Embed Size (px)
Citation preview

Potential of biogas production from
livestock manure in China
--GHG emission abatement from ‗manure-biogas-digestate‘
system
Master’s Thesis within the Industrial Ecology programme
LIU GUO GUO
Department of Energy and Environment
Division of Energy Technology
CHALMERS UNIVERSITY OF TECHNOLOGY
Göteborg, Sweden 2010


MASTER‘S THESIS
Potential of biogas production from livestock manure in
China
----GHG emission abatement from ‗manure-biogas-digestate‘ system
Master‘s Thesis within the Industrial Ecology programme
LIU GUO GUO
SUPERVISOR(S):
Erik Ahlgren
Christel Cederberg
EXAMINER
Erik Ahlgren
Department of Energy and Environment
Division of Energy Technology
CHALMERS UNIVERSITY OF TECHNOLOGY
Göteborg, Sweden 2010

Potential of biogas production from livestock manure in China
----GHG emission abatement from ‗manure-biogas-digestate‘ system
Master‘s Thesis within the Industrial Ecology programme
LIU GUO GUO
© LIU GUO GUO 2010
Department of Energy and Environment
Division of Energy Technology
Chalmers University of Technology
SE-412 96 Göteborg
Sweden
Telephone: + 46 (0)31-772 1000
Chalmers Reproservice
Göteborg, Sweden 2010

I
Potential of biogas production from livestock manure in China
--GHG emission abatement from ‗manure-biogas-digestate‘ system
LIU GUO GUO
Department of Energy and Environment
Chalmers University of Technology
ABSTRACT
With great change of food pattern on Chinese people‘s table, livestock production has
been expanded to meet increasing demand of meat, egg and dairy products. Due to
N2O and CH4 emission from ammonia utilization and untreated manure as well as
CO2 emission from large reliance on fossil fuels and traditional biomass, anaerobic
digestion as a biological waste treatment technology to integrate energy system and
agricultural system into manure management system, has attracted attention from
public. Of special concern in this thesis is the setting up of ‗manure-biogas-digestate‘
model and evaluating its GHG emission abatement compared to reference system.1
Due to differences in livestock production, energy consumption pattern and
agricultural land distribution, household biogas system and livestock farm-based
biogas system are encouraged strongly in rural and suburb areas in China respectively.
Aims of this thesis are to assess environmental benefits from manure treatment
perspective, energy perspective and agricultural perspective of entire biogas system
and to analyze whether biogas system implemented is a good choice to achieve the
sustainability. Three steps are in focus to achieve the research aim:
Calculating GHG emission abatement from household biogas system in rural
areas and assessing which phase contributes to the most environmental impact;
Assessing environmental impact through comparison between ‗energy-
environmental‘ biogas system and ‗energy-ecological‘ biogas system.
Doing future estimation of these two types of ‗manure-biogas-digestate‘
systems with changes of energy consumption pattern and agricultural land area.
Through investigation of household biogas project in western China and livestock
farm-based biogas project in east, the basic data used for assessing environmental
benefits of two systems were collected. In household biogas system, CO2 emission
abatement is the largest in biogas substitution part but CH4 is produced in large
amount from uncovered anaerobic lagoon after anaerobic digestion (AD); As for
livestock farm-based biogas system, AD selection and manure treatment process
design play important role in the GHG emission mitigation potential, which are based
on main purpose of project implement. Both energy substitution and agricultural land
acceptable capacity are considered as constraint conditions of large-scale biogas
system development.
1 Reference system is cited for comparing with ‘manure-biogas-digestate’system. In household biogas system, the
reference system is traditional household system, and in M&L farm-based biogas system, reference system is
‘energy-environmental’biogas system compared to ‘energy-ecological’biogas system

II
Key words: Livestock manure management; anaerobic digestion; ‗manure-biogas-
digestate‘ system; future estimation; GHG emission abatement; household biogas
system; ‗energy-ecological‘ biogas system; ‗energy-environmental‘ biogas system.

III
Contents
1. INTRODUCTION 1
1.1 Background 1
1.2 Aim of research 5
1.3 'Manure-biogas-digestate' system 6
1.4 Reasons to develop 'manure-biogas-digestate' system 15
2. METHODOLOGY AND DATA ASSUMPTION 23
2.1 Methodology 23
2.2 Data collection and assumption 29
3. CASE STUDY 34
3.1 Case study 1—housheold biogas system 34
3.2 Case study 2—Livestock farm-based biogas system 41
4. RESULTS 49
4.1 Results of GHG emission abatement and future estimation of
case study 1 49
4.2 Results of GHG emission abatement and future estimation of
case study 2 56
5. CONCLUSION AND DISCUSSION 63
5.1 Conclusion 63
5.2 Discussion 63
REFERENCE FEL! BOKMÄRKET ÄR INTE DEFINIERAT.
APPENDIX 70

IV
Abbreviation and definition
AD Anaerobic digester
BOD5 Biochemical oxygen demand
CHP Combine heat and power plants
CO2-euq CO2 equivalent
COD Chemical oxygen demand
DM Dry matter of livestock manure
EBC Emission from biogas combustion
EBP Emission from biogas production
EFGHG GHG emission factor
ERES Emission reduction from energy substitution
ERMM Emission reduction from manure management
GHG Greenhouse gas
MMS Manure management system
RES Reference energy system
SBR Sequencing Batch Reactor Activated Sludge Process
TN Total nitrogen
UASB Upflow Anaerobic Sludge Blanket process
USR Upflow Solids Reactor
VS Volatile solid

V

VI
Preface
In this study, two main parts are divided according to purpose of research. The paper
work and calculation of energy perspective of research have been supervised by Erik
Ahlgren at the Energy Technology division of Energy and Environment department in
Chalmers University of Technology; The agricultural and livestock manure
management part is guided by Christel Cedeberg working in SIK in Gothenburg.
This part of the fieldwork has been carried out in Biogas Scientific Research Institute
of the Chinese Ministry of Agriculture in Chengdu, Sichuan. All data for calculation
of two scenarios were obtained from investigation of rural areas in Chengdu and
livestock farm-based project in Inner Mongolia.
Finally, it should be noted that this master thesis could never have been conducted
without the strongly help and high quality suggestion from my supervisors Erik
Ahlgren and Christel Cedeberg as well as Professor Deng Liangwei from Chinese
Biogas Scientific Research Institution, from whom I have learnt quite a lot knowledge
beyond my education background. I also would like to thanks to my thesis opponent
Zhao Lei who has given me valuable idea of paper work modification. Last but not
least, I will express great appreciate to my parents who support me all the time during
my study and the most tough time in my thesis research.
Göteborg September 2010
Liu Guoguo


1
1. Introduction
1.1 Background
China has a long history of livestock husbandry, and through the entire country, large
differences in livestock production systems are found. These differences are based on
temperature, climate, geomorphology, soil quality and population distribution. Figure
1.1 shows the two main livestock areas, ‗pastoral region‘ in north and west and
‗agricultural region‘ in east and south. Between these two regions is a transitional area
called semi-pastoral belt which is characterized by combination of pastoral land based
livestock systems and arable farming based livestock system.
Figure 1.1 Map of distribution of pastoral region and agricultural region in China
[1]
Pastoral region covers northern and western part of China, and animals such as sheep,
horse, goat and cattle fed by grazing are found in this grass based livestock system.
Most of areas in northwest and southwest of China are under harsh natural
environment, which is more appropriate for grassland rather than arable land. The
natural grassland in this region occupies over 75% of total pasture areas (300 million
hectare) in China.
Agricultural region includes middle and eastern areas of China as well as Sichuan
province in southwest. This region is characterized by intensive arable farming
because the geomorphology, temperature and soil quality are suitable for crops, fruits
and vegetables growth. Since population density is large in this region, the livestock
husbandry patterns are decided by urban and rural location. Farming livestock areas
dominate most of Chinese agricultural plants, which concentrate in Northeast, Huabei
plain, Yangtze plain, Sichuan basin and Pearl River delta. The livestock productions

2
in these areas consist of pig, cattle and all kinds of poultries, of which pigs make up
the largest part. And large share of these pigs are fed in ‗back yard‘ of rural
household. In additional, an increasing number of livestock industries with high level
intensification are situated in suburbs of middle and big size cities in this region,
especially dairy cow and poultry farm, to provide fresh dairy products, egg and meat
to city residents.
1.1.1 Growth of animal products consumption
Over past 10 years, perhaps nowhere else than China has such huge ―livestock
revolution‖ occurred and the shift from diets based on vegetable foods to those much
heavier in animal products been striking. Due to the rapid economic expansion, more
Chinese enter the new middle class, and meat has moved from the side of the dinner
plate to the centre. More meat and dairy products are demanded with economic
development and nutrients requirement. During such short period, increase of pork
and egg consumption has made China has become the world‘s top producer of these
animal products. Table 1.1 and Table 1.3 demonstrate the number of livestock
slaughtered and animal products produced from 2004 to 2008 and Table 1.2 illustrates
the change of livestock in same period. During these five years, pig meat production
has grown 1.06 times, and cattle and chicken meat have increased 11% and 16%
respectively. With total meat production increased 10% from 2004 to 2008, of which
pig meat production decreased from 65,5% to 63.3%, while chicken and cattle meat
production percentage have risen from 14% to 15% and 7.8%to 7.9% respectively.
What‘s more, the increasing popularity of fresh milk results in immense increase in
dairy cow numbers. From 2004 to 2008, 56.8% of cow milk production growth was
with 41% increase of number of dairy cow. Meanwhile, the growth of number of pigs
was accelerated with the same level of pork‘s demands.
Table 1.1 Number of slaughter livestock in China (million head), 2004-2008 [2]
Livestock 2004 2005 2006 2007 2008
Cattle 40.03 40.66 41.58 44.05 43.57
Pig 584.6 615.3 623.8 576.4 620.8
Broiler 6898 7243 7202 7464 7759
Table 1.2 Number of livestock in China (million head), 2004-2008 [2]
Livestock 2004 2005 2006 2007 2008
Dairy cow 8.98 11.13 12.33 12.35 12.65
Other cattle 83.23 79 75.22 69.72 69.97
Pig 420.7 428.5 440.4 425.2 446.4
Broiler 4210 4294 4431 4505 4602
Layer 2135 2235 2305 2386 2487

3
Table 1.3 Production of animal products in China (million ton), 2004-2008 [2]
Production quantity 2004 2005 2006 2007 2008
Total meat 67.9 71.2 72.7 70.4 74.5
Cattle meat 5.3 5.4 5.5 5.9 5.9
Chicken meat 9.5 10.0 10.2 10.6 11.0
Pig meat 44.5 46.6 47.6 43.9 47.2
Cow milk 22.9 27.8 32.3 35.6 35.9
Hen egg 20.5 21.0 20.9 21.8 22.7
1.1.2 Increasing livestock manure
Increasing production of animal products results in increasing animal manure from the
livestock. In 2008, Chinese livestock produced 2.7 billion tons manure totally, nearly
three and a half times the industrial solid waste level. In Table 1.4, approximate
values for N produced in manure (before any losses) and manure production from
livestock per day are shown, all the data of which are based on Chinese resources [3]
and Swedish default values from the software program STANK developed by the
Swedish Board of Agriculture [4]. In Table 1.4, numbers of livestock in 2007 are
provided by FAOSTAT database and total manure production and N in manure was
calculated under Chinese context. Based on calculation of Table 1.4 and Table 1.5,
total N content of livestock manure in 2007 is around 10.7 Mt, which only include
livestock categories, pigs, dairy cows, beef cattle, broiler and layer hens.
Table 1.4 Manure production from livestock (kg DM /head.yr) and N (kg N /head.yr)
and P (kg P /head.yr) content in manure
Livestock categories Manure
production
(Sweden)
Manure
production
(China)
N content
(Sweden)
P content
(Sweden)
N content
(China)
Dairy cow
6000 kg milk/yr
2400 1524 100 15 68
Young heifer
0-12 month
425 20 2.5
Young heifer
12-24 month
1000 920 47 7 30
Sow 12month 500 36 10

4
Manure NH4+; NO3
-
Water NO3-, N2
Fertilizer NH4+;NO3
-
Atmosphere N2, NH3, NO2,N2O
Soil and Crops NH3;NO3-
,NH4+
Fattening pigs
2.5-3 batch/yr
160 135 3.7 0.8 4.6
Broiler 7 batch/yr 0.14 0.13 0.04 0.008 0.054
Layer hens 12month 11 14 0.52 0.17 0.57
Table 1.5 Total N and P content in manure (Mt) in China, 2007
Livestock categories Number of livestock (Mhead) N content P content
Dairy cow 12.4 0.8 0.2
Other cattle 67.9 2 0.5
Pig (general) 597 2.7
Sow 37 1.3 0.4
Fattening pigs 560 2.1 0.4
Broiler 7464 0.4 0.06
Layer hens 2386 1.4 0.4
Loss of N and P from untreated livestock manure can lead to severe environmental
pollution. The N and P cycle are shown as followings [5]:
a. Nitrogen cycle
Figure 1.2 illustrates the nitrogen flow through agricultural, livestock system and
environment. The excess N is lost to the environment via emissions, leaching and
runoff. In the soil, ammonium from livestock manure and chemical fertilizers can
convert into NO3- through nitrification which is mediated by the activity of nitrifying
micro-organisms. However, not all the nitrified nitrogen is taken up by plants, some
of nitrate is leached from soil and runoff to water which cause the aquatic system
eutrophication. Besides this, ammonia in manure is evaporated to the atmosphere and
this represents a significant N loss from agriculture. Ammonia contributes to
eutrophication as well as acidification. In the nitrification process in the soils, NO3-
can be denitrified into N2O which is one of greenhouse gases leading to warming
effect.

5
Figure 1.2 Overview of important N losses in agriculture
b. Phosphorus cycle
Phosphorous is lost from arable land by soil erosion, surface runoff and leaching (See
Figure 1.3). One problem of today is that many agricultural soils have accumulated
phosphorous in excess. Excess fertilization with P is not necessarily leached like the
case is for nitrogen, but can go into the turnover of the various phosphorus types/
compounds in the soil layers, whereof some are passive and/or only slowly converted
to other forms. Adding more P than crop normal requirement results in high
accumulation of P in soil, and it leads to the risk for future P leaching and increase the
aquatic system eutrophication.
Figure 1.3 Overview phosphorous cycle in agriculture
1.2 Aim of research
Facing with increasing severely environmental problems from untreated livestock
manure, ‗manure-biogas-digestate‘ system is a new model to be built which integrates
energy and agricultural system into livestock manure management system and
environmental assessment of this model is done to evaluate whether large-scale biogas
projects development with rapid growth in rural and suburb of China can achieve
sustainability. In this thesis, GHG emission abatement from ‗manure-biogas-
digestate‘ system substitution is the only environmental evaluation parameter, and the
other environmental impacts, such as soil erosion and water eutrophication resulted
from N and P loss are not included here.
The GHG emission abatement is calculated by comparison between emissions from
‗manure-biogas-digestate‘ system and reference system. However, due to different
livestock husbandry patterns and biogas systems in rural areas and livestock farm, the
‗manure-biogas-digestate‘ system implemented in rural areas is called ‗household
biogas system‘ and that in livestock farm is named ‗energy-ecological‘ biogas system,
from which the GHG emission abatement should be done as two separate scenarios as
well. To household biogas system, the traditional household system2 in rural area is
selected as the reference system; As for livestock farm-based biogas system3
,
2 Traditional household system is formed by three parts, which are traditional manure treatment, traditional energy consumption pattern and traditional agricultural soil management. 3 In livestock farm-based system, ‘energy-environmental’ biogas system commonly used in most livestock farms is considered as a baseline to compare with ‘energy-ecological’ biogas system which is encouraged to develop in future.
Manure P2O5
P fertilizer P2O5 Rock P
Soil Phosphate anion
Aquatic system
Eutrophication

6
reference system for comparison should be chosen as the traditional livestock manure
treatment based on IPCC guideline. However, according to Technical Specifications
for pollution treatment projects of livestock and poultry farms [6], the ‗energy-
environmental‘ biogas system is the most commonly used to instead of traditional
manure treatment in Chinese M&L livestock farm at present. Hence, ‗energy-
environmental‘ biogas system can be assumed as the reference system of the ‗energy-
ecological‘ biogas system. What‘s more, based on large amount of variable factors
when assessing environmental benefits of biogas system, such as ingredients of
feedstock, anaerobic digester, design of biogas production process, and digestate
treatment and utilization, the GHG emission abatement of household and livestock
farm-based biogas system should be assessed relying on the specific project. Three
steps are in focus with rapid growth of biogas projects in large scale:
To assess GHG emission abatement due to biogas systems compared with present
situation of traditional household/farm-based system;
To analyze which perspective of biogas system substitution has the largest GHG
emission abatement through future estimation;
To conclude the opportunities and challenges of future development of biogas
system in Chinese livestock sector.
1.3 ‘Manure-biogas-digestate’ system
The anaerobic digestion becomes an increasingly attractive manure management
technology by multiple benefits from the process and it is adopted in both household
and medium and large (M&L) livestock farm. Livestock manure is collected
concentrate and treated in anaerobic digester which can protect ammonia and methane
from emitting to atmosphere, and reduce the amount of nutrients to rush into
groundwater resulting in aquatic system eutrophication. Meanwhile, biogas and
digestate produced from anaerobic digestion process can be seen as renewable energy
fuel and organic fertilizer to substitute of fossil fuel and industrial fertilizer in energy
and agricultural systems. Therefore, biogas is now widely integrated with animal
husbandry and become an important means of manure treatment in agricultural sector.
1.3.1 Anaerobic digestion technology
1. Scientific theory of anaerobic digestion
Anaerobic digestion depends on consortia of hydrolytic and acidogenic bacteria
working with methane producing bacteria (methanogens) growing in structured
colonies or films for structural support and metabolic interchange. Four stages of
chemical reaction in anaerobic digester is shown in Figure 1.4.

7
Figure 1.4 Four stages of chemical reaction in anaerobic digester [7]
1st stage Hydrolysis: In this stage, aerobic bacteria reconstructs high-molecular
substance (protein, carbohydrates, fats and cellulose) by means of enzymes to
low-molecular compounds like monosaccharide, amino acids, fatty acids and
water.
2nd stage Acidogenesis: This stage is made by acid-forming bacteria, which
separate molecules penetrate into bacteria cells. In order to process well in next
stage, this process is partially accompanied by anaerobic bacteria that consume
rest of oxygen to provide appropriate environment for methane bacteria. Acids,
alcohols and gases (carbon dioxide, hydrogen sulfide and ammonia) are
produced.
3rd stage Acetogenesis: Acetic acid is produced in this step for methane
formation.
4th stage Methanogenesis: This is the last step in anaerobic digestion process,
which produces methane, carbon dioxide and water. 90% of methane yield takes
place here and 70% of it from acetic acid.
With all biological processes, the constancy of the living conditions is of importance.
A temperature change or changes in the substrates or the substrate concentration can
lead to shutdown of the gas production. The microbial metabolism processes are
dependent on many parameters, so that, for an optimum fermenting process,
numerous parameters must be taken into consideration and be controlled. The
environmental requirements of biological process are shown in Table 1.6. [8]
Table 1.6 Parameters of biogas production during 4 stages of anaerobic digestion
Parameter I-III stages IV stage
Temperature 25-35oC Mesophilic:32-42
oC;
Thermophilic:50-65oC
PH value 5.2-6.3 6.7-7.5
C:N ratio 10-45 20-30
DM content <40% DM <30% DM

8
Required C:N:P:S ratio 500:15:5:3 600:15:5:3
2. Biogas production from anaerobic digestion
Biogas contains mainly CH4 (60%-70%), which is the same energy carrier as in
natural gas. So, biogas and natural gas can be used in same application. Methane can
be burnt for cooking or lighting the house. It can also be used to power combustion
engines to drive a motor or generate electricity. Strictly speaking, biogas production is
proportional of the volatile solids (the organic matter) content of the feedstock, but to
a good approximation may be considered proportional to the dry matter (DM).
Normally, DM of raw materials should be kept around 10%-12%. [9] If substrate is so
thick, crust will be formed above liquid surface; if the DM is low, the biogas cannot
be produced with inefficient VS content. Biogas plants are used to ferment liquid
manure, at present, quite often combined with co-substrates to increase the biogas
yield, for example municipal organic waste, food waste, slaughter house waste and
other crop residues. In China, the most common used addictive raw material is rice
straw. The biogas yield from livestock manure and other raw materials are shown in
Table 1.7 and Table 1.8 shows the biogas yield from different raw materials.
Table 1.7 Biogas production of livestock manure per head (m3 /head.day) [10]
Livestock
categories
Fresh manure
(kg/head.day)
DM
%FM
oDM
%DM
Biogas
producing rate
m3 /kg DM
Biogas yield
m3 /head.day
Dairy cow 25-30 16.7 74 0.2-0.25 0.83-1
1.05-1.25
Pig 1.5-2.5 18.5 83.9 0.25-0.3 0.07-0.12
0.08-0.14
Poultry 0,1-0.12 30 82.2 0.3-0.35 0.009-0.011
0.011-0.013
*Lower data is related to fermentation temperature 15 C and higher one is 25 C
Table 1.8 Biogas yield from different raw materials for biogas production [11]
Raw materials Estimate
DM (%)
Best estimate of
biogas yield
(GJ/DM)
Low value of
biogas yield
(GJ/DM)
High value of
biogas yield
(GJ/DM)
Ley crops 23 10.6 5.3 13
Municipal
organic waste
30 12.4 10 14
Slaughterhouse 17 9.4

9
waste
Tops and leaves 19 10.6 7.8 14
Straw 82 7.1 5.6 8.5
3. Digestate production from anaerobic digestion
Solid residue
During fermentation of livestock manure, pathogen can be killed under anaerobic
environment, and biogas residue, an organic fertilizer with high quality is produced.
The chemical forms of N and P in residue are easier to be utilized by plants in short
time than those in other manure management system, such as compost. For instance,
in residue, organic matter content is around 28%-50%, humic acid content is about
10%-20%, cellulose content is 13%-17%, N content is 0.8%-20% and P content is
0.4%-12%. [12] It is estimate that, continuous use of residue for six years can
obviously enhance the water retention of soil and improve its physical properties.
Liquid effluent
Slurry is another by product of biogas production, which is constituted of three kinds
of bioactive substances. And all of these elements play an important role in
maintaining plant‘s normal growth. Slurry is different from solid residue, since it can
be irrigated at farms, to vegetables, fruit and other plants directly. However, due to N
and COD contained in slurry, the amount of it should follow the national regulation of
farm irrigation depending on plants categories.
1.3.2 Two types of ‘manure-biogas-digestate’ systems
There are two types of ‗manure-biogas-digestate‘ systems in China. The first is based
on household livestock husbandry which mainly focuses on the small-scale animal
production in household of rural areas. The farmers that live in rural areas raise
several animals in their own backyards, which are mixed breed in this type, for
instance, 2 pigs, 1 cattle and 4-5 chickens per farm. The production system is quite
common in China because of large population in rural areas. The areas in China which
are right for developing the household livestock husbandry pattern are mostly located
in under developed areas, like north-western China, south-western China and north-
eastern China. The second type is based on intensive livestock production systems
which includes medium & large-scale (M&L) livestock farms. The areas appropriate
for this type are suited in east-coast of China and most suburbs of middle and big
cities. Table 1.9 shows the distinction between these two livestock husbandry patterns
based on number of livestock breed.
Table 1.9 Number of livestock in livestock farm and household husbandry system
(head) [13]
livestock M&L-scale livestock production
system
Small-scale livestock
production system

10
Medium-scale Large-scale Ⅰ Ⅱ
Pig(S) 50-2999 >=3000 1-9 10-49
Cow(T) 21-199 >=200 1-5 6-20
Cattle(S) 51-499 >=500 1-10 11-50
Layer(T) 2001-49,999 >=50,000 1-49 50-2000
Broiler(S) 2001-99,999 >=100,000 1-99 100-2000
*Number of pig and cattle in both husbandry patterns are calculated as the slaughter
number per year; Cow and layer are calculated as stock number per year (both
animals can stay in farm the whole year); Broiler in intensive livestock husbandry is
calculated as slaughter number per year while the dispersed type is not.
1. Household biogas system
Household biogas digester
In household biogas digester, feedstock used in anaerobic digesters of household
biogas production system depends on what organic wastes are produced by rural
families. Generally, food waste are often consumed by pigs or poultries, and the
feedstock for generating biogas always includes human and livestock manure as well
as crop residues. However, crop residues are high in fiber which is hard to break down
and intend to form crust inside the digester, except for its function of adjusting C/N
ratio in digester. Hence, livestock, human manure and food waste are the best option
as input to produce biogas. In commonly used Chinese household digester design,
effluent chamber and anaerobic reactor are connected and toilets and pigsties are
connected to influent port. Both gas storage room and fermentation room occupy 15%
and 85% of total volume of digester respectively. [14] The head space volume above
the reactor leads to gas pressure delivered into the home; it is affected upon effluent
port liquid level. Hence, separate gas storage chamber is constructed in some systems.
In rural areas of China, the waste from both pigsties and toilet are flush into reactor
directly. And in order to remove effluent periodically, a vertical cylindrical pull-rod
port is added at the side of the effluent port. Effluent is removed by moving a pull-rod
up and down in the port. The pull-rod is simply a wooden shaft with a metal disk on
the bottom. This facility is also operated by hand. There are three common types of
household biogas system developed in Chinese rural areas depending on their local
climate and natural environment. The detailed information is concluded in Table a in
Appendix 1.
Biogas utilization of household biogas system
At present, 60% of China‘s population live in rural area China. In the long term, rural
household energy consumption in Chinese rural areas mainly depend on traditional

11
biomass energy and fossil fuels, in which straw account for 34%, fire wood account
for 24% and coal cake stood for 32%.[15] In the past, energy used for heating and
cooking was provided by biomass resources combustion, which leads to low energy
efficiency and severely environmental degradation. When burning firewood and coal
cake in traditional stove, the smoke contains CO2 and SO2 which result in enhanced
greenhouse gas effect and acid rain. Apart from that, coal is facing the danger of
exhaustion and large demand of firewood leads to uncontrolled tree cut and risk of
degrading land. According to China‘s rural biogas planning project (2006–2010)
[13], by 2010, 139 million rural households are suitable for further development of
biogas project. Compared with past 15 years, total energy from biogas production is
equivalent to 2.84×10⁷ tons coal which leads to 7315.7 Mt GHG emission reduction.
Digestate utilization of household biogas system
This slurry produced from household anaerobic digester cannot only be used as
agricultural fertilizer but also as a feed supplement for pigs, mushroom growing
substrate, fertilizer for fish ponds and substrate for rearing worm and soaking seeds.
The waste sludge produced at the bottom of reactor can be used as fertilizer after
composted in the field. Using anaerobic reactor effluent instead of industrial fertilizer
increased a field‘s net economic yield by 30% [16]. What‘s more, anaerobic effluent
used in mushroom production increases yields by 30%, increase fish production by 6-
12% and reduce the cost of breeding pigs. [16]
With the urbanization, more farmers rush into the cities. According to government
target, in 2020 the biogas utilization ratio in total rural areas will achieve 38.4%,
which is more than twice times than that in 2010. And 70% of potential household
will establish the biogas plants at home. See from Table 1.10, western China is in the
top of household biogas project development. As for eastern China, due to rapidly
urbanization in this region, potential household for biogas project is reduced with
rural households shrinking. The percentage of potential household for biogas projects
to total rural areas in eastern China is 37% and estimate biogas plants are only 6% of
total.[13]
Table 1.10 Household biogas projects distribution and development in 2010
Region Total rural
household
(million)
Potential
Household biogas
(million)
Biogas
plants
(million)
Biogas
system
type
Western
China
Southwest 49.68 39.1 14.53 3 in 14
Northwest 17.68 10 4.14 5 in 15
4 ‗Three in One‘ eco-agricultural model, which combining the biogas digester with a pigpen and toilet, is popular
in eastern and southern of China. The provinces included in these two districts are Jiangxi, Hubei, Hunan, Hainan,
Jiangsu, Zhejiang, Fujian, Shandong, Guangdong, Tianjin, Shanghai and Beijing. 5 The ‘four in one‘ eco-agricultural model, which combines the biogas digester, pigpen, solar greenhouse and toilet,
can solve the problem of conventional greenhouse model to meet the energy and environmental requirement. The
greenhouse in this model can be used to increase the temperature of biogas digester when it is on operation,
besides the plants and livestock demand. This model is common used in north part of China with cold temperature.

12
Others 8.31 6.26 1.36
Mid &
Northeast
China
Southeast 23.77 18.62 6.82 3 in 1
Yellow-Huai
sea plain
60.29 35.24 7.8 4 in 16
Northeast 10.48 5.25 1.64 4 in 1
Eastern China 65.8 24.54 3.89 3 in 1
2. Livestock farm-based biogas system
Medium and Large farm-based biogas digester
In M&L livestock farm-based biogas projects, selection of anaerobic digest device
should be based on raw material,temperature, energy recovery, and post-treatment
process. The ingredients and concentration of raw materials should be taken into
consideration in the first place when choosing the appropriate anaerobic digester, in
which the quantity of raw material per day, moisture content, COD and BOD5 content
as well as other physical condition (PH and temperature) are included. Due to the
introduction above, the biogas production efficiency is represented by the volumetric
biogas producing rate which results from organic volumetric loading rate multiply
with raw material biogas producing rate [17]. Hence, improving the materials
transferring between the microbes and substrate or remaining amount of anaerobic
microbes in the reactor are important for selection of anaerobic digester.
Biogas utilization of M&L farm-based biogas system
Biogas produced from livestock farm manure transported to residents living in suburb
is the most common way of using the energy from biogas production. On large
livestock farms, biogas can replace heat and electricity used for livestock operation,
e.g milking and cooling. For example, biogas can be burned in boilers without any
pretreatment of the gas besides the removal of water and H2S and the heat it produced
can keep warm of animal living places especially under low temperature in winter.
What‘s more, biogas produced from large-scale biogas plant on livestock farm intends
to generate electricity through electricity turbine, from which heat generated partly
escapes with the exhaust gas and has been recovered in heat exchanger for further use.
Since the exhaust gas is at the minimum temperature of 120-180oC, the heat cannot be
completely transferred to water in cooling water heat exchanger. The heat losses of
entire biogas plant cannot be avoided. Biogas production is continuous through the
whole year, which will provide excess heat demand during summer. Any excess gas is
suggested to be flared off to reduce emission of methane. Most biogas digesters are
heated by combustion of excess biogas generated themselves. Several electricity
engines are available in market, such as diesel engines, stirling engine and gas turbine.
The energy efficiency of biogas cogeneration is high and corresponds to about 34% of
electrical energy and 57% of heat energy with 9% of total energy loss [18]. However,
6 The ‘Five in One‘ eco-agriculture model, which combines the biogas digester with solar-powered barns, water
saving irrigation system, water cellar, and toilet, is proposed for Northwest China with rare water resources.

13
electricity generation from biogas in China is not as popular as that in Europe,
because of weak economic support from government and low revenue for electricity.
Apart from the local direct conversion of biogas to electricity and heat, biogas can be
used for feeding into the natural gas network. To be distributed on the natural gas
grid, biogas needs to be upgraded. CO2 and mainly H2S contained in biogas have to
remove in order to increase the heating value. Odorants are added to make leakage
traceable, and heavy hydrocarbons are added to increase biogas quality.
Digestate utilization of M&L farm-based biogas system
Digestate includes both solid residues and slurry. The solid residue consists of the
mineralized remains of the dead bacteria from the digesters and lignin that cannot be
broken down by the anaerobic microorganisms. Hence, compost solid residue from
digester is following. Lignin and other materials are available for degradation by
aerobic microorganisms to nutrients, which is more suitable as a soil improver [19].
The liquid slurry through anaerobic treatment is disposed by removing majority of the
large solid. This effluent is rich in nutrients which is suitable for irrigation for field.
However, If the digester is situated far away from agricultural land where the
digestate can be used substituting fertilisers, the volatile matters left in the liquid
needs to be purified in, aerobic treatments which is regulated under environmental law
in China. ‗Energy-environmental‘ biogas system and ‗energy-ecological‘ biogas
system are accepted by most of M&L livestock farm. The former one is commonly
adopted in the surrounding of digestion system which is without any farm or fish pool
nearby, and the liquid from digester is required to be treated in aerobic tank to remove
most of active chemicals; The latter one is used for the opposite situation, in which
the effluent with rich nutrients can irrigate to farm or pure into fish pool after
sediment from digester.
Compared to small-scale intensive livestock husbandry pattern, medium and large
livestock farm has larger biogas potential. It is not only due to its abundant raw
materials but also because of reduction of negative environmental impact from
manure treatment on farm. According to ‗Five years plan‘ from Chinese government,
east China with highest population density has the largest potential of medium and
large scale livestock farm biogas system development. As seen in Table 1.11, it is
estimated that M&L scale biogas projects in eastern areas will achieve a total number
of 2393 in 2010, which represents 48% of all M & L livestock farms in the same
region and 51% of total M & L livestock biogas projects. [13] Compared to west and
middle of China, eastern areas consists of many large cities which results in loss of
agricultural land due to urbanization. With more biogas projects developed on
livestock farms in these urbanized areas, large amount of digestate produced must be
irrigated on arable land in short time. However, if the distance is long to agricultural
land, the digestate cannot be used and instead have to be purified through aerobic
lagoon and all the nutrients contained in digestate can‘t be used in agriculture to
replace of industrial fertilizer.
Table 1.11 Livestock farm biogas projects distribution and development in 2010
M & L scale
livestock farm ,
2005
M & L scale
biogas project ,
20102
Ratio1
(%)

14
Western
China
Southwest 852 236 27.7
Northwest 689 219 31.79
Mid &
Northeast
China
Southeast 1522 489 32.13
Yellow-Huai sea
plane
2313 793 34.28
Northeast 1602 570 35.58
Eastern
China
Rural areas of east
coast
4974 2393 48.11
*1. Ratio1= medium & large scale biogas project/medium and large livestock farm;
2. According to the Chinese report, the M&L scale livestock farm in 2010 remain the
same number as that in 2005.
3. Comparison between these two biogas systems
Based on the introduction of household biogas system and M&L livestock farm-based
biogas system, the comparisons between these two systems are concluded in the Table
1.12 below:
Table 1.12 Comparison between household biogas system and M&L livestock farm
biogas system
Item Household digester M&L farm-based biogas plants
Purpose Energy & sanitation Energy& environmental
Digested
effluent
Fertilizer Fertilizer, aerobic post-treatment
Power input None Yes
Fermentation
facilities
Simple Facilities of purification, storage and
distribution of biogas, CHP facilities and
auto-controlling instruments
Installation Underground On the ground
Design&
Construction
Simple Joint of specialty of process, structure
equipment, electric and auto-controlling

15
instruments
Operator None Professional operator
Biogas
producing rate
0.1-0.3m3/m
3.day 0.3-10m
3/m
3.day
1.4 Reasons to develop ‘manure-biogas-digestate’ system
In the past, agriculture, livestock husbandry and energy were three independent
sectors in China. People know the relation among them but used to neglect how they
interact with each other. When facing with increasing concern on the environmental
issue and coming energy crisis, Chinese government make great efforts to change
traditional life pattern into sustainable one. Reasons to develop ‗manure-biogas-
digestate‘ system are due to positive environmental impact from reduction of
industrial fertilizer use from agricultural perspective, substitution of fossil energy fuel
from energy perspective and improvement of manure management system. The GHG
emission from ‗manure-biogas-digestate‘ and relation between each of them are
shown in Figure 1.5.
Figure 1.5 Environmental benefits from ‘manure-biogas-digestate’ system
Greenhouse gas emission
Agricultural
system Energy system Manure
management
system
Nutrient
recovery Biogas
CH4, N2O CO2

16
1.4.1 Environmental benefit from manure management system
1. Substitution of traditional manure treatment
Manure treatment is divided into two categories, one is untreated manure which
means the farmer use fresh manure as fertilizer directly without any treatment; most
of these farmers in rural areas don‘t have any manure treatment; the manure is spread
immediately or stored in simple constructions. In suburb regions, most of modern
medium and large scale farms are located and since the manure is mostly untreated,
this leads to severe environmental pollution problem through runoff of nutrients to
water bodies and emissions to air of ammonia; For instance, ‗dead zone‘ in the South
China Sea is virtually devoid of marine life due to eutrophication problem, in north,
overgrazing to satisfy the needs of large amount of livestock, lead to the loss of nearly
a million acres (about 400,000 hectares) of grassland each year to desert.[20]. The
other is treated manure, which also can be divided into two types according to their
energy recovery. Composting manure and slurry/liquid storage don‘t have any energy
recovery from treatment, the products from this process is only the composted manure
which is used as a fertilizer and soil improver. Manure treatment with energy recovery
includes combustion and anaerobic digestion. Combustion of manure has the
limitation that manure should be in high fiber content but little moisture. Cattle, sheep
and horse manure are more suitable for this treatment than pig and poultries.
However, drying manure is a precondition of combustion which aims to lowing
moisture, but consuming fossil fuel to provide thermal. What‘s more, energy
conversion efficiency is not high and a lot of smoke with S and CO2 is emitted.
Hence, manure treated by combustion is not common used in China, besides the
pastoral areas. Different manure managements common used in China are shown in
Table 1.13. [21]
Table 1.13 Definition of common manure management system in China
System Definition
Solid storage Manure is stored in unconfined piles periodically.
Liquid/slurry Manure is stored as excreted with minimal water added and
always stored in tanks or ponds. This manure management
system is the most commonly one in rural China.
Composting Composting manure is a naturally occurring process that
farmers have used for centuries in China. Under the aerobic
conditions, microorganisms grow and multiply, converting
the original organic material into a more stable, usable
product.
Anaerobic digester Anaerobic digester is designed and operated for waste
decomposition by microbial reduction of complex
compounds to methane and carbon dioxide. Methane can be
used as fuel with high heat value and digestate produced
from digestion process can be used as organic fertilizer to
agricultural plants.

17
Due to N, P and other nutrients are in large numbers in manure and especially if the
manure is spread when there is no crop growing in winter, severe problems can arise
when water bodies become over-enriched by excessive nutrient input and
consequently polluted. Moreover, some antibiotic residues and pathogens are left in
livestock manure that is not treated. These will make negative effect to people‘s
health when emitting to the air. And odor from ammonia in manure will destroy
people‘s living environment.
1.4.2 Environmental benefit from agricultural system
1. Substitution of increasing demand of industrial fertilizer by digestate
Because arable land is reduced by construction and urbanization, land must be
expanded, and crop yields must be improved. Table 1.14 indicates the yield of wheat,
rice and maize between 2007 and 2008.
Table 1.14 Yield of wheat, rice and maize per harvest area (ton/ha), 2007-2008 [2]
Year Wheat harvest Rice harvest Maize harvest
2007 4.3 5.8 4.9
2008 4.2 6.1 5.1
Along with increasing of crop yield and food quality, more fertilizer and pesticide are
needed in agricultural sector. According to Y.FO (2001) [22], in China, areas for
cropping account for 70% of total arable areas, which includes both crop and
economic agricultural plants, such as cotton. In 1999, total area of arable land in
China was 130 million hectare and real cultivation area is 200 million hectare
depending on double cropping. 70% of 200 million hectare (140 Mha) is used for
agricultural crops, not including permanent crops such as fruit, tea and also cotton.
This area is estimated to keep stable in following years. At the end of 1999, total
crops productions were 500 Mt in China. If the average crop demand per people
remains 400 kg per year, till 2010, the total crops production in China will increase up
to 552 Mt in order to satisfy demands of 1.38 billion populations. Hence, yield of
crops have to be improved by using fertilizer. Table 1.15 shows the estimate of crops
production and fertilizer consumption in 2010, 2015 and 2030. [22]. the fertilizer
consumption in 2010, 2015 and 2030 will increase continuously.
Table 1.15 Estimate of crops production and fertilizer consumption in China, 2010,
2015 and 2030
1999 2010 2015 2030
Cropping areas
(billion hectare)
0.14 0.14 0.14 0.14
Total crop production
(Mt)
500 552 576 640

18
Population (billion) 1.25 1.38 1.44 1.6
Crop yield (t/ha) 3.5 3.9 4.1 4.6
Amount of fertilizer
added (Mt)
---- 5.6-7 8.4-10.5 15.4-19.6
Total fertilizer
consumption (Mt)
24.75 30.35-31.75 33.15-35.25 40.15-43.35
Fertilizer per hectare
(kg/ha)
176 217-227 237-252 287-310
In additional, based on another experiment from national fertilizer website from 1980
to 1993, [23] if crop yield per harvest land is expected to achieve 5-6 t/ha, the most
appropriate N fertilizer consumption is 150-180 kg N/ha and P fertilizer is 40-70 kg
P2O5/ha in China. Compared to Europe, this fertilizer consumption is quite high.
Meanwhile the ratio of different nutrients in mixed fertilizer N:P2O5:K2O is suggested
to adjust as 1:0.4-0.45:0.25-0.3 and total fertilizer input per harvest area shouldn‘t
exceed 300 kg/ha. Fertilizer consumption per arable land in 2007 is shown in Table
1.16. When compared to suggest N and P fertilizer consumption per hectare, it is clear
to see that N and P fertilizer consumed per arable land in 2007 had exceed the
recommended value.
Table 1.16 N and P fertilizer consumption per arable land in China (t/ha), 2007
Year Arable land
(Mha)
N fertilizer
consumption (kg N/ha)
P fertilizer consumption
(kg P2O5/ha)
2007 140.63 230 80
In most of arable land, farmer commonly use more fertilizer than normal demand of
crops in order to increase its yield in short time. However, nitrogen evaporates into
atmosphere and phosphorous accumulate in soil in large amount which leads to
nutrients losses both in short and long term. For instance, in Huabei plain, settlement
of nitrogen in atmosphere achieves 60-80 kg N/ha, which accounts for almost 30% of
N demand of crops normal growth per year [24]. Meanwhile, accumulation of
nutrients in soil occurs after more than 20 years continuous fertilization. Based on
investigation of 140 farmers in Huabei plain, nitrogen accumulation in soil is up to
280 kg/ha, which is more than crops normal nitrogen needs 200 kg/ha. From 1977 to
2005, chemical fertilizer consumption in China has increased 700% but yield of crops
is only 71% rise at the same time. Meanwhile, coal used for producing more fertilizer
leads to GHG emission besides water pollution caused by overuse fertilizer. [25]
According to report [26], the average annual growth rate of N2O-direct emission from
agricultural soil of China is 7.6% for 1980-2007, releasing 0.3 Mt N in 2007. The
contribution of industrial nitrogen fertilizer, organic fertilizer, crop residues and
histosol soils to N2O-direct emission from agricultural soil of China are 77.64%,

19
15.57%, 6.64% and 0.33% respectively in 2007 (See Table 1.17). The data in the
report represents that industrial fertilizer is the main source of N2O emission from
soil. From 1980 to 2007, contribution to N2O emission by chemical fertilizer
consumption increased from 57.22% to 77.64%, with decrease of organic fertilizer
input by 53.1%. Amount of nitrogen loses to environment is tightly related to N
efficiency of chemical fertilizer and organic fertilizer.
Table 1.17 Contribution of impact factors of N2O-direct emission from agricultural soil
in China (%) [26]
Year Contribution of
industrial fertilizer
Contribution of
organic fertilizer
Contribution of
crop residues
Contribution
of histosol*
1980 57.55 33.23 8.20 1.01
1985 66.98 23.56 8.73 0.74
1990 73.09 19.08 7.30 0.53
1995 75.21 17.54 6.83 0.42
2000 76.41 16.70 6.51 0.38
2005 76.27 16.89 6.50 0.34
2007 77.64 15.57 6.46 0.33
*Histosol is a soil comprised primarily of organic materials. They are defined as
having 40 centimetres or more of organic soil material in the upper 80 centimetres.
Organic soil material has organic carbon content (by weight) of 12% to 18 %, or
more, depending on the clay content of the soil.
Besides the direct and indirect GHG emission from industrial fertilizer and nutrients
leaching from soil, the emission from fertilizer production also needs to be
considered. Demand for coal in synthetic ammonia has grown with fertilizer
consumption increased. 3% of total coal consumption is chemical sector in 2005 of
which fertilizer production represents 60% of that in 2006 [27].
1.4.3 Environmental benefit from energy system
1. Substitution of traditional energy fuel
According to Shi and Zhao (1999) [28], China‘s total energy consumption is projected
to increase from about 920Mt-oil equivalent in 2001 to 1,550 Mt-oil equivalent in
2015. The implied average annual rate of growth is 5.1% during 2001-2005 and 3.1%
during 2005-2010. Table 1.18 shows the estimate of China‘s primary energy
consumption from 2005 to 2010. [29] The consumption will vary across the regions in
China. The eastern coast regions will still lead the energy growth in China and
residential sectors will likely be the sectors contributing to China‘s increased energy
consumption in the future. Through comparison between different energy fuels in
market, coal consumption is estimated to be declined from 67% to 65.3% from 2005
to 2010, while crude oil will increase from 22% to 24% and natural gas will rise up to

20
3.4% from 3.2% in the same period. Although the coal consumption will decline after
2005, coal still domains Chinese energy market, especially in power and heat
generation sector. By 2005, the share of primary coal use going to power and heat
generation was over 57% of total consumption, of which power generation accounts
for 90%. 3% of coal is consumed in chemical sector and 60% of it is used for
producing industrial fertilizer. It is predicted by the China coal transport and
marketing association that domestic coal demand during 2006-2010 will grow about
3-5% per year, which is 2-3% higher than that during 2010-2020. [27] However, due
to gradually increase of coal price, demand for natural gas is expected to grow faster.
The Chinese Academy of social sciences predicts that, in the next 15 years, China‘s
demand for natural gas will grow at an average annual rate of 11-13%.
Table 1.18 Estimate of China’s primary energy consumption from 2005 to 2010
(million ton-coal equivalent) [28]
Year Coal Crude oil Natural gas Total
2005 1215.9 402.9 54.1 1806.3
2006 1245.1 417.5 57.8 1858.8
2007 1274.1 435.4 61.6 1914.3
2008 1311.1 457.6 65.5 1982.6
2009 1359.7 485.4 69.4 2068.5
2010 1421.1 519.5 73.3 2173.5
RES of rural areas in China
As the biggest developing country, China has large population living in rural areas
which is around 60% of total. Although energy consumption in rural areas of China is
much less than that in urban, GHG emission from rural energy sector cannot be
neglected because of their energy sources. In rural areas and other remote places, coal
and traditional biomass energy play major roles in domestic energy consumption.
Based on L, Junfeng (2005) [30], in 1997, rural traditional biomass fuel consumption,
such as straw and firewood account for more than 30% of total rural energy
consumption, of which energy used for domestic purpose occupied 60%. In domestic
energy consumption in rural community, heating space and household cooking as well
as light are the basic needs of people, of which cooking demand accounts for 90%.
(See Figure 1.6).In 1999, the total residential energy consumption is 10261 PJ, of
which 2003 PJ is from urban and 8259 PJ is from rural, corresponding to share of
20% and 80% respectively. [31] Although total residential energy consumption from
1991 to 1999 reduced gradually with economic development and energy sources
changes, increasing quantities of traditional biomass fuel such as straw and firewood
are used in rural residential houses for cooking and space heating with lower energy
conversion efficiency. In Table 1.19, the allocation of different energy sources used in
rural China in 2005 are shown. Straw, firewood and coal occupy nearly 90% of total
rural energy consumption.

21
Table 1.19 Allocation of fuels consumption in rural areas in China, 2005 (%) [15]
Energy fuel Straw Firewood Coal Elec Oil LOG1 Natural
gas
Coal
gas
Share of fuel
consumption
33 24 32 7.4 2 0,9 0.4 0.3
*1. LOG—Liquid oil gas;
Figure 1.6 Reference Energy System of rural energy system
RES of urban areas in China
The energy consumption in urban area is primary on commercial purpose rather than
residential one. See from Figure 1.7, electricity, natural gas, oil and coal are the major
energy sources used in urban areas which can provide energy service in industrial,
residential, commercial and transport sectors. According to S.D [32], in 2006, the total
urban energy consumption was around 1735.7 Mtce, of which commercial energy
accounts for 81.32%. Increasing natural gas consumption for heating and cooking
purpose of citizens in urban can reduce correspond GHG emission by replacing of
coal to some extent. Additionally, emission from energy fuels consumption is not only
related to energy sources but also to energy conversion efficiency.
Elec
Gas
Oil
Coal
Firewood
Straw
Cooking
stove
Oven
Boiler
Furnace
Kiln
Cooking
Lighting
Heating
Others
Gas pipe Elec grid

22
Figure 1.7 Reference Energy System of urban energy system
Elec
NG
Oil
Coal
Power plant
Boiler
Heat pump
Industrial energy
demand
Residential energy demand
Commercial energy demand
Transport
Gas grid
Elec grid
DH
S
23
2. Methodology and data assumption
2.1 Methodology
There are two methodologies used for assessing environmental impact of ‗manure-
biogas-digestate‘ system substitution and drawing final conclusion.
Calculate GHG emission abatement from ‗manure-biogas-digestate‘ system
substitution in rural household and M&L livestock farm in suburb respectively,
which is mainly based on IPCC guideline.
Assess the GHG emission abatement of biogas system development based on
future estimation. Changes of future energy consumption pattern and agricultural
land areas are two scenarios taken into account.
2.1.1 GHG emission abatement from ‘manure-biogas-digestate’
system
In order to simplify the calculation of GHG emission abatement from entire system,
‗manure-biogas-digestate‘ system is divided into two parts, which are ‗manure-
biogas‘ system and ‗manure-digestate‘ system. GHG emission abatement equals to
GHG emission from reference system minus GHG emission from ‗manure-biogas-
digestate‘ system, these emission estimates are based on IPCC guideline. From 2006.
GHG emission of ‗manure-biogas‘ system is from biogas production and utilization
phase and GHG emission of ‗manure-digestate‘ system is from digestate applied on
soil. Appendix 2 shows the schematic view of both household biogas system and
farm-based biogas system.
1. GHG emission abatement from ‘manure-biogas’ part
‗Manure-biogas-agriculture‘ system can not only reduce the energy crisis of rural
regions and over reliance on fossil fuels in urban, improve the ecological environment
and sanitation condition and local economic development, but also reduce the
greenhouse gas emission from fossil fuel combustion. Biogas has high heat value
(21MJ/m3) and thus can replace of fossil fuels, such as coal, and other biomass
resources like straw and firewood to provide heat for rural residents. In rural regions,
heating, cooking and lighting are the major ways to use the energy, hence CO2
emission abatement by biogas system mainly relies on how much fossil fuels it will be
replaced. (Appendix 3) In traditional manure treatment in China, methane always
emits from uncovered and simple manure storage tank. Compared to this, anaerobic
digester efficiently reduces methane emission from manure management (Appendix
4). As for biogas combusted for heat and electricity production, resulting GHG
emission should be reported under energy sector based on IPCC guideline-
Volume5_Ch4_biological waste water treatment [33]. However, CO2 emission from
biogas combustion is of biogenic origin which is regarded as 0, the N2O as well as
CH4 emission from that need to be considered. When biogas is burned, the emissions
are depended on quality of combustion facility. The combustion facility effects heat
conversion efficiency to some extend which should be taken into consideration when
assessing environmental impact of biogas utilization. As for biogas system of M&L
livestock farm, manure treatments of both ‗energy-environmental‘ biogas system and
‗energy-ecological‘ biogas system are anaerobic digestion but with different types of

24
anaerobic digester. The comparison between these two systems is the main purpose of
GHG emission abatement. The emissions produced from biogas production are
different in energy utilization aspective and digestate treatment aspective. Therefore,
GHG emission abatement by biogas system substitution is based on four parameters,
ERES (emission reduction from energy substitution), ERMM (emission reduction
from manure management), EBC (emission from biogas combustion) and EBP
(emission from biogas production). GHG emission abatement from ‘manure-biogas’
system equals to ERES+ERMM-EBC-EBP. All the formulas and parameters used for
calculation is gathered in Appendix 6.
ERES (emission reduction from energy substitution)
The ERES is calculated as GHG emission produced from energy fuel combustion
which is replaced by biogas. This parameter strongly depends on types of energy fuels
consumed in reference system.
a. In household biogas system, the reference system to be replaced is traditional
household system. The common energy fuels used in rural area are coal, straw
and firewood. Due to carbon neutral of straw, as a energy fuel, only coal and
firewood7 are considered as the energy fuel to be replaced by biogas. The coal
and firewood consumption is based on their share of entire rural energy
consumption. (Table 1.19) and GHG emission from them are calculated as the
formula (Appendix 6), EFGHG fuel are shown in Appendix 7. The GHG emission
from coal and firewood combustion are regarded as ERES of household biogas
system;
b. In livestock farm-based biogas system, coal as the only energy fuel used in
suburbs is considered. Biogas produced from ‗energy-environmental‘ biogas
system aims to providing heat for residents when burned in oven and biogas
produced from ‗energy-ecological‘ biogas system is used for electricity
generation. Hence, the GHG emission abatement of ‗energy-environmental‘
biogas system equals to ERESGHG fuel1 of coal combustion for heat and that from
latter system equals to ERESGHG fuel2 of coal for electricity production. The
ERESGHGfuel from ‗energy-ecological‘ biogas system substitute of ‗energy-
environmental‘ biogas system is ERESGHG fuel2 minus ERESGHG fuel1. ERMM (emission reduction from manure management)
Methane and nitrous oxide are two major emissions from livestock manure
management system depending on livestock categories, manure production and
manure treatment. Both the formulas for CH4 as well as N2O emission and parameters
for calculation are shown in Appendix 6.
a. In rural areas, livestock manure is treated as slurry/liquid storage, uncovered
lagoon, and composting. GHG emission from manure treatments are based on
IPCC guideline Volume4—manure management system [21].
b. In livestock farm-based biogas system, traditional livestock farm system use
composting as the only manure treatment. Because it is seen as the reference
system of both ‗energy-environmental‘ biogas system and ‗energy-ecological‘
biogas system, it leads to the same GHG emission when ingredients of feedstock
7 Firewood as a traditional biomass resource should be considered as carbon neutral in big map of CO2 cycle.
However, in rural areas of China, farmers used to cut down trees without further planting. The CO2 emit from
firewood combustion cannot be reduced by photosynthesis of new trees. Hence, firewood is included in
environmental assessment of this thesis.

25
keeping stable. The ERMM of ‗energy-environmental‘ biogas system substituted
by ‗energy-ecological‘ biogas system is only calculated as GHG emission from
MMS of former system minus MMS of latter one. The feedstock disposed during
biogas production process is seen as the manure management system rather than
biological waste or wastewater treatment because the manure treated here is seen
as the only ingredient with the water which flush manure to treatment system on
livestock farm. Hence, GHG emission from biogas production process, including
AD, solid composting, slurry storage and aerobic treatment are all based on IPCC
guideline Volume4- manure management system [21];
EBC (emission from biogas utilization)
The calculation of EBC is similar as ERES. (Appendix 6)
a. In household biogas system, GHG emission is from biogas combustion, which
should consider the biogas combustion efficiency in calculation;
b. Biogas produced from anaerobic digestion in ‗energy-ecological‘ biogas system is
used for generating electricity which will transport to residents for daily
consumption. The emission from CHP is calculated here; GHG emission from
biogas combustion directly is for ‗energy-environmental‘ biogas system.
EBP (Emission from biogas production)
Emission from biogas production equals to that from anaerobic digestion process.
This can be seen as the emission produced from AD8 manure management system and
that from energy consumption when producing biogas.
a. In household biogas system, no external heat supply is taken into consideration
and anaerobic digester operates nearly 3/4 of a year. The EBP produced is only
from anaerobic digester when storing livestock manure.
b. In livestock farm biogas system, heat is generated by coal burned in boiler which
is equivalent to 1/3 of energy contained in biogas production and electricity
bought from national electricity grid which should be taken into account. All
these energy consumption which are produced by fossil fuels produce GHG
emission especially CO2 emission to atmosphere. In additional, as for AD manure
treatment, N2O and CH4 are produced when manure stored. The leakage from
manure storage and leakage is not considered due to inefficient data of AD
selected. The formula for emission calculation from manure management is the
same as that for ERMM; (Appendix 6)
2. GHG emission abatement from ‘manure-digestate’ system
In agricultural sector, N2O is an important greenhouse gas and agricultural soil is a
major source of nitrous oxide emission. N2O is produced naturally in soil through
nitrification and denitrification. Nitrification is the aerobic microbial oxidation of
ammonium to nitrate (NH4+NO3
-) and denitrification is the anaerobic microbial
reduction of nitrate to nitrogen gas N2 (NO3-N2). N2O is produced in the reaction
sequence of denitrification and a by-product of nitrification. The N2O emission results
from anthropogenic N input and N mineralization occur through both a direct and
indirect pathway [34].
Direct pathway: N2O emission is directly from soils to which N is added;
8 AD is short for anaerobic digester

26
Indirect pathway: Volatilization of NH3 and NOx from managed soil; after
leaching and runoff of N from managed soils, mainly as NO3-; fossil fuel
combustion and biomass burning: the subsequent redeposition of NH3 and
NOx and their products NH4+and NO3
- to soil and water.
Appendix 5 represents sources and pathway of N2O emission in soil management
system. Since this study mainly focuses on GHG emission reduction in ‗manure-
biogas-agriculture‘ system, the nitrous oxides emission reduced by livestock manure
available to soil replacing of industrial fertilizer is analyzed in the first place. The
green colour boxes in Appendix 4 shows the relation between livestock manure
management and soil management as well as nitrous oxides emission from both
system. Appendix 6 shows all the formula and parameters for GHG emission
calculation from ‗manure-digestate‘ parts of both household biogas system and M&L
livestock farm-based biogas system.
GHG emission abatement from substitution of synthetic ammonia
The GHG emission abatement from ‗manure-digestate‘ part mainly considers how
much emissions are reduced by digestate applied on arable land. Synthetic ammonia is
the industrial fertilizer commonly used in China and it is the objective to be replaced
by digestate in two biogas systems. The GHG emission abatement from fertilizer
substitution includes two aspects. One is the emission from fertilizer production. In
China, coal is used as the major energy fuel for industrial fertilizer production. 2.2 Mt
coals are used for producing 1 Mt of N fertilizer, which means 2200 kg coal for 1 ton
of synthetic ammonia production [35]. And emission from coal combustion is seen as
the only GHG emission from fertilizer production phase [36]. The formula used for
emission calculation is as the same as that for ERES. The combustion efficiency of
coal is 40% should be included. What‘s more, the amount of synthetic ammonia
equals to NH4+ content in digestate which is assumed as 60% of total N content [37].
The second GHG emission is produced when synthetic ammonia used on soil (See
Figure 2.1). Applying synthetic N-fertiliser means not only N2O emissions from soil
but also CO2 is also loss during synthetic ammonia fertilisation. Synthetic ammonia
(CO(NH2)2) is converted into NH4+, OH
- and HCO3
- in the presence of water and
urease enzymes. HCO3- that formed evolves into CO2 and waster.[38] Hence, based
on IPCC guideline volume 4, CO2 is suggested to consider when it applied on soil.
a. In household biogas system, the GHG emission abatement in ‗manure-digestate‘
part results from GHG emission from synthetic ammonia production and
utilization, which contained as the same amount of NH4+ as digestate, minus
GHG emission from digestate applied on arable land;
b. In livestock farm-based biogas system, the GHG emission in present situation is
assumed to come from all synthetic ammonia fertilizer and use on farm. This is
equal to GHG emissions from ‗energy-environmental‘ biogas system since all
digestate produced from this system aren‘t used for fertilizer purpose. Hence, the
GHG emission abatement from ‗energy-ecological‘ biogas system substitutes of
‗energy-environmental‘ biogas system is only the GHG emission abatement from
former system itself. What‘s more, sell of manure in market after composting is
not taken into consideration in this part.
GHG emission produced by digestate applied on soil

27
Before calculating the GHG emission from ‗manure-agriculture‘ system, the nitrogen
flow in this system should be identified because N2O is the dominant emission in
agricultural sector which is tightly correspond with N flow (See Figure 2.1). Based on
IPCC methodology of calculate nitrous oxides emission from soils, large percentage
of emission is mainly caused by industrial fertilizer and organic fertilizer. Therefore,
the nitrous oxides emissions from industrial fertilizer replaced by manure application
can be seen as an effective solution of emission abatement in agricultural sector. Total
nitrogen in digestate should be seen as N content left after anaerobic digestion. From
Figure 2.1, N applied on soil equals to total N content in feedstock minus N lost
during manure treatment. The livestock manure is assumed to be purred into
anaerobic digester immediately, so the N loss 1 is neglected here.
a. In household biogas system, digestate is stored in anaerobic digester which is
removed twice a year. N content in digestate applied on soil is decided by
ingredients of feedstock and N lost during the storage. N lost is calculated as N2O
lost during a year.
b. In livestock farm-based biogas system, effluent from anaerobic digester in
‗energy-environmental‘ system is treated as sewage without any agricultural
utilization. Hence, this part is considered as 0. While in ‗energy-ecological‘
system, digestate replacing synthetic ammonia are used on soil.
Figure 2.1 N flow from livestock collection to organic fertilizer utilization
2.1.2 Future estimation of GHG emission abatement of ‘manure-
biogas-digestate’ system development
The GHG emission abatement from household biogas system is calculated from
energy and manure management aspects included in ‗manure-biogas‘ parts and
agricultural aspects included in ‗manure-digestate‘ parts. However, with the change of
traditional energy consumed and arable land areas irrigated in reference system, GHG
emission abatement from biogas system is variable. Hence, future estimation is done
here in order to assess which factor will take more effect to GHG emission abatement.
Since the purpose of household biogas system and livestock farm-based biogas system
are different, future estimation is also applied for judging whether main purpose of
N available
Manure
Manure
management system
Arable land Storage Digestate
fertilizer
Crop
N loss 4 N loss 3
N loss 1
N loss 2

28
these two systems is appropriate for environment improvement. What‘s more, it aims
to looking for constraint conditions for further development of biogas system.
1. Household biogas system
Household biogas system is encouraged to implement in rural area results from its
energy purpose. However, when analysing the entire ‗manure-biogas-digestate‘
system, both the energy and agricultural perspective are considered. Hence, whether it
is appropriate to develop the household biogas system should also make
environmental analysis to digestate utilization as well. The future estimation of
household biogas system is focused on two parts:
To assess the GHG emission abatement from household biogas system through
increasing share of coal consumption in rural energy system. As described in
Chapter 1, coal domestic consumption will increase 3-5% during 2006-2010 per
year and 1-2% in the next 10 years annually. [27] Hence, the growth rate of coal
consumption in rural areas is assumed the same as the domestic trend, and the
sensitivity analysis of energy substitution is based on the coal consumption
increased with same rate of firewood reduced. The aim is to estimate how
environmental impact the biogas utilization will bring when RES changed in the
future. This can make conclusion and suggestion to future development of
household biogas system.
To assess the GHG emission abatement from household biogas system through
changing share of digestate applied based on arable land area. The future
estimation is calculated as arable land area per household decreased by 4% and
16% which is according to the estimate of increasing crop yield per arable land
from 2010-2030 related to urbanization. The aim of it is to emphasize the
importance of concerning digestate utilization from agricultural perspective. In
additional, the constraint condition of how much digestate will apply based on
arable land area results from N-fertilizer consumption per hectare, which is
suggested as 150-180kg/ha. Because the more digestate surpass the required N-
fertilizer input, the more N will leach and runoff from soil, which leads to
pollution to underground water. Hence, the GHG emission abatement from
agricultural perspective should be under the condition of minimum water and soil
pollution.
2. Livestock farm-based biogas system
Due to the reference system (traditional livestock farm) of both ‗energy-
environmental‘ biogas system and ‗energy-ecological‘ biogas system are the same;
hence, the GHG emission abatement is seen as the comparison between these two
systems. Because livestock farm-based biogas system is applied only for
environmental purpose, the aim of future estimation aims to pointing out how large
effect from energy substitution part effect the total GHG emission abatement of
biogas system development and what are constraint conditions when judging whether
‗energy-ecological‘ biogas system is right for replacing ‗energy-environmental‘
biogas system. Two variable factors are considered here.
The first one is the increase of natural gas consumption in suburb nearby. In
Chapter 1, introduction of RES of urban illustrates that the natural gas
consumption will rise by 11-13% annually during next 15 years.[27] However,
due to power generation plants are still run by coal, only heat production is
substituted by natural gas in RES when estimate the future scenario. The results

29
from this future estimation will reflect how variable the GHG emission abatement
when natural gas increased and coal decreased the same rate;
The other factor is the change of arable land area based on TN and COD content
in digestate under national irrigation standard (See Table 2.1) requirement. Only
‗energy-ecological‘ biogas system is considered here because of digestate
utilization. The maximum arable land area required is calculated by TN and COD
content in digestate in case study. And the minimum arable land area is based on
TN and COD content in digestate after SBR (aerobic treatment). The future
estimation in ‗manure-digestate‘ part illustrates how GHG emission abatement
changed based on max and min required arable land area.
Table 2.1 National irrigation standard on farm [39]
Arable land Rice Wheat and maize Vegetable
Irrigation water
quantity L/mu1.yr
800,000 300,000 200,000-500,000
COD mg/L <=200 <=300 <=150
TN mg/L <=12 <=30 <=30
*1. 1 mu=0.067 hectare
2.2 Data collection and assumption
2.2.1 Data collection
In order to get to know the present situation of biogas system development in rural
household and M&L livestock farm in China, the fieldwork is indispensible. It is not
only important for data collection but also for future suggestion based on investigation
to different roles involving in biogas system. The Biogas Scientific Research Institute
of the Chinese Ministry of Agriculture situated in Chengdu, Sichuan province offered
the most support to my fieldwork. And the reflection to future development of two
types biogas systems were mainly obtained from 2010 bio-energy expo and
international bio-energy summit in Beijing.
2.2.2 Data assumption
The environmental impact from biogas system mainly relies on ingredients of
feedstock to anaerobic digester, types of anaerobic digester and types of biogas
system. Hence, the data used for GHG emission abatement calculation of specific
biogas project are all collected in fieldwork while to large-scale biogas system
development should consider the other variable factors.
1. Household biogas system
Fixed factor assumption of household system in case study
The GHG emission abatement and sensitivity analysis of household biogas system in
rural area in this thesis is based on the result of fieldwork rather than the large-scale
system analysis. Hence, the factors below are fixed if analysis is done in the same

30
area. However, if large-scale analysis is estimated, most of factors should be changed
according to local situation, which are included in variable factor assumption to be
mentioned in conclusion part for future development suggestion.
a. Energy demand per person
This data is obtained from the investigation on research field, which is 0.3 m3 biogas
per people per day. And total energy demand of household can be simply calculated
as the result of unit energy demand multiplies the people of family.
b. Biogas yield from livestock manure
It is affected by amount of livestock manure and the other substrate added. Because
the raw materials are mixed, the biogas yield is hard to estimate only depending on
the types of substrate in biogas digester. In order to get the max biogas yield, ratio of
manure and straw is suggested as 5/1 by scientists in China. Hence, biogas yield
should also be assumed as fixed factor if amount of livestock manure is known.
c. Energy efficiency of traditional energy fuel
In household biogas system, coal and firewood are two energy fuel to be substituted
by biogas, of which the energy efficiency for heat are 40% and 24%. What‘s more,
biogas is normally considered as the renewable energy, from which CO2 emission is
0, but with shrink of arable land area, the capacity of CO2 emission recovery is
decreased. Hence, CO2 emission from biogas combustion should be considered here.
The energy efficiency from biogas to heat is 60% in household biogas system.
d. Types of industrial fertilizer applied on arable land
Synthetic ammonia is assumed as the only industrial fertilizer applied on arable land
and to be substituted by digestate. The NH4+ contained in digestate is 60% of total N
and it equals to the same amount of synthetic ammonia consumption.
e. Fraction of manure management system
When concerning the manure management system in calculating GHG emission
abatement from system, faction of each manure management system is assumed as 1.
The agricultural plants in arable land close to household digester
The agricultural plants cannot be changed when making sensitivity analysis.
f. Arable land area
Each household has the fixed size of arable land. 1 mu=0.067 hectare per household
in rural area.
Variable factor assumption of household system in large-scale estimate
Allocation of coal and firewood consumption in rural energy system and share of
digestate applied on arable land are two variable factors are considered in future
estimation. The following variable factors are not included in calculation but to be
mentioned in conclusion part in Chapter 3 for future development suggestion.
a. Types of household biogas system
‗4 in 1‘ and ‗5 in 1‘ household biogas system (see explanation in Page 11 and 12)
common used in other parts of Chinese rural areas except western part lead to
different GHG emission abatement by biogas system implement.

31
b. Ingredients of feedstock to anaerobic digester
Dairy cows, cattle and chicken breed in rural area is not considered in the case study.
However, due to different TS, VS and N content in their manure, the biogas yield and
organic fertilizer benefits are various.
c. Types of plants grown in agricultural land per household
The parameters shown in Table 2.2 reflect the amount of digestate applied on soil is
required by types of plants. The climate is different according to geographical
distribution in China, crops and other plants are various.
2. Livestock farm-based biogas system
Different from household biogas system, livestock farm-based biogas system is more
complex according to anaerobic digester selection and biogas production process
design. Two biogas systems are discussed in this thesis, and dairy cow manure is the
only manure in feedstock for biogas production. The certain type of anaerobic digester
has been chosen by project design of each system.
Fixed factor assumption of livestock farm-based biogas system in case study
a. Biogas yield from livestock farm
This data can be obtained based on amount of livestock and manure production per
livestock on farm. In this case study, the substrates are mixed with manure, urine and
wastewater from farm, of which the biogas yield is calculated according to full-scale
data.
b. Energy consumption of residents surrounding
The energy consumption of residents living beside livestock farm is assumed only
produced by coal combustion. The coal combustion efficiency is 40% and the
combustion efficiency of natural gas is 57% in sensitivity analysis. In additional,
biogas produced from ‗energy-ecological‘ biogas system is for electricity generation.
The electricity conversion efficiency is 36% and heat conversion efficiency is 45%
from CHP.
c. Energy consumption on farm
On livestock farm, the energy consumption is concerned as heat and electricity
demand for all facilities in biogas production process. Because ‗energy-
environmental‘ biogas system and ‗energy-ecological‘ biogas system are two systems
adopted for the same project, of which the heat and electricity is considered as equal.
and when making comparison, the GHG emission from this part is 0, which can be
neglected.
d. Chemicals contained in discharged water
The chemicals contained in effluent from anaerobic digester are based on the types of
digester chosen by biogas system and feedstock formation. In order to get the national
discharged wastewater standard, aerobic pond is designed in the process. In this case
study, the removal ratio of TN and COD in slurry is assumed as 74.1% and 52.7-
82.1% based on SBR technology [40].
Variable factor assumption of livestock farm-based system in large-scale estimate
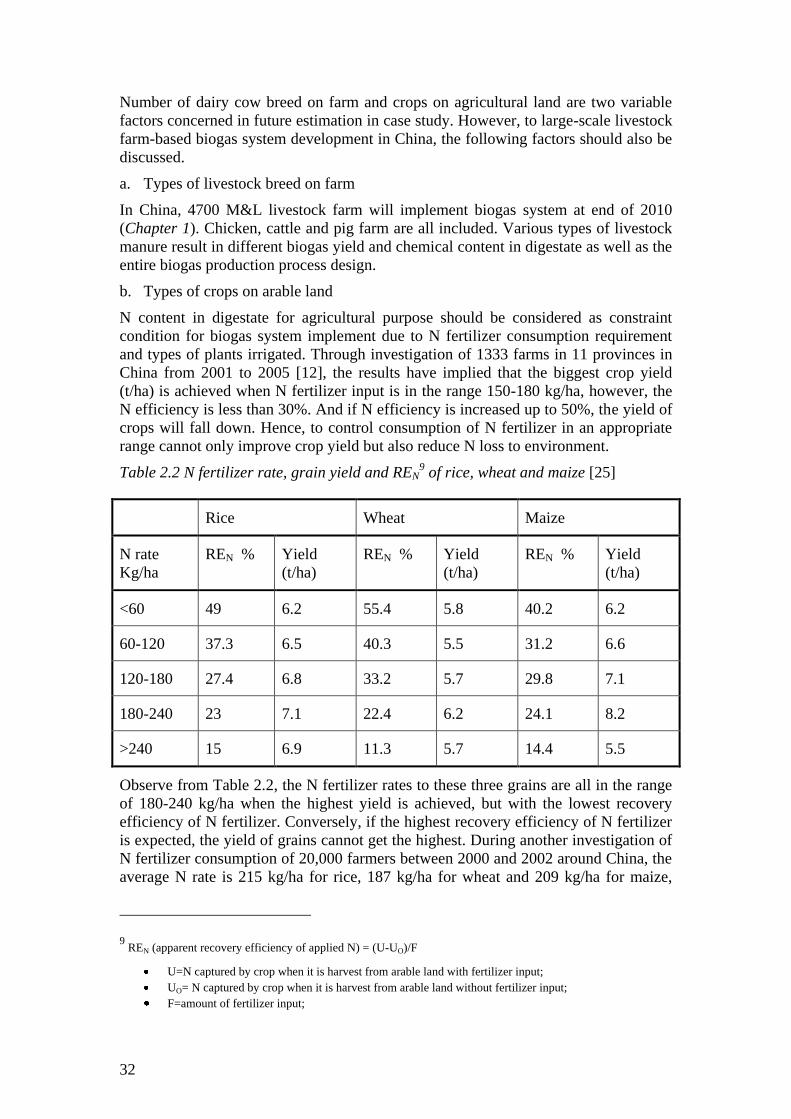
32
Number of dairy cow breed on farm and crops on agricultural land are two variable
factors concerned in future estimation in case study. However, to large-scale livestock
farm-based biogas system development in China, the following factors should also be
discussed.
a. Types of livestock breed on farm
In China, 4700 M&L livestock farm will implement biogas system at end of 2010
(Chapter 1). Chicken, cattle and pig farm are all included. Various types of livestock
manure result in different biogas yield and chemical content in digestate as well as the
entire biogas production process design.
b. Types of crops on arable land
N content in digestate for agricultural purpose should be considered as constraint
condition for biogas system implement due to N fertilizer consumption requirement
and types of plants irrigated. Through investigation of 1333 farms in 11 provinces in
China from 2001 to 2005 [12], the results have implied that the biggest crop yield
(t/ha) is achieved when N fertilizer input is in the range 150-180 kg/ha, however, the
N efficiency is less than 30%. And if N efficiency is increased up to 50%, the yield of
crops will fall down. Hence, to control consumption of N fertilizer in an appropriate
range cannot only improve crop yield but also reduce N loss to environment.
Table 2.2 N fertilizer rate, grain yield and REN9 of rice, wheat and maize [25]
Rice Wheat Maize
N rate
Kg/ha
REN % Yield
(t/ha)
REN % Yield
(t/ha)
REN % Yield
(t/ha)
<60 49 6.2 55.4 5.8 40.2 6.2
60-120 37.3 6.5 40.3 5.5 31.2 6.6
120-180 27.4 6.8 33.2 5.7 29.8 7.1
180-240 23 7.1 22.4 6.2 24.1 8.2
>240 15 6.9 11.3 5.7 14.4 5.5
Observe from Table 2.2, the N fertilizer rates to these three grains are all in the range
of 180-240 kg/ha when the highest yield is achieved, but with the lowest recovery
efficiency of N fertilizer. Conversely, if the highest recovery efficiency of N fertilizer
is expected, the yield of grains cannot get the highest. During another investigation of
N fertilizer consumption of 20,000 farmers between 2000 and 2002 around China, the
average N rate is 215 kg/ha for rice, 187 kg/ha for wheat and 209 kg/ha for maize,
9 REN (apparent recovery efficiency of applied N) = (U-UO)/F
U=N captured by crop when it is harvest from arable land with fertilizer input;
UO= N captured by crop when it is harvest from arable land without fertilizer input;
F=amount of fertilizer input;

33
which are all concentrate on crop yield more than recovery efficiency. Hence, large
amount of N lost to environment in agricultural sector. In China, the recommended N
rate to crops are in range of 150-200 kg/ha and 250 kg/ha is the maximum.
c. Types of anaerobic digester
The anaerobic digester plays an important role in biogas production and chemicals
removal in process. Based on the purpose of biogas system implemented on livestock
farm, different anaerobic digester is chosen. The factors used for AD selection are VS
concentration of feedstock, required biogas yield, required chemical content in slurry
and energy demand for biogas production.

34
3. Case study
Two case studies in this chapter is selected as an example to represent biogas
development in rural area and livestock farm in China. Each case study contains two
scenarios, one is based on reference system and the other is based on suggested
system. Due to different backgrounds of two case studies, the selection of reference
system and suggested system in each should be connected with local situation.
Case study 1 is done in rural areas in Sichuan province, in which the
household biogas system is built for replacing of traditional household system.
Hence, in case study 1, the reference system is chosen as traditional
household system and suggested system is household biogas system.
Case study 2 reflects the biogas project on dairy cow farm in Inner Mongolia.
The reference system is ‗energy-environmental‘ biogas system and the
suggested system named ‗energy-ecological‘ biogas system.
The purpose of this chapter aims to introducing the background of each case study
and calculating GHG emissions of two scenarios in each case study. This Chapter
provides the basic data for assessing GHG emission abatement of each case study in
Chapter 4, which is the foundation for justifying whether suggested system is
appropriate to substitute of reference system. The background information and basic
data of both case studies including livestock amount, family size, arable land areas as
well as facility capacity were obtained from fieldwork.
3.1 Case study 1—housheold biogas system
3.1.1 Background of case study 1
Figure 3.1 Map of Sichuan province
Western China is chosen as a research region of household biogas system because of
its natural and social environment. Land areas of western China occupy 72% of total
areas in China but the population density is only 0.55 per hectare. In energy

35
perspective, most of remote areas and under developed areas are in this region, where
the main energy carriers of people‘s daily life are firewood and straw. If biogas
project developed universally in these areas, it is a good solution to energy crisis of
people there. From agricultural perspective, distribution of arable land in this region is
imbalance. Most of arable land with higher productivity concentrates in Sichuan basin
but other areas especially in northwest are facing with severely soil erosion and
desertification. Hence, with such a great potential to develop the household biogas
project, Sichuan province is selected as the fieldwork site for household biogas system
research. The map of Sichuan is shown as Figure 3.1, of which the average
temperature ranges between 14oC-19
oC per year. The average temperature in spring is
between 10oC-21.9
oC which lasts for three month; The average temperature of
summer is more than 22oC; The temperature in autumn is similar with that in spring
and 3-8oC is the average temperature in winter. [41]
3.1.2 GHG emission calculation of case study 1
1. Basic information about case study 1
In western part of rural China, swine is the most common livestock breed in
household, the manure of which is chosen as a research feedstock of household biogas
project. The household system selected for environmental analysis contains 3 people
and 4 pigs breed in the backyard. The types of pigs are all fattening pigs which are
breed for 4 months each time and 12 swine totally in one year. The functional unit for
calculation is set as the total weight of swine manure for biogas production per
household.(See Table 3.1) The arable land area per functional unit in scenario 1 is 1
mu which is equivalent to 1/15 hectare. Because the temperature in winter is not
appropriate for biogas production, 3/4 of one year is considered in calculation.
During the fieldwork of household biogas project in rural areas of Chengdu, the swine
manure, human manure and straw are common components of feedstock for biogas
production by anaerobic digestion in household digester. Because the aim of this
research mainly focuses on GHG emission abatement of biogas production from
livestock manure, the human manure and straw added are not taken into consideration
in the case study 1. The biogas in rural areas from household biogas digester is used
for lighting, heating water and cooking. The total biogas output is based on biogas
combustion efficiency. Total energy content in biogas utilization per functional unit is
shown in Table 3.2.
Table 3.1 Total swine manure to biogas digester per household per year, this figure is
set as the functional unit. (kg)
Feedstock Unit weight
(kg/hd.day)
Number of
swine (head)
Life time of swine
(day)
Total swine manure to
biogas digester (kg)
Swine
manure
2 12 91 2190
Table 3.2 Total energy content of biogas utilization. This figure is based on the
functional unit (MJ)

36
Total swine
manure (kg)
TS
(%)
Biogas producing
rate (m3/kg TS)
Biogas
yield (m3)
Energy content
of biogas (MJ)
End-use
(MJ)
2190 18.5 0.375 152 3192 1723
* 1 m3 biogas=21MJ ; Biogas combustion efficiency is 60% and leakage of biogas from household
AD is 10% of biogas yield.
Besides biogas produced from household biogas digester, the by-product of digester is
the digestate with large amount of nutrients, such as N and P content. However, the
data of N and P content in human manure and straw are hard to get, the N and P
content of digestate only takes that of swine‘s manure into account. (See Table 3.3)
Table 3.3 N and P content of swine manure for biogas production per household per
year. This figure is calculated based on functional unit. (Kg)
N content of
swine manure
(kg/head)
P content of
swine manure
(kg/head)
Number of
swine
(head)
N content of
swine manure1
(kg)
P content of
swine manure1
(kg)
3.7 0.8 12 33.3 7.2
*1. The manure used for biogas production depends on operational time of anaerobic
digester, which is 3/4 of one year.
2. GHG emission from scenario 1 in case study 1
See the Figure 3.2, the traditional household system (Scenario 1) is chosen as the
reference system to household biogas system in case study 1. It is divided into three
parts for its environmental analysis. The GHG emission from its energy perspective
results from energy consumption pattern in this system; The GHG emission from its
manure management system depends on different manure storage method; The GHG
emission from agricultural perspective is mainly relied on energy used for making
industrial fertilizer which applied on arable land.
N2O, CH4 CO2
fertilizer
Livestock
manure
Crops
Cooking Crop
residue
Heating water
Lighting
Coal
Rural household Oven
firewood
Livestock

37
Figure 3.2 Traditional household system
GHG emission from energy perspective of scenario 1
In rural areas of China, coal, straw and firewood are used as the main energy fuel for
people‘s daily life. Based on Table 1.19 in Chapter 1, allocation of these three energy
fuels consumption in rural areas of China in 2005 occupied almost 86% of total
energy consumption, in which firewood is 24% and coal is 32%, which is seen as 57%
and 43% when substituted by biogas. The amount of these two energy fuel is
calculated based on equivalent energy content of biogas produced from household
biogas digester per year. The result of this calculation can be seen as GHG emission
abatement replaced by biogas, which is presented as ERESGHG fuel (emission reduction
from energy substitution) for short. (See Table 3.4) The GHG emission factor of coal
and firewood are shown in Appendix 7.
Table 3.4 Energy input (MJ) of coal and firewood amount to equivalent biogas
utilization and emissions (kg) from combustion.
Energy fuel
consumption
in reference
system
Biogas
energy
equivalent
(MJ)
Energy input (MJ) GHG emission (kg)
1723 Share % Heat CO2 CH4 N2O CO2-equ10
Coal 57 982.5 232.3 0.024 0.004 234
Firewood 43 741 345.7 0.1 0.013 351.5
Total GHG emission from
energy perspective (kg)
100 1915.2 578 0.124 0.017 585.4
*The energy here only points out daily life energy demand, such as lighting, space heating and
cooking. Coal=29MJ/kg; Firewood=16.6MJ/kg. The amounts of fossil fuel are calculated
according to their share in rural energy consumption system and combustion efficiency.
Combustion efficiency of coal is 40% and firewood is 24%.
ERESGHG fuel (emission reduction from energy substitution) equals to total GHG
emission produced by coal and firewood consumption in rural househld. Based on
Table 3.4, it is clear to see that the GHG emission from coal is less than firewood
although it has higher allocation in energy system. 40% of total CO2-equ emission is
produced from coal and 60% is from firewood.
GHG emission from manure management perspective of scenario 1
In rural areas of China, there are three types of manure management system
commonly used by farmers. The total manure from pigs per functional unit is 2190
kg. The GHG emission from manure management system in traditional household
system is calculated upon types of manure treatment used by farmers. The result of
this calculation is named ERMM (emission reduction from manure management) for
10 1 t CH4 = 21 t CO2-equivalent, 1 t N2O = 310 t CO2-equivalent

38
short, which are shown in the Table 3.5 below. The formula used for calculation is
introduced in Chapter 2 based on IPCC guideline-Volume 4 and shown in Appendix 7.
Through the comparison among these four MMS11
, it is clear to see that the CO2-equ
emission from composting is the least which is nearly 1/4 of that from slurry and
uncovered lagoon system. The N2O emission per functional unit from composting is
the largest but the CH4 from this manure management system is the least.
Table 3.5 GHG emission from traditional MMS and digestate utilization, this figure is
based on functional unit (kg)
MMS Swine manure input (kg) GHG emission (kg)
VS1 TN CH4 N2O CO2-equ
Composting 340 33.3 0.66 0.84 274.1
Uncovered lagoon 52.23 0.32 1196
Slurry/liquid 43 0.58 1082.2
*1. VS is calculated based on functional unit which is total VS of swine manure per year. 2. The
average temperature of scenario 1 is assumed as 25oC, on which MCF value of different MMS is
based.
GHG emission from agricultural perspective of scenario 1
In agricultural perspective of traditional household system, the GHG emission is
calculated based on energy consumption used for making synthetic ammonia which
are the most common N-fertilizer applied on arable land per household. Based on
Table 1.15, N fertilizer consumption in 2007 in China is 230 kg N/ha which is equal
to 15.3 kg N/mu (1 mu=0.067 hectare). However, according to N content in swine
manure in Table 3.4, 33.3 kg N contained in digestate per function unit can produce
60%-70% of NH4+ by microorganism in soil. It can substitute of all the N-fertilizer
applied per mu arable land. According to The norm of energy consumption per unit
product of synthetic ammonia made by Chinese government, the coal consumption
per ton of synthetic ammonia mustn‘t be more than 2200 kg.[35] Table 3.6 shows the
GHG emission from coal combustion for making synthetic ammonia, and N2O and
CO2 emission from soil where synthetic ammonia applied.
Table 3.6 GHG emissions from synthetic ammonia production and utilization, the
total GHG emission from agricultural perspective is based on functional unit (kg)
Synthetic TN-equ NH4+/TN Synthetic Coal for GHG emission (kg)
11 MMS is short for manure management system

39
ammonia
(NH4+)
input
in swine
manure
(kg)
in swine
manure
(%)
ammonia
substitution
(kg)
ammonia
production
(kg)
CO2 CH4 N2O CO2-
equ
Production 33.3 60 19.98 44 120.7 0.013 0.002 122
Utilization 7.3 0.16 57
Total GHG emission from agricultural perspective (kg) 128 0.013 0.162 179
When the same amount of synthetic ammonia applied on soil, the direct N2O and
indirect N2O are the main GHG emission from soil. The GHG emission is calculated
based on IPCC guideline and formula is stated in Chapter 2. The manure treated from
traditional manure management system is also used as fertilizer on soil but it doesn‘t
replace of the industrial fertilizer per household, farmers are used to selling this
organic fertilizer in the market. The emissions from this part are not to be calculated
in this system. In additional, based on IPCC guideline, the CO2 emission from urea is
included in GHG emission from urea applied on soil. According to chemical reaction
from urea to ammonium in soil, 1 urea can be degradable into 2 ammonium.
3. GHG emission from scenario 2 in case study 1
Figure 3.3 represents household biogas system which is encouraged to replace of
traditional household system in rural areas of China. This system is the suggested
system for future development in rural China and it is the scenario 2 in case study 1.
Compared to reference system, GHG emission from biogas system includes biogas
combustion from energy perspective, manure storage in AD and digestate (organic
fertilizer) applied on soil.
Figure 3.3 Rural household biogas system
GHG emission from energy perspective of scenario 2
The biogas produced from household anaerobic digester is used for heating purpose
for people‘s daily life. Due to CO2 emission from biogas combustion is of biogenic
N2O
CH4, N2O CH4,CO2
Digestate
Livestock manure
Household biogas digester
Cooking
Biogas Heating water
Lighting
Crops
Fruit

40
origin, the GHG emission only includes N2O and CH4. The result is illustrated in
Table 3.7.
Table 3.7 GHG emission from biogas combustion. Data is based on functional unit.
(kg)
Household biogas system Energy input (MJ) GHG emission (kg)
Biogas combustion CO2 CH4 N2O CO2-equ
2872 0 0.003 0.0003 0.15
GHG emission from manure management perspective of scenario 2
Anaerobic digester as one of the manure management systems also emits GHG
emissions when producing biogas. The GHG emission from AD stated in Chapter 2 is
only focused on treatment of livestock manure. The emission factor of human manure
and straw are not introduced here. Hence, the result of this calculation shown in Table
3.8 is only based on anaerobic digestion of swine manure. After manure is treated in
AD, it would store in uncovered lagoon. The GHG emission from it should be
considered. However, the emission from this part is extremely larger than the others
because of large amount of methane emitted from uncovered lagoon.
Table 3.8 GHG emission from anaerobic digester in household biogas system, this
figure is based on functional unit (kg)
MMS Swine manure input (kg) GHG emission (kg)
Biogas
leakage
CH4
content
CH4 N2O CO2-equ
AD 15.2 60% 6.11 0 128.3
Total CO2-equ emission from MMS in household biogas system 128.3
*1. VS is calculated based on functional unit which is total VS of swine manure per year. 2. The
average temperature of scenario 1 is assumed as 25oC, on which the density of CH4 is 0.67kg/m
3
and weight of CH4 leakage is 152m3*0.6*0.1*0.67kg/m
3=10kg. The CH4 content of biogas is 0.6
GHG emission from agricultural perspective of scenario 2
After fermentation of anaerobic digester, digestate can be applied on soil as a kind of
organic fertilizer. Assume the N quantity The total N content in swine manure is 33.3
kg per functional unit and each household has 1 mu (1/15 hectare) of arable land in
this case study. The N content in feedstock input should be considered as the sum of
N2O and NH3 emission and NH4+
and NO3- left in digestate, but due to lack of data
offered, the organic N-fertilizer input per mu arable land is assumed the same as the
same amount of N content in swine manure, 33.3 kg. The CO2-equ emission from

41
organic fertilizer applied on soil is shown in Table 3.9 which is calculated as IPCC
guideline in Chapter 2.
Table 3.9 GHG emission from organic fertilizer applied on soil and this figure is
based on functional unit. (kg)
Household biogas system Digestate input (kg) GHG emission (kg)
TN in swine manure N2O CO2-equ
33.3 0.32 67
3.2 Case study 2—Livestock farm-based biogas system
3.2.1 Background of case study 2
Because of high population density in eastern China, large demand of animal food
product leads to increasing number of intensive livestock farms. From analysis above,
livestock farm in eastern China will have the largest potential of biogas development
in 2010. What‘s more, based on article written from Q.Z [26], the highest nitrous
oxide emission from unit arable land is from this region, where is the largest fertilizer
consumption per hectare input as well. Moreover, under transition of Chinese
livestock husbandry system and urbanization process in future, intensive livestock
farm will replace of household livestock husbandry pattern in China which will result
in producing livestock manure more concentrate. Compared to household livestock
husbandry pattern, intensive pattern has stricter requirement on surrounding capacity
to sustain digestate in large amount. The eastern region of China is located along sea
coast and strict manure management system must be applied in order to protect
ecosystem. Hence, whether increasing of M&L livestock farm biogas projects in this
region is appropriate, will be assessed through environmental analysis in entire
‗manure-biogas-agricultural‘ system.
The case study 2 is about a dairy industry in inner Mongolia in China. All data comes
from Biogas Scientific Research Institute of the Ministry of Agriculture in Chengdu.
Inner Mongolia is a large region located along the northern edge of China, in which
many dairy cow farms are built. (See Figure 3.4) The east of Inner Mongolia consists
of wide grass meadow lands, forests and mountains. The winter in this area occupies
half of a year and average temperature is below 28oC. The weather is humid between
May and September. The west of the region is made up of scorching hot dry deserts,
which is always hot in summer and extremely cold in winter. The dairy cow farm is
located in the eastern part of Inner Mongolia. Inner Mongolia had total land area 5.37
million hectare, in which arable land occupies 0.59 million hectare, pastorueland land
is 2.53 million hectare and forest land are 0.24 million hectare. In 2008, net arable
land increased by 1000 hectare corresponding to an average of unit arable land
surpasses 0.67 ha per farmer. Due to large quantity of dairy cow manure in this
region, the development of biogas production from livestock manure and application
of digestate to soil have attracted most attention.
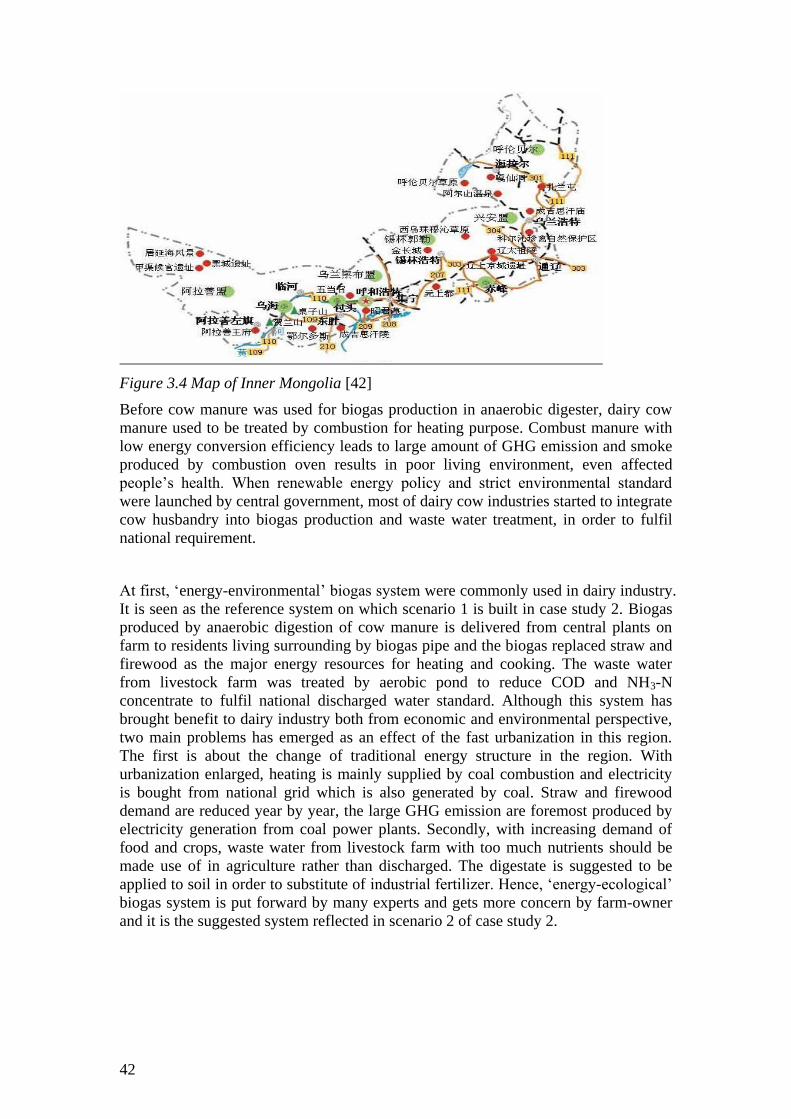
42
Figure 3.4 Map of Inner Mongolia [42]
Before cow manure was used for biogas production in anaerobic digester, dairy cow
manure used to be treated by combustion for heating purpose. Combust manure with
low energy conversion efficiency leads to large amount of GHG emission and smoke
produced by combustion oven results in poor living environment, even affected
people‘s health. When renewable energy policy and strict environmental standard
were launched by central government, most of dairy cow industries started to integrate
cow husbandry into biogas production and waste water treatment, in order to fulfil
national requirement.
At first, ‗energy-environmental‘ biogas system were commonly used in dairy industry.
It is seen as the reference system on which scenario 1 is built in case study 2. Biogas
produced by anaerobic digestion of cow manure is delivered from central plants on
farm to residents living surrounding by biogas pipe and the biogas replaced straw and
firewood as the major energy resources for heating and cooking. The waste water
from livestock farm was treated by aerobic pond to reduce COD and NH3-N
concentrate to fulfil national discharged water standard. Although this system has
brought benefit to dairy industry both from economic and environmental perspective,
two main problems has emerged as an effect of the fast urbanization in this region.
The first is about the change of traditional energy structure in the region. With
urbanization enlarged, heating is mainly supplied by coal combustion and electricity
is bought from national grid which is also generated by coal. Straw and firewood
demand are reduced year by year, the large GHG emission are foremost produced by
electricity generation from coal power plants. Secondly, with increasing demand of
food and crops, waste water from livestock farm with too much nutrients should be
made use of in agriculture rather than discharged. The digestate is suggested to be
applied to soil in order to substitute of industrial fertilizer. Hence, ‗energy-ecological‘
biogas system is put forward by many experts and gets more concern by farm-owner
and it is the suggested system reflected in scenario 2 of case study 2.

43
3.2.2 GHG emission calculation of case study 2
1. Basic information about case study 2
This dairy cow farm located in Inner Mongolia breed 10,000 cows for milk supply,
which feed biogas plants with 280 tons manure and 200 tons urine every day. The
influent flow rate to biogas plants and biogas yield are shown in Table 3.10 below.
Before electricity turbine introduced to farm, the biogas produced was delivered by
pipeline to residents‘ living nearby. The wastewater from digester is required to be
treated as national chemical standard before discharged. The new design concept of
biogas project on this cow farm focuses on electricity generation and digested residue
utilization as organic fertilizer for pastureland. The functional unit of M&L farm
based biogas system is based on ton dairy cow manure treated by anaerobic digestion
per day. The manure is produced by total 10,000 heads of dairy cow per day. The
influent to biogas digester on dairy farm includes dairy cow manure and urine, and
wastewater of flashing manure per day; the effluent points out slurry produced at the
end of pipe.
Table 3.10 Biogas potential of feedstock based on functional unit (m3)
Substrate Quantity of
feeding (ton/day)
TS
%
Biogas producing
rate (m3/kg TS)
Biogas
yield(m3)
Energy
content(MJ)
Cow
manure
280 16.7 0.25 11690 245,490
Urine 200 0
Waste
water
160 0
To environmental consideration, national form of chemical content in effluent from
livestock farm is required to fulfil when wastewater discharged. Table 3.11 is the
chemical content of influent to biogas system in this case study and Table 3.12
illustrates the national form of chemical content of effluent and the chemical removal
ratio based on influents and national standard.
Table 3.11 Chemical content in influent to biogas system (kg). This figure is based on
functional unit.
Substrate Quantity
(ton/ day)
COD
(kg/ton)
BOD
(kg/ton)
TN
(kg/ton)
TP
(kg/ton)
NH3-N
(kg/ton)
Cow manure 280 31 24.53 4.37 1.18 1.7
Urine 200 6 4 8 0.4 3.5
Wastewater 160 0 0 0 0 0
Concentration 16654.3 12926.3 4759.6 691.8 1982.3

44
mg/L
Concentration
kg
9880 7668.4 2823.6 410.4 1176
Table 3.12 National chemical standard of effluent discharged from livestock farm and
responding chemical removal ratio [43]
COD BOD NH3-N P
Concentrate
mg/L
400 150 80 8
Chemical
removal %
97.6 98.8 96 98.8
2. GHG emission from scenario 1 in case study 2
GHG emission from biogas production process of scenario 1
In the ‗energy-environmental‘ biogas system (Appendix 8), the cow manure and waste
water is primarily treated by solid-liquid separation process after pre-treatment, which
can reduce COD and VS content in slurry. (See Table 3.13) After then, 65.6% of VS
and 39.8% of TN can flow into dewatered system for solid composting and the rest
VS and TN is contained in liquid after separation inflow to anaerobic digestion. The
UASB is the type of anaerobic digester selected in this system, which can remove
86.7% of VS and 70% of TN [44] and SBR can reduce 75% of TN and 60% of VS.
The slurry produced after fermentation of feedstock in anaerobic digester must be
discharged after aerobic treatment in order to fulfil the national form of waste water
discharged from livestock farm. Biogas in this system is transported by biogas pipe to
residents living around. It assumed the transport distance is not so long that methane
leakage is not taken into consideration. The GHG emission abatement in biogas
utilization in ‗energy-environmental‘ biogas system is relied mostly on the traditional
energy structure in specific site.
Table 3.13 VS content of dairy manure for biogas production (ton)
Feedstock Quantity of feedstock
ton/day
TS % VS
%TS
Quantity of VS
Cow manure 280 16.7 74 34.6
Urien 200 0
Waste water 160 0
The GHG emission produced from different phases of biogas production system is
calculated as IPCC guideline which is stated in Chapter 2. All the CH4 and N2O
emission are calculated as IPCC guideline-Volume4. The quantity of manure
treatment for composting is based on VS removed from separation phase and moisture

45
content in composting, which is appropriate at 55%-60%. The GHG emission from
USAB is regarded as that from dairy manure treated by anaerobic digester and that
produced from aerobic lagoon is based on IPCC guideline volume 4 as well. See from
Table 3.14, the CH4 emission is mainly produced from solid-composting and the
largest N2O emission potential is from aerobic treatment compared to low TN content
is very low in influent.
Table 3.14 GHG emission produced from biogas production process of ‘energy-
environmental’ biogas system. All the figures are based on functional unit. (ton)
Influent (ton) Effluent (mg/L) GHG emission (ton)
TN VS TN COD CH4 N2O CO2-equ
Soild-composting 1.12 22.7 --- --- 0.02 0.018 5.89
UASB leakage12
1.68 11.9 --- --- 0.06 0 1.27
Aerobic process 0.51 1.41 214.5 324.3 0 0.04 12.4
Total GHG emission from biogas production (ton) 0.08 0.058 19.56
Based on removal ratio of chemical content in influent to every phase during biogas
production, the concentration of TN and COD left in slurry are shown in Table 3.14.
According to national form of chemical content in effluent from livestock farm,
concentration of COD fulfils the national requirement <=400 mg/L COD.
GHG emission abatement from energy substitution of scenario 1
In the ‗energy-environmental‘ biogas system, [44] the biogas is produced when dairy
cow manure and wastewater are treated by anaerobic digester. The biogas is
transported by pipeline to resident‘s house nearby which substitutes of heat produced
by coal. Hence, the GHG emission abatement is calculated as the GHG emission
produced by coal combustion minus GHG emission produced by biogas combustion.
The coal combustion efficiency is 40% and biogas combustion efficiency is 60%.
However, due to process of biogas production, VS concentration is reduced by
seperation before entering AD, which is only 34.4% of total VS content in influent.
Hence, in the Table 3.18, the total biogas yield is only 34.4% of 11690 m3 biogas
production. 35186 kwh of coal equivalent to 23458 kwh of biogas is consumed.
Different from household biogas project, the anaerobic digester needs external heating
which is equal to 30% of total energy production for digester operation during winter,
which is also substituted by biogas. Hence, the total GHG emission abatement equals
to emission from coal combustion. The CO2-equ emission abatement from energy
substitution part in ‗energy-environmental‘ biogas system is 11.64 ton per day in the
dairy cow farm. (See Table 3.15)
12 The CH4 leakage from UASB is assumed as 3% of total CH4 produced from digester, based on IPCC guideline.

46
Table 3.15 GHG emission abatement produced from biogas substituting of coal
combustion, the figure is based on functional unit. (ton)
Energy
fuel
Energy
end-use1
(kwh)
Combustion
efficiency
(%)
Energy
input
(kwh)
GHG emission (ton)
CO2 CH4 N2O CO2-equ
Biogas 13644.7
60 22741.2 0 0 0 0
Coal 40 34111.8 11.6 0.0012 0 11.64
GHG emission abatement from energy perspective
(ton)
11.6 0.0012 0 11.64
*1. Energy input=Energy end-use /combustion efficiency; 1 m3 biogas=21 MJ=5.83 kwh;
3. GHG emission from scenario 2 in case study 2
GHG emission from biogas production process of scenario 2
Due to TN and COD removal rate of different phases during biogas production in
‗energy-ecological‘ system, the concentration of TN and COD reduced a lot in
effluent from slurry storage tank. (See Table 3.16) The slurry is applied on the
pastureland which is regarded as a substitution of synthetic ammonium.
Table 3.16 GHG emission produced from biogas production process of ‘energy-
ecological’ biogas system. All the figures are based on functional unit. (ton)
Influent (ton) Effluent (mg/L) GHG emission (ton)
TN VS TN COD CH4 N2O CO2-equ
USR 2.8 34.6 --- ---- 0.17 0 3.7
Composting 1.13 3.4 --- --- 0.003 0.018 5.6
Slurry storage tank 0.55 1.8 856.7 2498.1 0.1 0.004 3.4
Total GHG emission from biogas production (ton) 0.273 0.022 12.63
The GHG emission from biogas production process is divided into three phases, the
emission from USR anaerobic digester, solid-composting and slurry storage tank.
When feedstock entering into USR, all of feedstock weight is calculated. 3.7 ton of
CO2-equ emission is produced from anaerobic digestion based on IPCC guideline—
livestock manure management. The organic waste to be treated in solid-composting is
reduced by VS removal. 10% of total VS contained in mixture for composting with
55% moisture content. The total waste mass for composting is 2.32 ton. In slurry tank,
the GHG emission is calculated as slurry storage, the VS of influent is 1.8 ton and TN
content is 0.55 ton. From Table 3.16, the GHG emission from process per functional
unit is 12.63 ton, in which the methane emitted from slurry storage tank contributes

47
the most with least VS content in feedstock, and the largest N2O emission is from
solid-composting phase.
GHG emission abatement from energy substitution of scenario 2
Based on Table 3.17, biogas output from anaerobic digestion of feedstock is 11,339
m3/functional unit. Electricity generated from CHP is 23,676 kwh/functional unit with
electricity efficiency 36% and heat production is 29,596 kwh/functional unit with heat
efficiency 45%.
If the same amount of electricity is generated by coal, the emission produced is
regarded as the emission abatement from electricity produced by biogas. In additional,
the exhausted heat recovers the external heat demand, which can also be seen as the
GHG emission abatement in energy substitution part.
Table 3.17 GHG emission abatement produced from CHP by biogas substituting of
coal (ton)
Energy
fuel
Energy end-use (kwh) Energy
input(kwh)
GHG emission (ton)
Electricity Heat CO2 CH4 N2O CO2-equ
Biogas 23676 29596 65768 0 0 0 0
Coal 23676 72274 24.6 0.0026 0.0004 24.8
Coal2 29596 73989 25.2 0.0027 0.0004 25.4
GHG emission abatement from energy perspective (ton) 50.2
*1 kwh electricity consume 379g coal. Coal combustion efficiency is 40%. Coal2 means the coal
provided for external heating source of digester.
GHG emission abatement from industrial fertilizer substitution of scenario 2
N content in feedstock is 0.55 ton of functional unit. Based on N removal ratio of
different phases of biogas production process, the TN in slurry which applied on soil
to replace the synthetic ammonium is 0.33 ton with TN removal rate 82%. The GHG
emission abatement from slurry for fertilizer substitution is seen as the direct GHG
emission abatement in agricultural part. Because 60% of N in slurry is taken up by
plants as NH4+, synthetic ammonia can be replaced the same amount of 60% of total
N in slurry. The GHG emission produced from synthetic ammonia production and
utilization are shown in Table 3.18.
Table 3.18 GHG emission from synthetic ammonia production and utilization, the
total GHG emission from agricultural perspective is based on functional unit (ton)
Synthetic
ammonia
(NH4+)
input
TN-equ
in cow
manure
(ton)
NH4+/TN
in cow
manure
(%)
Synthetic
ammonia
substitution
(ton)
Coal for
ammonia
production
(ton)
GHG emission (ton)
CO2 CH4 N2O CO2-
equ
Production 0.55 60 0.33 0.73 2 0 0 2

48
Utilization 0.12 0 0.003 0.94
Total GHG emission from ammonia (ton) 2.12 0 0.003 2.93
When the same amount of synthetic ammonia applied on soil, the direct N2O and
indirect N2O are the main GHG emission from soil. The GHG emission is calculated
based on IPCC guideline. And the GHG emission from digestate applied on soil is
written in Table 3.19.
Table 3.19 GHG emission abatement from agricultural perspective of ‘energy-
ecological’ biogas system and this figure is based on functional unit. (ton)
Fertilizer
utilization
TN content
(ton)
Digestate input
(ton)
Emission (ton)
CO2 CH4 N2O CO2-equ
Ammonia 0.55 0.33 2.12 0 0.003 2.93
Digestate 0.55 0 0 0.005 1.63
Total GHG emission abatement from agricultural
perspective (ton)
2.12 -0.002 1.3

49
4. Results
This Chapter includes the results of GHG emission abatement from case study 1 and
case study 2 through comparison of two scenarios in each case study, and future
estimation based on GHG emission abatement of two case studies.
4.1 Results of GHG emission abatement and future
estimation of case study 1
4.1.1 Results of GHG emission abatement of case study 1
1. Results of GHG emission from scenario 1 in case study 1
CO2, CH4 and N2O emission from three parts of traditional household system are
concluded in the Table 4.1. Through comparison among the GHG emissions from
different parts, it is clear to see that the CO2 emission is mainly produced by
traditional energy fuel combustion which occupies the largest share of the total GHG
emission in the whole system. However, CH4 emission produced from traditional
manure management system is more than that from other parts, especially from slurry
and uncovered anaerobic lagoon as well as the N2O emission. Compared among these
three manure treatment, except composting, the GHG emission from other two occupy
for more than 50% of total emission from entire system. From agricultural
perspective, large reliance on industrial fertilizer will lead to CO2 emission from
fertilizer production phase and ammonia utilization will result in N2O emission and
NH4+
leaching from soil, which cause eutrophication to aquatic system.
Table 4.1 Comparison of GHG emission from three parts of traditional household
system (kg/functional unit)
GHG Saving of
coal and
firewood
Slurry Uncovered
lagoon
Compost Avoid from
fertilizer
production
Avoid from
fertiliser
utilization
CO2 578 120.7 7.3
CH4 0.124 43 52.23 0.66 0.013 0
N2O 0.017 0.58 0.32 0.84 0.002 0.16
CO2-equ 585.4 1082.2 1196 274.1 122 57
Total CO2-equ 1846.6 1960.4 1038.5
2. Results of GHG emission from scenario 2 in case study 1
See from Table 4.2, CO2-equ emission from anaerobic digestion occupies 65% of
total GHG emissions due to 10% of biogas is leaked from system with methane

50
content is 60%. The organic fertilizer applied on soil contributes the largest N2O
emission of entire system.
Table 4.2 Comparison of GHG emission from three parts of household biogas system
(kg/functional unit)
GHG emission Biogas
combustion
Anaerobic system Organic
fertilizer
CO2 0
CH4 0.003 6.11
N2O 0.0003 0.32
CO2-equ 0.15 128.3 67
Total CO2-equ 195.45
3. Results of GHG emission abatement between two scenarios in case study 1
From Table 4.1 and Table 4.2, the GHG emission abatement from household biogas
system is obvious drawn in conclusion (See Table 4.3). The result from the
comparison has shown the GHG emission abatement from biogas system when
substituting traditional household system. Based on different traditional system
adopted in rural areas, under MMS as slurry and uncovered anaerobic lagoon without
natural crust, the most important emission abatement is due to manure management
substitution followed with traditional energy fuel replacement. While, if composting
is the main manure treatment used, biogas substitution contributes the most to GHG
emission abatement in entire system. In digestate utilization perspective, the GHG
emission is reduced by substitution of ammonia applied on soil as well as ammonia
production.
Table 4.3 GHG emission abatement from household biogas system substitution
(kg/functional unit)
Energy
substitution
Manure management system substitution Fertilizer
substitution Slurry Uncovered lagoon Composting
CO2-equ
abatement
585.25 953.9 1067.7 145.8 112
Total CO2-equ emission 1651.2 1765 843.1

51
abatement
4.1.2 Future estimation of GHG emission abatement of case study 1
1. GHG emission abatement from changing share of energy fuel in RES
According to development of rural areas in western China, the main energy to be
substituted by biogas are coal and firewood. With economic development of rural
China, coal will gradually dominate the rural energy consumption. In Chapter 1, it has
mentioned that the growth of domestic coal consumption will increase 3-5% annually
during 2006-2010 and 1-2% during 2010-2020 every year. [27]The future estimation
done here is to calculate GHG emission abatement in 2005, 2010 and 2015 with coal
increased and firewood reduced at the max and min ratio perspective (See Table 4.4a
and Table 4.4b). The changes of GHG emission abatement of biogas substitution in
rural area is concluded in Table 4.5a
and Table 4.5b and future estimation of GHG
emission abatement from energy perspective of household biogas system is shown in
Table 4.6 a and Table 4.6
b with min and max coal increased in RES.
Table 4.4a Share of coal and firewood in rural RES with min coal increased (2005-
2015)
Energy fuel growth ratio 2005 2010 2015
Coal 32% 37% 39%
Firewood 24% 19% 17%
Table 4.5a Change of GHG emission abatement with coal consumption increased at
3% (2005 -2010) and 1% (2010-2015) annually. (kg/functional unit)
ERESGHG fuel 2005 2010 2015
Coal13
Firewood 57% 43% 66% 34% 70% 30%
CO2-equ abatement 234 351.5 271 278 287 245
Table 4.6a Future estimation of GHG emission abatement from energy perspective of
household biogas system with min coal increased in RES (kg/functional unit)
ERESGHG fuel Saving GHG emission Biogas GHG emission
13 Coal and firewood will be substituted by biogas totally, of which the share is calculated based on their shares in rural RES.

52
from coal and firewood combustion abatement
Ratio of energy 2005 2010 2015 2005 2010 2015
CO2-equ
emission
585.5 542 532.6 -0.15 585.4 541.7 532.5
Table 4.4b Share of coal and firewood in rural RES with max coal increased (2005-
2015)
Energy fuel growth ratio 2005 2010 2015
Coal 32% 41% 45%
Firewood 24% 15% 11%
Table 4.5b
Change of GHG emission abatement with coal consumption increased at
5% (2005-2010) and 2% (2010-2015) annually. (kg/functional unit)
ERESGHG fuel 2005 2010 2015
Coal Firewood 57% 43% 73% 27% 80% 20%
CO2-equ abatement 234 351.5 300 220.7 328.4 163.5
Table 4.6b Future estimation of GHG emission abatement from energy perspective of
household biogas system with max coal increased in RES (kg/functional unit)
ERESGHG fuel Saving GHG emission
from coal and firewood
Biogas
combustion
CO2-equ emission
abatement
Ratio of energy 2005 2010 2015 2005 2010 2015
CO2-equ
emission
585.5 520.4 491.9 -0.15 585.4 520.2 491.8
From result of comparison of GHG emission abatement from coal and firewood
consumption changed, it is clear to see that the more coal consumed, the less GHG
emission abatement results from biogas substitution in energy perspective. When
assessing total GHG emission abatement from entire household biogas system

53
(scenario 2), the emission abatement from MMS and agricultural perspective are
included, which are assumed to keep stable as scenario 1. The Figure 4.1 shows the
change of GHG emission abatement of entire household biogas system (scenario 2)
with min and max coal consumption increased in case study 1. Because in traditional
household system, the manure management system is considered as three types, the
GHG emission abatement from household biogas system substitution is also
represented by these three categories.
Figure 4.1 GHG emission abatement of household biogas system with min and max
coal consumption increased, 2005-2015
From Figure 4.1 above, it is obvious to see that if the coal consumption increased 3%
annually from 2005-2010 and 1% from 2010-2015 (min growth ratio), the GHG
emission abatement reduced at 2.5-3% (uncovered anaerobic lagoon), 2.6-3.2%
(slurry/liquid storage) and 5-6.2% (composting) at the end of 2010 and 2015
compared to that in 2005; And if the coal consumption increased with max ratio, the
GHG emission abatement decline at 3.7-5.3% (uncovered anaerobic lagoon),4-6%
(slurry/liquid storage) and 7.8-11% (composting) at the end of 2010 and 2015.
Compared with traditional household system, three MMS used in reference system
plays the most important role in emitting GHG emission. Hence, although GHG
emission abatement in energy perspective reduced, total emission abatement is not
effected obviously. Due to large emission produced from MMS, the total GHG
emission abatement can only be achieve if the slurry is implemented. The effect of
energy pattern change to GHG emission abatement in entire system is larger if
household adopted composting as their manure treatment than the others.
2. GHG emission abatement from changing share of digestate applied to soil
When the arable land area per household changed, total amount of N contained in
swine manure cannot be applied on land based on 15.3 kg N/mu from report of N
fertilizer consumption in 2007. The left digestate is assumed to be treated by
composting.GHG emission produced from composting is need to be considered. The
digestate is removed twice a year which aims to irrigate on soil. Hence, the N

54
contained in digestate for once irrigation is 16.65 kg/mu.yr which equals to
10kg/mu.yr (150 kg/ha.yr). Based on requirement of N fertilizer applied on soil in
Chapter 1, the most appropriate N fertilizer is 150-180 kg/ha.yr. Hence, the digestate
fulfil the requirement. The GHG emission abatement from agricultural perspective per
functional unit (one year) is shown in Table 4.7.
Table 4.7 GHG emission abatement from digestate application (kg/function unit)
Arable land area
mu/household
1 0.96 0.84
N content of swine manure
kg/functional unit
33.3 33.3 33.3
N content in digestate applied
kg/functional unit
33.3 32 28
Synthetic ammonium kg/functional
unit
19.98 19.2 16.8
CO2-equ abatement from ammonium
replacement
179 172 150
Left digestate for composting
Kg/functional unit
0 1.3 5.3
CO2-equ emission from composting 0 1.8 7.3
CO2-equ emission from digestate 67 64.3 56.3
Net CO2-equ abatement from soil 112 105.9 86.4
Reduction of GHG emission
abatement from agricultural
perspective (%)
5% 23%
If take the entire household biogas system (scenario 2) into consideration, the
reduction of GHG emission abatement is shown in Figure 4.2 as following.

55
Figure 4.2 Reduction of GHG emission abatement from entire household biogas
system with arable land area changed, 2010-2030
When arable area shrunk with 4% and 16% at the end of 2015 and 2030, net GHG
emission abatement from entire household biogas system will reduce 0.04%, 0.03%
and 0.08% at the end of 2015 and 0.02%, 0.016% and 0.03% at the end of 2030
compared to that in 2010, which are categorized as slurry/liquid storage, uncovered
anaerobic lagoon and composting used in reference system. Although the shrink of
arable land area will not lead to so much reduction to GHG emission abatement from
entire household biogas system substitution, it has large negative effect to agricultural
perspective of biogas system. See from Table 4.7, with arable land area reducing 5%
and 23%, more CO2-equ emission will be produced from composting of the rest
digestate which cannot be applied on soil.
3. Results of future estimation of case study 1
The conclusion drawn from future estimation above represents how GHG emission
abatement reduced with changes of future rural energy pattern and household arable
land area, which is based on results of GHG emission abatement of case study 1.
In energy substitution part, the GHG emission abatement is reduced more
obviously from energy perspective than in entire system when household biogas
system substitution with increasing of coal consumption in rural area in following
years;
In digestate utilization part, arable land area plays an important role in reducing
GHG emission abatement from agricultural perspective rather than from entire
household biogas system.
The GHG emission abatement in system substitution is mostly effected by
household AD replacing of traditional manure treatment.

56
4.2 Results of GHG emission abatement and future
estimation of case study 2
4.2.1 Results of GHG emission abatement from case study 2
1. Results of GHG emission abatement from scenario 1 in case study 2
In ‗energy-environmental‘ system, the GHG emission abatement is from energy
substitution part and GHG emission is produced from biogas production process. The
GHG emission abatement from this system is shown in Table 4.8. Although biogas
can replace of coal as heating resources used by residents, the GHG emission also
produced during biogas production process. The result shows the emission from
process is less than emission abatement from energy substitution which achieves the
emission abatement. The GHG emission reduced by ‗energy-environmental‘ system is
5.57 ton per day and 2033 tons per year. Hence, M&L livestock farm shouldn‘t only
take environmental impact of discharged water into consideration; reduce the external
heat for biogas production and GHG emission from biogas production process are
necessary to be concerned.
Table 4.8 GHG emission abatement from ‘energy-environmental’ biogas system (ton)
The figure is based on functional unit
CO2-equ emission
abatement from biogas
substitution
CO2-equ emission
abatement from biogas
production process
CO2-equ emission abatement
from ‗energy-environmental‘
biogas system
11.64 -19.56 -7.92
2. Results of GHG emission abatement of scenario 2 in case study 2
From Table 4.9, it is obvious to see that the GHG emission is reduced largely in
energy substitution part of system. The electricity produced by biogas through the gas
turbine is transport by electricity grid to residents and exhaust heat can be recovered
to heat the digester which can save fossil fuel for heating digester in winter. In biogas
production process, amount of GHG emission is from composting, particularly the
N2O emission. As for digestate utilization on soil, it can reduce the synthetic
ammonium consumption and avoid responding amount of fossil fuel for fertilizer
production.
Table 4.9 GHG emission abatement from ‘energy-ecological’ biogas system (ton) The
figures are based on functional unit.
CO2-equ emission
abatement from
biogas substitution
CO2-equ emission
abatement from
biogas production
process
CO2-equ emission
abatement from
digestate
substitution
CO2-equ emission
from ‗energy-
ecological‘ biogas
system
50.2 -12.63 1.3 38.87

57
3. Results of GHG emission abatement between two scenarios in case study 2
In ‗energy-environmental‘ biogas system, the GHG emission abatement from energy
substitution is only 11.64 ton based on functional unit. The inefficiency of biogas
production and low heat value of biogas is the main reason to less GHG emission
abatement from energy perspective. What‘s more, because the main focus of ‘energy-
environmental‘ system is on its treatment of discharged water, which names the
chemical content of effluent from system must fulfil the national environmental
standard, the VS content of feedstock to AD is reduced mostly in solid-liquid
separation phase. And this leads to less biogas production from anaerobic digestion
process. However, the GHG emissions are produced from biogas production process
due to methane leakage (10% of total biogas production) from AD and aerobic
process (SBR). Hence, GHG emission produced from AD process is more than
emission abatement from energy substitution perspective in ‗energy-environmental‘
biogas system.
Compared to ‗energy-environmental‘ biogas system, ‗energy-ecological‘ biogas
system leads to less GHG emission from biogas production process but more COD
and TN content in effluent. Larger arable land is needed if all digestate from ‗energy-
ecological‘ biogas system is applied. GHG emission abatement from this system is
achieved by biogas utilization. CHP is implemented for electricity generation from
biogas. Compared to heat efficiency of coal, electricity production efficiency from
coal combustion is less, which leads to larger GHG emission abatement when biogas
replaces of coal for electricity production rather than only heat purpose..
As for fertilizer substitution part of both systems, only direct GHG emission
abatement is taken into consideration. The solid after composting will sell in the
market and use as organic fertilizer. However, this part is not concerned when
assessing the GHG emission abatement from biogas system. The main purpose of
‘energy-ecological‘ biogas system is to make use of nutrients contained in digestate
on soil. The emission abatement from synthetic ammonia replacement is a little bit
less than that from digestate applied on soil, but that from coal used for fertilizer
production is 1.99 ton. In a word, in ‗manure-digestate‘ part, the environmental
benefits is 0 in ‗energy-environmental‘ system, but 31.3 ton GHG emission abatement
in ‗energy-ecological‘ system per day.
4.2.2 Future estimation of GHG emission abatement in case study 2
1. GHG emission abatement from changing share of energy fuel in urban RES
Natural gas will increase 11-13% every year during the next 15 years [27], which is
introduced in Chapter 1. Natural gas in future estimation here is only assumed to
replace of coal for heating purpose and to provide heat for residents. With natural gas
growing, the coal will reduce the same ratio at the same time. The electricity
generation and digester heat are still from coal-power plants. Hence, only ‗energy-
environmental‘ biogas system (scenario 1) is effected, the ‗energy-ecological‘ biogas
system (scenario 2) keeps the same GHG emission abatement in future estimation.
The change of energy fuels shares in RES are shown in Table 4.10a and Table 4.10
b
with min and max of NG increased, with which the change of GHG emission
abatement is shown in Table 4.11a and Table 4.11
b. The total GHG emission

58
abatement from energy perspective of ‗energy-environmental‘ biogas system is
demonstrated in Table 4.12a and Table 4.12
b.
Table 4.10a
Share of coal and NG in urban RES with min NG increased (2005-2015)
Energy fuel growth ratio 2010 2015 2020
Coal 100% 83.3% 71.9%
Natrual gas 0 16.7% 28.1%
Table 4.11a Change of GHG emission abatement with NG consumption increased at
11% (2010-2020) annually. (ton/functional unit)
ERESGHG fuel 2010 2015 2020
Coal NG 100% 0 83.3% 16.7% 71.9% 28.1%
CO2-equ abatement 11.64 0 9.7 1.2 8.4 2.02
Table 4.12a Future estimation of GHG emission abatement from energy perspective of
‘energy-environmental’ biogas system with min NG increased (ton/functional unit)
ERESGHG fuel Saving GHG emission
from traditional energy
fuel
Biogas
combustion
CO2-equ emission
abatement from energy
perspective
Year 2010 2015 2020 2005 2010 2015
CO2-equ
emission
11.64 10.9 10.39 0 11.64 10.9 10.39
Table 4.10b
Share of coal and NG in urban RES with max NG increased (2005-2015)
Energy fuel growth ratio 2010 2015 2020
Coal 100% 78.8% 61%
Natrual gas 0 21.2% 39%

59
Table 4.11b Change of GHG emission abatement with NG consumption increased at
13% (2010-2020) annually. (ton/functional unit)
ERESGHG fuel 2010 2015 2020
Coal NG 100% 0 78.8% 21.2% 61% 39%
CO2-equ abatement 11.64 0 9.17 1.52 7.1 2.9
Table 4.12b Future estimation of GHG emission abatement from energy perspective of
‘energy-environmental’ biogas system with max NG increased (ton/functional unit)
ERESGHG fuel Saving GHG emission
from traditional energy
fuel
Biogas
combustion
CO2-equ emission
abatement from energy
perspective
Year 2010 2015 2020 2005 2010 2015
CO2-equ
emission
11.64 10.69 10 0 11.64 10.69 10
See from Table 4.12a
and Table 4.12b, the GHG emission abatement from biogas
substitution will decline with increase of natural gas utilization. In Table 4.12a, when
NG consumption increases 11% annually, the total GHG emission from coal and NG
reduces 1.4% every year and GHG emission abatement will shrink with 2.3% per
year. In Table 4.12b, less GHG emission is produced along with NG consumption
rising. When NG consumption increased as 13% annually, the GHG emission
abatement will reduce as 3% every year, which means less GHG emission will be
replaced by biogas.
When concerning the GHG emission abatement from ‗energy-environmental‘ biogas
system (scenario 1), the GHG emission from biogas production process needs to be
included. Figure 4.3 demonstrates the reduction of GHG emission abatement from
energy perspective and growth of GHG emission from ‗energy-environmental‘ biogas
system (scenario 1). It is clear to see that with min NG increased, the GHG emission
from entire system will increase at 9% and 16% at the end of 2010 and 2015; And
with max growth of NG consumption, GHG emission will grow 11% and 21% at end
of 2010 and 2015 respectively. This result demonstrates that biogas used for heating
purpose cannot reduce GHG emission obviously when natural gas is provided in
suburb of livestock farm. The GHG emission will increase dramatically from ‗energy-
environmental‘ (scenario 1) biogas system if natural gas utilization still increases.

60
Figure 4.3 GHG emission abatement from energy perspective and GHG emission
from ‘energy-environmental’ biogas system with min and max growth of NG
consumption, 2005-2015
2. GHG emission abatement from changing share of digestate applied to soil
Due to digestate applied on soil is from ‗energy-ecological‘ biogas system (scenario
2), the sensitivity analysis to GHG emission abatement from agricultural perspective
is only done for this system. The aim is to point out how large area provided is right
for digestate utilization. The COD and TN content contained in effluent from biogas
system is written in Table 4.13. The slurry flow out of slurry storage tank will be
applied to agricultural. The Table 4.14 shows how large agricultural land area is
required to sustain these amount of chemicals.
Table 4.13 TN and COD content in slurry applied to soil. (kg/day)
Chemicals Concentration in digestate
TN 550
COD 1800
Table 4.14. Required arable land area for sustaining chemicals in digestate (hectare)
Arable land Rice Wheat and maize Vegetable
COD (kg/ha.yr) <=2400 <=1350 <=1125
COD in digestate (kg/yr) 657000 657000 657000
Areas for COD (ha) >=273.75 >=486.7 >=584
N-fertilizer demand 150-180 150-180 150-180
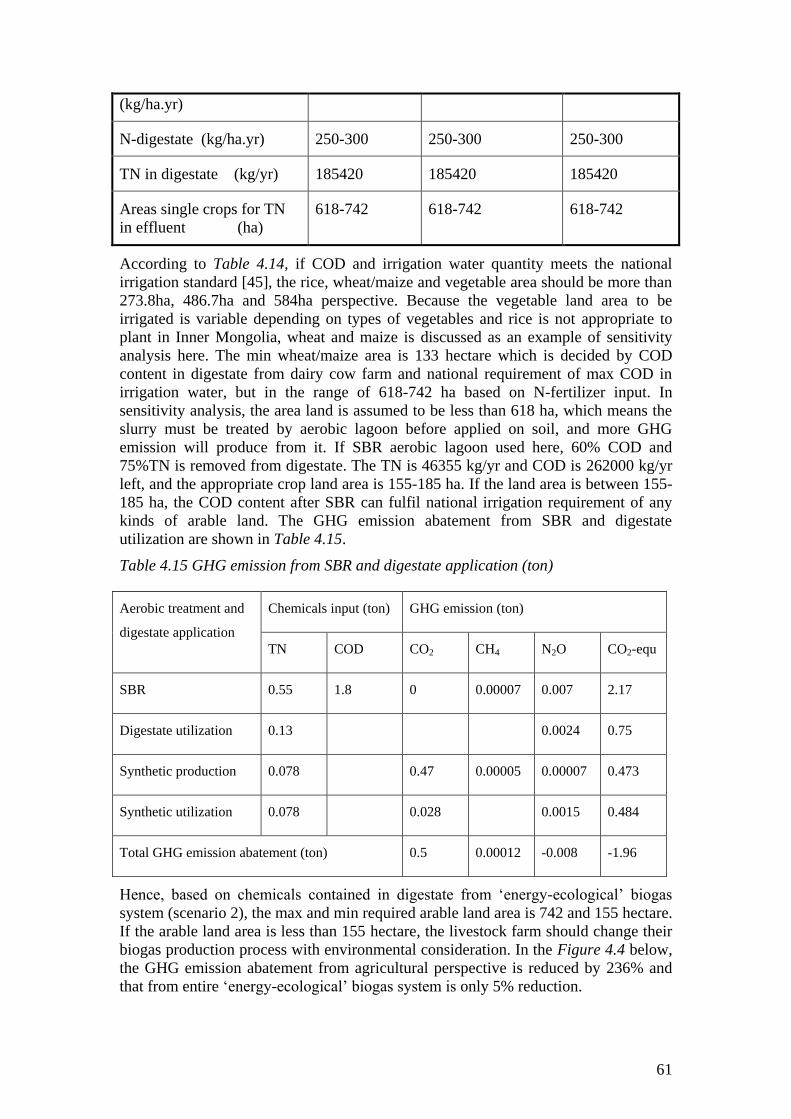
61
(kg/ha.yr)
N-digestate (kg/ha.yr) 250-300 250-300 250-300
TN in digestate (kg/yr) 185420 185420 185420
Areas single crops for TN
in effluent (ha)
618-742 618-742 618-742
According to Table 4.14, if COD and irrigation water quantity meets the national
irrigation standard [45], the rice, wheat/maize and vegetable area should be more than
273.8ha, 486.7ha and 584ha perspective. Because the vegetable land area to be
irrigated is variable depending on types of vegetables and rice is not appropriate to
plant in Inner Mongolia, wheat and maize is discussed as an example of sensitivity
analysis here. The min wheat/maize area is 133 hectare which is decided by COD
content in digestate from dairy cow farm and national requirement of max COD in
irrigation water, but in the range of 618-742 ha based on N-fertilizer input. In
sensitivity analysis, the area land is assumed to be less than 618 ha, which means the
slurry must be treated by aerobic lagoon before applied on soil, and more GHG
emission will produce from it. If SBR aerobic lagoon used here, 60% COD and
75%TN is removed from digestate. The TN is 46355 kg/yr and COD is 262000 kg/yr
left, and the appropriate crop land area is 155-185 ha. If the land area is between 155-
185 ha, the COD content after SBR can fulfil national irrigation requirement of any
kinds of arable land. The GHG emission abatement from SBR and digestate
utilization are shown in Table 4.15.
Table 4.15 GHG emission from SBR and digestate application (ton)
Aerobic treatment and
digestate application
Chemicals input (ton) GHG emission (ton)
TN COD CO2 CH4 N2O CO2-equ
SBR 0.55 1.8 0 0.00007 0.007 2.17
Digestate utilization 0.13 0.0024 0.75
Synthetic production 0.078 0.47 0.00005 0.00007 0.473
Synthetic utilization 0.078 0.028 0.0015 0.484
Total GHG emission abatement (ton) 0.5 0.00012 -0.008 -1.96
Hence, based on chemicals contained in digestate from ‗energy-ecological‘ biogas
system (scenario 2), the max and min required arable land area is 742 and 155 hectare.
If the arable land area is less than 155 hectare, the livestock farm should change their
biogas production process with environmental consideration. In the Figure 4.4 below,
the GHG emission abatement from agricultural perspective is reduced by 236% and
that from entire ‗energy-ecological‘ biogas system is only 5% reduction.

62
Figure 4.4 GHG emission abatement from agricultural perspective and ‘energy-
ecological’ biogas system with min and max required arable land area
3. Results of future estimation of case study 2
From energy perspective, with increasing of natural gas consumption in rural
energy system, the GHG emission abatement will reduce due to higher heat value
of natural gas and lower carbon content compared to coal. However, there is no
any effect to electricity generation; because in China, coal is still the main energy
fuel for power plant.
In ‗manure-digestate‘ part of system, whether digestate is appropriate to apply on
soil should follow the national irrigation requirement, which set different standard
to various kinds of plants. In the case study, wheat and maize are two major
plants grown in Inner Mongolia, and the future estimation is concentrated on
them. In order to fulfil the requirements of N-fertilizer input and COD
concentration of effluent, the wheat and maize land area should be more than 618
ha. If crop land area is less than this data, the effluent must be treated by SBR.
The GHG emission abatement from digestate application after treated by aerobic
digester is -1.96 ton, in which the emission from SBR contributes the most.
Hence, if there is no enough land area to sustain the N and COD content of
digestate, the best way is to reduce its COD and N content by adding water.

63
5. Conclusion and discussion
5.1 Conclusion
Through GHG emission abatement calculation and future estimation from ‗manure-
biogas-digestate‘ system, household biogas system and M&L livestock farm-based
biogas system are analyzed. There are two main differences existing in these two
types of biogas systems. Firstly, in household biogas system, energy substitution is
the motivation to develop the biogas projects, while in M&L livestock farm, the
environmental concern is put in the first place. Secondly, biogas produced from
household biogas system in rural China is based upon simplified household anaerobic
digester with low efficiency and unstable when producing biogas; The M&L livestock
farm always choose the most appropriate anaerobic digester based on VS content of
feedstock in order to fulfil national requirement of discharged wastewater.
In household biogas system, the GHG emission abatement from biogas substitution of
coal and firewood is obviously, however, the largest emission abatement results from
AD substitution of traditional manure treatment. If the MMS in reference system is
composting, the emission abatement from AD substitution is less than energy fuel
replacement. While, if the traditional manure management system is slurry or
uncovered anaerobic lagoon without natural crust, GHG emission abatement from
household biogas system is quite large. During future estimation in household biogas
system, the GHG emission abatement is reduced with small ratio when coal
consumption increased. Hence, in rural areas, household biogas system definitely has
great environmental potential because of positive environmental effect from MMS
perspective.
‗Energy-environmental‘ biogas system and ‗Energy-ecological‘ biogas system are two
the most common large-scale biogas project models used in M&L livestock farm. The
foremost difference between these two is due to natural environment nearby. In
‗energy-environmental‘ biogas system, in order to reduce nearly 90% of N and COD
content in discharged water, the GHG emission is mainly produced from biogas
production process which cannot achieve emission abatement goal from
systematically perspective. While ‗energy-ecological‘ biogas system has notable GHG
emission abatement from both energy and agricultural perspective. However, if crop
land area doesn‘t have enough capacity to absorb all N and COD in slurry applied on
soil, the aerobic treatment must be implemented before irrigation.
In a word, in order to achieve more GHG emission abatement from household and
livestock farm-based biogas system in the future development, maximizing biogas
yield and replacing synthetic ammonia fertilizers are both necessary measures to
include in the whole ‗manure-biogas-digestate‘ system.
5.2 Discussion
Through investigation of farmers who used household biogas digester in rural areas
and business delegations involving in M&L livestock farm-based biogas project, the
reflections to future biogas system development from them are not very optimistic.
The opportunities and challenges of ‗manure-biogas-digestate‘ system are concluded
as followings:

64
5.2.1 Opportunities of future development
1. Environmental benefits
Most of farmers living in rural areas of China are active to implement the household
biogas project due to its environmental benefits. In traditional household system, the
smoke produced from firewood and straw combustion leads to severely indoor
environmental problems. And odour from livestock manure in the open air effects the
living atmosphere as well as large amount of manure compiled along road result in
water and soil pollution. Meanwhile, large amount of synthetic ammonia fertilizers
and pesticides are used for increasing crop and fruits yield per hectare without
serious considering of food security and long-term soil productivity. Hence,
household biogas project can provide clean and high heat value energy fuel (biogas)
and produce organic fertilizer to farmers through anaerobic digestion of livestock
manure, and reduce pollution caused by nitrogen volatilisation from manure spread
in the open air.
2. Economic benefits
‗Manure-biogas-digestate‘ system is regarded as a reasonable and profitable way to
realize circular economy. To farmers in rural areas, manure as raw materials
producing biogas is free to get and products (biogas and digestate) from anaerobic
digestion can help them saving cost to buy energy fuels and industrial fertilizer. Most
M&L livestock farm owners mainly concern to national subsidy and policy to green
energy production. Especially, China intends to impose ‗carbon tax‘ around 2012
[46], which is based on consumption quantity of fossil fuels in industry. The Chinese
development and reform committee announce that the carbon tax will be set at 10
Yuan per ton CO2 in 2012 and it will be raise up to 40 Yuan per ton CO2 in 2020.
Therefore, to implement of biogas project can bring profits to livestock farm and even
build up their reputation. What‘s more, large scale biogas project integrating with
CDM has gained growth attraction. With imposing CDM into Chinese market [47], if
GHG emission abatement from livestock farm-based biogas project is verified and
CO2-equivalent emission can be traded in international market, and this can enhance
business internal profit and prolong their production chain.
5.2.2 Challenges of future development
1. Limitation of future development of rural household biogas system
In China, a large proportion of household biogas project cannot run successfully due
to deficient professional training and education about anaerobic digester operation and
maintenance to farmers. During interview, most farmers reflected that the digester is
hard to restart in the spring after 3 months stop during winter. Moreover, through
investigation of rural household biogas digester, it is common to see that most of
digesters are used as a big rubbish lagoon, which is filled with any kinds of waste and
the sludge at the bottom of digester is not removed periodically. All of these reasons
can definitely result in unstable and low quality biogas production. What‘s more,
facing with low cost and convenient usage of coal and firewood, household biogas
system not only has higher investment but also take time to build biogas digester.
2. Limitation of future development of livestock farm-based biogas system

65
The utmost important problem towards M&L livestock farm-based biogas project is
how this big farm maximize their profits. The major benefit of livestock farms are
from their livestock products trade. However, with renewable energy policy, industrial
fertilizer consumption regulation and form of livestock manure management treatment
launched, most livestock farms have been forced to adopt biogas project. Although
there are subsidy to renewable energy offered by government, most of farm owners
reflected this can only reduce the initial investment but higher maintenance cost
cannot be covered, which enhance their economy load compared to traditional
livestock business pattern. What‘s more, the solid concentration of influent to
anaerobic digester on Chinese livestock farm is lower than that in Europe, which will
produce less biogas but consume more energy to heat digester [48]. Moreover, to
some livestock farms which are located far away from arable land, large amount of
sludge will be treated by aerobic lagoon before discharged with increasing biogas
demand. This also level up the investment and environmental risk. As for CDM, the
ACM0010 is the basic methodology used for livestock sector [49]. However, with
system boundary of livestock farm expanded to energy and agricultural system, GHG
emission mitigation should be considered in a more complex system, which requires
the new methodology for verifying GHG emission abatement integrating with real
situation of Chinese livestock sector.
5.2.3 Suggestion to future development
The model of ‗manure-biogas-digestate‘ system in this thesis plays an important role
as a mathematic tool to assess GHG emission abatement from Chinese livestock
sector connecting with energy and agricultural system. Under future estimation to
energy consumption pattern changed, electricity generated from biogas has better
environmental performance, which can integrate existing CDM methodology
ACM0006 (Methodology of on-grid electricity produced from biomass residues) [50]
and ACM0012 (GHG emission abatement from recovery of exhausted heat produced
from electricity generation) [51] into ACM0010 (GHG emission abatement from
livestock manure management system). Additionally, this thesis have also taken
organic fertilizer applied on agricultural land into consideration, which leads GHG
emission mitigation from soil management as well as avoided coal combustion for
industrial fertilizer production. However, there is no existing methodology in CDM
used in this aspect. Hence, the further research will try to develop new methodology
in agricultural aspect focusing on soil management and integrate it into existing CDM
methodology for energy and manure treatment aspects of entire ‗manure-biogas-
digestate‘ system.
What‘s more, with consideration of farmers‘ reflections, single household biogas
system is suggested to be evolved to a district biogas system formed by central biogas
plant and several animal breed household nearby. This can solve technical problems
during anaerobic digester running, improve biogas yield by professional operation and
allocate digestate to each household due to their crop land area. However, whether
this type of biogas system can achieve more GHG emission abatement needs to be
assessed based on ‗manure-biogas-digestate‘ model. As for M&L livestock farm-
based biogas system, the GHG emission abatement is obvious in ‗energy-ecological‘
system. However, if arable land areas around livestock farm are in small size, the
aerobic treatment should be implemented before digestate utilization. If the livestock

66
farm is far from arable land, CHP is suggested to be implemented in ‗energy-
environmental‘ biogas system which can help reducing GHG emission from biogas
production process. The integration of ‗energy-environmental‘ biogas system and
‗energy-ecological‘ biogas system is needed with consideration of local
environmental requirement.
Moreover, to integrate economic model into scientific and technical analysis of
‗manure-biogas-digestate‘ system can make a more complete analysis to biogas
system. In additional, economic profits is more convincing than environmental
benefits to encourage people to implement biogas system in livestock sector. And
economic model can also be regarded as a tool to assess whether ‗manure-biogas-
digestate‘ system can achieve ‗win-win‘ strategy in economy and environment.

67
Reference
[1] P.H, H.van. Exploring changes in the spatial distribution of livestock in China,
Agricultural systems 62 (1999) 51-67.
[2]. FAOSTAT
[3] Wang W H, Chinese livestock manure production estimate and environmental
impact, China environmental science, 2006;
[4] STANK 2004, software program for calculating nutrient flows in agriculture.
Swedish board of agriculture, Jönköping
[5] Zhao J L, Guide of environmental science, China machine press, 2005
[6] Technical Specifications for pollution treatment projects of livestock and poultry
farms, HJ 497-2009, 2009
[7] http://www.zorg-biogas.com/library/biogas-production-process
[8] Ivet Ferreri Marti, Study of the effect of process parameters on the thermophilic
anaerobic digestion of sewage sludge, evaluation of thermal sludge pre-treatment and
overall energetic assessment, PHD thesis of Escola University, Barcelona, 2008
[9] Dieter Deublein,Biogas from waste and renewable resources—an introduction,
2008
[10] Klein E Lleleji, Basics of energy production through anaerobic digestion of
livestock manure, Purdue University, ID-406-W
[11] Maria Berglund, Biogas production from a systems analytical perspective, LTH
lund university, 2006
[12] Zhang FS, Wang JQ, Present situation and future improvement of apparent
recovery efficiency of applied fertilizer for Chinese major crop, Vol 45, No,5, 2008-9
[13] Chinese Ministry of Agriculture, Chinese rural biogas project construction plan
(2006-2010), 2007-3
[14] J. Paul Henderson, P.Eng, Anaerobic digestion in rural China, Canada's Office of
Urban Agriculture,2009. http://www.cityfarmer.org/biogasPaul.html
[15] Liu Yu, Rural biogas project development and GHG emission abatement, China
population, resources and environment, Vol.18, No.3 2008 .
http://www.docin.com/p-37856633.html
[16] Li Kangmin, Biogas China, ISIS report, 2006.
http://www.i-sis.org.uk/BiogasChina.php
[17] Mir-Akbar Hessami, Anaerobic digestion of household organic waste to produce
biogas, Renewable energy Volume 9, Issues 1-4, Australia, 1999.
[18] Kestutis Navickas, Biogas for farmin, energy conversion and environment
protection, Lithuanian University of Agriculture, Rakican, 2007
[19] Montemurro F, Anaerobic digestate and on-farm compost application, Compost
science and utilization, 2010

68
[20] Peter Verburg and Youqi Chen, Multi-scale characterization of land-use patterns
in China, Ecosystems (in press)
[21] IPCC guidelines for national greenhouse gas inventories from livestock manure
management system,Vol 4,2006
[22] Yang XY, Li QH, Research on nutrients balance of agricultural ecosystem in
Shaanxi province, Northwest agricultural and technology university press, Vol 29,
2001-4
[23] Zhang FS, Wang JQ, Present situation and future improvement of apparent
recovery efficiency of applied fertilizer for Chinese major crop, Vol 45, No,5, 2008-9
[24] Chang Y X, Effects of irrigation and nitrogen on the performance of aerobic rive
in northern China, Journal of intergrative plant biology Volume 50 Issue 12, 2008
[25] Feng Jianfei, Improvement of efficiency of fertilizer consumption, Modern
agricultural technology, 2010.
[26] Zhang Qiang, Re-estimation of direct nitrous oxide emission from agricultural
soils of China via revised IPCC2006 guideline method, China agricultural university,
Beijing
[27] OECD/IEA, Cleaner coal in China, International energy agency, France, 2009
[28] Shi Q and Zhao J, Development report of Chinese industries, Beijing, China
Zhigong publishing house,1999
[29] Paul C and Yan W, Energy consumption in China: past trends and future
directions, forthcoming in energy economics, Australia
[30] L. Junfeng et al. assessment of sustainable energy potential of non-plantation
biomass resources in China, Biomass and Bioenergy 29 (2005) 167-177
[31] Yutaka Tonooka, Hailin Mu, Energy consumption in residential house and
emission inventory of GHGs, air pollutants in China, Saitama University, Japan
[32] Shobhakar Dhakal, Urban energy use and carbon emissions from cities in China
and policy implications, Global carbon project, national institute for environmental
studies, Japan
[33] IPCC guideline-Biological waste water treatment, Volume 5_Ch 4, 2006
[34] Wenju Jiang, Design and implement of SBR technology for wastewater from
livestock farm, Urban sewage technology, Chemical industry publisher, 2007
[35] The norm of energy consumption per unit product of synthetic ammonia, GB
21344-2008, 2008
[36] Cleaner Production Standard–Nitrogenous Fertilizer Industry,Chinese Ministry
of environmental protection, HJ/T 188-2006, 2006
[37] Al Seadi T, An intergrated approach for biogas production with agricultural
waste, Report on quality criteria for application of AD sludge as bio-fertilizer in
agriculture, Demark, 2006
[38] IPCC guideline—N2O emissions from managed soils and CO2 emission from
lime and urea application, V4_11_Ch 11, 2006
[39] Nitrogen flow and use efficiency in production and utilization of wheat, rice and
maize in China, 2004

69
[40] Shefali V, Anaerobic digestion of biodegradable organics in municipal solid
waste, Department of Earth and Environmental Engineering in Columbia University,
2002
[41] Introduction of Sichuan province:
http://www.izy.cn/travel_guide/4cf/13_0_0_2_0_0.html
[42] An introduction of Inner Mongolia Autonomous Region
http://www.china-guide.de/english/a_profile_of_china/inner_mongolia/
[43] Chinese Ministry of environmental protection, Discharge standard of pollutants
for livestock and poultry breeding, GB 18596-2001, 2001
[44] Kun Wang, Huiying Liu, Assessment of GHG emission reductions of ecological
energy type and environmental protection energy type waste treatment system in
large-scale pig farms, Renewable energy—Vol 27, 2009
[45] Chinese Agricultural Ministry, Standard of irrigation water quality, GB 5084-
2005, 2005
[46] Young T, China to impose carbon tax from 2012, BusinessGreen, 12 May 2012
http://www.businessgreen.com.
[47] Chinese renewable energy industries association, CDM Country Guide for China,
Institute for Global Environmental Strategies 1st edition, 2005
[48] Wu L J, Effect of different solid concentration on biogas yield and composition
during anaerobic fermentation process, Int. J. Glob. Energy Issues 31(3-4), 240-250,
2009.
[49] UNFCCC/CCNUCC, Approved consolidated baseline methodology ACM0010-
‗Consolidated baseline methodology for GHG emission reductions from manure
management system‘, ACM0010/ Version 05 Sectoral scopes: 13 and 15, EB42
[50] UNFCCC/CCNUCC, Approved consolidated baseline and monitoring
methodology ACM0006-‗Consolidated methodology for electricity generation from
biomass residues in power and heat plants‘, ACM0006/Version 10.1 Sectoral scope:
01, EB55
[51] UNFCCC/CCNUCC, Approved consolidated baseline and monitoring
methodology ACM0012-‗Consolidated methodology for GHG emission reduction
from waste energy recovery projects‘, ACM0012/Version 03.1 Sectoral scope: 01 and
04, EB44
[52] IPCC guideline-Energy, Vol2_1_Ch 1 introduction, 2006
[53] A. Mirsepasi, Performance evaluation of full scale UASB reactor in treating
stillage wastewater, Department of Environmental Health Engineering in University
of Tehran, Iran, 2006
[54] Fabien M, An introduction to anaerobic digestion of organic wastes, Final report
in Emade Scotland, 2003
[55] Zheng Y Y, Application of process of USR & IOD in treatment of pig farm
wastewater, Environmental engineering, 2006

70
Appendix
Appendix 1. Reasons and expectation of biogas project development in three parts of
China [13]
Region Reasons to develop biogas
project
Expect result from biogas
project development
Western
China
Southwest
Guangxi
Chongqing
Sichuan
Guizhou Yunnan
Tibet
Ecological surrounding is extremely
fragile, especially the nutrients
runoff in soil;
Weather in this region is warm and
wet, fruit and crop production is
high but sanitation situation is poor;
Pesticide and fertilizer overused to
protect crops from pest leads to
negative environmental impact;
Inefficient energy supplied these
areas where is large reliance on
firewood, straw and coal;
Reduce further water and soil
pollution from overuse fertilizer and
pesticide;
Improve the living condition and
sanitation;
Less reliance on fossil fuels;
Economic benefit from biogas
production of livestock manure in
household.
Northwest
Inner Mongolia
Shaanxi
Gansu
Qinghai
Xinjiang
Water is rare resource in these
provinces and dispersed livestock
husbandry is common used;
With increase of amount of
livestock, over-grazing and
desertification become quite
serious.
Control the number of livestock and
regulate grazing pattern to avoid
continuous desertification;
Make use of livestock manure to
produce biogas and provide energy;
Biogas can instead of firewood to
provide heat in the long cold winter
not only for people but also warm
greenhouse for vegetable growth.
Others This region consists of minority in middle
and east areas. Those areas are not
geographic close but similar in economic
situation. All of areas contained are under-
developed.
Economic benefit and make use of manure
resources rather than over consumption of
firewood and rice straw.
Mid &
Northeast
China
Southeast
hill region
Hubei
Hunan
Hainan
Jiangxi
Weather in this region is typical
subtropics climate;
Sufficient livestock resources of
biogas production;
Improve the sanitation of living
environment;
Reduction of fossil fuel consumption;
Yellow-
Huai sea
plain
Henan
Hebei
Anhui
Shanxi
Biggest areas of agricultural and
livestock production.
Environmental pollution results
from large number of livestock
breeding and overuse of fertilizer.
Develop intensive livestock
husbandry will control the waste
water and manure efficiently;
Improve the agricultural products‘
quality with digestate use;
Biogas combining with greenhouse
can solve the heat problem in Winter.
Northeast
Liaoning
Jilin
These areas are abundant with
maize and soybean which offer
sufficient fodder resource for pig
breed;
Large biogas production resources
and strongly reliance on fossil fuel
Greenhouse with biogas can ensure
the vegetable and fruit‘s sound
growth condition in long cold winter;
Saving fuels and reasonable disposal
of livestock manure;

71
Hei Longjiang for heating provide in winter
Eastern
China
Beijing
Shanghai
Tianjin
Jiangsu
Zhejiang
Fujian
Shandong
Guangdong
All the under-developed areas in east
coast of China are included in this region.
These places are inconvenience of
regional transport which leads to fuels
limited.
The condition for livestock production is
appropriate here and great potential to
develop biogas projects.

72
Appendix 2. Two common types of ‗manure-biogas-agricultural‘ system
Electrici
ty
Lig
hti
ng
Heatin
g
Liq
uid
dig
estate S
olid
residue
Raw
bio
gas
Dig
estat
e
Ho
useh
old
waste
Liv
estock
man
ure
Cro
p resid
ue
Liv
estock
farm w
aste
Ho
useh
old
bio
gas
pro
ductio
n
Farm
-based
bio
gas
pro
ductio
n
Ar
able
land
Mark
et P
erman
ent
crop
land
Natu
ral gas
grid
Co
mp
o
st
CH
P
Up
grad
i
ng
Heat
Electricity
grid
B
iog
as pip
e
Co
ok
i
ng
Maize
Wh
eat R
ice
Co
mbu
stio
n
Inp
ut/o
utp
ut
Energ
y
con
versio
n/
man
ure
disp
osal
Acto
r F
utu
re bio
gas u
tilization
pro
du
ced fro
m farm
-based
system
Resid
ential en
ergy
con
sum
ptio
n u
sed in
rural
Energ
y distrib
utio
n
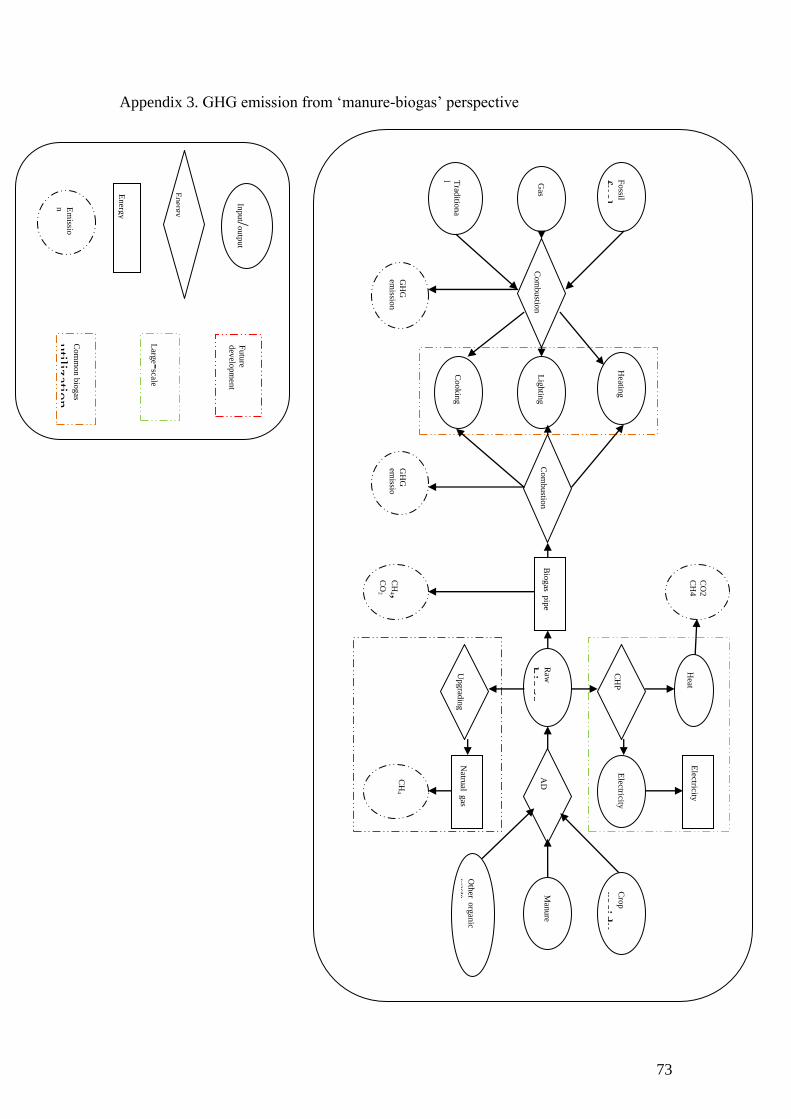
73
Appendix 3. GHG emission from ‗manure-biogas‘ perspective
Fossil
fuel
Gas
Trad
ition
a
l bio
m
ass
Heatin
g
Lig
htin
g
Cookin
g
Raw
bio
ga
s
Oth
er org
anic
waste C
rop
residu
e Man
ure
Com
bustio
n C
om
bustio
n
Bio
gas
pip
e A
D
Up
grad
ing
CH
P
Natru
al gas
grid
Electricity
grid
GH
G em
ission
GH
G em
issio
n
CH
4 , C
O2
CH
4
Heat
Electricity
CO
2 C
H4
Inp
ut/
outp
ut
En
ergy
conversio
n En
ergy
distrib
utio
n
Em
issio
n
Futu
re dev
elopm
ent
Com
mon b
iogas
utilizatio
n
Larg
e-scale
bio
gas
utilizatio
n

74
Appendix 4. GHG emission form ‗manure-digestate‘ perspective
Liv
estock
mam
u
re
Po
ultry
man
ure
So
w
man
ure
Fatten
ing
pig
man
ur
e
Wh
eat
So
lid resid
ue
Liq
uid
dig
estate
Treated
man
ure
Dairy
cow
man
ure
Oth
er cattle
man
ure
Rice
Maize
Solid
storag
e
Liq
uid
/
slurry
Dry
lot
Com
post
AD
Arab
le lan
d
CH
4 ,
N2 O
Perm
anen
t
crops
land
Ag
ricultu
ral land
Pasto
ral land
Ind
ustrial
fertilizer
CH
4 ,
N2 O
N2 O
N
2 O
Inp
ut/o
utp
ut
MM
S
Actor
Em
ission
Man
ure stab
le
Man
ure sto
rage
Man
ure m
anag
emen
t system
Ag
ricultu
ral
system

75
N2O-direct emission
N2O-indirect emission
N deposition
Fossil fuel combustion
Biomass
burning
Livestock manure
management
Applied organic N fertilizer
Industrial N fertilizer
Manure from grazing
animals
Crop residues
Mineralization of soil
organic matter
Atmosphere
Soil
Surface
water
Groundwater
Appendix 5. Sources and pathway of N2O emission in soil management system
Volatile
N Input to soil
Runoff
Leaching

76
Appendix 6 Formulas for GHG emission calculation
1. ERES (emission reduction from energy substitution) and EBC (emission from
biogas utilization)
ERESGHG fuel= FS fuel * EFGHG fuel14
2. ERMM (emission reduction from manure management) and EBP (Emission
from biogas production)
Biogas system CH4 N2O
Rural household EF(T)15*N(T) [Σ[Σ(Nex(T)*N(T)*MS(T,S) ]*EF3(S)]*44/2816
M&L farm-based EF(T) *N(T) [Σ[Σ(Nex(T)*N(T)*MS(T,S) ]*EF3(S)]*44/28
3. GHG emission produced from ‘manure-digestate’ part of biogas systems
Biogas
system
CO2 CH4 N2O
Rural
household
FS fuel * EFfuel17
M*EF *44/1218
FSfuel*EFfuel FS fuel * EFGHG fuel
[(FSN+FON+FCR)*EF1]+[(FSN+FON+FCR)*EF1FR]*44/2819
[(FSN*FracGASF)+ (FON+FPRP)* FracGASM ]* EF4*44/2820
(FSN+FON+FCR+FSOM+FPRP)*FracLEACH-(H)*EF5*44/2821
M&L farm-
based
FS fuel * EF fuel
M*EF *44/12
FSfuel * EF fuel FS fuel * EFGHG fuel
[(FSN+FON+FCR)*EF1]+[(FSN+FON+FCR)*EF1FR]*44/28
14 EFGHG fuel is the emission factor from energy combustion part which is shown in Table a in appendix 7.
15 EF(T)=(VS(T)*365)*[Bo(T)*0.67*Σ(MCFs,k/100)*MS(T,S,K)], kg CH4 animal-1 yr-1
; (Appendix 7-Table b and
Table c).
16 Direct N2O emission from MMS. N(T)=number of head of livestock species in the country; Nex(T)=annual
average N excretion per head of species in the country, kg N animal-1 yr-1; MS(T,S)=fraction of total annual nitrogen excretion for each livestock species, that is managed in manure management system S in the country. 44/28=conversion of N2O-N(mm) emission to N2O(mm) emission; (Appendix 7) 17 GHG emission produced from coal combustion for synthetic ammonia production 18 CO2 emission from synthetic ammonia applied on soil. The default emission factor is 0.2 for carbon emission from synthetic ammonia applications. 19 Direct N2O emission from synthetic ammonia and digestate applied on soil. FSN is N fertilizer input and FON is total N organic fertilizer input. The EF1FR is emission factor of paddy field, 0.41%. FCR is crop residue input and EF1 is emission factor of upland which are not considered here.
20 N2O(ATD) is the indirect N2O emission produced from atmospheric deposition of N volatilized from
managed soil.
21 N2O(L)-N is annual amount of N2O-N produced from leaching and runoff of N additions to managed
soils;FSOM is annual amount of N mineralized in mineral soils associated with loss of soil from soil organic matter
as a result of changes to land use. The FracLEACH-(H) and EF5 are shown in Table g in Appendix 7.

77
[(FSN*FracGASF) + (FON+FPRP)* FracGASM ]* EF4*44/28
(FSN+FON+FCR + FSOM+FPRP)* FracLEACH-(H) * EF5*44/28

78
Appendix 7 Parameters for emission calculation of ‗manure-biogas-digestate‘ system
Table a. GHG emission factors (EFGHG fuel) for residential energy consumptions [52]
Objective CO2(g/MJ) CH4(g/MJ) N2O(g/MJ) Combustion
efficiency
Firewood 112 0.03 0.004 0.24
Coal 94.6 0.01 0.0015 0.4
Biogas 0 0.001 0.0001 0.6
NG 56.1 0.001 0.0001 0.57
Table b22
2006 IPCC guidelines for national greenhouse gas inventories—Asia [21]
Livestock Bo(T)
m3 CH4 kg
-1VS
pig (average) 0,29
Dairy cow 0.13
Table c 2006 IPCC guidelines for national greenhouse gas inventories—Asia [21]
Livestock MCF of slurry/liquid
system
%
MCF of
composting
%
MCF of uncover lagoon
%
swine 65 1 79
Dairy
cow
65 1 79
*Temperature is estimated in 25oC
Table d23
2006 IPCC guidelines for national greenhouse gas inventories—Asia [21]
Livestock EF3-solid EF3–Liquid EF3–composting EF3–uncovered EF3–aerobic treatment
22 VS(T)=daily volatile solid excreted for livestock category T, kg dry matter animal-1 day-1; Bo,(T)=maximum methane producing capacity for manure produced by livestock category T, m3 CH4 kg-1 of VS excreted; MCFs,k=methane conversion factors for each manure management system S by climate region k,%; MS(T,S,K)=fraction of livestock category T manure handled using manure management system S in climate region K, dimensionless; 0.67=conversion factor of m3 CH4 to Kg CH4. 23 EF3(S)= emission factor for direct N2O emissions from manure management system S, kg N2O-N/kg N in system S; value of liquid and slurry is 0; S = manure management system;

79
lagoon
Pig 0.005 0.005 0.01 0 0.005
Dairy cow 0.01 0 0.005
Table e 24
Default emission, volatilization and leaching factors for indirect soil N2O
emissions [38]
Factors Default value
EF4 [N volatilization and re-deposition],
kg N2O-N (kg NH3-N+ NOX-N
volatilized) -1
0,01
EF5 [leaching and runoff], kg N2O-N (kg
N leaching and runoff)-1
0,0075
FracGASM [volatilization from all organic
N fertilizers applied, only consider
livestock manure here], kg NH3-N+ NOX-
N (kg N applied or deposited) -1
0,2
FracGASF [volatilization from industrial
fertilizer], kg NH3-N+ NOX-N (kg N
applied) -1
0,1
FracLEACH-(H) 0
24 EF4 emission factor for N2O emissions from atmospheric deposition of N on soils and water surfaces and EF5 emission factor for N2O emission is from N leaching and runoff from soil. FracGASF is fraction of industrial fertilizer N that volatilize as NH3 and NOx; FracGASM is fraction of FON and FPRP that volatilizes as NH3 and NOx;

80
Appendix 8 Biogas production process of ‗energy-environmental‘ biogas system
Separation
Biogas Discharged
CH4
N2O-direct
CH4 N2O-indirect
N2O-direct
CH4 N2O
-indirect
N leaching and
runoff
Cow manure
Urine wastewater
AD
Solid
dewatered
Compost
Aerobic lagoon
Solid 65.6% of VS
39.8% of TN
Slurry 34.4% of VS
60.2% of TN
Sedimentation lagoon
Supernatant
Sludge
Slurry 34.4% of VS
18.1% of TN
Slurry 13.8% of VS
4.53% of TN

81
Phases in ‘energy-environmental’ biogas system
Pre-treatment phase
The purpose of pre-treatment phase of ‗energy-environmental‘ system is to remove as
much as solids in feedstock by settling chamber and separation facilities. The solid
separated from influent can be composted for making fertilizer. The slurry should
remain in sedimentation lagoon more than one hour before entering anaerobic
digester. The supernatant from sedimentation lagoon is distributed to anaerobic
digester and sludge left in lagoon flows into AD for biogas production.
Anaerobic digester selection
The AD used in ‗energy-environmental‘ system is mesophilic fermentation which is
normally no less than 15oC.UASB is the anaerobic digester mainly designed for deal
with sludge concentration within 5-7 kg BOD/ m3 and its volumetric loading rate is
about 10-14 kg COD/m3 during 1-12 weeks [53]. And COD removal rate ranges
between 70%-85%. Compared to other anaerobic digester, UASB has three distinct
zones: a sludge bed, a sludge blanket and gas separation zone [54]. The livestock
manure and wastewater on farm feeds into the tank from below and flows upward
through a bed of dense, granular sludge and a blanket of sludge particles. The gas-
liquid-solid separation system can separate suspended solids from treated liquid and
baffles are used to release trapped gas, which can promote long SRT and remain high
concentration of sludge in digester to improve environmental conditions for
microorganisms.
Post-treatment phase
In ‗energy-environmental‘ system, aerobic treatment plays the most important role in
post-treatment phase. Due to high concentration of N and P in slurry flow out of
digester, aerobic lagoon should be in good performance of N and P removal. SBR
(sequencing batch reactor) is selected in this system. SBR system has been common
used as an efficient activated sludge model for treating municipal wastewater and
organic industrial wastewater with high concentration of COD and BOD5 [34]. Table
h represents the chemical removal rate of SBR used in post-treatment phase.
Table h The chemical removal rate of SBR in case study
Chemical categories COD BOD5 TN TP NH3-N
Removal rate (%) 52.7~82.1 89.0~95.7 74.1 42.2 97.2~99.8
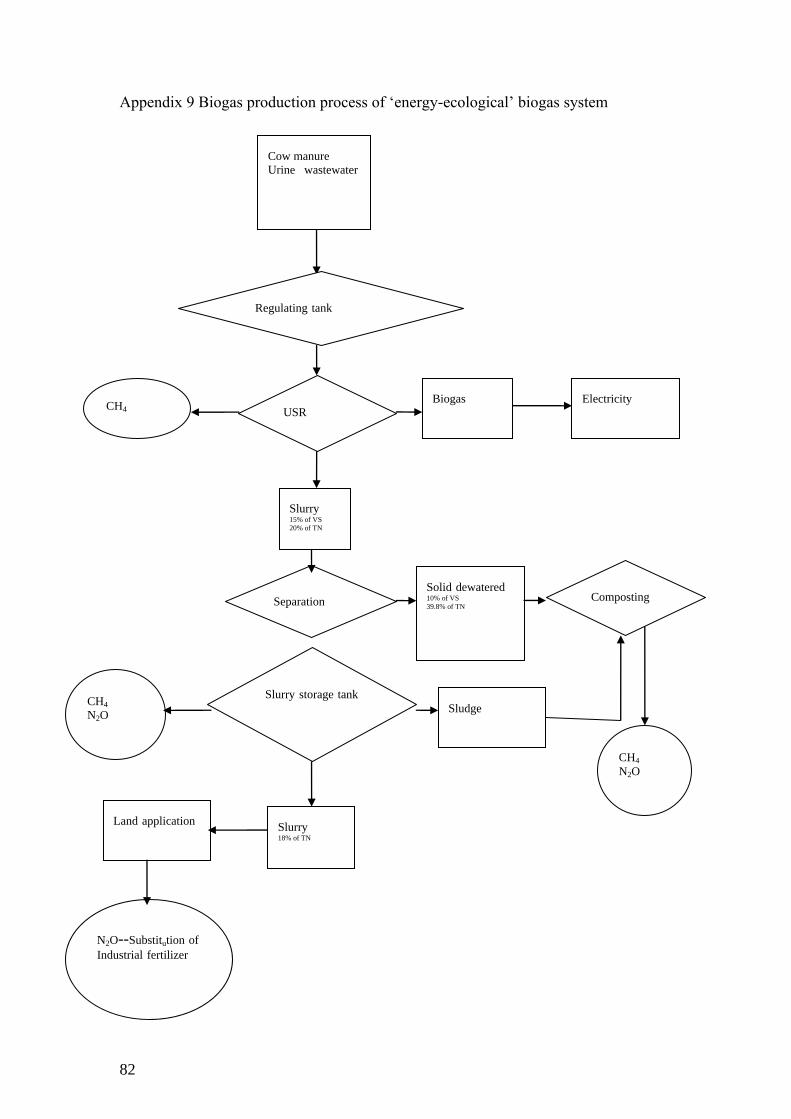
82
Appendix 9 Biogas production process of ‗energy-ecological‘ biogas system
Land application
Solid dewatered 10% of VS
39.8% of TN
Sludge CH4 N2O
N2O--Substitution of Industrial fertilizer
CH4 N2O
Regulating tank
USR
Electricity CH4
Cow manure
Urine wastewater
Separation
Slurry storage tank
Composting
Biogas
Slurry 18% of TN
Slurry 15% of VS
20% of TN

83
Phases in ‘energy-ecological’ biogas system
‗Energy-ecological‘ system aims to produce biogas as much as possible and make use
of N and P contained in digestate. The pre-condition of adopting this type of system is
whether enough arable land or pastureland nearby to digest the slurry and solid
residue produced from anaerobic digester. Different from ‗energy-environmental‘
biogas system, the separation phase is taken after anaerobic digestion and all the
feedstock can enter AD which will increase biogas yield.
Pre-treatment phase
The wastewater flush on dairy cow farm is collected in water storage tank and all the
manure and urine also put in. The solid with big size is removed by settling chamber
before flow in anaerobic digester. However, different from liquid-solid separation
facility used in ‗energy-environmental‘ system, the chamber cannot reduce the VS
content of feedstock, which doesn‘t have any effect to biogas yield. Regulating tank is
settled before anaerobic digester, which is used for mixing wastewater and solid
feedstock and regulating flow, concentration and temperature.
Anaerobic digester selection
USR (upflow solid reactor)is a simple and low-cost anaerobic digester used
commonly in China [55]. Untreated feedstock solids and microorganisms are
maintained in the reactor by passive settling. The dense accumulation of solids at the
bottom of digester results in long SRT. The volumetric loading rate of this digester
ranges from 1.6-9.6 kg COD/m3.d. USR can remove 85% of COD.
Post-treatment phase
Effluent from digester can be treated by solid-liquid separation facility, which
removes 65.5% of VS and 39.8% of TN from effluent. The solid from separation
process is put into dewatered equipment for the further composting and liquid enters
to slurry storage tank. The slurry from this slurry tank with 70% of TN removal can
be applied to arable land around.
To energy utilization perspective, the biogas produced from process is used for
electricity production. Compared to traditional livestock farm-based project,
electricity turbine can transfer biogas into electricity which can be put on national
electricity grid for residents‘ energy consumption. Biogas through CHP has electricity
efficiency about 32-38% and heat efficiency about 45% in most of Chinese project.
The heat is commonly recovered for livestock farm internal demand, especially for
heating anaerobic digester in winter in order to keep temperature in 25oC.

84
Appendix 10 The source of tables in thesis
Source of tables in text No. table
Tables from literature 1.1, 1.2, 1.3, 1.4, 1.6, 1.7, 1.8, 1.9, 1.10,
1.13, 1.14, 1.15, 1.17, 1.18, 1.19, 2.1,
4.4a, 4.4
b, 4.7, 4.10
a, 4.10
b, 4.14
Tables from calculation 1.11, 1.16, 3.2, 3.3, 3.4, 3.5, 3.6, 3.7, 3.8,
3.9, 3.13, 3.14, 3.15, 3.16, 3.17, 3.18,
3.19, 4.5a, 4.5
b, 4.6
a, 4.6
b, 4.7, 4.11
a,
4.11b
Tables from fieldwork 3.1, 3.14, 3.16, 3.2, 3.3, 3.10, 3.11, 3.12
Tables for conclusion 1.12, 4.1, 4.2, 4.3, 4.8, 4.9


