Embed Size (px)
Citation preview

JOH-ESK010-20080520-JvW-P1
Jacob Maroga,
Chief Executive, Eskom Holdings Ltd
23 January 2009
Update on the Power System and the Build
Programme:
A Presentation to the Media

JOH-ESK010-20080520-JvW-P1
Power System - update

3
State of the Power System: Capacity (last 6 months)
• Camden Power Station fully operational (8 units)
• 2 units of Grootvlei power station now synchronised to the grid
• 1 unit of Komati power station now synchronised to the
grid• 2 more open cycle gas turbine units at Gourikwa
power station commissioned.• Based on last year’s peak demand reserve margin is
above 8%.
– 35, 959 MW on 14 July 2008 compared to 36, 513 MW on
5 July 2007
Eskom has just over 39 500MW of operational capacity with the aim of
adding close to 1 000 MW more from the return to service stations and
the open cycle gas turbines by the middle of the year.
4
CAPACITY OUTLOOK
0
1000
2000
3000
4000
5000
6000
7000
8000
01 J
an 0
816
Jan
08
31 J
an 0
815
Feb
08
01-M
ar-0
816
-Mar
-08
31-M
ar-0
815
-Apr
-08
30-A
pr-0
815
-May
-08
30-M
ay-0
814
-Jun-
0829
-Jun-
0814
-Jul-0
829
-Jul-0
813
-Aug
-08
28-A
ug-0
812
-Sep
-08
27-S
ep-0
812
-Oct
-08
27-O
ct-0
811
-Nov
-08
26-N
ov-0
811
-Dec
-08
26-D
ec-0
810
-Jan-
09
MW
's
LL Full LL Partial Target
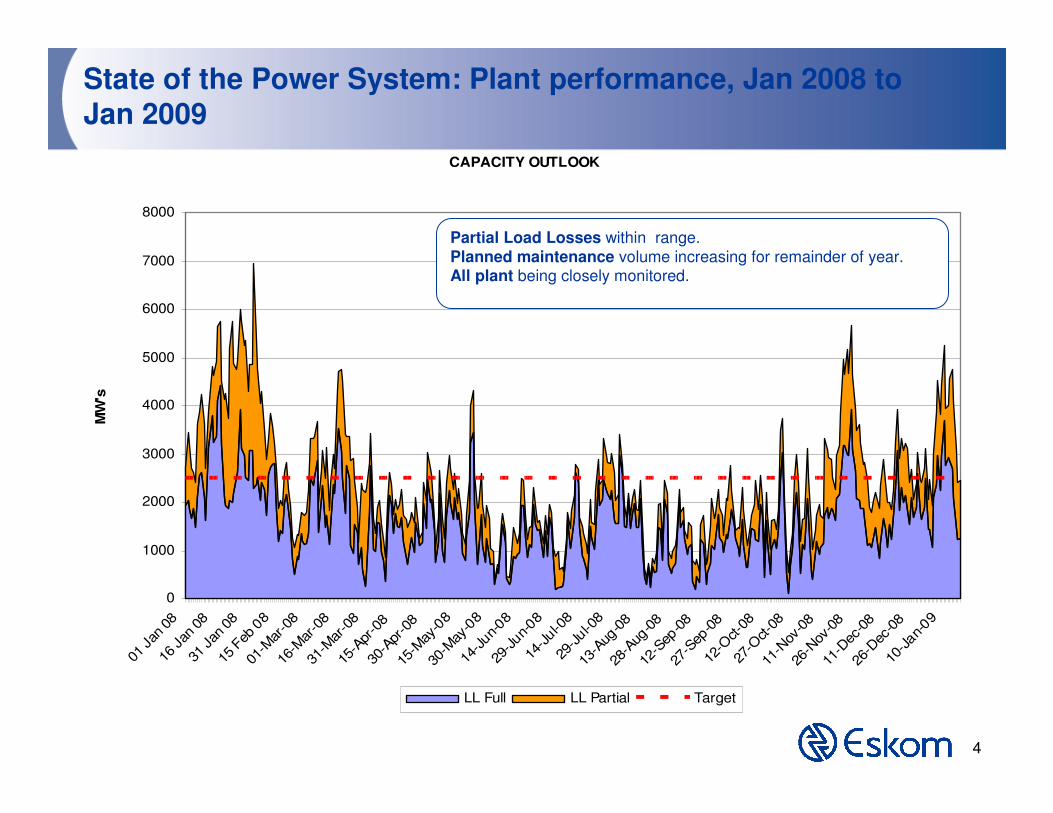
Partial Load Losses within range.
Planned maintenance volume increasing for remainder of year.All plant being closely monitored.
State of the Power System: Plant performance, Jan 2008 to
Jan 2009

5
State of the Power System: Plant performance
• Significant maintenance work done in the holiday period in December and January
–between 6 000MW and 9 000MW of plant
• Impact of heavy rains managed and plant performance
has improved as compared to the January 2008 period.
• More work still requires to be done to enable sustainable plant performance in the next few years.

6
10111213141516171819202122232425262728293031323334353637383940
20-Jan 24-Feb 30-Mar 04-May 05-Jun 01-Jul 23-Jul 25-Aug 28-Oct 08-Dec 22-Jan
Weeks
Co
al
sto
ck
pil
e d
ay
s
38.7
days
• Average coal stockpile levels at 38.7 days with every power station having stockpile levels above 20 days.• Stations vulnerable to rain have stockpiles of about 5 days of coarse coal treated with chemicals to resist moisture ingress
State of the Power System – coal supply trend, Jan
2008 to Jan 2009

7
State of the Power System: Energy Savings
• Forecasting to have a 3% reduction in energy sales for
the financial year 2008/9 as compared to 2007/8• Impact of the economic downturn seen in the shutting
down of ferro-alloy and stainless steel smelters.
– At least 1500MW of demand reduced.
• Savings by remaining customer base through
efficiencies and price signals providing up to 1500MW of demand reductions.
– Some reduction due to the downturn but difficult to
quantify.
• Average of 3 to 5% savings. – Eskom is in continuous discussion with the mining
houses to ensure production is not lost.

JOH-ESK010-20080520-JvW-P1
Build Programme - update

JOH-ESK010-20080520-JvW-P1
Planned capacity expansion projects
3,182.4 MWTOTAL Generation MW Installed to date (Since Build Programme Inception)
1,335 KmPower Delivery ProjectsInstalled to date (Since Build Programme Inception)
No Capacity increaseMajuba Rail
No Capacity increaseMatla
7 New Transformer Substations
300 MW
3,645 MW
5,032 MW
9,564 MW
PORTFOLIO TOTAL
No Capacity increaseKriel
300 MW IncreaseArnot
Mpumalanga Refurbishment
1,170 MWGrootvlei
1,520 MWCamden
Duvha
Komati
Sere
Tubatse
OCGT
Ingula
Kusile
Medupi
PROJECT
TransformersInstalled to date (Since Build Programme Inception)
RTS
PEAKING
NEW COAL
PORTFOLIO CAPACITY
4,764 MW
4,800 MW
1,352 MW
2,080 MW
1,500 MW
100 MW
955 MW
No Capacity increase
3,182.4 MWTOTAL Generation MW Installed to date (Since Build Programme Inception)
1,335 KmPower Delivery ProjectsInstalled to date (Since Build Programme Inception)
No Capacity increaseMajuba Rail
No Capacity increaseMatla
7 New Transformer Substations
300 MW
3,645 MW
5,032 MW
9,564 MW
PORTFOLIO TOTAL
No Capacity increaseKriel
300 MW IncreaseArnot
Mpumalanga Refurbishment
1,170 MWGrootvlei
1,520 MWCamden
Duvha
Komati
Sere
Tubatse
OCGT
Ingula
Kusile
Medupi
PROJECT
TransformersInstalled to date (Since Build Programme Inception)
RTS
PEAKING
NEW COAL
PORTFOLIO CAPACITY
4,764 MW
4,800 MW
1,352 MW
2,080 MW
1,500 MW *
100 MW
955 MW
No Capacity increase
* Tubatse has

JOH-ESK010-20080520-JvW-P1
Planned power delivery projects
085km275KV Tarbor-Spencer
0218km765KV Majuba-Umfolozi
233km1450km765KV Zeus-Omega Western Cape
Complete408kmSouthern Cape Strengthening (Beta/Delphi)
Assure availabilty of the Cahora Bassa – Apollo line
205km
56km
111km
PLANNED CAPACITY INSTALLED TO DATEPROJECT
Apollo Refurbishment
400KV Duvha-Lesideng
Cape Strengthening Western Grid
Platinum Basin Complete
Complete
82km
Complete
5 Year plan for Transmission Lines:
765Kv: 8,122km
400Kv: 7,768km
275Kv: 310km
132kv: 293km

11
The benefits to South Africa go far beyond
increased generation capacity
Regional development
International competitive-
ness
Infrastructure
GDP impact
Skills development
Reserve margin
Local Spend
New industries
•GDP growth:Medupi 0.34% /yrKusile 0.34% /yrIngula 0.04% /yrTotal 0.72% /yr
• 40% of total spend
(~R227bn) to be spent
locally (~R90bn)
• More than 3,000 skills to be
developed through
partnerships with suppliers
and educational institutions
• At least 54km of new roads to be
built
• Local infrastructure improvements
• Implementation of CSDP will improve competitiveness of
SA electricity components manufacturing industry
• Additional capacity will result in meeting 10% reserve margin target in 2015
• Creation of a boiler and
turbinecomponent
manufacturingindustries in SA

12
Medupi Power Station“rain that soaks parched lands,
giving economic relief”Project update
Unit 1
Unit 2Unit 3
Unit 4
Unit 5
Unit 6

13
Medupi is SA’s largest construction project by far!!
Medupi
4X larger than Gautrain
Capex cost (Rand)

14
Medupi - construction in commenced 2007 and is due to go
online in 2012
Medupi construction activities started
2007 2008 2009 2010 2011 2012 2013 2014 2015 2016
6 5 4 3 2 1
First unit commissioned in 2012
Fully commissioned in 2015
Execution partner: Coal supply
Boiler
Turbine
Enabling Civils
Main Civils
Generator transformers
2006
Board approval March 2007
NERSA licence granted

15
Medupi Power Station will have a significant impact on SA
Inc.
HEADLINE FIGURES
• Funding required: R100bn (local & offshore)
• Capacity as % of Eskom’s installed base: 11% (4,794 MW)
• Will be the 22nd largest power plant, 4th largest coal plant in the world
• Direct construction employment: 8,000
(at peak)
• Current construction employment: 2,700
(Dec ‘08)
• Indirect employment: ~1,500
• Ongoing direct employment: 750
• People directly impacted by Medupi ~80,000
…… plus keeping the lights on for all of South Africa!

16
Medupi Power Station’s potential impact on SA Inc.
MEDUPI
National Infrastructure
Main components
(expanded on following pages)
Roads
Freight forwarding
Ongoing roads maintenance
Richards Bay to
Lephalale road
Lephalale bypass
R1bn, 500 jobs
R50-100m
Richards Bay facility
R90m, 150 jobs
Hotels
Local transport
Local business
Catering and workforce
supply
Vehicle
maintenance
Hotels to expand
100%-150%
30-35 buses at peak
Increased taxis
~100 jobs
Food, laundry,
maintenance, security
supplied to workforce
R1bn, 500 jobs
500+ extra vehicles
maintained locally
20 jobs
Skills (current & legacy)
Artisans
Engineers
Semi-skilled
Unskilled
R&D
Proj Mgt, Admin
200 required
2,400 required
2,750 required
1,000 required
70 required
1,500 required
Transmission
Lines
Substations
2500 km lines built
~R5bn
2200 jobs
1 large substations
Upgrade to 1 other substation
~R1bn
450 jobs
Gypsum
Coal, Water, Limestone
Waste (Ash, Gypsum,
General)
Ash
General
Coal
Limestone
Water
300kt/yr
R60m / yr
15Mt / yr
~R1.8bn / yr
2000 jobs for mine
expansion
Needs 14Mm3/yr vs
current allocation of
2.9Mm3/yr. Crocodile
River diversion
R50m / yr
3Mt / yr
20 jobs
Potential to sell to
cement manufacturers
Low environmental
impact
Setting up local waste
dump
Up to 50 jobs
R100m
Trains
38 wagon train per day
for limestone
12 tank carriers per
year of oil
Maintenance of rail
lines
50 jobs
Local Infrastructure
Housing
Water
Sanitation
Social facilities
1850 houses (320
being purchased and
900 being built)
R2.0bn
Sewerage plant
upgrade
R50m
2x schools, increased
policing, recruitment
centre, fire, social club,
ICT centre
R50m planned spend
Benefit from Crocodile
River diversion
• Training to upskill local workforce (eg MPS-JV
local training facility targeting 3000 in multiple skills
categories)
• Training to reskill/upskill Eskom employees with
on-the-job training for 500 people
Ongoing operations and maintenance
250 jobs permanent
250 contracted
R450m / yrPlant permanent
~130 jobsT&D
FundingR100bn funding required from multiple
sources:
•Government
•Local banks
•Foreign banks

17
Kusile Power Station“The Dawn has come.”
Project update
Kusile

18
Kusile construction in commenced 2007 and is
due to go online in 2012
Kusile construction
activities started(01 April 2008)
2007 2008 2009 2010 2011 2012 2013 2014 2015 2016
1 2 3 4 5 6
First unit commissioned in2013
Fully
commissioned by2017
Coal Supply
Boiler
Turbine
Enabling Civils
Main Civils
2006
Board approvalMarch 2007
NERSA licence
granted(15 March 2008)
Generator Transformers
Execution Partner

19
Kusile Power Station will have a significant impact on SA Inc.
HEADLINE FIGURES
• Funding required: R111billion (local & offshore)
• Capacity as % of Eskom’s installed base: 11% (4,800 MW)
• Will be the 22nd largest power plant, 4th largest coal plant in the world
• Direct construction employment (at peak) : 8,500
• Current construction employment: 1100
• Current local employment (Dec ‘08) 448
• Indirect employment: ~5,000
• Ongoing direct employment: 12,750
• People directly impacted by Kusile ~71,000
…… plus keeping the lights on for all of South Africa!
20
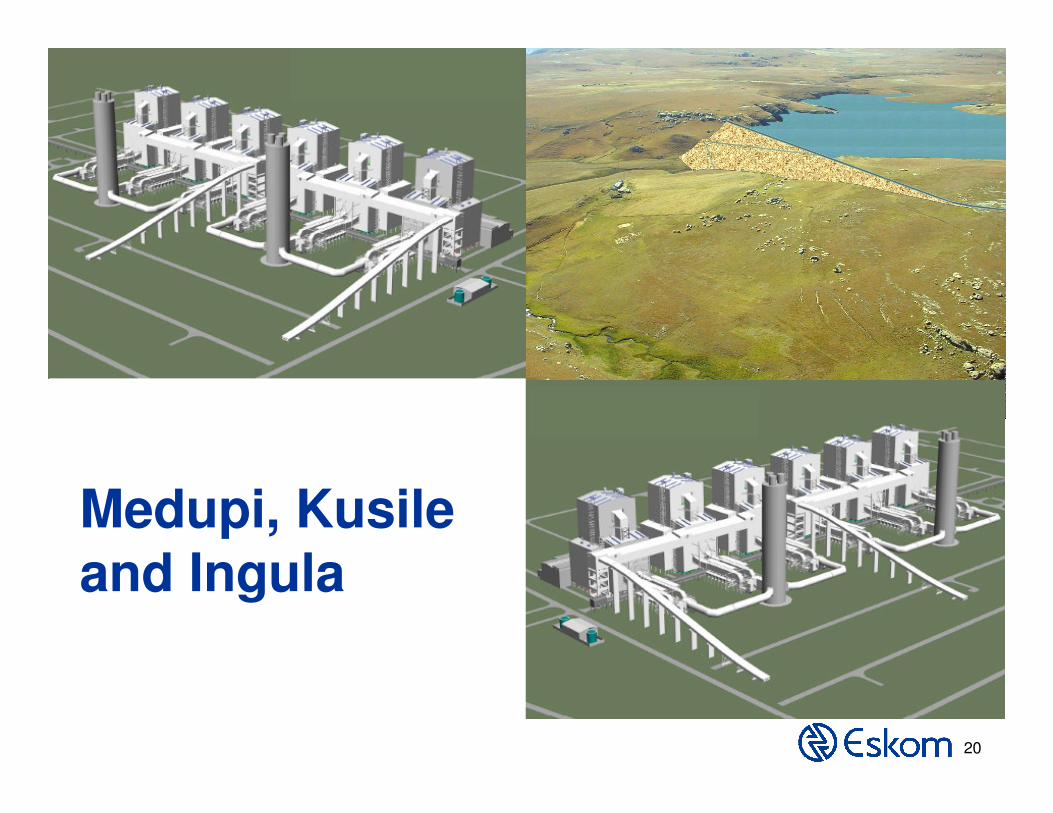
Medupi, Kusile
and Ingula

21
Medupi, Kusile, Ingula … together represent the most
ambitious infrastructure investment SA has ever undertaken
HEADLINE FIGURES
• Funding required:
• Capacity increase as % of Eskom’s installed base:
– Base load increases from Medupi and Kusile
– Peaking capacity increase from Ingula
• Will be 4th and 5th largest coal plants in the world and 19th
largest pumped storage scheme
• Direct construction employment:
• People directly impacted by Medupi, Kusile and Ingula
• Pace of build of Medupi and Kusile is 30% faster than
previous Eskom coal builds
…… plus they will keep the lights on for all of South Africa!
R227bn (local & offshore)
25% (+9,564 MW)
30% (+1,332 MW)
20,000
~ 155,000

22
The three projects will require about 85% of one year’s artisans and 105% of one year’s higher education graduates
Opportunity for SA to grow its skills base
Artisans
R&D
Project management and admin
IngulaKusile
Medupi
Engineers
8 700 skilled
people required
8 700 skilled
people required
Demand for skills on projects
5,200
150
500
2,840

23
Thank You