Embed Size (px)
Citation preview

University of the District of Columbia Right-Sizing Plan
Part I: Creating Pathways to Sustainability and Accountability
The Board of Trustees of University of the District of Columbia | October 1, 2012
ii
Table of Contents Executive Summary ................................................................................................................ iii Section I .....................................................................................................................................1 “A vision for the UDC system that defines the interconnected mission, roles, responsibilities, and scope of the flagship university, the community college and the law school, and how they relate to each other.” Section II....................................................................................................................................5 “An enrollment plan that sets forth reasonable enrollment projections for the next five years based on both recent enrollment trends and on a realistic analysis of potential student demand for the flagship university and the community college.” Section III ................................................................................................................................ 10 “An analysis of all academic programs that identifies under-enrolled and under-performing programs and an associated timeline and plan for either improving or eliminating those programs.” Section IV ................................................................................................................................ 14 “A compensation market analysis to determine appropriate compensation levels to attract and hold highly qualified staff and faculty and a strategy and timeline to bring salaries and wages in line with these levels.” Section V .................................................................................................................................. 16 “An analysis of current and planned facilities and a revised capital spending plan that reflects the University’s actual enrollment size and realistic enrollment projections.” Section VI ................................................................................................................................ 19 “A tuition analysis and timeline to bring tuition more in line with actual costs associated with a student’s education, with a particular emphasis on the non-District resident tuition rates, including the metro-area resident rate.” Section VII ............................................................................................................................... 24 “A staff and faculty reduction strategy and timeline, including an assessment of the initial and subsequent budgetary impacts of implementing this strategy.” Summary and Conclusion ....................................................................................................... 29 Appendix A – Enrollment Plan ............................................................................................... 32 Appendix B – Proposed Program Realignments .................................................................... 46 Appendix C – Projected Fundraising and Grant Giving ....................................................... 51 Appendix D – Tuition Competitiveness Study ....................................................................... 52 Appendix E - Key Assumptions for Pro Forma ..................................................................... 55
iii
The University of the District of Columbia (“the University”)1 fulfills the promise of economic independence and freedom from poverty for many residents of the District. As a noted academician recently opined “the value of public higher education is fundamental to advancing the economic well-being of this country and its citizen.2
” Public colleges and universities are necessary to prevent higher education from being available only to the elitist or wealthiest in society. This viewpoint is validated by scholarly research and empirical data that affirms that both earning potential and unemployment rates are influenced by whether or not an individual possesses a college degree. In these difficult economic times, the value of a public university as a vehicle for economic uplift cannot be underestimated. The Board of Trustees of the University understands this dynamic between economic aspirations and educational accessibility and has employed it as a guide in shaping policy outcomes for the University suggested by this report.
For over 161 years, the University, in one form or another, has provided this means of economic mobility and social access for residents of the District of Columbia. The University’s history tells the story of its relevance as a school for “colored girls” through its evolution as a university system. Since its inception, the University has been committed to ensuring the availability of public higher education to the residents of the District. Success of our students is paramount and their needs must be satisfied if the University is to thrive. The Board remains committed to continuing the University as a viable institution by taking the following actions:
• Maintaining a system of public education that includes a strong Flagship offering undergraduate and graduate degrees, a viable and independent Community College, and the nationally recognized David A. Clarke School of Law (the “School of Law”);
• Ensuring student success by providing wrap around services that include, but do not stop at (1) nurturing students’ natural abilities; (2) teaching confidence, competition and self-determination; (3) developing within students a sense of community service fostering a lifelong sense of altruism; and (4) providing academic advising and counseling that assists students in adjusting to what can be a difficult transition from high school to college and more independent learning environments;
• Improving the University’s relationship with our community – both the internal University community and the District at-large; and,
• Stabilizing our costs and bringing our costs more in line with comparable universities.
1 As used in this report, “University” means the aggregate of the Flagship (undergraduate and graduate programs), the Community College and the David A. Clarke School of Law. 2 Bell, S (2012) Assault on Public Higher Education | From the Bell Tower. Retrieved from http://lj.libraryjournal.com/2012/03/opinion/steven-bell/assault-on-public-higher-education-from-the-bell-tower.
Executive Summary

iv
The University is the only public, land-grant postsecondary institution in the District of Columbia. We also proudly hail our designation as a Historically Black College and University (HBCU) and embrace the traditions and obligations that come with it. In a city and a region where over half of the job openings require a bachelor’s degree or above, the comprehensive university envisioned by our founding legislation and guided by our mission remains necessary. Consistent with our mission, we uniquely offer both accessible and affordable postsecondary options for District residents in a way that private institutions in the District are not structured to do. Against very challenging economic and academic obstacles, the University has achieved the following notable gains:
• We are the only university in the area that has a demonstrated history of successfully producing two-year and four-year graduates from academically at-risk District residents.
• The University has enrolled and graduated more District residents than all the city’s private institutions combined, and we continue to do so.
• Over the last three years alone, the University awarded 1,180 degrees to District residents.
• The University awards more baccalaureate degrees per 100 full time equivalent undergraduates than all but one of its peer institutions nationally.
• With more than 20,000 University alumni living in the District, the University has a profound impact on shaping economic uplift and academic advancement for District residents.
Despite all that the University has accomplished and sustained, the University must contend with dwindling public resources, increasing competition from private, for-profit institutions for government funding, and challenging economic conditions. As a result of these barriers, the University has had to wrestle with and defend its relevance and value as an institution before the District and its political leadership. In May 2012, the Council of the District of Columbia mandated that the University engage in “right-sizing” in order to create a University that is consistent with its enrollment and the financial resources available. The Board embraces this mandate as an opportunity to look at the University as a clean slate and to develop a vision for the Flagship, Community College and the School of Law that will ensure the University’s viability for years to come. The Board acknowledges that component parts of the University system have not performed well in the past and must be organized and aligned in order to better meet the secondary educational and workforce training needs of our city. The Board has unanimously approved the plan contained in this report. The plan was informed by the imperative that the University must serve the aspirations of our students, support the employment and economic development needs of the District, and be implemented with effectiveness, efficiency and the prudent management of taxpayer resources. To a person, the

v
Board is committed to the changes in structure, operations, and financial discipline outlined in this report. The following table contains the major initiatives of the right-sizing plan with anticipated savings or revenue increases from each initiative.
Right-Sizing Plan, Summary of Part I Initiatives
As provided above, the Board has designed an academic and operating framework that shows that the University’s revenue is projected to expand while its costs under the right-sizing activities are expected to dramatically decrease. Implementation of the right-sizing plan will create a University that is more academically effective, economically efficient and financially stable over the long term. We anticipate a five year cost avoidance of more than $95 million and an increase in annual revenue of $14 million by FY18. Our operating costs relative to our peers are also benefitted by our right-sizing actions. These savings are captured in the chart below:
Cost per Full Time Equivalent, University vs. Peers, Projections under Right-Sizing Plan
We believe that our right-sizing actions will be able to significantly reduce the University’s cost per full time equivalent. We anticipate that the University will be 25% higher than its peer group by FY18, compared to 66% higher in FY11, after the implementation of the right-sizing plan.
Savings or Revenue Increase ($M)FY13 FY14 FY15 FY16 FY17 FY18
Cost Reduction Programmatic Realignment and Reduction
1.2 1.3 2.5 2.5 2.5 2.5
Cost Reduction Compensation Market Analysis - 0.2 0.2 0.2 0.2 0.2 Cost Reduction Facilities Study - 5.5 5.5 5.5 5.5 5.5 Cost Reduction Personnel Realignment 6.8 9.8 9.8 9.8 9.8 9.8
Total, Cost Reduction 8.0 16.9 18.0 18.0 18.0 18.0
Revenue Increase Tuition Restructuring - 0.9 0.9 1.0 1.0 1.1 Revenue Increase Enrollment Planning - 0.9 0.9 1.6 2.6 2.7 Revenue Increase Increase Funding from Alumni
and Corporate Sponsors - 0.1 0.1 0.1 0.1 0.1
Total, Revenue Increase - 1.9 1.9 2.7 3.7 4.0
Type Initiatives
Cost / FTE FY13 FY14 FY15 FY16 FY17 FY18UDC Projections* (A) 35,152 32,666 32,460 31,642 30,128 28,527Peer Schools Median (B) 21,143 21,671 22,213 22,768 22,768 22,768Variance (A-B)/B 66% 51% 46% 39% 32% 25%* Excluding federal fnancial aid and onetime funding to support rightsizing plan

vi
As part of the right-sizing plan, the University will request $21 million in one-time funding from the District government to address costs associated with implementing the various right-sizing actions. Of the $21 million, $11 million will be reallocated from the existing appropriated capital budget to support relocation costs. The remaining $10 million will support employee separation and other right-sizing related costs. Section VII of this report provides a more detailed pro forma that includes the University’s proposal.
Answering Difficult Questions, Anticipating Critical Needs, Making Hard Choices
The University of the District of Columbia Right-Sizing Plan Emergency Act of 2012 required the Board to submit a right-sizing plan to the Council by October 1, 2012. The following seven items were to be included in the plan pursuant to the legislation:
1. “A vision for the UDC system that defines the interconnected mission, roles, responsibilities, and scope of the Flagship university, the Community College and the law school, and how they relate to each other.”
2. “An enrollment plan that sets forth reasonable enrollment projections for the next five years based on both recent enrollment trends and on a realistic analysis of potential student demand for the Flagship university and the Community College.”
3. “An analysis of all academic programs that identifies under-enrolled and under-performing programs and an associated timeline and plan for either improving or eliminating those programs.”
4. “A compensation market analysis to determine appropriate compensation levels to attract and hold highly qualified staff and faculty and a strategy and timeline to bring salaries and wages in line with these levels.”
5. “An analysis of current and planned facilities and a revised capital spending plan that reflects the University’s actual enrollment size and realistic enrollment projections.”
6. “A tuition analysis and timeline to bring tuition more in line with actual costs associated with a student’s education, with a particular emphasis on the non-District resident tuition rates, including the metro-area resident rate.”
7. “A staff and faculty reduction strategy and timeline, including an assessment of the initial and subsequent budgetary impacts of implementing this strategy.3
”
In framing our responses to these questions, we have determined that the following actions are appropriate:
• Realign and focus our academic programs in all academic units, including the
Community College, by taking an interdisciplinary approach to meet demands in the marketplace and current fiscal realities. We will institute a University-wide public service
3 D.C. Law 19-0168 § 4032 (2012).

vii
requirement and integrate clinical, hands-on, experiences throughout the curriculum based on the clinical model of our nationally recognized School of Law.
• Invest in the activities and services that better enable us to recruit, retain and support student persistence to graduation. In this regard, conduct a top-to-bottom review of customer service quality and enabling technologies in key student service areas, including financial aid, registration, and academic advising to ensure that students can thrive and faculty and staff better serve them.
• Review and realign all University facilities and locations to increase economic efficiency and promote better space utilization.
• Streamline administration through a critical review of all staffing, including at the senior management level, and reorganize, consolidate and transfer administrative units to reduce hierarchy, redundancy, and bureaucracy.
• Develop new revenue streams including alumni giving, partnerships, grants, and corporate and foundation support. For further details on institutional advancement initiatives, please see Appendix C.
The plan contained in this report is the first step in our right-sizing initiative. Beyond the initiatives described in this report, we anticipate further programmatic changes of academic programs, including the development of more combined bachelor’s and master’s degree programs and providing quality online courses at the Community College and the Flagship. Our right-sizing efforts will better align the University’s costs with those of comparable institutions, providing an improved return on the public’s investment. Above all, however, right-sizing will ensure the University’s continued vitality in service to all residents of the District of Columbia.

1
Section I “A vision for the UDC system that defines the interconnected mission, roles, responsibilities, and scope of the flagship university, the community college and the law school, and how they relate
to each other.”

2
The Board has engaged in a critical examination of what the University should be. In so doing, we consulted internal University stakeholders, the Office of the Mayor, the Office of the State Superintendent of Education, and the District of Columbia Public Schools. These discussions revealed that the University’s mission does not need to change, but instead the vision that implements the mission must be reinvigorated and aligned to address the needs of the District.
Establishing a Vision that is Relevant and Encompasses the Needs of the District The University is an essential element of a 0-24 public education system in the District that provides young and adult learners with the skills to succeed in life and careers. The University offers job skills certificate programs; two-year associates degree programs; four-year programs aligned to the strong market demand for college graduates; and graduate opportunities in the high-demand professions of law, business and engineering. The University’s distinctive place in the city’s education chain is rooted in its unique history as an HBCU and as a public urban land-grant institution. These two designations have inter-related emphases on service to community and academic capacity for underserved populations. The new University vision is committed to building on that strong foundation by offering academic programs infused with clinical, on-the-job, and experiential learning opportunities. The economic value of the postsecondary degree is not disputed. As verified by the US Census Bureau and the Bureau of Labor Statistics, individuals with postsecondary education earn higher incomes and experience lower rates of unemployment then those with less education. The fact that over half of entry-level jobs in the region require a bachelor’s degree or above confirms the necessity of affordable and accessible baccalaureate and graduate opportunities for District residents. Within the District, there are many institutions that provide postsecondary education offerings. However, only the University has historically succeeded in providing educational options that are accessible and affordable to our District residents, and in particular, at-risk residents and graduates from the District’s public secondary schools. The University’s success in this regard, though not widely known, should not be minimized. The University has enrolled and graduated more District residents than all the city’s private institutions combined. Over the last three years alone, the University has awarded 1,180 degrees to District residents. In fact, the University awards more baccalaureate degrees per 100 full time equivalent undergraduates than all but one of its peer institutions nationally. With more than 20,000 alumni living in the District, the University’s role in creating economic uplift and educational advancement for District residents is strong. Given the unique success that the University has had in educating District residents, the challenge for the Board in framing a vision is fulfilling our mission while creating an educational framework that meets the needs our residents. We believe that vision must be one that recognizes and embraces our geographical and political location, imbues our students with a
Framing a New Vision to Achieve our Mission

3
sense of public service and equips them with skill sets that will promote deeper learning throughout their lives. The Board has determined that our vision should be that of a public service urban land-grant university, where students will have the opportunity, while pursuing their academic studies, to work in non-profit and government programs across the curricular spectrum at the University. In so doing, students will not just enhance their job-related skills but identify their goals in life in settings of public service. This ‘deeper learning experience,’ as more particularly described herein, will build the purpose, character and commitment needed to succeed in life while at the same time help to build the “One City” imperative that informs policy choices within the District. Furthermore, we believe this vision will distinguish us from other institutions of higher learning in the District while enhancing the educational value that we can and must offer to students.
We Affirm Our Mission
Our mission has not changed and is both simple and comprehensive in scope:
The University of the District of Columbia is a Historically Black College and University (HBCU) and urban land-grant institution of higher education. Through its community college, flagship, and graduate schools, it offers affordable post-secondary education to District of Columbia residents at the certificate, associate’s, baccalaureate and graduate levels. These programs will prepare students for immediate entry into the workforce, the next level of education, specialized employment opportunities and life-long learning.4
Our discussions around vision have reinforced the view that the University must provide an educational structure that appeals to the diverse population within the District. Our community is one of non-profit, government sector, international and private sectors. It is also one of income inequality and limited access to economic opportunity that is segmented by Wards across the city. Our vision is one of inclusion and cohesion. It recognizes the distinct role that the University has as the only public, land-grant institution in our nation’s capital and the responsibilities that it must meet in connection with this unique status. Our vision reaffirms that, consistent with our founding legislation and mission, the University is unalterably committed to providing affordable, accessible, and unobstructed 21st century pathways for all District residents to pursue their career goals and educational aspirations – from high school to entry into the workforce to degree programs to careers and career advancement. The University, through its Community College and Flagship baccalaureate, graduate and professional programs, including those offered by the School of Law, provides a continuum of opportunities so that students, regardless of their point of entry, can realize their immediate goals as well as envision the next level of education and accomplishment open to them. 4 University of the District of Columbia Strategic Plan Blueprint for the Future, 2010.

4
The overall mission of the University is the mission of all the academic units; however, the respective roles they play, particular opportunities they provide and the student constituencies they serve necessarily differ:
1. The Community College, with open admissions and a lower tuition rate, provides the most accessible, most affordable gateway for students with varying levels of preparation and immediate personal goals. The Community College is responsible for offering all of the University’s developmental courses (i.e. non-credit, college preparation), workforce development, certificate and associate’s degree programs geared to job training, preparation for the next level of education, and building a foundation for lifelong learning. The importance of the Community College is underscored by the fact that less than 10% of entry-level jobs in the region are available to individuals without any college education. Like the Flagship, the Community College works with District of Columbia Public Schools (DCPS) and District of Columbia Public Charter Schools (DCPCS) to offer appropriate school-to-college “bridge” programs and dual enrollment “early college” opportunities.
2. The Flagship, with moderately selective admissions standards and competitively low
tuition rates, admits undergraduate students who have demonstrated – in high school or at the Community College or at another institution of higher learning – their readiness to succeed at the baccalaureate level. The Flagship admits graduate students who have demonstrated that they are prepared to succeed at the master’s level and in their chosen professions. The Flagship offers baccalaureate, masters and professional degree programs to prepare students for careers, career advancement, career changes and lifelong learning. Our graduate programs are focused in areas designed to draw additional resources to the University. The Flagship also provides school-to-college “bridge” programs and early college opportunities for secondary students prepared to succeed at the baccalaureate level. The School of Law, which became a part of the University in 1996, serves a diverse population of students from across the nation interested in legal careers that support social justice and provide opportunities for direct community service. It is a model for all the University’s professional degree programs (e.g., MBA, MPA) in recognition of its success in directly serving the needs of District residents and neighborhoods.
This re-envisioning of how the University will fulfill its mission provides both context and planning guidance for the academic offerings at the Community College and the Flagship. The University will conduct program realignments and reorganizations in accordance with this vision in order to promote interdisciplinary collaboration, fast-track degree opportunities, and intellectual synergies.
The Board believes that infusing the University with this vision will improve both academic programs, promote institutional effectiveness and streamline course and job training offerings. Furthermore, we believe it will transform the University into the kind of university that prepares students for the complex realities of the 21st century and better align with initiatives to help the District address the critical issues of economic inequality and limited employment mobility.

5
Section II
“An enrollment plan that sets forth reasonable enrollment projections for the next five years based on both recent enrollment trends and on a realistic analysis of potential student demand
for the flagship university and the community college.”

6
The University has experienced fluctuations in enrollment that challenge the right-sizing effort. The fact that the University receives over 10,000 applications for admission a year attests to the University’s enrollment potential. However, the high proportion of incomplete applications restricts our ability to maximize the enrollment potential of its applicant pool. From 2005 to 2008, total enrollment at the University declined by over 11% to its lowest level since 1997. In 2009, the University created the Community College and repositioned the Flagship; as a result, from 2008 to 2010, new student enrollments increased by almost 15% per year (“normal” annual University enrollment growth is approximately 3%) and total University enrollment increased almost 20% to its highest level in over 15 years. In fall 2011, the Flagship was unable to sustain its increasing enrollment trajectory. This dip in enrollment illuminated key challenges that had received insufficient attention amidst the rapid enrollment growth, including the following realities:
1. Given the academic preparation of DCPS and DCPCS graduates and the large cost
difference between the Community College and Flagship, the University’s enrollment growth was concentrated within the Community College while new student enrollments at the Flagship declined between 5% - 10% per year;
2. Our admissions function was not staffed or equipped appropriately to strategically recruit new students or to handle a sharp increase in applications;
3. Financial aid packaging was inept and inefficient resulting in errors and delay in receiving financial aid;
4. A high application incompletion rate that limited the number of students who were admitted and could ultimately enroll, particularly at the Flagship; and
5. The inception of the Community College, without additional financial support, challenged the Flagship to sharpen its target student focus, develop a more professional admissions operation, and to work with the local government to position the University as a more viable player in the city’s higher education strategy.
As part of our right-sizing the University intends to invest and build upon a host of enrollment management planning and academic improvement initiatives designed to jumpstart its enrollment growth trajectory. These initiatives will include the following:
1. Developing a comprehensive admissions, enrollment, and retention data profile on the University, its competitors, and the external marketplace so the University can make strategic data-driven decisions;
2. Conducting a thorough review of all academic programs; eliminating low performing programs; and establishing a revamped, innovative General Education program;
Attracting Students, Retaining Students and Graduating Students with Careers and Economic Mobility
7
3. Creating an Enrollment Committee (EC) to identify strategic opportunities and threats to
expanding the University’s enrollment;
4. Overhauling the Office of Admissions, including the hiring of new staff and experienced leadership, and implementing state-of-the-art business processes and accountability systems;
5. Developing a comprehensive plan for creating new kinds of learning experiences based on the Learning University/Natural Critical Learning Environment/Capital Education5
model that promises both to attract more students and retain higher numbers of them; and
6. Critically examining what the size of the University should be and how the University’s student enrollment should be allocated to optimize revenues while minimizing costs.
While many of these efforts are expected to bear fruit primarily over the medium- and long-terms, the Flagship has already experienced an immediate impact in fall 2012 compared to fall 2011, including an almost 10% increase in applications, a 36% increase in application completion rates, an over 30% increase in offers of admission, and a 10% increase in new student enrollment.
The University has developed an enrollment plan that has three key enrollment strategies. First, the University must actively and intentionally recruit those students who, as suggested by historical data, are the most likely to complete their applications and enroll at the University, while exploiting contacts with Community Colleges across the country to grow the number of applications coming from those institutions. The University’s second key enrollment strategy is to implement application processing and applicant communication improvements that will increase the application completion rate. While some students who apply to the University may never intend to enroll, many applicants might attend the University if the University was able to: (1) assist them in completing their application; and (2) provide more encouragement and support during the admissions process. The University’s third key enrollment strategy is to improve the application to enrollment conversion rate through the following tactics:
1. Financial Aid Packaging: The University is committed to strengthening the Office of Financial Aid and improving the timely packaging of financial aid. The Office of Financial Aid has hired a new Director, revamped its staff, and has set a target of
5 The Learning University/Natural Critical Learning Environment/Capital Education model, which embraces clinical, experiential and hands-on learning, is discussed fully in Section III.
The University has Developed an Initial Enrollment Plan

8
processing and packaging financial aid for fall 2013. This process will occur within 30 days after a student applies, beginning in March.
2. Transfer Credit Evaluations: Currently, the University enrolls a large number of transfer
students despite failing to provide these students with clear and timely information on the number and manner in which their previously earned credits transfer to the University. To address this deficiency, the University will invest in technology improvements that include: a web-based transfer credit simulator that offers applicants an upfront understanding of how their credits will transfer; electronic access to the course catalogs of universities across the country; a course equivalency database manager; and reciprocal course equivalencies from all regional universities to boost the University’s equivalency database. These upgrades will improve the University’s efficiency in evaluating transfer credits and support improved communication with transfer students in a way that will hopefully increase transfer conversion rates.
3. Student Ambassador Program: The University has never engaged its potentially most
effective population of recruiters—its own students. The University will implement a Student Ambassador Program with 10 student leaders who will attend open houses and other recruiting events and telephone all admitted students to encourage them to enroll.
4. College and Department Enrollment Ambassadors: The University will also make a
concerted effort to involve faculty and deans in the recruitment of prospective students. As part of the EC, each academic department will appoint Enrollment Ambassadors who will work with the admissions staff to facilitate a phone campaign to convince admitted students to enroll. These Ambassadors, along with the student leaders, will effectively triple the admissions staff and engage the entire University community in the enrollment of prospective students. To reduce the number of mistakes in admissions decisions, the faculty will be involved in the application evaluation process, especially with students “on the cusp” applying to the Flagship.
5. New Student Orientation: Finally, the University is transforming its welcome and
orientation process for new students to ensure that students who confirm their enrollment remain committed to attending. The University will host early and late new student orientation sessions and structure these sessions to meet the needs of different student populations. We will offer summer events for first-time-in-college students so they can establish a cohort experience and “welcome days” for populations with specific needs like transfer and international students. We will continue moving towards a “one-stop” enrollment model to make the admission, orientation, advising, registration, and payment process for new students as streamlined and customer-friendly.
Over the next three months, the University will be finalizing a comprehensive long-term enrollment plan that will include the following attributes:
1. Expanded recruitment of students both within and outside the District;

9
2. Continued development and implementation of the Learning University/Natural Critical Learning Environment/Capital Education model for the University to improve educational experiences for students and thereby improve retention and graduation rates; and
3. Utilization of the extensive research from social psychology and other disciplines on why some students fail and others succeed in college. The University will revamp its institutional research function to create an Office of University Statistics and Student Success (USSS) that will create a more cost effective, upgraded staff to understand why some of our students leave the University and/or face academic difficulties. Within the next year, the USSS will collect and analyze a wide variety of data on both the demographic and academic make-up of students who leave and/or face academic difficulty.
For a full discussion of enrollment strategies and tactics, please see Appendix A.

10
Section III “An analysis of all academic programs that identifies under-enrolled and under-performing
programs and an associated timeline and plan for either improving or eliminating those programs.”

11
Our revised academic approach and offerings provide a framework upon which a reinvigorated and repositioned University will arise. To improve both academic quality and institutional effectiveness, the University will begin by consolidating its programs into six broad interdisciplinary areas of focus to provide students with the skills and competencies necessary to address the major issues that the District faces. The areas of focus, or “Centers of Excellence,” will include:
Urban Sustainability, Agriculture and Environmental Science6
Engineering, Applied Science, and Technological Innovation
Health Careers7
Arts
Urban Education and the Learning Sciences
Management and Leadership for the Public and Private Sectors8
In addition to these interdisciplinary Centers of Excellence, the University’s educational efforts will be buttressed by three significant and distinctive underpinnings:
1. A strong foundation in the liberal arts through the new general education program (already in place) to help students foster deep learning, critical and creative thinking, problem-solving abilities, adaptive expertise and the capacity to learn;
2. Use of the extensive current research in how people learn to create learning environments
that will give our students a greatly enhanced chance of learning meaningfully, engaging in the learning process, realizing their competence, persisting in their studies, and gaining confidence. As successfully modeled by the School of Law’s clinical programs, we will use University-wide service and experiential learning as the foundation of the educational experience in every field, at all levels. This new model for learning will be integrated into all academic offerings and workforce training programs.
3. Use of the city as a learning laboratory to provide “A Capital Education.” We will amplify learning experiences by using our unique setting as the Nation’s Capital to make the District itself an apparatus for learning. Students will learn each discipline using problem-solving experiences focused on the District of Columbia.
The University believes that this educational paradigm will provide an educational experience beyond simply “getting a degree” and enhancing a resume. A 21st century education requires the
6 The anchor of the University’s land-grant mission. 7 Includes nursing, health care management and allied health professions. 8 Includes hospitality, green hospitality, public interest, and public service.
Creating Academic Offerings and Workforce Training that Equip our Students with Skills Necessary to Compete

12
mindset of looking outside curricular and other silos to the problem to be addressed, and it requires the ability to call forth expertise across many disciplines in order to address the problem.
The most distinctive feature of the University will be its ability to use research on human learning to improve student learning and academic success. New evidence-based research in learning calls for the creation of a Natural Critical Learning Environment (NCLE). The importance of the NCLE is rooted, in part, in the concept that students learn by problem-solving, hypothesizing about solutions to challenging problems even before they are taught about conventional approaches, and tackling real world problems while engaged in service learning. In our case, the District itself will become our NCLE as we utilize the rich resources of the city to build experiential service learning education opportunities for our students. This Capital Education will feature the use of evidence-based practices that offer cutting edge learning experiences for our students. The Capital Education will be a problem and question-based learning experience, with an emphasis on leadership, service, rational thought, problem-solving, and creativity focused on District entities and institutions, including federal agencies. Our Capital Education will be concurrently coordinated with a new Learning University approach that will be infused in the curriculum of workforce development and transfer programs at the Community College, as well as all programs (baccalaureate, graduate and professional) at the Flagship. An important feature and foundational concept of the Learning University will be that students can enter at the workforce development level and if they so desire can progress through associate, baccalaureate, graduate and professional programs with ease. They can matriculate at any level along this spectrum that they chose, or complete the entire spectrum of programs if they so desire. We call this student option a “Step-Out/Step-Up” approach to program completion. The seamless transition of associate degree recipients to baccalaureate programs, reflecting student preferences and performance, will be enhanced by the development of common general education requirements at the Community College and the Flagship, even as the Community College progresses to a branch campus and ultimately to independence. To institutionalize the integrated approach to higher education as envisioned herein, the University will undertake the following actions:
1. Developing a series of “Step-Out/Step-Up” degree programs in which students can step
out with an associate degree from the Community College after two years, or step up to a bachelor’s degree in another two years, or a master’s degree in a total of five years.
2. Expanding the Concurrent Enrollment Program at the Flagship, where students will be able to start their higher education at the beginning of their junior year in high school. They will earn credits that will satisfy both high school graduation requirements and the first two years of college by the time they would normally graduate from high school. In such a program, some students could earn a master’s degree by the time they are 21.
3. Evolving toward the issuance of competency-based credentials, based on our belief that “time to graduation” is not a useful criterion for measuring student success.
An Integrated Approach to Higher Learning: Learning University/Natural Critical Learning Environment/Capital Education
13
The implementation of the interdisciplinary focus areas and integration of different learning paradigms will necessarily mean changes in our faculty through reductions and strategic additions. The Board believes the implementation will result in a reduced number of programs, faculty and staff, and additions of new interdisciplinary courses and programs supported by more efficient organizational arrangements and better alignment with critical educational and job training needs of the District.
The Flagship program realignment will impact the University in several important ways. First, we will create more interdisciplinary work and reduce the total number of independent majors by approximately 25 and the number of departments by seven. Second, we will reduce the size of the faculty and staff by 25 positions. Third, we will use educational research to improve retention and graduation rates by providing a postsecondary education that has a sustained, substantial, and positive influence on the way our graduates will be able to think and act. We anticipate that these improvements will reduce the Academic Affairs budget by $2.5 million. At this time, there are no recommendations for program discontinuations within the Community College or the School of Law. However, by the end of the fall, we expect the Community College to redesign its general education requirements to match the streamlined program already in place in the Flagship. During the same time, the University will have in place fully articulated five-year Step-Out/Step Up programs in at least ten areas, in which students can acquire an associate degree in two years, a bachelor’s in four, a master’s degree in five, or step out at any of these three points. True to its founding legislation and its mission, the University is committed to providing affordable, accessible, and unobstructed 21st century pathways for District residents to pursue their career goals and educational aspirations – from secondary school to entry into the workforce to degree programs to careers and career advancement. For the detailed proposed program realignment plan, please see Appendix B.
Tough Choices in Academic Realignment

14
Section IV “A compensation market analysis to determine appropriate compensation levels to attract and
hold highly qualified staff and faculty and a strategy and timeline to bring salaries and wages in line with these levels.”

15
The Board understands that personnel costs, both faculty and staff, contribute disproportionately to the University’s high cost of education. The University’s faculty demographic is heavily weighted at the high end of professorial rank and seniority, which provides higher compensation, as well as generous benefits. The numbers and compensation levels of administrative staff, however, are the more significant cost driver for the University. Consequently, we expect to find important opportunities for cost savings in this area. We have already made progress in this regard (see Section VII). The Board is committed to ensuring that faculty and staff members are compensated fairly and appropriately. We also recognize that a compensation analysis must be finalized consistent with the academic realignment described in this report. At a minimum, the compensation study will align titles, job descriptions, dut ies and compensation levels across the University. The ultimate target is to align our compensation scales with those of peer institutions. It is also critical to recognize that the University must be able to retain, recognize and reward those faculty members who are effective in serving students, current in their fields, productive and capable of participating in a 21st century university learning experience. The Board is confident that the aggregate effect of these approaches to cost containment of faculty and staff will serve the University well by lowering our operating costs and producing value for our students. Independent consultants have been retained and will deliver a full report and compensation analysis by December 31, 2012.
Aligning Executive, Faculty and Administrative Support Costs to Meet our New Teaching Paradigm

16
Section V “An analysis of current and planned facilities and a revised capital spending plan that reflects
the University’s actual enrollment size and realistic enrollment projections.”

17
The Board is committed to building a physical environment that is supportive of the educational needs of our students, faculty and staff. The Board must balance that commitment with the need to manage costs of our real estate holdings in order to create value for our students. The University devotes a substantial amount of funding to the upkeep of its facilities, as evidenced in the chart below.
Direct Cost of Facilities Operations
Given the need to better manage our real estate holdings, the University has determined that the following steps are necessary in order to achieve costs savings related to our facilities: (1) the Community College campus at 801 North Capitol should be relocated back at the Flagship for the 2013-2014 academic year and (2) satellite locations at PR Harris and Backus need to be returned to the city during the 2013-2014 academic year, if not sooner.
801 North Capitol The Board has a 17-year lease obligation at 801 North Capitol. At present, we must determine whether it is in our best interest to exercise a purchase option to buy this facility by March of 2013. Failure to exercise this option will result in a higher rental costs for this property for the balance of the lease term. The rental outlay under this lease will total over $70 million during the lease term if the University fulfills its entire lease obligation. After very considerable discussion, the Board believes that the economically prudent course of action regarding 801 North Capitol is ending the leasing relationship and relocating the Community College students back to the Flagship campus. At present, Building 44 has been identified as the likely home for the Community College on the Flagship campus. We have confirmed that such a move will not by itself undermine the University’s accreditation. In fact, it recognizes that the costs imposed by 801 North Capitol Street are not sustainable for the University. The relocation of the Community College is not without costs. The University will likely incur lease termination and/or tenant assignment costs in connection with any action. Furthermore, Building 44 will need to undergo certain renovations to accommodate the
Rent Utility Janitorial Pest Control Landscaping Fire
Extinguisher Trash
Collections Contract Services Total
FlagshipVan Ness 3,785,369 1,979,859 16,290 94,475 15,000 124,450 2,700,000 8,715,443 Building 52 199,230 180,018 857 4,972 3,000 6,550 188,717 583,344 Taylor Street 140,000 140,000 Subtotal 140,000 3,984,599 2,159,877 17,147 99,447 18,000 131,000 2,888,717 9,438,787
CC Site Location Backus N/A 192,500 73,935 2,500 11,000 300 3,859 N/A 284,094 P.R Harris N/A 700,000 162,598 3,200 26,850 692 3,859 99,700 996,899 801 North Capital St 4,081,339 N/A N/A N/A N/A N/A N/A N/A 4,081,339 Airport (Hangar) 242,885 N/A N/A N/A N/A N/A N/A N/A 242,885 Subtotal 4,324,224 892,500 236,533 5,700 37,850 992 7,718 99,700 5,605,217
Total 4,464,224 4,877,099 2,396,410 22,847 137,297 18,992 138,718 2,988,417 15,044,004
Rethinking our Facilities to Provide Economic Efficiency and Maximizing Space Utilization

18
Community College. However, with potential savings of at least approximately $3 million to $4 million on an annual basis, the Board believes this is a prudent economic course of action given the abundance of excess space at the Flagship and the high operating costs associated with maintaining 801 North Capitol. Furthermore, one intangible benefit of relocating the Community College on the Flagship campus will be enhancement of the articulated pathways and continuity of course offerings between the campuses that is the subject of our academic realignment. PR Harris and Backus At this time, the costs of maintaining PR Harris and Backus are undermining the objective of having a University presence in every Ward as contemplated by the Master Plan. With maintenance costs in excess of $1.3 million a year, the University can no longer afford to hold on to these properties. Accordingly, the University believes that the best course of action is relinquishing these properties back to the District government so that the city may make use of these properties in any manner that it desires. The Board remains committed to having a presence in every Ward and will continue to seek that presence through community partnerships, student internships and other collaborations. Airport Hanger In light of the academic realignment that is occurring, the University will do a cost/benefit analysis of our aircraft academic offerings. If it is determined that the uniqueness of that program cannot justify its costs, the University will terminate this course offering and the associate Airport Hangar lease.
While the Board is making substantial decisions in this area, our actions should not be viewed as backing away from our Master Plan. To the contrary, the Board believes that the University must both grow and invest in its real estate infrastructure. We are proud of new LEED-certified Student Center that is presently under construction, the renovation of Dennard Plaza, our renovated Natatorium, our newly refurbished School of Law and School of Business and Public Administration, and a host of other improvements. The Master Plan proposes construction of residence halls to serve much needed recruitment purposes. Student housing at other institutions improves student retention by providing an enhanced engagement in campus community life. Furthermore, student residence halls typically support their own costs. Accordingly, once the University has better contained its costs, we look to aggressively move on implementing our Master Plan in a manner that services the Flagship, the Community College, and the School of Law.

19
Section VI “A tuition analysis and timeline to bring tuition more in line with actual costs associated with a
student’s education, with a particular emphasis on the non-District resident tuition rates, including the metro-area resident rate.”

20
The Board is very concerned about maintaining a quality, affordable system of public secondary education in the District9
In formulating its prospective policies regarding tuition and right-sizing, the Board reviewed what actions it has taken at the University over the last twelve months in relation to tuition levels. During FY12, and at the behest of the Council, the Board approved resolutions to make tuition adjustments for the University as follows:
. In order to maximize District enrollment in the University, the University charges a different tuition rate based on the degree level and residence status of student. This tuition pricing gives preferential pricing to District residents over non-District residents in all areas of the University
• Flagship Undergraduate and Graduate: In fall 2012, the tuition rate increased by 4% and will increase at an annual rate of Consumer Price Index (CPI) +1% thereafter.
• Community college: The metropolitan area tuition rate increased by 68% in fall 2012
and all other non-District resident student tuition rates increased by 183% in the fall 2012. Beginning in fall 2013, tuition rates for all students at the Community College will increase at an annual rate of CPI+1%.
• School of Law: The tuition rate increased 20% in fall 2012.
By implementing the CPI+1% annual increase, the University sought to avoid sporadic, significant tuition increases, and instead implement consistent, incremental increases. The Board made this decision with the goal of better aligning tuition rates with the market while retaining the competitiveness of the University. All tuition rates will be reviewed on an annual basis by the Board in order to monitor the University’s tuition framework to verify that our pricing is creating value for students.
Like all institutions of higher learning, the University struggles with balancing the need for tuition revenue with the need for providing quality education in a competitive academic marketplace. Much like its public counterparts, the University utilizes tuition price differentiation in making tuition pricing determinations. However, as explained below, differential pricing alone cannot fully account for the costs of providing an education with the costs that students can pay to receive that education. Approximately 38% of University students are non-District residents including metropolitan area students. These groups of students contribute about 60% of the total tuition revenue. Our data show that the current non-District resident student tuition rate is already very close to the direct 9 As reflected on Appendix VI-1, the University is proud that relative to our educational counterparts, our tuition price is low.
Creating and Reinforcing Our Educational Value Proposition in our Tuition Pricing Structure
Balancing the Need for Tuition Revenue Against a Commitment to Accessibility

21
instructional cost for the majority of non-District residents students, especially at the Flagship and School of Law. Accordingly, if non-District students are charged at the fully-allocated cost per full time equivalent at this time, the University will likely lose a large number of non-District students and a significant percentage of their $18 million tuition revenue. Such a loss would significantly increase the cost per full time equivalent to the remaining students - mainly District residents - and create significant additional fiscal pressures on the University. The chart below compares the University tuition and fees with the cost per full time equivalent for 2011. The chart reveals that the University average cost per student in FY2011 was $26,809 per full time equivalent10
Cost per Full Time Equivalent Student, FY2011
.
The following chart isolates both the direct cost in academic/academic support programs and the shared cost of student services and other administrative services for FY2013. Key factors influencing our per student are total operational revenue, expenditures and overall enrollment.
Tuition and Fees, Costs, Per Student, FY1311
10 This differs from the Attain Report in that it shows the true cost of education excluding restricted-use federal, private, and the intra-district grants.
11 Fall 2012 full time equivalent enrollment data have not been finalized.
Enrollment FTE Headcount% of Shared
Services¹CC 1,684 2675 33%Flagship (Undergraduate+Graduate) 1,978 2,843 60%Law School 310 337 7%Total 3,972 5,855 100%
Unrestricted Cost Direct Cost Shared Cost TotalCC 17,888,611 15,868,319 33,756,930Flagship (Undergraduate+Graduate) 32,307,263 28,851,489 61,158,752Law School 8,202,684 3,366,007 11,568,692Total 58,398,558 48,085,815 106,484,373
Unrestricted Cost / FTE Direct
Cost / FTEShared
Cost / FTETotal
Cost / FTECC 10,623 9,423 20,046Flagship (Undergraduate+Graduate) 16,333 14,586 30,919Law School 26,460 10,858 37,318Total 14,703 12,106 26,809
22
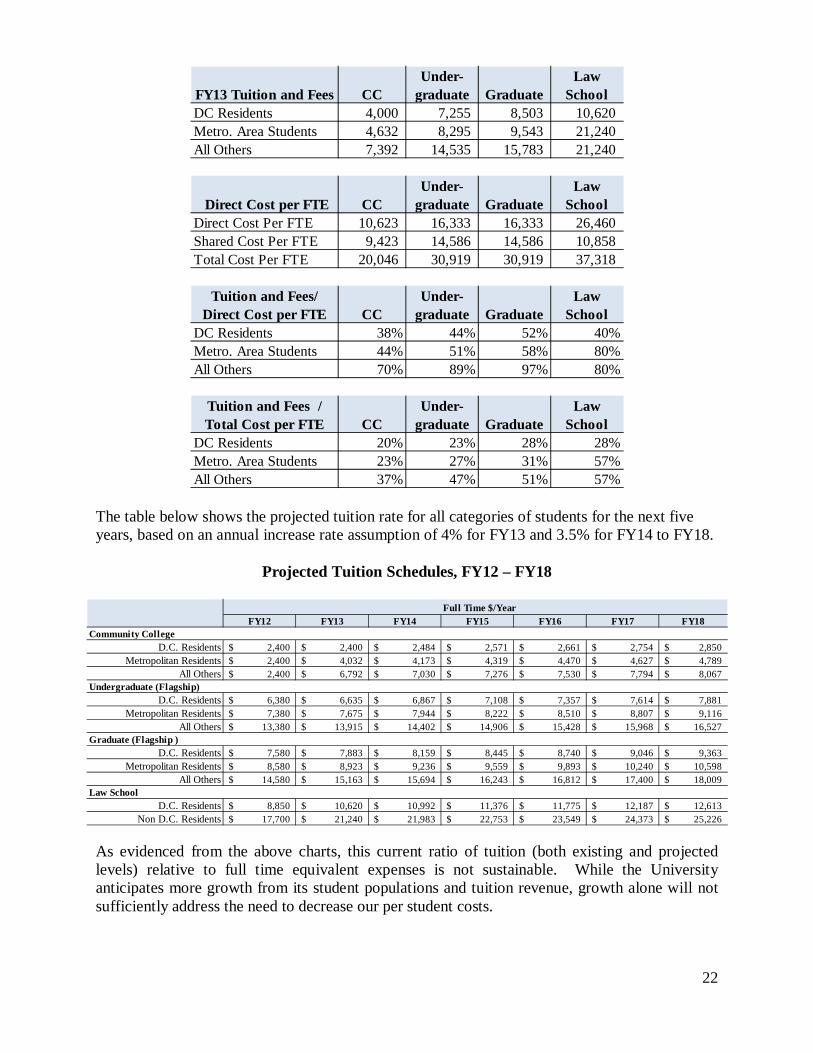
The table below shows the projected tuition rate for all categories of students for the next five years, based on an annual increase rate assumption of 4% for FY13 and 3.5% for FY14 to FY18.
Projected Tuition Schedules, FY12 – FY18
As evidenced from the above charts, this current ratio of tuition (both existing and projected levels) relative to full time equivalent expenses is not sustainable. While the University anticipates more growth from its student populations and tuition revenue, growth alone will not sufficiently address the need to decrease our per student costs.
FY13 Tuition and Fees CCUnder-
graduate GraduateLaw
SchoolDC Residents 4,000 7,255 8,503 10,620 Metro. Area Students 4,632 8,295 9,543 21,240 All Others 7,392 14,535 15,783 21,240
Direct Cost per FTE CCUnder-
graduate GraduateLaw
SchoolDirect Cost Per FTE 10,623 16,333 16,333 26,460 Shared Cost Per FTE 9,423 14,586 14,586 10,858 Total Cost Per FTE 20,046 30,919 30,919 37,318
Tuition and Fees/ Direct Cost per FTE CC
Under-graduate Graduate
Law School
DC Residents 38% 44% 52% 40%Metro. Area Students 44% 51% 58% 80%All Others 70% 89% 97% 80%
Tuition and Fees / Total Cost per FTE CC
Under-graduate Graduate
Law School
DC Residents 20% 23% 28% 28%Metro. Area Students 23% 27% 31% 57%All Others 37% 47% 51% 57%
Full Time $/YearFY12 FY13 FY14 FY15 FY16 FY17 FY18
Community CollegeD.C. Residents 2,400$ 2,400$ 2,484$ 2,571$ 2,661$ 2,754$ 2,850$
Metropolitan Residents 2,400$ 4,032$ 4,173$ 4,319$ 4,470$ 4,627$ 4,789$ All Others 2,400$ 6,792$ 7,030$ 7,276$ 7,530$ 7,794$ 8,067$
Undergraduate (Flagship)D.C. Residents 6,380$ 6,635$ 6,867$ 7,108$ 7,357$ 7,614$ 7,881$
Metropolitan Residents 7,380$ 7,675$ 7,944$ 8,222$ 8,510$ 8,807$ 9,116$ All Others 13,380$ 13,915$ 14,402$ 14,906$ 15,428$ 15,968$ 16,527$
Graduate (Flagship )D.C. Residents 7,580$ 7,883$ 8,159$ 8,445$ 8,740$ 9,046$ 9,363$
Metropolitan Residents 8,580$ 8,923$ 9,236$ 9,559$ 9,893$ 10,240$ 10,598$ All Others 14,580$ 15,163$ 15,694$ 16,243$ 16,812$ 17,400$ 18,009$
Law SchoolD.C. Residents 8,850$ 10,620$ 10,992$ 11,376$ 11,775$ 12,187$ 12,613$
Non D.C. Residents 17,700$ 21,240$ 21,983$ 22,753$ 23,549$ 24,373$ 25,226$

23
Recognizing this imbalance, certain actions have been taken and/or are recommended to address this challenge. While no one action will resolve this issue, the collective results of these actions should start a process which will bring per student costs more in alignment with our academic counterparts. These actions include the following:
1. The newly approved CPI+1% tuition increase will gradually bring the tuition rate closer to the total cost per FTE while maintaining the competiveness of affordability on the market.
2. The University will implement an effective enrollment strategy to increase strategically the overall enrollment, which in turn lowers the cost per full time equivalent. Assuming the University is able to control the budget at current or lower levels and increase enrollment by 2% a year, by FY17, the non-District student tuition rate will be approximately 65%-70% of the cost per full time equivalent student.
3. As part of the University right-sizing plan, the University is developing a cost reduction
plan, which will help decrease the cost per full time equivalent. The cumulative reductions in our facility outlays, academic realignments and personnel actions should dramatically decrease our annual operating costs such that University costs will be able to better align with appropriate counterparts.
Finding the Right Tuition Prices While Right-sizing
24
Section VII “A staff and faculty reduction strategy and timeline, including an assessment of the initial and subsequent budgetary impacts of implementing this strategy.”
25
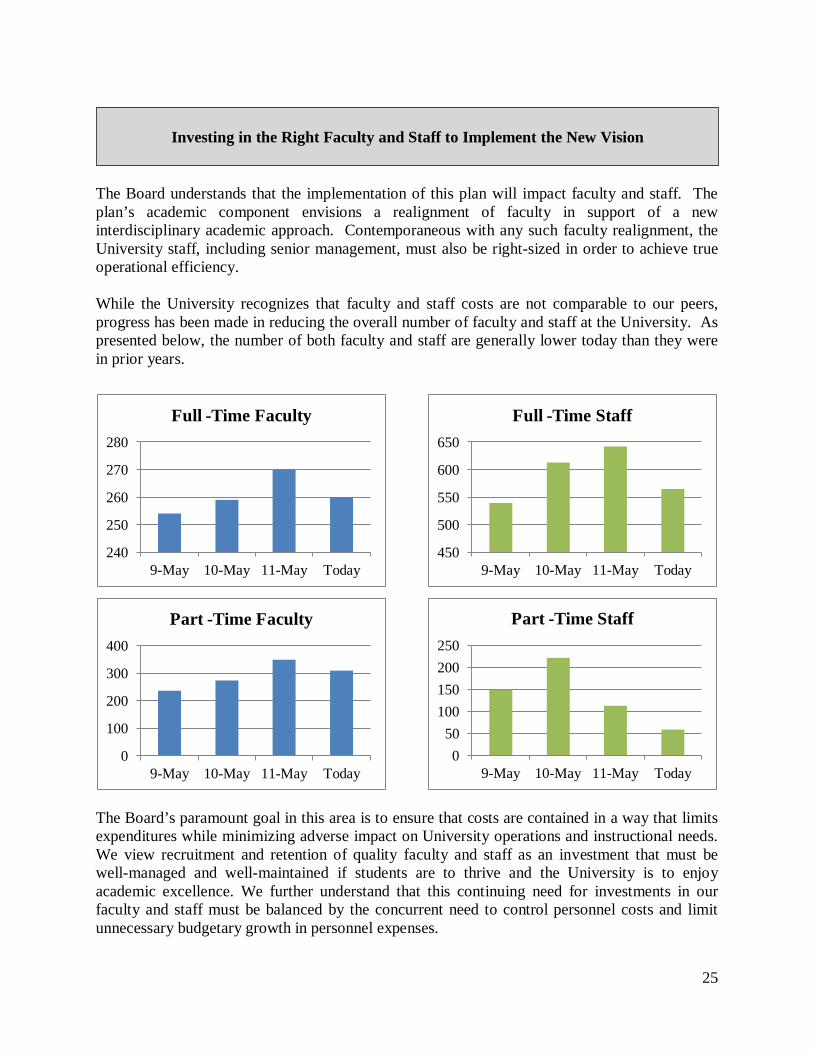
The Board understands that the implementation of this plan will impact faculty and staff. The plan’s academic component envisions a realignment of faculty in support of a new interdisciplinary academic approach. Contemporaneous with any such faculty realignment, the University staff, including senior management, must also be right-sized in order to achieve true operational efficiency. While the University recognizes that faculty and staff costs are not comparable to our peers, progress has been made in reducing the overall number of faculty and staff at the University. As presented below, the number of both faculty and staff are generally lower today than they were in prior years.
The Board’s paramount goal in this area is to ensure that costs are contained in a way that limits expenditures while minimizing adverse impact on University operations and instructional needs. We view recruitment and retention of quality faculty and staff as an investment that must be well-managed and well-maintained if students are to thrive and the University is to enjoy academic excellence. We further understand that this continuing need for investments in our faculty and staff must be balanced by the concurrent need to control personnel costs and limit unnecessary budgetary growth in personnel expenses.
Investing in the Right Faculty and Staff to Implement the New Vision
0 50
100 150 200 250
9-May 10-May 11-May Today
Part -Time Staff
450
500
550
600
650
9-May 10-May 11-May Today
Full -Time Staff
240
250
260
270
280
9-May 10-May 11-May Today
Full -Time Faculty
0
100
200
300
400
9-May 10-May 11-May Today
Part -Time Faculty

26
We must acknowledge that the growth in faculty and staff positions is less in academic areas than it is in the executive, administrative and managerial areas. In fact, when comparing the University with the national average, we find that we are 88% higher than the national average for all employees and 315% above the national average for administrative, executive and managerial staff.12
The following actions are presently in process or will be initiated in order to right-size our executive, administrative and managerial staff as well as faculty:
1. The University will complete both an internal review of senior management staffing needs and conduct a deep dive in the academic organizational structure in order to compress the hierarchal structure of the University.
2. As a result of compressing our hierarchal structure, we will also better align executive, administrative and managerial positions with the academic profile of the University.
3. The University will initiate a comprehensive programmatic review of academic offerings at the University, including how general educational requirements are taught, costs savings associated with where they are taught, and matching faculty to the teaching needs of general education offerings.
4. By spring 2013, the University will finalize a comprehensive programmatic review of all academic offerings at the Community College that will further identify under-enrolled and under-performing offerings and work force training options.
5. The University will realign, reassign, staff and faculty to meet both the growing needs of the Community College and the University-wide interdisciplinary approach identified in this report, based on our internal findings and right-sizing requirements.
At present, the net financial effect of faculty and staff right-sizing suggested by this report is not quantifiable because: (1) additional staffing decisions and non-personnel related actions may be needed; and (2) litigation expenses from legal challenges to any action that the University takes regarding faculty and staff repositioning are unknown at this time. The Board has determined that the right-sizing envisioned under this plan will produce savings. The following pro forma shows the estimated savings and revenue projections from the right-sizing initiatives.
12 Zaback, Staffing Trends in Public Colleges and Universities - A National Analysis 2001 – 2009, State Higher Education Executive Officers, May 23, 2011.

27
Right-Sizing Pro Forma of Savings and Revenue13
13 See Appendix E for the key assumptions of the pro forma.
Pro Forma FY13 FY14 FY15 FY16 FY17 FY18Recurring Expenditure
Proj. Base Expenditure 104.9 101.3 95.1 97.2 99.5 101.8Inflation 1.0 2.5 2.4 2.4 2.5 2.5Mandated CC Additional 3.0PS Savings - Academic Programmatic Realignment and Reduction (1.2) (1.3)PS Savings - Personnel Realignment (6.8) (3.0) 0.0 0.0 0.0 0.0UDC Foundation Scholarships and other Contribution 0.1 0.01 0.01 0.01 0.01 PS Savings from Comp Study (0.2) (0.2) (0.2) (0.2) (0.2)CC Facility Savings (5.5)Add'l Op Cost for Van Ness 1.0IT System Operations 0.35 0.3
Subtotal Recurring Expenditure 101.3 95.1 97.2 99.5 101.8 104.2
One Time Right Sizing ExpenditureSeverance Payment 4.0One time moving cost - CC 11.1IT Infrastructure Update 2.2Students Recruitment 1.0Contingent Liability for Labor 1.7Legal, HR, and other consulting 1.0 0.5 0.5 0.5 0.5 0.5
Subtotal one time right sizing cost 21.0 0.5 0.5 0.5 0.5 0.5
Total Unrestricted Expenditure 122.2 95.6 97.7 100.0 102.3 104.7
Revenue FY13 FY14 FY15 FY16 FY17 FY18Local Appropriation
Base Local Appropriation 65.1 65.1 67.2 69.4 71.6 73.9Inflation Adjustment 0.0 1.6 1.7 1.7 1.8 1.8Severance Funding 4.0One Time Rightsizing Suppor t 17.0 0.5 0.5 0.5 0.5 0.5
Subtotal Local Appropriation 86.1 67.2 69.4 71.6 73.9 76.3
UDC Self Generated RevenueTuition
Base Tuition Revenue 26.5 26.5 28.2 29.9 32.3 35.6Add' l Revenue from Tuition Increase 0.9 0.9 1.0 1.0 1.1Add'l Revenue from Enrollment Increase 0.8 0.8 1.4 2.2 2.4
Subtotal Tuition 26.5 28.2 29.9 32.3 35.6 39.2
FeesBase Fees 4.3 4.3 4.3 4.3 4.3 4.3Add'l Fees Revenue from Enrollment Increase 0.1 0.1 0.2 0.3 0.3
Subtotal Fees 4.3 4.4 4.4 4.5 4.6 4.6
Aux and Other Revenue 5.7 5.8 6.0 6.1 6.3 6.4UDC Foundation Scholarships and other Contribution - 0.1 0.1 0.1 0.1 0.1
Subtotal Self Generated Revenue 36.5 38.6 40.5 43.1 46.7 50.4
Total Revenue 122.6 105.8 109.9 114.7 120.6 126.7
Budget Summary FY13 FY14 FY15 FY16 FY17 FY18Revenue 122.6 105.8 109.9 114.7 120.6 126.7Expenditure 122.2 95.6 97.7 100.0 102.3 104.7Rev - Expen./FB Accrual 0.3 10.2 12.1 14.7 18.3 22.0

28
As shown in the pro forma projections, the University’s financial health has the potential to significantly improve upon implementation of the right-sizing initiatives contained herein. For example, currently the University experiences a cost per full time equivalent that is 66% higher than its peer group. The initiatives contained in the right sizing plan will reduce the cost per full time equivalent to 25% higher than its peer group by FY18. We believe these goals are reasonable and better reflect the University’s location in a relatively higher cost area-an issue that many of the peers identified by others do not have to contend with in managing their costs. We also believe that our actions in connection with right-sizing will help shore up our Fund Balance. As reported in the Attain Report, institutions of the size of the University should have a fund balance in the $50 million range. The University’s declining Fund Balance is a source of continuing concern for the long term sustainability of the University. As demonstrated in the revenue minus expense line below of our pro forma, the Fund Balance could grow by up to $50 million in four years assuming all the savings and revenue projections are realized. These potential savings will do much to addressing the urgency around this issue and chart a course of sustainability in this area.

29
Summary and Conclusion
30
This right-sizing plan represents only our first step in what will be a process of continuous improvement. The Board has outlined an ambitious framework covering many areas to achieve a right-sized University. Some action items can be done immediately, while others will have a longer timeline for implementation and/or will impose costs. We believe the action plan contained in this report is an ambitious yet realistic, transformative end goal for the University. The Board is committed to ensuring follow-through on the recommendations contained in this report and will, with buy-in from the District’s leadership, persist in the execution of the programmatic, managerial and financial strategies necessary to build a strong, sustainable University. Our work does not stop with the actions described in this document. In connection with our right-sizing plan, we will engage in certain actions that we believe will facilitate the long term success of the University. These actions will include the following:
1. Consult regularly with stakeholders so that the University is better attuned to government, community and student/faculty/staff needs. We will create mechanisms to receive input from internal and external stakeholders as we engage in right-sizing. We will communicate our findings, be deliberate in our decisions, and acknowledge success and challenges with regularity and simplicity.
2. Engage in a re-branding/marketing communications plan that enhances recruitment
efforts, promotes fundraising and celebrates University successes. We will highlight our academic gains, celebrate our student accomplishments and recognize our outstanding faculty and staff who enable us to succeed.
3. We will identify those regulatory constraints that burden our ability to act as an institution of higher learning and propose changes as needed.
4. We will provide oversight in a way that helps the University manage expenses and
creates a budgetary platform conducive to achieving right-sizing goals outlined herein. In short, we are committed to doing our part. At the same time, we need the support of the Council and the Mayor in order to accomplish the outcomes that we all want and need for long term success. Specifically, we need support from the District government in the following areas:
1. We need the continued support of city leadership. Although we are right-sizing for an unspecified period in the near future, the University must be and will be open for business and doing its business of providing a quality education for our students. We need to know upfront and often that we will have the support of our local leadership as we embark on this journey.
Conclusion: Right-Sizing, A Journey Requiring Stakeholder Support and Patience

31
2. We will need a financial commitment from the District to offset the one-time right-sizing costs of the University.
3. We need patience and acknowledgement that there must be an implementation window to
allow right-sizing. The University will not change overnight. The process of change will be the Board’s singular overriding focus informing all decision points.
We cannot guarantee that actions relating to our faculty and staff alignment or other action areas outlined herein will not result in litigation. Our goal is to be fair, efficient and to avoid disruptions to our academic operations as we make decisions in this regard. The challenge before the Board is immense. But we are committed to giving steadfast devotion to the rightsizing effort needed to ensure its success. We will organize and align in a way that demonstrates the inherent value proposition we have as being the only public, HBCU and land grant institution in the District. It is our intent to deliver on our commitment of ensuring that the University is sustainable and viable for years to come. Our graduates, new and emerging partners and government funders will recognize that a degree from the University of the District of Columbia has value. At the end of the day, the University must be preserved for those who need the availability and accessibility of a public institution of higher learning that the University was created to deliver.
32
Appendix A – Enrollment Plan
I. New Student Enrollment Plan Overview The University is engaged in a comprehensive rightsizing initiative, including the development of a long-term strategic enrollment management plan by a University-wide Enrollment Committee (EC), which will address new and continuing student retention, financial aid, academic offerings, and support services. In the meantime, the University has crafted a short-term enrollment plan designed to produce a substantial increase in new student enrollments in the next 12 months.
a. Recent Enrollment History From 2005 to 2008, total enrollment declined by over 11% to its lowest level since 1997. In 2009, the University created the Community College and repositioned the Flagship; as a result, from 2008 to 2010, new student enrollments increased by almost 15% per year (“normal” annual University enrollment growth is approximately 3%) and total University enrollment increased almost 20% to its highest level in over 15 years. In fall 2011, the University was unable to sustain its increasing enrollment trajectory, which illuminated some key challenges that had received insufficient attention amidst rapid enrollment growth, including:
1. Given the academic preparation of District public high school graduates and the large
cost difference between the Community College and Flagship, the University’s enrollment growth was concentrated within the Community College while new student enrollments at the Flagship declined between 5% - 10% per year;
2. An admissions function that was not staffed or equipped appropriately to strategically
recruit new students or to handle a sharp increase in admissions applications;
3. An applicant pool with a tenuous commitment to higher education, and as a result, a high application incompletion rate that limited the number of students who were admitted and could ultimately enroll, particularly at the Flagship14
;
4. More broadly, the inception of the Community College challenged the Flagship to sharpen its target student focus, develop a more professional admissions operation, and to work with the District government to position the University as a more viable player in the city’s higher education strategy.
14 According to National Student Clearinghouse data, 50% of students who applied to the University in 2009 but chose not to enroll at the University did not ultimately enroll at any higher education institution
New Student Enrollment Strategies and Tactics

33
b. Enrollment Planning and Accomplishments to Date
The University has already engaged in a host of enrollment management planning and academic improvement initiatives designed to jumpstart its enrollment growth trajectory, including the following:
• Developing a comprehensive admissions, enrollment, and retention data profile on the University, its competitors, and the external marketplace so the University can make strategic data-driven decisions;
• Conducting a thorough review of all academic programs; eliminated low performing
programs; and established a revamped, innovative General Education program; • Creating an EC and conducted an enrollment Strengths, Weakness, Opportunities,
and Threats analysis to identify strategic opportunities and threats to expanding the University’s enrollment;
• Overhauling the Office of Admissions including the hiring of new staff and
experienced leadership, and implemented state-of-the-art business processes and accountability systems; the Office of Financial Aid is now undergoing a similar transformation;
• And, perhaps, most important, developing a comprehensive plan for creating new
kinds of learning experiences based on the Learning University, Natural Critical Learning Environment, and the Capital Education model that promises both to attract more students and retain higher numbers of them.15
While many of these efforts are expected to bear fruit primarily over the long-term, the University has already experienced an immediate impact in fall 2012 compared to fall 2011, including an almost 10% increase in applications; a 36% increase in application completion rates; an over 30% increase in offers of admission; and a 10% increase in new student enrolments. II. New Student Enrollment Plan Assumptions and Goals The University’s new student enrollment plan for 2012-2013 builds upon the momentum of recent accomplishments, and is guided by the following assumptions:
a. Given that the University already receives a large volume of admissions applications and that 60% of admitted students enroll (compared to an average of 40% at other public universities), the University can most efficiently increase enrollment by increasing its application completion/offer rate.
15 See Section III for a full discussion of the Learning University/Natural Critical Learning Environment/Capital Education model.

34
b. To increase enrollment from within the district and metropolitan area, the University
must increase its enrollment from outside the region, thereby creating a diverse and robust intellectual community that will be more beneficial for all students and more attractive to potential students within the district. The recruitment plan will target students locally, nationally, and internationally. 1. Already more than thirteen percent of the University students come from outside the
United States and with the contacts currently being established by the Director of International Programs and Exchange, the University is building foundations for continued growth of this student population. The University’s Diplomatic Neighborhood Initiative has established opportunities for a growing number of students coming to the University with scholarship support from their own country. Most of those students will enter the Flagship.
2. Within the United States, the University has an opportunity to expand its recruitment
among community college graduates from across the country. The Office of the Provost has already established close ties with more than thirty large community colleges in Cleveland, Dayton, Dallas, Fort Worth, California, Florida, and elsewhere and the recruitment plan will exploit those ties. As the Community College produces more graduates, the opportunities expand locally.
3. Geographically, New Jersey offers some of the greatest potential growth of first-time-
in-college students. With a large population and annually among the highest rates of college attendance in the country, New Jersey produces large numbers of college students. In recent years, more than half of that population has gone outside of the state to attend college, and many of those students are already coming to the Washington area. The recruitment plan will focus on states with the highest college going rates.
c. Similarly, the University already receives an unusually high proportion of applications
and new student enrollments from transfer students and readmits, and can increase its share of these markets by better engaging/supporting these populations.
d. Currently, despite its sizeable contribution to the postsecondary education of District high
school graduates, the University does not have strong partnerships with DCPS, the Charter School Board, OSSE, and the District government. A more intentional effort to work with these parties to identify, engage, and enroll students who might not consider attending college if not for the University could lead to a substantial increase in new student enrollments as well as in higher education participation rates for the District overall.
Consistent with these assumptions, the University has identified the following priority admissions application and new student enrollment goals for spring 2013 and fall 2013:
a. Increase the completion rate of all applications from historical averages of 40% for the

35
Flagship and 60% for Community College to 50% and 66% respectively;
b. Maintain enrollment conversion rates of 60% or higher for all students offered admission;
c. Increase new student enrollments by 10% - 15% compared to the previous three-year average, including 400 - 500 new Flagship students and 800 - 900 new Community College students for spring 2013 and 700 - 800 new Flagship students and 1,100 – 1,200 Community College students for fall 2013; and
d. Grow the number of U.S students from outside the metropolitan area by at least 25 to 40 a year in the fall of 2013 and 2014 and 100 to 150 per year in each fall thereafter.
III. New Student Enrollment Strategies and Tactics
a. Cultivate a More Viable Applicant Pool The University still receives over 10,000 applications for admission a year. While this attests to the University’s enrollment potential, the high proportion of applications that are incomplete hampers the University’s ability to maximize the enrollment potential of its applicant pool. Thus, the University’s first key enrollment strategy is to recruit more actively those students who, as suggested by historical data, are the most likely to complete their applications and enroll at the University. We will also recruit from community colleges across the country to grow the number of applications coming from those institutions Target student populations for this initiative and related recruitment tactics include:
1. Community College Graduates: The University will strive to at least double the rate of Community College graduates who attend the Flagship through the following tactics: • Automatically notify all Community College students who apply for graduation of
their admission to the Flagship without these students even submitting an application; and
• Enhance this “automatic admissions” effort with a series of recruiting events on the Community College campus for second year and graduating Community College students to explain the benefits of the Flagship and facilitate “on-the-spot” enrollment.
2. First-Time-in-College-Students from the District and Maryland: The overwhelming
majority of first-time-in-college students who enroll at the University are from the District and Maryland; concentrated from 10-15 high schools; and earned GPAs between 2.0 and 3.0. To increase the number of applicants from these sources, the University will employ the following strategies: • Attend high-yield college recruitment fairs for first-time-in-college students in the
region;

36
• Develop recruitment partnership at the school level, and relationships at the
individual level with the principals, counselors, and college advisors at the identified target high schools to specifically identify, recruit and enroll viable candidates;
• Partner with OSSE/DCPS to host a District college recruitment fair specifically for the University;
• Assemble an Advisory Board of key higher education stakeholders in the District, including DCPS, OSSE, the Charter School Board, City Council, and Mayor’s Office, to advise the University on how to improve its recruitment and enrollment of new students.
3. Transfer Students from Regional Institutions: The University receives a large number of
transfer students from Prince George’s and Montgomery Community College, and to a much lesser extent, other two and four year colleges in the region. To target this population, the University will: • Attend regional transfer student college recruitment fairs;
• Develop broad credit articulation agreements with Prince George’s and Montgomery
College as further incentives for their students to apply to the University;
• Schedule an aggressive calendar of recruitment events on-site at both colleges.
4. Prior Students and Applicants: Given that many University students are older and part-time, they often start and stop their education multiple times. These former students, as well as previous applicants who didn’t enroll at the University, already have a demonstrated interest in the University and reapply in large numbers every year. To bring these students back into the University, we will: • Intentionally and aggressively recruit former students and prior applicants through a
targeted email, phone, social media, and marketing communication plan;
• Implement and advertise a new “fresh start” policy directed at former students whereby previous courses completed with a grade of D or F will remain on a student’s transcript but not calculated in the student’s GPA.
5. Nontraditional Students (25 and older): While the University receives a majority of its
applications from traditional students, the Flagship has a higher yield with nontraditional students, and enrolls a higher proportion of nontraditional students than the majority of its competitors. Additionally, the University outperforms many other institutions in the number of students who ultimately earn degrees relative to the University’s student population in large part due to the degrees awarded to nontraditional students. To ensure productive outreach to nontraditional students, the University will:

37
• Revamp the University website—the most important tool for recruiting--to focus on engaging prospective students and to reflect web design, architecture, and optimization best practices;
• Develop recruitment partnerships with five to ten churches, nonprofit organizations, advisory neighborhood commissions, and other key community groups in the District.
6. Community College Graduates from Other Areas: We will expand the contacts already
established with leadership at some of the largest community colleges in the country, develop the specific elements of the Capital Education and Natural Critical Learning Environment Model, and utilize those elements to build recruitment partnerships with those institutions and build a pipeline of students from those institutions.
The University will complement these recruitment activities with its largest ever investment in population-specific open houses and direct admission events for first-time-in-college, transfer, readmit, nontraditional, and first generation students. On a monthly basis, the University will host well-funded and marketed open houses; “On-the-Spot Admissions and Transfer Credit Evaluation” events; “Returning Students: Welcome Back” days; informational/application assistance sessions; and “What the Best College Students Do” fairs.
b. Increase Application Completion Rates The University’s second key enrollment strategy is to implement application processing and applicant communication improvements that will increase the application completion rate. While some students who apply to the University may never intend to enroll, many applicants might attend the University if we were able to assist them in completing their application and provided more encouragement and support during the admissions process the University will employ the following tactics to advance this goal:
1. Transcript Requests: In fall 2012, 85% of all first-time-in-college students who submitted their transcripts to the University completed their admissions application. The University has developed formal agreements with both DCPS and the Charter School Board that the University can directly request the transcripts of all District first-time-in-college students who give the University permission to do so on their application. In the fall 2012, over 1,400 applicants provided the University with this permission; yet, due to staffing changes and poor communication with schools, the University only obtained a third of these transcripts. With new staff and a commitment to partnering with local schools, the University will seek to obtain at least 50% of all transcripts where it has received student permission, and thereby substantially increasing offers of admission, and ultimately, enrolled students.
2. Communication Plan: The University is finalizing a comprehensive communication plan that encompasses a fixed schedule of emails, phone calls, marketing activities, and social media outreach to applicants at every stage of the admissions funnel. The University will complement this effort with increased training and accountability on customer service for Admissions staff; a new phone system; live web chats; a more tailored and engaging

38
website; and a reorganized Admissions staff designed to provide applicants with a personalized admissions experience.
3. Technology and Data Improvements: The Admissions Office has now achieved a basic level of proficiency with Banner (the University’s new MIS such that it can employ advanced functionality such as the Banner communication plan, Quick Admit, and letter generation features to provide students with more timely responses on their application status. The University has also invested in a tool known as Blackboard Analytics that will allow the University to produce detailed data on admission outcomes, and will rigorously examine this data to track progress on enrollment goals and to hold staff accountable for their assigned caseloads.
c. Increasing Enrollment Conversion Rates
While the University already benefits from a high enrollment conversion rate, the University’s third key enrollment strategy is to implement a series of tactics that could further improve this rate:
6. Financial Aid Packaging: The University is committed to strengthening the Office of Financial Aid and improving the timely packaging of financial aid. The Office of Financial Aid has hired a new Director, revamped its staff, and has set a target of processing and packaging financial aid for fall 2013. This process will occur within 30 days after a student applies, beginning in March.
7. Transfer Credit Evaluations: Currently, the University enrolls a large number of
transfer students despite failing to provide these students with clear and timely information on the number and manner in which their previously earned credits transfer to the University. To address this deficiency, the University will invest in technology improvements that include: a web-based transfer credit simulator that offers applicants an upfront understanding of how their credits will transfer; electronic access to the course catalogs of universities across the country; a course equivalency database manager; and reciprocal course equivalencies from all regional universities to boost the University’s equivalency database. These upgrades will improve the University’s efficiency in evaluating transfer credits and support improved communication with transfer students in a way that will increase transfer conversion rates.
8. Student Ambassador Program: The University has never engaged its potentially most
effective population of recruiters—its own students. We will implement a Student Ambassador Program with 10 student leaders who will attend open houses and other recruiting events and telephone all admitted students to encourage them to enroll.
9. College and Department Enrollment Ambassadors: The University will also make a
concerted effort to involve faculty and Deans in the recruitment of prospective students. As part of the EC, each academic Department will appoint Enrollment Ambassadors who will work with the Admissions Office to facilitate a phone

39
campaign to convince admitted students to enroll. These Ambassadors, along with the student leaders will effectively triple the Admissions staff, and engage the entire University community in the enrollment of prospective students. To reduce the number of mistakes in admissions decisions, the faculty will be involved in the process, especially with students “on the cusp” who apply for the Flagship.
10. New Student Orientation: Finally, the University is transforming its welcome and
orientation process for new students to ensure that students who confirm their enrollment remain committed. The University will host early and late new student orientation sessions and structure these sessions to meet the needs of different student populations. It will host summer yield events for first-time-in-college student so they can establish a cohort experience and will have “welcome days” for populations with specific needs like transfer and international students. The University will also continue moving towards a “one-stop” enrollment model to make the admission, orientation, advising, registration, and payment process for new students as streamlined and customer-friendly as possible.
IV. Enrollment Plan Implementation The University will ensure the successful implementation of the short-term new student enrollment plan by:
• Even despite budget limitations, increasing the budget of the Admissions Office to support marketing and recruitment materials, travel and event registration, open houses and other events, technology upgrades, and name buys and direct mailings;
• Revamping and professionalizing the staff of the Admissions Office, the Financial
Aid Office, and the Office of Student Accounts to bring positive and highly efficient customer-oriented service to the process, and looking at models from other universities for greater coordination between these offices in an enrollment management program.
• Scheduling regular meetings of the EC to share information on enrollment activities, soliciting feedback and participation from the Department and Student Ambassadors, reviewing progress reports, and identifying and addressing obstacles to plan implementation;
• Bi-weekly progress reports submitted to and reviewed with the Provost with detailed metrics related to the plan’s goals and other key enrollment objectives;
• Committing to the reorganization of the Office of Financial Aid, align financial aid and admissions processes, and guarantee the timely packaging of aid for all admitted students; and
• Outreach by the University’s leadership to DCPS, the Charter School Board, OSSE, Mayor’s Office, and City Council to begin positioning the University as a more

40
central player in the District’s higher education strategy, and to provide the high level support for the University’s on-the-ground efforts to develop recruitment partnership with high schools and civic organizations in the District.
V. Long-term Enrollment Plan Over the next three months the EC and the Offices of the President and Provost will be finalizing a comprehensive long-term enrollment plan that will include:
a. Expanded recruitment of students both within and outside the District
b. Continued development and implementation of the Learning University/Natural Critical Learning Environment/Capital Education model for the University to improve educational experiences for students and thereby improve retention and graduation rates.
c. Utilization of the extensive research from social psychology and other disciplines on why some students fail and others succeed in college. The University will revamp its Institutional Research office to create a Department of University Statistics and Student Success (USSS) that will create a more cost effective but upgraded staff to understand why some of our students leave the University and/or face academic difficulties. Within the next year, the USSS will collect and analyze a wide variety of data on both the demographic and academic make-up of students who leave and/or face academic difficulty. Such efforts will become an important part of enrollment management, increase the likelihood of academic success and retention and build a strong reputation that the University is a place where students succeed and be highly adaptive problem solvers.

41
Figure 1: Applications for Admission to the University, 2009-2012 (Fall + Spring)
0
2000
4000
6000
8000
10000
12000
2009-10 2010-2011 2011-2012
UDC-CC Applications Flagship Applications Total Applications

42
Figure 2: Applications and New Student Enrollment by Student Type, 2011-2012
0
500
1000
1500
2000
2500
3000
FTIC Transfer Readmit Intl FTIC Intl Transfer Non-Degree
UDC-CC Apps Flagship Apps UDC-CC Enroll Flagship Enroll
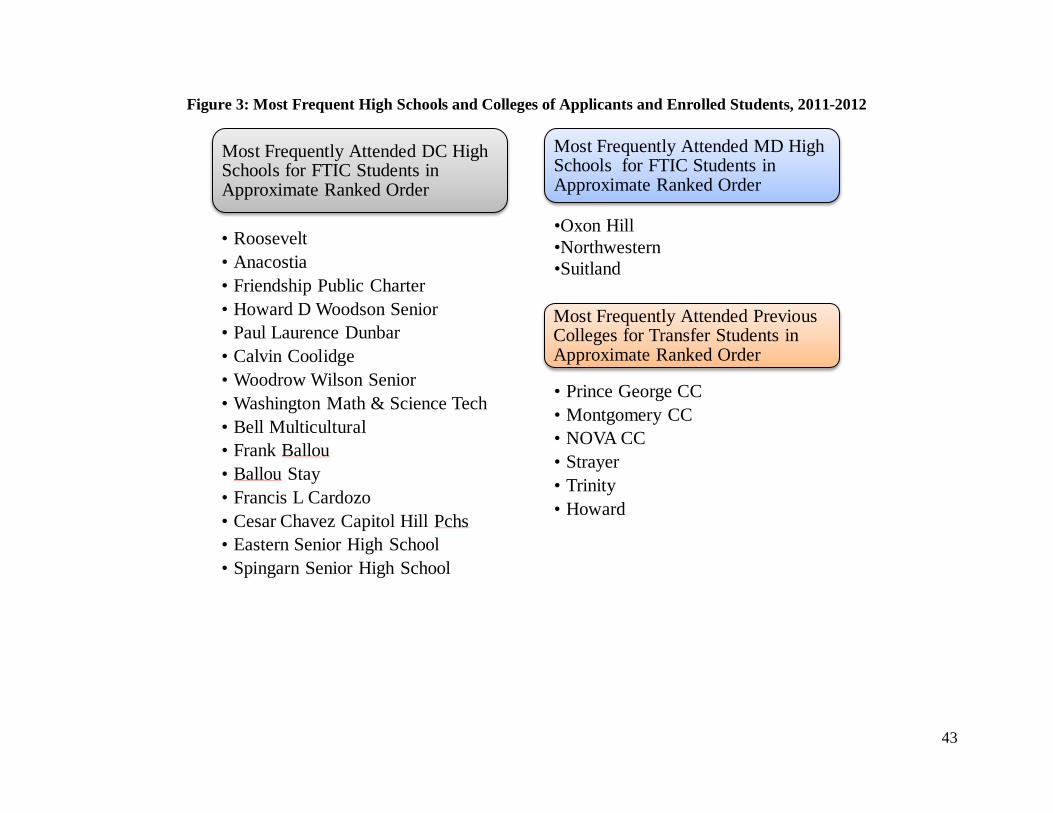
43
Figure 3: Most Frequent High Schools and Colleges of Applicants and Enrolled Students, 2011-2012
Most Frequently Attended MD High Schools for FTIC Students in Approximate Ranked Order
•Oxon Hill •Northwestern •Suitland
Most Frequently Attended Previous Colleges for Transfer Students in Approximate Ranked Order
• Prince George CC • Montgomery CC • NOVA CC • Strayer • Trinity • Howard
Most Frequently Attended DC High Schools for FTIC Students in Approximate Ranked Order
• Roosevelt • Anacostia • Friendship Public Charter • Howard D Woodson Senior • Paul Laurence Dunbar • Calvin Coolidge • Woodrow Wilson Senior • Washington Math & Science Tech • Bell Multicultural • Frank Ballou • Ballou Stay • Francis L Cardozo • Cesar Chavez Capitol Hill Pchs • Eastern Senior High School • Spingarn Senior High School
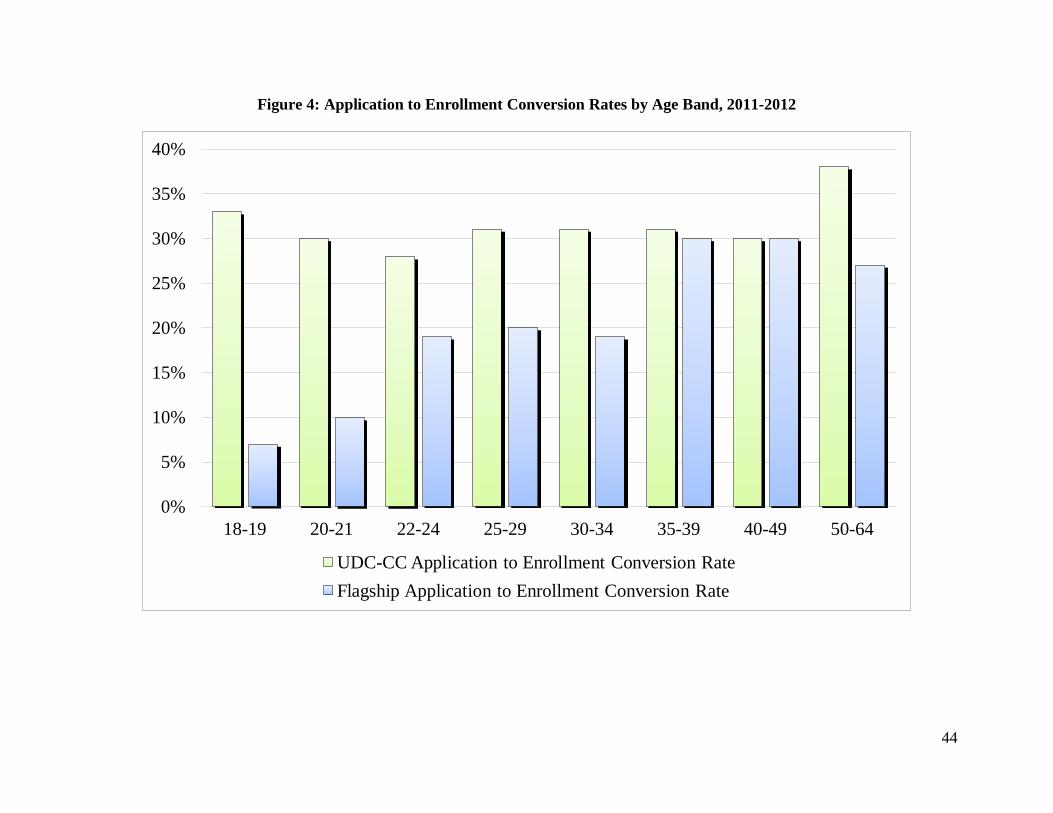
44
Figure 4: Application to Enrollment Conversion Rates by Age Band, 2011-2012
0%
5%
10%
15%
20%
25%
30%
35%
40%
18-19 20-21 22-24 25-29 30-34 35-39 40-49 50-64
UDC-CC Application to Enrollment Conversion Rate Flagship Application to Enrollment Conversion Rate

45
Figure 5: Baccalaureate Degrees Award per 100 FTE Undergraduates, 2009-1016
16University of the District of Columbia Financial Assessment and Cost Drivers, Attain, LLC, Copyright 2012, from NCES, IPEDS 2010 Graduation Rate File.
0 5 10 15 20 25 30 35 40
University of Houston-Victoria University of the District of Columbia Mansfield University of Pennsylvania
Fayetteville State University Eastern New Mexico University-Main Campus
Peer Average Francis Marion University Delaware State University
Southern University and A & M College Peer Median
Virginia State University University of Maryland Eastern Shore
Coppin State University Alabama A & M University
Lincoln University University of Arkansas at Pine Bluff
Fort Valley State University

46
Appendix B – Proposed Program Realignments
Centers of Excellence – Flagship Programs
Centers of Excellence – Community College
Centers of Excellence – School of Law
Discontinued Programs (Current and Proposed)

Centers of Excellence – Flagship Programs
47
All Programs will include a sound foundation in the liberal arts to help students learn how to learn, learn deeply, think critically, solve problems, work creatively as adaptive experts, and to live full lives.
All Programs will include service learning components to take advantage of the rich resources of the District of Columbia. *Programs that support the liberal arts foundation.
Liberal Arts and Service Learning Foundation
Art Communication Languages & Linguistics * Music (BA, BM) * Graphic Design
Arts
Nursing Social Welfare/ Social Work Exercise Science Mathematics & Statistics * Nutrition Dietetics & Food Science Cancer Biology Prevention & Control (MS) Speech Pathology (MA)
Health Careers
Architecture & Urban Sustainability Agricultural & Environmental Science Biology * Chemistry * Criminal Justice Homeland Security (MS) Cancer Biology Prevention & Control (MS) Nutrition, Dietetics & Food Science (MS) Water Resources Management (PMS)
Urban Sustainability, Agriculture and Environmental Science
Art Global Studies * Communication * Languages & Linguistics * Mathematics * Political Science * Biology * Chemistry * Music * History * Psychology & Human Development * Mathematics & Applied Statistics (MS) Teaching (MAT) Speech Pathology (MA) Counseling (MA) Early Childhood Education (MA) Adult Education (Graduate Cert.) Special Education (MA)
Urban Education
Mathematics * BS Civil Engineering (ABET) BS Computer Science (ABET) BS Mechanical Engineering (ABET) BS Electrical Engineering (ABET) Masters in Electrical Engineering Masters in Computer Science
Engineering, Applied Science and Technological Innovation
Accounting Business Administration (with functional
concentrations) Economics * Procurement & Public Contracting (Cert) Various Certificates Business Administration (MBA) Public Administration (MBA)
Management and Leadership

Centers of Excellence – Community College
48
Administrative Office Management Architectural Engineering Technology Aviation Maintenance Technology Business Technology Computer Accounting Technology Computer Science Technology Corrections Administration Education Fashion Merchandising Fire Science Technology Graphic Communications Technology Graphic Design Hospitality Management & Tourism Law Enforcement Legal Assistant Liberal Studies Medical Radiography Mortuary Science Music Nursing Respiratory Therapy Nursing Assistant (Cert) Practical Nursing (Cert) Office Technology (Cert)
Community College (AA)

Centers of Excellence – School of Law
49
Juris Doctor (JD) Master of Laws (LLM)
School of Law

50
Discontinued Programs (Current and Proposed)
Early Childhood Education (BA) Elementary Education (BA) French (BA) Graphic Communications (BA) Respiratory Therapy (BS) Sociology & Anthropology (BA) Spanish (BA) Special Education (BA) Theatre Arts (BA) Urban Studies (BA) Clinical Psychology (MS) English Composition & Rhetoric (MA) Finance (BA) Marketing (BA) Office Administration (BA) Procurement & Public Contracting (BA) Fire Science Administration (BS) Information Technology (BS) Electromechanical System Engineering (BS) Construction Engineering Science (BS) Aviation Maintenance Management (BS) Electronics Engineering Tech (BS)

51
Appendix C – Projected Fundraising and Grant Giving

52
Appendix D – Tuition Competitiveness Study The competitors were identified by assessing what universities students who applied to but did not enroll at the University ultimately attended. The rate in comparison is based on annual tuition and mandatory fee charge for full time students. Undergraduate level = 24 credit/year. Graduate level = 18 credit/year.
Community College/Associate
Universities
2010-2011 County Tuition + Fees
2010-2011 State Tuition + Fees
2010-2011 Out-of State Tuition + Fees
Allegany College of Maryland $3,303 5943 7083Garrett College 3420 7200 8370Montgomery College 4272 8304 11184Prince George's Community College 4070 6200 8840Northern Virginia Community College 4132 4132 9960University of the District of Columbia 3000 3000 3000Median 3745 6072 8605
UDC-CC FY13 3000 4632 7392

53
Undergraduate/ Baccalaureate
Universities
2010-2011 In-State Tuition + Fees (Approximate)
2010-2011 Out-of State Tuition + Fees (Approximate)
American University $36,955 $36,955Bowie State University $6,039 $16,923Catholic University of America $34,006 $34,006Central State University $8,184 $11,955Cheyney University of Pennsylvania $7,603 $16,317Coppin State University $5,441 $14,861Delaware State University $6,616 $14,238Howard University $17,333 $17,333Lincoln University of Pennsylvania $8,448 $13,310Montclair State University $10,190 $19,454Norfolk State University $9,230 $18,862North Carolina A & T State University $3,696 $13,138North Carolina State University at Raleigh $5,686 $18,226Stevenson University $22,089 $22,089Strayer University $13,705 $13,705University of Maryland Eastern Shore $6,082 $13,575University of Maryland-College Park $8,053 $24,950University of Maryland-University College $5,760 $12,702University of the District of Columbia $7,000 $14,000Virginia State University $6,547 $15,255Virginia Union University $14,213 $14,213Median $8,053 $15,255

54
Graduate/Masters
Universities
2009-2010 In-State Tuition + Fees
2009-2010 Out-of State Tuition + Fees
American University $22,696 $22,696Bowie State University $7,411 $12,901Catholic University of America $22,460 $22,460Central State University $5,022 $8,622Cheyney University of Pennsylvania $7,636 $11,650Coppin State University $5,668 $9,232Delaware State University $6,920 $14,786Howard University $15,151 $15,151Lincoln University of Pennsylvania $10,017 $16,299Montclair State University $11,155 $15,907Norfolk State University $9,688 $21,496North Carolina A & T State University $6,238 $15,814North Carolina State University at Raleigh $5,762 $9,650Stevenson University $9,085 $9,085Strayer University $7,826 $7,826University of Maryland Eastern Shore $4,460 $8,024University of Maryland-College Park $9,665 $19,475University of Maryland-University College $7,884 $12,042University of the District of Columbia $8,198 $15,200Virginia State University $7,796 $13,826Virginia Union UniversityMedian $7,855 $14,306

55
Appendix E - Key Assumptions for Pro Forma
Programmatic Realignment and Reduction
1. Reduce ~25 independent majors and 7 academic departments2. Reduce faculty and academic staff by 13 in FY13 and 12 in FY14 as result of program realignment
Compensation Market Analysis
0.3% annual savings in PS budget for FY14-FY18. Assumption will be revised accordingly once Compensation study is available.
Facilities Study 1. Programs in 801, Backus, PR Harris and Shad will be relocated to Van Ness at the end of FY132. No change to airport hangar until academic program review is finished.3. Ongoing savings includes rent, utilities, and all other operational costs will reduce the base operational budget for FY14 and will be carry over to future years. 4. One time costs includes moving expenses and spce renovation costs for Van Ness. The 801 lease termination costs are not included.
Personnel Realignment
1. P ersonnel Realignment including both staff and faculty, which started in FY12 and finishes in FY14.2. This specifc line item estimate cost savings from administrative functions only. Academic restructuring savings is shown above.3. Assume ~$4M severance funding received in FY13 for one time right sizing cost.
Tuition Restructuring
1. Includes new rate for CC and Law School in FY13.2. Assumes 2.5% annual inflation rate for future years and CPI+1% annual increase policy applies to all schools and colleges.
Enrollment Planning
Enrollment Growth Assumption:1. 3% for FY14 and FY152. 5% for FY163. 7.5% for FY17 and FY18
Increase Funding from Alumni and Corporate Sponsors
1. Assuming UDC Foundation will contribute $80K in FY14 to UDC unrestricted operational budget as scholarship. 2. Assuming 12% annual contribution increase from FY15-FY183.This amount shown includes only direct support for UDC's operating budget. Does not include grants, and other scholarships from the Foundations' corpus.
Peer School Peer school cost per FTE and local appropriation per FTE annual increase at inflation rate assumption of 2.5%
Federal Financial Aid
Federal Financial Aid is excluded in the total cost
One Time Right Sizing Cost
One time funding to suppor t rightsizing plan is excluded in the annual operations cost per FTE.
IT Infras tructure Update
Includes $500K for Telecom System Update, $500K for Cooling System for Server Room, $400K for new router and server, etc. $300K for ERP system update, and $500K for computer upgrade.