Embed Size (px)
Citation preview

University of Tennessee Center for Industrial Services
Energy Assessments “Home & Business”

Today’s Topics➢HVAC ➢Chillers and Towers ➢Lighting ➢Pumps & Motors ➢Ventilation & Fans ➢Water Conservation
➢Insulation ➢Renewable Energy
Sources ➢Solar Heating ➢Photovoltaic (solar cells) ➢Geothermal

What is Energy Assessment…..
• Help understand energy use –Home or Business – what’s the difference? – Heating & Cooling • Electrical power • Natural gas
– Lighting systems – Windows and doors – Insulation & building envelops – Significant energy users
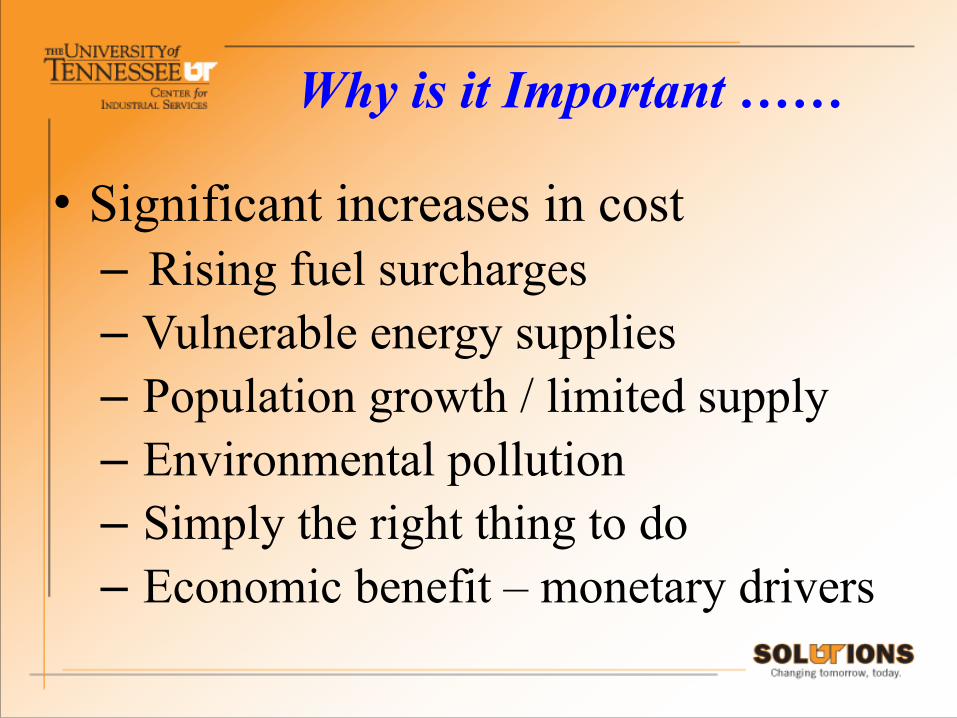
Why is it Important ……
• Significant increases in cost – Rising fuel surcharges – Vulnerable energy supplies – Population growth / limited supply – Environmental pollution – Simply the right thing to do – Economic benefit – monetary drivers
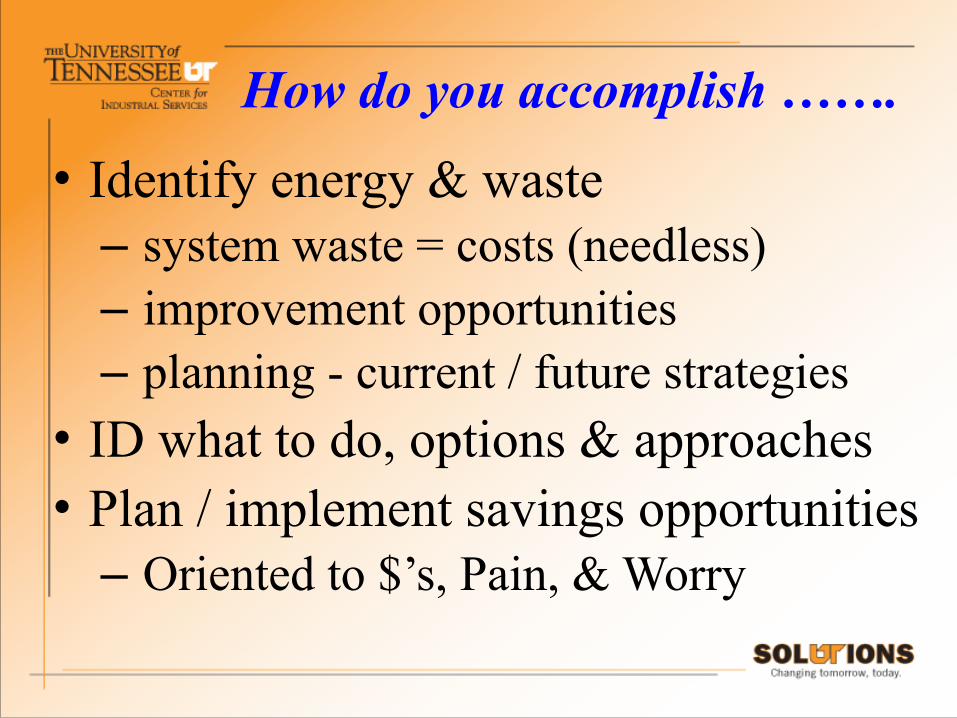
How do you accomplish …….
• Identify energy & waste – system waste = costs (needless) – improvement opportunities – planning - current / future strategies
• ID what to do, options & approaches • Plan / implement savings opportunities – Oriented to $’s, Pain, & Worry

Project Savings Quiz
• Quantity: (1) 5 HP electric motor • Operations: 24 hours/day; 7 days / week • Electric rate: $ 0.095 per kWH • Annual Cost: a) $ 387 b) $ 775 c) $ 1,550 d) $ 3,100 e) $ 6,200
$0.862 Per HP -‐ Hr.Correct answer
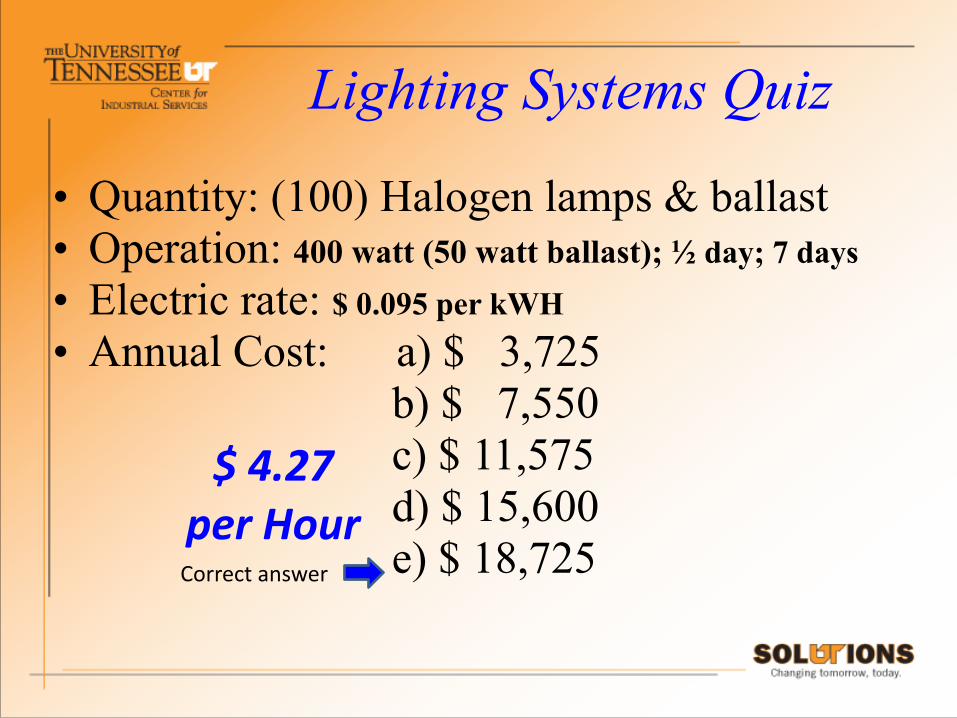
Lighting Systems Quiz
• Quantity: (100) Halogen lamps & ballast • Operation: 400 watt (50 watt ballast); ½ day; 7 days • Electric rate: $ 0.095 per kWH • Annual Cost: a) $ 3,725 b) $ 7,550 c) $ 11,575 d) $ 15,600 e) $ 18,725
$ 4.27 per HourCorrect answer

Lighting Project Example
• Quantity: (100) HBF Replacements • Operation: Lower Watts; no ballast; ½ day; 7 days • Electric rate: $ 0.095 per kWH • Annual Cost: a) less than $ 1,000 b) $ 1,150 c) $ 2,300 d) $ 4,680 e) $ 9,350 f) $11,890
25 to 50% Saved
Correct answers
Correct answers
LED Technology 164 Watts / unit $1.55 / hour
versus $4.27 / hour
Correct answers

Energy Consumption
Power ConsumpDon -‐ Electrical Average Cost
$ 0
$ 4,889
$ 9,778
$ 14,667
$ 19,556
$ 24,444
$ 29,333
$ 34,222
$ 39,111
$ 44,000
1 2 3 4 5 6 7 8 9 10 11 12
Power for Lights, Electronics, Motors, and other Electrical
Systems
HVAC Energy Consumption
Integral Calculus: dy = ∫ (0.2345x6 + 12.099x5 -‐ 212.93x4 + 1569.9x3 -‐ 4770.2x2 + 7109.7x + 20920) dx
HVAC Cost $90,000 Annual
Jan Jun Dec
Air Handlers for the building

Natural Gas - HeatingConsumpDon of Natural Gas -‐ Monthly Average Cost
$ 0
$ 4,250
$ 8,500
$ 12,750
$ 17,000
1 2 3 4 5 6 7 8 9 10 11 12
y = -‐0.7312x6 + 30.397x5 -‐ 486x4 + 3745.2x3 -‐ 13965x2 + 20615x + 5194.2R² = 0.9724
Building Heat
Heat for Hot Water (Showers, Kitchen, & Laundry) plus Heat for
Laundry Dryers
DecJunJan
Heating Cost $26,900 Annual

Why are You Here?
$$$$$$$
“Don’t Know”
“Tree Hugger”
“Energy Strategy”
“High Cost of Energy”

Introductory Perspectives
• 10% concepts • 90% practical application
–20-‐to-‐1 payback • No expensive & advanced solutions
– simple, effective, low-‐cost, and quick
Transformations are generally:

Introductory PerspectivesNot just about energy equations and numbers !• People are greatest factor
in saving energy
• People must be engaged andinformed about energy
• People must be involved at all levels of the organization

People are the Most Important Factor for Saving Energy
• Some people are more excited about energy efficiency than others
• Even the barely-excitedpeople will contribute smallenergy-saving ideas
• When the most-excitedpeople get involved, bigenergy savings occur
• Energy teams of excited people are the best way to achieve energy savings.Each success occurs by doing an energy-saving event

Heating, Ventilation & Air Conditioning (HVAC)
Low-‐cost energy solutions with high payback
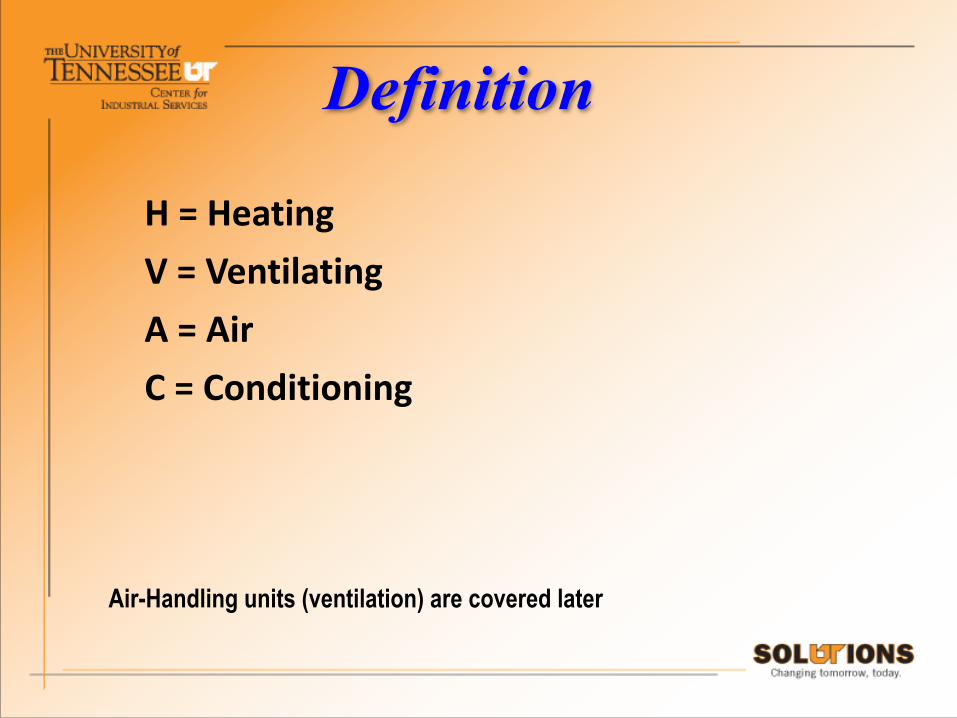
Definition
H = Heating V = Ventilating A = Air C = Conditioning !!!Air-Handling units (ventilation) are covered later

Why Care About HVAC?
• HVAC systems provide heating, cooling, humidity control, filtration, fresh air (indoor air quality), building pressure control, and comfort control
• HVAC systems are essential for employee productivity and product quality
• HVAC systems are the single largest energy expenditures in an energy bill (approx. 50%) for buildings

Why Care About HVAC?
Monitoring, adjusting, and controlling HVAC systems achieve significant
savings in your energy bill.
Heat Transfer & Heat Generation in Buildings

Psychrometric ChartIndoor ASHRAE Comfort Conditions (American Society of Heating, Refrigerating, and Air-‐Conditioning Engineers)
Note: See tighter comfort windows on next slide based on ASHRAE people survey.

Psychrometric ChartTighter recommended conditions for indoor comfort based on survey of people per ASHRAE Standard 55 Thermal Environmental conditions for Human Occupancy
Summarize as a Table of Indoor Comfort Conditions
70° winter 76° summerexample on next slide
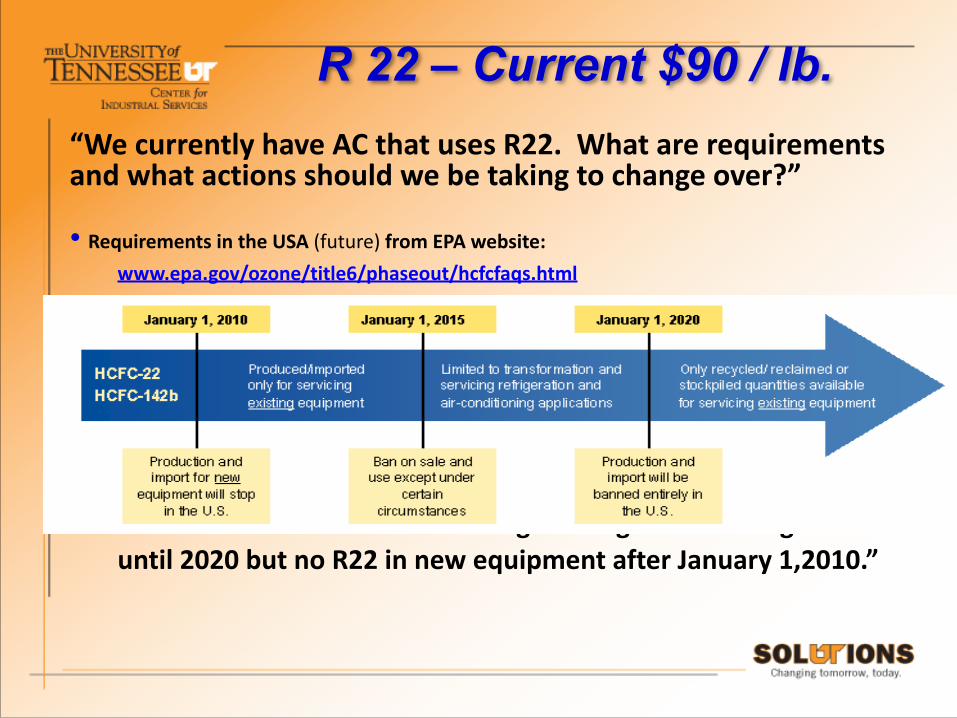
“We currently have AC that uses R22. What are requirements and what actions should we be taking to change over?”
• Requirements in the USA (future) from EPA website: www.epa.gov/ozone/title6/phaseout/hcfcfaqs.html
“You can still use R22 for servicing existing AC and refrigeration until 2020 but no R22 in new equipment after January 1,2010.”
R 22 – Current $90 / lb.

• Many buildings have both chillers and cooling towers
– chillers and cooling towers use energy – opportunities to save energy
• Chillers
– Prevalent in office buildings • largest single energy-‐consumer • large motors typical (25 to 125 HP)
Why Care About Chillers and Cooling Towers?
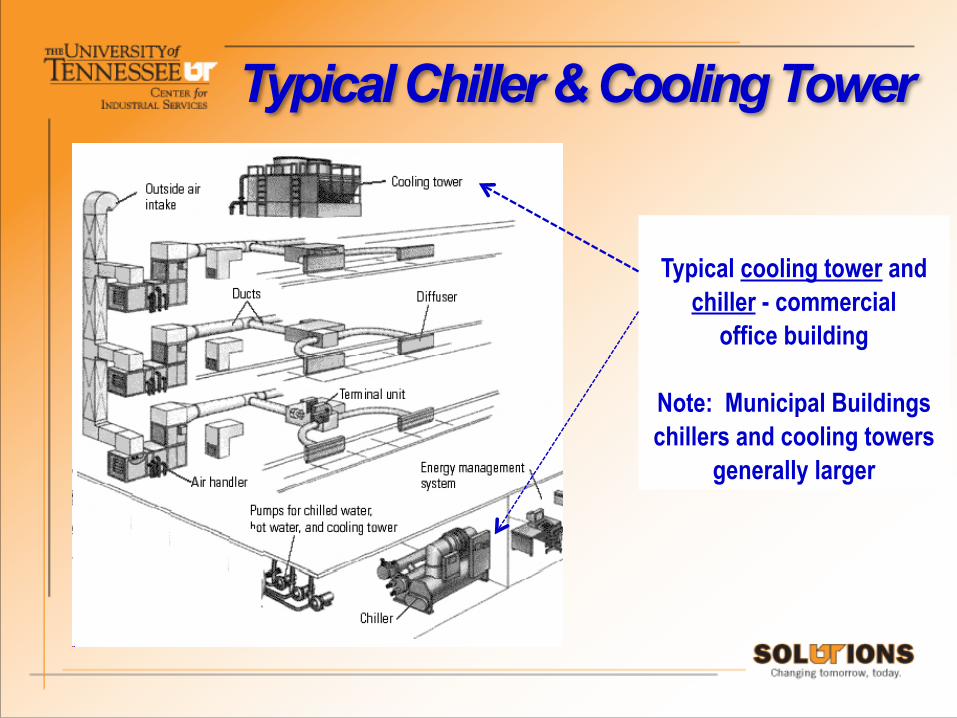
Typical cooling tower and
chiller - commercial office building
Note: Municipal Buildings chillers and cooling towers
generally larger
Typical Chiller & Cooling Tower
Gas
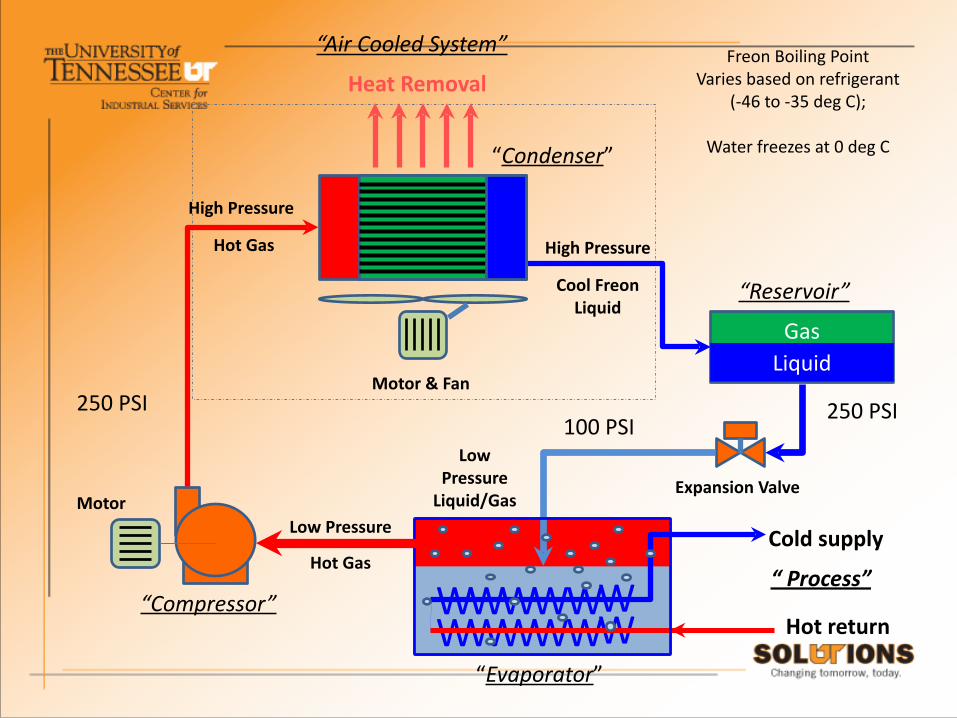
Heat Removal
“Compressor”
High Pressure !Hot Gas
“Evaporator”
“Air Cooled System”
Low Pressure !Hot Gas
High Pressure !Cool Freon
Liquid
Cold supply
Hot return
“ Process”
Liquid
Expansion Valve
Motor & Fan
Motor
Freon Boiling Point Varies based on refrigerant
(-‐46 to -‐35 deg C); !Water freezes at 0 deg C
Low Pressure Liquid/Gas
“Reservoir”
250 PSI250 PSI100 PSI
WWWWWWWWWWWW
“Condenser”

Gas
Hot Water Return
“Compressor”
High Pressure !Hot Freon
Gas
“Water Cooled System”
High Pressure !Cool Freon
Liquid
Liquid
Expansion ValveMotor
Freon Boiling Point Varies based on refrigerant
(-‐46 to -‐35 deg C); !Water freezes at 0 deg C
“Reservoir”
250 PSI250 PSI100 PSI
Cool Water Supply
“Evaporator”
Cold supply
Hot return
“ Process”
Expansion Valve
Low Pressure Liquid/Gas
250 PSI100 PSI
WWWWWWWWWWWW
Low Pressure !Hot Gas
“Condenser”
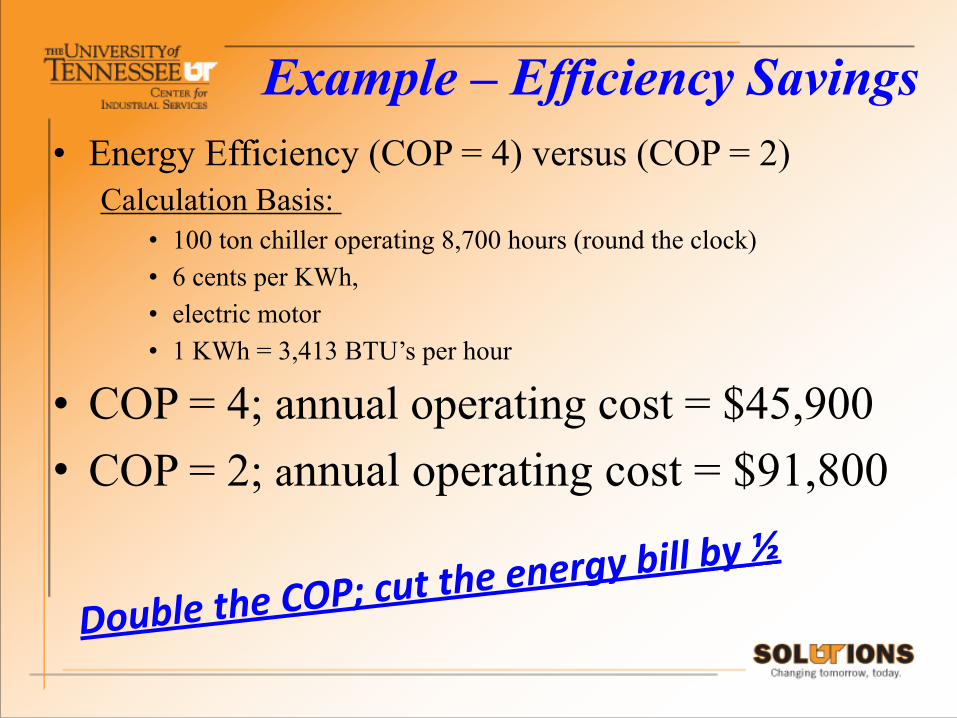
Example – Efficiency Savings• Energy Efficiency (COP = 4) versus (COP = 2)
Calculation Basis: • 100 ton chiller operating 8,700 hours (round the clock) • 6 cents per KWh, • electric motor • 1 KWh = 3,413 BTU’s per hour
• COP = 4; annual operating cost = $45,900 • COP = 2; annual operating cost = $91,800
Double the COP; cut the ener
gy bill by ½

System Related Energy-‐saving Opportunities
• Overall System Savings if Reset/raise Chilled Water Temp (continued)
– Chiller water is raised to 54 °F (OK for HVAC) instead of typical ARI settings
– Compared to 44 °F setting…… – (54 -‐ 44) = (10 °F) x (2 % savings per °F) = 20% energy savings !!! Also, chiller COP improves linearly by increasing chilled water T
Change the Operating Temperature
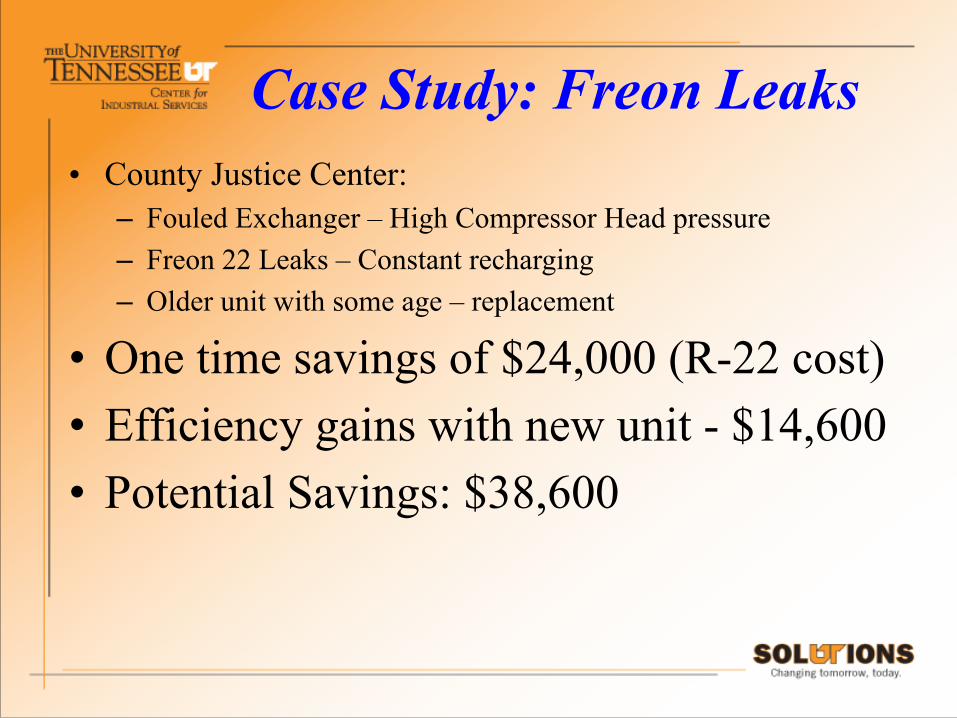
Case Study: Freon Leaks• County Justice Center:
– Fouled Exchanger – High Compressor Head pressure – Freon 22 Leaks – Constant recharging – Older unit with some age – replacement
• One time savings of $24,000 (R-22 cost) • Efficiency gains with new unit - $14,600 • Potential Savings: $38,600
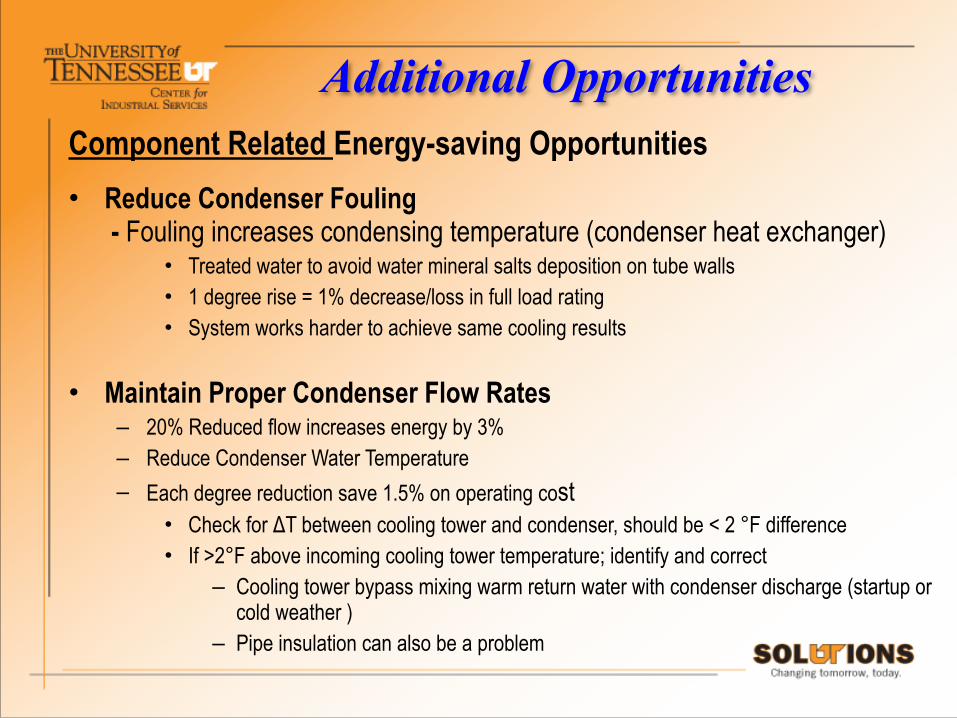
Component Related Energy-saving Opportunities !• Reduce Condenser Fouling
- Fouling increases condensing temperature (condenser heat exchanger) • Treated water to avoid water mineral salts deposition on tube walls • 1 degree rise = 1% decrease/loss in full load rating • System works harder to achieve same cooling results
• Maintain Proper Condenser Flow Rates – 20% Reduced flow increases energy by 3% – Reduce Condenser Water Temperature – Each degree reduction save 1.5% on operating cost
• Check for ΔT between cooling tower and condenser, should be < 2 °F difference • If >2°F above incoming cooling tower temperature; identify and correct
– Cooling tower bypass mixing warm return water with condenser discharge (startup or cold weather )
– Pipe insulation can also be a problem
Additional Opportunities
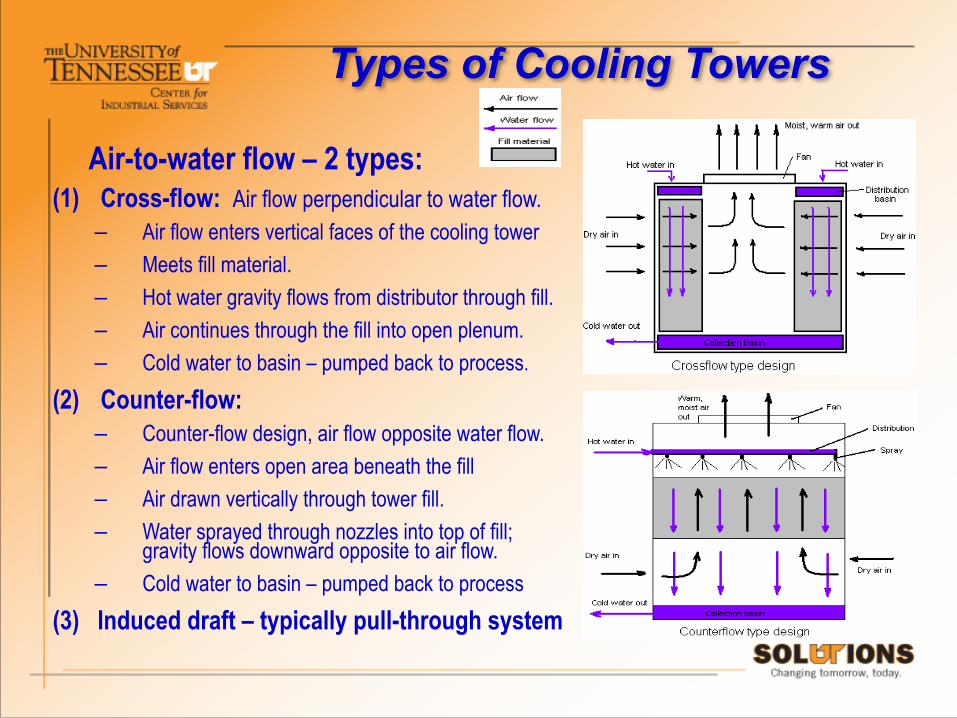
Air-to-water flow – 2 types: (1) Cross-flow: Air flow perpendicular to water flow.
– Air flow enters vertical faces of the cooling tower – Meets fill material. – Hot water gravity flows from distributor through fill. – Air continues through the fill into open plenum. – Cold water to basin – pumped back to process.
(2) Counter-flow: – Counter-flow design, air flow opposite water flow. – Air flow enters open area beneath the fill – Air drawn vertically through tower fill. – Water sprayed through nozzles into top of fill;
gravity flows downward opposite to air flow. – Cold water to basin – pumped back to process
(3) Induced draft – typically pull-through system
Types of Cooling Towers

• Cooling towers use water in 3 ways(1) Evaporation, (2) Drift, and (3) Bleed-off !
• This figure illustrates water use in a typical cooling tower.
1. Evaporation (E) controlled by thermodynamics; • Water evaporation removes heat • 1200 lbs/hrs = 100 tons of cooling; 2.4 gpm of water !
2. Bleed off (B) – removes mineral salts / solids • Evaporation doesn’t remove salts / dirt / dust • Water typically high in Calcium Carbonate - limestone • Salts collect on cooling surfaces if not removed • Also known as “blow-down” – similar to boilers ops !
3. Drift (D) – function of design • Typical is 0.05 to 0.2% of tower water lost to drift • Entrained water droplets out top of tower • Caused by upward lift of air flow !
4. M (makeup water) = E + B + D 5.
Types of Cooling Towers
Building with these systems don’t return a lot of the water to the sewer but they pay for the sewer cost nonetheless.
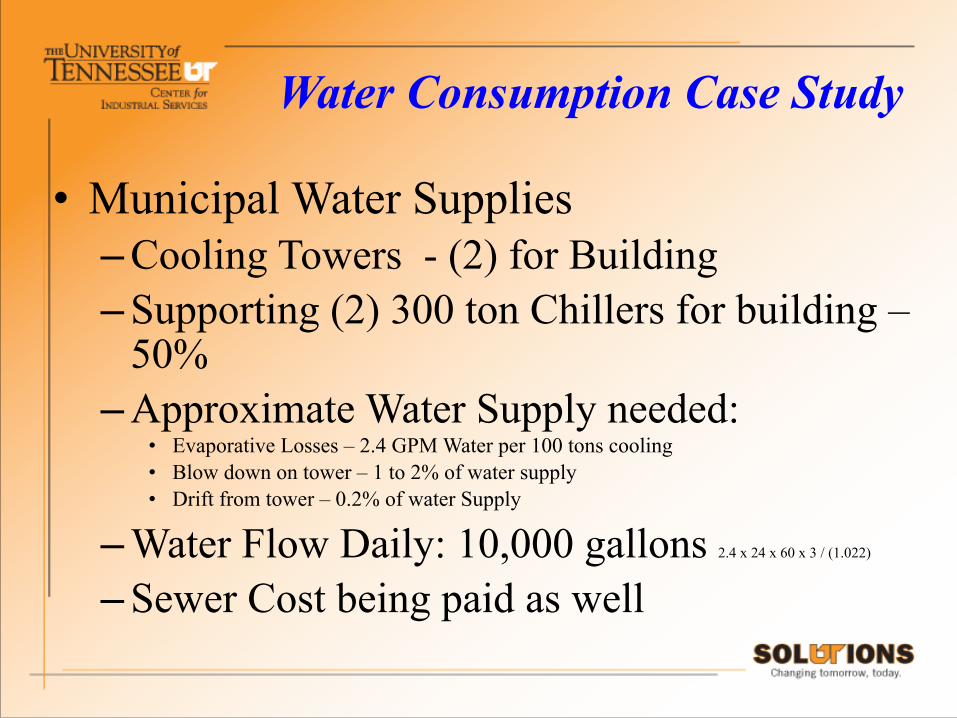
Water Consumption Case Study
• Municipal Water Supplies – Cooling Towers - (2) for Building – Supporting (2) 300 ton Chillers for building –
50% – Approximate Water Supply needed:
• Evaporative Losses – 2.4 GPM Water per 100 tons cooling • Blow down on tower – 1 to 2% of water supply • Drift from tower – 0.2% of water Supply
– Water Flow Daily: 10,000 gallons 2.4 x 24 x 60 x 3 / (1.022) – Sewer Cost being paid as well
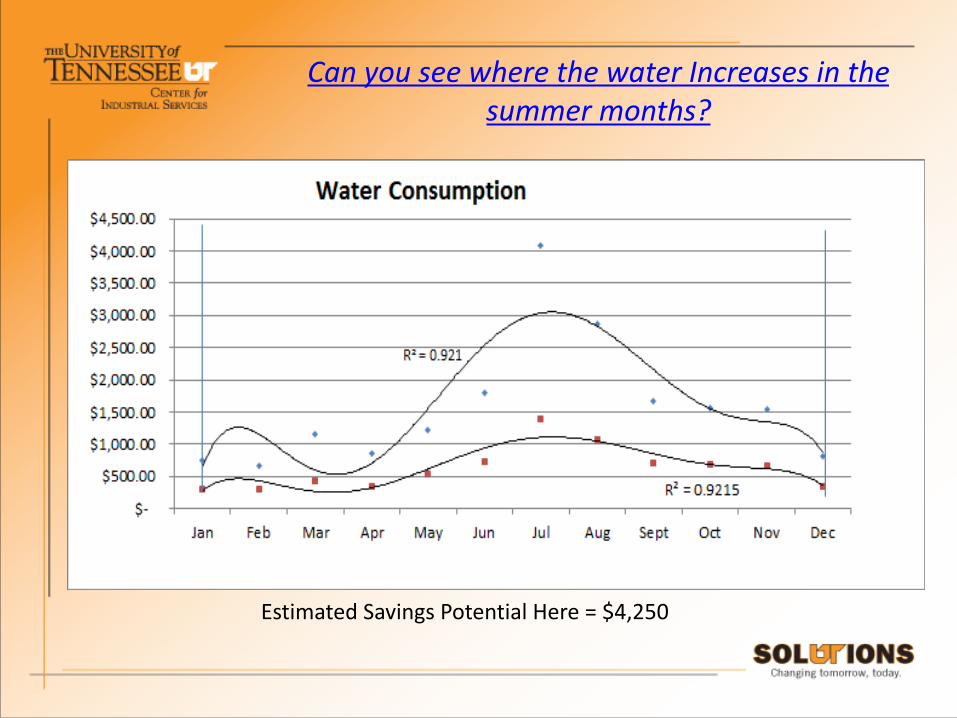
Can you see where the water Increases in the summer months?
Estimated Savings Potential Here = $4,250

Energy-‐saving Opportunities for Cooling Towers
• 2 Biggest Problems for Cooling Towers
– The two biggest problems with cooling towers are: 1) poor performance – inadequate cooling 2) premature tower failure – corrosion, wood deterioration, rot, fouled
– Both adversely affect energy consumption. • Routine tower maintenance
• Water treatment program normally avoids problems
• Consult supplier’s maintenance manuals for recommendations
Energy-saving Opportunities
Energy Efficient Lights
A short-course in
low-cost energy solutions that provide high payback

Why Care About Lights?
• Energy efficient lights use up to 75% less energy than standard lighting, produce 75% less heat, and last up to 10 times longerthan standard lights.

Energy-saving Opportunities•Locate light fixtures near/above the work area where light needed
•Light level reduces as the square of the distance E = I / d2 E = Illuminance (foot-candles or lux) Foot-Candles ~ Lux / 10 I = Intensity of lighting in candelas d = Distance from light source
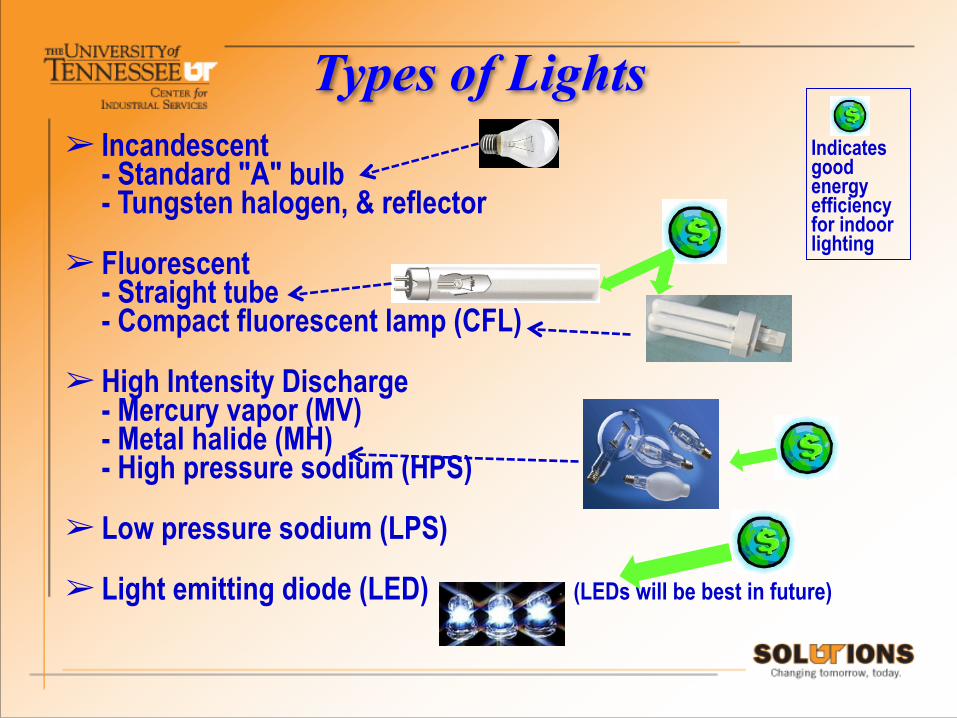
Types of Lights➢ Incandescent
- Standard "A" bulb- Tungsten halogen, & reflector
➢ Fluorescent - Straight tube - Compact fluorescent lamp (CFL)
➢ High Intensity Discharge - Mercury vapor (MV)- Metal halide (MH) - High pressure sodium (HPS)
➢ Low pressure sodium (LPS)
➢ Light emitting diode (LED) (LEDs will be best in future)
Indicatesgoodenergyefficiency for indoorlighting

Light per Unit EnergyLu
men
s pe
r wat
t
NOTE: Some LEDs are 60 lumens per watt and 131 has been achieved in labs so expect LEDs to be the best in future years
Incand. – Incandescent LED – Light Emitting Diode MV – Mercury Vapor MH – Metal Halide HPS High Press Sodium LPS – Low Press Sodium
Trends for Lights➢ Incandescent Being phased out by Energy Independence
and Security Act of 2007 – “EISA” – (Energy Bill)
Signed into law December 18, 2007 ➢ All light bulbs must use 25% less energy than today’s incandescent bulbs by the year
2015. ➢ The phase-out will start with 100 watt bulbs in January 2012 and end with 40 watt bulbs in
January 2014. Phase in 2012 to 2014 – specialty bulbs exempted ➢ By 2020, law requires all bulbs to be at least 70% more efficient (effectively equal to
today’s CFLs energy consumption).
Light Controls• Benefits of controls for lights can be significant
- Energy reductions by as much as 75% by using skylights and dimmable lighting controls.
• Electric Power Research Institute (EPRI) estimated savings by using light controls – offices (25-50%) – rest rooms (30-75%) – corridors (30-40%) – storage areas (45-65%) – meeting rooms (45-65%) – and warehouses (50-75%)

Lighting Example
Example: Hallway (Corridor) Lights ➢ 25 fixtures operating 24/7 @ $0.06 / kWh ➢ Each fixture equipped with (4) 32 watt T-‐8’s ➢ Electronic ballast ! kWh = 365 x 24 x 32 x 4 x 25 / 1,000 = 28,032,000 / 1,000 = 28,032 kWh !Cost Saving Potential = 28,032 x 0.35 x 0.06 = $590 annually
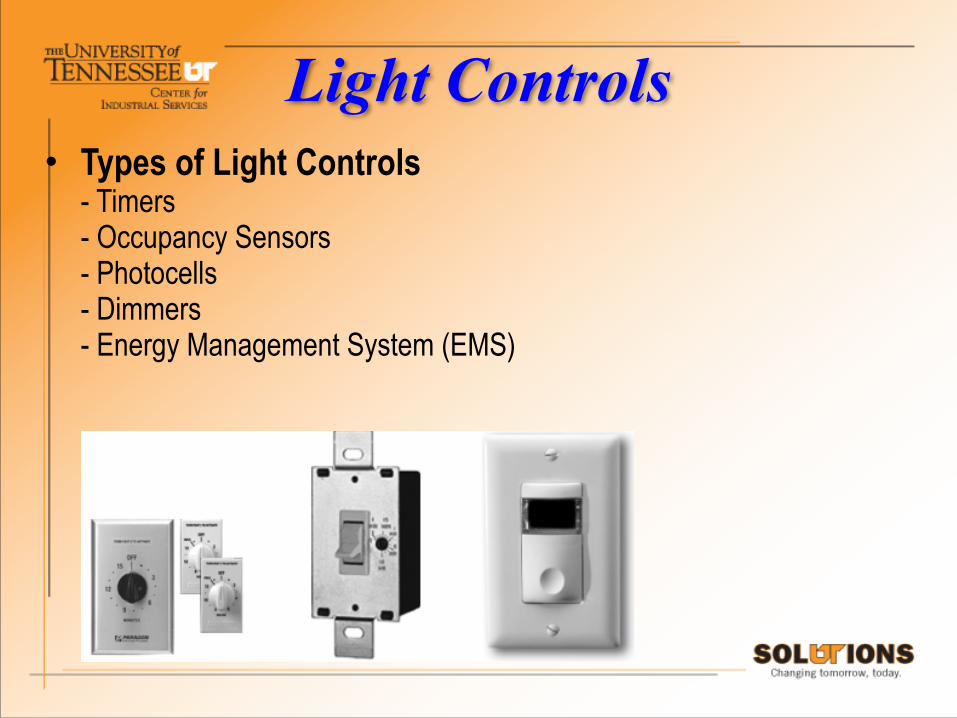
Light Controls• Types of Light Controls
- Timers - Occupancy Sensors- Photocells - Dimmers - Energy Management System (EMS)
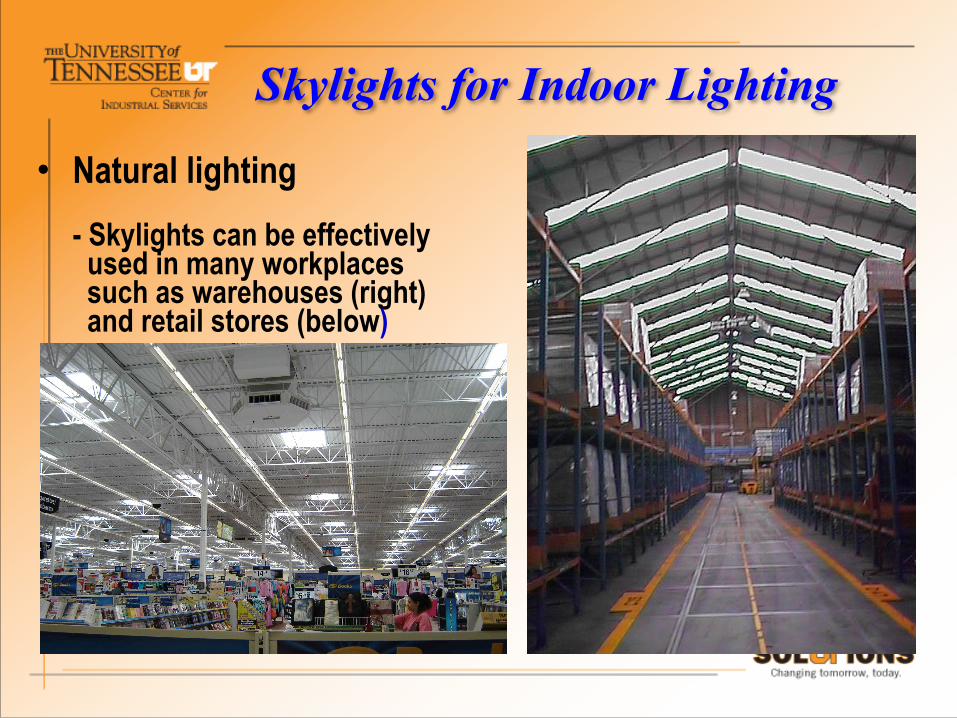
Skylights for Indoor Lighting
• Natural lighting - Skylights can be effectively used in many workplaces such as warehouses (right) and retail stores (below)
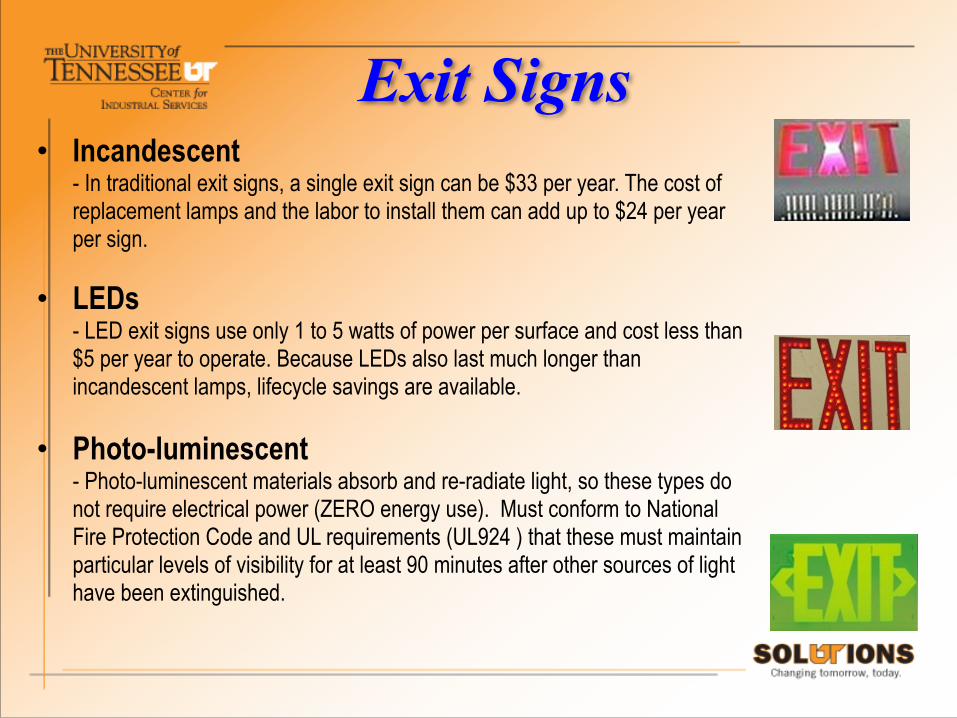
Exit Signs• Incandescent
- In traditional exit signs, a single exit sign can be $33 per year. The cost of replacement lamps and the labor to install them can add up to $24 per year per sign.
• LEDs - LED exit signs use only 1 to 5 watts of power per surface and cost less than $5 per year to operate. Because LEDs also last much longer than incandescent lamps, lifecycle savings are available.
• Photo-luminescent- Photo-luminescent materials absorb and re-radiate light, so these types do not require electrical power (ZERO energy use). Must conform to National Fire Protection Code and UL requirements (UL924 ) that these must maintain particular levels of visibility for at least 90 minutes after other sources of light have been extinguished.

Physically “Lower the Lights”
!• To increase lux (or foot-candles), consider moving light
fixtures lower (if currently in a high ceiling) to be closer above the work area/desks/benches. !– extend the wires/conduit to hang the lights lower
– install a false ceiling (suspended tile ceiling). • can also accomplish HVAC savings by reducing heat load

Energy-saving Opportunities•Locate light fixtures near/above the work area where light needed
•Light level reduces as the square of the distance E = I / d2 E = Illuminance (foot-candles or lux) Foot-Candles ~ Lux / 10 I = Intensity of lighting in candelas d = Distance from light source

Exit Signs• Other TypesElectroluminescent panels: not as good as LED or photo-luminescent for exit signs. Cold cathode fluorescents: not as good as LED or photo-luminescent for exit signs.

Exit Signs Comparison of Light Sources for Exit Signs

Lighting Case Study• Attic Space Lighting– On when no one there
– Annual Operating Costs: $2,460 • High Traffic areas – less light needed
– Switch from T-8 Technology to LED – Annual operating savings: $8,840
• Parking Lot Lamps: Mercury Vapor – $4,100 annual operating cost – Switch to exterior Energy efficient lighting – Annual operating savings: $2,000
• Annual savings potential: $13,300


Energy Efficient Motors & Pumps
Low-cost energy solutions that provide high payback by
saving energy in all facilities at manufacturers, offices, etc.

Why Care About Motors?
➢Motors are everywhere ➢Fans, pumps, conveyors, anything that moves/turns, etc.)
➢50% of U.S. electricity in offices flows through a motor. ➢64% of U.S. electricity in industry flows through motors
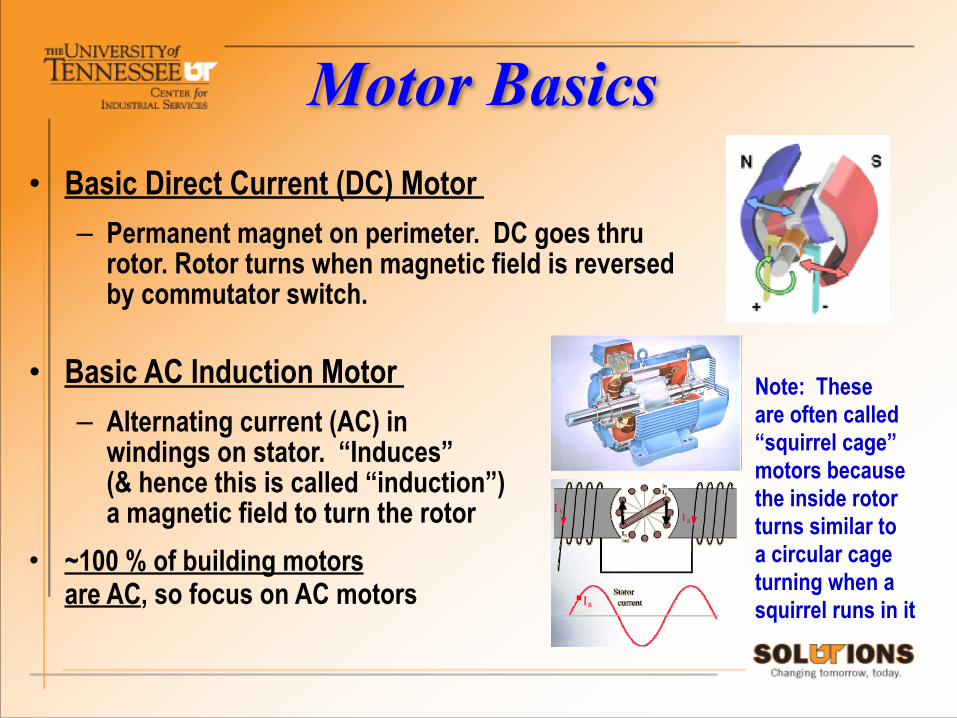
Motor Basics• Basic Direct Current (DC) Motor
– Permanent magnet on perimeter. DC goes thru rotor. Rotor turns when magnetic field is reversed by commutator switch.
• Basic AC Induction Motor – Alternating current (AC) in
windings on stator. “Induces” (& hence this is called “induction”)a magnetic field to turn the rotor
• ~100 % of building motors are AC, so focus on AC motors
Note: These are often called “squirrel cage” motors becausethe inside rotorturns similar to a circular cageturning when a squirrel runs in it
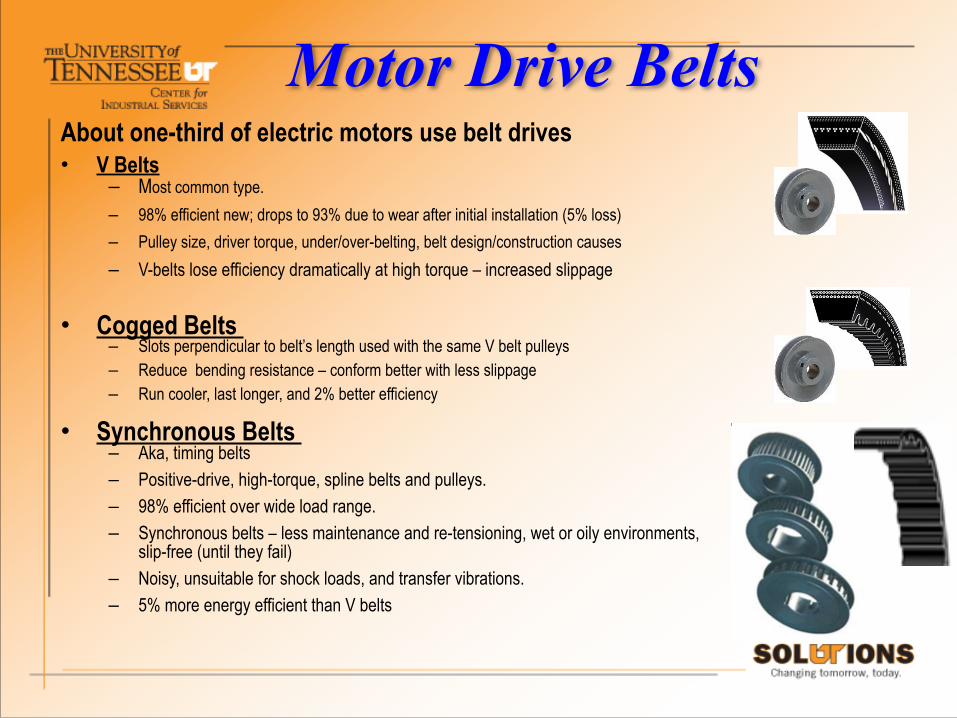
Motor Drive BeltsAbout one-third of electric motors use belt drives • V Belts
– Most common type. – 98% efficient new; drops to 93% due to wear after initial installation (5% loss) – Pulley size, driver torque, under/over-belting, belt design/construction causes – V-belts lose efficiency dramatically at high torque – increased slippage !
• Cogged Belts – Slots perpendicular to belt’s length used with the same V belt pulleys – Reduce bending resistance – conform better with less slippage – Run cooler, last longer, and 2% better efficiency
• Synchronous Belts – Aka, timing belts – Positive-drive, high-torque, spline belts and pulleys. – 98% efficient over wide load range. – Synchronous belts – less maintenance and re-tensioning, wet or oily environments,
slip-free (until they fail) – Noisy, unsuitable for shock loads, and transfer vibrations. – 5% more energy efficient than V belts
!➢10 or 20 to 1 payback typical ➢ For Example:
➢25 HP motor; 24 / 7 @ $0.06 per kWh ➢5% of annual cost = 5% x $9,800 = $490 ➢Cost of belt and installation = $25 - 50
Belt Replacement / Maintenance
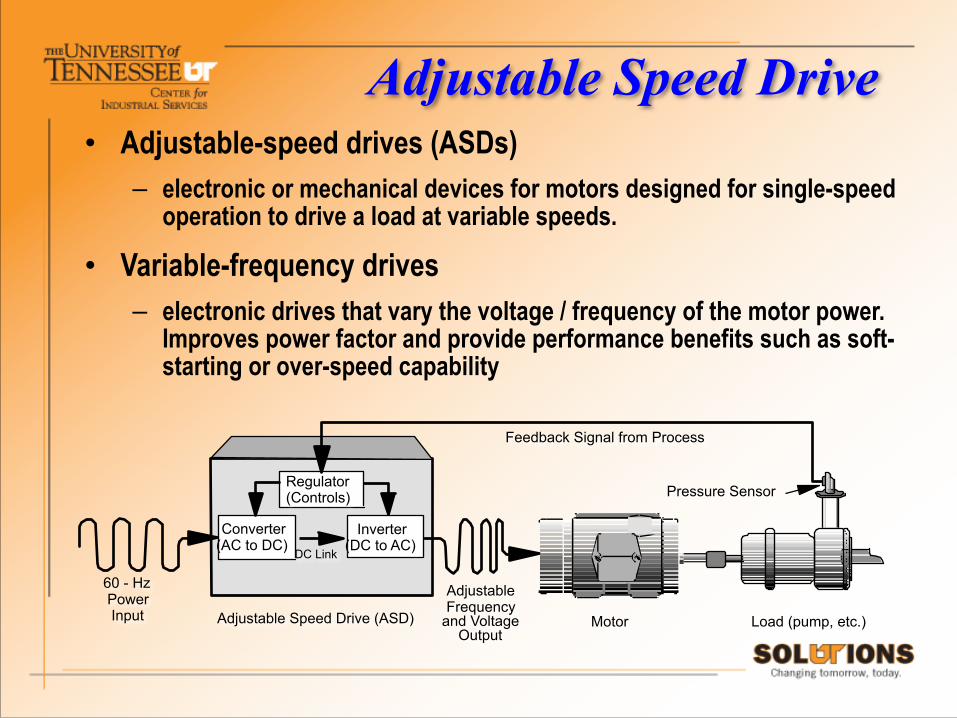
Adjustable Speed Drive• Adjustable-speed drives (ASDs)
– electronic or mechanical devices for motors designed for single-speed operation to drive a load at variable speeds.
• Variable-frequency drives – electronic drives that vary the voltage / frequency of the motor power.
Improves power factor and provide performance benefits such as soft-starting or over-speed capability
Regulator(Controls)
Converter(AC to DC)
Inverter (DC to AC)
60 - Hz Power Input
DC Link
Adjustable Speed Drive (ASD)
AdjustableFrequency
and Voltage Output
Motor Load (pump, etc.)
Pressure Sensor
Feedback Signal from Process
Replace Motor, not Rewind• All new motors sold in US are high efficiency.
– Older standard efficiency motors generally rewound and reused.
• Rewinding costs less but re-wound standard motors are 5% to 8% less efficient than high efficiency motors (EPACT or NEMA).
Motor Replacement Advice
• Standard (old technology) motors 50 hp or smaller – High runtime (> 3,000 hours per year), – Replace with more efficient NEMA , before (old) motor fails – Payback usually less than 3 years (33% ROI)
• Standard (old technology) larger motors > 50 hp – Replace at failure – Larger motors generally more efficient – Replacement not economically justified till failure
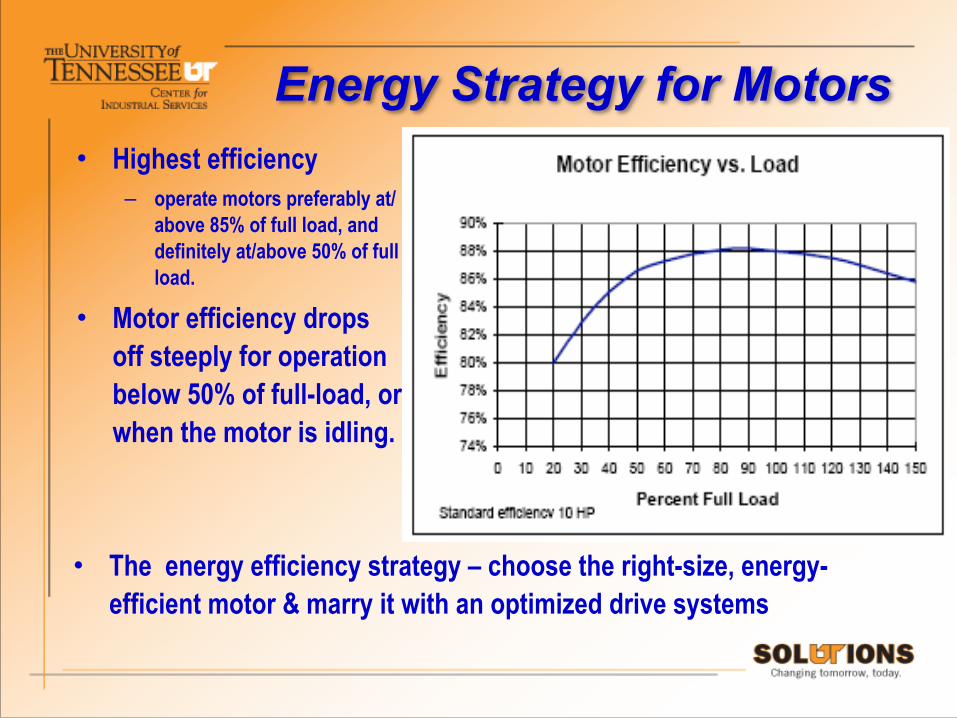
Energy Strategy for Motors• Highest efficiency
– operate motors preferably at/above 85% of full load, and definitely at/above 50% of full load.
• Motor efficiency drops off steeply for operation below 50% of full-load, or when the motor is idling.
• The energy efficiency strategy – choose the right-size, energy-efficient motor & marry it with an optimized drive systems

Building Ventilation & Fans
!
Low-cost energy solutions with high dollar payback
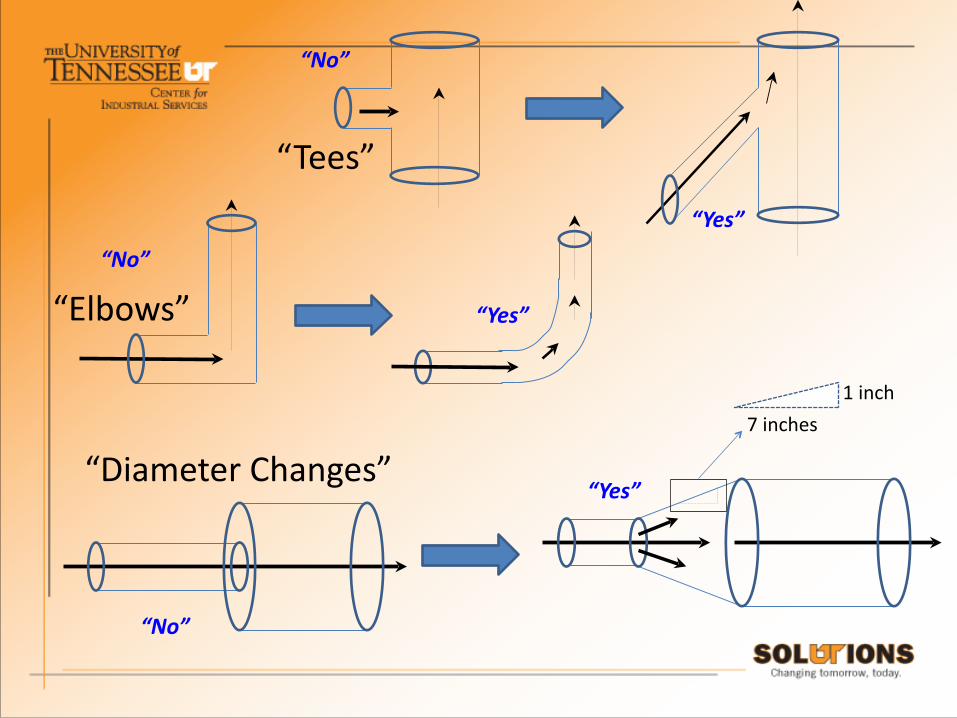
“Tees”
“Elbows”
“Diameter Changes”7 inches
1 inch
“No”
“No”
“No”
“Yes”
“Yes”
“Yes”

Pipe Diameter 18
inches
“No”6 inches
Inefficient Design

18 inches 18 inches
Pipe Diameter
18 inches
36 inches
“Yes”
Two Pipe Diameter Allowance
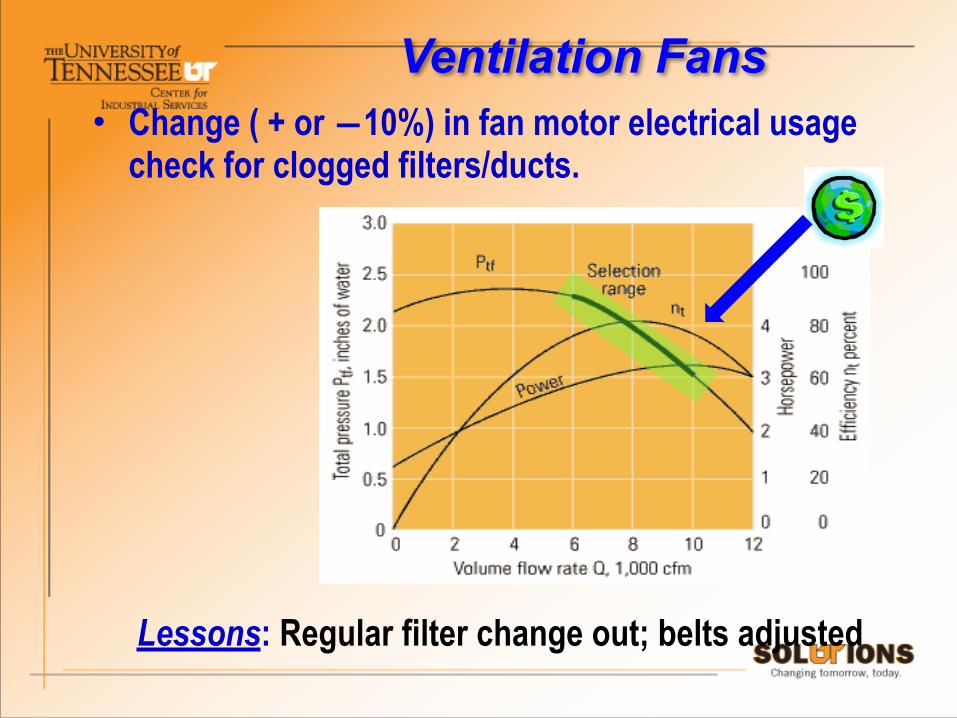
• Change ( + or ―10%) in fan motor electrical usage check for clogged filters/ducts.
! !! !!
Lessons: Regular filter change out; belts adjusted
Ventilation Fans

Water Conservation Practices

Case Study: Water Conservation
• Justice Center Water Bill – total for facility – Average monthly cost in past years: $4,500 – Current average cost in past year: $9,000 – Low to no change in number of inmates – No change in the pricing for water
• Annual savings potential: $120,000 – Find source of problem and correct (cause was
a faulty water meter……) • Lessons Learned: “Monitor billing closely”
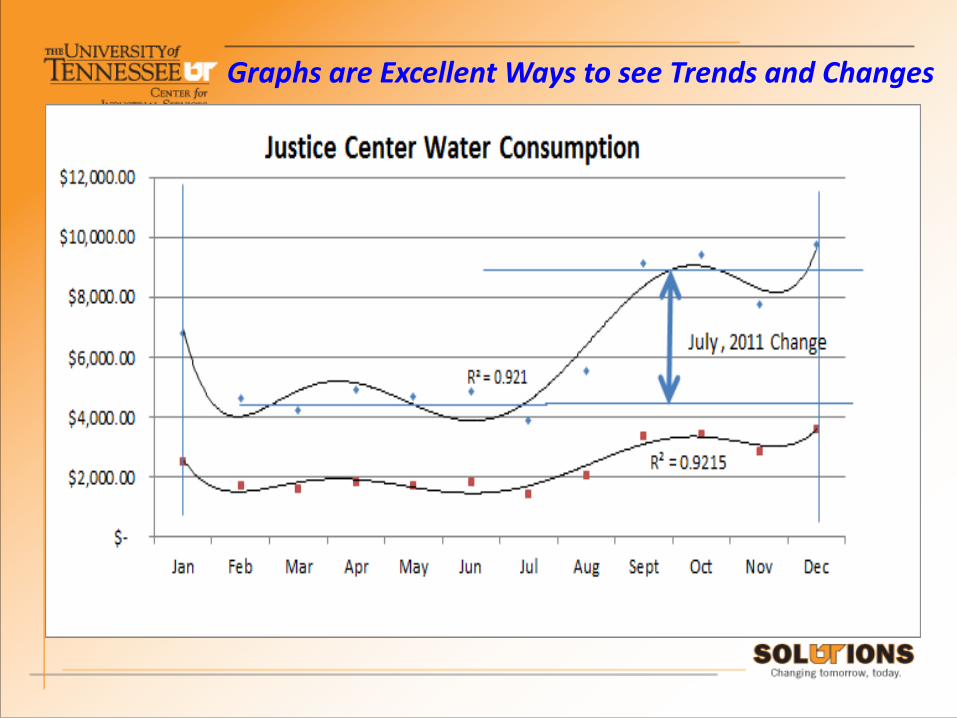
Graphs are Excellent Ways to see Trends and Changes

General Notes on Insulation• Double paned windows are 50% more energy efficient than
single paned units • Triple paned windows are 90% more energy efficient • Adequate insulation in attic spaces above rooms can lower
energy usage by as much as 30% – Minimal depth of blown insulation is six inches
• Crawl space insulation under floors can lower energy usage by as much as 35%
• Walls and windows the remainder (about 35%); windows perhaps as much as 1/3 the wall loss if not thermally efficient

General Notes on Insulation• Wall insulation is much harder to install after
building construction – Possible but expensive
• Sealing windows and doors with weather stripping can significantly reduce energy cost – Especially with public buildings
• Isolating a building entrance from the main halls and offices with a second set of doors to the building can lower energy usage.

!
Renewable Energy
Solar Heating, Photovoltaic, Geothermal, etc.

Solar HeatingPayback usually 3 to 5 years (after tax credits) !• Heat Buildings
– Passive solar design • Specially designed windows, walls, and floors • Collect, store, and distributes heat energy in winter • Reject solar heat for summer
– Active solar heating • Collectors to absorb solar radiation, • Transfer the solar heat directly to an interior space or to a storage system • Heat transfer fluid can be liquid (water, glycol, etc.) or air.
• Hot Water – Solar water heating systems include storage tanks and solar collectors - (2 types) – Active - circulating pumps & controls, and passive, which don’s – ~ 60% to 80% efficient at energy conversion to hot water
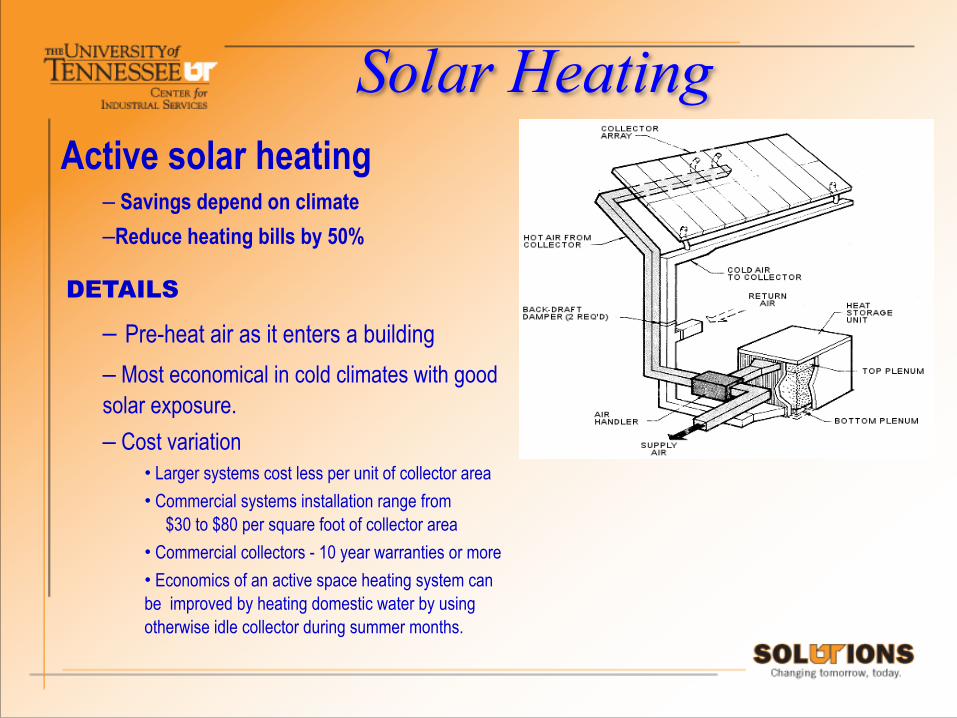
Solar HeatingActive solar heating
– Savings depend on climate –Reduce heating bills by 50%
DETAILS
– Pre-heat air as it enters a building – Most economical in cold climates with good solar exposure. – Cost variation
• Larger systems cost less per unit of collector area • Commercial systems installation range from $30 to $80 per square foot of collector area • Commercial collectors - 10 year warranties or more • Economics of an active space heating system can be improved by heating domestic water by using otherwise idle collector during summer months.

Solar HeatingHot water (active or passive), • Hot water bills should drop 50% - 80% • Cloudy days - partially pre-heat water
entering conventional hot water tank
• Active system- Has circulating pumps & controls
• Passive thermo-siphon- No circulating pumps or controls, so water tank must be above solar panel for thermo-siphon flow
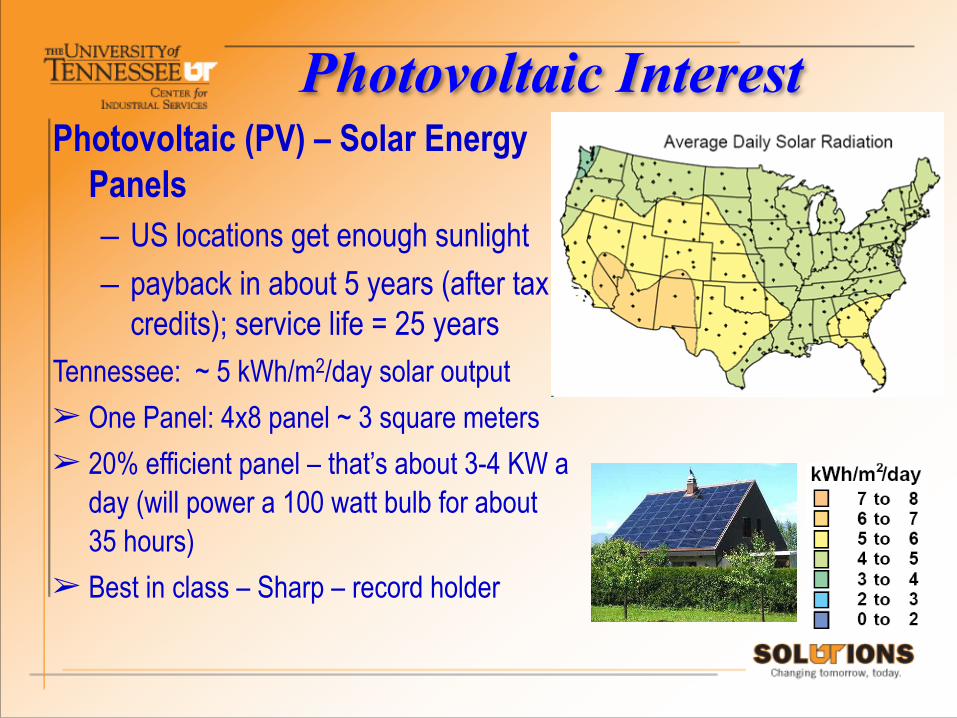
Photovoltaic InterestPhotovoltaic (PV) – Solar Energy
Panels – US locations get enough sunlight – payback in about 5 years (after tax
credits); service life = 25 years
Tennessee: ~ 5 kWh/m2/day solar output ➢ One Panel: 4x8 panel ~ 3 square meters ➢ 20% efficient panel – that’s about 3-4 KW a
day (will power a 100 watt bulb for about 35 hours)
➢ Best in class – Sharp – record holder

PhotovoltaicDETAILS of Photovoltaic Cell • Semiconductor panel absorbs light • Panel typically converts 10%-18% to kW
– 44.4% in laboratory (achieved May 2013) – materials science & design are keys – 100 square yards needed for a home
• Energy to usable DC Current electricity •Energy to Power Inverter •Production of AC voltage for use •A typical small office = 35 kWh per day.
+ -‐

Building Schematic
(Typically: 4x8 ft. Panels)

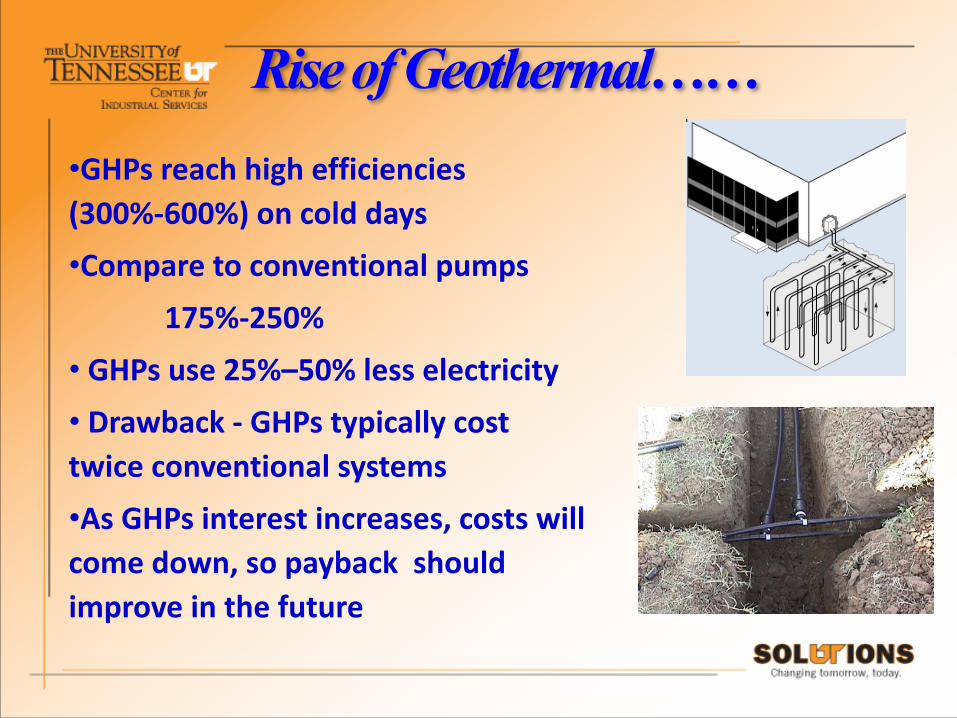
Rise of Geothermal……!•GHPs reach high efficiencies (300%-‐600%) on cold days •Compare to conventional pumps 175%-‐250% • GHPs use 25%–50% less electricity • Drawback -‐ GHPs typically cost twice conventional systems •As GHPs interest increases, costs will come down, so payback should improve in the future
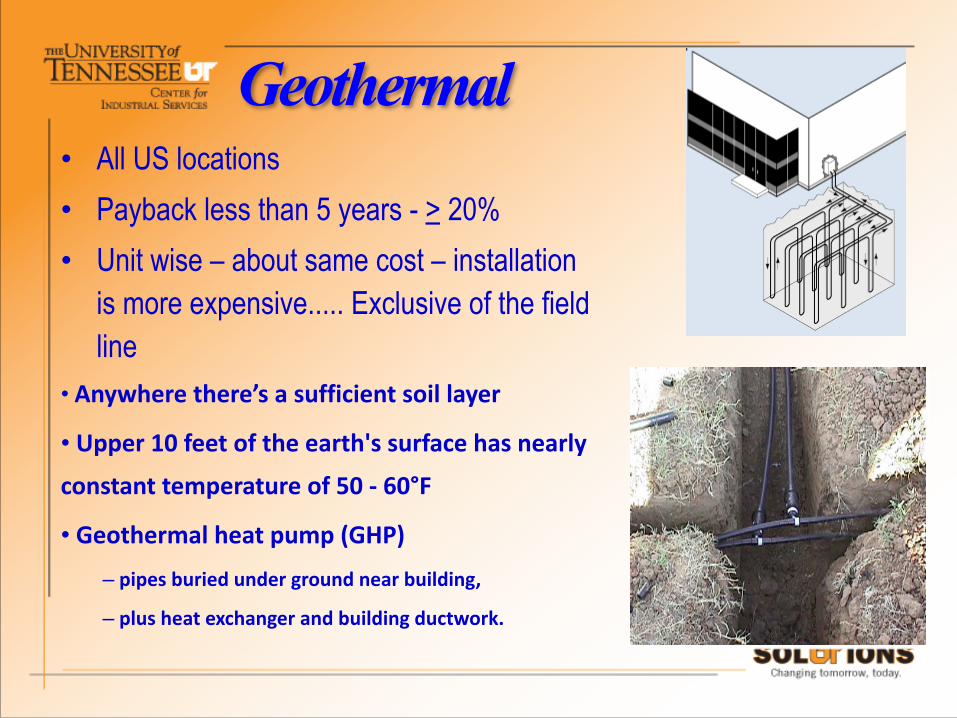
Geothermal• All US locations • Payback less than 5 years - > 20% • Unit wise – about same cost – installation
is more expensive..... Exclusive of the field line
• Anywhere there’s a sufficient soil layer
• Upper 10 feet of the earth's surface has nearly constant temperature of 50 -‐ 60°F
• Geothermal heat pump (GHP)
– pipes buried under ground near building, – plus heat exchanger and building ductwork.

Questions?