Embed Size (px)
Citation preview

Journal of Applied Security Research, 6:32–81, 2011Copyright © Taylor & Francis Group, LLCISSN: 1936-1610 print / 1936-1629 onlineDOI: 10.1080/19361610.2011.529413
Research
Insider Threat Detection Usinga Graph-Based Approach
WILLIAM EBERLE, PhD and JEFFREY GRAVESDepartment of Computer Science, Tennessee Technological University,
Cookeville, Tennessee, USA
LAWRENCE HOLDER, PhDSchool of Electrical Engineering & Computer Science, Washington State University, Pullman,
Washington, USA
The authors present the use of graph-based approaches to discov-ering anomalous instances of structural patterns in data that rep-resent insider threat activity. The approaches presented search foractivities that appear to match normal transactions, but in fact arestructurally different. The authors show the usefulness of applyinggraph theoretic approaches to discovering suspicious insider activ-ity in domains such as social network communications, businessprocesses, and cybercrime. The authors present some performanceresults to show the effectiveness of our approaches, and then con-clude with some ongoing research that combines numerical anal-ysis with structure analysis, analyzes multiple normative patterns,and extends to dynamic graphs.
KEYWORDS Anomaly detection, graph based, insider threat
INTRODUCTION
The ability to mine structurally complex data has become the focus of manyinitiatives, ranging from business process analysis to cybersecurity. Since
This material is based on work supported by the U.S. Department of Homeland Securityunder Contract No. N66001-08-C-2030. Any opinions, findings and conclusions or recommen-dations expressed in this material are those of the author(s) and do not necessarily reflect theviews of the Department of Homeland Security.
Address correspondence to William Eberle, Department of Computer Science, TennesseeTechnological University, Box 5101, Cookeville, TN 38505. E-mail: [email protected]
32
Downloaded By: [Eberle, William] At: 15:03 10 January 2011

Insider Threat Detection 33
September 11, 2001, there has been an increasing emphasis on applicablemethods for analyzing everything from bank transactions to network traffic,as our nation scours individual communications for possible illegal or terroristactivity.
Protecting our nation’s cyberinfrastructure and securing sensitive infor-mation are critical challenges for both industry and homeland security. Oneof the primary concerns is the deliberate and intended actions associatedwith malicious exploitation, theft, or destruction of data, or the compromiseof networks, communications or other information technology resources, ofwhich the most harmful and difficult to detect threats are those perpetratedby an insider. However, current efforts to identify unauthorized access toinformation such as what is found in document control and managementsystems are limited in scope and capabilities. We propose to address thesechallenges by analyzing the relations among entities in the data.
The ability to mine data for nefarious behavior is difficult because ofthe mimicry of the perpetrator. If a person or entity attempts to participate insome sort of illegal activity, he or she will attempt to convey his or her actionsas close to legitimate actions as possible. Recent reports have indicated thatapproximately 6% of revenues are lost as a result of fraud, and almost 60% ofthose fraud cases involve employees (Association of Certified Fraud Examin-ers, 2006). The Identity Theft Resource Center recently reported that 15.8% ofsecurity breaches so far in 2008 have come from insiders, up from 6% in 2007(Foley, 2008). Various insider activities such as (a) violations of system secu-rity policy by an authorized user; (b) deliberate and intended actions suchas malicious exploitation, theft, or destruction of data; (c) the compromise ofnetworks, communications, or other information technology resources; and(d) the difficulty in differentiating suspected malicious behavior from normalbehavior have threatened our nation’s security. Organizations responsible forthe protection of their company’s valuable resources require the ability tomine and detect internal transactions for possible insider threats. Yet, mostorganizations spend considerable resources protecting their networks andinformation from the outside world, with little effort being applied to thethreats from within.
Cybercrime is one of the leading threats to company confidential dataand resources. A recent study by the Ponemon Institute (2009) surveyed577 information technology practitioners, who rated the issue of cybercrimeas the top trend in their industry for the next few years, over such hottopics as cloud computing, mobile devices, and peer-to-peer sharing. TheU.S. Department of Justice, in its “Computer Crime & Intellectual PropertySection,” (2009) reported six incidences in the past month alone, rangingfrom trafficking in counterfeit computer programs to accessing governmentdatabases. News stories detail how insiders have bilked corporations out ofmillions as a result of their ability to access sensitive information— sometimesafter they have resigned from a company that did not immediately removetheir confidential access (Vijayan, 2009). There has even been studies that
Downloaded By: [Eberle, William] At: 15:03 10 January 2011

34 W. Eberle et al.
suggest that the economy has affected or will affect the surge in cybercrime(Bush, 2009; Kirk, 2009).
For the past several years, companies have been analyzing their informa-tion technology operations and processes for the purpose of uncovering in-sider threats and cybercrime. Most approaches have been either statistical innature, leading to various data-mining approaches, or a visualization of theirresources in which they can monitor for illegal access or entry. However, re-cently, the ability to mine relational data has become important for detectingstructural patterns. The complex nature of heterogeneous data sets, such asnetwork activity, e-mail, and payroll and employee information, provides fora rich set of potentially interconnected and related data. Graph-based data-mining approaches analyze data that can be represented as a graph (i.e.,vertices and edges). Although there are approaches for using graph-baseddata mining for intrusion detection, little work has been done in the area ofgraph-based anomaly detection, especially for detecting threats from insiders.
In this article, we present our work in graph-based anomaly detectionfor identifying insider threats. After presenting some previous work in graph-based data mining, we define graph-based anomaly, then briefly present ouralgorithms. In three sections (“Experiments on Communication-Based SocialNetworks,” “Experiments on Business Process,” and “Experiments on Cy-bercrime”), we present our approach as applied to several insider threatscenarios. Next, we evaluate the performance of our algorithms on graphsof varying sizes and structure. Then, we demonstrate some potential en-hancements to our algorithms, including the handling of dynamic graphs.We then conclude with a brief discussion of future work.
PREVIOUS WORK
Much of the information related to insider threats resides in the relationsamong the various entities involved in an incident. There has recently beenan impetus toward analyzing multirelational data using graph theoretic meth-ods. Not to be confused with the mechanisms for analyzing spatial data,graph-based data-mining approaches are an attempt at analyzing data thatcan be represented as a graph (i.e., vertices and edges). Yet, although therehas been much written as it pertains to graph-based intrusion detection(Staniford-Chen et al., 1996), little research has been accomplished in thearea of graph-based anomaly detection.
In 2003, Noble and Cook used the SUBDUE application to look at theproblem of anomaly detection from both the anomalous substructure andanomalous subgraph perspective. They were able to provide measurementsof anomalous behavior as it applied to graphs from two different perspec-tives. Anomalous substructure detection dealt with the unusual substructuresthat were found in an entire graph. To distinguish an anomalous substructurefrom the other substructures, the researchers created a simple measurement
Downloaded By: [Eberle, William] At: 15:03 10 January 2011

Insider Threat Detection 35
whereby the value associated with a substructure indicated a degree ofanomaly. They also presented the idea of anomalous subgraph detection,which dealt with how anomalous a subgraph (i.e., a substructure that is partof a larger graph) was to other subgraphs. The idea was that subgraphs thatcontained many common substructures were generally less anomalous thansubgraphs that contained few common substructures. In addition, they alsoexplored the idea of conditional entropy and data regularity using networkintrusion data as well as some artificially created data.
Several approaches use statistical measures to identify individual nodeor edge anomalies. Lin and Chalupsky (2003) took the approach of applyingwhat they called “rarity measurements” to the discovery of unusual linkswithin a graph. The AutoPart system presented a nonparametric approach tofinding outliers in graph-based data (Chakrabarti, 2004). Part of this approachwas to look for outliers by analyzing how edges that were removed from theoverall structure affected the minimum descriptive length (MDL) of the graph(Rissanen, 1989). The idea of entropy was used by Shetty and Adibi (2005)in their analysis of the famous Enron e-mail data set. Using bipartite graphs,Sun, Qu, Chakrabar, and Faloutsos (2005) presented a model for scoring thenormality of nodes as they relate to other nodes. Rattigan and Jensen (2005)went after anomalous links using a statistical approach.
In Priebe, Conroy, Marchette, and Park’s (2005) work, they used whatare called “scan statistics” on a graph of the e-mail data that is represented asa time series. Although their approach detects statistically significant events(excessive activity), without further analysis, they are unable to determinewhether the events are relevant (such as insider trading). Martin, Nelson,Sewani, Chen, and Joseph (2005) examined what they called “behavioralfeatures” of a particular user’s network traffic in order to discover abnormalactivity. Through various clustering approaches, and comparisons to methodssuch as support vector machines and naive Bayes classification, they groupsets of users into single behavioral models. Diesner and Carley (2005) appliedvarious network analytic techniques in their exploration of the structuralproperties of the Enron network. They used various graph structural metrics,such as betweenness centrality, eigenvectors, and total degree in order toidentify key players across time. In 2007, Kurucz, Benczur, Csalogany, andLukacs used hierarchical spectral clustering to evaluate weighted call graphs.They analyzed several heuristic approaches using phone calls made over an8-month period. However, their purpose was not to expose anomalies inphone traffic, but instead to address the issues associated with processinglarge graphs. In Swayne, Buja, and Temple Lang (2003)’s work, they usedgraph techniques to explore AT&T phone records. Although their approachwas able to provide for the analysis of phone traffic, it was entirely based ongraph visualization, rather than on any graph theoretic approaches. In fact,when it comes to generating graphs of information, much research has dealtwith only the visual aspects of what is represented, rather than the structuralaspects of the graphs themselves.
Downloaded By: [Eberle, William] At: 15:03 10 January 2011

36 W. Eberle et al.
The advantage of graph-based anomaly detection is that the relationsamong elements can be analyzed, as opposed to just the data values them-selves, for structural oddities in what could be a complex, rich set of infor-mation. Furthermore, our approach identifies the structural context in whichthe anomaly occurs rather than just the particular nodes or links that areanomalous.
GRAPH-BASED ANOMALY DETECTION
Definition
The idea behind the approach used in this work is to find anomalies ingraph-based data in which the anomalous substructure in a graph is part of(or attached to or missing from) a normative substructure.
Definition: A graph substructure S’ is anomalous if it is not isomorphic tothe graph’s normative substructure S, but is isomorphic to S within X%.
X signifies the percentage of vertices and edges in S’ that would need tobe changed in order for S’ to be isomorphic to S. The importance of thisdefinition lies in its relation to any deceptive practices that are intended toillegally obtain or hide information. The United Nations Office on Drugs andCrime states the first fundamental law of money laundering as “the moresuccessful money-laundering apparatus is in imitating the patterns and be-havior of legitimate transactions, the less the likelihood of it being exposed”(Blum et al., 1998, p. 23).
There are three general categories of anomalies: insertions, modifica-tions, and deletions. Insertions constitute the presence of unexpected verticesor edges, modifications consist of unexpected labels on vertices or edges,and deletions constitute the unexpected absence of vertices or edges.
Approaches
Most anomaly-detection methods use a supervised approach that requiressome sort of baseline of information from which comparisons or trainingcan be performed. In general, if one has an idea what is normal behavior,deviations from that behavior could constitute an anomaly. However, theissue with those approaches is that one has to have the data in advancein order to train the system, and the data have to already be labeled (e.g.,normal employee transaction vs. threatening insider activity).
Graph-based anomaly detection (GBAD; Eberle & Holder, 2007) is anunsupervised approach, based on the SUBDUE graph-based knowledge dis-covery method (Cook & Holder, 2000). Using a greedy beam search and MDLheuristic (Rissanen, 1989), each of the three anomaly-detection algorithmsin GBAD uses SUBDUE to discover the best-compressing substructure, or
Downloaded By: [Eberle, William] At: 15:03 10 January 2011

Insider Threat Detection 37
normative pattern, in an input graph. In our implementation, the MDL ap-proach is used to determine the best substructure(s) as the one that minimizesthe following:
M (S, G) = DL(G|S) + DL(S)
where G is the entire graph, S is the substructure, DL(G |S) is the descriptionlength of G after compressing it using S, and DL(S) is the description length ofthe substructure. The description length DL(G) of a graph G is the minimumnumber of bits necessary to describe the graph G.
We have developed three separate algorithms: GBAD-MDL, GBAD-P,and GBAD-MPS. Each of these approaches is intended to discover one ofthe three possible graph-based anomaly types as set forth earlier. The fol-lowing is a brief summary of each of the algorithms, along with some simpleexamples to help explain their usage. The reader should refer to Eberle andHolder (2007) for a more detailed description of the actual algorithms.
INFORMATION THEORETIC ALGORITHM (GBAD-MDL)
The GBAD-MDL algorithm uses the MDL heuristic to discover the best com-pressing (normative) substructure in a graph, and then it subsequently ex-amines all of the instances of that substructure that “look similar” to thatpattern—or more precisely, are modifications to the normative pattern. InNoble and Cook (2003)’s work on GBAD, they presented a similarly struc-tured example (albeit with different labels) to the one shown in Figure 1.
In this example, the normal business process involves Sales sending anorder to the Dispatcher, the Dispatcher verifying the order and sending inonto the Warehouse, and the Warehouse confirming the fulfillment of theorder with Sales. When applying the GBAD-MDL algorithm to this example,the circled substructure in Figure 1 is reported as being anomalous. In thiscase, there are three entities communicating for each order, but Accountsis handling the order instead of Sales—going outside the normal process.With Noble and Cook’s (2003) approach, the “Accounts” vertex would havecorrectly been shown to be the anomaly, but the importance of this newapproach is that a larger context is provided regarding its associated sub-structure. In other words, not only are we providing the anomaly, but we arealso presenting the context of that anomaly within the graph (the individualanomaly within the instance is in bold).
PROBABILISTIC ALGORITHM (GBAD-P)
The GBAD-P algorithm also uses the MDL evaluation technique to discoverthe best compressing (normative) substructure in a graph, but instead ofexamining all instances for similarity, this approach examines all extensions
Downloaded By: [Eberle, William] At: 15:03 10 January 2011

38 W. Eberle et al.
FIGURE 1 GBAD-MDL example with anomalous instance circled.
(or insertions) to the normative substructure with the lowest probability. Thedifference between the algorithms is that GBAD-MDL is looking at instancesof substructures with the same characteristics (e.g., size), whereas GBAD-P is examining the probability of extensions to the normative pattern todetermine whether there is an instance that includes edges and vertices thatare probabilistically less likely than other possible extensions. Taking thebusiness process example again, Figure 2 shows the process flow betweena warehouse (W), dispatcher (D), accounting (A) and the customer (C).
In this example, the normal process involves a communication chainbetween Sales, Warehouse, and Dispatcher, with the order confirmation be-ing conveyed by the Dispatcher to the Customer. After the first iteration ofthe GBAD-P algorithm, the boxed instance in Figure 2 is one of the instancesof the normative substructure. Then, on the second iteration, extensions areevaluated, and the circled instance is the resulting anomalous substructure.In this example, the Dispatcher is communicating with Accounts when itshould have been the Customer. Again, the edge and vertex (shown in bold)are labeled as the actual anomaly, but the entire anomalous substructure isoutput to provide additional context for possible analysis.
Downloaded By: [Eberle, William] At: 15:03 10 January 2011

Insider Threat Detection 39
FIGURE 2 GBAD-P example with instance of normative pattern boxed and anomaly circled.
MAXIMUM PARTIAL SUBSTRUCTURE ALGORITHM (GBAD-MPS)
The GBAD-MPS algorithm again uses the MDL approach to discover the bestcompressing (normative) substructure in a graph, then it examines all of theinstances of parent (or ancestral) substructures that are missing various edgesand vertices (i.e., deletions). The value associated with the parent instancesrepresents the cost of transformation (i.e., how much change would have totake place for the instance to match the normative substructure). Thus, theinstance with the lowest cost transformation is considered the anomaly, as itis closest (maximum) to the normative substructure without being includedon the normative substructure’s instance list. If more than one instance hasthe same value, the frequency of the instance’s structure will be used tobreak the tie if possible. Consider the slightly more complex graph of abusiness process, involving multiple transactions that are linked together bycommon entities, as shown in Figure 3.
In this example, the normative pattern in the process is a Sales personcommunicating with the Warehouse and a Customer, and the Warehousecorresponding with a Dispatcher. Suppose we take one of the instancesof the normative pattern (shown in the box), and remove an edge and itsassociated vertex (shown in the circle). When applying GBAD-MPS to thatmodified graph, an anomalous substructure, similar to the normative pattern,is discovered, where the Customer entity is missing along with the “note”link from Sales.
EXPERIMENTS ON COMMUNICATION-BASED SOCIAL NETWORKS
Social networks consist of nodes representing individuals and edgesrepresenting various relationships (e.g., friendship) between individuals.
Downloaded By: [Eberle, William] At: 15:03 10 January 2011

40 W. Eberle et al.
FIGURE 3 GBAD-MPS example with instance of normative pattern boxed and anomaly cir-cled.
Discovering patterns and anomalies in social networks is of particular in-terest. Here, we focus on social networks where the relationship links repre-sent communication between individuals. One communication-based socialnetwork that has garnered much interest is based on e-mail traffic. As TheNew York Times reported, it “. . . is a potential treasure trove for investiga-tors monitoring suspected terrorists and other criminals. . .” (Kolata, 2005, p.1). Until recently, researchers have struggled with being able to obtain cor-porate e-mail because of the obvious restrictions placed on releasing whatcould be sensitive information. However, with the Federal Energy RegulatoryCommission publication of the e-mail associated with the infamous EnronCorporation, researchers now have access to a rich data set of correspon-dences between management, lawyers, and traders, many of whom weredirectly involved in the scandal.
Another domain that has been the subject of data-mining activities in-volves the analysis of phone calls. Organizations such as the National SecurityAgency have spent the past several years collecting suspicious phone callsand storing them in a database (Cauley, 2006). The significance of being ableto peruse phone call information lies in the fact that an analyst can see whocalled whom, when they talked, for how long they talked, and the locationof both parties. In the case of cell phone calls, one can also ascertain the
Downloaded By: [Eberle, William] At: 15:03 10 January 2011

Insider Threat Detection 41
FIGURE 4 Graph substructure of e-mail data set.
specific global position of two entities. Such information has been usefulto not only general data mining research, but more specifically, researchin diverse areas such as marketing, terrorist monitoring, and social networkanalysis.
The following sections explore the detection of anomalies in the socialnetworks that can be found in both e-mail communications and cell phonetraffic.
E-mail Communications
One of the more recent domains that have become publicly available is thedata set of e-mails between employees from the Enron Corporation. TheEnron e-mail data set consists of not only messages, but also employeeinformation such as their full name and work title. By limiting our graphto the Enron employees and their correspondences, we are able to notonly create a social network, but also discover anomalous behaviors amongclasses of individuals (Eberle & Holder, 2009a). Thus, we generated graphson the basis of the social aspect and company position of employees thatstart a chain of e-mails, in which a chain consists of the originating e-mailand any subsequent replies or forwards to that corresponding e-mail. Eachgraph consists of the substructures shown in Figure 4.
Downloaded By: [Eberle, William] At: 15:03 10 January 2011

42 W. Eberle et al.
FIGURE 5 Anomalous instance (portion) of e-mail being forwarded.
In this representation, a graph consists of individual, disconnected sub-structures that represent the flow of each e-mail that originates from someonewith a specified employment title (e.g., Director). An e-mail can be sent byone or more TRANSFERs, from a SENDER (and their corresponding TITLE),to a RECEIVER (with the TITLE of the e-mail), and can either be sent back (asa reply or forward, called a STATE), with a unique message identifier (calleda MID), or forwarded/replied on to other entities (via a specific METHOD).There is no limit to the number of times a message can be replied/forwarded.
There are many different employee titles within Enron (i.e., managers,directors, chief executive officers), and each of the GBAD algorithms wereable to show different structural anomalies in the chains of e-mails thatoriginated along people’s company titles. For instance, running GBAD onthe graph that consists of e-mails originating from Directors, the anomalousinstance shown in Figure 5, visualized using the GraphViz tool (GraphViz),is discovered.
This anomalous instance consists of a message being sent from a directorto an employee (i.e., nonmanagement personnel), that was then forwarded toanother nonmanagement employee. What is interesting about this anomalyis that the data set consists of many e-mails that are sent to employees fromdirectors, but this is the only situation in which the employee FORWARDedthe e-mail on to another employee who was not privy to the original e-mail.Specifically, the e-mail started with Hyatt (director) regarding “Oasis DairyFarms Judgement,” who sent it to Watson (employee), which the employeeforwarded to Blair (employee).
Although applying GBAD-MPS and GBAD-P to the graph of e-mailsoriginating from personnel with the title of “trader” does not produce anysignificant anomalies, the GBAD-MDL algorithm does produce two anoma-lous instances. Figure 6 shows two situations in which a Trader was involvedin a chain of e-mails that resulted in correspondences to a chief executiveofficer and a president, respectively, that were not normal.
In terms of the first anomalous instance, shown in Figure 6, from ane-mail titled “Financial Disclosure of $1.2 Billion Equity Adjustment,” thereare only four e-mails that are sent to chief executive officers. However, this
Downloaded By: [Eberle, William] At: 15:03 10 January 2011

Insider Threat Detection 43
FIGURE 6 Anomalous instances of e-mails to a chief executive officer and to a president.
is the only example of an e-mail being sent to a chief executive officer; theother three e-mails are carbon copied. In the case of the second anomalousinstance shown in Figure 6, an e-mail titled “Fastow Rumor,” this is the onlytime that an e-mail is sent by a trader to a president.
Cell Phone Traffic
As part of the 2008 IEEE Symposium on Visual Analytics Science and Tech-nology (2008), we decided to apply our approaches to one of the mini chal-lenges that deals with cell phone traffic (Eberle & Holder, 2008). Althoughthe goal of the challenge is to target new visual analytics approaches, it isstill possible to apply these graph-based anomaly-detection algorithms to thesame data sets. One of the data sets consists of cell phone traffic betweeninhabitants of the fictitious island of Isla Del Sueno. The data consist of 9,834cell phone calls between 400 people over a 10-day period. The challenge isto describe the social network of a religious group headed by FerdinandoCattalano and how it changes over 10 days. A graph of the general structureof this cell phone traffic is represented as shown in Figure 7.
FIGURE 7 Graph of a cell phone call from the Visual Analytics Science and Technology dataset.
Downloaded By: [Eberle, William] At: 15:03 10 January 2011

44 W. Eberle et al.
FIGURE 8 Ferdinando/Catalano’s social structure with associated normative pattern andanomalies.
To answer the challenge, we focused on the social interactions by cre-ating a graph of the social network that indicated for a particular day, whocalled whom. On the basis of all of the information that was provided withthe challenge, we made the following assumptions about this particular dataset:
• The person with an ID of 200 is Ferdinando Catalano.• Anyone who Ferdinando Catalano calls (or who calls him) is in his “inner
circle.”• The person with an ID of 5 is Estaban Catalano, Ferdinando’s brother,
because he is called the most.• The person with an ID of 1 is David Vidro, because he talks the most with
the others with whom Ferdinando talks.
Starting with these simple assumptions, and a graph that consisted of verticesfor each unique ID with links between the vertices if there was a conversationon that day, we were able to create a simple visualization of Ferdinando’sinner circle social network structure (or Catalano/Vidro social structure) overthe 10 days that data were generated.
Figure 8 was rendered using AT&T’s graph visualization program,GraphViz. This visualization shows the graph structure of interactions be-tween people in 200’s (i.e., Ferdinando Catalano’s) inner circle (i.e., 200,
Downloaded By: [Eberle, William] At: 15:03 10 January 2011

Insider Threat Detection 45
1, 2, 3, 5, 97, and 137), the normative pattern within the graph, and theanomalous patterns in terms of the normative pattern.
In Figure 8, the substructure in the upper right shows the normativepattern that was discovered in this graph. The substructure consisting of anedge to the vertex labeled “96” is the anomaly that was discovered by theGBAD-P algorithm, which analyzes a graph for anomalous extensions to thenormative pattern. In this case, the fact that 5 called 97 was anomalous,compared with other instances of what was the normal social structure. Thethird substructure from the right across the top is the anomaly that wasdiscovered by the GBAD-MPS algorithm, which analyzes a graph for missingstructure. In this case, the fact that 200 did not talk to 3 on that day isconsidered anomalous.
Looking at the visualization shown in Figure 8 of the Catalano/Vidrocalling history, we are able to make several interesting observations abouthis social network:
• There are only nine substructures in the graph. This is because on Day 8,nobody in 200’s inner circle talked to each other. In other words, therewere no calls among 1, 2, 3, 5, 97, 137, or 200 on that day.
• Catalano/Vidro’s “normative” social pattern only occurs on Days 1, 2, 4, 5,and 7.
• Nobody from the “normative inner circle” (i.e., 1, 2, 3, 5, and 200), com-municates with anyone else in the normative circle after Day 7. Could itbe that Ferdinando sent them to the United States at this point?
• 200 communicates with both 97 and 137 on Day 9, and just 97 on Day 10.• 200 is involved in an inner circle conversation on every day (except Day
8).
We also played with several other variants of the graph, including the“directedness” of the graph. Although we chose an undirected graph forall of the previously shown results (because we considered a conversationbetween two people to be a two-way communication), we also looked at adirected version of the graph, in which the edge between two vertices wasdirected going from the person who called to the person who was beingcalled. When we did that, we noticed that 97 and 137 are never called by 1,2, 3, and 5—and they only call 5 and 200.
EXPERIMENTS ON BUSINESS PROCESSES
For years, companies have been analyzing their business processes for thepurposes of streamlining operations, discovering wasteful overhead, over-coming inefficiencies in production, and so forth. However, there have alsobeen several efforts applied toward analyzing business processes for fraud
Downloaded By: [Eberle, William] At: 15:03 10 January 2011

46 W. Eberle et al.
FIGURE 9 Depiction of an order fulfillment process; circled edge indicates a low-probabilityanomaly.
detection, which has led to an increase in pertinent data-mining activity.Most of these approaches have dealt with the visualization of business pro-cesses, such as VisImpact (Hao, Keim, Dayal, & Schneidewind, 2006). Someapproaches have used data/audit logs that are collected by a company in or-der to generate fraud alerts in near real time. Although there are approachesfor using graph-based data mining on domains such as intrusion detection(Staniford-Chen et al., 1996), little work has been done in the area of GBAD,especially for application to business processes, such as in document controland management systems.
To perform a systematic evaluation of the GBAD approach for iden-tifying anomalies, or insider threats, in business transactions or processes,we used the OMNeT++ discrete event simulator to model transactions andprocesses, generate transaction and process data, represent the data in graphform, and then analyze the graphs using GBAD (Eberle & Holder, 2009b).This process has two main benefits. First, we can model many differenttypes of transactions with known structure and known anomalies, whichallows us to easily verify GBAD’s ability to detect these anomalies. Second,the OMNeT++ framework can be used to model real business processes tofurther evaluate the real-world applicability of the GBAD approach. Here,we give a brief introduction of this process on a simple business transac-tion example, followed by a more complex example representing a knownbusiness process.
Order Processing
Consider the order-fulfillment process depicted in Figure 9. The processis initiated by the Customer placing an Order, which is sent to the Salesdepartment. The Sales department sends an Order Acknowledgement backto the Customer and sends an Internal Order to the Warehouse. Once the
Downloaded By: [Eberle, William] At: 15:03 10 January 2011

Insider Threat Detection 47
FIGURE 10 Partial OMNeT++ simulation output.
Warehouse ships the order, they send a Delivery Note to the Customer. Onepossible anomaly in this process is when someone in the Sales departmentcopies the Order to an Unknown entity, perhaps to leak insider informationto a competitor about the order.
We first define the structure of this network using OMNeT++’s Net-work Description Language and then define the flow of information withinC++ modules for each node. After receiving an Order message, the Salesmodule waits 10–60 seconds and then sends an Order Acknowledgementmessage to the Customer module, sends an Internal Order message to theWarehouse module, and with a Bernoulli probability of 0.001 (as defined inthe omnetpp.ini file) sends an Order message to the Unknown module.
Figure 10 shows a portion of the output from the order fulfillment sim-ulation. In addition to the logging information produced by OMNeT++, thefigure also shows the GBAD-related messages printed from each moduledescribing order-related messages as they are sent and received by the mod-ules. We use this information to construct graphs of the ordering process.
For the experiment depicted in Figure 9, representing the processingflow of 1,000 orders, we generated a graph of approximately 3,000 verticesand 4,000 edges. From this graph, GBAD is able to successfully discover,with no false positives, the known anomaly shown with dotted lines and alarger font in Figure 11, alongside two other nonanomalous instances of thenormative pattern.
Passport Applications
Another type of process for which we have applied our approaches, mo-tivated by two real-world sources of information, deals with document
Downloaded By: [Eberle, William] At: 15:03 10 January 2011

48 W. Eberle et al.
FIGURE 11 Subdue-formatted (partial) graph produced from GBAD-enhanced OMNeT++simulation output.
processing (Eberle & Holder, 2009b). One source is the incidents reportedin the CERT Insider Threat documents (Kowalski, 2008a, 2008b; Moore, Ran-dazzo, Keeney, & Cappelli, 2004) that involve privacy violations in a govern-ment identification card processing organization and fraud in an insuranceclaim processing organization. Another source, for which our model directlysimulates, is based on the process flow associated with a passport applica-tion (Chun, 2008). The outline of this process flow, depicted in Figure 12, isas follows:
1. The applicant submits a request to the frontline staff of the organization.2. The frontline staff creates a case in the organization’s database and then
submits the case to the approval officer.
FIGURE 12 Passport application process.
Downloaded By: [Eberle, William] At: 15:03 10 January 2011

Insider Threat Detection 49
3. The approval officer reviews the case in the database and then assigns thecase to one of the case officers. By default, there are three case officers inthe organization.
4. The assigned case officer reviews the case and may request additionalinformation from the applicant, which is submitted to the frontline staffand then forwarded to the assigned case officer. The assigned case officerupdates the case in the database on the basis of this new information.The assigned case officer may also discuss the case with one or more ofthe other case officers, who may review and comment on the case in thedatabase. Ultimately, the assigned case officer will recommend to acceptor reject the case. This recommendation is recorded in the database andsent to the approval officer.
5. Upon receiving the recommendation from the assigned case officer, theapproval officer will make a final decision to accept or reject the case.This decision is recorded in the database and sent to both the frontlinestaff and the applicant.
6. Last, upon receiving the final decision, the frontline staff archives the casein the database.
There are several scenarios in which potential insider threat anomalies mightoccur, including the following:
1. Frontline staff performing a review case on the database (e.g., invasion ofprivacy).
2. Frontline staff submits case directly to a case officer (bypassing the ap-proval officer).
3. Frontline staff recommends or decides case.4. Approval officer overrides accept/reject recommendation from assigned
case officer.5. Unassigned case officer updates or recommends case.6. Applicant communicates with the approval officer or a case officer.7. Unassigned case officer communicates with applicant.8. Database access from an external source or after hours.
Representing the processing of 1,000 passport applications, we generated agraph of approximately 5,000 vertices and 13,000 edges, and proceeded toreplicate some of the insider threat scenarios described earlier.
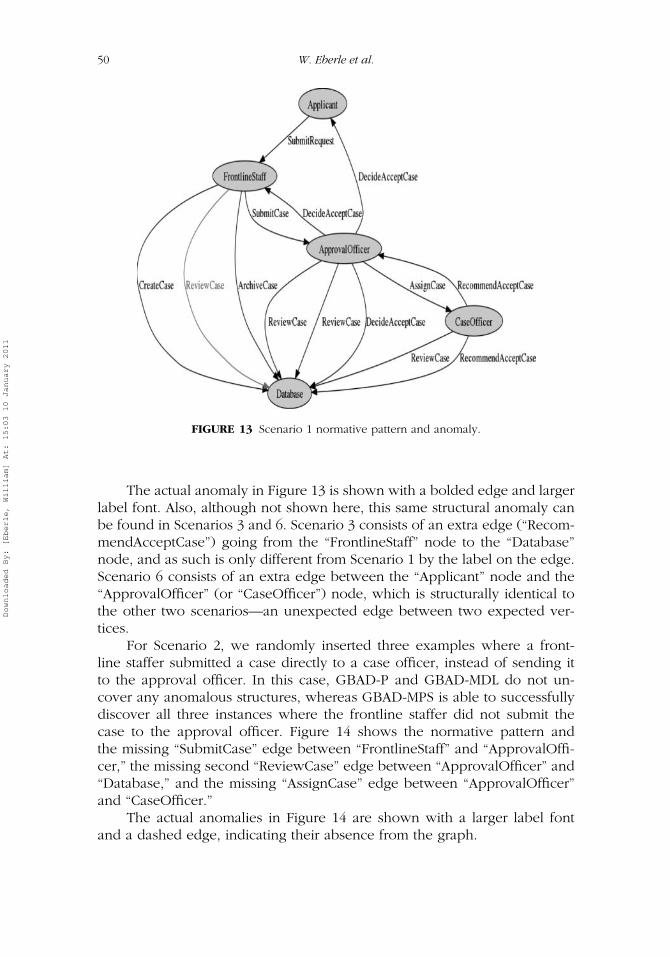
First, we randomly inserted an example that represents Scenario 1. Al-though the GBAD-MDL and GBAD-MPS algorithms do not discover anyanomalous structures, GBAD-P is able to successfully discover the onlyanomalous case out of 1,000 in which a frontline staffer was performinga review of a case—a clear violation of their duties. Figure 13 shows the nor-mative pattern and the anomalous edge “ReviewCase” between the “Front-lineStaff” node and the “Database” node.
Downloaded By: [Eberle, William] At: 15:03 10 January 2011
50 W. Eberle et al.
FIGURE 13 Scenario 1 normative pattern and anomaly.
The actual anomaly in Figure 13 is shown with a bolded edge and largerlabel font. Also, although not shown here, this same structural anomaly canbe found in Scenarios 3 and 6. Scenario 3 consists of an extra edge (“Recom-mendAcceptCase”) going from the “FrontlineStaff” node to the “Database”node, and as such is only different from Scenario 1 by the label on the edge.Scenario 6 consists of an extra edge between the “Applicant” node and the“ApprovalOfficer” (or “CaseOfficer”) node, which is structurally identical tothe other two scenarios—an unexpected edge between two expected ver-tices.
For Scenario 2, we randomly inserted three examples where a front-line staffer submitted a case directly to a case officer, instead of sending itto the approval officer. In this case, GBAD-P and GBAD-MDL do not un-cover any anomalous structures, whereas GBAD-MPS is able to successfullydiscover all three instances where the frontline staffer did not submit thecase to the approval officer. Figure 14 shows the normative pattern andthe missing “SubmitCase” edge between “FrontlineStaff” and “ApprovalOffi-cer,” the missing second “ReviewCase” edge between “ApprovalOfficer” and“Database,” and the missing “AssignCase” edge between “ApprovalOfficer”and “CaseOfficer.”
The actual anomalies in Figure 14 are shown with a larger label fontand a dashed edge, indicating their absence from the graph.
Downloaded By: [Eberle, William] At: 15:03 10 January 2011

Insider Threat Detection 51
FIGURE 14 Graph of Scenario 2, showing the normative pattern and missing edges.
For Scenario 4, we randomly modified three examples by changing therecommendation that the “CaseOfficer” sends to the “ApprovalOfficer.” Inone example, the “CaseOfficer” recommends to accept the case, and the rec-ommendation from the “ApprovalOfficer” is changed to rejecting the case,and in the other two examples the reverse is implemented. For this example,GBAD-MDL and GBAD-MPS do not find any anomalies, and GBAD-P onlydiscovers one of the anomalous examples (in which the “CaseOfficer” rec-ommends to reject the case but the “ApprovalOfficer” decides to accept thecase. Figure 15 shows the normative pattern and the anomalous structuresfrom this example.
When we have GBAD report on the top two most anomalous substruc-tures, instances of that type (reject changed to accept) are discovered, butwe are still missing the first anomalous example (accept changed to reject).The issue is that we are dealing with multiple normative patterns (i.e., mul-tiple substructures that can be considered normative in the entire graph.)In this case, there are two basic normative patterns—one in which the “Ap-provalOfficer” and “CaseOfficer” both accept a case, and one in which the“ApprovalOfficer” and “CaseOfficer” both reject a case. However, when wemodified the GBAD-P algorithm to analyze the top N normative patterns,both of the examples in which the “CaseOfficer” recommends rejecting thecase but the “ApprovalOfficer” accepts the case, are reported as the mostanomalous examples, and the next most anomalous instance reported is theother anomalous example. Also, no other substructures were reported as
Downloaded By: [Eberle, William] At: 15:03 10 January 2011

52 W. Eberle et al.
FIGURE 15 Graph of Scenario 4, showing the normative pattern and unexpected edge labels.
anomalous along with these top three anomalies (i.e., no false positives).This highlights a general issue with GBAD in regards to finding anomalieswhen multiple normative patterns exist in the graph. We discuss this issuein more detail in the “Discovering Anomalies to Multiple Normative Patternsin Structural and Numeric Data” section.
For Scenario 5, we randomly inserted into two examples the situa-tion in which a “CaseOfficer” recommends to accept a case for whichthey were not assigned. In this scenario, GBAD-MDL does not report anyanomalies, while both GBAD-MPS and GBAD-P each discover both anoma-lous instances. GBAD-MPS discovers the anomalies because the “CaseOffi-cer” has assigned himself to the case without any corresponding recommen-dation back to the “ApprovalOfficer” or “Database,” while GBAD-P uncoversthe extra “CaseOfficer” and his unauthorized assignment to the case. Figure16 shows the normative pattern and the anomalous structures from one ofthese examples. Also, although not shown, this same structural anomaly canbe found in Scenario 7. Scenario 7 consists of an extra edge going from theunauthorized “CaseOfficer” node to the “Customer” node and, as such, it isonly different from Scenario 5 by the label on the edge and the targetednode.
The added aspect of time, found in Scenario 8, involves the analysisof numerical attributes and how to incorporate them into the graph struc-ture. This will be discussed further in the “Discovering Anomalies to Multiple
Downloaded By: [Eberle, William] At: 15:03 10 January 2011

Insider Threat Detection 53
FIGURE 16 Scenario 5, unauthorized handling of a case.
Normative Patterns in Structural and Numeric Data” section, when we incor-porate numerical analysis with the structural analysis.
EXPERIMENTS ON CYBERCRIME
An example of cybercrime is the leaking of information by employees withaccess to confidential and sensitive information. As part of the 2009 IEEESymposium on Visual Analytics Science and Technology (2009), we againapplied our approaches to one of their mini challenges. Whereas the 2008challenge mentioned earlier focused on cell phone traffic, each of the 2009mini challenges consists of various aspects of a fictional insider threat, basedupon the leaking of information. The goal of these challenges is to allowcontestants to apply various visual analysis techniques so as to discover thespy and their associated actions.
Again, although our GBAD approaches are not visually based, we choseto apply our algorithms to the mini challenge that consists of badge andnetwork internet protocol (IP) traffic. The data set comprises employee badgeswipes during the month of January in 2008, and the IP log consists ofall network activity to and from the facility. One of the goals of this minichallenge was to determine which computers the “spy” used to send thesensitive information.
We can separate the cybercrime discovery process into three separatetasks:
Downloaded By: [Eberle, William] At: 15:03 10 January 2011

54 W. Eberle et al.
1. Discover the anomalous network activity.2. Create targeted graphs for just those days and people that might be in-
volved in the anomalous activity.3. Use GBAD to discover which employees participate in anomalous activity.
The first stage of this process is to discover the network activity that isunusual—or the source of illegal transmissions. Rather than apply a graph-based approach to the discovery of what would be numerical/statisticalanomalies (i.e., nonstructural anomalies), we can do a simple analysis of theactual records. Sorting the IP logs by amount of traffic, one discovers thatthe top five transmissions are all to the same destination IP, 100.59.151.133,on port 8080:
Synthetic Data 37.170.100.31 2008-01-15T17:03 100.59.151.133 8080 9513313 14324Synthetic Data 37.170.100.20 2008-01-24T17:07 100.59.151.133 8080 9732417 42347Synthetic Data 37.170.100.13 2008-01-22T08:50 100.59.151.133 8080 9984318 42231Synthetic Data 37.170.100.56 2008-01-29T15:41 100.59.151.133 8080 10024754 29565Synthetic Data 37.170.100.8 2008-01-31T16:02 100.59.151.133 8080 13687307 485421
In the IP log file, the first column is the type of data, the second columnis the source IP, the third column is the date and time, the fourth column isthe destination IP, the fifth column is the destination port, the sixth column isthe size of the transmission, and the final column is the size of the responserecord. In fact, 17 of the 32 highest transmission records have this samedestination IP—clearly an unusual volume of traffic to a single, externaldestination. In addition, with our graph-based approach, we can verify theanomalousness of the traffic upon the basis of the relation of the activitywithin the graph. For example, knowing that Employee 31’s computer isone of the computers that sent the supposedly illegal transmissions (see thetop record), we can analyze the subgraph of that employee’s activity on thatday.
To discover an insider committing this form of cybercrime, we maketwo reasonable assumptions:
1. The insider never uses his or her own computer (for fear of his or heractions being traced back to him or her).
2. The insider only uses the victim’s computer when that victim is in theclassified area (because that is the only time the insider knows that thevictim is not in his or her office).
Using these two assumptions, we can then focus on the generation of graphsthat (a) exclude people whose computer was compromised from being con-sidered as suspects and (b) reduce the graph search space to only those dayson which the illicit transmissions took place. In this data set, 10 employees
Downloaded By: [Eberle, William] At: 15:03 10 January 2011

Insider Threat Detection 55
FIGURE 17 7 Graph topological representation.
are removed from being considered as suspects, and only the activity ofother employees during the anomalous network activity are represented inthe graph. This will enable us to analyze abnormal structure in the graphduring the times of the crimes.
First, we create graphs consisting of subgraphs that represent employeemovements for each targeted day (i.e., the days when the illicit transmis-sions took place), as well as graphs that represent the movements for eachemployee over all of the targeted days. Each subgraph will contain a “back-bone” of movement vertices. Attached to the movement vertices will be twovertices representing where the person was before entering the current lo-cation and the current location (i.e., outside, building, classified). The edgeswill be labeled start and end, respectively. Then, if network traffic is sentbefore the person moves again, a network vertex will be created and linkedto the movement vertex via a sends edge. The network vertex will also belinked to a vertex with a numerical label, representing how many messagesare sent before the next movement occurs. The result is a graph topologicalrepresentation as shown in Figure 17.
In the partial example shown in Figure 18, a person enters from theoutside, transfers some data across the network, and then moves into theclassified area.
We created a tool to process the comma-delimited proxy log and IP logfiles and output graph files for use with GBAD. Once the graph files arecreated, GBAD can then be used to obtain the normative pattern discoveredin the specified graph input file and the top-N most anomalous patterns.
Using this graph representation, GBAD discovers the normative patternshown in Figure 19.
Downloaded By: [Eberle, William] At: 15:03 10 January 2011

56 W. Eberle et al.
FIGURE 18 Example movement and activity (partial graph shown).
After uncovering the normative pattern, GBAD can then use its threealgorithms to discover all of the possible structural changes that can exist ina graph (i.e., modification, deletions, and insertions).
The Visual Analytics Science and Technology data set consists of theactivities of 60 employees at an embassy during January 2008. As statedearlier, there are 17 transmissions to the suspect IP. On the basis of ourfirst assumption, we can remove 10 employees from the list of suspects(some employees’ computers were compromised more than once). We canalso reduce our data set down to just the days on which the anomaloustransmissions took place, which consists of 8 of the 31 available days worthof information. This subset of the data is then the baseline for our GBADanalysis.
Using these targeted graphs (8 day graphs and 50 people graphs), weran the GBAD algorithms using default parameter settings, where it would
FIGURE 19 Normative pattern.
Downloaded By: [Eberle, William] At: 15:03 10 January 2011

Insider Threat Detection 57
FIGURE 20 Anomalous structure (in the graph).
report only the most anomalous instances, rather than the top-K instances.On the graphs that represent individual people and their movements andnetwork activities across all targeted days, the GBAD-MDL algorithm discov-ers 12 employees as having anomalous movements and activities, and theGBAD-MPS algorithm reports 8 employees as anomalous. On the graphs thatrepresent all movements and activities for each targeted day, GBAD-MDL re-ports 6 employees as anomalous while GBAD-MPS reports two employees.However, there is an interesting commonality across all four experiments. Ifyou take the overlap (intersection) between them, in other words which em-ployees are reported in all of the experiments, one discovers that there areonly two employees that are very suspicious: Employee 49 and Employee30.
We can further distinguish a difference between these two employees byanalyzing the graphs and GBAD results. From the GBAD results, Employee30 is reported as the most anomalous (scorewise) on 6 of the 8 days, withEmployee 49 being the most anomalous on the other 2. Also, Employee 30is the only employee with the structural anomaly shown in Figure 20.
In Figure 20 (only the parts of the graph necessary for this observationare shown), one will notice that the employee initially moves from theoutside into the building. However, their next move is from the classifiedarea into the building—with no movement into the classified area beforethat. This is called piggybacking, in which an employee does not use his orher badge but instead follows on the heels of another employee. Yet, whileemployee 30 is not the only employee to piggyback into the classified area,he or she does it several times. Perhaps his or her intent is to gather classifiedinformation without a trace of ever entering the area. Unfortunately (for him
Downloaded By: [Eberle, William] At: 15:03 10 January 2011

58 W. Eberle et al.
or her), he or she had to badge-out of the area—resulting in a structuralanomaly in their movement.
It should also be noted that the GBAD-P algorithm does not reportany significant movement or activities as anomalous, but it does report thedifferences in network traffic sizes. In addition, it is interesting to note thatall of the anomalous activity takes place on Tuesdays or Thursdays. Futurework in anomaly detection could detect structural patterns in the anomaliesthemselves.
PERFORMANCE
Of course, the ability to discover anomalies is critical to the success of anyanomaly-detection system. However, to be useful as a real-world application,the performance of the algorithms must be viable for real-time analysis.
In previous work (Eberle & Holder, 2007), we demonstrated the ac-curacy of GBAD on real-world and synthetic graphs of varying sizes anddensity (number of vertices and edges). Recently, we conducted variousexperiments with GBAD to identify areas for further performance enhance-ments in regards to scalability by examining the relation between accuracyand efficiency as it relates to the graph topology. These efforts have focusedon identifying the performance of GBAD in terms of the following:
1. Measuring the effects on accuracy and efficiency as a function of the sizeof the input graph.
2. Measuring the effects on accuracy and efficiency as a function of the sizeof the normative pattern.
For the first set of experiments, we tested various graph input sizes(number of vertices). As an example of our results, Figure 21 shows a log-log plot of the running time of GBAD as a function of the graph size wherethe normative pattern has 10 vertices and 9 edges. Here, we see that all threeversions of GBAD run in time polynomial (degree just below 2.0) in the graphsize. This particular plot is for disconnected graphs, in which each instanceof the normative pattern appears in a separate graph and some instances arerandomly selected for the introduction of an anomaly (insertion, deletion, ormodification). In these experiments, all anomalies are found with no falsepositives.
Figure 22 shows a similar plot for connected graphs; that is, all instancesof the normative pattern appear in one connected graph. Here, again we seethat all three versions of GBAD run in time polynomial in the number ofvertices in the graph. Although all anomalies are found, there were somefalse positives found in the smaller graphs (3 at size 100, 2 at size 200, and 2at size 400). The main reason for this is that fewer random edges are needed
Downloaded By: [Eberle, William] At: 15:03 10 January 2011

Insider Threat Detection 59
FIGURE 21 GBAD running time as a function of graph size (number of vertices) for discon-nected graphs. This log-log plot shows that GBAD scales polynomial with graph size.
to connect the smaller graphs, and therefore, these edges appear anomalous.As the graph grows in size, the random edges appear with more frequencythan the anomalous edges and therefore appear less anomalous. Overall,these results show that GBAD scales well with graph size in both efficiency
FIGURE 22 GBAD running time as a function of graph size (number of vertices) for con-nected graphs. This log-log plot shows that GBAD scales polynomial with graph size.
Downloaded By: [Eberle, William] At: 15:03 10 January 2011

60 W. Eberle et al.
and accuracy, as GBAD’s running time is low-degree polynomial in the sizeof the input graph.
We then evaluated GBAD’s performance as the size of the normativepattern increases. We initially identified performance bottlenecks. For ex-ample, when GBAD looked for anomalies that were small modifications tothe normative pattern, after finding the normative pattern, GBAD had tofind close matches to the pattern (e.g., a graph with a vertex or edge labelchanged). As the normative pattern’s size increased, finding close matchesbecame increasingly costly in both memory and running time. The bottle-neck was basically due to the graph isomorphism test being performed onsubgraphs of the normative pattern as GBAD expanded these subgraphs tobecome the same size as the normative pattern, yet they were potentiallyanomalous. In response to this, we enhanced the GBAD algorithms with amore constrained matching technique that takes advantage of the fact thata large portion of the normative pattern and potential anomaly will matchexactly, and that the graph matching process should not try to undo this por-tion of the match. Adding this constraint alone results in a ∼40% speedup inrunning time.
For the second set of experiments, we analyzed GBAD’s performanceas it relates to both the size of the input graph and the size of the normativepattern. Before the enhancement, we noted a sharp increase in runtime asthe size of the normative pattern reached a certain percentage size of theinput graph. However, by implementing the enhancement described earlier,we are able to alleviate the increased runtime, in many cases achieving twoorders of magnitude speedup over the previous version, without sacrificingaccuracy. For example, Table 1 shows results for increasing sizes of norma-tive patterns for an input graph of size 1700 vertices. In this table, we seesignificant improvement at higher normative pattern sizes for modification-based anomalies (anomalies that are the same size as the normative pattern,but with a small difference). In the case of the 40 vertex normative pattern,the enhancement allowed GBAD to complete where it had not been able topreviously. This enhancement has also allowed processing of graphs up to60,000 vertices in less than 5 min.
However, there is still room for improvement. Figure 23 shows the run-ning time of GBAD with increasing input graph size for sparse graphs. Thelog-log plot indicates an approximately quadratic order of growth. Experi-ments on dense graphs show an even higher order of growth. Most of thistime is spent finding the normative patterns, which is currently done usingthe SUBDUE graph-based knowledge discovery approach (Cook & Holder,1998). SUBDUE has several parameters that limit the amount of computation(search) that is performed, and we are exploring better settings for theseparameters that reduce running time, but still find the correct normativepattern. Another approach would be to use a frequent subgraph discovery
Downloaded By: [Eberle, William] At: 15:03 10 January 2011

Insider Threat Detection 61
TABLE 1 Results for Different Normative Pattern Sizes for Each Anomaly Type on an InputGraph of 1700 Vertices
Size of Found False CPU seconds CPU secondsnormative Anomalous all False (before (afterpattern type anomalies? positives? enhancement) enhancement)
3v/2e Deletion Yes No 0.05Insertion Yes No 0.05Modification Yes No 0.05
5v/4e Deletion Yes No 0.12Insertion Yes No 0.13Modification Yes No 0.11
10v/9e Deletion Yes No 0.17Insertion Yes No 0.27Modification Yes No 0.57 0.22
20v/19e Deletion Yes No 0.36Insertion Yes No 0.64Modification Yes No 1346.26 0.37
40v/39e Deletion Yes No 6.27Insertion Yes No 1.45Modification Yes No (process killed after
a few days)6.78
algorithm, such as FSG (Kuramochi & Karypis, 2004) or gSpan (Yan & Han,2002), which tend to be more efficient than SUBDUE, given that they searchfor frequent subgraphs; whereas, SUBDUE searches for highly compressingsubgraphs.
FIGURE 23 GBAD running time with increasing input graph size.
Downloaded By: [Eberle, William] At: 15:03 10 January 2011

62 W. Eberle et al.
FIGURE 24 GBAD running time with increasing normative pattern size on a sparse graphwith 60,000 vertices.
On a more positive note, results of GBAD on a fixed-size sparse graphwith an increasing-sized normative pattern show fairly constant runningtimes. Figure 24 shows the running time of GBAD on a sparse graph of60,000 vertices as the size of the normative pattern increases. In sparsegraphs, GBAD’s running time is less influenced by the size of the norma-tive pattern, and most domains of interest to the insider threat problemare sparse. However, when the graph is dense, the size of the normativepattern does affect the running time of GBAD. Figure 25 shows GBAD’srunning time on a denser graph with 53,900 vertices as the size of the nor-mative pattern increases. Here, we see that larger normative patterns doincrease the running time in a dense graph. These results again indicatethat a reduction in the time to find the normative pattern can result in asignificant reduction in GBAD’s overall running time. We are continuing toinvestigate approaches to reduce the complexity of this phase of GBAD’sprocessing.
DISCOVERING ANOMALIES TO MULTIPLE NORMATIVE PATTERNSIN STRUCTURAL AND NUMERIC DATA
One of the primary issues with traditional anomaly-detection approaches istheir inability to handle complex, structural data. The advantage of GBAD
Downloaded By: [Eberle, William] At: 15:03 10 January 2011

Insider Threat Detection 63
FIGURE 25 GBAD running time with increasing normative pattern size on a dense graphwith 53,900 vertices.
is that the relations among elements can be analyzed, as opposed to justthe data values themselves, for structural oddities in what could be a com-plex, rich set of information. However, until now, attempts at applyinggraph-based approaches to anomaly detection have encountered two issues:(a) numeric values found in the data are not incorporated into the analysisof the structure, which could augment and improve the discovery of anoma-lies; and (b) the anomalous substructure may not be a deviation of themost normative pattern, but deviates from one of many normative patterns.The following proposes enhancements to existing graph-based anomaly-detection techniques that address these two issues and shows experimentalresults validating the usefulness of these enhancements.
Multiple Normative Patterns
One of the issues with this approach is that many data sets, when representedas a graph, consist of multiple normative patterns. For example, a graphof telephone calls across multiple customers or service providers containdifferent calling patterns. The normative “behavior” of one customer wouldnot be representative of another customer’s calling pattern. For this reason,most telecommunications’ fraud-detection systems use a profiling system todistinguish between different customer calling patterns (Cortes & Pregibon,
Downloaded By: [Eberle, William] At: 15:03 10 January 2011

64 W. Eberle et al.
FIGURE 26 Example of multiple normative patterns.
2001). However, the issue with these sorts of traditional systems is that theyare a type of supervised approach because they require a profile of thecustomer before they can detect anomalies.
The GBAD approach is unsupervised, discovering substructures that arethe smallest deviations from the normative pattern (i.e., the substructure thatbest compresses the graph). However, if we extend GBAD to consider thetop N normative substructures, we can then discover other deviations thatare potentially more anomalous. This results in the following change to thefirst step of each of the GBAD algorithms:
Find the N normative substructures Si that have the N smallest values forDL(Si)+DL(G |Si).
where N normative patterns are initially discovered, against which potentiallyanomalous instances are analyzed.
For example, suppose we have the graph in Figure 26.
Downloaded By: [Eberle, William] At: 15:03 10 January 2011

Insider Threat Detection 65
FIGURE 27 Depiction of application processing.
In Figure 26, the best normative pattern consists of the substructureoutlined in the big box. Then, using that normative pattern, GBAD wouldreport the two anomalous substructures shown in the small boxes. Howeverthere is another normative pattern that is the second best substructure inthe graph, shown outlined with an ellipse (in bold). From that normativepattern, a more anomalous substructure is discovered (shown in a smallerellipse, also in bold), as the probability of an extension to an A vertex israrer than the previously reported anomalous extensions (Y ) associated withthe first normative pattern.
To test this in a real-world scenario, we simulated a passport applica-tion document processing scenario on the basis of the process flow depictedin Figure 27. We generated a graph representing the processing of 1,000passport applications, consisting of approximately 5,000 vertices and 13,000edges. There are potentially two types of prevalent patterns in this type ofdata: (a) the ApprovalOfficer and CaseOfficer both accept a passport applica-tion, and (b) the ApprovalOfficer and CaseOfficer both reject an application.Therefore, potentially anomalous scenarios could exist where the Approval-Officer overrides the accept/reject recommendation from the assigned Case-Officer.
For our testing, we used the OMNeT++ tool to generate a graph con-sisting of these two normative patterns, although these patterns were notthe top-ranked most normative substructures. We then had the tool ran-domly insert an anomalous instance of the first type (case officer accepts, ap-proval officer rejects) and two anomalous instances of the second type (case
Downloaded By: [Eberle, William] At: 15:03 10 January 2011

66 W. Eberle et al.
FIGURE 28 Example of vertices labeled with numeric values.
officer rejects, approval officer accepts). Applying the GBAD algorithmsto this graph allowing only one normative pattern results in only one ofthe anomalous instances to be discovered. However, when we modify theGBAD-P algorithm (which was the only algorithm to discover an anomalousinstance) to analyze the top N normative patterns, where N is set arbitrarily to20, all three anomalous instances are reported as the most anomalous. Otherexperiments showed that the size of N was not important. For instance, inthis example, when we increase N to 100, the top three anomalies reportedare still the same ones. In addition, no other substructures are reported asanomalous along with these top three anomalies (i.e., no false positives).
Numerical Analysis
Although GBAD provides for the structural analysis of complex data sets,another one of the issues with this approach is the lack of analysis regardingthe numeric values that are present in certain data. GBAD has had successdiscovering anomalies regarding the relations among data entities (Eberle& Holder, 2007), including differences between node and link labels, butsometimes the distances between actual entity values needs to be considered.Take, for instance, the simple example shown in Figure 28.
In Figure 28, each person has a name and an age. Running GBADon this simple graph results in the reporting of the four age vertices as
Downloaded By: [Eberle, William] At: 15:03 10 January 2011

Insider Threat Detection 67
equally anomalous. Although each person has an age, because the ages havedifferent values, each person is each viewed as being structurally different.
Currently, GBAD-P calculates the probability of the existence of an edgeand/or vertex as follows:
P(attribute = value) = P(attribute exists)
where P(attribute exists) is in terms of the probability that it exists as anextension of the normative pattern. However, when we implement the fol-lowing change to the GBAD-P algorithm:
P ′(attribute = value) = P(attribute = value | attribute exists) ∗
P(attribute exists)
where the probability of the data is calculated as the probability of thevalue, given that the attribute even exists, times the probability that it exists.Calculating the mean and standard deviation for all attribute values, wecan generate P(attribute = value | attribute exists) by using a Gaussiandistribution:
ρ (x) = 1√2πσ
e
− (x − µ)2
2σ 2
where σ is the standard deviation and µ is the mean.Using the same simple example shown in Figure 28, the probability P(x)
that each age edge exists is 0.25. The mean of the age value is 37.75, andthe standard deviation is 4.03. When applying this revised probability P’,GBAD-P is able to correctly identify that while the structures are the same,with edges labeled “age,” the associated vertex with a labeled age of “32,”results in the lowest probability, P’(x), and thus the greater “anomalousness”(i.e., anomaly value closer to zero):
P′(age = 41) = 0.017876 P′(age = 38) = 0.024694P′(age = 40) = 0.021173 P′(age = 32) = 0.008946
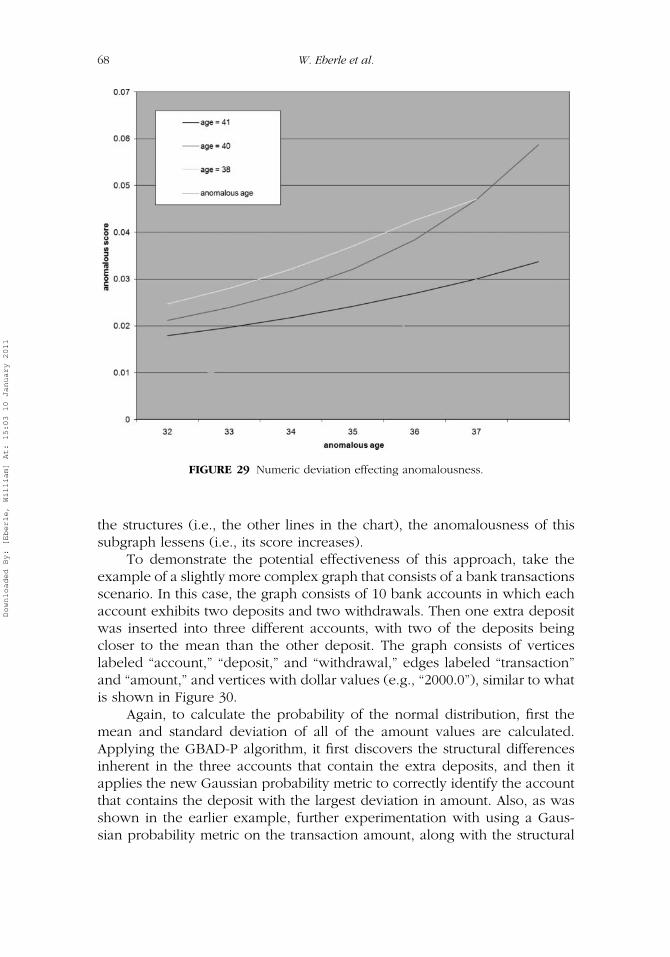
In addition, further experimentation with using a Gaussian probabilitymetric along with the structural anomalous metric indicates that any numericvalue less than one standard deviation results in the anomaly not being re-ported as anomalous. For example, Figure 29 shows how the anomalousnesslessens (anomalous score increases) as the numeric value gets closer to themean, where eventually the originally anomalous vertex is just as anoma-lous as another vertex. The bottom line in this chart (i.e., the values withthe lowest, and thus most anomalous, score) shows that as the age value isincreased, closing the gap between its value and the mean value of all of
Downloaded By: [Eberle, William] At: 15:03 10 January 2011
68 W. Eberle et al.
FIGURE 29 Numeric deviation effecting anomalousness.
the structures (i.e., the other lines in the chart), the anomalousness of thissubgraph lessens (i.e., its score increases).
To demonstrate the potential effectiveness of this approach, take theexample of a slightly more complex graph that consists of a bank transactionsscenario. In this case, the graph consists of 10 bank accounts in which eachaccount exhibits two deposits and two withdrawals. Then one extra depositwas inserted into three different accounts, with two of the deposits beingcloser to the mean than the other deposit. The graph consists of verticeslabeled “account,” “deposit,” and “withdrawal,” edges labeled “transaction”and “amount,” and vertices with dollar values (e.g., “2000.0”), similar to whatis shown in Figure 30.
Again, to calculate the probability of the normal distribution, first themean and standard deviation of all of the amount values are calculated.Applying the GBAD-P algorithm, it first discovers the structural differencesinherent in the three accounts that contain the extra deposits, and then itapplies the new Gaussian probability metric to correctly identify the accountthat contains the deposit with the largest deviation in amount. Also, as wasshown in the earlier example, further experimentation with using a Gaus-sian probability metric on the transaction amount, along with the structural
Downloaded By: [Eberle, William] At: 15:03 10 January 2011

FIG
UR
E3
0Exa
mple
ofan
om
alous
ban
ktran
sact
ions.
69
Downloaded By: [Eberle, William] At: 15:03 10 January 2011

70 W. Eberle et al.
anomaly metric indicates that any value less than one standard deviationresults in the anomaly not being reported as anomalous.
What makes this significant from a practical perspective is that althoughthe value of the anomalous deposit was high ($5,000 for this transaction, and$1,000 and $2,000 for the other two extra deposits), there were actually 11transactions of this same amount (i.e., out of 43 transactions, more than onefourth of the transactions were at the $5,000 level) within this graph. If onewere to perform a traditional numerical analysis of this value in terms of allof the deposits (and withdrawals) that were made, the value of $5,000 wouldnot have been interesting. However, when combined with the anomaly of theextra structure (i.e., an extra deposit transaction), then it becomes significant.
In addition, earlier we presented a passport application scenario whichincluded the situation in which an employee accesses the system after hours.Given that this scenario also includes some numerical analysis (hours), werepresented time in the graph as the number of hours since midnight, andwe used this enhanced statistical analysis of numerical attributes as part of itsevaluation of the graph structure. For this scenario, we randomly inserted twoanomalies into the graph, and the GBAD-P algorithm was able to successfullydiscover both anomalies where access to the company database was duringunexpected hours, with no false positives reported. Although the structurewas the same, the time information (represented as a number), providesextra information that aides in the insider threat detection.
DYNAMIC GRAPHS
So far, GBAD only detects anomalies in static graphs. However, many do-mains in which we desire to detect anomalies are dynamic; that is, theinformation is changing over time. One solution to this scenario is to collectdata over a time window, build a graph from this data that may or may notexplicitly represent time, and then apply GBAD to the graph. While this so-lution will find anomalies to patterns within the time window, any dynamiccomponent to the patterns and anomalies will rely on a proper representa-tion of time and a sufficiently long time window in which to observe thepatterns’ regularity.
One approach to detecting patterns of structural change in a dynamicgraph, which has been successfully applied to the domain of biologicalnetworks (You, Holder, & Cook, 2008b), is called DynGRL (You, Holder,& Cook, 2008a). In this approach, DynGRL first learns how one graph isstructurally transformed into another using graph rewriting rules, and thenabstracts these rules into patterns that represent the dynamics of a sequenceof graphs. The goal of DynGRL is to describe how the graphs change overtime, not merely whether they change or by how much.
Downloaded By: [Eberle, William] At: 15:03 10 January 2011
Insider Threat Detection 71
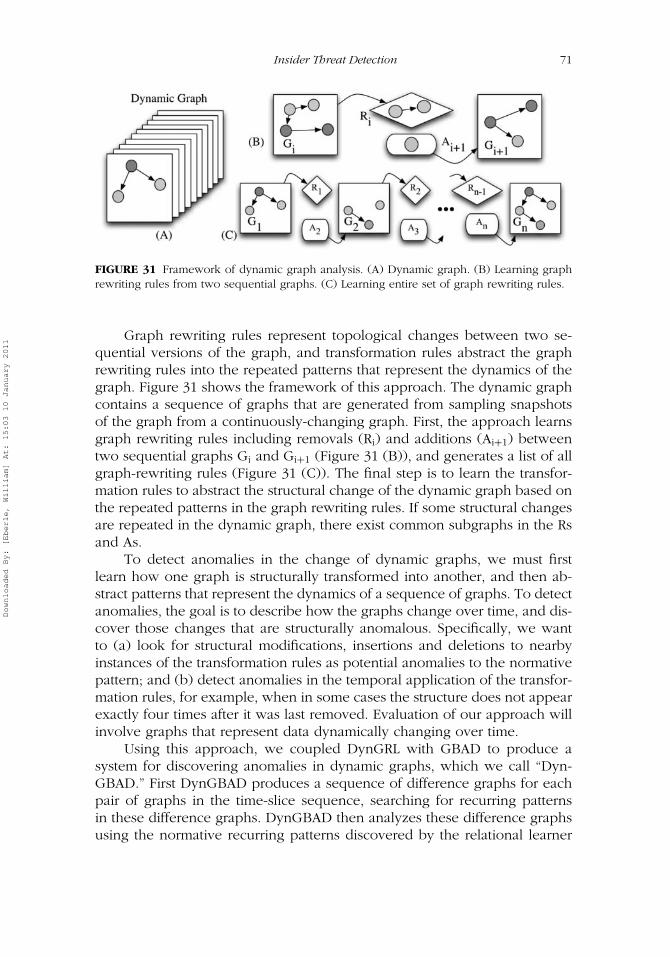
FIGURE 31 Framework of dynamic graph analysis. (A) Dynamic graph. (B) Learning graphrewriting rules from two sequential graphs. (C) Learning entire set of graph rewriting rules.
Graph rewriting rules represent topological changes between two se-quential versions of the graph, and transformation rules abstract the graphrewriting rules into the repeated patterns that represent the dynamics of thegraph. Figure 31 shows the framework of this approach. The dynamic graphcontains a sequence of graphs that are generated from sampling snapshotsof the graph from a continuously-changing graph. First, the approach learnsgraph rewriting rules including removals (Ri) and additions (Ai+1) betweentwo sequential graphs Gi and Gi+1 (Figure 31 (B)), and generates a list of allgraph-rewriting rules (Figure 31 (C)). The final step is to learn the transfor-mation rules to abstract the structural change of the dynamic graph based onthe repeated patterns in the graph rewriting rules. If some structural changesare repeated in the dynamic graph, there exist common subgraphs in the Rsand As.
To detect anomalies in the change of dynamic graphs, we must firstlearn how one graph is structurally transformed into another, and then ab-stract patterns that represent the dynamics of a sequence of graphs. To detectanomalies, the goal is to describe how the graphs change over time, and dis-cover those changes that are structurally anomalous. Specifically, we wantto (a) look for structural modifications, insertions and deletions to nearbyinstances of the transformation rules as potential anomalies to the normativepattern; and (b) detect anomalies in the temporal application of the transfor-mation rules, for example, when in some cases the structure does not appearexactly four times after it was last removed. Evaluation of our approach willinvolve graphs that represent data dynamically changing over time.
Using this approach, we coupled DynGRL with GBAD to produce asystem for discovering anomalies in dynamic graphs, which we call “Dyn-GBAD.” First DynGBAD produces a sequence of difference graphs for eachpair of graphs in the time-slice sequence, searching for recurring patternsin these difference graphs. DynGBAD then analyzes these difference graphsusing the normative recurring patterns discovered by the relational learner
Downloaded By: [Eberle, William] At: 15:03 10 January 2011

72 W. Eberle et al.
(DynGRL) and identifying anomalies to these patterns (GBAD). A dynamicanomaly may be a change in the dynamic pattern at some point in time (sim-ilar to what GBAD already does), but also may consist of a change in theperiod of recurrence of the pattern. Our hypothesis was that a representationthat links the difference graphs together will allow DynGBAD to detect suchanomalies.
To further explain how DynGBAD works, take the simple exampleshown in Figure 32. The general idea is that the subgraph consisting of ver-tices F, G and H appears and disappears regularly over time. Specifically,the subgraph appears and disappears in a 10100 pattern, where “1” meanspresence of the subgraph at that time, and “0” means its absence. However,at one point in the graph, the subgraph appears as 11000—an anomaly inthe regularity of the dynamic graph. Figure 32(a) shows the input dynamicgraph for this problem, and Figure 32(b) shows the normative pattern foundby GBAD in this dynamic graph. Figure 32(c) shows the anomaly found byGBAD. While this anomaly does not make obvious the change in regularityof the F-G-H subgraph, it is in fact the instance of the subgraph that occursat the time of the anomaly. So, GBAD does identify the anomalous event,just not in the form we would like to see. However, when we expand thesize of the dynamic graph to include more occurrences of the 10100 patternin the likelihood that GBAD can discover the entire 10100 sequence as thenormative pattern, the discovery of the 11000 anomaly is more apparent.Figure 33 shows the normative pattern found by DynGBAD after extendingthe size of the dynamic graph to include more instances of the normativepattern. In this case, DynGBAD finds the complete normative pattern consist-ing of two copies of the FGH subgraph separated by one time slice. Figure34 shows the anomaly found by DynGBAD in the extended dynamic graph.The blue vertices and edges (located inside the squiggly shape) representthe discovered normative pattern, the orange (located inside of the box) rep-resents the complete anomalous instance, and the red (located inside of theoval) indicates the specific anomaly that triggered the discovery of the entireanomalous instance. Here we see that DynGBAD finds the anomaly withina larger context; namely, two FGH subgraphs occur in two consecutive timeslices. So, in order to find the proper context, we must be sure that thenormative pattern occurs with sufficient frequency to be fully captured byDynGBAD; thus, allowing anomalies to these patterns to be discovered withsufficient context for a user to determine where they occur in the dynamicgraph and to what extent they differ from the normative pattern.
We have also done some initial real-world testing of our DynGBADapproach using the Enron e-mail data set. Previously, we have used GBADto analyze this data set by looking for anomalies in graphs representing thee-mail traffic of an employee, but we have yet to consider how this trafficchanged over time, or what anomalies to these time-changing patterns mayoccur. First, we changed the static representation of the Enron data to that
Downloaded By: [Eberle, William] At: 15:03 10 January 2011
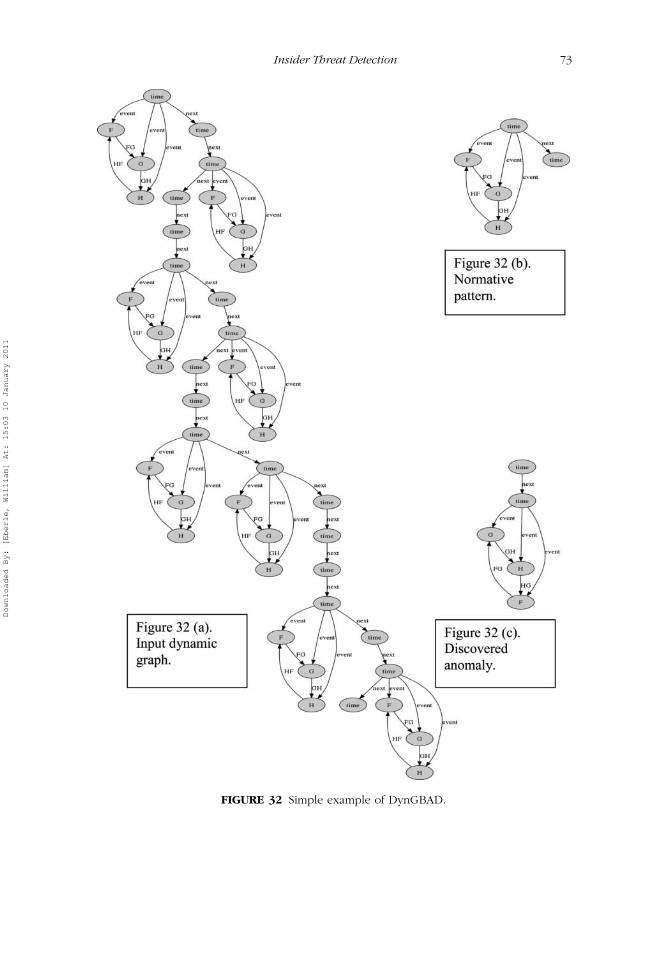
Insider Threat Detection 73
FIGURE 32 Simple example of DynGBAD.
Downloaded By: [Eberle, William] At: 15:03 10 January 2011

74 W. Eberle et al.
of a dynamic graph. Each dynamic graph consists of a sequence of graphs,each representing one day of e-mail activity for a particular employee (e.g.,Kenneth Lay). Figure 35 shows a portion of the graph of e-mails involv-ing Kenneth Lay on October 10, 2001. This is one graph in the sequencecomprising the dynamic graph. We initially applied DynGBAD on dynamicgraphs constructed from each day in October 2001 and on each Wednesday(an arbitrary day of the week, when perhaps there is the most activity) in2001. However, the normative pattern tends to be the message infrastruc-ture (“message,, “sender,” “original” nodes) and the resulting anomalies areuninteresting.
Figure 36 shows an alternative representation, where the message in-formation is removed and only the senders and receivers are included in thegraph as nodes. Our desire in analyzing this type of representation is that wewill discover patterns in how these graphs change over time (e.g., KennethLay e-mails Joannie Williamson every other week) and then anomalies tothese dynamic patterns (e.g., Kenneth Lay did not e-mail Joannie Williamsonon the second Wednesday of the month, as predicted by the normative
FIGURE 33 Normative pattern found by DynGBAD on extended dynamic graph.
Downloaded By: [Eberle, William] At: 15:03 10 January 2011

Insider Threat Detection 75
FIGURE 34 Anomaly found by DynGBAD on the extended dynamic graph. The structurein orange (inside the dashed-line-box) shows the occurrence of two F-G-H sugbraphs inconsecutive time slices, which is the correct anomaly.
pattern). Such anomalous behavior may prompt further investigation into anemployee’s activities.
The ability of DynGBAD to detect anomalies to patterns of changein dynamic graphs will open up a new dimension in the analysis of pro-cesses for detecting anomalies and insider threats. Given that an insidermay exhibit behavior that is structurally similar over time, detecting anoma-lies in the regularity of this behavior may be necessary to detect nefariousactivities.
Downloaded By: [Eberle, William] At: 15:03 10 January 2011

FIG
UR
E3
5G
raph
ofe-
mai
lsin
volv
ing
Ken
net
hLa
yon
Oct
ober
10,20
01.
76
Downloaded By: [Eberle, William] At: 15:03 10 January 2011

FIG
UR
E3
6A
ltern
ativ
egr
aph
ofin
form
atio
nw
ithonly
emplo
yees
repre
sente
das
nodes
inth
egr
aph.
77
Downloaded By: [Eberle, William] At: 15:03 10 January 2011

78 W. Eberle et al.
CONCLUSIONS AND FUTURE WORK
Using the MDL principle and probabilistic approaches, we have been able tosuccessfully discover anomalies in graphs and patterns of varying sizes withminimal to no false positives. Results from running the GBAD algorithmson e-mail, cell phone traffic, business processes and cybercrime, show howthese graph-theoretic approaches can be used to identify insider threats.Although we have been able to achieve some minimal successes when ap-plying graph-theoretic algorithms to dynamic graphs that change over time,clearly we have only begun to scratch the surface. In addition, we will con-tinuously explore the incorporation of traditional data-mining approaches asadditional quantifiers to determining anomalousness. Using the OMNeT++example, we can create limitless numbers and varieties of simulations model-ing business processes, network traffic, e-mail flows, and so forth. These canthen be used to evaluate GBAD systematically and on models of real-worldprocesses.
Two of the issues with current graph-based anomaly-detection ap-proaches are their inability to use numeric values along with their structuralanalysis to aid in the discovery of anomalies, and their inability to discoveranomalous substructures that are not part of the normative pattern. We willcontinue researching other numeric analysis approaches that can be incorpo-rated into the structural analysis so as to further delineate “anomalousness.”In addition, we will analyze our ability to discover an anomaly involving twodifferent numeric attributes that individually are not anomalous, but togetherare rare. We will also investigate the limitations involved with analyzing mul-tiple normative patterns, including how well this approach scales with thesize of the graph, number of normative patterns, and size of the normativepatterns.
In addition, we have only just begun to research the effectiveness ofapplying a graph-based approach to dynamic data. Further research into notonly the graph representation of dynamic data, but also the techniques foranalyzing graphs that represent data that is changing over time, will be valu-able for providing a more comprehensive graph-based anomaly-detectionapproach to discovering insider threats.
REFERENCES
Association of Certified Fraud Examiners. (2006). 2006 AFCE report to the nation onoccupational fraud & abuse. Austin, TX.
Blum, A., Levi, M., Naylor, T., & Williams, P. (1998). Financial Havens, BankingSecrecy and Money Laundering. United Nations Office for Drug Control andCrime Prevention.
Bush, J. (2009). Survey suggests economy could lead to cybercrime in-crease. Purdue University News Service. Retrieved March 19, 2009, fromhttp://www.purdue.edu/newsroom.
Downloaded By: [Eberle, William] At: 15:03 10 January 2011

Insider Threat Detection 79
Cauley, L. (2006). NSA has massive database of Americans’ phone calls.USA Today. Retrieved May 11, 2006, from http://www.usatoday.com/news/washington/2006-05-10-nsa x.htm
Chakrabarti, D. (2004). AutoPart: Parameter-free graph partitioning and outlier de-tection. PKDD 2004 Proceedings of the 8th European Conference on Princi-ples/Practices of Knowledge Discovery in Databases (112–124), New York, NY:Springer-Verlag.
Chun, A. (2008). An AI framework for the automatic assessment of e-governmentforms. AI Magazine, 29, 52–64.
Cook, D., & Holder, L. (1998). Graph-based data mining. IEEE Intelligent Systems,15, 32–41.
Cortes, C., & Pregibon, D. (2001). Signature-based methods for data streams. DataMining and Knowledge Discovery, 5, 167–182.
Diesner, J., & Carley, K. (2005). Exploration of communication networks from theEnron email corpus. Computational and Mathematical Organization Theory,11, 201–228.
Eberle, W., & Holder, L. (2007). Anomaly detection in data represented as graphs.Intelligent Data Analysis: An International Journal, 11, 663–689.
Eberle, W. & Holder, L. (2008). Analyzing Catalano/Vidro social structure usingGBAD. IEEE VisWeek Compendium (pp. 117–118). Piscataway, NJ: IEEE Press.
Eberle, W., & Holder, L. (2009a). Applying graph-based anomaly detection ap-proaches to the discovery of insider threats. In IEEE International Conferenceon Intelligence and Security Informatics (pp. 206–208). Piscataway, NJ: IEEEPress.
Eberle, W., & Holder, L. (2009b). Mining for insider threats in business transactionsand processes. In Computational Intelligence in Data Mining, IEEE SymposiumSeries on Computational Intelligence (pp. 163–170). Nashville, TN: IEEE Press.
Foley, L. (2008, June). ITRC breach meter reaches 342, to date. Reuters, June2008, Available at: http://www.prnewswire.com/news-releases/itrc-breach-meter-reaches-342-to-date-57558887.html.
GraphViz, Available at: http://www.graphviz.org.Hampton, M., & Levi, M. (1999). Fast spinning into oblivion? Recent developments in
money-laundering policies and offshore finance centres. Third World Quarterly,20, 645–656.
Hao, M. C., Keim, D. A., Dayal, U., & Schneidewind, J. (2006). Business processimpact visualization and anomaly detection. Information Visualization, 5, 15–27.
Kirk, J. (2009, March). In poor economy, IT pros could turn to e-crime. IDGNews Service, Retrieved March 24, 2009, from http://www.networkworld.com/news/2009/03409-in-poor-economy-it-pros.html.
Kolata, G. (2005, May). Enron offers an unlikely boost to e-mail surveillance. TheNew York Times. Retrieved May 22, 2005, from http://www.nytimes.com
Kowalski, E. (2008a). Insider threat study: Illicit cyber activity in thegovernment sector. Retrieved January 2008, from http://www.cert.org/insider threat/study.html.
Kowalski, E. (2008b). Insider threat study: Illicit cyber activity in the informa-tion technology and telecommunications sector. Retrieved January 2008, fromhttp://www.cert.org/insider threat/study.html.
Downloaded By: [Eberle, William] At: 15:03 10 January 2011

80 W. Eberle et al.
Kuramochi, M., & Karypis, G. (2004). An efficient algorithm for discovering fre-quent subgraphs. IEEE Transactions on Knowledge and Data Engineering, 16,1038–1051.
Kurucz, M., Benczur, A., Csalogany, K., & Lukacs, L. (2007, August). Spectral cluster-ing in telephone call graphs. Joint 9th WEBKDD and 1st SNA-KDD Workshop2007, San Jose, CA.
Lin, S., & Chalupsky, H. (2003). Unsupervised link discovery in multi-relational datavia rarity analysis. Proceedings of the 3rd IEEE ICDM International Conferenceon Data Mining (pp. 171–178). IEEE Computer Society, Washington, DC.
Martin, S., Nelson, B., Sewani, A., Chen, K., & Josephn, A. D. (2005, July). Analyzingbehaviorial features for email classification. CEAS 2005: Conference on Emailand Anti-Spam, Palo Alto, CA.
Moore, A. P., Randazzo, M., Keeney, M., & Cappelli, D. (2004). Insider threat study:Illicit cyber activity in the banking and finance sector. Retrieved August 2004,from http://www.cert.org/insider threat/study.html.
Noble, C., & Cook, D. (2003). Graph-based anomaly detection. Proceedings of the9th ACM SIGKDD International Conference on Knowledge Discovery and DataMining, 631–636, 2003, Washington, DC.
OMNeT++. Available at: http://www.omnetpp.orgPonemon, L. (2009). Cyber crime: The 2009 MegaTrend. CSO. Retrieved De-
cember 16, 2008 from http://www.computerworld.com/s/article/9123731/Cybercrime The 2009 megathreat.
Priebe, C. E., Conroy, J. M., Marchette, D. J., & Park, Y. (2005). Scan statisticson Enron graphs. Computational and Mathematics Organization Theory, 11,229–247.
Rattigan, M., & Jensen, D. (2005). The case for anomalous link discovery. ACMSIGKDD Exploration News, 7, 41–47.
Rissanen, J. (1989). Stochastic complexity in statistical inquiry. San Jose, CA: WorldScientific.
Shetty, J., & Adibi, J. (2005). Discovering important nodes through graph entropy:The case of Enron email database. KDD, Proceedings of the 3rd InternationalWorkshop on Link Discovery (74–81). Chicago, IL.
Staniford-Chen, S., Cheung, S., Crawford, R., Dilger, M., Frank, J., & Hoagland, K.(1996). GrIDS—A graph based intrusion detection system for large network.Proceedings of the 19th National Information Systems Security Conference, Bal-timore, MD.
Sun, J., Qu, H., Chakrabarti, D., & Faloutsos, C. (2005). Relevance search andanomaly detection in bipartite graphs. SIGKDD Explorations, 7, 48–55.
Swayne, D., Buja, A., & Temple Lang, D. (2003). Exploratory visual analysis ofgraphs in GGobi. Proceedings of the 3rd International Workshop on DistributedStatistical Computing, Vienna, Austria.
U.S. Department of Justice. (2009). Computer crime & intellectual property section.Available at: http://www.justice.gov/criminal/cybercrime
Vijayan, J. (2009). Insider at Cal Water steals $9M and runs. Computerworld Secu-rity, Retrieved May 26, 2009 from http://www.csoonline.com/article/493377/insider-at-cal-water-steals-9m-and-runs.
Visual Analytics Science and Technology. (2008). Challenge. Retrieved fromhttp://www.cs.umd.edu/hcil/VASTchallenge08
Downloaded By: [Eberle, William] At: 15:03 10 January 2011

Insider Threat Detection 81
Visual Analytics Science and Technology. (2009). Challenge. Retrieved fromhttp://www.cs.umd.edu/hcil/VASTchallenge09
Yan, X. & Han, J. (2002). gSpan: Graph-based substructure pattern mining. In Inter-national Conference on Data Mining (pp. 721–724). Maebashi City, Japan.
You, C., Holder, L., & Cook, D. (2008a). Graph-based data mining in dynamic net-works: Empirical comparison of compression-based and frequency-based sub-graph mining. IEEE International Conference on Data Mining Workshop onAnalysis of Dynamic Networks, Pisa, Italy.
You, C., Holder, L., & Cook, D. (2008b). Graph-based temporal mining of metabolicpathways with microarray data. ACM SIGKDD Workshop on Data Mining inBioinformatics, Las Vegas, NV.
Downloaded By: [Eberle, William] At: 15:03 10 January 2011