Embed Size (px)
Citation preview
University of São Paulo “Luiz de Queiroz” College of Agriculture
Strategies to improve kernel processing and dairy cow performance in whole-plant corn silage based on vitreous endosperm hybrid
Gustavo Gonçalves de Souza Salvati
Thesis presented to obtain the degree of Doctor in Science. Area: Animal Science and Pastures
Piracicaba 2019
Gustavo Gonçalves de Souza Salvati Animal Scientist
Strategies to improve kernel processing and dairy cow performance in whole-plant corn silage based on vitreous endosperm hybrid
versão revisada de acordo com a resolução CoPGr 6018 de 2011
Advisor: Prof. Dr. LUIZ GUSTAVO NUSSIO
Thesis presented to obtain the degree of Doctor in Science. Area: Animal Science and Pastures
Piracicaba 2019
2
Dados Internacionais de Catalogação na Publicação
DIVISÃO DE BIBLIOTECA – DIBD/ESALQ/USP
Salvati, Gustavo Gonçalves de Souza
Strategies to improve kernel processing and dairy cow performance in whole-plant corn silage based on vitreous endosperm hybrid / Gustavo Gonçalves de Souza Salvati. - - versão revisada de acordo com a resolução CoPGr 6018 de 2011. - - Piracicaba, 2019.
83 p.
Tese (Doutorado)- - USP / Escola Superior de Agricultura “Luiz de Queiroz”.
1. Processador de grãos 2. Fibra fisicamente efetiva 3. Endosperma vítreo 4. Digestibilidade de amido I. Título

3
“We are the average of the five people we spend the most time with”
Jim Rohn
4
ACKNOWLEDGMENTS
First of all, I thank God for giving me the gift of life and for all the people he has put
in my way.
To my parents, José Augusto and Ceyla Maria, for being my example of
extraordinary human beings. They always taught me to help others, and motivated me to
follow my dreams and to be the best version of myself.
To my brothers, Priscila and Igor, for all the support and for sharing happy moments.
To my girlfriend, Renata, who supported me in every step of this project with
patience and kindness.
To my friends from the Forage Quality and Conservation Group - QCF, for the
fellowship, the help during the stages of this work and for good moments of enjoyment.
To the Department of Animal Science's employees, who collaborated to this project
and with whom I also shared moments of enjoyment.
To my advisor, Dr. Luiz Gustavo Nussio, for his contribution to my professional
training through his instructions and opportunities during my PhD training.
To “Luiz de Queiroz” College of Agriculture, Animal Science and Pastures Graduate
Program, and the faculty team for the opportunity and supportduring my PhD training.
To FAPESP (The State of São Paulo Research Foundation) for my scholarship and
financial support.
To CAPES foundation for the my first scholarship
To Cargill for the donation of SoyPass®, Nutricorp for calcium soap of palm fatty
acids, Adisseo for Smartamine-M and Phileo-Lessafre for Procreatin7.
To support of TQR Agro, New Holland, Jumil and JF Máquinas during the harvest of
the treatments.
To Dr. Marcos Neves Pereira, for the contribution to my professional training when I
was an undergraduate student, and during my master's degree. Also, for accepting to join my
committee.
To Dr. Luiz Felipe Ferraretto, for his instructions during my international training at
the University of Wisconsin-Madison in 2014, a factor that contributed to the elaboration of
this project and to my professional training.
To Dr. João Luiz Pratti Daniel, for the intellectual contribution in my training during
graduation.
5
To Dr. Nilson Nunes Morais Júnior and his team for the contribution in the execution
of experiment 2 and in the starch analyzes of the other experiments.
To all my friends who shared this challenge with me. Especially Willian, who has
been my good friend since we were undergraduate students, your partnership was very
important during these last years.
To my English teacher, Lise, for corrections and friendship.
To my family, for giving me the opportunity to discover my gift of working with
dairy cows at the farm in Bom Jesus do Itabapoana-RJ.
To my grandparents (José Salvato in memmorian, Nadyr, José Alves and Zenilda)
and my great-grandmother (Idete) for unconditional support.
To my friend Diego Albino Lopes, in memmorian.
6
CONTENTS
RESUMO ................................................................................................................................... 7 ABSTRACT ............................................................................................................................. 10 LIST OF FIGURES ................................................................................................................. 13 LIST OF TABLES ................................................................................................................... 14 1. INTRODUCTION ............................................................................................................... 17 2. STRATEGIES TO MAXIMIZE KERNEL PROCESSING IN BRAZILIAN VITREOUS
ENDOSPERM HYBRID ......................................................................................................... 23 ABSTRACT ............................................................................................................................. 23
2.1. INTRODUCTION ......................................................................................................... 23 2.2. MATERIALS AND METHODS .................................................................................. 25
2.2.1. Silage production and treatments ........................................................................... 25 2.2.2. Physical and chemical characteristics .................................................................... 25 2.2.3. Statistical analysis .................................................................................................. 27
2.3. RESULTS...................................................................................................................... 27 2.3.1. Experiment 1 .......................................................................................................... 27 2.3.2. Experiment 2 .......................................................................................................... 29
2.4. DISCUSSION ............................................................................................................... 34 2.5. CONCLUSIONS ........................................................................................................... 37
3. HOW DOES A NOVEL PULL-TYPE FORAGE HARVESTER WITH KERNEL
PROCESSOR CHOP A VITREOUS CORN HYBRID? ........................................................ 41 ABSTRACT ............................................................................................................................. 41
3.1. INTRODUCTION ......................................................................................................... 41 3.2. MATERIALS AND METHODS .................................................................................. 42
3.2.1. Statistical analysis .................................................................................................. 44 3.3. RESULTS...................................................................................................................... 44 3.4. DISCUSSION ............................................................................................................... 46 3.5. CONCLUSIONS ........................................................................................................... 48
4. IMPACT OF KERNEL PROCESSING AND PARTICLE SIZE IN WHOLE PLANT
CORN SILAGE WITH VITREOUS ENDOSPERM ON DAIRY COW PERFORMANCE 51 ABSTRACT ............................................................................................................................. 51
4.1. INTRODUCTION ......................................................................................................... 52 4.2. MATERIALS AND METHODS .................................................................................. 53
4.2.1. Statistical analysis .................................................................................................. 61 4.3. RESULTS...................................................................................................................... 61 4.4. DISCUSSION ............................................................................................................... 71 4.5. CONCLUSIONS ........................................................................................................... 77
LITERATURE CITED……………………………………………………………………….77
7
RESUMO
Estratégias para melhorar o processamento de grãos e o desempenho de vacas leiteiras
em silagem de planta inteira de milho oriunda de híbrido de endosperma vítreo
Silagem de milho (SM) é a principal fonte de forragem para vacas leiteiras
em sistemas intensificados de produção no Brasil. O processamento adequado dos
grãos é crucial principalmente quando SM são oriundas de híbridos com
endosperma vítreo, os quais são mais difíceis de serem quebrados. Nesse sentindo
dois experimentos foram conduzidos para avaliar os efeitos do tamanho teórico de
corte (TTC) e do tempo de estocagem sobre o tamanho de partículas e o
processamento dos grãos em SM colhida com diferentes tipos de colhedoras. O
mesmo híbrido de milho vítreo DKB 177 VT PRO 2 foi usado em ambos os
experimentos. A média do teor de matéria seca da planta no momento da colheita
foi de 34,2%. No primeiro experimento, a lavoura de milho foi colhida por uma
colhedora de forragem tracionada por trator (CFTT; JF AT 1600, sem processador
de grãos) nos TTC de 3, 6 e 9-mm. No segundo experimento, a colheita foi
realizada por uma colhedora de forragem auto propelida (CFAP; New Holland,
FR 9050) nos seguintes TTC: 6, 12 e 18-mm com distância entre os rolos de 3-
mm. As SM foram armazenadas em mini-silos (4 repetições por tratamento) por 0,
35 e 140 dias. A vitreosidade foi medida por dissecação em grãos não
fermentados e foi de 65,6%. Os dados de ambos os ensaios foram analisados
como arranjo em parcelas subdivididas usando o procedimento MIXED do SAS
(SAS Institute Inc., Cary, NC). O modelo incluiu os efeitos fixos do TTC, tempo
de estocagem e a interação entre os mesmos. Na CFTT, os TTC de 3 e 6-mm não
impactaram na distribuição das partículas e no tamanho médio de partículas
(TMP). No entanto, o TTC de 9-mm aumentou a porcentagem de partículas acima
das 2 peneiras superiores do separador de partículas da Penn State e
consequentemente, o TMP. O aumento do TTC na CFAP levou a aumento da
porcentagem de partículas longas (> 19-mm) e do TMP. O tempo de estocagem
também aumentou porcentagem de partículas longas e TMP apenas para SM
colhida por CFAP. A estratégia de redução de TTC na CFAP melhorou a
porcentagem de grãos menores que 4,75-mm. Além disso, o TTC de 6-mm
proporcionou o melhor processamento de grãos nesta mesma colhedora. O tempo
de estocagem reduziu o tamanho de partículas da fração grãos para ambas as
colhedoras. O corn silage processing score (CSPS) aumentou apenas após 140
dias de estocagem somente para as amostras colhidas por CFAP. No terceiro
experimento, o objetivo foi avaliar o efeito de uma CFTT equipada com
processador de grãos (PG) regulado em diferentes tamanhos de corte sobre
características físicas de SM. Um híbrido de endosperma vítreo (BM 709,
Sementes Biomatrix) foi cultivado e colhido quando a MS da planta de milho
atingiu 34,8%. A plantação foi colhida com uma CFTP sem PG regulada para
TTC de 6 e 10-mm ou por uma CFTP com PG ajustada para os mesmos TTC. As
amostras de SM foram armazenadas por 35 dias. A vitreosidade foi de 62,4%. Os
dados foram analisados em delineamento inteiramente casualizado em arranjo
fatorial: 2 tipos de colhedoras × 2 TTC utilizando o procedimento MIXED da
SAS (SAS Institute Inc., Cary, NC). O modelo incluiu os efeitos fixos de
colhedora, do TTC e da interação dos mesmos. As seguintes diferenças ocorreram
8
apenas no TTC de 10-mm. O PG reduziu o material retido acima da peneira de
crivo de 19 mm de 4,7 para 1,8%, o que por sua vez aumentou a percentagem de
partículas abaixo da peneira de crivo de 8-mm e diminuiu o TMP. Este TTC
exibiu o valor mais alto de material retido na peneira de 8-mm e os valores mais
baixos na peneira de 4 mm para SM não processada. Tanto o processamento de
grãos e como a redução do TTC levaram a um aumento de partículas retidas na
peneira de 4 mm. O PG aumentou a porcentagem de grãos menores que 4,75 mm
de 56,4 para 80,0% e o teor de amido abaixo da peneira de 8-mm. O TTC de 6-
mm e o PG levaram a uma redução do tamanho geométrico dos grãos, com
subsequente aumento da área superficial. A nova CFTT com PG promoveu um
processamento mais intenso nos grãos. No quarto experimento, os objetivos do
estudo foram: 1) avaliar o efeito do processamento de grãos em um híbrido
brasileiro de endosperma vítreo e 2) aumento no tamanho de partículas da SM no
consumo, desempenho, digestibilidade dos nutrientes, comportamento alimentar e
perfil de ácidos graxos no leite de vacas leiteiras. Os seguintes tratamentos foram
realizados durante a colheita: 1) CFTT (sem PG, JF AT 1600) ajustada para um
TTC de 6-mm - PT6; 2) CFAP (New Holland, FR 9050) ajustada para um TTC de
6-mm - SP6; 3) CFAP ajustada para um TTC de 12-mm - SP12; e 4) CFAP
ajustada para um TTC de 18-mm -SP18. As SM foram estocadas por 9 meses. Os
CSPS das SM dos tratamentos foram: 32,1% (PT6), 53,9% (SP6), 49,0% (SP12) e
40,1 (SP18). Vinte e quatro vacas da raça Holandesa (139 ± 63 DEL) foram
blocadas e distribuídas em seis quadrados latinos 4 × 4, com período de 24 dias
(18 dias de adaptação). As dietas foram formuladas para conter (% MS) 48,5%
SM, 9,5% farelo de soja, 6,9% farelo de soja protegido, 15,1% milho moído seco,
15,5% polpa cítrica, 1,7% de minerais e vitaminas, 1,8% de sabão de cálcio de
ácidos graxos de palma e 1% de ureia. A composição nutricional das dietas (%
MS) foi: 16,5% PB, 28,9% FDN e 25,4% amido. Três contrastes ortogonais foram
usados para comparar os tratamentos: C1 = PT6 vs. SP6 (efeito do processamento
de grãos), C2 = SP6 vs. SP12 (efeito do tamanho de partículas) e C3 = SP12 vs.
SP18 (efeito do tamanho de partículas). Vacas alimentadas com SP6 apresentaram
maior produção de leite de 1,2 kg / d, sem alterações no consumo de matéria seca,
resultando em maior eficiência alimentar quando comparadas com PT6. A
digestibilidade do amido no trato total e a glicose plasmática também foram
maiores para as vacas alimentas com SP6. Além disso, as maiores secreções de
proteína (+ 36 g/d), lactose (+ 61 g/d) e sólidos do leite (+ 94 g/d) foram resultado
da melhora na produção de leite para as vacas do SP6. O mecanismo envolve uma
melhor digestibilidade dos nutrientes e disponibilidade de glicose para a síntese de
lactose pela glândula mamária. Não houve evidência de diferenças no consumo de
matéria seca (kg/d) entre os tratamentos colhidos por SPFH. As vacas do SP12
alcançaram a mesma produção de leite em relação ao SP6; no entanto, elas
tenderam a reduzir a concentração plasmática de D-lactato e o amiloide sérico A
(SAA), maximizando o tempo de mastigação e selecionando a favor de partículas
finas. No SP6, vacas selecionaram contra partículas finas e tenderam a aumentar
SAA em relação a PT6. O SP18 reduziu a digestibilidade do amido no trato total e
tendeu a reduzir a produção de leite e a glicose plasmática. O SP6 elevou o teor de
ácidos graxos da cadeia linear ímpar do leite em comparação ao PT6. No entanto,
uma redução desses mesmos ácidos graxos ocorreu no SP12 em relação ao SP6.
As vacas SP6 apresentaram maior teor de alguns ácidos graxos monoinsaturados
(C14:1 e C16:1), porém o oposto ocorreu para SP12. O processamento de grãos
nos TTC de 6 e 12-mm aumentou a digestibilidade de amido, glicose plasmática e

9
produção de leite, enquanto o TTC de 18-mm prejudicou o desempenho e a
digestibilidade de amido. O TTC de 12-mm melhorou o tempo de mastigação e
reduziu os marcadores de acidose subclínica no sangue. Estes resultados sugerem
que o tempo de estocagem de pelo menos 140 dias e TTC curto (6-mm) para
SPFH podem ser estratégias para maximizar o processamento de grãos e, assim, a
digestibilidade do amido em SM. Porém, para promover desempenho e saúde de
vacas leiteiras, o TTC de 12-mm é o indicado para colheita de híbridos de milho
endosperma vítreo para SM.
Palavras-chave: Endosperma vítreo; Tempo de estocagem; Processamento de
grãos; Tamanho teórico de corte; Digestibilidade de amido
10
ABSTRACT
Strategies to improve kernel processing and dairy cow performance in whole-plant corn
silage based on vitreous endosperm hybrid
Whole-plant corn silage (WPCS) is a major source of forage for lactating
dairy cattle in Brazil. Improved kernel processing may be especially advantageous
when feeding corn hybrids with vitreous endosperm, which are more difficult to
be broken. Two experiments were conducted to evaluate the effects of theoretical
length of cut (TLOC) and ensiling time on whole-plant corn silage (WPCS)
particle size and kernel processing with two types of forage harvesters. The same
vitreous corn hybrid DKB 177 VT PRO 2 was used in both experiments. In the
first experiment, the whole-plant corn was harvested by a pull-type forage
harvester (PTFH) at TLOC of 3, 6 and 9-mm. In the second experiment, the
harvesting was performed by a self-propelled forage harvester (SPFH) at the
following TLOC settings: 6, 12 and 18-mm with a roll gap of 3-mm. The WPCS
were stored for 0, 35 and 140 d. Vitreousness, measured by dissection in
unfermented kernels, averaged 65.6%. Data from both trials were analyzed as a
split-plot design using the procedure MIXED of SAS (SAS Institute Inc., Cary,
NC). The model included the fixed effects of TLOC, ensiling time and the
interaction TLOC × ensiling time. In PTFH, the TLOC of 3 and 6-mm did not
differ WPCS particle size distribution and mean particle length (MPL). However,
the TLOC of 9-mm increased particles above the top 2 sieves and, as a
consequence, the MPL. The rise of TLOC in SPFH led to a higher MPL and
percentage of long particles (> 19-mm). The ensiling time increased MPL and
long particles only for WPCS harvested by SPFH. The strategy of reducing TLOC
in SPFH increased the percentage of kernels smaller than 4.75-mm. Furthermore,
The TLOC of 6-mm led to the best kernel processing for SPFH. The ensiling time
reduced the particle size of kernel fraction for both forage harvesters. The corn
silage processing score only improved with 140 d of ensiling for SPFH samples.
In the third experiment the objective was to evaluate the impact of two types of
forage harvesters and two TLOC settings on the physical characteristics of WPCS.
A vitreous corn silage hybrid (BM 709, Sementes Biomatrix) was cultivated and
harvested when whole-corn plant DM achieved 34.8%. The whole-plant was
harvested with a conventional pull-type forage harvester (PTFH) without kernel
processor (KP) at 6 and 10 of theoretical lengths of cut (TLOC) or by a new
PTFH with KP at same TLOC settings. Whole-plant corn silage (WPCS) samples
were stored for 35 d. Vitreousness, measured by dissection in unfermented
kernels, averaged 62.4%. Data were analyzed as completely randomized design in
a factorial arrangement: 2 harvesters × 2 TLOC using the procedure MIXED of
SAS (SAS Institute Inc., Cary, NC). The model included the fixed effects of
harvester, TLOC and the interaction harvester × TLOC. The major differences
occurred only in TLOC of 10-mm. KP reduced the material above the 19-mm
sieve from 4.7 to 1.8% which, in turn, increased the percentage of particles below
8-mm sieve while MPL was decreased. This TLOC displayed the highest value of
material retained in the 8-mm and the lowest values in the 4-mm sieve for
unprocessed WPCS. Kernel processing and short TLOC led to a rise in particles
retained in a 4-mm sieve. KP increased the percentage of kernels smaller than
11
4.75-mm from 56.4 to 80.0% and the starch content below 8-mm sieve. The short
TLOC and kernel processing, together, led to a reduction of kernel geometrical
mean particle size (GMPS) followed by an increase of surface area. The new
PTFH with KP promoted more extensive and effective kernel breakage. The
impact of this harvester in WPCS particle size distribution was pronounced in the
TLOC of 10-mm which led to a drop in MPL. The reduction of TLOC for both
forage harvesters may be a good strategy to fracture corn kernels for WPCS at
34.8% of DM. In the fourth experiment, the objectives of this study were: 1) to
evaluate the effect of kernel processing on a Brazilian vitreous endosperm corn
hybrid and 2) the increment of particle size in WPCS on intake, lactation
performance, total-tract nutrient digestibility, feeding behavior and milk fatty
acids profile. The following treatments were performed during the harvest: 1)
pull-type forage harvester (without kernel processor, JF AT 1600) set for a 6-mm
theoretical length of cut (TLOC) – PT6; 2) self-propelled forage harvester (New
Holland, FR 9050) set for a 6-mm TLOC – SP6; 3) self-propelled forage harvester
set for a 12-mm TLOC – SP12; and 4) self-propelled forage harvester set for a 18-
mm TLOC – SP18. The WPCS of treatments were storaged for 9 months. The
CSPS of the WPCS were: 32.1% (PT6), 53.9% (SP6), 49.0% (SP12) and 40.1%
(SP18). Holstein cows (n = 24; 139 ± 63 DIM) were blocked and assigned to six 4
× 4 Latin squares, with 24-d period (18 d of adaptation). Diets were formulated to
contain (% DM) 48.5% WPCS, 9.5% soybean meal, 6.9% soybean meal non-
enzymatic browned, 15.1% dry ground corn, 15.5% citrus pulp, 1.7% minerals
and vitamins mix, 1.8% calcium soap of palm fatty acids, and 1% urea. Nutrient
composition of the diets (% DM) was: 16.5% CP, 28.9% NDF and 25.4% starch.
Three orthogonal contrasts were used to compare treatments: C1 = PT6 vs. SP6
(effect of kernel processing), C2 = SP6 vs. SP12 (effect of particle size) and C3 =
SP12 vs. SP18 (effect of particle size). Cows fed SP6 WPCS had greater 1.2 kg/d
milk yield with no changes in DMI, resulting in greater feed efficiency when
compared with PT6. The total-tract starch digestibility (TTSD) and plasma
glucose was also improved when cows were fed SP6. Moreover, the higher milk
protein (+ 36 g/d), lactose (+ 61 g/d) and solids (+ 94 g/d) secretions were a result
of the improvement in milk yield for SP6. In addition, the mechanism apparently
involved a better nutrient digestibility and glucose availability for the synthesis of
lactose by the mammary gland. There was no evidence for differences in DMI
(kg/d) among self-propelled treatments. The SP12 cows achieved the same milk
yield of SP6; however they tended to reduce plasma D-lactate and serum amiloyd
A (SAA) while maximizing chewing time and selecting for fine particles. In SP6,
cows selected against fine particles and tended to show higher levels of SAA than
PT6. The SP18 reduced TTSD and tended to reduce milk production, and plasma
glucose. The SP6 raised milk linear-odd chain fatty acids content in comparison
with PT6. Nonetheless, a reduction of these same fatty acids occurred in SP12 in
relation to SP6. SP6 cows had higher content of some monounsaturated fatty acids
(C14:1 and C16:1), however the opposite occurred for SP12. Kernel processing at
TLOC settings of 6 and 12-mm enhanced nutrient digestibility, plasma glucose
and milk yield, whereas the 18-mm TLOC impaired lactation performance and
TTSD. The TLOC of 12-mm improved chewing time and reduced blood sub-
acute acidotic markers. The findings of this set of studies suggest that ensiling
time and low TLOC in SPFH (6-mm) may be strategies to increase kernel damage
and thus starch digestibility in WPCS. Despite 6-mm TLOC has improved kernel

12
processing, the TLOC of 12-mm appeared to be the best setting to harvest whole-
corn plant to feed dairy cows.
Keywords: Vitreous endosperm; Ensiling time; Kernel processing; Theoretical
length of cut; Starch digestibility
13
LIST OF FIGURES
Figure 1. Interaction between TLOC and ensiling time for particles in the Penn State
Particle Size Separator pan (P =0.01; SEM = 0.08) ................................................................. 31
Figure 2. Interaction between TLOC and ensiling time for kernel particles retained in the
pan (P =0.10; SEM = 0.21) ...................................................................................................... 34
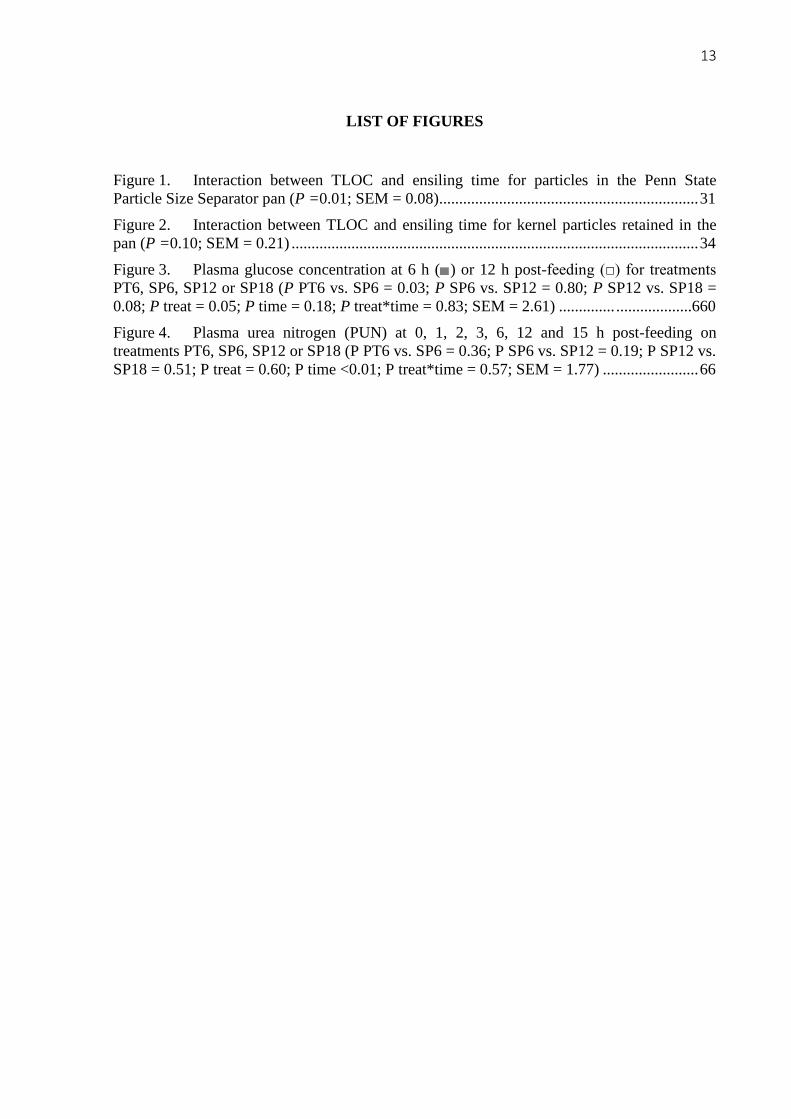
Figure 3. Plasma glucose concentration at 6 h ( ) or 12 h post-feeding (□) for treatments
PT6, SP6, SP12 or SP18 (P PT6 vs. SP6 = 0.03; P SP6 vs. SP12 = 0.80; P SP12 vs. SP18 =
0.08; P treat = 0.05; P time = 0.18; P treat*time = 0.83; SEM = 2.61) .............. ...................660
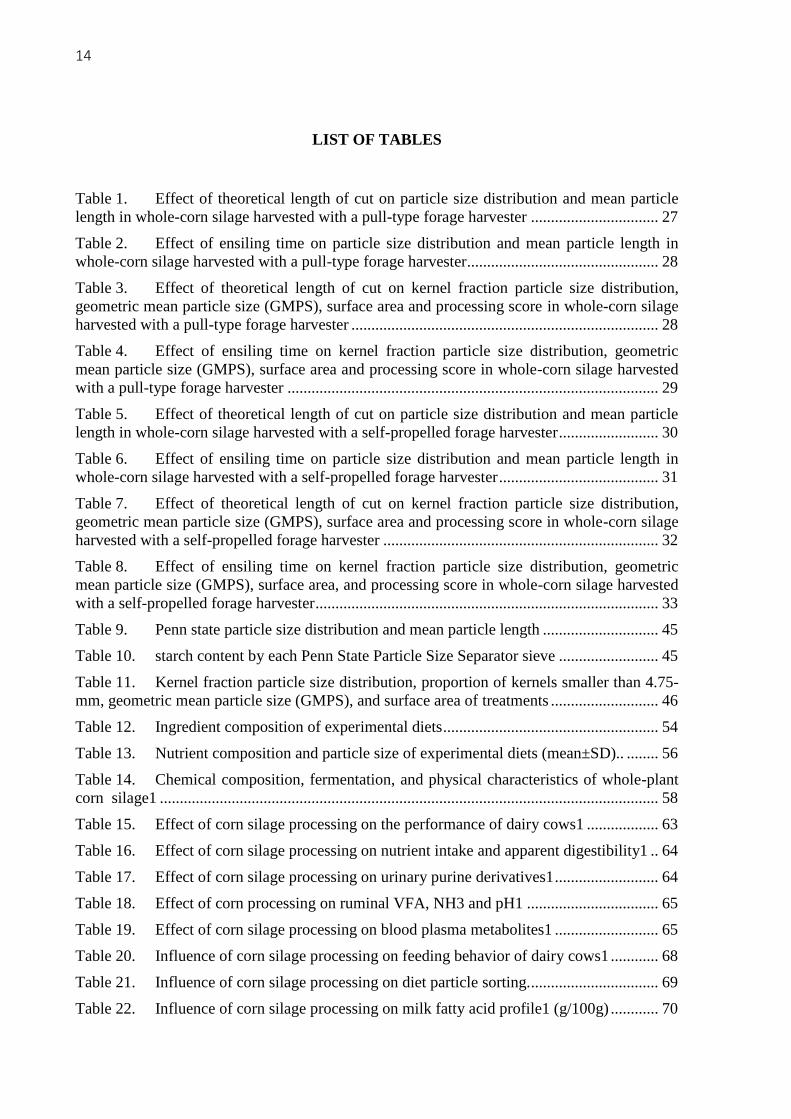
Figure 4. Plasma urea nitrogen (PUN) at 0, 1, 2, 3, 6, 12 and 15 h post-feeding on
treatments PT6, SP6, SP12 or SP18 (P PT6 vs. SP6 = 0.36; P SP6 vs. SP12 = 0.19; P SP12 vs.
SP18 = 0.51; P treat = 0.60; P time <0.01; P treat*time = 0.57; SEM = 1.77) ........................ 66
14
LIST OF TABLES
Table 1. Effect of theoretical length of cut on particle size distribution and mean particle
length in whole-corn silage harvested with a pull-type forage harvester ................................ 27
Table 2. Effect of ensiling time on particle size distribution and mean particle length in
whole-corn silage harvested with a pull-type forage harvester ................................................ 28
Table 3. Effect of theoretical length of cut on kernel fraction particle size distribution,
geometric mean particle size (GMPS), surface area and processing score in whole-corn silage
harvested with a pull-type forage harvester ............................................................................. 28
Table 4. Effect of ensiling time on kernel fraction particle size distribution, geometric
mean particle size (GMPS), surface area and processing score in whole-corn silage harvested
with a pull-type forage harvester ............................................................................................. 29
Table 5. Effect of theoretical length of cut on particle size distribution and mean particle
length in whole-corn silage harvested with a self-propelled forage harvester ......................... 30
Table 6. Effect of ensiling time on particle size distribution and mean particle length in
whole-corn silage harvested with a self-propelled forage harvester ........................................ 31
Table 7. Effect of theoretical length of cut on kernel fraction particle size distribution,
geometric mean particle size (GMPS), surface area and processing score in whole-corn silage
harvested with a self-propelled forage harvester ..................................................................... 32
Table 8. Effect of ensiling time on kernel fraction particle size distribution, geometric
mean particle size (GMPS), surface area, and processing score in whole-corn silage harvested
with a self-propelled forage harvester ...................................................................................... 33
Table 9. Penn state particle size distribution and mean particle length ............................. 45
Table 10. starch content by each Penn State Particle Size Separator sieve ......................... 45
Table 11. Kernel fraction particle size distribution, proportion of kernels smaller than 4.75-
mm, geometric mean particle size (GMPS), and surface area of treatments ........................... 46
Table 12. Ingredient composition of experimental diets ...................................................... 54
Table 13. Nutrient composition and particle size of experimental diets (mean±SD).. ........ 56
Table 14. Chemical composition, fermentation, and physical characteristics of whole-plant
corn silage1 ............................................................................................................................. 58
Table 15. Effect of corn silage processing on the performance of dairy cows1 .................. 63
Table 16. Effect of corn silage processing on nutrient intake and apparent digestibility1 .. 64
Table 17. Effect of corn silage processing on urinary purine derivatives1 .......................... 64
Table 18. Effect of corn processing on ruminal VFA, NH3 and pH1 ................................. 65
Table 19. Effect of corn silage processing on blood plasma metabolites1 .......................... 65
Table 20. Influence of corn silage processing on feeding behavior of dairy cows1 ............ 68
Table 21. Influence of corn silage processing on diet particle sorting................................. 69
Table 22. Influence of corn silage processing on milk fatty acid profile1 (g/100g) ............ 70

15
Table 23. Milk fatty acids as daily secretion (Assumes milk fat is 93.3% fatty acids and
6.7% glycerol) (g/d) .................................................................................................................. 71

16

17
1. INTRODUCTION
Whole-plant corn silage (WPCS) is a major source of forage for lactating dairy cattle
in Brazil (Bernardes and Rêgo, 2014), in the United States (Martin et al., 2017, Ferraretto et
al., 2018), and world-wide (Ferraretto et al., 2018). The high adoption of WPCS is due to the
provision of high energy (mainly from starch in the kernel fraction) and physically effective
NDF (peNDF; derived from the stover fraction, Ferraretto et al., 2018). Furthermore, WPCS
has high yield of low-cost starch per hectare (Wilkinson and Rinne, 2018), minimized risks of
production, flexibility to harvest corn for forage or kernel (Allen et al., 2003), rapid harvest,
and ease of ensiling (Nigon et al., 2016).
Approximately 72% of the kernel fraction is composed by starch (DM basis;
Huntington, 1997) that represents nearly 45% of the whole-plant DM (Philippeau and
Michalet-Doreau, 1998) and about half of the energy in WPCS (calculated using NRC, 2001).
The total-tract starch digestibility (TTSD, from 80 to 98%) of WPCS has high variability in
lactating dairy cows fed WPCS-based diets (Ferraretto and Shaver, 2012). Kernel processing
WPCS through rollers during harvest fractures corn kernels (Johnson et al., 1999; Shinners et
al., 2000) and increases TTSD (Bal et al., 2000). Nonetheless, its efficiency is influenced by
maturity, theoretical length of cut (TLOC), type of processor, roll speed differential and
processor roll-gap clearance (Shinners et al., 2000; Ferraretto and Shaver, 2012a,b). Kernel
vitreousness increases along with the maturity of WPCS (Philippeau and Michalet-Doreau,
1997), and with a high WPCS dry matter content (>40%) the TTSD was not improved by
kernel processing to the same extent as less mature WPCS (Ferraretto and Shaver, 2012). This
situation may occur in Brazilian vitreous corn hybrids even with a DM below 40%.
Extended ensiling time leads to a proteolysis of zein proteins and a disassociation of
starch-protein clusters in high-moisture corn which could allow for a greater surface area for
rumen bacteria (Hoffman et al., 2011). Higher values of proteolysis markers (soluble CP and
ammonia-N) followed by an improvement in ivSD have been observed in WPCS stored for
long periods of time (Ferraretto et al., 2015a). Ferraretto et al. (2015b) reported a rise of 7 to
10% units for corn silage processing score (CSPS) in WPCS ensiled for at least 30 d and up to
240 d.
Different corn silage processing has been implemented on some of the self-propelled
forage harvesters (SPFH) being used on farms. Changes include shredlage processors,
shredder rolls, conventional processors with greater roll speed differentials (Ferraretto et al.,
2018), and inter-meshing disc processors (Salvati et al., 2015). There has been interest in

18
setting the forage harvester for a longer theoretical length of cut (TLOC) with the aim of
increasing the mean particle length (MPL) of WPCS. To harvest WPCS, greater TLOC
settings (≥19-mm) are used on customized forage harvesters that are equipped with kernel-
processing rolls in an attempt to maintain or improve fiber effectiveness as the stover is also
crushed by the rolls (Johnson et al., 2003). Increasing the TLOC of forages might be a
strategy to increase the peNDF of diets (Mertens, 1997) which may improve rumination
activity, salivary buffering and rumen mat formation in dairy cows (Mertens, 1997; Zebeli et
al., 2012). However, the concerns of this practice is feed bunk sorting in high TLOC forages
(Vanderwerrff et al., 2015) that can make dairy cows prone to subacute ruminal acidosis
(SARA). We still are lacking scientific evidence to support this decision.
Despite the increase in custom contractors offering self-propelled forage harvester
(SPFH) services (Daniel et al., 2019), the most part of Brazilian dairy farmers harvest the
corn crop with a pull-type forage harvester (PTFH) without a kernel processor (KP;
Bernardes and Rego, 2014). In addition, the most cultivated hybrids have flint kernel with a
higher proportion of vitreous endosperm (Correa et al., 2002; Bernardes et al., 2018) which is
more difficult to damage during harvesting (Ferraretto et al. 2018); thereby compromising
kernel processing. In the United States, the typical range of TLOC to chop corn plants by
SPFH is from 19-mm to 26-mm (Grant and Ferraretto, 2018) and between 10 to 13-mm for
PTFH without kernel processor (Kung and Muck, 2017). However, the hypothesis of our
study was that to achieve adequate kernel processing in WPCS from vitreous endosperm
hybrid a lower TLOC and high ensiling time would be required for the both types of forage
harvesters (SPFH and PTFH).
References
Allen, M. S., J. G. Coors, and G. W. Roth. 2003. Corn silage. Pages 547-608 in Silage
Science and Technology. D. R. Buxton, R. E. Muck, and H. J. Harrison, ed. ASA, CSA,
and SSSA, Madison, WI.
Bal, M. A., R. D. Shaver, A. G. Jirovec, K. J. Shinners, and J. G. Coors. 2000. Crop
processing and chop length of corn silage: Effects on intake, digestion, and milk
production by dairy cows. J. Dairy Sci. 83:1264-1273.
Bernardes, T. F., and A. C. Rego. 2014. Study on the practices of silage production and
utilization on Brazilian dairy farms. J. Dairy Sci. 97:1852-1861.
19
Bernardes, T. F., J. L. P. Daniel, A. T. Adesogan, T. A. McAllister, P. Drouin, L. G. Nussio,
P. Huhtanen, G. F. Tremblay, G. Bélanger, and Y. Cai. 2018. Silage review: Unique
challenges of silages made in hot and cold regions. J. Dairy Sci. 101:4001-4019.
Correa, C. E. S., R. D. Shaver, M. N. Pereira, J. G. Lauer, and K. Kohn. 2002. Relationship
between corn vitreousness and ruminal in situ starch degradability. J. Dairy Sci. 85:3008-
3012.
Daniel, J. L. P., Bernardes, T. F., C. C. Jobim, P. Schmidt, and L. G. Nussio.Production and
utilization of silages in tropical areas with focus in Brazil. 2019. Grass Forage Sci. 1-13.
Dias Junior, G. S., L. F. Ferraretto, G. G. S. Salvati, L. C. de Resende, P. C. Hoffman, M. N.
Pereira, and R. D. Shaver. 2016. Relationship between processing score and kernel-
fraction particle size in whole-plant corn silage. J. Dairy Sci. 99:2719-2729.
Der Bedrosian, M. C., L. Kung Jr., and K. E. Nestor Jr.. 2012. The effects of hybrid, maturity
and length of storage on the composition and nutritive value of corn silage. J. Dairy Sci.
95:5115-5126.
Grant, R. J, and L. F. Ferraretto. Silage review: Silage feeding management: Silage
characteristics and dairy cow feeding behavior. J. Dairy Sci. 101:4111-4121.
Ferraretto, L. F., and R. D. Shaver. 2012a. Effect of corn shredlage on lactation performance
and total tract starch digestibility by dairy cows. Prof. Anim. Sci. 28:639-647.
Ferraretto, L. F., and R. D. Shaver. 2012b. Meta-analysis: Impact of corn silage harvest
practice on intake, digestion and milk production by dairy cows. Prof. Anim. Sci. 28:141-
149.
Ferraretto, L. F., P. M. Crump, and R. D. Shaver. 2015a. Effect of ensiling time and
exogenous protease addition to whole-plant corn silage of various hybrids, maturities and
chop lengths on nitrogen fractions and ruminal in vitro starch digestibility. J. Dairy Sci.
98:8869-8881.
Ferraretto, L. F., G. S. Dias Junior, L. C. de Resende, and R. D. Shaver. 2015b. Effect of
ensiling on kernel processing score in whole-plant corn silage harvested with varied
processors and settings. J. Dairy Sci. 98(Suppl. 2):689. (Abstr.)
Ferraretto, L. F., R. D. Shaver, and B. D. Luck. 2018. Silage review: Recent advances and
future technologies for whole-plant and fractionated corn silage harvesting. J. Dairy Sci.
101:3937-3951.
Hoffman, P. C., N. M. Esser, R. D. Shaver, W. Coblentz, M. P. Scott, A. L. Bodnar, R.
Schmidt, and B. Charely. 2011. Influence of inoculation and storage time on alteration of
the starch-protein matrix in high moisture corn. J. Dairy Sci. 94:2465-2474.
20
Huntington, G. B. 1997. Starch utilization by ruminants: From basics to the bunk. J. Anim.
Sci. 75:852-867.
Johnson, L., J. H. Harrison, C. Hunt, K. Shinners, C. G. Doggett, and D. Sapienza. 1999.
Nutritive value of corn silage as affected by maturity and mechanical processing: A
contemporary review. J. Dairy Sci. 82:2813-2825.
Johnson, L. M., J. H. Harrison, D. Davidson, W. C. Mahanna, and K. Shinners. 2003. Corn
silage management: Effects of hybrid, chop length, and mechanical processing on
digestion and energy content. J. Dairy Sci. 86:208-231.
Kung Jr., L., and R. E. Muck. Silage harvesting and storage. 2017. Pages 723-738 in Large
Dairy Herd Management (3oed.) edited by D. K. Beede. 1376 p.
Martin, N. P., M. P. Russelle, J. M. Powell, C. J. Sniffen, S. I. Smith, J. M. Tricarico, and R.
J. Grant. 2017. Invited review: Sustainable forage and kernel crop production for the US
dairy industry. J. Dairy Sci. 100:9479-9494.
Mertens, D. R. 1997. Creating a system for meeting the fiber requirements of dairy cows. J.
Dairy Sci. 80:1463-1481.
Nigon, B. J., K. J. Shinners, and D. E. Cook. 2016. Harvester modifications to alter
composition and dry matter of corn-silage. Appl. Eng. Agric. 32:157–167.
National Research Council. 2001. Nutrient requirements of dairy cattle. 7th rev. ed. Natl.
Acad. Sci., Washington D.C.
Philippeau, C., and B. Michalet-Doreau. 1997. Influence of genotype and stage of maturity of
maize on rate of ruminal starch degradation. Anim. Feed Sci. Technol. 68:25-35.
Philippeau, C., and B. Michalet-Doreau. 1998. Influence of genotype and ensiling of corn
kernel on in situ degradation of starch in the rumen. J. Dairy Sci. 81:2178-2184.
Salvati, G. S. S., R. D. Shaver, M. Lippert, E. Ronk, and C. Wacek-Driver. 2015. Corn Silage
Processing: Dairy Farm Survey. Accessed Feb. 16, 2019. https:// shaverlab .dysci .wisc
.edu/ wp -content/ uploads/sites/ 87/ 2015/ 04/ cornsilageprocessingsurveysummaryreport
.pdf.
Shinners, K. J., A. G. Jirovec, R. D. Shaver, and M. Bal. 2000. Processing whole-plant corn
silage with crop processing rolls on a pull-type forage harvester. Appl. Eng. Agric.
16:323-331.
Shinners, K. J. 2003. Engineering principles of silage harvesting equipment. Pages 361-403 in
Silage Science and Technology. D. R. Buxton, R. E. Muck, and H. J. Harrison, ed. ASA,
CSA, and SSSA, Madison, WI.
21
Vanderwerff, L. M., L. F. Ferraretto, and R. D. Shaver. 2015. Brown midrib corn shredlage in
diets for high-producing dairy cows. J. Dairy Sci. 98:5642-5652.
Wilkinson, J. M., and Rinne, M. 2017. Review: Highlights of progress in silage conservation
and future perspectives. Grass and Forage Science 73:40-52.
Zebeli, Q., J. R. Aschenbach, M.Tafaj, J. Boguhn, B. N. Ametaj, and W. Drochner. 2012.
Invited review: role of physically effective fiber and estimation of dietary fiber adequacy
in high-producing dairy cattle. J. Dairy Sci. 95:1041-1056.

22

23
2. STRATEGIES TO MAXIMIZE KERNEL PROCESSING IN BRAZILIAN
VITREOUS ENDOSPERM HYBRID
ABSTRACT
Whole-plant corn silage (WPCS) is a major source of forage for lactating
dairy cattle in Brazil. Improved kernel processing may be especially advantageous
when feeding corn hybrids with vitreous endosperm, which are more difficult to
be broken. Two experiments were conducted to evaluate the effects of theoretical
length of cut (TLOC) and ensiling time on whole-plant corn silage (WPCS)
particle size and kernel processing with two types of forage harvesters. The same
vitreous corn hybrid DKB 177 VT PRO 2 was used in both experiments. In the
first experiment, the whole-plant corn was harvested by a pull-type forage
harvester (PTFH) at TLOC of 3, 6 and 9-mm. In the second experiment, the
harvesting was performed by a self-propelled forage harvester (SPFH) at the
following TLOC settings: 6, 12 and 18-mm with a roll gap of 3-mm. The WPCS
were stored for 0, 35 and 140 d. Vitreousness, measured by dissection in
unfermented kernels, averaged 65.6%. Data from both trials were analyzed as a
split-plot design using the procedure MIXED of SAS (SAS Institute Inc., Cary,
NC). The model included the fixed effects of TLOC, ensiling time and the
interaction TLOC × ensiling time. In PTFH, the TLOC of 3 and 6-mm did not
differ WPCS particle size distribution and mean particle length (MPL). However,
the TLOC of 9-mm increased particles above the top 2 sieves and, as a
consequence, the MPL. The rise of TLOC in SPFH led to a higher MPL and
percentage of long particles (> 19-mm). The ensiling time increased MPL and
long particles only for WPCS harvested by SPFH. The strategy of reducing TLOC
in SPFH increased the percentage of kernels smaller than 4.75-mm. Furthermore,
The TLOC of 6-mm led to the best kernel processing for SPFH. The ensiling time
reduced the particle size of kernel fraction for both forage harvesters. The corn
silage processing score only improved with 140 d of ensiling for SPFH samples.
These findings suggest that ensiling time and low TLOC in SPFH (6-mm) may be
good strategies to increase kernel damage and thus starch digestibility in WPCS.
Keywords: Kernel particle size; Vitreous endosperm; Ensiling time; Theoretical
length of cut
2.1. INTRODUCTION
Whole-plant corn silage (WPCS) is the predominat source of forage for lactating
dairy cattle in Brazil (Bernardes and Rêgo, 2014) and worldwide (Ferraretto et al., 2018). It is
a high-energy forage composed by stover and kernel fractions which are rich in NDF and
starch contents, respectively (Dias Junior et al., 2016). For the greatest availability of starch in
WPCS the kernel processing is crucial (Ferraretto and Shaver, 2012). Despite the increase in

24
custom contractors offering self-propelled forage harvester (SPFH) services (Daniel et al.,
2019), the most part of Brazilian dairy farmers harvest the corn crop with a pull-type forage
harvester (PTFH) without a kernel processor (KP; Bernardes and Rego, 2014). This is a
concern because the most cultivated hybrids in Brazil have vitreous kernels with higher
vitreous endosperm proportion (Correa et al., 2002; Bernardes et al., 2018). Futhermore,
higher vitreous endosperm is related to kernel hardness (Correa et al., 2002) which makes
kernels more difficult to be broken by the harvester’s processors (Ferraretto et al. 2018) and
this could be worse for a PTFH without KP.
Kernel processing WPCS by rollers during harvest fractures corn kernels (Johnson
et al., 1999, Shinners et al., 2000) and increases total-tract starch digestibility (TTSD; Bal et
al., 2000). Nonetheless, its efficiency is influenced by maturity, theoretical length of cut
(TLOC), type of processor, roll speed differential and processor roll-gap clearance (Shinners
et al., 2000; Ferraretto and Shaver, 2012a,b). Kernel vitreousness increases throughout the
maturity of WPCS (Johnson et al., 1999) and with a high WPCS dry matter content (>40%)
the TTSD is reduced (Ferraretto and Shaver, 2012). This situation can occur in Brazilian
vitreous corn hybrids even with a DM below 40%.
The in vitro starch digestibility (ivSD) of WPCS is improved by a longer length of
storage (Der Bedrosian et al., 2012). Extended time stored in silos leads to a proteolysis of
zein proteins and a disassociation of starch-protein clusters in high moisture corn which could
allow for a greater surface area for rumen bacteria (Hoffman et al., 2011). Higher values of
proteolysis markers (soluble CP and ammonia-N) followed by an improvement in ivSD have
been observed in WPCS stored for long periods of time (Ferraretto et al., 2015a). Ferraretto et
al. (2015b) reported a rise of 7 to 10%-units for corn silage processing score (CSPS) in
WPCS ensiled for at least 30 d and up to 240 d. Based on this, it is possible to presume that a
increased length could reduce kernel particle size.
In general, dairy farmers increase TLOC with the aim of increasing particle size of
WPCS and thereby achieving a greater physically effective fiber (peNDF; Mertens, 1997;
Ferraretto et al., 2018). For WPCS the TLOC is usually between 10 to 13-mm for
unprocessed and about 19-mm for processed (Shinners et al., 2003; Kung and Muck, 2017).
Ferraretto and Shaver et al. (2012) reported no impact of kernel processing in ruminal starch
digestibility when WPCS was harvested with a high TLOC (> 32-mm). The hypothesis of our
study was that in order to achieve adequate kernel processing in vitreous endosperm hybrid, a
lower TLOC and a longer length of storage would be required. The objective of this study was
25
to evaluate the impact of two different types of forage harvesters, TLOC settings and ensiling
time on the physical characteristics WPCS.
2.2. MATERIALS AND METHODS
2.2.1. Silage production and treatments
Three hectares of a vitreous corn silage hybrid (DKB 177 VT PRO 2, Dekalb,
Monsanto, Dekalb, Illinois, USA) were sown on November 4, 2015, at a density of 68,750
seeds per hectare at the Luiz de Queiroz College of Agriculture – University of São Paulo
(Piracicaba, São Paulo, Brazil). The harvesting occurred on February 17, 2016, at
approximately 34.0% DM of the whole-plant corn. The field was harvested in alternating
strips in an attempt to keep similar nutrient composition among the treatments. The treatments
were performed during the harvest. Corn vitreousness was determined by manual dissection
of the kernels (Dombrink-Kurtzman and Bietz, 1993) in fifteen ears collected from the corn
crop according to the procedure described by Correa et al. (2002).
In the first experiment, a PTFH without KP (JF AT 1600; JF Máquinas Agrícolas,
Itapira, Brazil) set for a TLOC of 3, 6 and 9-mm was used in impose harvesting treatments.
The samples of 8.5 kg were ensiled in 10-L bucket (density of 850 kg.m-3
) and stored for 0,
35 and 140 d. This experiment consisted of 9 treatments (3 lengths of cut and 3 lengths of
storage) and 36 mini-silos (4 replications per treatment). In the second experiment, a SPFH
(FR 9050; CNH Industrial, New Holland, Pennsylvania, USA) equipped with conventional
rolls set at a 3-mm roll-gap and 20% roll speed differential was used to harvest the following
TLOC treatments: 6, 12, and 18-mm. All samples were ensiled as described in the first
experiment. Again, this experiment also consisted of 9 treatments (3 lengths of cut and 3
lengths of storage) and 36 mini-silos (4 replications per treatment). The mini-silos were stored
at natural environment conditions until achieving the targeted of length of storage. After the
storage period reached 35 and 140 d, the mini-silos were opened and the samples were
manipulated immediately.
2.2.2. Physical and chemical characteristics
The samples of WPCS were homogenized manually and divided into 4 equal
subsamples of 500 g using a quartering technique. The first subsample, as-fed WPCS samples
26
were used for the determination of particle size distribution and MPL using a Penn State
Particle Size Separator (PSPS). The PSPS procedure was conducted manually using 3 sieves
(19, 8 and 1.18-mm) and a bottom pan according to the method of Kononoff et al. (2003).
The second subsample was dried at 60°C for 48 h in a forced-air oven and then
ground to pass through a 1-mm Wiley mill screen (Arthur H. Thomas). The DM (method
942.05) and ether extract (method 2003.05) were determined as described by AOAC
International (2012). Concentration of CP was determined as N x 6.25 after analysis with a N
analyzer (Leco FP-2000; Leco Corp., St. Joseph, MI, USA) by the Dumas method (Wiles et
al., 1998). The NDF was analyzed using a TE–149 fiber analyzer (TECNAL Equipamentos
para Laboratórios, Piracicaba, Brazil) with heat-stable α-amylase and sodium sulfite (method
2002.04, AOAC, 2012). Starch was analyzed according to Hall et al. (2015). This data was
used only for the description of WPCS nutritional composition.
The third subsample was not ground. It was dried at 60°C for 48 h in a forced-air
oven to evaluate corn silage processing score (CSPS) as described by Ferreira and Mertens
(2005). In the fourth subsample, kernel and stover fractions were separated by a
hydrodynamic separation procedure (Savoie et al., 2004). This method is based on differences
in buoyancy between the kernels and stover. Because all samples were fermented for at least
35 d, which is thought to make the separation process more difficult, all samples were dried in
a forced-air oven set at 60°C for 48 h prior to immersion in water as recommended by Savoie
et al. (2004). Each sample of approximately 400 g of DM was placed in a 10-L rectangular
tub containing 7 L of water. Each dried sample was gently agitated manually for 2 min such
that the entire sample was submerged in water. After 2 min, the stover fraction which floated,
due to a lower density than water, was removed gently using a small 1.18-mm sieve (Savoie
et al., 2004). After separation, the kernel-fraction was transferred to aluminum plates, re-dried
at 60°C for 48 h in a forced-air oven and dry-sieved using a Tyler Ro-Tap Shaker (model RX-
29, Tyler, Mentor, OH) with a set of 9 sieves with nominal square apertures of 9.50, 6.70,
4.75, 3.35, 2.36, 1.70, 1.18, 0.59-mm and bottom pan. The geometrical mean particle size
(GMPS; µm) and surface area (cm2.g
-1) were calculated using a log normal distribution
(Baker and Herrman, 2002) as described by Dias Junior et al. (2016). The proportion of
kernels smaller than 4.75-mm was calculated by the sum of percentages retained at 3.35, 2.36,
1.70, 1.18 and 0.59-mm sieves and bottom pan (Dias Junior et al., 2016).
27
2.2.3. Statistical analysis
Data from both trials was analyzed as a split-plot design using the procedure MIXED
of SAS (SAS Institute Inc., Cary, NC). The model included the fixed effects of TLOC,
ensiling time and the interaction TLOC × ensiling time. A mini-silo was used as the
experimental unit. Means were determined using the LSMEANS statement and were
compared using the Tukey test at 5 % of significance. Statistical significance and trends were
considered at P ≤ 0.05 and P > 0.06 to P ≤ 0.10, respectively.
2.3. RESULTS
The kernel vitreousness of the hybrid was 65.6 ± 3.7% of total endosperm (data not
shown in tables or figures). The chemical composition of whole-plant corn was (% of DM)
6.4 ± 1.4 for CP, 3.4 ± 1.4 for EE, 43.6 ± 0.8 for NDF and 30.6 ± 1.7 for starch. The average
of DM among treatments (% of as fed) was 35.2%.
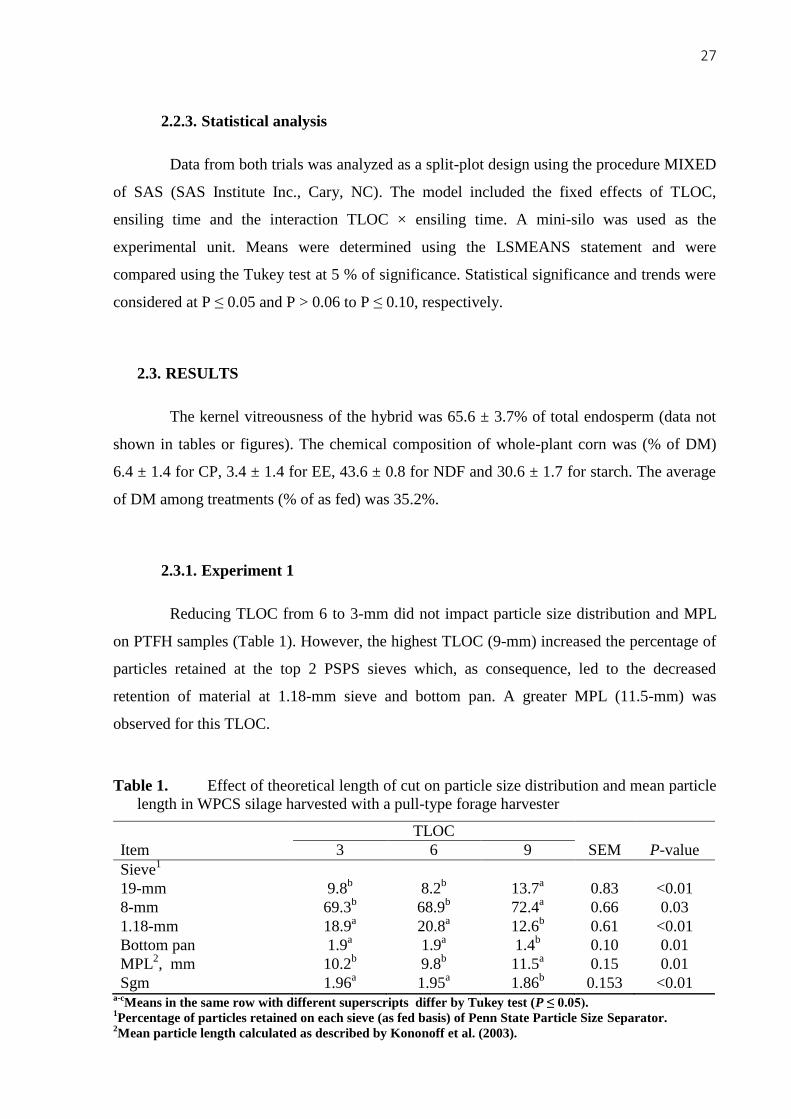
2.3.1. Experiment 1
Reducing TLOC from 6 to 3-mm did not impact particle size distribution and MPL
on PTFH samples (Table 1). However, the highest TLOC (9-mm) increased the percentage of
particles retained at the top 2 PSPS sieves which, as consequence, led to the decreased
retention of material at 1.18-mm sieve and bottom pan. A greater MPL (11.5-mm) was
observed for this TLOC.
Table 1. Effect of theoretical length of cut on particle size distribution and mean particle
length in WPCS silage harvested with a pull-type forage harvester
TLOC
Item 3 6 9 SEM P-value
Sieve1
19-mm 9.8b
8.2b
13.7a
0.83 <0.01
8-mm 69.3b
68.9b
72.4a
0.66 0.03
1.18-mm 18.9a
20.8a
12.6b
0.61 <0.01
Bottom pan 1.9a
1.9a
1.4b
0.10 0.01
MPL2, mm 10.2
b 9.8
b 11.5
a 0.15 0.01
Sgm 1.96a
1.95a
1.86b
0.153 <0.01 a-c
Means in the same row with different superscripts differ by Tukey test (P ≤ 0.05). 1Percentage of particles retained on each sieve (as fed basis) of Penn State Particle Size Separator.
2Mean particle length calculated as described by Kononoff et al. (2003).
28
The ensiling time did not change particle size distribution and MPL (Table 2). There
was no interaction between TLOC and ensiling time for particle size distribution results (P >
0.20).
Table 2. Effect of ensiling time on particle size distribution and mean particle length in
WPCS harvested with a pull-type forage harvester
Ensiling time
Item 0 35 140 SEM P-value
Sieve1
19-mm 10.8
9.6
11.3 0.78 0.32
8-mm 70.1
71.0
69.7 0.75 0.46
1.18-mm 17.2
17.9
17.2
0.61 0.62
Bottom pan 1.8
1.6
1.8
0.10 0.12
MPL, mm 10.5 10.4 10.6 0.15 0.72
Sgm 1.93 1.90 1.95 0.15 0.12 1Percentage of particles retained on each sieve (as fed basis) of Penn State Particle Size Separator.
2Mean particle length calculated as described by Kononoff et al. (2003).
Table 3. Effect of theoretical length of cut on kernel fraction particle size distribution,
geometric mean particle size (GMPS), surface area and processing score in WPCS
harvested with a pull-type forage harvester
TLOC
Item 3 6 9 SEM P-value
Sieve1, mm
6.7 36.3 35.9 36.9 0.97 0.79
4.75 38.4 39.3 38.8 0.81 0.79
3.35 8.8 8.8 8.9 0.28 0.95
2.36 6.3 6.3 6.2 0.36 0.98
1.70 3.2 3.1 2.9 0.16 0.58
1.18 2.3 2.1 2.1 0.12 0.30
0.59 2.6 2.5 2.4 0.14 0.57
Pan 2.1 2.1 1.9 0.13 0.51
% < 4.752 25.3 24.8 24.3 0.93 0.79
GMPS, µm 5070.0 5090.4 5172.8 62.5 0.48
Surface area, cm2/g 11.1 11.0 10.6 0.25 0.31
Processing score3
24.7 26.4 25.0 1.71 0.76 1Percentage of particles retained on each sieve (DM basis).
2Proportion of kernel fraction passing through a 4.75-mm sieve.
3Percent of starch passing a 4.75-mm sieve; processing score was measured as described by Ferreira and
Mertens (2005).
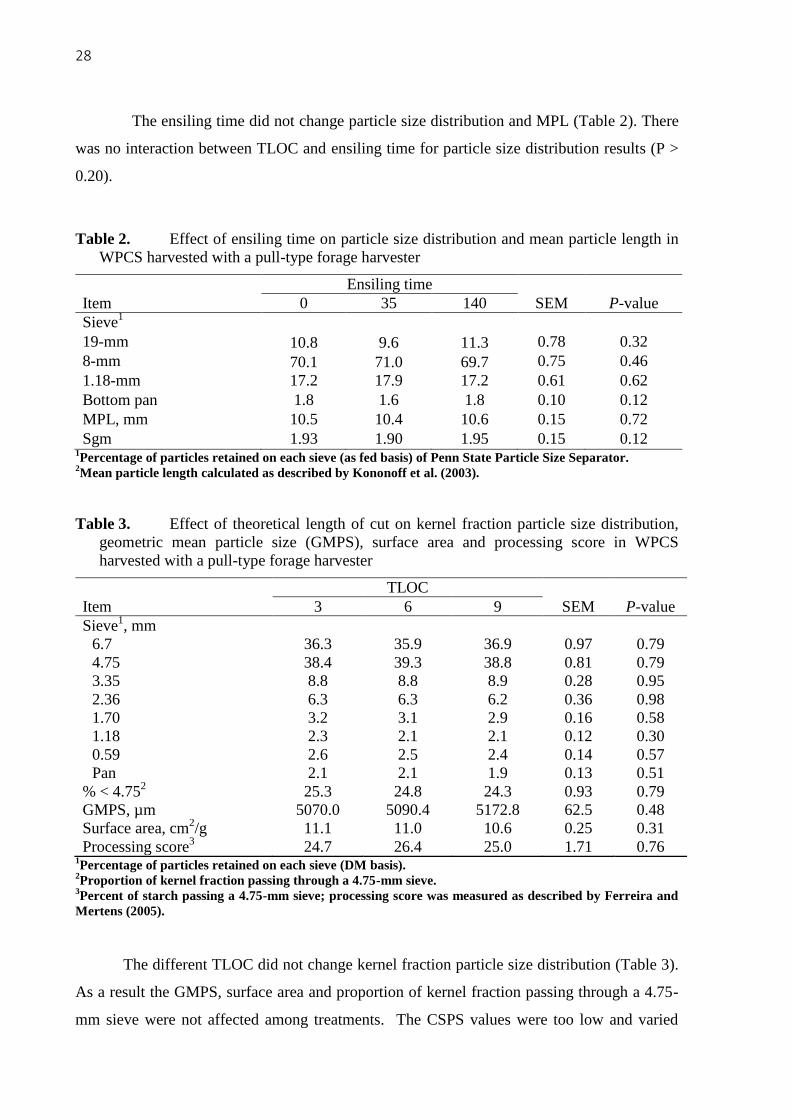
The different TLOC did not change kernel fraction particle size distribution (Table 3).
As a result the GMPS, surface area and proportion of kernel fraction passing through a 4.75-
mm sieve were not affected among treatments. The CSPS values were too low and varied
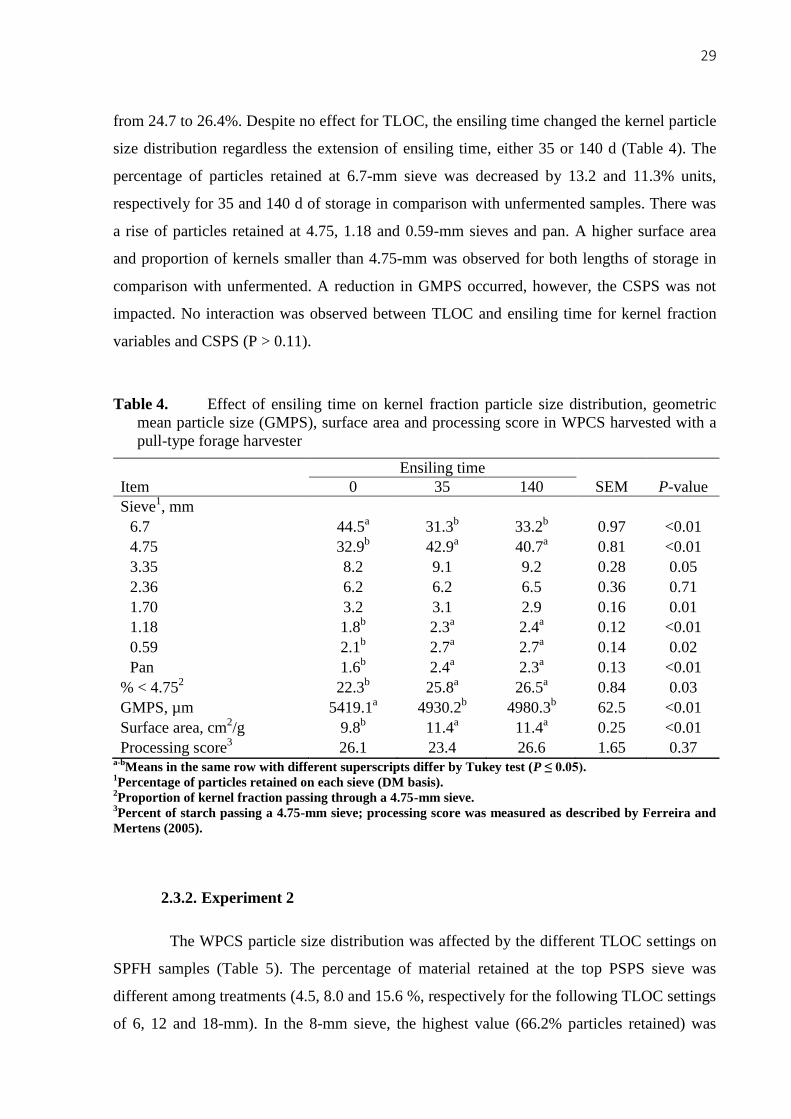
29
from 24.7 to 26.4%. Despite no effect for TLOC, the ensiling time changed the kernel particle
size distribution regardless the extension of ensiling time, either 35 or 140 d (Table 4). The
percentage of particles retained at 6.7-mm sieve was decreased by 13.2 and 11.3% units,
respectively for 35 and 140 d of storage in comparison with unfermented samples. There was
a rise of particles retained at 4.75, 1.18 and 0.59-mm sieves and pan. A higher surface area
and proportion of kernels smaller than 4.75-mm was observed for both lengths of storage in
comparison with unfermented. A reduction in GMPS occurred, however, the CSPS was not
impacted. No interaction was observed between TLOC and ensiling time for kernel fraction
variables and CSPS (P > 0.11).
Table 4. Effect of ensiling time on kernel fraction particle size distribution, geometric
mean particle size (GMPS), surface area and processing score in WPCS harvested with a
pull-type forage harvester
Ensiling time
Item 0 35 140 SEM P-value
Sieve1, mm
6.7 44.5a
31.3b
33.2b
0.97 <0.01
4.75 32.9b
42.9a
40.7a
0.81 <0.01
3.35 8.2 9.1 9.2 0.28 0.05
2.36 6.2 6.2 6.5 0.36 0.71
1.70 3.2 3.1 2.9 0.16 0.01
1.18 1.8b
2.3a
2.4a
0.12 <0.01
0.59 2.1b
2.7a
2.7a
0.14 0.02
Pan 1.6b
2.4a
2.3a
0.13 <0.01
% < 4.752
22.3b
25.8a
26.5a
0.84 0.03
GMPS, µm 5419.1a
4930.2b
4980.3b
62.5 <0.01
Surface area, cm2/g 9.8
b 11.4
a 11.4
a 0.25 <0.01
Processing score3
26.1 23.4 26.6 1.65 0.37 a-b
Means in the same row with different superscripts differ by Tukey test (P ≤ 0.05).
1Percentage of particles retained on each sieve (DM basis).
2Proportion of kernel fraction passing through a 4.75-mm sieve.
3Percent of starch passing a 4.75-mm sieve; processing score was measured as described by Ferreira and
Mertens (2005).
2.3.2. Experiment 2
The WPCS particle size distribution was affected by the different TLOC settings on
SPFH samples (Table 5). The percentage of material retained at the top PSPS sieve was
different among treatments (4.5, 8.0 and 15.6 %, respectively for the following TLOC settings
of 6, 12 and 18-mm). In the 8-mm sieve, the highest value (66.2% particles retained) was
30
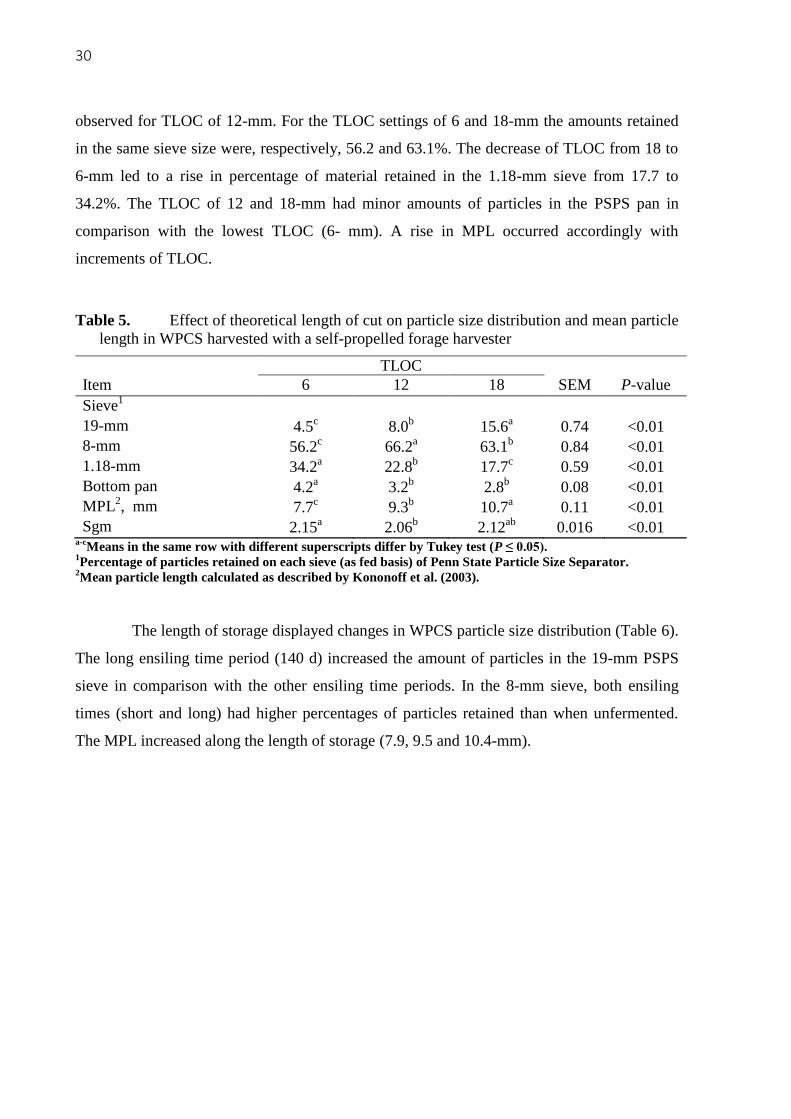
observed for TLOC of 12-mm. For the TLOC settings of 6 and 18-mm the amounts retained
in the same sieve size were, respectively, 56.2 and 63.1%. The decrease of TLOC from 18 to
6-mm led to a rise in percentage of material retained in the 1.18-mm sieve from 17.7 to
34.2%. The TLOC of 12 and 18-mm had minor amounts of particles in the PSPS pan in
comparison with the lowest TLOC (6- mm). A rise in MPL occurred accordingly with
increments of TLOC.
Table 5. Effect of theoretical length of cut on particle size distribution and mean particle
length in WPCS harvested with a self-propelled forage harvester
TLOC
Item 6 12 18 SEM P-value
Sieve1
19-mm 4.5c
8.0b
15.6a
0.74 <0.01
8-mm 56.2c
66.2a
63.1b
0.84 <0.01
1.18-mm 34.2a
22.8b
17.7c
0.59 <0.01
Bottom pan 4.2a
3.2b
2.8b
0.08 <0.01
MPL2, mm 7.7
c 9.3
b 10.7
a 0.11 <0.01
Sgm 2.15a
2.06b
2.12ab
0.016 <0.01 a-c
Means in the same row with different superscripts differ by Tukey test (P ≤ 0.05). 1Percentage of particles retained on each sieve (as fed basis) of Penn State Particle Size Separator.
2Mean particle length calculated as described by Kononoff et al. (2003).
The length of storage displayed changes in WPCS particle size distribution (Table 6).
The long ensiling time period (140 d) increased the amount of particles in the 19-mm PSPS
sieve in comparison with the other ensiling time periods. In the 8-mm sieve, both ensiling
times (short and long) had higher percentages of particles retained than when unfermented.
The MPL increased along the length of storage (7.9, 9.5 and 10.4-mm).

31
Table 6. Effect of ensiling time on particle size distribution and mean particle length in
WPCS harvested with a self-propelled forage harvester
Ensiling time
Item 0 35 140 SEM P-value
Sieve1
19-mm 7.8b
7.8b
11.7a
0.74 <0.01
8-mm 54.0b
66.1a
65.4a
0.84 <0.01
1.18-mm 31.5a
22.4b
20.8c
0.59 <0.01
Bottom pan 5.4
2.8
2.1
0.08 <0.01
MPL2, mm 7.9
c 9.5
b 10.4
a 0.11 <0.01
Sgm 2.28a
2.05b
2.00b
0.016 <0.01 a-c
Means in the same row with different superscripts differ by Tukey test (P ≤ 0.05). 1Percentage of particles retained on each sieve (as fed basis) of Penn State Particle Size Separator.
2Mean particle length calculated as described by Kononoff et al. (2003).
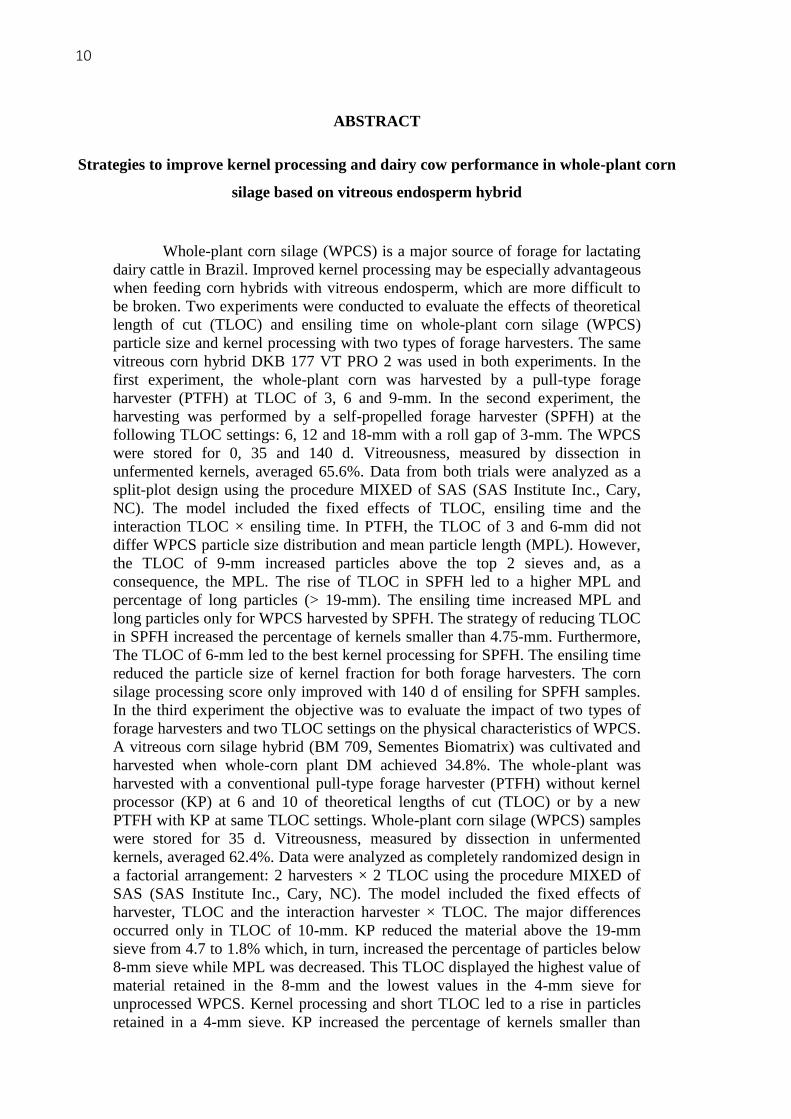
There was an interaction between TLOC and ensiling time for particles in the PSPS
pan (P =0.01; Figure 1). Distinct amounts in the pan were observed at time 0 among TLOC
settings. Nonetheless, at short and long ensiling time periods, there was a rise in particles in
the pan only for the 6-mm TLOC. For the other variables no interactions occurred (P > 0.14).
Figure 1. Interaction between TLOC and ensiling time for particles in the Penn State Particle Size
Separator bottom pan (P =0.01; SEM = 0.08)
The kernel particle size distribution changed through TLOC settings (Table 7). In the
upper sieve, the TLOC of 6 (14.9%) and 12-mm (17.0%) retained lower percentages than 18-
mm (20.4%). In the next sieve (4.75 mm), there was a rise of 2.5% units of particles retained
for the 18-mm in relation to 6-mm TLOC. However the 12-mm was not distinguished from
other treatments. The TLOC impacted the particle size distribution in the 3.35, 2.36, 1.70,
32
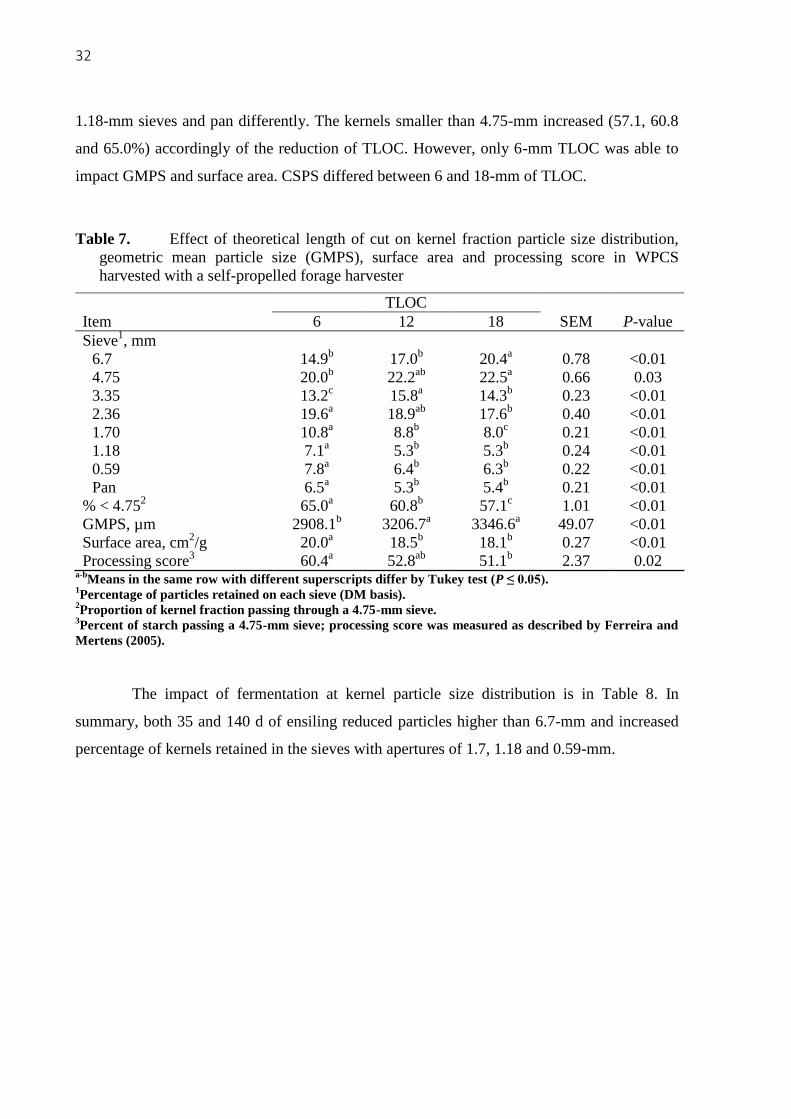
1.18-mm sieves and pan differently. The kernels smaller than 4.75-mm increased (57.1, 60.8
and 65.0%) accordingly of the reduction of TLOC. However, only 6-mm TLOC was able to
impact GMPS and surface area. CSPS differed between 6 and 18-mm of TLOC.
Table 7. Effect of theoretical length of cut on kernel fraction particle size distribution,
geometric mean particle size (GMPS), surface area and processing score in WPCS
harvested with a self-propelled forage harvester
TLOC
Item 6 12 18 SEM P-value
Sieve1, mm
6.7 14.9b
17.0b
20.4a
0.78 <0.01
4.75 20.0b
22.2ab
22.5a
0.66 0.03
3.35 13.2c
15.8a
14.3b
0.23 <0.01
2.36 19.6a
18.9ab
17.6b
0.40 <0.01
1.70 10.8a
8.8b
8.0c
0.21 <0.01
1.18 7.1a
5.3b
5.3b
0.24 <0.01
0.59 7.8a
6.4b
6.3b
0.22 <0.01
Pan 6.5a
5.3b
5.4b
0.21 <0.01
% < 4.752 65.0
a 60.8
b 57.1
c 1.01 <0.01
GMPS, µm 2908.1b
3206.7a
3346.6a
49.07 <0.01
Surface area, cm2/g 20.0
a 18.5
b 18.1
b 0.27 <0.01
Processing score3
60.4a
52.8ab
51.1b
2.37 0.02 a-b
Means in the same row with different superscripts differ by Tukey test (P ≤ 0.05).
1Percentage of particles retained on each sieve (DM basis).
2Proportion of kernel fraction passing through a 4.75-mm sieve.
3Percent of starch passing a 4.75-mm sieve; processing score was measured as described by Ferreira and
Mertens (2005).
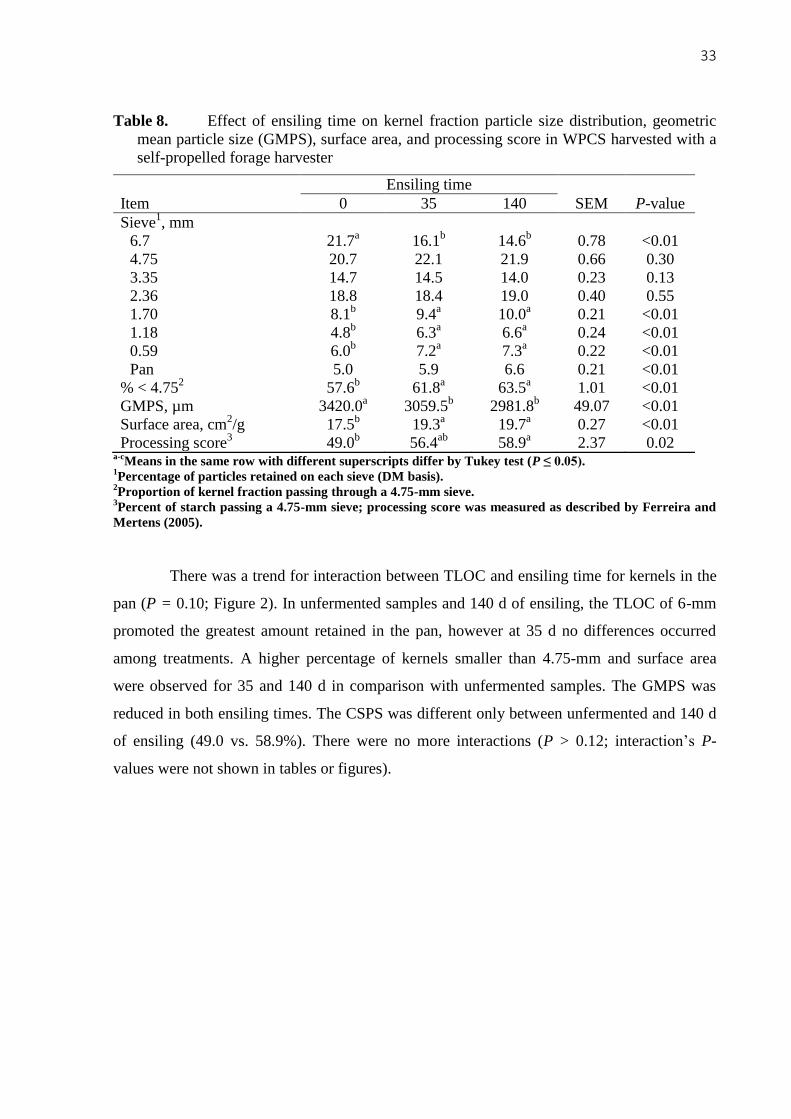
The impact of fermentation at kernel particle size distribution is in Table 8. In
summary, both 35 and 140 d of ensiling reduced particles higher than 6.7-mm and increased
percentage of kernels retained in the sieves with apertures of 1.7, 1.18 and 0.59-mm.
33
Table 8. Effect of ensiling time on kernel fraction particle size distribution, geometric
mean particle size (GMPS), surface area, and processing score in WPCS harvested with a
self-propelled forage harvester
Ensiling time
Item 0 35 140 SEM P-value
Sieve1, mm
6.7 21.7a
16.1b
14.6b
0.78 <0.01
4.75 20.7 22.1 21.9 0.66 0.30
3.35 14.7 14.5 14.0 0.23 0.13
2.36 18.8 18.4 19.0 0.40 0.55
1.70 8.1b
9.4a
10.0a
0.21 <0.01
1.18 4.8b
6.3a
6.6a
0.24 <0.01
0.59 6.0b
7.2a
7.3a
0.22 <0.01
Pan 5.0
5.9
6.6
0.21 <0.01
% < 4.752
57.6b
61.8a
63.5a
1.01 <0.01
GMPS, µm 3420.0a
3059.5b
2981.8b
49.07 <0.01
Surface area, cm2/g 17.5
b 19.3
a 19.7
a 0.27 <0.01
Processing score3
49.0b
56.4ab
58.9a
2.37 0.02 a-c
Means in the same row with different superscripts differ by Tukey test (P ≤ 0.05). 1Percentage of particles retained on each sieve (DM basis).
2Proportion of kernel fraction passing through a 4.75-mm sieve.
3Percent of starch passing a 4.75-mm sieve; processing score was measured as described by Ferreira and
Mertens (2005).
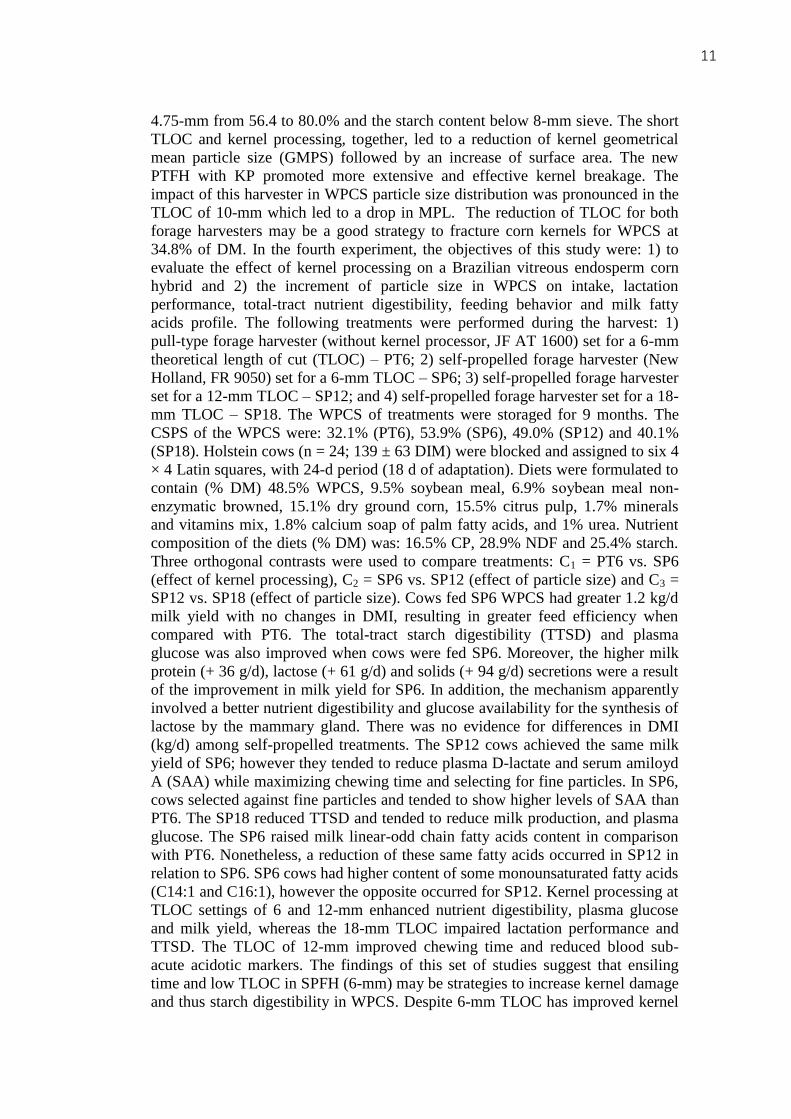
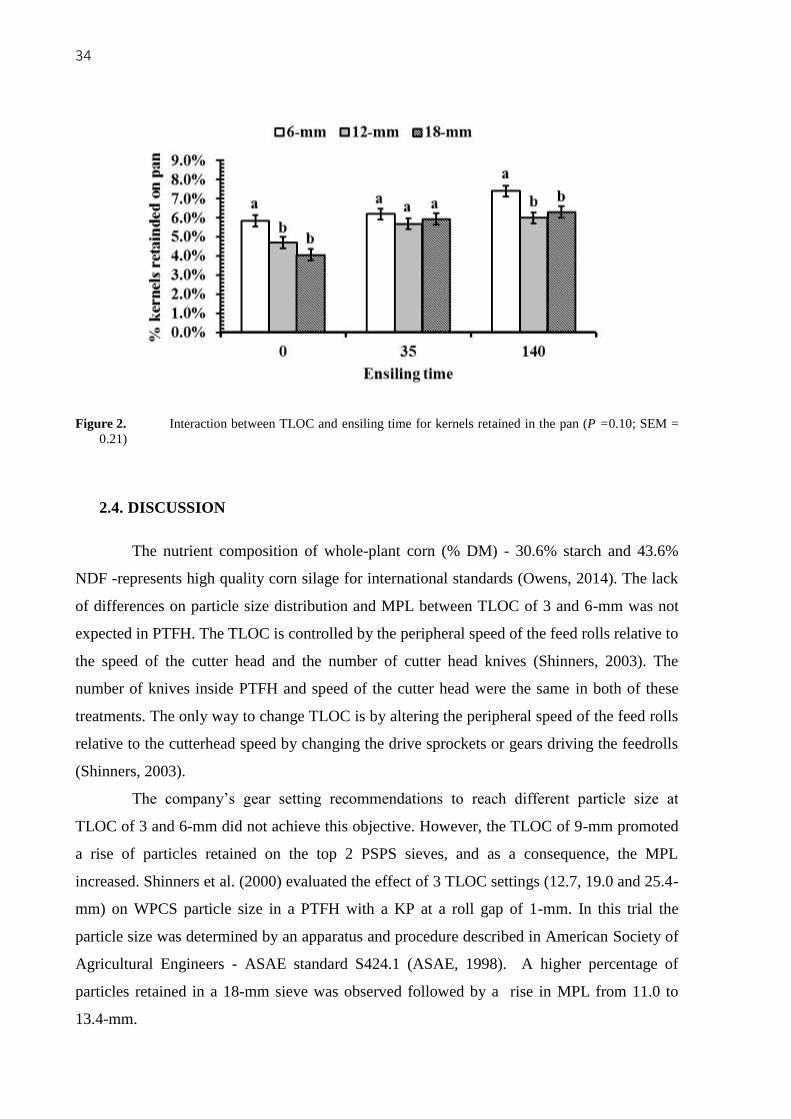
There was a trend for interaction between TLOC and ensiling time for kernels in the
pan (P = 0.10; Figure 2). In unfermented samples and 140 d of ensiling, the TLOC of 6-mm
promoted the greatest amount retained in the pan, however at 35 d no differences occurred
among treatments. A higher percentage of kernels smaller than 4.75-mm and surface area
were observed for 35 and 140 d in comparison with unfermented samples. The GMPS was
reduced in both ensiling times. The CSPS was different only between unfermented and 140 d
of ensiling (49.0 vs. 58.9%). There were no more interactions (P > 0.12; interaction’s P-
values were not shown in tables or figures).
34
Figure 2. Interaction between TLOC and ensiling time for kernels retained in the pan (P =0.10; SEM =
0.21)
2.4. DISCUSSION
The nutrient composition of whole-plant corn (% DM) - 30.6% starch and 43.6%
NDF -represents high quality corn silage for international standards (Owens, 2014). The lack
of differences on particle size distribution and MPL between TLOC of 3 and 6-mm was not
expected in PTFH. The TLOC is controlled by the peripheral speed of the feed rolls relative to
the speed of the cutter head and the number of cutter head knives (Shinners, 2003). The
number of knives inside PTFH and speed of the cutter head were the same in both of these
treatments. The only way to change TLOC is by altering the peripheral speed of the feed rolls
relative to the cutterhead speed by changing the drive sprockets or gears driving the feedrolls
(Shinners, 2003).
The company’s gear setting recommendations to reach different particle size at
TLOC of 3 and 6-mm did not achieve this objective. However, the TLOC of 9-mm promoted
a rise of particles retained on the top 2 PSPS sieves, and as a consequence, the MPL
increased. Shinners et al. (2000) evaluated the effect of 3 TLOC settings (12.7, 19.0 and 25.4-
mm) on WPCS particle size in a PTFH with a KP at a roll gap of 1-mm. In this trial the
particle size was determined by an apparatus and procedure described in American Society of
Agricultural Engineers - ASAE standard S424.1 (ASAE, 1998). A higher percentage of
particles retained in a 18-mm sieve was observed followed by a rise in MPL from 11.0 to
13.4-mm.
35
In the second experiment, we observed that the rise of TLOC from 6 to 18-mm led
to a greater percentage of longer particles (> 19-mm) and MPL. Johnson et al. (2003) also
reported increments of MPL and the percentage of longer particles in response to different
TLOC settings (11.1, 27.8, and 39.7 mm) for WPCS harvested by SPFH. Ferraretto et al.
(2015a) studied the impact of 3 hybrids, at 2 maturities (milk-line and 7-d later) and chopped
at 2 TLOC settings (6.4-mm or 19.5-mm) in particle size and processing score. Particle size
was increased with longer TLOC settings as expected. The samples harvested at 6.4-mm
TLOC, on average, showed less retention in the coarse (3.5 vs. 9.0%) and medium (52.9 vs.
58.1%) sieves, but more material retained in the fine sieve (41.3 vs. 30.6%) than 19.5-mm
TLOC samples. Material in the bottom pan did not differ between TLOC settings and
averaged 2.3%. The kernel processing score varied among all samples, but it was not affected
by the TLOC setting.
The ensiling time affected the WPCS particle distribution only in the second
experiment. The longest ensiling time had a higher percentage of particles retained in the top
2 PSPS sieves, therefore the MPL increased. At d 35 of ensiling, there was an increase of
particles only in the 8-mm PSPS sieve. Johnson et al. (2003) observed an increase in MPL
and particles retained in the 19-mm sieve with ensiling period. These authors suggested that
compaction of the forage in the silo may have altered the physical characteristics of the forage
(flattened some of the particles), making it difficult for some particles to pass through the
screens in the PSPS. The reason for the interaction between TLOC and ensiling time for
particles smaller than 1.18-mm is unknown.
Reducing TLOC can be a possible strategy for improving kernel breakage in PTFH
without a KP (Johnson et al., 1999). Dias Junior et al. (2015) reported a reduction in visible
intact kernels in WPCS harvested by PTFH when the TLOC was reduced from 8.5-mm to 3-
mm. In the present study was expected a reduction of kernel particle size for the smallest
TLOC, however, it did not happen in the first experiment. The values of CSPS were below
50% for PTFH and from 51.1 to 60.4% for SPFH samples. In this way, they can be classified
as inadequately and adequately processed, respectively, according to Shinners and Holmes
(2013). The hybrid had a high percentage of vitreous endosperm (65%) which is related to
kernel hardness (Correa et al., 2002) and can make kernels more difficult to be broken by the
harvester processors (Ferraretto et al. 2018). It could be worse for a PTFH without a KP that
depends on the cutting knives for kernel breakage. Moreover, kernel virtuousness
traditionally increases throughout the maturity of WPCS (Philippeau and Michalet-
Doreau,1997) which may explain the depression of TTSD for cows fed with very dried
36
WPCS (> 40% DM) even when processed (Ferraretto and Shaver, 2012). This effect may
occur in Brazilian vitreous corn hybrids even earlier than 40% DM.
The common TLOC used for SPFH is 19-mm in USA (Shinners, 2003; Kung and
Muck, 2017). However, even within a range of TLOC below this target (e.g. 12 and 18-mm),
the CSPS was not good. Through a meta-analysis of 24 studies, Ferraretto and Shaver et al.
(2012) evaluated the impact of TLOC and kernel processing in starch digestibility. Authors
have reported decreased ruminal starch digestibilty when WPCS was harvested with long
TLOC (>32-mm) and proposed that the long fiber fraction could reduce kernel breakage
during processing. This effect might be occuring at TLOC setting below 32-mm for vitreous
corn hybrid. Research should be focused on evaluating strategies (i.e new KP, roll speed
differetial, roll gap and TLOC settings) within a wide range of maturities to optmize kernel
processing in vitreous endosperm hybrids.
The ensiling time of either 35 or 140 d were able to reduce GMPS even in poor
processed silage (CSPS < 26.4 %) harvested by PTFH. As a consequence, the surface area
and proportion of kernels smaller than 4.75-mm increased. The same effect was observed for
SPFH samples with adequate CSPS. This impact of ensiling time for these kernel fraction
variables (GMPS and surface area) of WPCS had not been reported in the literature yet.
Futhermore, Dias Júnior et al. (2016) observed a strong relationship between these kernel
variables and ruminal DM dissapperence in unfermented kernels at different times of
incubation (3, 6, 9 and 12 h), thus an effect of ensiling time to improve DM digestibility
through reduction of kernel particle size is plausible. Ferraretto et al. (2015b) reported, across
2 experiments, an increase of 7 to 10 % units for CSPS in WPCS ensiled for at least 30 d and
up to 240 d. In the present trial, the CSPS was not altered by ensiling time in PTFH samples,
but was increased by 9.9 % units for 140 d of storage in comparison with unfermented
samples. These findings suggest that ensiling time of at least 140 d may be a good strategy to
increase kernel damage.
Hoffman et al. (2011) reported physicalchemical alterations in high-moisture corn
silage due to longer ensiling time (240 d). A reduction of α, γ, δ, and β prolamin-zein
subunits of the starch-protein matrix was observed followed by a rise of buffer-soluble CP at
240 d of ensiling in comparison with unfermented samples. Through electron micrograph
pictures, the authors demonstrated that starch-zein protein clusters within particles of high-
moisture corn were dissosiated. This effect of proteolysis may be a possible explanation for
the alterations in GMPS, surface area, propotion of kernels smaller than 4.75-mm and CSPS.
37
However, in the present study no analyses of these chemical components were performed to
support this premise.
2.5. CONCLUSIONS
In PTFH, the TLOC of 3 and 6-mm promoted no differences in WPCS particle size
distribution. However, the TLOC of 9-mm increased the MPL. The rise of TLOC in SPFH led
to a higher MPL and percentage of long particles (> 19-mm). The ensiling time increased
MPL and longer particles only for WPCS harvested by SPFH. The strategy of reducing TLOC
in SPFH was efficient to improve the percentage of kernels smaller than 4.75-mm.
Furthermore, The TLOC of 6-mm led to the best kernel processing in SPFH. The ensiling
time reduced the particle size of kernel fraction for both forage harvesters. The CSPS
increased only for 140 d of ensiling and when WPCS was harvested with SPFH. These
findings suggest that ensiling time and low TLOC in SPFH (6-mm) may be good strategies to
increase kernel damage in Brazilian vitreous corn hybrid silages.
LITERATURE CITED
AOAC International. 2012. Official Methods of Analysis. 19th ed. AOAC International,
Arlington, VA.
ASAE Standards, 44th Ed. 1998. S424.1. Method of determining and expressing particle size
of chopped forage materials by screening. St. Joseph, Mich.: ASAE.
Bal, M. A., R. D. Shaver, A. G. Jirovec, K. J. Shinners, and J. G. Coors. 2000. Crop
processing and chop length of corn silage: Effects on intake, digestion, and milk
production by dairy cows. J. Dairy Sci. 83:1264-1273.
Baker, S., and T. Herrman. 2002. Evaluating particle size. MF-2051. Kansas State Univ.,
Manhattan.
Bernardes, T. F., and A. C. Rego. 2014. Study on the practices of silage production and
utilization on Brazilian dairy farms. J. Dairy Sci. 97:1852-1861.
Bernardes, T. F., J. L. P. Daniel, A. T. Adesogan, T. A. McAllister, P. Drouin, L. G. Nussio,
P. Huhtanen, G. F. Tremblay, G. Bélanger, and Y. Cai. 2018. Silage review: Unique
challenges of silages made in hot and cold regions. J. Dairy Sci. 101:4001-4019.
Correa, C. E. S., R. D. Shaver, M. N. Pereira, J. G. Lauer, and K. Kohn. 2002. Relationship
between corn vitreousness and ruminal in situ starch degradability. J. Dairy Sci. 85:3008-
3012.
38
Daniel, J. L. P., Bernardes, T. F., C. C. Jobim, P. Schmidt, and L. G. Nussio.Production and
utilization of silages in tropical areas with focus in Brazil. 2019. Grass Forage Sci. 1-13.
Dombrink-Kurtzman, M. A., and J. A. Bietz. 1993. Zein composition in hard and soft
endosperm of maize. Cereal Chem. 70:105–108.
Dias Junior, G. S., N. N. Morais Junior, R. F. Lima, F. F. Cardoso, O. F. Zacaroni, R. A. N.
Pereira, and M. N. Pereira. 2015. Effect of KP and theoretical length of cut on physical
characteristics of forage corn harvested with one row harvester. J. Dairy Sci. 98(Suppl.
2):689 (Abstr.)
Dias Junior, G. S., L. F. Ferraretto, G. G. S. Salvati, L. C. de Resende, P. C. Hoffman, M. N.
Pereira, and R. D. Shaver. 2016. Relationship between processing score and kernel-
fraction particle size in whole-plant corn silage. J. Dairy Sci. 99:2719-2729.
Der Bedrosian, M. C., L. Kung Jr., and K. E. Nestor Jr.. 2012. The effects of hybrid, maturity
and length of storage on the composition and nutritive value of corn silage. J. Dairy Sci.
95:5115-5126.
Ferraretto, L. F., and R. D. Shaver. 2012. Meta-analysis: Impact of corn silage harvest
practice on intake, digestion and milk production by dairy cows. Prof. Anim. Sci. 28:141-
149.
Ferraretto, L. F., P. M. Crump, and R. D. Shaver. 2015a. Effect of ensiling time and
exogenous protease addition to whole-plant corn silage of various hybrids, maturities and
chop lengths on nitrogen fractions and ruminal in vitro starch digestibility. J. Dairy Sci.
98:8869-8881.
Ferraretto, L. F., G. S. Dias Junior, L. C. de Resende, and R. D. Shaver. 2015b. Effect of
ensiling on kernel processing score in whole-plant corn silage harvested with varied
processors and settings. J. Dairy Sci. 98(Suppl. 2):689. (Abstr.)
Ferraretto, L. F., R. D. Shaver, and B. D. Luck. 2018. Silage review: Recent advances and
future technologies for whole-plant and fractionated corn silage harvesting. J. Dairy Sci.
101:3937-3951.
Ferreira, G., and D. R. Mertens. 2005. Chemical and physical characteristics of corn silages
and their effects on in vitro disappearance. J. Dairy Sci. 88:4414-4425.
Hall, M. B. 2015. Determination of dietary starch in animal feeds and pet food by an
enzymatic-colorimetric method. Collaborative study. J. AOAC Int. 98:397-409.
Hoffman, P. C., N. M. Esser, R. D. Shaver, W. Coblentz, M. P. Scott, A. L. Bodnar, R.
Schmidt, and B. Charely. 2011. Influence of inoculation and storage time on alteration of
the starch-protein matrix in high moisture corn. J. Dairy Sci. 94:2465-2474.
39
Johnson, L., J. H. Harrison, C. Hunt, K. Shinners, C. G. Doggett, and D. Sapienza. 1999.
Nutritive value of corn silage as affected by maturity and mechanical processing: A
contemporary review. J. Dairy Sci. 82:2813-2825.
Johnson, L. M., J. H. Harrison, D. Davidson, W. C. Mahanna, and K. Shinners. 2003. Corn
silage management: Effects of hybrid, chop length, and mechanical processing on
digestion and energy content. J. Dairy Sci. 86:208-231.
Kung Jr., L., and R. E. Muck. Silage harvesting and storage. 2017. Pages 723-738 in Large
Dairy Herd Management (3oed.) edited by D. K. Beede. 1376 p.
Mertens, D. R. 1997. Creating a system for meeting the fiber requirements of dairy cows. J.
Dairy Sci. 80:1463-1481.
Owens, F. 2014. New technologies in forage varieties and production. Pages 103–121 in Proc.
Tri-State Dairy Nutr.Conf., Ft. Wayne, IN. Ohio State Univ., Columbus.
Philippeau, C., and B. Michalet-Doreau. 1997. Influence of genotype and stage of maturity of
maize on rate of ruminal starch degradation. Anim. Feed Sci. Technol. 68:25-35.
Shinners, K. J., A. G. Jirovec, R. D. Shaver, and M. Bal. 2000. Processing whole-plant corn
silage with crop processing rolls on a pull-type forage harvester. Appl. Eng. Agric.
16:323-331.
Shinners, K. J. 2003. Engineering principles of silage harvesting equipment. Pages 361-403 in
Silage Science and Technology. D. R. Buxton, R. E. Muck, and H. J. Harrison, ed. ASA,
CSA, and SSSA, Madison, WI.
Shinners, K. J., and B. J. Holmes. 2013. Making sure your KP is doing its job. Focus on
Forage, 15:1–3. Accessed May 20, 2018. http:// fyi .uwex .edu/ forage/ files/ 2014/ 01/
Kernel Processing -FOF .pdf.
Wiles, P. G., I. K. Gray, and R. C. Kissling. 1998. Routine analyses of protein by Kjeldahl
and Dumas methods: Review and inter-laboratory study using dairy products. J. AOAC
Int. 81:620-632.

40
41
3. HOW DOES A NOVEL PULL-TYPE FORAGE HARVESTER WITH KERNEL
PROCESSOR CHOP A VITREOUS CORN HYBRID?
ABSTRACT
The objective of this study was to evaluate the impact of two types of
forage harvesters and two TLOC settings on the physical characteristics of WPCS.
A vitreous corn silage hybrid (BM 709, Sementes Biomatrix) was cultivated and
harvested when whole-corn plant DM achieved 34.8%. The whole-plant was
harvested with a conventional pull-type forage harvester (PTFH) without kernel
processor (KP) at 6 and 10 of theoretical lengths of cut (TLOC) or by a new
PTFH with KP at same TLOC settings. Whole-plant corn silage (WPCS) samples
were stored for 35 d. Vitreousness, measured by dissection in unfermented
kernels, averaged 62.4%. Data were analyzed as completely randomized design in
a factorial arrangement: 2 harvesters × 2 TLOC using the procedure MIXED of
SAS (SAS Institute Inc., Cary, NC). The model included the fixed effects of
harvester, TLOC and the interaction harvester × TLOC. The follow differences
occurred only in TLOC of 10-mm. KP reduced the material above the 19-mm
sieve from 4.7 to 1.8% which, in turn, increased the percentage of particles below
8-mm sieve while MPL was decreased. This TLOC displayed the highest value of
material retained in the 8-mm and the lowest values in the 4-mm sieve for
unprocessed WPCS. Kernel processing and short TLOC led to a rise in particles
retained in a 4-mm sieve. KP increased the percentage of kernels smaller than
4.75-mm from 56.4 to 80.0% and the starch content below 8-mm sieve. The short
TLOC and kernel processing, together, led to a reduction of kernel geometrical
mean particle size (GMPS) followed by an increase of surface area. The new
PTFH with KP promoted more extensive and effective kernel breakage. The
impact of this harvester in WPCS particle size distribution was pronounced in the
TLOC of 10-mm which led to a drop in MPL. The reduction of TLOC for both
forage harvesters may be a good strategy to fracture corn kernels for WPCS at
34.8% of DM.
Keywords: Kernel processing; Vitreous endosperm; Geometrical mean particle
size
3.1. INTRODUCTION
In 2012, a survey performed with 260 dairy farmers from 23 states in Brazil
indicated that the most used source of forage was whole-plant corn silage (WPCS; Bernardes
and Rego, 2014). The WPCS can provide a greater production of low-cost starch per hectare
with a high concentration of metabolizable energy in areas where the land is suitable for its
42
cultivation (Wilkinson and Rinne, 2018). Furthermore, the rapid harvest and ease of ensiling
(Nigon et al., 2016) has made the crop a popular choice for dairy farmers.
Despite the increase in custom contractors offering self-propelled forage harvester
(SPFH) services (Daniel et al., 2019), the adoption of pull-type forage harvesters (PTFH) by
Brazilian dairy farmers is still very common (Bernardes and Rego, 2014). Until two years ago
there was no PTFH with kernel processor (KP) on the market. This is a current concern as
most cultivated hybrids have a higher proportion of vitreous endosperm in the kernel (Correa
et al., 2002; Bernardes et al., 2018) which is more difficult to fracture during the harvesting
process (Ferraretto et al. 2018). In this scenario, reducing the theoretical length of cut
(TLOC) may be a possible way to optimize the kernel breakage by cutting knives (Johnson et
al., 1999).
In the USA, the common TLOC settings for unprocessed WPCS are between 10 and
13-mm and about 19-mm for processed WPCS (Shinners et al., 2003; Kung and Muck, 2017).
Recently, a new model of PTFH with a KP was launched in the Brazilian market; however no
studies to prove its kernel processing efficiency have been performed yet. The hypothesis of
this study was that in order to achieve adequate kernel processing in the vitreous endosperm
hybrid, a PTFH with KP and lower TLOC would be required. The objective of this study was
to evaluate the impact of two types of forage harvesters and two TLOC settings on the
physical characteristics of WPCS.
3.2. MATERIALS AND METHODS
Three hectares of a vitreous corn silage hybrid (BM 709, Sementes Biomatrix, Rio
Claro, São Paulo, Brasil) were cultivated on August 1st, 2017 at a density of 62 500 seeds per
hectare at the Federal Institute of Espírito Santo – Itapina Campus (Colatina, ES, Brazil). The
harvesting occurred on December 12, 2017, at approximately 34.8% DM when plants had half
of milk line stage of kernel maturity. The field was harvested in alternating strips in an
attempt to keep similar nutrient composition among the treatments. The treatments were
performed during the harvesting. Corn kernel vitreousness was determined by manual
dissection (Dombrink-Kurtzman and Bietz, 1993) in fifteen ears collected from the corn crop
and followed the procedure described by Correa et al. (2002).
A JF C240 PTFH without KP (PT; JF Máquinas Agrícolas, Itapira, Sao Paulo,
Brazil) and a JM4200 PTFH with KP (PTK; 2-mm of roll gap; Jumil, Batatais, Sao Paulo,
Brazil) set for a TLOC at 6 or 10-mm were used to harvest treatments. The samples collected
43
during harvest were vacuum-sealed in four plastic bags (15 × 35 cm, width × length) and
stored for 35 d. This experiment consisted of 4 treatments (2 harvesters and 2 lengths of cut)
and 36 plastic bag mini-silos (4 replications per treatment). Mini-silos were stored at room
temperature (approximately 25°C) in the dark until reaching the targeted ensiling time.
Each WPCS sample was placed in a bucket, homogenized manually and divided in 3
equal subsamples. The first subsample, as-fed whole-plant samples were used for
determination of particle size distribution using Penn State Particle Size Separator (PSPS).
The PSPS procedure was conducted manually using 3 sieves (19, 8 and 4-mm) and a bottom
pan. The mean particle length (MPL) was calculated according of Heinrichs (2013). The
particles retained in each sieve were dried at 60°C for 48 h in a forced-air oven and then
ground to pass through a 1-mm Wiley mill screen (Arthur H. Thomas). Starch content was
analyzed as described to Hall et al. (2015) and the particle starch content retained in each
PSPS sieve was calculated.
The second subsample was dried at 60°C for 48 h in a forced-air oven and then
ground to pass through a 1-mm Wiley mill screen (Arthur H. Thomas). The DM (method
942.05) and ether extract (method 2003.05) were determined as described by AOAC
International (2012). Concentration of CP was determined as N x 6.25 after analysis with a N
analyzer (Leco FP-2000; Leco Corp., St. Joseph, MI, USA) by the Dumas method (Wiles et
al., 1998).The NDF was analyzed using a TE–149 fiber analyzer (TECNAL Equipamentos
para Laboratórios, Piracicaba, Brazil) with heat-stable α-amylase and sodium sulfite (method
2002.04, AOAC, 2012). Starch was analyzed according to Hall et al. (2015). This data was
used only for the description of whole-plant corn nutritional composition.
The third subsample, kernel and stover fractions were separated by a hydrodynamic
separation procedure (Savoie et al., 2004). This method is based on differences in buoyancy
between the kernels and stover. Because all samples were fermented for at least 35 d, which is
thought to make the separation process more difficult, all samples were dried in a forced-air
oven set at 60°C for 48 h prior to immersion in water as recommended by Savoie et al.
(2004). Each sample of approximately 400 g of DM was placed in a 10-L rectangular tub
containing 7 L of water. Each dried sample was gently agitated manually for 2 min such that
the entire sample was submerged in water. After 2 min, the stover fraction which floats, due
to a lower density than water, was removed gently using a small 1.18-mm sieve (Savoie et al.,
2004). After separation, the kernel-fraction was transferred to aluminum plates, re-dried at
60°C for 48 h in a forced-air oven and dry-sieved using a Tyler Ro-Tap Shaker (model RX-
29, Tyler, Mentor, OH) with a set of 9 sieves with nominal square apertures of 9.50, 6.70,
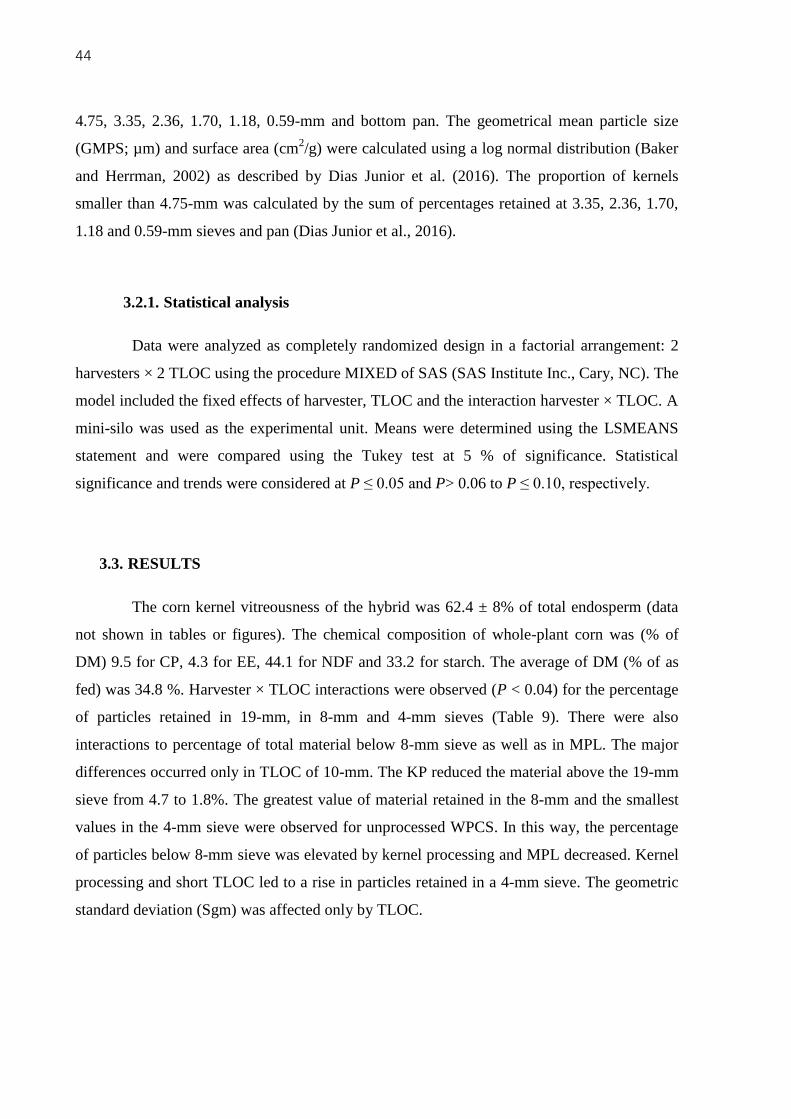
44
4.75, 3.35, 2.36, 1.70, 1.18, 0.59-mm and bottom pan. The geometrical mean particle size
(GMPS; µm) and surface area (cm2/g) were calculated using a log normal distribution (Baker
and Herrman, 2002) as described by Dias Junior et al. (2016). The proportion of kernels
smaller than 4.75-mm was calculated by the sum of percentages retained at 3.35, 2.36, 1.70,
1.18 and 0.59-mm sieves and pan (Dias Junior et al., 2016).
3.2.1. Statistical analysis
Data were analyzed as completely randomized design in a factorial arrangement: 2
harvesters × 2 TLOC using the procedure MIXED of SAS (SAS Institute Inc., Cary, NC). The
model included the fixed effects of harvester, TLOC and the interaction harvester × TLOC. A
mini-silo was used as the experimental unit. Means were determined using the LSMEANS
statement and were compared using the Tukey test at 5 % of significance. Statistical
significance and trends were considered at P ≤ 0.05 and P> 0.06 to P ≤ 0.10, respectively.
3.3. RESULTS
The corn kernel vitreousness of the hybrid was 62.4 ± 8% of total endosperm (data
not shown in tables or figures). The chemical composition of whole-plant corn was (% of
DM) 9.5 for CP, 4.3 for EE, 44.1 for NDF and 33.2 for starch. The average of DM (% of as
fed) was 34.8 %. Harvester × TLOC interactions were observed (P < 0.04) for the percentage
of particles retained in 19-mm, in 8-mm and 4-mm sieves (Table 9). There were also
interactions to percentage of total material below 8-mm sieve as well as in MPL. The major
differences occurred only in TLOC of 10-mm. The KP reduced the material above the 19-mm
sieve from 4.7 to 1.8%. The greatest value of material retained in the 8-mm and the smallest
values in the 4-mm sieve were observed for unprocessed WPCS. In this way, the percentage
of particles below 8-mm sieve was elevated by kernel processing and MPL decreased. Kernel
processing and short TLOC led to a rise in particles retained in a 4-mm sieve. The geometric
standard deviation (Sgm) was affected only by TLOC.
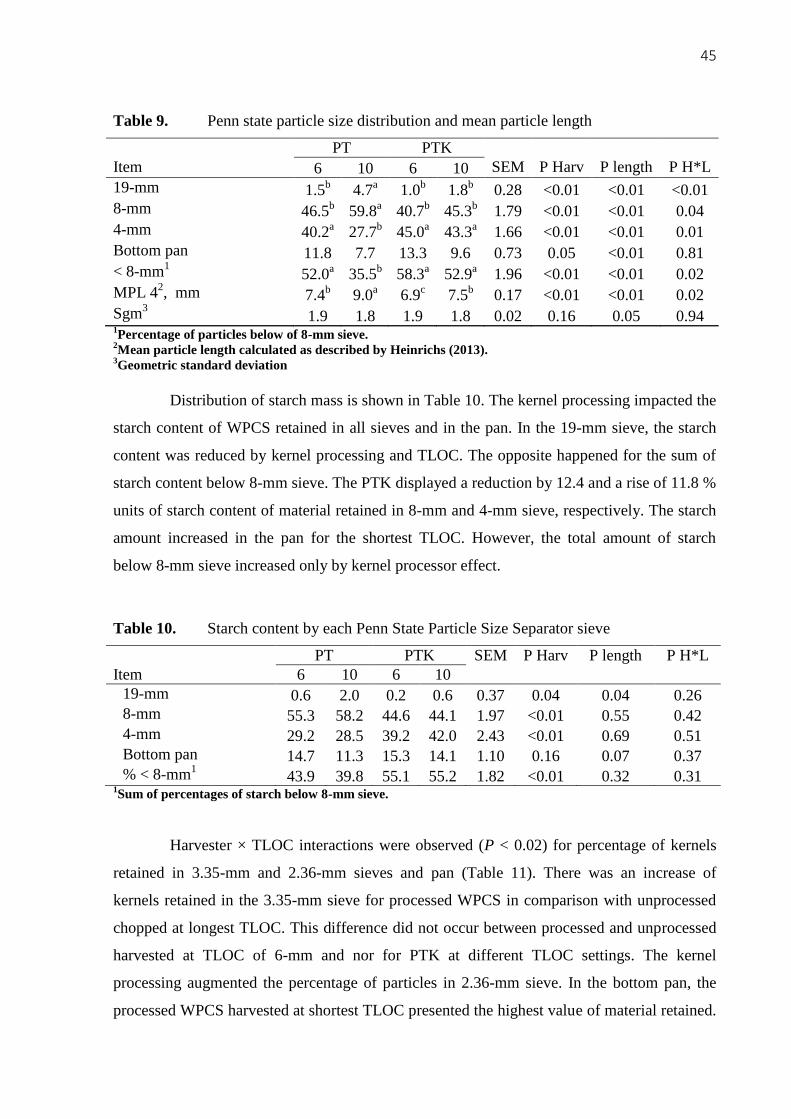
45
Table 9. Penn state particle size distribution and mean particle length
PT PTK
Item 6 10 6 10 SEM P Harv P length P H*L
19-mm 1.5b
4.7a
1.0b
1.8b
0.28 <0.01 <0.01 <0.01
8-mm 46.5b
59.8a
40.7b
45.3b
1.79 <0.01 <0.01 0.04
4-mm 40.2a
27.7b
45.0a
43.3a
1.66 <0.01 <0.01 0.01
Bottom pan 11.8 7.7 13.3 9.6 0.73 0.05 <0.01 0.81
< 8-mm1
52.0a
35.5b
58.3a
52.9a
1.96 <0.01 <0.01 0.02
MPL 42, mm 7.4
b 9.0
a 6.9
c 7.5
b 0.17 <0.01 <0.01 0.02
Sgm3
1.9 1.8 1.9 1.8 0.02 0.16 0.05 0.94 1Percentage of particles below of 8-mm sieve.
2Mean particle length calculated as described by Heinrichs (2013).
3Geometric standard deviation
Distribution of starch mass is shown in Table 10. The kernel processing impacted the
starch content of WPCS retained in all sieves and in the pan. In the 19-mm sieve, the starch
content was reduced by kernel processing and TLOC. The opposite happened for the sum of
starch content below 8-mm sieve. The PTK displayed a reduction by 12.4 and a rise of 11.8 %
units of starch content of material retained in 8-mm and 4-mm sieve, respectively. The starch
amount increased in the pan for the shortest TLOC. However, the total amount of starch
below 8-mm sieve increased only by kernel processor effect.
Table 10. Starch content by each Penn State Particle Size Separator sieve
PT PTK SEM P Harv P length P H*L
Item 6 10 6 10
19-mm 0.6 2.0 0.2 0.6 0.37 0.04 0.04 0.26
8-mm 55.3 58.2 44.6 44.1 1.97 <0.01 0.55 0.42
4-mm 29.2 28.5 39.2 42.0 2.43 <0.01 0.69 0.51
Bottom pan 14.7 11.3 15.3 14.1 1.10 0.16 0.07 0.37
% < 8-mm1
43.9 39.8 55.1 55.2 1.82 <0.01 0.32 0.31 1Sum of percentages of starch below 8-mm sieve.
Harvester × TLOC interactions were observed (P < 0.02) for percentage of kernels
retained in 3.35-mm and 2.36-mm sieves and pan (Table 11). There was an increase of
kernels retained in the 3.35-mm sieve for processed WPCS in comparison with unprocessed
chopped at longest TLOC. This difference did not occur between processed and unprocessed
harvested at TLOC of 6-mm and nor for PTK at different TLOC settings. The kernel
processing augmented the percentage of particles in 2.36-mm sieve. In the bottom pan, the
processed WPCS harvested at shortest TLOC presented the highest value of material retained.

46
The percentage of kernels smaller than 4.75-mm was maximized only on processed WPCS.
There was an increase from 56.4 to 80.0%. The short TLOC and kernel processing led to a
reduction of GMPS followed by an increase of surface area.
Table 11. Kernel fraction particle size distribution, proportion of kernels smaller than
4.75-mm, geometric mean particle size (GMPS), and surface area of treatments
PT PTK
6 10 6 10 SEM P Harv P length P H*L
Sieve1, mm
6.7 17.6 19.7 4.6 7.2 0.92 <0.01 0.04 0.76 4.75 19.8 21.3 14.7 12.6 0.87 <0.01 0.71 0.12 3.35 13.4
b 11.9
c 13.8
ab 14.7
a 0.26 0.01 0.30 0.01
2.36 19.3c
17.2c
26.5b
28.7a
0.79 <0.01 0.96 0.02 1.70 8.6 8.7 13.1 13.9 0.47 <0.01 0.44 0.47 1.18 5.6 5.5 9.2 8.5 0.27 <0.01 0.16 0.24 0.59 6.0 5.6 9.0 7.8 0.26 <0.01 0.02 0.16 Pan 5.8
b 5.3
b 8.8
a 6.0
b 0.31 0.01 0.01 0.01
% < 4.752 58.7 54.1 80.4 79.6 1.80 <0.01 0.18 0.32
GMPS, µm 3284.1 3465.2 2315.8 2552.6 89.11 <0.01 0.05 0.76 Surface area, cm
2/g 18.4 17.6 22.6 20.7 0.41 <0.01 0.01 0.20
1Percentage of particles retained on each sieve (DM basis).
2Proportion of kernels smaller than 4.75-mm.
3.4. DISCUSSION
The nutrient composition of whole-plant corn on average (% DM) was 33.2% starch
and 44.1% NDF which idicates high nutrional quality based on international standards
(Owens, 2014). Recently, in a review of literature, Ferraretto et al. (2018) observed a decrease
of particles larger than 18 or 19-mm by 20% for processed WPCS. Andrae et al. (2001) noted
that kernel processing led to drop of large particles (>19-mm) followed by an increase in mid-
size (8 to 19-mm) and small (<8-mm) particles for WPCS harvested by SPFH at 19-mm of
TLOC. Jonhson et al (2002) reported, in experiment 1, a decrease of particles on the top PSPS
layer which, in turn, increased particle retained in the 8-mm and MPL for processed WPCS
harvested at 6.4-mm of TLOC. Similar effects of KP were noticed in the present study, but
these occurred only for TLOC of 10-mm. It is not clear the lack of impact for the short TLOC
(6-mm) in the current trial. At equal TLOC settings, a reduction in particle size by about 15 to
30% due to kernel processor has been observed (Schurig and Rodel, 1993; Roberge et al.,
1998). The processing rolls crush and shear the stover fraction (Johnson et al., 2003) and, as a
47
consequence, eliminates intact cobs and long particles especially under tight roll gap setting
(Shinners et al., 2000).
The fine adjustment from 10 to 6-mm of TLOC reduced particles larger than 19-mm
and tended to increase particles in the bottom pan as well as reducing the MPL. Shinners et al.
(2000) reported a decrease of 23.8 %-units of particles retained above the 18-mm sieve, as a
result, a drop in MPL from 13 to 11.0-mm occured for WPCS harvested at 2 TLOC settings
(25.4 and 12.7) in PTFH with a KP. In this trial the particle size was determined by an
apparatus and procedure described in American Society of Agricultural Engineers - ASAE
standard S424.1 (ASAE, 1998). Ferraretto et al. (2015) evaluated the impact of 2 TLOC
settings (6.4-mm or 19.5-mm), 3 hybrids and at 2 maturities in WPCS particle size. Particle
size reduced with lowest TLOC as expected. The samples harvested at 6.4-mm TLOC, on
average, had less material retained in the coarse (3.5 vs. 9.0%), however the material in the
bottom pan did not differ between TLOC settings. Besides TLOC and kernel processing,
others factors can influence the MPL in WPCS, such as processor roll-gap setting (Shinners et
al., 2000), silage ensiling time (Johnson et al., 2003), DM content (Shinners et al., 2000), ratio
of kernel to stover (Mertens, 2005), hybrid (Johnson et al., 2002), knife sharpness and knife–
to–shear bar clearance (Shinners, 2003).
Shinners et al. (2000) reported a drop in kernel GMPS and, as a consequence, an
increase of surface area for processed WPCS. In the current trial was observed similar
response; apparently, there was a reduction of kernels retained in 6.7 and 4.75-mm sieves
followed by a rise in the percentage of kernels retained at bottom sieves. Dias Junior et al.
(2016) cut manually unfermented kernels from 110 hybrids in 4 and 8 pieces and sifted in Ro-
Tap shaker with the same set of sieves used in our trial. The percentages of kernels smaller
than 4.75-mm were 38.9 and 94.4%, respectively. Based on these observations, it suggests
that the most part of kernel particles were broken at least in 4 pieces in our trial. There is a
recommendation which corn particles should have greater than 65 to 70% of kernels broken
into pieces less than one-third to one-fourth of a kernel in size (Kung and Muck, 2017). In this
way, the WPCS harvested by PTK probably achieved this target more effectively. The
processed WPCS had higher concentration of starch in the material below 8-mm sieve. Weiss
and Wyatt (2000) also reported a rise of starch content in this fraction for processed WPCS
harvested at 19-mm of TLOC in comparison with unprocessed at 10-mm TLOC. The
reduction of TLOC improved GMPS and surface area. Shinners et al. (2000) noted an
increase of broken kernels by 8.5 % units of total kernel mass when TLOC was reduced from
19 to 9.5-mm in unprocessed WPCS. However, the kernel GMPS and surface area were not
48
affected by TLOC in this trial. Johnson et al. (1999) also supposed a possible improvement of
kernel breakage by harvester cutting knives when TLOC is reduced.
3.5. CONCLUSIONS
The new PTFH with KP promoted a greater kernel breakage. The impact of this
harvester in WPCS particle size distribution was pronounced in the TLOC of 10-mm which
led to drop in MPL. The reduction of TLOC for both forage harvesters may be a good strategy
to fracture corn kernels for WPCS at 34.8% of DM. There is a lack of information regarding
kernel processors and the right TLOC settings for PTFH in distinct field scenarios (maturity
and hybrids) and further research is warranted.
LITERATURE CITED
Andrae, J. G., C. W. Hunt, G. T. Pritchard, L. R. Kennington, J. H. Harrison, W. Kezar, and
W. Mahanna. 2001. Effect of hybrid, maturity, and mechanical processing of corn silage
on intake and digestibility by beef cattle. J. Anim. Sci. 79:2268-2275.
AOAC International. 2012. Official Methods of Analysis. 19th ed. AOAC International,
Arlington, VA.
ASAE Standards, 44th
Ed. 1998. S424.1. Method of determining and expressing particle size
of chopped forage materials by screening. St. Joseph, Mich.: ASAE.
Baker, S., and T. Herrman. 2002. Evaluating particle size. MF-2051. Kansas State Univ.,
Manhattan.
Bernardes, T. F., and A. C. Rego. 2014. Study on the practices of silage production and
utilization on Brazilian dairy farms. J. Dairy Sci. 97:1852-1861.
Bernardes, T. F., J. L. P. Daniel, A. T. Adesogan, T. A. McAllister, P. Drouin, L. G. Nussio,
P. Huhtanen, G. F. Tremblay, G. Bélanger, and Y. Cai. 2018. Silage review: Unique
challenges of silages made in hot and cold regions. J. Dairy Sci. 101:4001-4019.
Correa, C. E. S., R. D. Shaver, M. N. Pereira, J. G. Lauer, and K. Kohn. 2002. Relationship
between corn vitreousness and ruminal in situ starch degradability. J. Dairy Sci. 85:3008-
3012.
Daniel, J. L. P., Bernardes, T. F., C. C. Jobim, P. Schmidt, and L. G. Nussio.Production and
utilization of silages in tropical areas with focus in Brazil. 2019. Grass Forage Sci. 1-13.
Dombrink-Kurtzman, M. A., and J. A. Bietz. 1993. Zein composition in hard and soft
endosperm of maize. Cereal Chem. 70:105-108.
49
Dias Junior, G. S., L. F. Ferraretto, G. G. S. Salvati, L. C. de Resende, P. C. Hoffman, M. N.
Pereira, and R. D. Shaver. 2016. Relationship between processing score and kernel-
fraction particle size in whole-plant corn silage. J. Dairy Sci. 99:2719-2729.
Ferraretto, L. F., and R. D. Shaver. 2012. Meta-analysis: Impact of corn silage harvest
practice on intake, digestion and milk production by dairy cows. Prof. Anim. Sci. 28:141-
149.
Ferraretto, L. F., P. M. Crump, and R. D. Shaver. 2015. Effect of ensiling time and exogenous
protease addition to whole-plant corn silage of various hybrids, maturities and chop
lengths on nitrogen fractions and ruminal in vitro starch digestibility. J. Dairy Sci.
98:8869-8881.
Ferraretto, L. F., R. D. Shaver, and B. D. Luck. 2018. Silage review: Recent advances and
future technologies for whole-plant and fractionated corn silage harvesting. J. Dairy Sci.
101:3937-3951.
Hall, M. B. 2015. Determination of dietary starch in animal feeds and pet food by an
enzymatic-colorimetric method. Collaborative study. J. AOAC Int. 98:397-409.
Heinrichs, A. J. 2013. The Penn State Particle Separator.Extension publication DSE 2013-
186.Pennsylvania State University, College Park.
Johnson, L., J. H. Harrison, C. Hunt, K. Shinners, C. G. Doggett, and D. Sapienza. 1999.
Nutritive value of corn silage as affected by maturity and mechanical processing: A
contemporary review. J. Dairy Sci. 82:2813-2825.
Johnson, L. M., J. H. Harrison, D. Davidson, W. C. Mahanna, and K. Shinners. 2003. Corn
silage management: Effects of hybrid, chop length, and mechanical processing on
digestion and energy content. J. Dairy Sci. 86:208-231.
Johnson, L. M., J. H. Harrison, D. Davidson, J. L. Robutti, M. Swift, W. C. Mahanna, and K.
Shinners. 2002. Corn silage management I: Effects of hybrid, maturity, and mechanical
processing on chemical and physical characteristics. J. Dairy Sci. 85:833-853.
Kung Jr., L., and R. E. Muck.Silage harvesting and storage. 2017. Pages 723-738 in Large
Dairy Herd Management (3oed.) edited by D. K. Beede. 1376 p.
Mertens, D. R. 2005. Particle size, fragmentation index, and effective fiber: Tools for
evaluating the physical attributes of corn silages. Pages 211-220 in Proc. Four-State Dairy
Nutr. Mgmt. Conf., Dubuque, IA.
Nigon, B. J., K. J. Shinners, and D. E. Cook. 2016. Harvester modifications to alter
composition and dry matter of corn-silage. Appl. Eng. Agric. 32:157-167.

50
Owens, F. 2014. New technologies in forage varieties and production. Pages 103–121 in Proc.
Tri-State Dairy Nutr.Conf., Ft. Wayne, IN. Ohio State Univ., Columbus.
Roberge, M., P. Savoie, and E. R. Norris. 1998. Evaluation of a crop processor in a pull-type
forage harvester. Trans. ASAE 41:967-972.
Wiles, P. G., I. K. Gray, and R. C. Kissling. 1998. Routine analyses of protein by Kjeldahl
and Dumas methods: Review and inter-laboratory study using dairy products. J. AOAC
Int. 81:620-632.
Wilkinson, J. M., and Rinne, M. 2018. Review: Highlights of progress in silage conservation
and future perspectives. Grass and Forage Science 73:40-52.
Schurig, M., and G. Rodel. 1993. Power consumption and the effects of corn crackers. ASAE
Paper 93–1586. American Society of Agricultural Engineers, St. Joseph, MI.
Shinners, K. J. 2003.Engineering principles of silage harvesting equipment. Pages 361-403 in
Silage Science and Technology. D. R. Buxton, R. E. Muck, and H. J. Harrison, ed. ASA,
CSA, and SSSA, Madison, WI.
Shinners, K. J., A. G. Jirovec, R. D. Shaver, and M. A. Bal. 2000. Processing whole-plant
corn silage with crop processing rolls on a pull-type forage harvester. Appl. Eng. Agric.
16:323-331.
Weiss, W. P., and D. J. Wyatt. 2000. Effect of oil content and kernel processing of corn silage
on digestibility and milk production by dairy cows. J. Dairy Sci. 83:351-358.
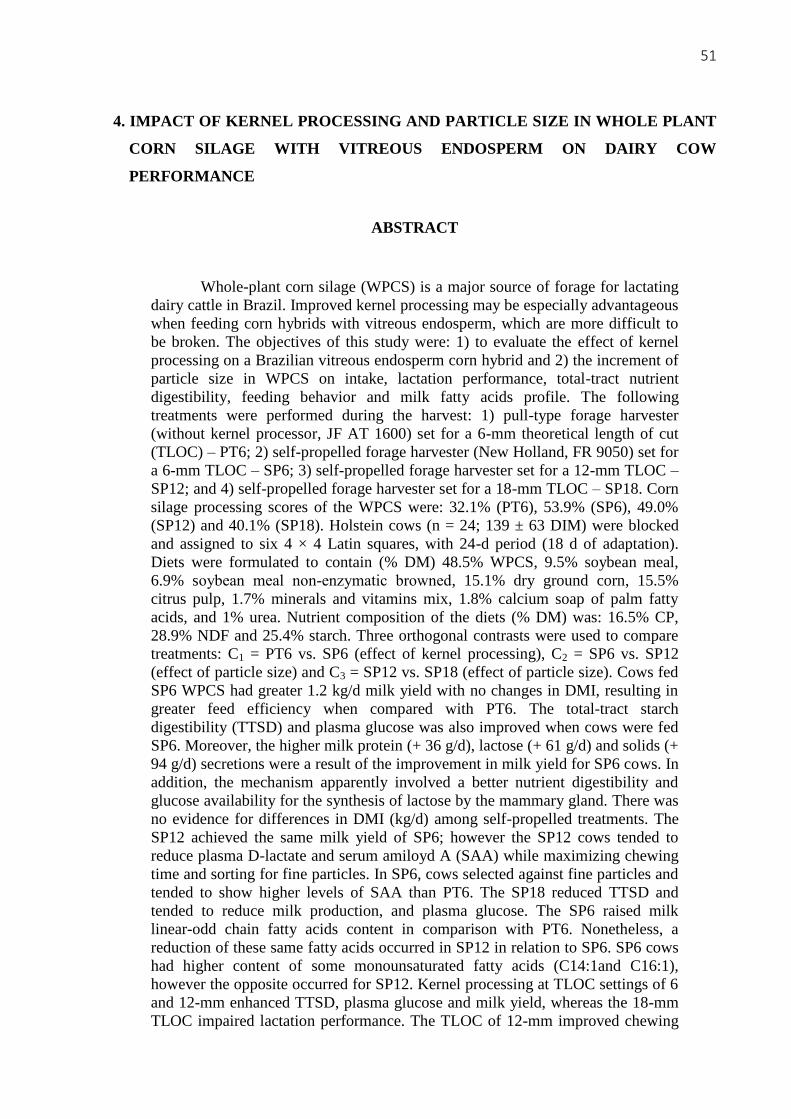
51
4. IMPACT OF KERNEL PROCESSING AND PARTICLE SIZE IN WHOLE PLANT
CORN SILAGE WITH VITREOUS ENDOSPERM ON DAIRY COW
PERFORMANCE
ABSTRACT
Whole-plant corn silage (WPCS) is a major source of forage for lactating
dairy cattle in Brazil. Improved kernel processing may be especially advantageous
when feeding corn hybrids with vitreous endosperm, which are more difficult to
be broken. The objectives of this study were: 1) to evaluate the effect of kernel
processing on a Brazilian vitreous endosperm corn hybrid and 2) the increment of
particle size in WPCS on intake, lactation performance, total-tract nutrient
digestibility, feeding behavior and milk fatty acids profile. The following
treatments were performed during the harvest: 1) pull-type forage harvester
(without kernel processor, JF AT 1600) set for a 6-mm theoretical length of cut
(TLOC) – PT6; 2) self-propelled forage harvester (New Holland, FR 9050) set for
a 6-mm TLOC – SP6; 3) self-propelled forage harvester set for a 12-mm TLOC –
SP12; and 4) self-propelled forage harvester set for a 18-mm TLOC – SP18. Corn
silage processing scores of the WPCS were: 32.1% (PT6), 53.9% (SP6), 49.0%
(SP12) and 40.1% (SP18). Holstein cows (n = 24; 139 ± 63 DIM) were blocked
and assigned to six 4 × 4 Latin squares, with 24-d period (18 d of adaptation).
Diets were formulated to contain (% DM) 48.5% WPCS, 9.5% soybean meal,
6.9% soybean meal non-enzymatic browned, 15.1% dry ground corn, 15.5%
citrus pulp, 1.7% minerals and vitamins mix, 1.8% calcium soap of palm fatty
acids, and 1% urea. Nutrient composition of the diets (% DM) was: 16.5% CP,
28.9% NDF and 25.4% starch. Three orthogonal contrasts were used to compare
treatments: C1 = PT6 vs. SP6 (effect of kernel processing), C2 = SP6 vs. SP12
(effect of particle size) and C3 = SP12 vs. SP18 (effect of particle size). Cows fed
SP6 WPCS had greater 1.2 kg/d milk yield with no changes in DMI, resulting in
greater feed efficiency when compared with PT6. The total-tract starch
digestibility (TTSD) and plasma glucose was also improved when cows were fed
SP6. Moreover, the higher milk protein (+ 36 g/d), lactose (+ 61 g/d) and solids (+
94 g/d) secretions were a result of the improvement in milk yield for SP6 cows. In
addition, the mechanism apparently involved a better nutrient digestibility and
glucose availability for the synthesis of lactose by the mammary gland. There was
no evidence for differences in DMI (kg/d) among self-propelled treatments. The
SP12 achieved the same milk yield of SP6; however the SP12 cows tended to
reduce plasma D-lactate and serum amiloyd A (SAA) while maximizing chewing
time and sorting for fine particles. In SP6, cows selected against fine particles and
tended to show higher levels of SAA than PT6. The SP18 reduced TTSD and
tended to reduce milk production, and plasma glucose. The SP6 raised milk
linear-odd chain fatty acids content in comparison with PT6. Nonetheless, a
reduction of these same fatty acids occurred in SP12 in relation to SP6. SP6 cows
had higher content of some monounsaturated fatty acids (C14:1and C16:1),
however the opposite occurred for SP12. Kernel processing at TLOC settings of 6
and 12-mm enhanced TTSD, plasma glucose and milk yield, whereas the 18-mm
TLOC impaired lactation performance. The TLOC of 12-mm improved chewing
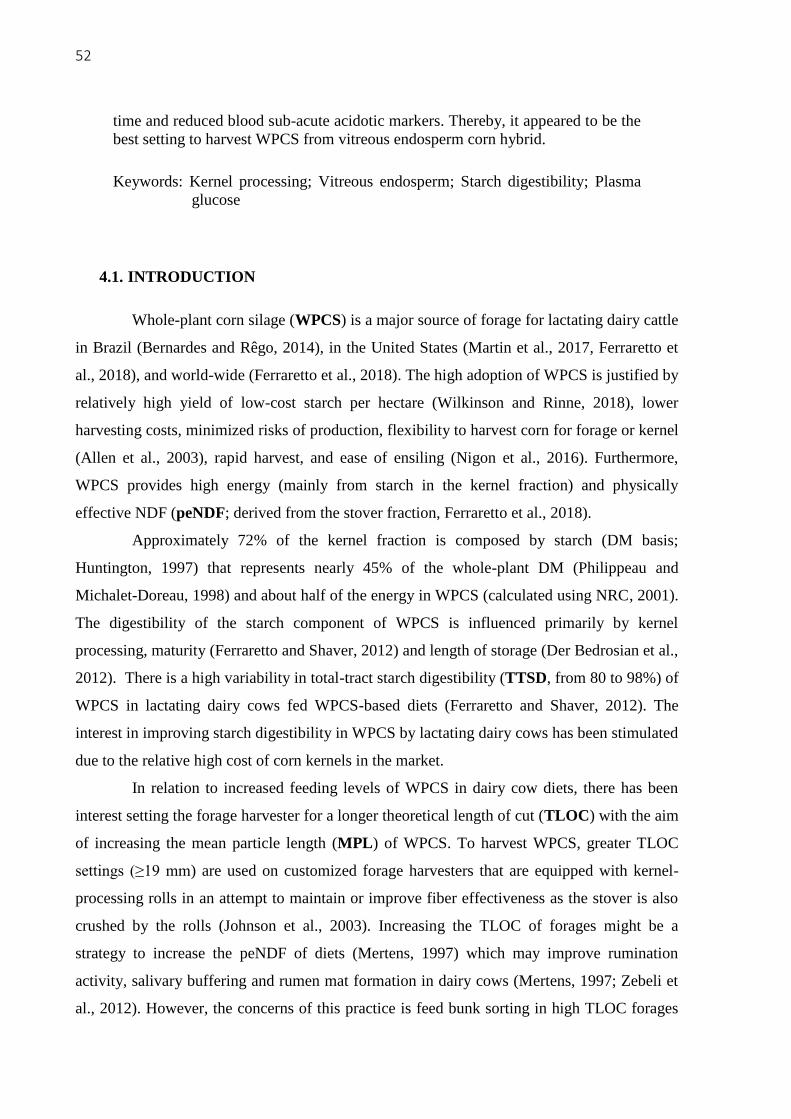
52
time and reduced blood sub-acute acidotic markers. Thereby, it appeared to be the
best setting to harvest WPCS from vitreous endosperm corn hybrid.
Keywords: Kernel processing; Vitreous endosperm; Starch digestibility; Plasma
glucose
4.1. INTRODUCTION
Whole-plant corn silage (WPCS) is a major source of forage for lactating dairy cattle
in Brazil (Bernardes and Rêgo, 2014), in the United States (Martin et al., 2017, Ferraretto et
al., 2018), and world-wide (Ferraretto et al., 2018). The high adoption of WPCS is justified by
relatively high yield of low-cost starch per hectare (Wilkinson and Rinne, 2018), lower
harvesting costs, minimized risks of production, flexibility to harvest corn for forage or kernel
(Allen et al., 2003), rapid harvest, and ease of ensiling (Nigon et al., 2016). Furthermore,
WPCS provides high energy (mainly from starch in the kernel fraction) and physically
effective NDF (peNDF; derived from the stover fraction, Ferraretto et al., 2018).
Approximately 72% of the kernel fraction is composed by starch (DM basis;
Huntington, 1997) that represents nearly 45% of the whole-plant DM (Philippeau and
Michalet-Doreau, 1998) and about half of the energy in WPCS (calculated using NRC, 2001).
The digestibility of the starch component of WPCS is influenced primarily by kernel
processing, maturity (Ferraretto and Shaver, 2012) and length of storage (Der Bedrosian et al.,
2012). There is a high variability in total-tract starch digestibility (TTSD, from 80 to 98%) of
WPCS in lactating dairy cows fed WPCS-based diets (Ferraretto and Shaver, 2012). The
interest in improving starch digestibility in WPCS by lactating dairy cows has been stimulated
due to the relative high cost of corn kernels in the market.
In relation to increased feeding levels of WPCS in dairy cow diets, there has been
interest setting the forage harvester for a longer theoretical length of cut (TLOC) with the aim
of increasing the mean particle length (MPL) of WPCS. To harvest WPCS, greater TLOC
settings (≥19 mm) are used on customized forage harvesters that are equipped with kernel-
processing rolls in an attempt to maintain or improve fiber effectiveness as the stover is also
crushed by the rolls (Johnson et al., 2003). Increasing the TLOC of forages might be a
strategy to increase the peNDF of diets (Mertens, 1997) which may improve rumination
activity, salivary buffering and rumen mat formation in dairy cows (Mertens, 1997; Zebeli et
al., 2012). However, the concerns of this practice is feed bunk sorting in high TLOC forages

53
(Vanderwerrff et al., 2015) that can make dairy cows prone to subacute ruminal acidosis
(SARA).
In Brazil, most dairy farmers harvest the corn crop with a pull-type forage harvester
(PTFH; Bernardes and Rego, 2014). Brazilian PTFH do not have specialized kernel processor
displays (Bernardes et al., 2018) and the most cultivated hybrids have flint kernel with a
higher proportion of vitreous endosperm (Correa et al., 2002; Bernardes et al., 2018) which is
more difficult to damage during harvesting (Ferraretto et al. 2018); thereby compromising
kernel processing. In the United States, the typical range of TLOC to chop corn plants for
WPCS is from 19-mm to 26-mm (Grant and Ferraretto, 2018). However, the hypothesis of
our study was that to achieve adequate kernel processing in vitreous endosperm hybrid a
lower TLOC would be required. Therefore, the objectives of this study were: 1) to evaluate
the effect of kernel processing on a Brazilian vitreous endosperm corn hybrid and 2) the
increment of particle size in WPCS on intake, lactation performance, total-tract nutrient
digestibility, feeding behavior and milk fatty acids profile.
4.2. MATERIALS AND METHODS
Fifteen hectares of a vitreous corn hybrid (DKB 177 VT PRO 2, Dekalb, Monsanto,
Dekalb, Illinois, USA) were planted on November 4, 2015, at a density of 68,750 seeds per
hectare at the Luiz de Queiroz College of Agriculture – University of São Paulo (Piracicaba,
São Paulo, Brazil). The harvesting occurred on February 17, 2016,at approximately one-half
of milk line stage of kernel maturity and at 34% DM of whole-plant. The field was harvested
in alternating strips in an attempt to keep similar nutrient compositions among treatments.
Treatments were performed during the harvesting process. A PTFH (JF AT 1600 PTFH; JF
Máquinas Agrícolas, Itapira, Brazil) set for 6-mm of TLOC without a kernel processor was
used to harvest the PT6 treatment. A self-propelled forage harvester (SPFH; FR 9050; CNH
Industrial, New Holland, Pennsylvania, USA) equipped with conventional rolls set for a 1-
mm roll gap and a 22% roll speed differential was used to harvest the following TLOC
treatments: 6-mm (SP6), 12-mm (SP12) and 18-mm (SP18). The silages were stored in
bunker silos for approximately 10 months before initiating the feeding trial.
The animal performance trial was conducted from December 4, 2016 to March 10,
2017, in anopen walled sand bedded free-stall barn with fans, and equipped with feed
monitoring system (Intergado Ltda., Contagem, Minas Gerais, Brazil). The trial protocol was
approved by the Luiz de Queiroz College of Agriculture – University of São Paulo Bioethic
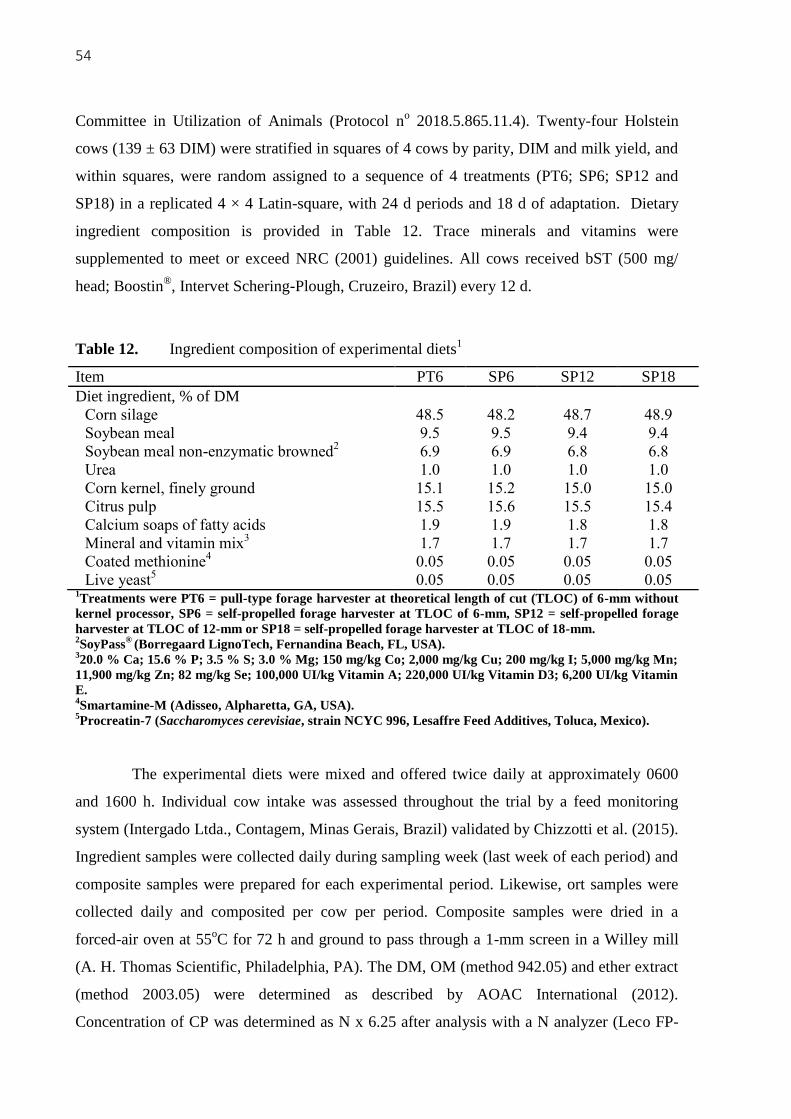
54
Committee in Utilization of Animals (Protocol no 2018.5.865.11.4). Twenty-four Holstein
cows (139 ± 63 DIM) were stratified in squares of 4 cows by parity, DIM and milk yield, and
within squares, were random assigned to a sequence of 4 treatments (PT6; SP6; SP12 and
SP18) in a replicated 4 × 4 Latin-square, with 24 d periods and 18 d of adaptation. Dietary
ingredient composition is provided in Table 12. Trace minerals and vitamins were
supplemented to meet or exceed NRC (2001) guidelines. All cows received bST (500 mg/
head; Boostin®, Intervet Schering-Plough, Cruzeiro, Brazil) every 12 d.
Table 12. Ingredient composition of experimental diets1
Item PT6 SP6 SP12 SP18
Diet ingredient, % of DM
Corn silage 48.5 48.2 48.7 48.9
Soybean meal 9.5 9.5 9.4 9.4
Soybean meal non-enzymatic browned2 6.9 6.9 6.8 6.8
Urea 1.0 1.0 1.0 1.0
Corn kernel, finely ground 15.1 15.2 15.0 15.0
Citrus pulp 15.5 15.6 15.5 15.4
Calcium soaps of fatty acids 1.9 1.9 1.8 1.8
Mineral and vitamin mix3
1.7 1.7 1.7 1.7
Coated methionine4
0.05 0.05 0.05 0.05
Live yeast5 0.05 0.05 0.05 0.05
1Treatments were PT6 = pull-type forage harvester at theoretical length of cut (TLOC) of 6-mm without
kernel processor, SP6 = self-propelled forage harvester at TLOC of 6-mm, SP12 = self-propelled forage
harvester at TLOC of 12-mm or SP18 = self-propelled forage harvester at TLOC of 18-mm. 2SoyPass
® (Borregaard LignoTech, Fernandina Beach, FL, USA).
320.0 % Ca; 15.6 % P; 3.5 % S; 3.0 % Mg; 150 mg/kg Co; 2,000 mg/kg Cu; 200 mg/kg I; 5,000 mg/kg Mn;
11,900 mg/kg Zn; 82 mg/kg Se; 100,000 UI/kg Vitamin A; 220,000 UI/kg Vitamin D3; 6,200 UI/kg Vitamin
E. 4Smartamine-M (Adisseo, Alpharetta, GA, USA).
5Procreatin-7 (Saccharomyces cerevisiae, strain NCYC 996, Lesaffre Feed Additives, Toluca, Mexico).
The experimental diets were mixed and offered twice daily at approximately 0600
and 1600 h. Individual cow intake was assessed throughout the trial by a feed monitoring
system (Intergado Ltda., Contagem, Minas Gerais, Brazil) validated by Chizzotti et al. (2015).
Ingredient samples were collected daily during sampling week (last week of each period) and
composite samples were prepared for each experimental period. Likewise, ort samples were
collected daily and composited per cow per period. Composite samples were dried in a
forced-air oven at 55oC for 72 h and ground to pass through a 1-mm screen in a Willey mill
(A. H. Thomas Scientific, Philadelphia, PA). The DM, OM (method 942.05) and ether extract
(method 2003.05) were determined as described by AOAC International (2012).
Concentration of CP was determined as N x 6.25 after analysis with a N analyzer (Leco FP-
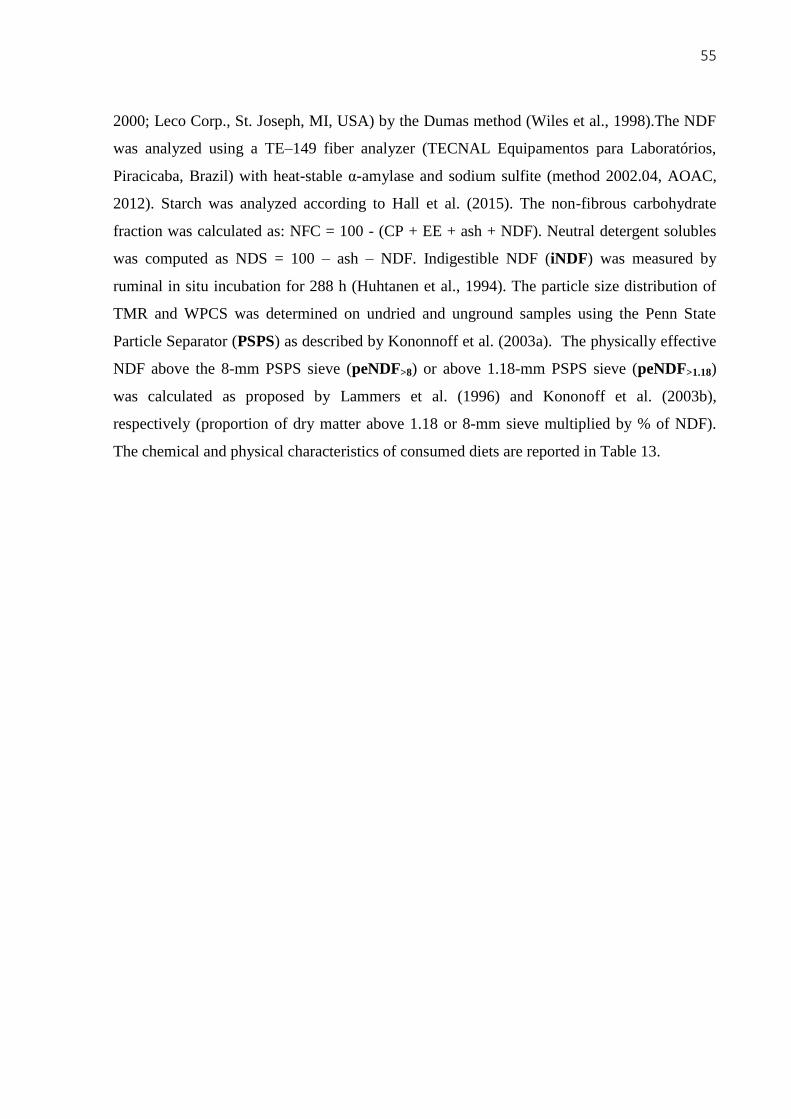
55
2000; Leco Corp., St. Joseph, MI, USA) by the Dumas method (Wiles et al., 1998).The NDF
was analyzed using a TE–149 fiber analyzer (TECNAL Equipamentos para Laboratórios,
Piracicaba, Brazil) with heat-stable α-amylase and sodium sulfite (method 2002.04, AOAC,
2012). Starch was analyzed according to Hall et al. (2015). The non-fibrous carbohydrate
fraction was calculated as: NFC = 100 - (CP + EE + ash + NDF). Neutral detergent solubles
was computed as NDS = 100 – ash – NDF. Indigestible NDF (iNDF) was measured by
ruminal in situ incubation for 288 h (Huhtanen et al., 1994). The particle size distribution of
TMR and WPCS was determined on undried and unground samples using the Penn State
Particle Separator (PSPS) as described by Kononnoff et al. (2003a). The physically effective
NDF above the 8-mm PSPS sieve (peNDF>8) or above 1.18-mm PSPS sieve (peNDF>1.18)
was calculated as proposed by Lammers et al. (1996) and Kononoff et al. (2003b),
respectively (proportion of dry matter above 1.18 or 8-mm sieve multiplied by % of NDF).
The chemical and physical characteristics of consumed diets are reported in Table 13.
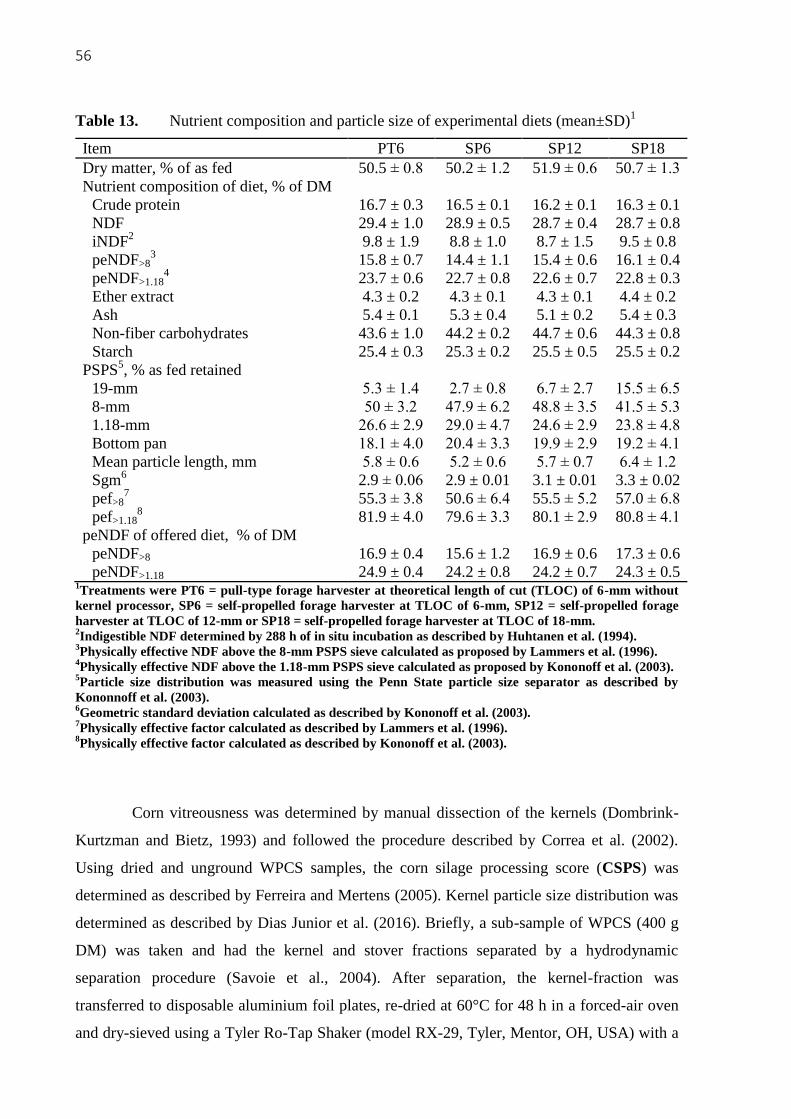
56
Table 13. Nutrient composition and particle size of experimental diets (mean±SD)1
Item PT6 SP6 SP12 SP18
Dry matter, % of as fed 50.5 ± 0.8 50.2 ± 1.2 51.9 ± 0.6 50.7 ± 1.3
Nutrient composition of diet, % of DM
Crude protein 16.7 ± 0.3 16.5 ± 0.1 16.2 ± 0.1 16.3 ± 0.1
NDF 29.4 ± 1.0 28.9 ± 0.5 28.7 ± 0.4 28.7 ± 0.8
iNDF2
9.8 ± 1.9 8.8 ± 1.0 8.7 ± 1.5 9.5 ± 0.8
peNDF>83
15.8 ± 0.7 14.4 ± 1.1 15.4 ± 0.6 16.1 ± 0.4
peNDF>1.184
23.7 ± 0.6 22.7 ± 0.8 22.6 ± 0.7 22.8 ± 0.3
Ether extract 4.3 ± 0.2 4.3 ± 0.1 4.3 ± 0.1 4.4 ± 0.2
Ash 5.4 ± 0.1 5.3 ± 0.4 5.1 ± 0.2 5.4 ± 0.3
Non-fiber carbohydrates 43.6 ± 1.0 44.2 ± 0.2 44.7 ± 0.6 44.3 ± 0.8
Starch 25.4 ± 0.3 25.3 ± 0.2 25.5 ± 0.5 25.5 ± 0.2
PSPS5, % as fed retained
19-mm 5.3 ± 1.4 2.7 ± 0.8 6.7 ± 2.7 15.5 ± 6.5
8-mm 50 ± 3.2 47.9 ± 6.2 48.8 ± 3.5 41.5 ± 5.3
1.18-mm 26.6 ± 2.9 29.0 ± 4.7 24.6 ± 2.9 23.8 ± 4.8
Bottom pan 18.1 ± 4.0 20.4 ± 3.3 19.9 ± 2.9 19.2 ± 4.1
Mean particle length, mm 5.8 ± 0.6 5.2 ± 0.6 5.7 ± 0.7 6.4 ± 1.2
Sgm6
2.9 ± 0.06 2.9 ± 0.01 3.1 ± 0.01 3.3 ± 0.02
pef>87
55.3 ± 3.8 50.6 ± 6.4 55.5 ± 5.2 57.0 ± 6.8
pef>1.188
81.9 ± 4.0 79.6 ± 3.3 80.1 ± 2.9 80.8 ± 4.1
peNDF of offered diet, % of DM
peNDF>8 16.9 ± 0.4 15.6 ± 1.2 16.9 ± 0.6 17.3 ± 0.6
peNDF>1.18 24.9 ± 0.4 24.2 ± 0.8 24.2 ± 0.7 24.3 ± 0.5 1Treatments were PT6 = pull-type forage harvester at theoretical length of cut (TLOC) of 6-mm without
kernel processor, SP6 = self-propelled forage harvester at TLOC of 6-mm, SP12 = self-propelled forage
harvester at TLOC of 12-mm or SP18 = self-propelled forage harvester at TLOC of 18-mm. 2Indigestible NDF determined by 288 h of in situ incubation as described by Huhtanen et al. (1994).
3Physically effective NDF above the 8-mm PSPS sieve calculated as proposed by Lammers et al. (1996).
4Physically effective NDF above the 1.18-mm PSPS sieve calculated as proposed by Kononoff et al. (2003).
5Particle size distribution was measured using the Penn State particle size separator as described by
Kononnoff et al. (2003). 6Geometric standard deviation calculated as described by Kononoff et al. (2003).
7Physically effective factor calculated as described by Lammers et al. (1996).
8Physically effective factor calculated as described by Kononoff et al. (2003).
Corn vitreousness was determined by manual dissection of the kernels (Dombrink-
Kurtzman and Bietz, 1993) and followed the procedure described by Correa et al. (2002).
Using dried and unground WPCS samples, the corn silage processing score (CSPS) was
determined as described by Ferreira and Mertens (2005). Kernel particle size distribution was
determined as described by Dias Junior et al. (2016). Briefly, a sub-sample of WPCS (400 g
DM) was taken and had the kernel and stover fractions separated by a hydrodynamic
separation procedure (Savoie et al., 2004). After separation, the kernel-fraction was
transferred to disposable aluminium foil plates, re-dried at 60°C for 48 h in a forced-air oven
and dry-sieved using a Tyler Ro-Tap Shaker (model RX-29, Tyler, Mentor, OH, USA) with a
57
set of 9 sieves with nominal square apertures of 9.50, 6.70, 4.75, 3.35, 2.36, 1.70, 1.18, and
0.59-mm, in addition to the bottom pan. Geometric mean particle size (GMPS; µm) and
surface area (cm2/g) were calculated using a log normal distribution (Baker and Herrman,
2002). The percentage of kernels below the 4.75-mm screen was determined as described by
Dias Junior et al. (2016).
During silage feed out, samples were collected daily and kept frozen at –20º C to
form a composite sample per silo. Aqueous extracts were prepared from the composite sample
(25 g + 225 g of deionized water) and homogenized for 4 min in a stomacher. The extract was
filtered through 3 folder cheese-cloth and centrifuged for 15 min at 10,000 × g. The
supernatant was analyzed for fermentation end products. Lactic acid (Pryce, 1969) and
ammonia (Weatherburn, 1967) were determined by colorimetric methods and volatile fatty
acids, alcohols and esters were analyzed using a gas chromatograph with a mass detector
(GCMS QP 2010 plus, Shimadzu, Kyoto, Japan), using a capillary column (Stabilwax,
Restek, Bellefonte, PA; 60 m, 0.25-mm, i.d., 0.25 90 m). The dry matter content corrected for
volatiles (DMcorr) was calculated using the equation of Weissbach (2009): DMcorr (% as
fed) = oven DM (% as fed) + n-alcohols (% as fed) + 2,3-butanediol (% as fed) + 0.95 ×
volatile fatty acids (% as fed) + 0.77 × 1,2-propanediol (% as fed) + 0.08 × lactic acid (% as
fed). The chemical composition, fermentation profile, and physical characteristics of whole-
plant corn silage are in Table 14.
58
Table 14. Chemical composition, fermentation, and physical characteristics of whole-
plant corn silage1
Item PT6 SP6 SP12 SP18
Nutrient
DM, % as fed 33.4 ± 1.2 33.4 ± 0.6 34.1 ± 0.7 33.2 ± 1.0
DMcorr, % as fed2
33.7 ± 1.6 33.7 ± 1.1 34.9 ± 0.3 33.6 ± 1.1
OM, % as fed 95.8 ± 0.1 95.6 ± 0.4 96.0 ± 0.1 95.9 ± 0.2
CP, % as fed 5.2 ± 0.6 5.7 ± 0.7 5.5 ± 0.7 5.3 ± 0.4
Ether extract, % of DM 3.2 ± 0.3 3.5 ± 0.1 3.3 ± 0.2 3.4 ± 0.1
NDF, % of DM 44.7 ± 4.1 44.8 ± 1.8 42.8 ± 1.3 43.0 ± 1.5
iNDF2, % of DM 18.0 ± 0.5 18.5 ± 1.3 18.9 ± 2.0 18.3 ± 1.1
Starch, % DM 31.6 ± 2.8 31.8 ± 3.1 32.4 ± 4.1 32.5 ± 4.3
Fermentation profile
pH 4.0 ± 0.2 3.8 ± 0.1 3.9 ± 0.2 4.0 ± 0.1
Lactic acid, % of DMcorr
3.0 ± 0.8 3.5 ± 1.2 3.1 ± 0.4 3.0 ± 0.8
Acetic acid, % of DMcorr 2.3 ± 0.6 2.4 ± 1.5 2.2 ± 0.5 2.2 ± 1.2
Propionic acid, % of DMcorr 0.45 ± 0.19 0.34 ± 0.24 0.40 ± 0.09 0.40 ± 0.21
1,2-Propanediol, % of DMcorr 0.48 ± 0.26 0.43 ± 0.06 0.45 ± 0.15 0.20 ± 0.03
2,3-Butanediol, % of DMcorr 0.18 ± 0.07 0.13 ± 0.09 0.16 ± 0.03 0.15 ± 0.08
1-Propanol, % of DMcorr 0.08 ± 0.02 0.13 ± 0.12 0.08 ± 0.06 0.15 ± 0.10
Ethanol, % of DMcorr 0.09 ± 0.03 0.10 ± 0.08 0.09 ± 0.03 0.11 ± 0.06
Butyric acid, % of DMcorr 0.02 ± 0.01 0.01 ± 0.01 0.01 ± 0.01 0.02 ± 0.02
Ammonia-N, % of CP 5.7 ± 0.1 5.8 ± 0.2 5.1 ± 0.5 5.6 ± 0.2
CSPS, % passing 4.75-mm sieve3
Starch 32.1 ± 3.5 53.9 ± 4.8 49.0 ± 2.9 40.1 ± 5.5
Kernel fraction
GMPS5, µm 4585 ± 351 3422 ± 350 3762 ± 534 4017 ± 399
Surface area, cm2/g 13.2 ± 1.4 17.6 ± 1.7 17.0 ± 2.1 16.5 ± 1.9
% kernels < 4.75-mm sieve6
33.8 ± 4.8 54.2 ± 6.4 48.9 ± 7.8 41.9 ± 5.1
PSPS7, % as fed retained
19-mm 9.0 ± 4.2 4.0 ± 1.9 9.8 ± 6.5 19.3 ± 4.2
8-mm 76.4 ± 2.6 79.1 ± 2.2 76.6 ± 4.4 69.7 ± 2.4
1.18-mm 12.3 ±1.7 14.4 ± 3.2 10.6 ± 1.4 8.9 ± 2.6
Bottom pan 2.4 ± 0.5 2.6 ± 0.8 3.0 ± 0.8 2.1 ± 0.7
Mean particle length, mm 10.8 ± 0.8 10.0 ± 0.8 11.0 ±1.0 12.4 ±0.7
Sgm8
1.89 ± 0.05 1.85 ± 0.09 1.92 ± 0.04 1.95 ± 0.04 1Treatments were PT6 = pull-type forage harvester at theoretical length of cut (TLOC) of 6-mm without
kernel processor, SP6 = self-propelled forage harvester at TLOC of 6-mm, SP12 = self-propelled forage
harvester at TLOC of 12-mm or SP18 = self-propelled forage harvester at TLOC of 18-mm. 2Dry matter content corrected for volatiles was calculated using the equation of Weissbach (2009):
DMcorr (% as fed) = oven DM (% as fed) + n-alcohols (% as fed) + 2,3-butanediol (% as fed) + 0.95 ×
volatile fatty acids (% as fed) + 0.77 × 1,2-propanediol (% as fed) + 0.08 × lactic acid (% as fed). 3Indigestible NDF determined by 288 h of in situ incubation as described by Huhtanen et al. (1994).
4Processing score was measured as described by Ferreira and Mertens (2005).
5Geometric mean particle size was measured as described by Dias Junior et al. (2016).
6Proportion of hydrodynamically separated kernel fraction passing through a 4.75-mm sieve.
7Particle size was measured using the Penn State particle size separator as described by Kononoff et al.
(2003). 8Geometric standard deviation calculated as described by Kononoff et al. (2003).
59
Cows were milked twice daily, at 0600 and 1600 h, and milk yield was recorded
daily. Milk samples were obtained on d 21 and 22 during four consecutive milkings. Milk
components and milk urea nitrogen (MUN) content were measured in Clínica do Leite
(Piracicaba, Brazil) by mid-infrared analysis (Bentley 2000. Bentley Instruments Inc., Chaska,
MN, USA). Milk energy secretion (Mcal/d) was calculated as: [(0.0929 x %fat) + (0.0547 x
% protein) + (0.0395 x % lactose)] x kg of milk (NRC, 2001). Energy corrected milk (ECM)
was calculated as: Energy secretion/0.70 (Assumes 0.70 Mcal/kg for milk with 3.7% fat,
3.2% protein, and 4.6% lactose). 4% fat corrected milk (4% FCM) was calculated as: (0.4 +
15 x % fat / 100) x kg of milk (NRC, 2001). Body condition score (BCS; scale of 1 to 5;
Wildman et al., 1982) was measured by three trained evaluators each experimental period and
the average was used to describe the experimental units. After the morning milking, BW was
also measured at each experimental period.
Milk samples collected on d 22 were used to isolate fat and determine the milk fatty
acids (FA) profile. The samples were frozen and stored at -20oC until the preparation for the
gas chromatographic analysis, performed in the laboratory at the University of Sao Paulo
(Pirassununga, Brazil). The samples were centrifuged at 17,800 x g for 30 min at 4oC and next
for 19,300 x g for 20 min at 4oC, according to Feng et al. (2004).The separated fat (0.300–
0.400 g) was methylated and the methyl esters were formed according to Kramer et al. (1997).
Two internal C18:0 and C19:0 FA standards were used for correcting losses during the
process of methylation. The fatty acids were quantified by chromatography gas (Shimadzu
GC 2010 with automatic injection) using capillary column SP-2560 (100 m × 0.25-mm i.d.
with 0.02-mm of film thickness (Supelco, Bellefonte, PA, USA). The initial temperature was
70oC for four minutes (13
oC/minute) until it reached a maximum temperature of 175
oC. This
temperature was maintained for 27 min. Afterwards, a new increase of 4oC/minute was
initiated until 215oC, which was maintained for 31 min. Hydrogen was used as carrier gas
with a flux of 40 cm/s. During the process of identification four standards were used: standard
C4-C24 FA (Supelco®TM 37), vaccenic acid C18:1trans-11 (V038-1G, Sigma®), CLA C18:2
trans-10, cis-12 (UC-61 M 100 MG), and CLA C18:2 cis-9, trans-11 (UC-60 M 100 MG;
NU-CHEK-PREP USA®) for identification of fatty acids that are formed during the
biohydrogenation.The daily secretion of fatty acids in milk was calculated considering that the
daily production of fat is comprised of 93.3% fatty acids and 6.7% glycerol (Jenkins, 2004).
On d 20 to d 22, fecal grab samples were collected every 8 h and composed by
period. Total-tract apparent digestibility of DM, OM, NDF, starch and NDS was determined
using indigestible NDF (iNDF) as an internal marker (Huhtanen et al., 1994). Spot urine
60
samples were collected in buckets, via stimulation of peri-vaginal area, simultaneously to
fecal sampling, to estimate rumen microbial synthesis based on purine derivatives excretion.
A 10% sulfuric acid solution was immediately added to the urine samples (1:9) before
refrigeration at 4°C. Composite urine samples were diluted 1:5 with distilled water and frozen
at -20°C. The creatinine and uric acid were analyzed by laboratory kits (Doles Reagentes e
Equipamentos para Laboratórios Ltda, Goiânia, Brazil). Urinary creatinine concentration was
used as an indicator of urine output (Chizzotti et al., 2008). Allantoin was analyzed as
described by Chen and Gomes (1992).
On d 22, the chewing activity behavior was measured by continuous observation of
buccal activity in each cow at 10 min intervals for 24 h. Buccal activities recorded were:
water ingestion, eating, rumination, and idleness. Chewing time, in min per d, was the sum of
eating and rumination time. Chewing, eating, and rumination per unit of DMI were calculated
using DMI of the day of chewing evaluation. The chewing, eating, and rumination per unit
NDF, forage NDF, iNDF, peNDF>8, and peNDF>1.18 intakes followed the same logic. Feed
sorting was also evaluated on d 22. Individual cow samples were analyzed for particle size as
described by Kononoff et al. (2003). Sorting was calculated as described by Leonardi and
Armentano (2003); values <100% indicate selective refusals, >100% indicate a preferential
consumption and those equal to 100% indicate no sorting. The time of first meal was recorded
on d 22 by visual observation.
Blood samples from the coccygeal vessels were obtained on d 23 to determine
plasma urea-N (PUN), glucose, D-lactate and serum amyloid A (SAA). Samples for PUN
were obtained immediately before the first daily feeding and 1, 2, 3, 6, 12 and 15 h after
feeding. The blood, collected in vacutainer tubes containing EDTA, was immediately
refrigerated, centrifuged at 1,500 x g for 15 min and the plasma was frozen at -20°C. The
PUN content was analyzed with a laboratory kit (Urea 500. Doles Reagentes para
Laboratórios Ltda, Goiânia, Brazil). Plasma glucose samples were collected 6 and 12 h post-
feeding in tubes containing EDTA and sodium fluoride. They were analyzed with a laboratory
kit (Glicose Enzimática Líquida. Doles Reagentes para Laboratórios Ltda, Goiânia, Brazil). In
addition, plasma D-lactate content 12-h post-feeding followed the same sample collecting
procedure of glucose samples and was analyzed using a commercial kit (EnzymChromTM
D-
lactate Essay – EDLC-100. BioAssay Systems, Haywart, USA). Samples for SAA analysis
were collected 12-h post-feeding in tubes containing heparin. SAA content was determined
using commercial ELISA kits (SEA885Bo and SEB406Bo, respectively; Cloud-Clone Corp,
Katy, USA) according with Ametaj et al. (2005).
61
On d 24, rumen fluid samples were collected through a flexible oro-gastric tube.
Samples were collected 12 ± 0.35 h after the morning feeding. Animals were randomly
sampled within each block. Ruminal pH was measured immediately (DIGIMED DM20, São
Paulo, Brazil). A ruminal sample was instantaneously frozen in liquid nitrogen to stop
fermentation and was kept frozen at -20oC until the preparation for analysis of organic acids
by Agilent 7890A gas chromatograph according to Ferreira et al. (2016). The NH3-N
concentration was determined with a colorimetric method described by Chaney and Marbach
(1962) and adapted for a microplate reader (BioRad, Hercules, CA, USA) with a 550 nm
absorbance filter.
4.2.1. Statistical analysis
Data were analyzed using the MIXED procedure of SAS (SAS Institute Inc., Cary,
NC). The model included the effects of Latin square (1 to 6), period (1 to 4), treatment (PT6,
SP6, SP12 and SP18) as fixed effects; cow within square (1 to 24) was a random effect. The
mean square of cow, period and treatment factors was used as the error to test the treatment
effects. Outcomes measured over time were analyzed as repeated measures. The covariance
structure was defined based on the Akaike’s information criterion among variance
compounds, autoregressive of first order, compound symmetry or unstructured. Degrees of
freedom were calculated using the Kenward-Roger option. Three orthogonal contrasts were
used to compare treatments: 1) PT6 vs. SP6 (effect of kernel processing), 2) SP6 vs. SP12
(effect of particle size) and 3) SP12 vs. SP18 (effect of particle size). Statistical significance
and trends were considered at P ≤ 0.05 and P> 0.06 to P ≤ 0.10, respectively.
4.3. RESULTS
Means of CP, EE, NDF and starch were 16.4, 4.3, 28.9 and 25.4% of DM. The
different TLOC settings and processing at WPCS influenced the percentage of TMR particles
retained above the 19-mm sieve and MPL (Table 13). The level of peNDF>8 (% DM) of
consumed diets were 15.8 ± 0.7 (PT6), 14.4 ± 1.1 (SP6), 15.4 ± 0.6 (SP12), and 16.1 ± 0.4
(SP18).
The kernel vitreousness was 65.6 ± 3.7% of total endosperm at 33.5% DM WPCS
(data not shown in tables or figures). The WPCS of treatments had similar DM content,
62
chemical composition and fermentation profile (Table 14). The average starch and NDF
content were 32.1 and 43.8 %, respectively. The starch from WPCS composed approximately
61.2 % of total starch diet. The CSPS were 32.1 ± 3.5 % (PT6), 53.9 ± 4.8 % (SP6), 49.0 ±
2.9% (SP12), and 40.1 ± 5.5% (SP18). The percentage of WPCS particles retained above the
19-mm sieve in treatments were 9.0 ± 4.2 (PT6), 4.0 ± 1.9 (SP6), 9.8 ± 6.5 (SP12) and 19.3 ±
4.2 (SP18, Table 14).
Cows fed SP6 WPCS had greater 1.2 kg/d milk yield with no changes in DMI,
resulting in greater feed efficiency (milk yield/DMI) when compared with PT6 (Table 15).
There was no evidence for differences in DMI (kg/d) among self-propelled treatments (P>
0.05; SP6 vs. SP12 or SP12 vs. SP18). Milk protein (+ 36 g/d), lactose (+ 61 g/d) and solids
(+ 94 g/d) secretions were increased when cows were fed SP6 in comparison with PT6. The
percentage of casein increased (77.5 vs. 76.8% milk protein) and MUN was lower (-1.1
mg/dL) for cows fed SP6. There was no difference in milk production between SP6 and SP12,
however, a tendency for reduction (- 0.8 kg) was observed (P = 0.10) when SP12 was
compared with SP18. The treatment SP12 showed less milk protein (3.31 vs. 3.23 %; P =
0.03) and casein (2.55 vs. 2.49 %; P = 0.04) content than SP6. A tendency of less lactose
content (4.64 vs. 4.59%; P = 0.06), lactose secretion (- 46 g/d; P = 0.07) and solid yield (- 84
g/d; P = 0.10; Table 4) occurred when cows were fed SP18. No other differences were
observed in the composition or production of milk solids. BCS and BW were not affected by
treatments (data not shown in tables or figures).
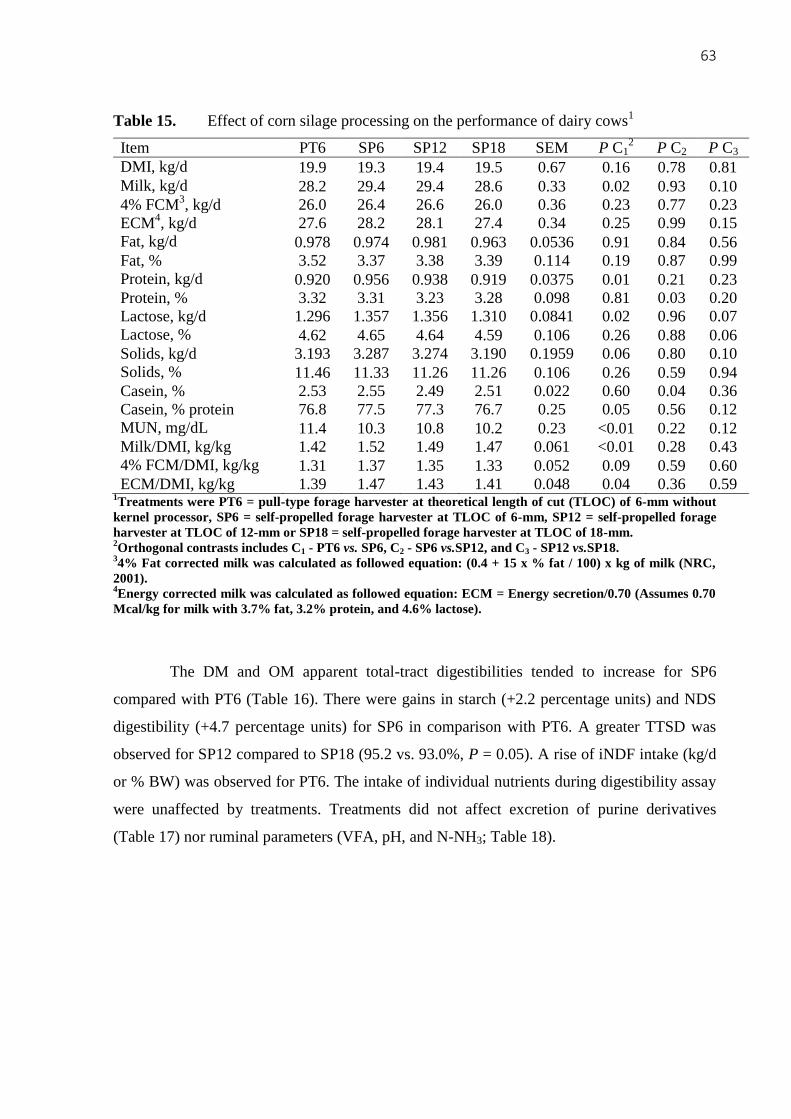
63
Table 15. Effect of corn silage processing on the performance of dairy cows1
Item PT6
SP6 SP12 SP18 SEM
P C12
P C2
P C3
DMI, kg/d
19.9 19.3 19.4 19.5 0.67 0.16 0.78 0.81
Milk, kg/d
28.2 29.4 29.4 28.6 0.33 0.02 0.93 0.10
4% FCM3, kg/d
26.0 26.4 26.6 26.0 0.36 0.23 0.77 0.23
ECM4, kg/d
27.6 28.2 28.1 27.4 0.34 0.25 0.99 0.15
Fat, kg/d 0.978 0.974 0.981 0.963 0.0536 0.91 0.84 0.56
Fat, % 3.52 3.37 3.38 3.39 0.114 0.19 0.87 0.99
Protein, kg/d 0.920 0.956 0.938 0.919 0.0375 0.01 0.21 0.23
Protein, % 3.32 3.31 3.23 3.28 0.098 0.81 0.03 0.20
Lactose, kg/d 1.296 1.357 1.356 1.310 0.0841 0.02 0.96 0.07
Lactose, % 4.62 4.65 4.64 4.59 0.106 0.26 0.88 0.06
Solids, kg/d 3.193 3.287 3.274 3.190 0.1959 0.06 0.80 0.10
Solids, % 11.46 11.33 11.26 11.26 0.106 0.26 0.59 0.94
Casein, % 2.53 2.55 2.49 2.51 0.022 0.60 0.04 0.36
Casein, % protein 76.8 77.5 77.3 76.7 0.25 0.05 0.56 0.12
MUN, mg/dL
11.4 10.3 10.8 10.2 0.23 <0.01 0.22 0.12
Milk/DMI, kg/kg 1.42 1.52 1.49 1.47 0.061 <0.01 0.28 0.43
4% FCM/DMI, kg/kg 1.31 1.37 1.35 1.33 0.052 0.09 0.59 0.60
ECM/DMI, kg/kg 1.39 1.47 1.43 1.41 0.048 0.04 0.36 0.59 1Treatments were PT6 = pull-type forage harvester at theoretical length of cut (TLOC) of 6-mm without
kernel processor, SP6 = self-propelled forage harvester at TLOC of 6-mm, SP12 = self-propelled forage
harvester at TLOC of 12-mm or SP18 = self-propelled forage harvester at TLOC of 18-mm. 2Orthogonal contrasts includes C1 - PT6 vs. SP6, C2 - SP6 vs.SP12, and C3 - SP12 vs.SP18.
34% Fat corrected milk was calculated as followed equation: (0.4 + 15 x % fat / 100) x kg of milk (NRC,
2001). 4Energy corrected milk was calculated as followed equation: ECM = Energy secretion/0.70 (Assumes 0.70
Mcal/kg for milk with 3.7% fat, 3.2% protein, and 4.6% lactose).
The DM and OM apparent total-tract digestibilities tended to increase for SP6
compared with PT6 (Table 16). There were gains in starch (+2.2 percentage units) and NDS
digestibility (+4.7 percentage units) for SP6 in comparison with PT6. A greater TTSD was
observed for SP12 compared to SP18 (95.2 vs. 93.0%, P = 0.05). A rise of iNDF intake (kg/d
or % BW) was observed for PT6. The intake of individual nutrients during digestibility assay
were unaffected by treatments. Treatments did not affect excretion of purine derivatives
(Table 17) nor ruminal parameters (VFA, pH, and N-NH3; Table 18).
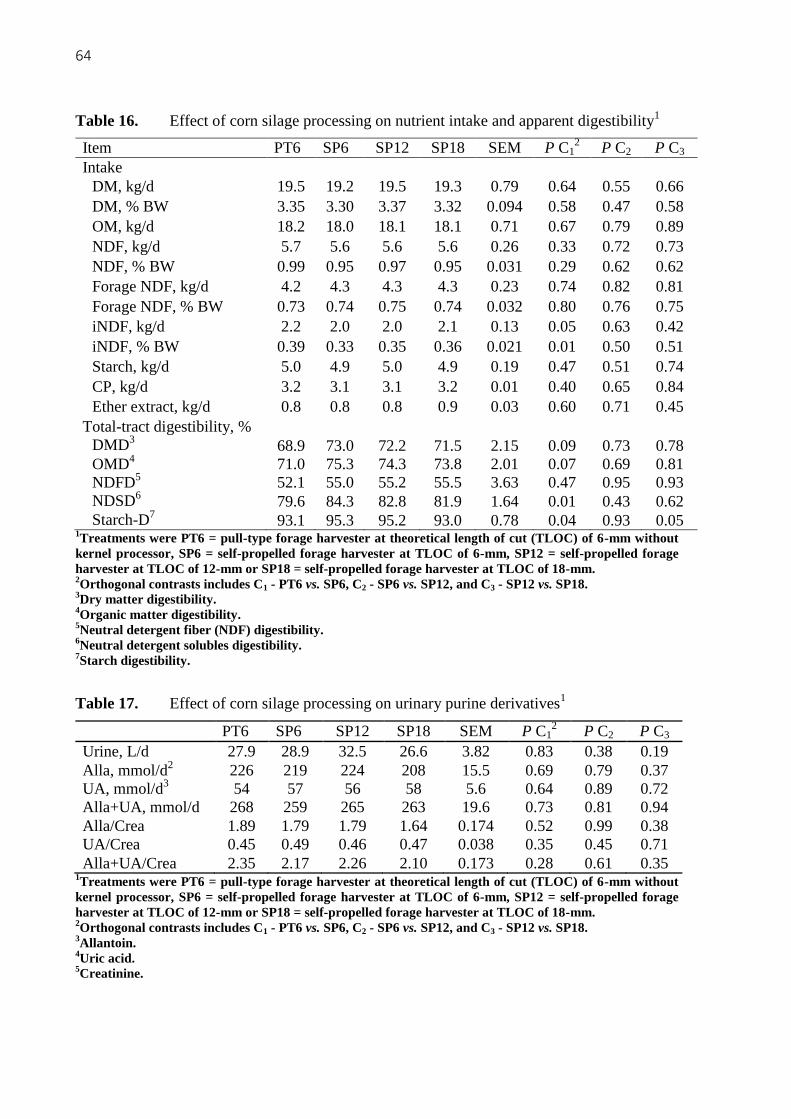
64
Table 16. Effect of corn silage processing on nutrient intake and apparent digestibility1
Item PT6 SP6 SP12 SP18 SEM
P C12
P C2
P C3
Intake
DM, kg/d 19.5 19.2 19.5 19.3 0.79 0.64 0.55 0.66
DM, % BW 3.35 3.30 3.37 3.32 0.094 0.58 0.47 0.58
OM, kg/d 18.2 18.0 18.1 18.1 0.71 0.67 0.79 0.89
NDF, kg/d 5.7 5.6 5.6 5.6 0.26 0.33 0.72 0.73
NDF, % BW 0.99 0.95 0.97 0.95 0.031 0.29 0.62 0.62
Forage NDF, kg/d 4.2 4.3 4.3 4.3 0.23 0.74 0.82 0.81
Forage NDF, % BW 0.73 0.74 0.75 0.74 0.032 0.80 0.76 0.75
iNDF, kg/d 2.2 2.0 2.0 2.1 0.13 0.05 0.63 0.42
iNDF, % BW 0.39 0.33 0.35 0.36 0.021 0.01 0.50 0.51
Starch, kg/d 5.0 4.9 5.0 4.9 0.19 0.47 0.51 0.74
CP, kg/d 3.2 3.1 3.1 3.2 0.01 0.40 0.65 0.84
Ether extract, kg/d 0.8 0.8 0.8 0.9 0.03 0.60 0.71 0.45
Total-tract digestibility, %
DMD3
68.9 73.0 72.2 71.5 2.15 0.09 0.73 0.78
OMD4
71.0 75.3 74.3 73.8 2.01 0.07 0.69 0.81
NDFD5
52.1 55.0 55.2 55.5 3.63 0.47 0.95 0.93
NDSD6
79.6 84.3 82.8 81.9 1.64 0.01 0.43 0.62
Starch-D7
93.1 95.3 95.2 93.0 0.78 0.04 0.93 0.05 1Treatments were PT6 = pull-type forage harvester at theoretical length of cut (TLOC) of 6-mm without
kernel processor, SP6 = self-propelled forage harvester at TLOC of 6-mm, SP12 = self-propelled forage
harvester at TLOC of 12-mm or SP18 = self-propelled forage harvester at TLOC of 18-mm. 2Orthogonal contrasts includes C1 - PT6 vs. SP6, C2 - SP6 vs. SP12, and C3 - SP12 vs. SP18.
3Dry matter digestibility.
4Organic matter digestibility.
5Neutral detergent fiber (NDF) digestibility.
6Neutral detergent solubles digestibility.
7Starch digestibility.
Table 17. Effect of corn silage processing on urinary purine derivatives1
PT6 SP6 SP12 SP18 SEM
P C12
P C2
P C3
Urine, L/d 27.9 28.9 32.5 26.6 3.82 0.83 0.38 0.19
Alla, mmol/d2
226 219 224 208 15.5 0.69 0.79 0.37
UA, mmol/d3
54 57 56 58 5.6 0.64 0.89 0.72
Alla+UA, mmol/d 268 259 265 263 19.6 0.73 0.81 0.94
Alla/Crea 1.89 1.79 1.79 1.64 0.174 0.52 0.99 0.38
UA/Crea 0.45 0.49 0.46 0.47 0.038 0.35 0.45 0.71
Alla+UA/Crea 2.35 2.17 2.26 2.10 0.173 0.28 0.61 0.35 1Treatments were PT6 = pull-type forage harvester at theoretical length of cut (TLOC) of 6-mm without
kernel processor, SP6 = self-propelled forage harvester at TLOC of 6-mm, SP12 = self-propelled forage
harvester at TLOC of 12-mm or SP18 = self-propelled forage harvester at TLOC of 18-mm. 2Orthogonal contrasts includes C1 - PT6 vs. SP6, C2 - SP6 vs. SP12, and C3 - SP12 vs. SP18.
3Allantoin.
4Uric acid.
5Creatinine.
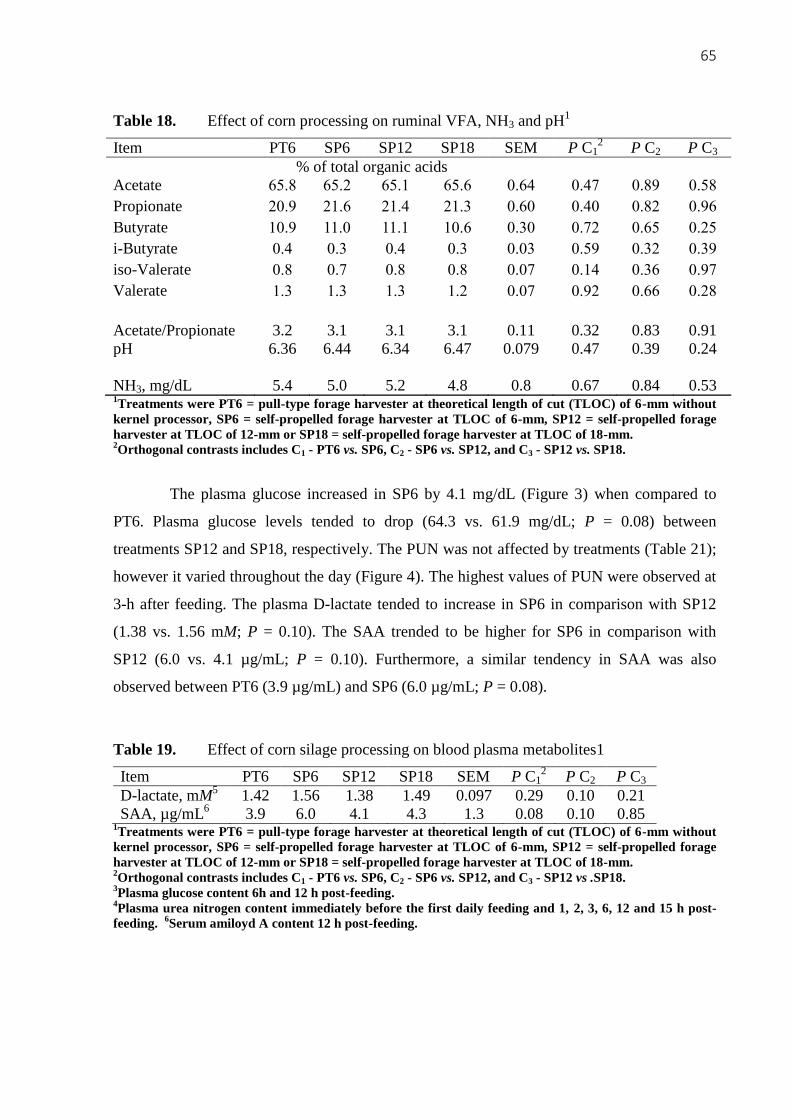
65
Table 18. Effect of corn processing on ruminal VFA, NH3 and pH1
Item PT6 SP6 SP12 SP18 SEM
P C12
P C2
P C3
% of total organic acids
Acetate 65.8 65.2 65.1 65.6 0.64 0.47 0.89 0.58
Propionate 20.9 21.6 21.4 21.3 0.60 0.40 0.82 0.96
Butyrate 10.9 11.0 11.1 10.6 0.30 0.72 0.65 0.25
i-Butyrate 0.4 0.3 0.4 0.3 0.03 0.59 0.32 0.39
iso-Valerate 0.8 0.7 0.8 0.8 0.07 0.14 0.36 0.97
Valerate 1.3 1.3 1.3 1.2 0.07 0.92 0.66 0.28
Acetate/Propionate 3.2 3.1 3.1 3.1 0.11 0.32 0.83 0.91
pH 6.36 6.44 6.34 6.47 0.079 0.47 0.39 0.24
NH3, mg/dL 5.4 5.0 5.2 4.8 0.8 0.67 0.84 0.53 1Treatments were PT6 = pull-type forage harvester at theoretical length of cut (TLOC) of 6-mm without
kernel processor, SP6 = self-propelled forage harvester at TLOC of 6-mm, SP12 = self-propelled forage
harvester at TLOC of 12-mm or SP18 = self-propelled forage harvester at TLOC of 18-mm. 2Orthogonal contrasts includes C1 - PT6 vs. SP6, C2 - SP6 vs. SP12, and C3 - SP12 vs. SP18.
The plasma glucose increased in SP6 by 4.1 mg/dL (Figure 3) when compared to
PT6. Plasma glucose levels tended to drop (64.3 vs. 61.9 mg/dL; P = 0.08) between
treatments SP12 and SP18, respectively. The PUN was not affected by treatments (Table 21);
however it varied throughout the day (Figure 4). The highest values of PUN were observed at
3-h after feeding. The plasma D-lactate tended to increase in SP6 in comparison with SP12
(1.38 vs. 1.56 mM; P = 0.10). The SAA trended to be higher for SP6 in comparison with
SP12 (6.0 vs. 4.1 µg/mL; P = 0.10). Furthermore, a similar tendency in SAA was also
observed between PT6 (3.9 µg/mL) and SP6 (6.0 µg/mL; P = 0.08).
Table 19. Effect of corn silage processing on blood plasma metabolites1
Item PT6 SP6 SP12 SP18 SEM
P C12
P C2
P C3
D-lactate, mM5
1.42 1.56 1.38 1.49 0.097 0.29 0.10 0.21
SAA, µg/mL6
3.9 6.0 4.1 4.3 1.3 0.08 0.10 0.85 1Treatments were PT6 = pull-type forage harvester at theoretical length of cut (TLOC) of 6-mm without
kernel processor, SP6 = self-propelled forage harvester at TLOC of 6-mm, SP12 = self-propelled forage
harvester at TLOC of 12-mm or SP18 = self-propelled forage harvester at TLOC of 18-mm. 2Orthogonal contrasts includes C1 - PT6 vs. SP6, C2 - SP6 vs. SP12, and C3 - SP12 vs .SP18.
3Plasma glucose content 6h and 12 h post-feeding.
4Plasma urea nitrogen content immediately before the first daily feeding and 1, 2, 3, 6, 12 and 15 h post-
feeding. 6Serum amiloyd A content 12 h post-feeding.
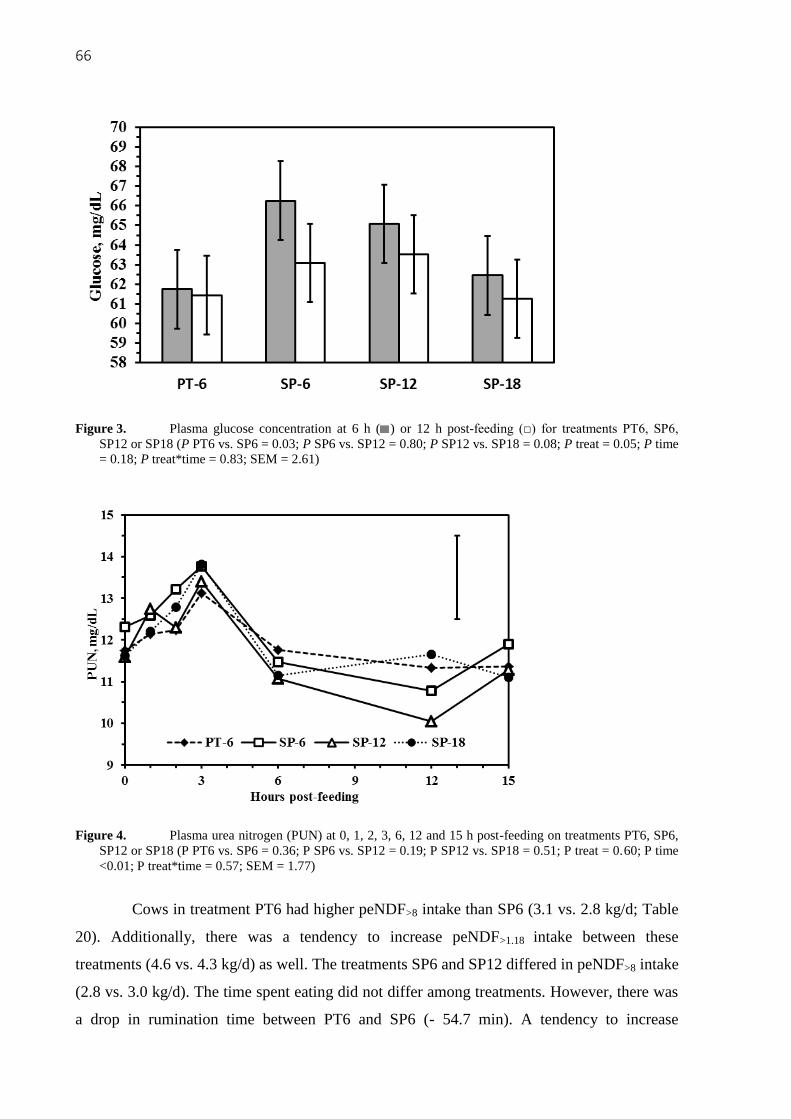
66
Figure 3. Plasma glucose concentration at 6 h ( ) or 12 h post-feeding (□) for treatments PT6, SP6,
SP12 or SP18 (P PT6 vs. SP6 = 0.03; P SP6 vs. SP12 = 0.80; P SP12 vs. SP18 = 0.08; P treat = 0.05; P time
= 0.18; P treat*time = 0.83; SEM = 2.61)
Figure 4. Plasma urea nitrogen (PUN) at 0, 1, 2, 3, 6, 12 and 15 h post-feeding on treatments PT6, SP6,
SP12 or SP18 (P PT6 vs. SP6 = 0.36; P SP6 vs. SP12 = 0.19; P SP12 vs. SP18 = 0.51; P treat = 0.60; P time
<0.01; P treat*time = 0.57; SEM = 1.77)
Cows in treatment PT6 had higher peNDF>8 intake than SP6 (3.1 vs. 2.8 kg/d; Table
20). Additionally, there was a tendency to increase peNDF>1.18 intake between these
treatments (4.6 vs. 4.3 kg/d) as well. The treatments SP6 and SP12 differed in peNDF>8 intake
(2.8 vs. 3.0 kg/d). The time spent eating did not differ among treatments. However, there was
a drop in rumination time between PT6 and SP6 (- 54.7 min). A tendency to increase

67
rumination time (602.6 vs. 549.3 min/d; P = 0.07) was observed in SP12 in comparison with
SP6, which impacted the overall trends observed in other variables (rumination time/DMI,
rumination time/NDFI, rumination time/forage NDFI and rumination time/peNDF>1.18
min/kg). Nonetheless, only SP12 tended to display higher chewing indexes (chewing
time/DMI, chewing time/NDFI, chewing time/forage NDFI and chewing time/peNDF>1.18)
than SP6. The resting time was reduced approximately by 68 and 65 min for PT6 and SP12,
respectively, when these treatments were compared with SP6. The treatments did not
influence the meal size, number of meals per day and duration of first ingestion. There was a
selection against TMR particles between 8 - 1.18-mm at treatment SP6 (Table 21) in
comparison to PT6. In addition, cows at treatment SP12 selected for TMR particles between 8
- 1.18-mm rather than SP6 (100.4 vs. 97.5 %).

68
Table 20. Influence of corn silage processing on feeding behavior of dairy cows1
Item PT6 SP6 SP12 SP18 SEM
P C12
P C2
P C3
Intake
peNDF>83
3.1 2.8 3.0 3.1 0.16 0.01 0.04 0.42
peNDF>1.184
4.6 4.3 4.4 4.4 0.21 0.10 0.67 0.98
Eating, min/d 216.3 204.1 214.7 230.3 21.49 0.23 0.38 0.20
Eating, min/kg of DMI 10.9 10.7 11.1 12.0 1.09 0.65 0.46 0.14
Eating, min/kg of NDFI5
38.8 36.9 40.0 42.7 4.55 0.51 0.28 0.34
Eating, min/kg of forage NDFI6
49.7 47.9 51.9 55.4 5.97 0.62 0.29 0.34
Eating, min/kg of iNDFI7
101.4 108.1 112.8 114.6 11.5 0.52 0.66 0.86
Eating, min/kg of peNDF>8
72.6 75.6 75.9 76.4 9.95 0.61 0.96 0.93
Eating, min/kg of peNDF>1.18 48.1 46.2 51.3 53.9 6.33 0.62 0.18 0.48
Rumination, min/d 604.0 549.3 602.6 617.2 30.12 0.05 0.07 0.62
Rumination, min/kg of DMI 30.8 28.8 31.2 32.3 1.76 0.16 0.10 0.49
Rumination, min/kg of NDFI 107.5 100.3 110.3 114.3 7.41 0.21 0.09 0.48
Rumination, min/kg of forage NDFI 139.2 130.3 143.3 148.5 9.21 0.23 0.09 0.47
Rumination, min/kg of Indfi 287.5 291.2 315.1 312.1 29.5 0.88 0.35 0.90
Rumination, min/kg of peNDF>8 199.7 201.9 207.4 204.1 13.94 0.86 0.66 0.79
Rumination, min/kg of peNDF>1.18 133.0 126.9 141.0 144.1 8.99 0.45 0.08 0.69
Chewing, min/d8
821.6 753.6 818.9 849.1 33.65 0.03 0.04 0.33
Chewing, min/kg of DMI
41.7 39.6 42.4 44.4 1.88 0.16 0.07 0.19
Chewing, min/kg of NDFI 146.5 137.2 150.1 156.7 9.82 0.18 0.07 0.31
Chewing, min/kg of forage NDFI 189.1 178.4 195.1 204.1 12.16 0.23 0.07 0.31
Chewing, min/kg iNDFI 388.9 398.7 426.7 426.5 34.47 0.77 0.40 0.99
Chewing, min/kg of peNDF>8 273.8 277.8 271.6 281.0 19.22 0.77 0.65 0.49
Chewing, min/kg of peNDF>1.18 181.7 173.5 192.4 198.1 12.98 0.41 0.06 0.56
Resting, min/d 617.6 686.4 621.2 590.6 33.76 0.02 0.04 0.34
Meal bouts, /d 8.3 8.4 8.5 8.7 0.69 0.86 0.91 0.56
Meal size, min 26.1 24.9 25.5 26.5 1.85 0.32 0.64 0.42
Duration of first meal, min 36.5 33.6 36.4 40.3 3.19 0.15 0.31 0.16 1Treatments were PT6 = pull-type forage harvester at theoretical length of cut (TLOC) of 6-mm without
kernel processor, SP6 = self-propelled forage harvester at TLOC of 6-mm, SP12 = self-propelled forage
harvester at TLOC of 12-mm or SP18 = self-propelled forage harvester at TLOC of 18-mm. 2Orthogonal contrasts includes C1 - PT6 vs. SP6, C2 - SP6 vs. SP12, and C3 - SP12 vs. SP18.
3Physically effective NDF above the 8-mm PSPS sieve intake.
4Physically effective NDF above the 1.18-mm PSPS sieve intake.
5NDF intake.
6Forage NDF intake.
7Indigestible NDF intake, determined by 288 h of in situ incubation (Huhtanen et al., 1994).
8Chewing = Eating + Rumination.
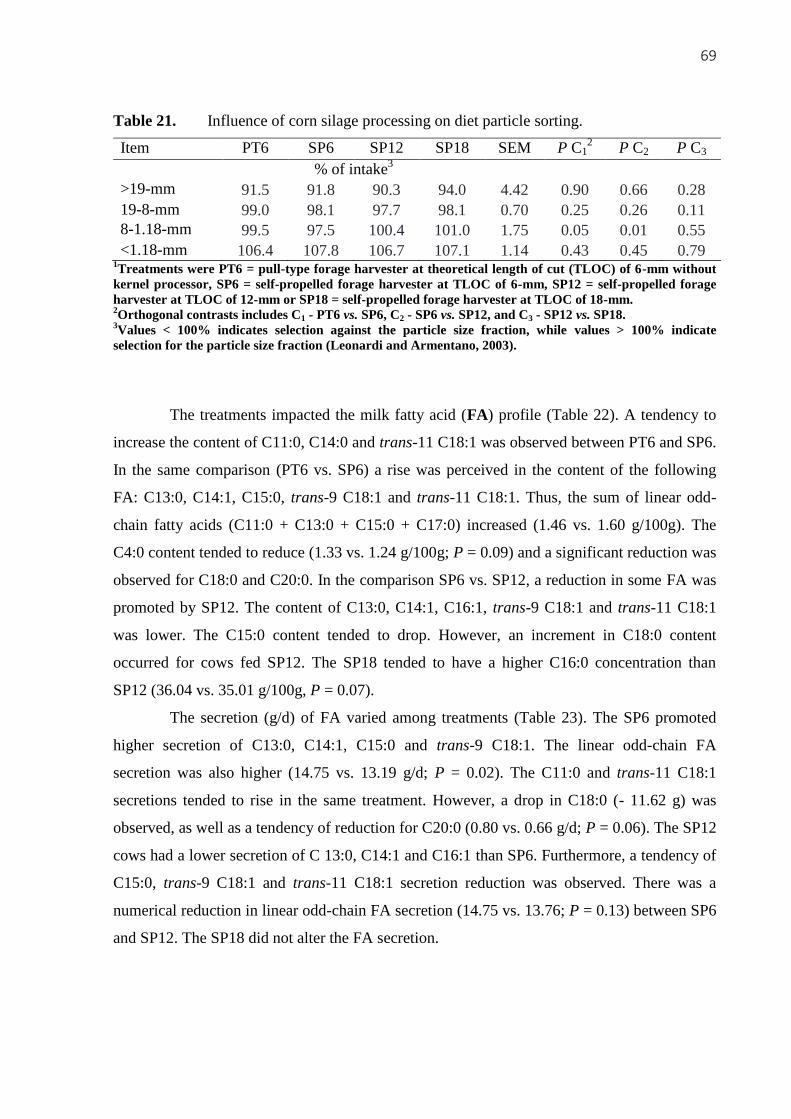
69
Table 21. Influence of corn silage processing on diet particle sorting.
Item PT6 SP6 SP12 SP18 SEM
P C12
P C2
P C3
% of intake3
>19-mm 91.5 91.8 90.3 94.0 4.42 0.90 0.66 0.28
19-8-mm 99.0 98.1 97.7 98.1 0.70 0.25 0.26 0.11
8-1.18-mm 99.5 97.5 100.4 101.0 1.75 0.05 0.01 0.55
<1.18-mm 106.4 107.8 106.7 107.1 1.14 0.43 0.45 0.79 1Treatments were PT6 = pull-type forage harvester at theoretical length of cut (TLOC) of 6-mm without
kernel processor, SP6 = self-propelled forage harvester at TLOC of 6-mm, SP12 = self-propelled forage
harvester at TLOC of 12-mm or SP18 = self-propelled forage harvester at TLOC of 18-mm. 2Orthogonal contrasts includes C1 - PT6 vs. SP6, C2 - SP6 vs. SP12, and C3 - SP12 vs. SP18.
3Values < 100% indicates selection against the particle size fraction, while values > 100% indicate
selection for the particle size fraction (Leonardi and Armentano, 2003).
The treatments impacted the milk fatty acid (FA) profile (Table 22). A tendency to
increase the content of C11:0, C14:0 and trans-11 C18:1 was observed between PT6 and SP6.
In the same comparison (PT6 vs. SP6) a rise was perceived in the content of the following
FA: C13:0, C14:1, C15:0, trans-9 C18:1 and trans-11 C18:1. Thus, the sum of linear odd-
chain fatty acids (C11:0 + C13:0 + C15:0 + C17:0) increased (1.46 vs. 1.60 g/100g). The
C4:0 content tended to reduce (1.33 vs. 1.24 g/100g; P = 0.09) and a significant reduction was
observed for C18:0 and C20:0. In the comparison SP6 vs. SP12, a reduction in some FA was
promoted by SP12. The content of C13:0, C14:1, C16:1, trans-9 C18:1 and trans-11 C18:1
was lower. The C15:0 content tended to drop. However, an increment in C18:0 content
occurred for cows fed SP12. The SP18 tended to have a higher C16:0 concentration than
SP12 (36.04 vs. 35.01 g/100g, P = 0.07).
The secretion (g/d) of FA varied among treatments (Table 23). The SP6 promoted
higher secretion of C13:0, C14:1, C15:0 and trans-9 C18:1. The linear odd-chain FA
secretion was also higher (14.75 vs. 13.19 g/d; P = 0.02). The C11:0 and trans-11 C18:1
secretions tended to rise in the same treatment. However, a drop in C18:0 (- 11.62 g) was
observed, as well as a tendency of reduction for C20:0 (0.80 vs. 0.66 g/d; P = 0.06). The SP12
cows had a lower secretion of C 13:0, C14:1 and C16:1 than SP6. Furthermore, a tendency of
C15:0, trans-9 C18:1 and trans-11 C18:1 secretion reduction was observed. There was a
numerical reduction in linear odd-chain FA secretion (14.75 vs. 13.76; P = 0.13) between SP6
and SP12. The SP18 did not alter the FA secretion.
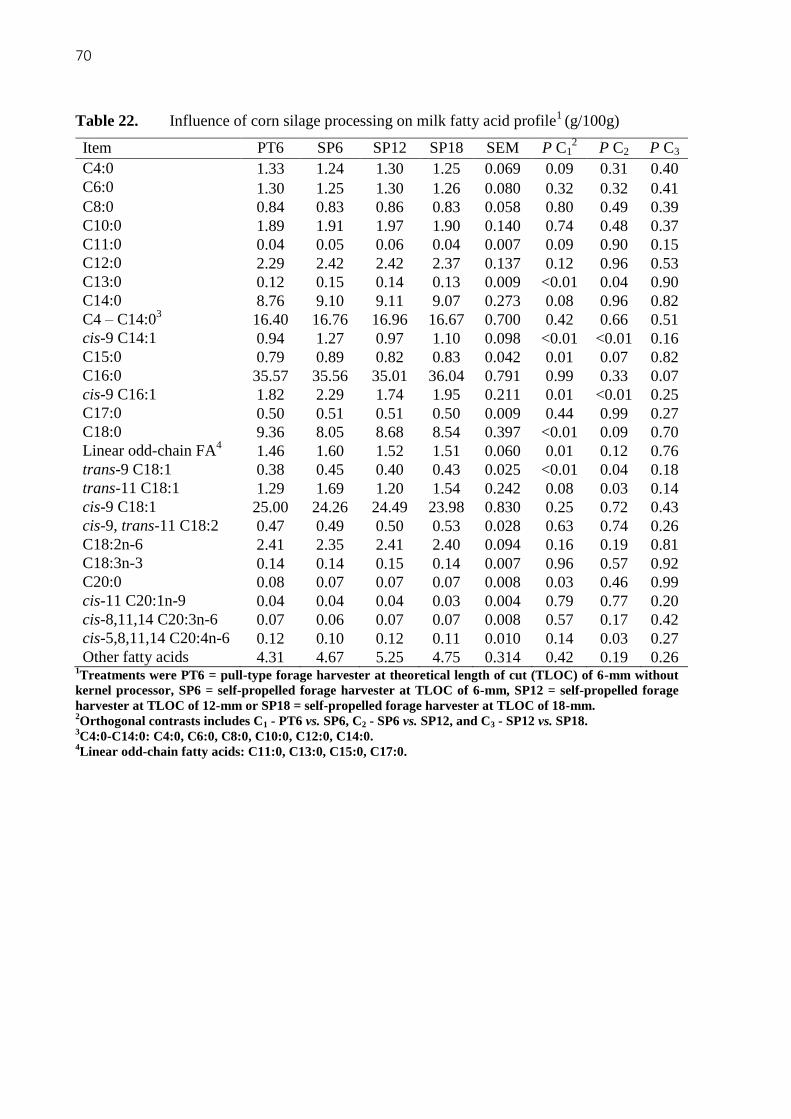
70
Table 22. Influence of corn silage processing on milk fatty acid profile1
(g/100g)
Item PT6 SP6 SP12 SP18 SEM
P C12
P C2
P C3
C4:0 1.33 1.24 1.30 1.25 0.069 0.09 0.31 0.40
C6:0 1.30 1.25 1.30 1.26 0.080 0.32 0.32 0.41
C8:0 0.84 0.83 0.86 0.83 0.058 0.80 0.49 0.39
C10:0 1.89 1.91 1.97 1.90 0.140 0.74 0.48 0.37
C11:0 0.04 0.05 0.06 0.04 0.007 0.09 0.90 0.15
C12:0 2.29 2.42 2.42 2.37 0.137 0.12 0.96 0.53
C13:0 0.12 0.15 0.14 0.13 0.009 <0.01 0.04 0.90
C14:0 8.76 9.10 9.11 9.07 0.273 0.08 0.96 0.82
C4 – C14:03
16.40 16.76 16.96 16.67 0.700 0.42 0.66 0.51
cis-9 C14:1 0.94 1.27 0.97 1.10 0.098 <0.01 <0.01 0.16
C15:0 0.79 0.89 0.82 0.83 0.042 0.01 0.07 0.82
C16:0 35.57 35.56 35.01 36.04 0.791 0.99 0.33 0.07
cis-9 C16:1 1.82 2.29 1.74 1.95 0.211 0.01 <0.01 0.25
C17:0 0.50 0.51 0.51 0.50 0.009 0.44 0.99 0.27
C18:0 9.36 8.05 8.68 8.54 0.397 <0.01 0.09 0.70
Linear odd-chain FA4
1.46 1.60 1.52 1.51 0.060 0.01 0.12 0.76
trans-9 C18:1 0.38 0.45 0.40 0.43 0.025 <0.01 0.04 0.18
trans-11 C18:1 1.29 1.69 1.20 1.54 0.242 0.08 0.03 0.14
cis-9 C18:1 25.00 24.26 24.49 23.98 0.830 0.25 0.72 0.43
cis-9, trans-11 C18:2 0.47 0.49 0.50 0.53 0.028 0.63 0.74 0.26
C18:2n-6 2.41 2.35 2.41 2.40 0.094 0.16 0.19 0.81
C18:3n-3 0.14 0.14 0.15 0.14 0.007 0.96 0.57 0.92
C20:0 0.08 0.07 0.07 0.07 0.008 0.03 0.46 0.99
cis-11 C20:1n-9 0.04 0.04 0.04 0.03 0.004 0.79 0.77 0.20
cis-8,11,14 C20:3n-6 0.07 0.06 0.07 0.07 0.008 0.57 0.17 0.42
cis-5,8,11,14 C20:4n-6 0.12 0.10 0.12 0.11 0.010 0.14 0.03 0.27
Other fatty acids 4.31 4.67 5.25 4.75 0.314 0.42 0.19 0.26 1Treatments were PT6 = pull-type forage harvester at theoretical length of cut (TLOC) of 6-mm without
kernel processor, SP6 = self-propelled forage harvester at TLOC of 6-mm, SP12 = self-propelled forage
harvester at TLOC of 12-mm or SP18 = self-propelled forage harvester at TLOC of 18-mm. 2Orthogonal contrasts includes C1 - PT6 vs. SP6, C2 - SP6 vs. SP12, and C3 - SP12 vs. SP18.
3C4:0-C14:0: C4:0, C6:0, C8:0, C10:0, C12:0, C14:0.
4Linear odd-chain fatty acids: C11:0, C13:0, C15:0, C17:0.
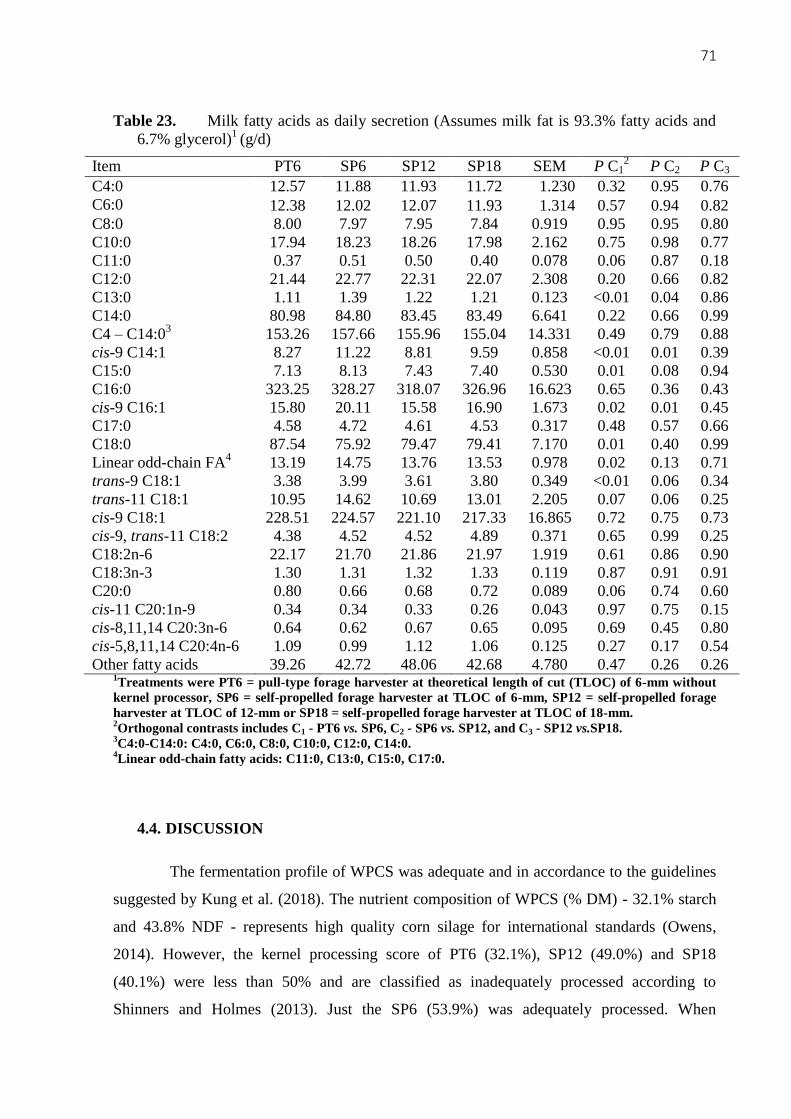
71
Table 23. Milk fatty acids as daily secretion (Assumes milk fat is 93.3% fatty acids and
6.7% glycerol)1
(g/d)
Item PT6 SP6 SP12 SP18 SEM
P C12
P C2
P C3
C4:0 12.57 11.88 11.93 11.72 1.230 0.32 0.95 0.76
C6:0 12.38 12.02 12.07 11.93 1.314 0.57 0.94 0.82
C8:0 8.00 7.97 7.95 7.84 0.919 0.95 0.95 0.80
C10:0 17.94 18.23 18.26 17.98 2.162 0.75 0.98 0.77
C11:0 0.37 0.51 0.50 0.40 0.078 0.06 0.87 0.18
C12:0 21.44 22.77 22.31 22.07 2.308 0.20 0.66 0.82
C13:0 1.11 1.39 1.22 1.21 0.123 <0.01 0.04 0.86
C14:0 80.98 84.80 83.45 83.49 6.641 0.22 0.66 0.99
C4 – C14:03
153.26 157.66 155.96 155.04 14.331 0.49 0.79 0.88
cis-9 C14:1 8.27 11.22 8.81 9.59 0.858 <0.01 0.01 0.39
C15:0 7.13 8.13 7.43 7.40 0.530 0.01 0.08 0.94
C16:0 323.25 328.27 318.07 326.96 16.623 0.65 0.36 0.43
cis-9 C16:1 15.80 20.11 15.58 16.90 1.673 0.02 0.01 0.45
C17:0 4.58 4.72 4.61 4.53 0.317 0.48 0.57 0.66
C18:0 87.54 75.92 79.47 79.41 7.170 0.01 0.40 0.99
Linear odd-chain FA4
13.19 14.75 13.76 13.53 0.978 0.02 0.13 0.71
trans-9 C18:1 3.38 3.99 3.61 3.80 0.349 <0.01 0.06 0.34
trans-11 C18:1 10.95 14.62 10.69 13.01 2.205 0.07 0.06 0.25
cis-9 C18:1 228.51 224.57 221.10 217.33 16.865 0.72 0.75 0.73
cis-9, trans-11 C18:2 4.38 4.52 4.52 4.89 0.371 0.65 0.99 0.25
C18:2n-6 22.17 21.70 21.86 21.97 1.919 0.61 0.86 0.90
C18:3n-3 1.30 1.31 1.32 1.33 0.119 0.87 0.91 0.91
C20:0 0.80 0.66 0.68 0.72 0.089 0.06 0.74 0.60
cis-11 C20:1n-9 0.34 0.34 0.33 0.26 0.043 0.97 0.75 0.15
cis-8,11,14 C20:3n-6 0.64 0.62 0.67 0.65 0.095 0.69 0.45 0.80
cis-5,8,11,14 C20:4n-6 1.09 0.99 1.12 1.06 0.125 0.27 0.17 0.54
Other fatty acids 39.26 42.72 48.06 42.68 4.780 0.47 0.26 0.26 1Treatments were PT6 = pull-type forage harvester at theoretical length of cut (TLOC) of 6-mm without
kernel processor, SP6 = self-propelled forage harvester at TLOC of 6-mm, SP12 = self-propelled forage
harvester at TLOC of 12-mm or SP18 = self-propelled forage harvester at TLOC of 18-mm. 2Orthogonal contrasts includes C1 - PT6 vs. SP6, C2 - SP6 vs. SP12, and C3 - SP12 vs.SP18.
3C4:0-C14:0: C4:0, C6:0, C8:0, C10:0, C12:0, C14:0.
4Linear odd-chain fatty acids: C11:0, C13:0, C15:0, C17:0.
4.4. DISCUSSION
The fermentation profile of WPCS was adequate and in accordance to the guidelines
suggested by Kung et al. (2018). The nutrient composition of WPCS (% DM) - 32.1% starch
and 43.8% NDF - represents high quality corn silage for international standards (Owens,
2014). However, the kernel processing score of PT6 (32.1%), SP12 (49.0%) and SP18
(40.1%) were less than 50% and are classified as inadequately processed according to
Shinners and Holmes (2013). Just the SP6 (53.9%) was adequately processed. When

72
comparing samples based on the orthogonal contrasts, there was a great difference in CSPS
among comparisons. The C1 (PT6 vs. SP6) had a numerical difference of 21.8 percentage
units, C2 (SP6 vs. SP12) of 4.9 percentage units and C3 (SP12 vs. SP18) of 8.9 percentage
units (Table 3).
The major difference in particle size was observed at the upper PSPS sieve. There
was a reduction of 55.5 % of WPCS at percentage retained above a 19-mm sieve of PSPS at
the same TLOC (PT6 vs. SP6). Ferraretto et al. (2018) reported, in a recent literature review
that mechanical processing is able to reduce 20% of WPCS particles retained above 18- or 19-
mm sieves of particle separators. As a consequence, the MPL of WPCS SP6 was lower than
PT6 by 8 %. Shinners et al. (2000) reported a drop in MPL for processed WPCS, which can
be explained by the crushing and shearing action of the kernel processor (Johnson et al.,
2002).
Greater milk production (+ 1.2 kg) at SP6 was partially related to the greater
apparent TTSD (+ 2.2 percentage units). Bal et al. (2000) reported an increase of 1.2 kg in
milk yield followed by greater DMI (+ 0.6 kg), ruminal (+ 19.3 percentage units) and total-
tract (+ 4.2 percentage units) starch digestibility for cows fed with processed WPCS harvested
at TLOC of 9.5-mm. Ferraretto and Shaver (2012) performed a meta-analysis of peer-
reviewed papers about the influence of kernel processing on dairy cow performance and
nutrient digestibility. WPCS processed at 1 to 3-mm or unprocessed displayed a trend toward
greater milk yield (+ 1.8 kg/cow/d) in comparison with WPCS processed at 4 to 8-mm.
However, no differences in milk yield were observed between WPCS processed at 1 to 3-mm
and unprocessed silage. Kernel processing with rollers set at 1 to 3-mm increased TTSD by
5.9 percentage units when compared to 4 to 8-mm processed WPCS, and increased by 2.8
percentage units when compared to unprocessed WPCS. The pericarp of corn kernel is poorly
digested by rumen bacteria with minimal post ruminal digestion potential (Giuberti et al.,
2014). Therefore, kernel damage during its passage through the rollers fractures pericarp and
disrupts the dense protein matrix where starch is embedded (Johnson et al., 2002). Thereby,
increased bacterial attachment and digestion (Huntington, 1997) improves TTSD.
The longest TLOC (SP18) tended to reduce milk yield followed by a tendency of
lower TTSD in comparison with SP12. This lower TTSD at a longer TLOC WPCS (SP18)
may be related to the longer fiber fraction reducing kernel breakage during the processing of
WPCS through the rollers at harvest as described by Ferraretto and Shaver (2012). Besides
TLOC, other factors including endosperm properties (Correa et al., 2002; Ferraretto and
Shaver, 2012), maturity (Johnson et al., 2002), and processing degree (Bal et al., 2000) of

73
WPCS can alter the fragmentation of kernels and also, as a consequence, TTSD (Cooke and
Bernard, 2005). The TLOC of 19-mm and a roll gap of 1 to 3-mm have been recommended in
the USA (Shinners et al., 2000) for the last decades, however in this trial the 18-mm tended to
impair TTSD and milk yield. Ferraretto and Shaver (2012) reported a drop in TTSD just when
WPCS was harvested at a TLOC above 32.0-mm. The vitreous endosperm hybrids may
require lower TLOC settings due to the hardness of the kernel which makes it more difficult
to be broken. There is a lack of information regarding the right TLOC and roll gap settings for
each type of kernel processor in distinct scenarios (maturity and hybrids) and further research
is warranted.
The impact of kernel processing and TLOC in milk fat is inconsistent in the
literature. Ferraretto and Shaver (2012) reported greater milk fat content for unprocessed
WPCS (3.55%) than processed at a roll gap of 1 to 3-mm (3.44%). Conversely, Shinners et al.
(2000) observed greater fat content for cows fed processed WPCS and attributed this to less
sorting of the cob fiber in the bunk. In our trial, there was just a numerical difference in milk
fat content between PT6 and SP6 (3.52 vs. 3.37%). The milk fat content did not change within
SPFH treatments (SP6, SP12, and SP18) at different TLOCs. The meta-analysis conducted by
Nasrollahi et al. (2015) with purpose to evaluate the impact of TMR MPL in the performance
of dairy cows revealed a reduction of 0.06 percentage units in fat content when cows were fed
finer particles. A similar ruminal VFA profile for WPCS with varying TLOCs have been
reported (Bal et al., 2000; Onetti et al., 2003) and may explain the lack of effect of TLOC on
milk fat content (Ferraretto and Shaver, 2012). Greater ruminal propionate concentrations for
cows fed processed WPCS had been reported (Dhiman et al., 2000; Schwab et al., 2002),
however the ruminal VFA were unaffected in our trial.
Despite the similar milk protein content (3.32 vs. 3.31%) of these treatments (SP6
and PT6) the milk protein yield was improved for processed WPCS. A consistent
improvement in milk protein yield when cows are fed processed WPCS has been observed
(Johnson et al., 1999), but not in milk protein content (Ferraretto and Shaver et al., 2012).
Lower MUN was noted in SP6 which may be related to increased ruminal starch digestibility
(Ferraretto and Shaver, 2012) and thus improved ruminal nitrogen utilization (NRC, 2001).
Schwab et al. (2002) observed a reduction of 1.2 mg/dL in MUN for processed WPCS. The
SP6 had greater milk protein content than SP12. The effect of particle size in milk protein
content is contradictory. Ferraretto and Shaver (2012) did not find an effect of TLOC;
however, greater protein content has been reported for cows fed finer particles (Nasrollahi et
al., 2015). The lactose content was lower for SP18 and milk yield tended to be reduced in
74
comparison with SP12; thereby the lactose excretion per day was also reduced. Enhanced
glucose availability to the mammary gland in response to kernel processing at specific TLOC
settings (SP6 and SP12) appears to have increased lactose synthesis, resulting in a positive
milk yield response. The gains in nutrient digestibility contribute to the enhancement in milk
yield. Greater OMD for cows fed processed WPCS has been reported, however no impact for
DMD and NDFD was observed (Ferraretto and Shaver, 2012).
The plasma glucose concentration increased by 4.1 mg/dL in SP6 compared with
PT6. Cooke and Bernard (2005) also reported greater plasma glucose levels in dairy cows fed
processed WPCS. Plasma glucose is influenced by ruminal propionate proportions
(Vlaeminck et al., 2004) or duodenal glucose absorption (Nocek and Tamminga, 1991). This
increment in plasma glucose can stimulate the lactose synthesis in the mammary gland, and as
a consequence, the milk yield. Despite low MUN, PUN, ruminal N-NH3 purine derivatives
were unaffected. Dhiman et al. (2000) reported lower ruminal N-NH3 in cows fed processed
WPCS, however no impact in PUN was observed. Ouellet et al. (2003) reported that PUN and
purine derivatives were not affected by kernel processing, however PUN varied throughout
the day and peaked at 3-h after feeding. These results are in accordance with our PUN results.
The DMI was unaffected among the treatments despite the distinct particle size,
peNDF>8 and peNDF>1.18 content in the diets. Ferraretto and Shaver (2012) reported no effect
of kernel processing and TLOC on DMI. However, Nasrollahi et al. (2015) observed through
a meta-analysis of 46 studies that the decrease in MPL enhanced DMI and this effect was
pronounced in diets containing high levels of forage (>50% of DM). Summarizing studies
conducted mainly with WPCS as the forage source revealed that when TLOC was reduced
from 23.3 ± 8.22-mm to 10.2 ± 6.78-mm the DMI was increased by 0.6 kg ranging from – 1.1
kg to + 2.3 kg/d (Zebeli and Humer, 2017).
Feeding dairy cows less than 18.5 % of peNDF>8 or 31.2% of peNDF>1.18 poses an
imminent risk of SARA (Zebeli et al. 2012). The SP6 consumed diet had the lowest peNDF>8
content among treatments (14.4 %) and when cows were fed this diet a trend of higher plasma
D-lactate (1.56 vs. 1.38 mM, P = 0.10) and SAA (6.0 vs. 4.1 µg/mL) was observed in
comparison with SP12. Moreover, SP6 cows selected against particles retained between 8 and
1.18-mm sieve of PSPS (97.5 vs. 100.4%). The kernel processing of WPCS improves ruminal
starch digestibility (Ferraretto and Shaver, 2012), reduces long particles (Ferraretto et al.
2018) possibly reducing rumen pH (Onetti et al., 2003) and thereby cows would be prone to
SARA. The peNDF impacts chewing activity, ruminal pH and milk fat content (Mertens,
75
1997). Despite a trend for diminishment in rumination and chewing times between SP6 and
SP12, the ruminal pH and milk fat content was not impacted.
A rise in peNDF>8 intake was observed between SP6 and SP12 (2.8 vs. 3.0 kg/d).
This higher intake of peNDF may have contributed for the tendency to reduction in plasma D-
lactate and SAA. Improvements in rumination activity, salivary buffering, and rumen mat
formation by higher peNDF intake have been reported in literature (Zebeli et al. 2012).
Chewing increases salivary secretion in dairy cows and also helps to reduce the risk of SARA
(Beauchemin, 2018). The higher rumination and chewing times may have promoted more
saliva secretion and consequently helped in rumen buffering.
The increase of long particles in TMR (≥ 19-mm) affects the eating time
(Beauchemin, 2018) due to increase necessary chewing to swallow a bolus of feed (Grant and
Ferraretto, 2018). Furthermore, these particles retained on the 19-mm sieve of PSPS are most
likely to be sorted by dairy cows (Kononoff and Heinrichs, 2003a). The treatments had
different TMR long particles percentages (5.3, 2.7, 6.7 and 15.5%; Table 1) and MPL,
however the eating time, duration of the first meal, and sorting against long particles were
unaffected. Bal et al. (2000) did not find different eating, ruminating and chewing times for
cows fed processed WPCS harvested at several TLOC (9.5, 14.5 and 19-mm) or unprocessed
at TLOC of 9.5 mm. Kononoff et al. (2003c) also reported no effect of particle size on feeding
behavior when a TMR containing 57.4%WPCS was fed for dairy cows.
Higher intake of medium particles (4-19-mm) impacts rumination time (Beauchemin,
2018). The peNDF>8 intake (3.1 vs. 2.8 kg/d) was higher and trended to increase peNDF>1.18
intake (4.6 vs. 4.3 kg/d) for PT6. The higher intake of peNDF for PT6 is in accordance with
the higher ruminating time (604 vs. 549 min) in this treatment. The SP12 cows had a greater
peNDF>8 intake than SP6 (3.0 vs. 2.8 kg/d) and it may have influenced the trend for greater
rumination time (602.6 vs. 549.3 min). Nasrollahi et al. (2016), in a meta-analysis of 86
published studies, reported that the decreasing forage MPL in dairy cow diets between an
average of 10 ± 4.9 to 6.7 ± 4.1-mm reduced eating, rumination and chewing time by 19, 28
and 44 min/d, respectively. The MPL of PT6 and SP12 diets were close (5.8 vs. 5.7-mm), as
well as the rumination time (604 vs. 602.6 min) and chewing time (821.6 vs. 818.9 min). Both
of these treatments (PT6 and SP12) were different or tended to be different from SP6
probably due to the lower SP6 MPL (5.0-mm) that led to a reduction in rumination and
chewing time which lead to a rise in resting time. A trend for a reduction in chewing index
between SP6 and SP12 could be explained by the different MPL. Lower chewing index
(expressed as minutes of chewing per kilogram of DM ingested) has been reported when MPL
76
is shortened (Grant and Ferraretto, 2018). The feeding behavior results may have contributed
to higher SAA values for SP6 cows.
Kernel-induced SARA led to an increment at levels of SAA followed by a higher
free lipopolysaccharide (LPS) in rumen fluid (Gozho et al., 2007; Khafipuor et al., 2009). The
SAA belongs to the class of acute phase proteins and its increase in the bloodstream indicates
acute phase response to inflammation (Horadagoda et al., 1999). The inflammation can be
caused by dietary-induced damage to the gut mucosa or by translocation of immunogenic
compounds (e.g. free LPS) into circulation (Horadagoda et al., 1999). Gozho et al. (2007) and
Khapifour et al. (2009) considered SARA when pH reduces below 5.6 for prolonged periods
(> 3 h). We did not measure ruminal pH throughout the day; therefore it is not possible to
confirm that SP6 cows suffered SARA. However, D-lactate and SAA results indicate a
potential blood acidotic status and acute phase response, respectively, for SP6 cows.
The C4:0 FA content tended to reduce in SP6. This FA is produced in the mammary
gland by de novo synthesis. The main pathway involves acetate being converted to acetyl
CoA by acetyl CoA synthetase. Then, acetyl-CoA carboxylase (ACC) converts acetyl-CoA to
malonyl-CoA (Bauman and Davis, 1974). Baumgard et al. (2002) reported decay of C4:0
content in milk fat after abomasal infusion of trans-10, cis-12 C18:2 followed by a reduction
of the abundance of mRNA of ACC, fatty acid synthetase and ∆-9 desaturase enzymes in
mammary gland. However, the content of trans-10, cis-12 C18:2 was low which precluded its
detection by the method. A greater linear odd-chain FA content for SP6 than PT6 was
observed. The linear odd-chain FA are formed in rumen when propionyl-CoA is used as a
primer (Kaneda, 1991). Vlaeminck et al. (2006) reported that linear odd-chain FA is mainly
synthetized in the rumen and partially in the mammary gland. However, the propionate
proportion in rumen was unaffected by these treatments. The response of linear odd-chain FA
to inclusion of WPCS in the diets is inconsistent in literature (Vlaeminck et al., 2006).
Vlaeminck et al. (2006) suggested a possible greater ∆-9 desaturase activity induced
by higher blood glucose levels (Ntambi and Miyazaki, 2004). This is a possible explanation
for higher content of C14:1 and C 16:1 FA observed at SP6 cows in comparison with PT6.
However, this theory failed when SP6 and SP12 were compared as they had the same plasma
glucose contents. However, a drop in C14:1 and C 16:1 FA content was observed in SP12.
The drop in trans-9 C18:1 and trans-11 C18:1 was followed by an increase in C18:0
concentrations for SP12 and PT6 in comparison with SP6. This can be indicative of a better
ruminal environment which allows the complete biohydrogenation of FA. Onetti et al. (2003)
77
reported no effect in trans-9 C18:1 and trans-11 C18:1 contents when cows were fed
processed WPCS harvested at 19 and 32-mm TLOC.
4.5. CONCLUSIONS
Kernel processing at TLOC settings of 6-mm and 12-mm enhanced nutrient
digestibility, plasma glucose and milk yield. The enhanced glucose availability to the
mammary gland likely increased lactose synthesis, resulting in a positive milk yield response.
Nevertheless, at 18-mm TLOC, the processing was poor and possibly impaired lactation
performance. The SP12 improved chewing time and reduced blood sub-acute acidotic
markers. Thereby, SP12 appeared to be the best setting to harvest WPCS from vitreous corn
endosperm hybrids. Additionally, more aggressive kernel processors to achieve excellent
kernel processing scores (>70%) for Brazilian corn hybrids are necessary.
The SP6 led a rise in milk linear odd-chain FA content in comparison with PT6.
Nonetheless, a reduction occurred at SP12. Kernel processing induced higher content of some
monounsaturated FA (C14:1and C16:1) at TLOC of 6-mm, however the opposite happened
for SP12. The possible explanations for these results are still unclear. More detailed studies to
investigate the effects of kernel processing and particle size in milk fat profile are warranted.
LITERATURE CITED
Allen, M. S., J. G. Coors, and G. W. Roth. 2003. Corn silage. Pages 547-608 in Silage
Science and Technology. D. R. Buxton, R. E. Muck, and H. J. Harrison, ed. ASA, CSA,
and SSSA, Madison, WI.
Ametaj, B. N., B. J. Bradford, G. Bobe, R. A. Nafikov, Y. Lu, J. W. Young, and D. C. Beitz.
2005. Strong relationship between mediators of the acute phase response and fatty liver in
dairy cows. Can. J. Anim. Sci. 85:165-175.
AOAC International. 2012. Official Methods of Analysis. 19th ed. AOAC International,
Arlington, VA.
Bal, M. A., R. D. Shaver, A. G. Jirovec, K. J. Shinners, and J. G. Coors. 2000. Crop
processing and chop length of corn silage: Effects on intake, digestion, and milk
production by dairy cows. J. Dairy Sci. 83:1264-1273.
Baker, S., and T. Herrman. 2002. Evaluating particle size. MF-2051. Kansas State Univ.,
Manhattan.
78
Baumgard, L. H., E. Matitashvili, B. A. Corl, D. A. Dwyer, and D. E. Bauman. 2002. Trans-
10, cis-12 conjugated linoleic acid decreases lipogenic rates and expression of genes
involved in milk lipid synthesis in dairy cows. J. Dairy Sci. 85:2155-2163
Bauman, D.E., and C.L. Davis. 1974. Biosynthesis of milk fat. In: B. L. Larson, and V. R.
Smith (Eds.) Lactation: A Comprehensive Treatise. Vol. 2. Academic Press, New York, p.
31- 75.
Bernardes, T. F., and A. C. Rego. 2014. Study on the practices of silage production and
utilization on Brazilian dairy farms. J. Dairy Sci. 97:1852-1861.
Bernardes, T. F., J. L. P. Daniel, A. T. Adesogan, T. A. McAllister, P. Drouin, L. G. Nussio,
P. Huhtanen, G. F. Tremblay, G. Bélanger, and Y. Cai. 2018. Silage review: Unique
challenges of silages made in hot and cold regions. J. Dairy Sci. 101:4001-4019.
Chaney, A. L., and E. P. Marbach. 1962. Modified reagents for determination of urea and
ammonia. Clin. Chem. 8:130-137.
Chen, X. B., and M. J. Gomes. 1992. Estimation of microbial protein supply to sheep and
cattle based on urinary excretion of purine derivatives: An overview of technical details.
Int. Feed Res. Unit, Occasional Publ. Rowett Research Institute, Aberdeen, United
Kingdom.
Chizzotti, M. L., F. S. Machado, E. E. L. Valente, L. G. R. Pereira, M. M. Campos, T. R.
Tomich, S. G. Coelho, and M. N. Ribas. 2015. Technical note: Validation of a system for
monitoring individual feeding behavior and individual feed intake in dairy cattle. J. Dairy
Sci. 98:3438-3442.
Chizzotti, M. L., S. C. Valadares Filho, R. F. D. Valadares, F. H. M. Chizzotti, and L. O.
Tedeschi. 2008. Determination of creatinine excretion and evaluation of spot urine
sampling in Holstein cattle. Livest. Sci. 113:218-225.
Correa, C. E. S., R. D. Shaver, M. N. Pereira, J. G. Lauer, and K. Kohn. 2002. Relationship
between corn vitreousness and ruminal in situ starch degradability. J. Dairy Sci. 85:3008-
3012.
Cooke, K. M., and J. K. Bernard. 2005. Effect of kernel processing and theoretical length of
cut of corn silage on performance of lactating dairy cows. J. Dairy Sci. 88:310-316.
Der Bedrosian, M. C., L. Kung Jr., and K. E. Nestor Jr.. 2012. The effects of hybrid, maturity
and length of storage on the composition and nutritive value of corn silage. J. Dairy Sci.
95:5115-5126.
79
Dias Junior, G. S., L. F. Ferraretto, G. G. S. Salvati, L. C. de Resende, P. C. Hoffman, M. N.
Pereira, and R. D. Shaver. 2016. Relationship between processing score and kernel-
fraction particle size in whole-plant corn silage. J. Dairy Sci. 99:2719-2729.
Dombrink-Kurtzman, M. A., and J. A. Bietz. 1993. Zein composition in hard and soft
endosperm of maize. Cereal Chem. 70:105-108.
Ferraretto, L. F., and R. D. Shaver. 2012. Meta-analysis: Impact of corn silage harvest
practice on intake, digestion and milk production by dairy cows. Prof. Anim. Sci. 28:141-
149.
Ferraretto, L. F., R. D. Shaver, and B. D. Luck. 2018. Silage review: Recent advances and
future technologies for whole-plant and fractionated corn silage harvesting. J. Dairy Sci.
101:3937-3951.
Ferreira, G., and D. R. Mertens. 2005. Chemical and physical characteristics of corn silages
and their effects on in vitro disappearance. J. Dairy Sci. 88:4414-4425.
Ferreira, E. M., A. V. Pires, I. Susin, M. V. Biehl, R. S. Gentil, M. O. M. Parente, D. M.
Polizel, C. V. M. R. Ribeiro, and E. Almeida. 2016. Nutrient digestibility and ruminal
fatty acid metabolism in lambs supplemented with soybean oil partially replaced by fish
oil blend. Anim. Feed Sci. Technol. 216:30-39.
Feng, S., A. L. Lock and P. C. Garnsworthy. 2004. Technical note: a rapid lipid separation
method for determining fatty acid composition of milk. J. Dairy Sci. 87:3785-3788.
Giuberti, G., A. Gallo, F. Masoero, L. F. Ferraretto, P. C. Hoffman, and R. D. Shaver. 2014.
Factors affecting starch utilization in large animal food production system: A review.
Starke (Weinheim) 66:72-90.
Grant, R. J, and L. F. Ferraretto. Silage review: Silage feeding management: Silage
characteristics and dairy cow feeding behavior. J. Dairy Sci. 101:4111-4121.
Gozho, G. N., D. O. Krause, and J. C. Plaizier. 2007. Ruminal lipopolysaccharide
concentration and inflammatory response during kernel-induced subacute ruminal acidosis
in dairy cows. J. Dairy Sci. 90:856–866.
Horadagoda, N. U., K. M. Knox, H. A. Gibbs, S. W. Reid, A. Horadagoda, S. E. Edwards,
and P. D. Eckersall. 1999. Acute phase proteins in cattle: Discrimination between acute
and chronic inflammation. Vet. Rec. 144:437-441.
Huhtanen, P., K. Kaustell and S. Jaakkola. 1994. The use of internal markers to predict total
digestibility and duodenal flow of nutrients in cattle given six different diets. Anim. Feed
Sci. Technol. 48: 211-227
80
Hall, M. B. 2015. Determination of dietary starch in animal feeds and pet food by an
enzymatic-colorimetric method. Collaborative study. J. AOAC Int. 98:397-409.
Huntington, G. B. 1997. Starch utilization by ruminants: From basics to the bunk. J. Anim.
Sci. 75:852-867.
Jenkins, T. C. 2004. Challenges of Meeting Cow Demands for Omega Fatty Acids.Pages 52-
66 in Proc. Florida Ruminant Nutrition Symposium.
Johnson, L., J. H. Harrison, C. Hunt, K. Shinners, C. G. Doggett, and D. Sapienza. 1999.
Nutritive value of corn silage as affected by maturity and mechanical processing: A
contemporary review. J. Dairy Sci. 82:2813-2825.
Johnson, L. M., J. H. Harrison, D. Davidson, W. C. Mahanna, and K. Shinners. 2003. Corn
silage management: Effects of hybrid, chop length, and mechanical processing on
digestion and energy content. J. Dairy Sci. 86:208-231.
Johnson, L. M., J. H. Harrison, D. Davidson, J. L. Robutti, M. Swift, W. C. Mahanna, and K.
Shinners. 2002. Corn silage management I: Effects of hybrid, maturity, and mechanical
processing on chemical and physical characteristics. J. Dairy Sci. 85:833-853.
Kaneda, T. 1991. Iso- and anteiso-fatty acids in bacteria: biosynthesis, function, and
taxonomic significance. Microbiol. Rev. 55: 288-302.
Khafipour, E., D. O. Krause, and J. C. Plaizier. 2009. A kernel-based subacute ruminal
acidosis challenge causes translocation of lipopolysaccharide and triggers inflammation. J.
Dairy Sci. 92:1060-1070.
Kramer, J. K. G., V. Fellner, and M. E. R. Dugan. 1997. Evaluating acid and base catalysts in
the methylation of milk and rumen fatty acids with special emphasis on conjugated dienes
and total trans fatty acids. Lipids 32:1219-1228.
Kononoff, P. J., and A. J. Heinrichs. 2003a. The effect of reducing alfalfa haylage particle
size on cows in early lactation. J. Dairy Sci.86:1445-1457.
Kononoff, P. J., A. J. Heinrichs, and D. R. Buckmaster. 2003b. Modification of the Penn State
forage and total mixed ration particle separator and the effects of moisture content on its
measurements.J. Dairy Sci. 86:1858-1863.
Kononoff, P. J., A. J. Heinrichs, and H. A. Lehman. 2003c. The effect of corn silage particle
size on eating behavior, chewing activities, and rumen fermentation in lactating dairy
cows. J. Dairy Sci.86:3343-3353.
Kung, L., Jr., R. Shaver, R. J. Grant, and R. J. Schmidt. 2018. Silage review: Interpretation of
chemical, microbial, and organoleptic components of silages. J. Dairy Sci. 101:4020-4033.
81
Lammers, B. P., D. R. Buckmaster, and A. J. Heinrichs. 1996. A simple method for the
analysis of particle sizes of forage and total mixed rations. J. Dairy Sci. 79:922-928.
Leonardi, C., and L. E. Armentano. 2003. Effect of quantity, quality and length of alfalfa hay
on selective consumption by dairy cows. J. Dairy Sci. 86:557-564.
Martin, N. P., M. P. Russelle, J. M. Powell, C. J. Sniffen, S. I. Smith, J. M. Tricarico, and R.
J. Grant. 2017. Invited review: Sustainable forage and kernel crop production for the US
dairy industry. J. Dairy Sci. 100:9479-9494.
Mertens, D. R. 1997. Creating a system for meeting the fiber requirements of dairy cows. J.
Dairy Sci. 80:1463-1481.
National Research Council. 2001. Nutrient requirements of dairy cattle. 7th
rev. ed. Natl.
Acad. Sci., Washington D.C.
Nasrollahi, S. M., M. Imani, Q. Zebeli. 2015. A meta-analysis and meta-regression of the
effect of forage particle size, level, source and preservation method of forages on feed
intake, nutrient digestibility, and performance in dairy cows. J. Dairy Sci. 98:8926-8939.
Nasrollahi, S. M., M. Imani, Q. Zebeli. 2016. A meta-analysis and meta-regression of the
impact of particle size, level, source and preservation method of forages on chewing
behavior and ruminal fermentation in dairy cows. Anim. Feed Sci. Technol. 219:144-158.
Nigon, B. J., K. J. Shinners, and D. E. Cook. 2016. Harvester modifications to alter
composition and dry matter of corn-silage. Appl. Eng. Agric. 32:157-167.
Nocek, J.E., and S. Tamminga. 1991. Site of digestion of starch in the gastrointestinal tract of
dairy cows and its effect on milk yield and composition. J. Dairy Sci. 74:3598-3629.
Ntambi, J.M., Miyazaki, M., 2004. Regulation of stearoyl-CoA desaturases and role in
metabolism.Prog. Lipid Res. 43:91-104.
Onetti, S. G., R. D. Shaver, S. J. Bertics, and R. R. Grummer. 2003. Influence of corn silage
particle length on the performance of lactating dairy cows fed supplemental tallow. J.
Dairy Sci. 86:2949-2957.
Ouellet, D. R., H. Lapierre, and J. Chiquette. 2003. Effects of corn silage processing and
amino acid supplementation on the performance of lactating dairy cows. J. Dairy Sci.
86:3675-3684.
Owens, F. 2014. New technologies in forage varieties and production. Pages 103–121 in Proc.
Tri-State Dairy Nutr.Conf., Ft. Wayne, IN. Ohio State Univ., Columbus.
Philippeau, C., and B. Michalet-Doreau. 1998. Influence of genotype and ensiling of corn
kernel on in situ degradation of starch in the rumen. J. Dairy Sci. 81:2178-2184.

82
Pryce, J. D. 1969. A modification of Barker-Summerson method for determination of lactic
acid. Analyst. 94:1151-1152.
Savoie, P., K. J. Shinners, and B. N. Binversie. 2004. Hydrodynamic separation of kernel and
stover components in corn silage. Appl. Biochem. Biotechnol. 113-116:41-54.
Schwab, E. C., R. D. Shaver, K. J. Shinners, J. G. Lauer, and J. G. Coors. 2002. Processing
and chop length effects in brown-midrib corn silage on intake, digestion, and milk
production by dairy cows. J. Dairy Sci. 85:613-623.
Shinners, K. J. 2003. Engineering principles of silage harvesting equipment. Pages 361-403 in
Silage Science and Technology. D. R. Buxton, R. E. Muck, and H. J. Harrison, ed. ASA,
CSA, and SSSA, Madison, WI.
Shinners, K. J., and B. J. Holmes. 2013. Making sure your kernel processor is doing its job.
Focus on Forage, 15:1-3. Accessed January 20, 2019. http:// fyi .uwex .edu/ forage/ files/
2014/ 01/ KernelProcessing-FOF .pdf.
Shinners, K. J., A. G. Jirovec, R. D. Shaver, and M. Bal. 2000.Processing whole-plant corn
silage with crop processing rolls on a pull-type forage harvester. Appl. Eng. Agric.
16:323-331.
Vanderwerff, L. M., L. F. Ferraretto, and R. D. Shaver. 2015. Brown midrib corn shredlage in
diets for high-producing dairy cows. J. Dairy Sci. 98:5642-5652.
Vlaeminck, B., V. Fievez, A. R. J. Cabrita, A. J. M. Fonseca, and R. J. Dewhurst. 2006.
Factors affecting odd- and branched-chain fatty acids in milk: A review. Anim. Feed Sci.
Technol. 131:389-417.
Vlaeminck, B., V. Fievez, , H. van Laar, and D. Demeyer. 2004. Prediction of rumen volatile
fatty acid proportions produced in vitro using variations in rumen odd and branched chain
fatty acids. J. Anim. Physiol. Anim. Nutr. 88:401-411.
Weatherburn, M. W. 1967. Phenol-hypochlorite reaction for determination of ammonia.
Analytical Chemistry 39:971-974.
Weissbach, F. 2009. Correction of dry matter content of silages used as substrate for biogas
production.Pages 483-484 in Proceedings of the 15th International Silage Conference, US
Dairy Forage Research Center, Madison, WI.
Wildman, E. E., G. M. Jones, P. E. Wagner, R. L. Boman, H. F. Troutt, and T. N. Lesch.
1982. A dairy-cow body condition scoring system and its relationship to selected
production characteristics. J. Dairy Sci. 65:495-501.
83
Wiles, P. G., I. K. Gray, and R. C. Kissling. 1998. Routine analyses of protein by Kjeldahl
and Dumas methods: Review and inter-laboratory study using dairy products. J. AOAC
Int. 81:620-632.
Wilkinson, J. M., and Rinne, M. 2018. Review: Highlights of progress in silage conservation
and future perspectives. Grass and Forage Science 73:40-52.
Zebeli, Q., J. R. Aschenbach, M.Tafaj, J. Boguhn, B. N. Ametaj, and W. Drochner. 2012.
Invited review: role of physically effective fiber and estimation of dietary fiber adequacy
in high-producing dairy cattle. J. Dairy Sci. 95:1041-1056.
Zebeli, Q., and E. Humer. 2017. An update of particle size and effective NDF in maize
silage-based rations. In: Proc. V International Symposium on Forage Quality and
Conservation, Piracicaba, SP, Brazil, p. 21-39.