Embed Size (px)
Citation preview
UNIVERSITY OF SÃO PAULO
COLLEGE OF ECONOMICS, BUSINESS AND ACCOUNTING
DEPARTMENT OF ACCOUNTANCY AND ACTUARIAL SCIENCE
GRADUATE PROGRAM IN ACCOUNTING
SHEIZI CALHEIRA DE FREITAS
An Exploratory Study on ENADE Evaluation Report Utilization and its Impact on
Undergraduate Accounting Program Performance in Brazil
SÃO PAULO
2012

Dr. João Grandino Rodas Rector of the University of São Paulo
Dr. Reinaldo Guerreiro
Dean of the College of Economics, Business and Accounting
Dr. Edgard Bruno Cornacchione Júnior Chairman of the Department of Accountancy and Actuarial Science
Dr. Silvia Pereira de Castro Casa Nova
Director of the Graduate Program in Accounting

SHEIZI CALHEIRA DE FREITAS
An Exploratory Study on ENADE Evaluation Report Utilization and its Impact on
Undergraduate Accounting Program Performance in Brazil
Dissertation presented to the Department of Accountancy and Actuarial Science at the College of Economics, Business and Accounting at University of Sao Paulo in partial fulfillment of the requirements for the Doctoral degree in Science (Accounting).
Advisor: Dr. Edgard Bruno Cornacchione Jr.
Versão Corrigida (versão original disponível na Unidade que aloja o Programa)
SÃO PAULO
2012
FICHA CATALOGRÁFICA Elaborada pela Seção de Processamento Técnico do SBD/FEA/USP
Freitas, Sheizi Calheira de
An exploratory study on ENADE evaluation report utilization and
Its impact on undergraduate accounting program performance in Brazil
/ Sheize Calheira de Freitas. – São Paulo, 2012.
176 p.
Tese (Doutorado) – Universidade de São Paulo, 2012.
Orientador: Edgard Bruno Cornacchione Junior.
1. Contabilidade 2. Avaliação da educação 3. Ensino superior I.
Universidade de São Paulo. Faculdade de Economia, Administração
e Contabilidade II. Título.
CDD – 657

This dissertation is dedicated to my mother, Zilda, whose pride
and confidence in me have always pushed me to do my best; to
my father, Amândio (in memoriam), whose example and character
are the foundations of my life; to my brother, Artur, for making
my life happier; and to my husband, Luis Paulo, whose love,
companionship, critical thinking and care complete me in so many
ways and who makes my world better.

Relat6rio de Defesa https :/ /uspdigital. usp. br/j anus/ alunoGeral/ defesa/relatori oDefesalm ...
1 de 1
:Fanus
Universidade de Sao Paulo
RELATORIO DE DEFESA
Aluno: 12136- 6869254- 1 1 Pagina 1 de 1
Relat6rio de defesa publica de Tese do(a) Senhor(a) Sheizi Calheira de Freitas no Programa: Controladoria e Contabilidade, do(a) Faculdade de Economia, Administrac;:ao e Contabilidade da Universidade de Sao Paulo.
Aos 07 dias domes de dezembro de 2012, no(a) Sala 215- 20 andar- FEA-05 realizou-se a Defesa da Tese do(a) Senhor(a) Sheizi Calheira de Freitas, apresentada para a obtenc;:ao do titulo de Doutora intitulada:
"An exploratory syudy on ENADE evaluation report utilization and its impact on undergraduate accounting program performance in Brazil"
Ap6s declarada aberta a sessao, o(a) Sr(a) Presidente passa a palavra ao candidate para exposic;:ao e a seguir aos examinadores para as devidas arguic;:oes que se desenvolvem nos termos regimentais. Em seguida, a Comissao Julgadora proclama o resultado:
Nome dos Participantes da Banca Func;ao Sigla da CPG Resultado Edgard Bruno Cornacchione Junior Presidente FEA- USP Aprovado
Reynaldo Fernandes Titular FEARP- USP Aprovado
Luis Eduardo Afonso Titular FEA- USP Aprovado
Robert Evan Verhine Titular UFBA- Externo Aprovado
Jennifer Caroline Greene Titular UI - Externo Aprovado
Resultado Final: Aprovado
Parecer da Comissao Julgadora *
A Comissao Julgadora reconhece merito da candidata e qualidade do trabalho. Recomenda a submissao a peri6dicos especializados da area.
Edga~ Presi""'-·-~,.-.
* Obs: Se o candidate for reprovado per algum des membros, o preenchimento do parecer e obrigat6rio.
A defesa foi homologada pela Comissao de P6 G aduac;:ao em~ ~IV; 6LO I 62/ e, portanto, o(a) aluno(a) faz jus ao titulo de Doutora em Ciencias obtido P troladoria e Contabilidade.
7/12/2012 18:00

ACKNOWLEDGEMENTS
I would like to express my deepest appreciation to my committee members, Professors
Edgard Cornacchione, Jennifer Greene, Luis Eduardo Afonso, Reynaldo Fernandes and
Robert Verhine, for their thoughtful recommendations, support and expert advice. In
particular, I would like to thank my advisor, Professor Edgard Cornacchione, for his guidance
throughout this process and my supervisor in the exchange program, Professor Jennifer
Greene, for our many enlightening meetings and for her attention.
I am particularly grateful to all of the accounting program administrators who participated in
the study as well as to my friends and colleagues who gave their valuable time to pilot the
survey and provide useful feedback. Thank you!
I would like to thank all of my professors at the University of São Paulo – Doctors Ariovaldo
dos Santos, Bruno Salotti, Edgard Cornacchione, Eliseu Martins, Gilberto Martins, Luiz
Corrar and Luiz Paulo Fávero – as well as at the University of Illinois at Urbana Champaign –
Doctors Carolyn Anderson, Jennifer Greene and Joseph Robinson – for sharing their
knowledge and experience and thereby contributing to my professional development. I also
thank Doctors Diógenes Bido, Gerlando Lima, Luis Eduardo Afonso and Silvia Casa Nova
for their support in my research and for their friendship.
I thank the agencies FAPESB, CAPES, FULBRIGHT and FIPECAFI for the operational and
financial support that I received during my doctorate program. In addition, I thank my
colleagues at the Accounting Department at the Federal University of Bahia for their
partnership and their confidence in my potential.
I would like to thank all of my friends at USP, here represented by Tatiana Albanez, Gilberto,
Josedilton, Kelly, Cláudio, Simone, Júlio, Aládio, Nelma, Odilanei, Daniel, Kleber, Patricia,
Kelly, Manoel and in particular my new friends for life, Josué and César, whose friendship
left unforgettable memories and a strong partnership.
My deepest thanks to my mother and my brother for their love, and to my husband, Luis
Paulo, for all of the good moments from our daily discussions on our respective doctoral
dissertations. I would never have completed this research without your support and love!

RESUMO
Freitas, S. C. (2012). Um Estudo Exploratório sobre a Utilização do Relatório de Avaliação do ENADE e seu Impacto no Desempenho dos Cursos de Graduação em Ciências Contábeis no Brasil. (Tese de Doutorado), Universidade de São Paulo, São Paulo, Brasil.
O programa Brasileiro de avaliação da educação superior, largamente conhecido pelo Exame
Nacional de Desempenho de Estudantes (ENADE), representa um esforço governamental
para reunir informações sobre a qualidade dos cursos de graduação. Como um produto da
avaliação, um relatório é disponibilizado para cada curso avaliado; e saber em que extensão
esses relatórios são utilizados pelos coordenadores de cursos de graduação em ciências
contábeis, assim como qual é o impacto do uso desse relatório sobre a performance dos
cursos, foram os principais objetivos desse estudo. Fundamentado teoricamente na literatura
sobre uso de avaliação, um questionário, que inclui uma escala para mensurar tipos de
utilização, foi desenvolvido e aplicado. Com base em uma taxa de resposta de 62% (322
questionários completos), quatro diferentes aspectos foram analisados: (1) estudo dos fatores
associados ao uso do relatório de avaliação do ENADE, através de regressão logística; (2)
análise descritiva acerca da incidência de uso dos relatórios de avaliação, e acerca dos tipos de
uso mais frequentes entre os coordenadores de cursos de ciências contábeis; (3) estudo do
impacto da utilização, bem como do uso inadequado dos relatórios de avaliação, sobre o
desempenho dos cursos de graduação em ciências contábeis na avaliação subsequente, por
meio de regressão múltipla; e (4) análise descritiva das razões apontadas pelos coordenadores
para o não uso dos relatórios de avaliação. Os principais resultados, a partir das evidências
reunidas pelo presente estudo, foram: quanto maior o número de anos do coordenador no
cargo, a sua titulação, o seu envolvimento no processo de avaliação e quanto mais positiva a
sua percepção sobre a efetividade da comunicação entre o INEP e os cursos, maior a
probabilidade de uso do relatório do ENADE; o uso conceitual foi o mais frequente entre os
coordenadores pesquisados; a falta de conhecimento sobre a disponibilidade online dos
relatórios de avaliação foi a principal causa de não uso verificada entre os pesquisados; e por
fim, foi identificada uma correlação positiva entre o uso do relatório do ENADE e o
desempenho dos cursos de graduação em ciências contábeis na avaliação subsequente.
Palavras-chave: utilização da avaliação, ensino superior, ciências contábeis.

ABSTRACT
Freitas, S. C. (2012). An Exploratory Study on ENADE Evaluation Report Utilization and its Impact on Undergraduate Accounting Program Performance in Brazil. (Doctoral dissertation), Universidade de São Paulo, São Paulo, Brazil.
The Brazilian program of higher education evaluation, broadly known by the National Exam
of Students’ Performance (ENADE), represents a governmental effort to gather information
on undergraduate educational quality. As a product of that evaluation, reports are made
available to each program evaluated; the main intent of the present research is to discover the
extent to which these reports are used by undergraduate accounting program administrators
and the impact of evaluation utilization on the programs’ performance. Based on the
theoretical support of the literature on evaluation utilization, a web-based survey was
developed and applied to collect the data. With a response rate of 62% (322 completed
surveys), analyses were conducted through four steps: (1) a logistic regression to verify which
factors were associated with the use of the ENADE evaluation report, (2) a descriptive
verification of the incidence of use of the evaluation report among the undergraduate
accounting program administrators and the most frequent types of use that they report, (3)
multiple regressions to analyze the impact of the evaluation report’s use or misuse on the
programs’ performance in the subsequent evaluation, and (4) a descriptive analysis of the
reasons for the nonuse of the evaluation report. The key findings of this research were as
follows: the longer the program administrator’s tenure, the higher his or her academic degree,
the greater his or her involvement in the evaluation process, and the more positive his or her
perception of the effectiveness of the communication between the evaluator and the programs,
the greater the likelihood that the ENADE evaluation report would be used; the most frequent
type of use among the administrators studied was conceptual; the main reason for nonuse was
a lack of information about the online availability of the evaluation report; and finally, there
was a positive correlation between the use of the ENADE evaluation report and the
performance of undergraduate accounting programs in the subsequent evaluation.
Keywords: evaluation utilization, higher education, accounting.

LIST OF FIGURES
Figure 1 - Data collection instrument design. .......................................................................... 58
Figure 2 - Study population. ..................................................................................................... 72
Figure 3 - Perceptions of the relevance of evaluation findings for the decision making. ...... 104
Figure 4 - Perceptions of the importance of contextual characteristics to the trustworthiness of the evaluation outcomes. .................................................................................................... 105
Figure 5 - Perceptions of the lack of necessity for governmental evaluation of higher education in Brazil. ................................................................................................................ 105
Figure 6 - Agreement on the maintenance of the Brazilian higher education evaluation program. ................................................................................................................................. 106
Figure 7 - Perceptions of the necessity of evaluand participation in the planning and design of the ENADE evaluation process. ........................................................................................ 107
Figure 8 - Perceptions of the congruousness of the ENADE large-scale test questions. ....... 107
Figure 9 - Agreement on the link between evaluation outcomes’ usefulness and evaluand participation in the evaluation. ............................................................................................... 108
Figure 10 - Perception regarding student refusals to answer the test as a threat to the evaluation outcomes. .............................................................................................................. 109
Figure 11 - Agreement on the use of student answers and performance as the main parameter in the evaluation. .................................................................................................................... 109
Figure 12 - Perceptions regarding the necessity of punishing students who do not answer the large-scale test. ....................................................................................................................... 110
Figure 13 - Perceptions of the credibility conferred by the Ministry of Education to the evaluation. .............................................................................................................................. 113
Figure 14 - Opinions about the quality of the ENADE implementation. ............................... 114
Figure 15 - Agreement on the statement that the ENADE report potentially supports decision making processes. ................................................................................................................... 115
Figure 16 - Agreement on the restricted disclosure of the ENADE evaluation reports. ........ 115

LIST OF TABLES
Table 1 - Programs evaluated by the ENC ............................................................................... 34
Table 2 - Brazilian empirical studies on factors associated with students’ performance on the ENC and ENADE ............................................................................................................... 40
Table 3 - Evaluation use/utilization definitions ....................................................................... 45
Table 4 - Primary use of findings and types of process use ..................................................... 46
Table 5 - Evaluation use analyses versus statistical approaches .............................................. 57
Table 6 - Matching between the factors associated with use and the questionnaire statements/questions ................................................................................................................. 60
Table 7 - Types of use plus misuse scale statements ............................................................... 63
Table 8 - Nonuse statements .................................................................................................... 65
Table 9 - Description of the data collection instrument variables ............................................ 69
Table 10 - Description of the 2009 ENADE database variables .............................................. 70
Table 11 - Response rate for completed surveys by Brazilian region ...................................... 76
Table 12 - Gender versus use or nonuse .................................................................................. 77
Table 13 - Highest degree versus use or nonuse ...................................................................... 78
Table 14 - Position tenure for accounting program administrators versus use or nonuse ....... 78
Table 15 - Main funding source versus use or nonuse ............................................................. 79
Table 16 - Main funding source and position tenure versus use or nonuse in public institutions .................................................................................................................................................. 80
Table 17 - Main funding source and position tenure versus use or nonuse in private institutions ................................................................................................................................ 80
Table 18 - Academic organization versus use or nonuse ......................................................... 81
Table 19 - Brazilian region versus use or nonuse .................................................................... 82
Table 20 - Position tenure versus use or nonuse of west-center institutions ............................ 82
Table 21 - Highest degree versus use or nonuse of west-center institutions ............................ 83
Table 22 - Factors associated with the ENADE evaluation report use .................................... 84

Table 23 - Latent variable bivariate correlations, AVE, composite reliability and Cronbach’s alpha – full model ..................................................................................................................... 86
Table 24 - Scale-excluded indicators ....................................................................................... 87
Table 25 - Latent variables correlations, AVE, composite reliability and Cronbach’s alpha – reduced model .......................................................................................................................... 87
Table 26 - Descriptive statistics from the scale constructs ...................................................... 88
Table 27 - Descriptive statistics of the outcome variable ........................................................ 89
Table 28 - Relationship between the use of the ENADE evaluation report and the undergraduate accounting programs’ performance .................................................................. 90
Table 29 - Relationships between the use of the ENADE evaluation report and the undergraduate accounting programs’ performance with additional control variables ............. 90
Table 30 - Relationship between the intensity of the ENADE evaluation report use and the undergraduate accounting programs’ performance .................................................................. 92
Table 31 - The relationship between the intensity of the ENADE evaluation report use and the undergraduate accounting programs’ performance with additional control variables ....... 93
Table 32 - The relationship between the conceptual use of the ENADE evaluation report and the undergraduate accounting programs’ performance ............................................................ 94
Table 33 - The relationship between the instrumental use of the ENADE evaluation report and the undergraduate accounting programs’ performance ..................................................... 94
Table 34 - The relationship between the persuasive use of the ENADE evaluation report and the undergraduate accounting programs’ performance ............................................................ 95
Table 35 - The relationship between the conceptual use of the ENADE evaluation report and the undergraduate accounting programs’ performance with additional control variables ....... 95
Table 36 - The relationship between the instrumental use of the ENADE evaluation report and the undergraduate accounting programs’ performance with additional control variables 96
Table 37 - The relationship between the persuasive use of the ENADE evaluation report and the undergraduate accounting programs’ performance with additional control variables ....... 97
Table 38 - The effect size and the statistical power of the hypotheses test multiple regressions .............................................................................................................................. 100
Table 39 - The relationship between misuse of the ENADE evaluation report and the undergraduate accounting programs’ performance ................................................................ 101
Table 40 - The relationship between misuse of the ENADE evaluation report and the undergraduate accounting programs’ performance with additional control variables ........... 101
Table 41 - ENADE evaluation report nonuse reasons ........................................................... 103

LIST OF ABBREVIATIONS AND ACRONYMS
AACSB Association to Advance Collegiate Schools of Business
ACE Evaluation of Teaching Conditions (Avaliação das Condições de Ensino)
AVE Average Variance Extracted
CAPES Coordination for the Improvement of Higher Level Personnel (Coordenação para o Aperfeiçoamento de Pessoal de Nível Superior)
CCLC Century Community Learn Centers
CFA Confirmatory Factor Analysis
CFC Federal Accounting Council (Conselho Federal de Contabilidade)
CONAES National Commission of Higher Education Evaluation (Comissão Nacional de Avaliação da Educação Superior)
CPC Program Preliminary Grade (Conceito Preliminar de Curso)
ENADE National Exam of Students’ Performance (Exame Nacional de Desempenho de Estudantes)
ENC National Exam of Programs (Exame Nacional de Cursos)
ENEM National High School Exam (Exame Nacional do Ensino Médio)
ENQA European Association for Quality Assurance in Higher Education
HLM Hierarchical Linear Model
IDD Difference Indicator between the Observed and the Expected Performance (Índice de Diferença de Desempenho)
IEA International Association for the Evaluation of Educational Achievement
IGC General Index of Programs (Índice geral de cursos)
INEP National Institute of Educational Studies and Research - Anísio Teixeira (Instituto Nacional de Estudos e Pesquisas Educacionais - Anísio Teixeira)
MLR Multinomial Logistic Regression

OECD Organization for Economic Co-operation and Development
OLS Ordinary Least Squares
PAIUB Brazilian Universities Institutional Evaluation Program (Programa de Avaliação Institucional das Universidades Brasileiras)
PARU Evaluation Program of University Reform (Programa de Avaliação da Reforma Universitária)
PISA Program for International Student Assessment
PLS-PM Partial Least Squares - Path Modeling
QAA Quality Assurance Agency for Higher Education
SAEB National System of Basic Education Evaluation (Sistema Nacional de Avaliação da Educação Básica)
SINAES National System of Higher Education Evaluation (Sistema Nacional de Avaliação da Educação Superior)
TIG Topical Interest Group
TIMSS Trends in International Mathematics and Science Study
VIF Variance Inflation Factor

TABLE OF CONTENTS
CHAPTER I - INTRODUCTION ............................................................................................ 15
1.1 Problem statement ....................................................................................................... 17
1.2 Purpose of the study .................................................................................................... 19
1.3 Significance of the study ............................................................................................. 20
1.4 Limitations of the study .............................................................................................. 22
CHAPTER II - LITERATURE REVIEW ............................................................................... 25
2.1 Understanding evaluation ........................................................................................... 25
2.2 Educational evaluations .............................................................................................. 27
2.3 Educational evaluation in Brazil ................................................................................. 29
2.3.1 The Brazilian program of higher education evaluation ....................................... 32
2.3.2 Previous studies on higher education evaluation in Brazil ................................. 39
2.4 Utilization-focused evaluation .................................................................................... 44
2.4.1 Factors associated with evaluation use ................................................................ 48
2.4.2 Types of use ........................................................................................................ 50
2.4.3 Nonuse and misuse of evaluation findings .......................................................... 51
2.4.4 Previous research on evaluation utilization ......................................................... 54
CHAPTER III - THE METHOD ............................................................................................. 57
3.1 Introduction ................................................................................................................. 57
3.2 The study data collection instrument .......................................................................... 58
3.2.1 Factors associated with evaluation use ................................................................ 59
3.2.2 Evidence of use ................................................................................................... 61
3.2.3 Types of use plus misuse scale ............................................................................ 62
3.2.4 Nonuse reasons .................................................................................................... 64
3.2.5 Demographic information ................................................................................... 66
3.3 The study hypotheses .................................................................................................. 66
3.4 The study variables and measurements ....................................................................... 68

3.5 The study population and sample ............................................................................... 71
3.6 The study pilot test ...................................................................................................... 73
CHAPTER IV - RESULTS ...................................................................................................... 75
4.1 Data collection ............................................................................................................ 75
4.2 Demographics ............................................................................................................. 77
4.3 Factors associated with evaluation use ....................................................................... 83
4.4 Types of use plus misuse scale ................................................................................... 85
4.5 Hypothesis tests .......................................................................................................... 89
4.6 Statistical power and effect size .................................................................................. 99
4.7 Additional analyses ................................................................................................... 100
4.7.1 Misuse analysis ................................................................................................. 100
4.7.2 Nonuse analysis ................................................................................................. 102
4.7.3 Other uses .......................................................................................................... 111
4.7.4 Perceptions of the ENADE ............................................................................... 113
CHAPTER V - CONCLUSION ............................................................................................. 117
5.1 Study purpose and procedures .................................................................................. 117
5.2 Key findings and implications .................................................................................. 118
5.3 Recommendations for future research ...................................................................... 122
REFERENCES ....................................................................................................................... 125
Appendix A – Survey instrument ........................................................................................... 141
Appendix B – Survey instrument (Portuguese) ...................................................................... 149
Appendix C – Invitation letter to the accounting program administrators ............................. 157
Appendix D – Logistic regression results .............................................................................. 159
Appendix E – Confirmatory factor analysis ........................................................................... 161
Appendix F – Regression assumption tests ............................................................................ 163
Appendix G – Effect size and statistical power ..................................................................... 173


15
CHAPTER I
INTRODUCTION
Program evaluation has become very popular despite concerns regarding resource scarcity, in
particular, scarcity in publicly funded programs. The evaluation goals reinforce the potential
value of the evaluation instrument to help decision makers in their daily work. Henry (2000)
stated that the main goal of an evaluation is “social betterment,” and Weiss (1988) asserted
that through the evaluation (a) evidence regarding the success of programs is provided, (b) the
main factors associated with good and bad outcomes are identified, and (c) some possible
explanations about how programs work and why they experienced the documented changes
are presented. Hence, evaluation can potentially contribute to the program’s quality
improvement.
More than the program characteristics or the evaluator’s background, federal policies have
influenced the definition of how evaluations are structured, how process practices are
developed, and which evaluation purpose (policy, accountability, utilization, contextual
understanding, or democratization, among others) is applied (Chelimsky, 2007). The
influence of federal policies is particularly notable in educational evaluations, which have
frequently been the focus of policy or accountability evaluations by local, international, public
and private organizations.
The quality of educational programs has been an object of debate and research around the
world. Initiatives such as the Program for International Student Assessment (PISA) and the
Trends in International Mathematics and Science Study (TIMSS) show that international
organizations such as the Organization for Economic Co-operation and Development (OECD)
and the International Association for the Evaluation of Educational Achievement (IEA) are
trying to verify whether schools are adequately preparing their students by comparing their
performances, aiming to highlight the strengths and weaknesses among the educational
systems of different countries.

16
Higher education has also been the object of quality evaluations around the world (Bertolin &
Leite, 2008; Ursin, Huusko, Aittola, Kiviniemi, & Muhonen, 2008; Van Kemenade, Pupius,
& Hardjono, 2008). Governmental and non-governmental organizations have developed ways
to certify institutional quality through evaluation or accreditation processes. Examples of
these organizations include the European Association for Quality Assurance in Higher
Education (ENQA), the Quality Assurance Agency for Higher Education (QAA), the
Association to Advance Collegiate Schools of Business (AACSB) and the National Institute
of Educational Studies and Research - Anísio Teixeira (INEP).
As in other fields of knowledge, accounting education has been pushed to improve teaching
and learning quality due to the new economic dynamics encountered by companies.
Moreover, accounting programs have been trying to prevent professional misbehavior and
failures that are related to a lack of knowledge, which is commonly verified in cases of
accounting fraud, by including courses such as ethics in their curricula and requiring approval
in accountant examinations before the students begin their professional careers. Additionally,
the harmonization of international financial reporting standards has recently required major
curriculum changes and has challenged accounting education in many countries. In this
context, concerns about quality are constantly present in the daily routine of accounting
program administrators. However, there is no consensus about how quality in higher
education can be measured.
Many higher education institutions are applying for an ISO 90001 certificate as a way to
assure their quality (Lundquist, 1997; Ursin et al., 2008; Van Kemenade et al., 2008), but the
most popular way to obtain evidence of quality in higher education programs is through
external evaluation (Van Kemenade et al., 2008).
External program evaluations are implemented with the goal of producing information that
helps to better comprehend how activities, processes and outcomes are contributing to the
attainment of the primary objectives of the organization. Therefore, if properly used,
evaluations can potentially serve as an information system that can help programs achieve
their goals and correct possible deviations in their operations.
1 ISO 9000 is a group of standards from the International Organization for Standardization, a non-governmental institution created in 1947, that aim to promote a quality continuum for products and services.

17
In general, evaluation use or utilization refers to the application of evaluation findings by
people (Patton, 2008). Some program evaluation researchers have reinforced the necessity of
exploring and comprehending evaluation use (Chelimsky, 1998; Conner, 1998; Datta, 2000;
Henry & Rog, 1998; Johnson, 1998); others have stated the importance and benefits of
evaluation utilization (Alkin, 2010; Patton, 2008; Preskill & Torres, 2000; Shadish, Cook, &
Leviton, 1991). Discussions concerning the definitions of use, types of use, factors associated
with use, and even occurrences of nonuse or misuse have been presented in the most
important journals on program evaluation (Alkin & Coyle, 1988; Cousins & Leithwood,
1986; Leviton & Hughes, 1981; Stevens & Dial, 1994; Shulha & Cousins, 1997). However,
there has been little research that includes practical tools for measuring use in its multiple
forms and intensity levels.
1.1 Problem statement
To provide a better understanding of educational institutions, program evaluations have been
implemented by governmental and private organizations with different foci and
methodologies; however, a report is always developed to describe the results and the means
through which these results were found. The evaluation use literature rests on the assumption
that institutions can improve their internal processes, make better decisions, better understand
themselves, and increase the quality of their programs through the utilization of evaluation
activities and reports.
In Brazil, the practice of educational evaluation has been consolidated through governmental
initiatives that aim to measure the quality of the Brazilian educational system with a focus on
accountability. The current Brazilian program of higher education evaluation was
implemented in 2004 by the Ministry of Education through the National System of Higher
Education Evaluation (SINAES) and has been used to evaluate each undergraduate program
offered in both public and private institutions every three years. This evaluation is managed
by the INEP and is generically titled the National Exam of Students’ Performance (ENADE);
ENADE is one component of SINAES. After the ENADE is implemented, each higher
education program in Brazil receives a grade from 1 (lower) to 5 (higher) that represents its
educational quality. The Brazilian government then summarizes and posts the results of each

18
program on the website of the INEP, but the utilization of these reports and the impact of the
evaluation information among colleges and universities in Brazil have not yet been
thoroughly studied (Burlamaqui, 2008).
Some characteristics of accounting programs in Brazil make accounting education peculiar,
especially as concerns the students. For instance, the students typically come from families
with lower socioeconomic status; most of them are part-time students, and there is high
demand for evening programs. In addition, the accounting restructuring that resulted from the
adoption of the international financial reporting standards has required curriculum and
knowledge updates, impacting accounting education in Brazil. In this context, program
evaluation could be a powerful tool for the process of comprehending and managing
educational institutions, providing information that helps them to better understand
themselves and their outcomes.
Additionally, the recent results from the accountants’ professional exam in Brazil caused
some concern regarding Brazilian accounting education (Miranda, 2011). The high failure rate
among the newly graduated students may be an indication of a knowledge shortfall, which
would induce accounting programs to seek quality improvement.
According to the utilization-focused evaluation literature, accounting programs could benefit
from the evaluation report utilization because “the ultimate purpose of evaluation is to
improve programs and increase the quality of decisions made” (Patton, 2008, p. 356). Hence,
the report provided through the ENADE evaluation may serve as a managerial instrument
used in the accounting program administrators’ decision making process.
The definition of evaluation use has been widely discussed in utilization-focused evaluation
theory. Among the many concepts of evaluation use, that of Cousins and Leithwood (1986)
perfectly fits the purpose of the present study. This concept states that “the mere
psychological processing of evaluation results constitutes use, without necessarily informing
decisions, dictating actions, or changing thinking” (Cousins & Leithwood, 1986, p. 332).
Based on this definition and assuming that through the utilization of evaluation reports,
educational institutions can better comprehend themselves, improve their processes and make
decisions that will increase the quality of their programs, this study aims to explore the
19
following question: to what extent are Brazilian higher education evaluation reports used
by the undergraduate accounting programs?
In a context where academic programs are seeking to improve quality, it is important to know
how the Brazilian higher education evaluation system is contributing to the undergraduate
accounting programs in Brazil. Knowing whether the accounting institutions use their
evaluation reports as an information source will help to examine the setting of some
educational decisions and to identify the possible strengths and weaknesses of the Brazilian
higher education evaluation process.
1.2 Purpose of the study
This study intended to verify the types, intensity and impact of the ENADE evaluation report
utilization among the program administrators in accounting schools in Brazil and to relate that
utilization to the programs’ grades in the subsequent evaluation, with an overarching goal of
analyzing the relationship between evaluation use and program outcome.
In addition to verifying the intensity of use and its correlation with program performance, this
study examined other factors described in the evaluation use literature and their relationship
to the utilization of the ENADE reports. These factors included those that influence
utilization, such as relevance, credibility, user involvement, communication effectiveness, the
potential for information processing, clients’ need for information, the perceived value of the
evaluation as a management tool, the quality of the evaluation implementation, contextual
characteristics of the decision or policy setting; and personal characteristics of the evaluation
users (Cousins & Leithwood, 1986; Shulha & Cousins, 1997). Additionally, the present study
sought to identify the main reasons given by the program administrators to justify their
nonuse of the ENADE evaluation report and to verify possible occurrences of misuse of the
report.
Therefore, the main objective of this study was to verify whether the ENADE evaluation
report was utilized by the accounting program administrators and how its possible use
impacted the programs’ performance in the next ENADE. Additionally, this study intended to

20
(a) identify the main factors influencing utilization, (b) identify the most frequent types of use
reported, (c) identify the main causes of evaluation nonuse, and (d) verify incidences of
misuse.
To accomplish these objectives, a data collection instrument was developed and applied to
identify the use occurrences, the most frequent types of use, the reasons for nonuse and the
possible misuses of the Brazilian higher education evaluation reports among the accounting
program administrators. The cited instrument was sent to all programs that were evaluated
through the ENADE in both the 2006 and 2009 editions. Lastly, multiple regressions were
used to correlate the utilization of the evaluation reports with the programs’ grades. Details on
the methods are described in the third chapter.
In the particular evaluation setting studied, most of the stakeholders2 were not involved in the
process. This lack of involvement differentiates this research from other studies investigating
the use of evaluations. Previous studies concluded that the participation of the intended users
in the evaluation processes was related to, facilitated, or enhanced the usefulness of the
evaluation results (Barrios, 1986; Brown-Mcgowan, 1992; Cai, 1996; Cornachione Jr.,
Trombetta, & Casa Nova, 2010; Greene, 1988a; Johnson, 1993; Mccormick, 1997; Preskill &
Caracelli, 1997; Rockwell, Dickey, & Jasa, 1990; Roseland, 2011; Turnbull, 1999). However,
the Brazilian higher education evaluation was not designed to be participatory. Therefore, the
present research explored a different context, studying evaluation utilization among
stakeholders who were not consulted or whose concerns and suggestions were not considered
in the evaluation design.
1.3 Significance of the study
This study aimed to contribute to the evaluation utilization literature by proposing a scale with
which to measure evaluation use of different types (instrumental, conceptual, and persuasive)
in addition to misuse and by applying this scale to measure the report utilization among
undergraduate accounting program administrators from the institutions evaluated through the
2 “Stakeholders are those who have a legitimate interest in or are served in some meaningful way by the program and are thus implicated in the program’s evaluation” (Yarbrough, Shulha, Hopson, & Caruthers, 2010 p. 23).

21
ENADE in 2006 and 2009. Furthermore, this study aimed to better comprehend how these
evaluation reports are used by the undergraduate accounting programs, which will enable the
accounting schools to increase their internal knowledge. The final goal of this study was to
promote information about accounting program management and outcomes in Brazil, which is
especially important at this time of major changes in financial accounting standards
worldwide.
Beyond studying the utilization of educational evaluation reports, this research examined the
main justifications for the nonuse of these reports. Through the opinions of the program
administrators who did not use the ENADE evaluation report, this study gathered information
about the strengths and weaknesses of the Brazilian higher education evaluation process.
Studies on nonuse are less common than studies focused on other issues in the evaluation use
literature, particularly studies of nonuse using empirical research with real evaluations,
reports and stakeholders.
The present study also attempts to verify the occurrence of misuse, as classified by the
evaluation use literature, among the uses described by the accounting program administrators.
This contribution is important because few studies have addressed misuse directly (Cousins &
Shulha, 2006; Fleischer & Christie, 2009). In particular, research using empirical data to
discuss the misuse of evaluation information among higher education institutions is scarce.
Another novel aspect of this research is that it includes an analysis of the factors associated
with the utilization of the ENADE report, which can help to better understand the attitude of
the group studied toward evaluation use. In addition, it was possible to identify some of the
aspects related to the administrators’ perceptions of the Brazilian program of higher education
evaluation.
The overall expectation is that the results of this research will promote a broader view about
ENADE evaluation utilization among undergraduate accounting programs in Brazil and that it
will help to clearly define particular information needs and contribute to the informative
potential of evaluation reports. Moreover, instruments for estimating use are not common in
the evaluation utilization literature, and, according to a literature review, no previous studies
have correlated use with a measure of programs’ quality.
22
Finally, it is expected that the feedback provided by this study will allow the Ministry of
Education in Brazil to better understand the impact and the usefulness of the reports
developed through the national exam of students’ performance and to make decisions aimed
at increasing the users’ potential interest in the evaluation outcomes. It is important to
highlight that concerns regarding the utilization of the higher education evaluation results or
products are present in the Brazilian educational evaluation literature (Souza & Oliveira,
2003; Verhine, Dantas, & Soares, 2006; Vianna, 2009). Thus, efforts to enhance the
knowledge about evaluation use in Brazil are welcome.
1.4 Limitations of the study
The main limitations of this study are (a) the utilization of retrospective actions as a way to
recognize use and the occurrences of types of use, (b) the utilization of a large-scale test as
part of the measurement of the quality of the programs, (c) the utilization of self-reporting to
gather information about evaluation use, and (d) the self-selection of participants.
The data collected through the scale application were based on past events derived from
reading the ENADE evaluation report. Hence, memory was the basis of the answers and
experiences reported. In this case, the limitation associated with the use of memory in the
process of gathering information is the fact that memories may not be reliable.
Inasmuch as students may not take seriously the large-scale test used by the Brazilian
Ministry of Education to evaluate the quality of programs (Leitão, Moriconi, Abrão, & Silva,
2010), the test outcomes may not represent the students’ knowledge. Consequently, the
programs’ grade may be affected because the large-scale test outcome is a relevant variable in
the definition of the programs’ performance, which was correlated with the utilization of the
ENADE evaluation report in this study. Therefore, any possible imprecision in these data
would influence the results and analyses of this research.
Considering that the program administrators self-reported the information about the use of the
evaluation reports, it is possible that some misunderstanding has occurred or that inaccurate
answers have been provided, intentionally or not, in the scale application. In this case, the

23
information gathered would not represent the programs’ status and, consequently, could lead
this research to inaccurate conclusions.
As expected, some accounting program administrators in the population researched did not
respond to the data collection instrument. Hence, only those who agreed to answer the
instrument were included in the group studied. The lack of answers from the non-respondents
impacted the analysis of the present study because the opinions of those who did not
participate were not counted in this study.
In addition, this study considered the primary stakeholders to be the program administrators
of the undergraduate accounting programs. The factors influencing utilization, types of use,
motivations for nonuse, views about the evaluation, and possible misuses by other potential
users, such as professors, students, college or university deans, and parents were not studied.
Lastly, the results presented in this research cannot be generalized because they did not come
from a probabilistic sample. Therefore, the conclusions derived from this research are
applicable only to the group of program administrators and accounting programs studied.

24

25
CHAPTER II
LITERATURE REVIEW
In this chapter, the theoretical support for program evaluation, educational evaluation and
utilization-focused evaluation will be presented in addition to the history of educational
evaluation in Brazil and the Brazilian program of higher education evaluation.
2.1 Understanding evaluation
Different types of programs and projects coexist that request funding from governmental and
non-governmental agencies or private organizations, but resources are always scarce. It is
necessary to know whether the programs are performing well and what their outcomes
(intended or not) are. In this situation, the best way to understand what is happening with
these programs and projects is to apply an evaluation. However, although the outcomes from
program evaluations might not be used as the only parameter for funding allocation, the
programs with unsatisfactory performance may have difficulty continuing to operate or they
may become worse due to the lack of financial support.
Generically, Stufflebeam (2001) described evaluation as “a study designed and conducted to
assist some audience to assess an object’s merit and worth” (p. 11). Alkin (1985), however,
defined evaluation as the “activity of systematically collecting, analyzing, and reporting
information that can then be used to change attitudes or to improve the operation of a project
or program” (pp. 11-12). Both definitions have in common the characteristic of translating
reality into information, providing a type of informed judgment about programs or projects. It
is also interesting to highlight, in Alkins’ definition, the argument about information use as a
natural consequence of an evaluation process.
One of the best-known ways to characterize evaluations is as either formative or summative,
terms developed by Scriven (1967) and largely used since then (Rebien, 1997). A formative
evaluation is intended to provide information for program improvement, whereas a

26
summative evaluation intends to help with decisions such as whether to continue or abandon a
program (Alkin, 2010). However, these types of evaluations are not mutually exclusive. It is
relatively common to find that both formative and summative characteristics coexist in the
same program evaluation (Stake, 2004).
Another perspective on formative and summative evaluations is related to their functions. The
formative function corresponds to the use of an evaluation for the improvement and
development of a program, product, or other activity that is in progress. However, the
summative function corresponds to the use of an evaluation for accountability, certification or
selection (Nevo, 2006).
Three other important aspects of evaluation include the following: (a) an evaluation is not
“value-free” (Patton, 2008; Rebien, 1997), (b) each evaluation is related to specific
approaches that guide the evaluation process (Stufflebeam, 2001), and (c) an evaluation is not
always a matter of value judgment (Scriven, 2001).
First, value, moral, and ethical considerations are always present in the evaluators’ decisions
and cannot be dissociated from their work. Additionally, some evaluation researchers have
noted the importance of incorporating values into the evaluation process to better understand
the effectiveness of the program being evaluated in its context (Greene, 2005; Schwandt,
1997; Stake, 2004).
Second, the approaches organized by Stufflebeam (2001), which were divided into four main
groups (pseudoevaluations, question- and/or methods-oriented approaches,
improvement/accountability approaches, and social agenda/advocacy), were developed based
on the beliefs and experiences of their authors regarding how evaluations should be
conducted. Alkin (2010) presented a different organization for the evaluation approaches,
dividing them into three general groups (use-oriented, values-oriented, and methods-oriented).
Alkin also explained that concerns about use, values and methods are present in all
evaluations but that the choice of the evaluation’s primary orientation is what defines the
approach that will be used (Alkin, 2010).
Third, the word evaluation has commonly been considered to be a synonym for a merit
judgment of programs or activities. However, according to Scriven (2001), an evaluation may
27
simply contrapose measurements and established standards without attributing merit
judgment. Thus, it is recommended that caution be used with generalizations when using the
term evaluation.
In evaluations, standards can be used to define the quality parameters that help to determine
the level of program success or to evaluate the evaluation process (metaevaluation). In the
former case, any prior outcomes from the same or similar programs can serve as a parameter
with which to judge the current status, or new goals can be established. In the latter case, a
group of standards is usually discussed and consensually chosen by the evaluators and
stakeholders, serving as a practice guide during the evaluation process. As an example,
evaluators and practitioners recognize “The Program Evaluation Standards” proposed by the
Joint Committee3 as among the most relevant criteria for assessing quality in educational
evaluations (Wingate, 2009).
Although the potential contributions to social improvement through evaluation are recognized
(Lipsey, 2001; Mark, Henry, & Julnes, 2000; Smith, 2001), some researchers believe that
there is a lack of studies on evaluation itself, particularly studies that will expand the present
understanding regarding the types of evaluation and their benefits and that include empirical
analysis aimed at improving practice and contributing to social betterment (Henry & Mark,
2003b; Shadish et al., 1991).
2.2 Educational evaluations
Educational institutions have been the target of evaluations worldwide and have received the
special attention of evaluation researchers, as can be attested by the large number of studies
focused on this domain. Characteristics such as strong governmental regulation, the variety of
actors involved (teachers, students, directors, social assistants, and program coordinators,
among others), cultural and social diversity, and the possibility of longitudinal analysis make
educational evaluation very attractive and in demand.
3 Joint Committee on Standards for Educational Evaluation.

28
Educational evaluation was defined by Nevo (1995) as the “act of collecting systematic
information regarding the nature and quality of educational objects” (p. 11). Research on
educational evaluation usually investigates issues regarding students, teachers, instructional
materials, educational projects, and program and school evaluations; among these objects of
evaluation, students have been the most studied by evaluators (Nevo, 2006). The same author
also stated that “educational evaluation can serve many needs at various levels of the
educational system resulting in five major functions. They are related to decision-making,
improvement, accountability, professionalism, and certification” (Nevo, 2006, p. 443).
Educational evaluation can be considered to be a complex task in a complex environment
(Ball, 1981). Therefore, the decisions on what outcomes to assess and what evaluation design
to apply are very important to the development and success of the evaluation process. Ryan
and Cousins (2009) stated that “the goal of all educational evaluation is to enable programs
and policies to improve student learning” (p. ix). This noble goal enhances the appeal of
educational evaluation and contributes to increasing the researchers’ interest and involvement
with this challenge.
Among the large number of studies on educational evaluations, those developed by Betoret
and Tomás (2003), Byrne and Flood (2003), Leviton and Boruch (1983) and Braskamp,
Brown and Newman (1978) are particularly interesting in the context of the present research
because they provide rich information about the previous results on evaluation in higher
education, evaluation in accounting programs, federal educational evaluation, and the source
and usefulness of evaluation reports.
Betoret and Tomás (2003) proposed an evaluation model using indicators for the activities
developed in the teaching and learning process in higher education. Based on questionnaires
applied to teachers (n = 2) and students (n = 156) during two semesters in a course at a
Spanish university, the results indicated that the indicators model was considered to be a
useful tool when utilized in the formative evaluation of professors.
Byrne and Flood (2003) tested the use of the Course Experience Questionnaire (CEQ) to
evaluate teaching quality through an analysis of curriculum, teaching experience and student
assessment outcomes. Through the CEQ questionnaire application among bachelor’s and
master’s students (n = 204) during two academic years in an accounting program in Ireland,

29
the study confirmed the CEQ’s reliability and construct validity and also confirmed the
questionnaire’s effectiveness in measuring teaching quality in that context.
Leviton and Boruch (1983) conducted research about the contributions of evaluations to
educational programs and policy. Using case studies and analyzing the content of 21
evaluation reports, these authors found that federal evaluations in education contributed to
changes in laws, regulations, and management; in particular, these changes were affected by
information related to the program implementation, followed by program outcomes, cost, and
federal administration.
Lastly, Braskamp, Brown and Newman (1978) verified the effects of the source and the
message of educational evaluation reports. More precisely, they verified whether school
administrators’ (n = 52) and teachers’ (n = 59) reactions to evaluation information were
affected by the characteristics of the evaluator, the content of the report and the audience
perception of the usefulness of the evaluation report, using simulated reports and conducting a
survey after the report reading. The results from the administrators and the teachers were
significantly different regarding their perception of the usefulness of the evaluation report.
Administrators rated the usefulness of the evaluation report higher than did teachers.
However, the two groups studied did not differ in their perception of the impact of the
evaluators’ characteristics on the evaluation information.
These studies exemplified the educational evaluation context and established previous
experiences with the topics that are related to the present study. It is important to highlight
that the research by Byrne and Flood (2003) was one of the few studies investigating
evaluation in accounting programs in the literature reviewed. Considering the focus of this
study on verifying evaluation utilization within undergraduate accounting programs in Brazil,
the present study appears to contribute to a minimally explored field.
2.3 Educational evaluation in Brazil
Educational evaluation in Brazil had an unstable beginning. Although introduced in the first
decades of the 20th century, only in the 1960s did educational evaluation become more

30
systematized and begin to be part of Brazil’s developmental politics. However, at the end of
the 1970s and the beginning of 1980s, educational evaluation was discredited and questioned
as a field of study, recovering its significance in the late 1980s early 1990s through initiatives
directed toward elementary school evaluation (Gatti, 2002).
Among the problems identified by the Brazilian educational evaluation literature, the two
primary difficulties related to the educational evaluation process were the lack of people with
program evaluation expertise to manage and structure the system and the discontinuity of
public politics over the years, which caused changes to the work teams and to the study
objects (Gatti, 2009).
Educational evaluation in Brazil has been consolidated only since the 1990s, and it has
aroused the interest of researchers in different fields of knowledge, such as education,
economics, and psychology. As examples of the systematization of educational
evaluation, the following programs can be cited: the National System of Basic Education
Evaluation (SAEB); the National High School Exam (ENEM); and the National Exam of
Programs (ENC), which was replaced by the ENADE. ENADE is one component of the
SINAES, instituted in 2004 with the purpose of evaluating higher education institutions,
higher education programs, and student performance (Dantas, 2009; Silva, 2011).
These programs are funded by the Brazilian government, which also maintains employees
who manage each program jointly with consultants, mainly professors, who make up specific
committees. The work teams define the evaluation concept and the standards used to measure
the quality of institutions, which are usually based on the outcomes of standardized tests
applied to students, and these teams are responsible for undertaking the evaluation.
Educational evaluation in Brazil has an accountability focus, and it aims to measure the
quality of institutions (Santos, 2012). The accountability approach is popular among
politicians, is question-oriented with outcomes, is based on pass/fail standards, provides for
punishment for unacceptable outcomes, and includes an external and impartial perspective
orientation, among characteristics (Stufflebeam, 2001). These characteristics are present in the
Brazilian educational evaluation programs. In addition, Rezende (2010) affirmed that
accountability systems “typically require students to take a standardized test” (p. 842), which
also occurs in the Brazilian evaluations.

31
According to Hanushek (2002), standardized tests have been the predominant instrument for
assessing the quality of education. This type of performance test predominantly depends on
the student’s cognitive ability. Educational literature has discussed the validity of this type of
performance measurement, although systematic studies that reveal the conceptual
framework and specific criteria that are considered in the students’ performance assessment
instruments are scarce (Bonamino, Coscarelli, & Franco, 2002).
Researchers have asserted that educational evaluations are increasing in importance
at all levels of education in Brazil and have argued that this practice is important because it
allows for a better understanding of the conditions in which schools exist and increases
the possibility of finding solutions to the problems that affect the quality of
education (Bonamino et al., 2002; Jesus, 2004; Pereira, 2006).
However, other researchers point out some negative aspects of educational evaluations in
Brazil, especially the use of standardized tests by educational institutions as a model that
drives curriculum reductions based on the test contents and the potential for the evaluation
process to become a type of control instrument that is directed at preparing the workforce for
the labor market (Gentili, 1996; Sousa, 2003). Another criticism related to the national
program of educational evaluation is that it is not restricted to pedagogical boundaries but,
rather, reflects a governmental and political orientation, and, in some cases, instead of acting
as a diagnostic instrument, it serves as a governmental control instrument (Souza, 2009).
After an initial period of strong resistance, the educational evaluations in Brazil underwent
changes and a new evaluative culture based on an accountability focus is in the process of
consolidation (Gatti, 2009). Impacts from this new evaluative culture can already be seen, and
the next stage should consider how the evaluation results can stimulate changes and be used
to improve the educational process (Gatti, 2009; Vianna, 2009).

32
2.3.1 The Brazilian program of higher education evaluation
According to Mendonça (2000) and Schwartzman (2010), higher education developed late in
Brazilian society. The first programs were initiated in the 1800s, but the first universities were
established between the 1920s and 1930s through the aggregation of the single programs and
colleges that were already in operation in Brazil (Mendonça, 2000; Schwartzman, 2010).
Concerns about the quality of higher education in Brazil originated from the expansion of
these institutions and the increasing number of students (Marchelli, 2007). As a response to
these concerns, the first initiative related to higher education evaluation in Brazil was
developed. The Evaluation Program of University Reform (PARU) was instituted in 1983
with the objective of analyzing university management and knowledge production and
dissemination among universities, but it had a very short lifetime and became extinct only one
year after its implementation due to political discontinuity and internal dispute within the
Brazilian Ministry of Education (Gatti, 2002; Marchelli, 2007).
A second attempt to institute a Brazilian program of higher education evaluation, called the
Brazilian Universities Institutional Evaluation Program (PAIUB), was implemented in 1993
and came to an end in 1995. This program introduced the institutional self-evaluation as the
initial stage of the evaluation process and obtained the volunteer participation of
approximately 94 universities before it was discontinued by the Ministry of Education. One of
the problems related to the PAIUB was that it evaluated only universities; in Brazil, more
undergraduate students were in institutions with a different academic organization, such as
colleges, which were not evaluated even though there were suspicions about the precarious
institutional conditions of many of these institutions (Gatti, 2002; Marchelli, 2007).
In the year after the PAIUB was discontinued, a new higher education evaluation initiative
was implemented: the National Exam of Programs (ENC), popularly known as Provão. This
evaluation program differed substantially from the higher education evaluation standards used
previously. This program was followed by two other initiatives: the Evaluation of Teaching
Conditions (ACE) and the Higher Education Census. However, the ENC received more
attention from the Brazilian media and society because it was based on a mandatory large-
scale test that was applied to all senior students in Brazil with the goal of measuring the
33
quality of the institutions. The ENC began by evaluating three programs in 1996 and
gradually increased the number of programs evaluated until it reached 26 in its last year in
2003 (Paiva, 2008; Verhine et al., 2006). Table 1 presents a chronological scale of the
programs evaluated by the ENC.

34
Table 1 - Programs evaluated by the ENC
YEARS
1996 1997 1998 1999 2000 2001 2002 2003
Prog
ram
s eva
luat
ed
Business Business Business Business Business Business Business Business Civil engineering Civil engineering Civil engineering Civil engineering Civil engineering Civil engineering Civil engineering Civil engineering
Law Law Law Law Law Law Law Law
Chemical engineering
Chemical engineering
Chemical engineering
Chemical engineering
Chemical engineering
Chemical engineering
Chemical engineering
Dentistry Dentistry Dentistry Dentistry Dentistry Dentistry Dentistry
Veterinary medicine
Veterinary medicine
Veterinary medicine
Veterinary medicine
Veterinary medicine
Veterinary medicine
Veterinary medicine
Electrical engineering
Electrical engineering
Electrical engineering
Electrical engineering
Electrical engineering
Electrical engineering
Journalism Journalism Journalism Journalism Journalism Journalism
Languages Languages Languages Languages Languages Languages
Mathematics Mathematics Mathematics Mathematics Mathematics Mathematics
Economics Economics Economics Economics Economics
Mechanical engineering
Mechanical engineering
Mechanical engineering
Mechanical engineering
Mechanical engineering
Medicine Medicine Medicine Medicine Medicine
Agronomy Agronomy Agronomy Agronomy
Biology Biology Biology Biology
Chemistry Chemistry Chemistry Chemistry
Physics Physics Physics Physics
Psychology Psychology Psychology Psychology
Pharmacy Pharmacy Pharmacy Pharmacy
Education Education Education
Accounting Accounting
Architecture Architecture
History History
Nursing Nursing
Geography
Phonoaudiology

35
The ENC was centered in outcomes, productivity, efficiency, control and student performance
(Tenório & Andrade, 2009). After the evaluation process, grades ranging from A to E were
assigned to each program based on the students’ average performance, and the Ministry of
Education disclosed these grades. Additionally, the grades were widely publicized by the
Brazilian media as a parameter of the programs’ quality. After three years receiving low
grades, D or E, programs could be punished through the temporary prohibition of new student
admissions (Gouveia, Silva, Silveria, Jacomini, & Braz, 2005; Rezende, 2010).
Some of the primary criticisms related to the ENC were that (a) it worked as a single
evaluation instrument used to measure the programs’ grades; (b) the evaluation design was
not participatory, and the evaluations were imposed on the educational institutions, which
were only information consumers; (c) it ignored the value-added concept by centering the
evaluation on a specific knowledge test to measure the students’ learning in their fields; (d)
the quality indicator was unstable due to the test regulation and its frequent changes, resulting
in incomparable outcomes; (e) it was economically unfeasible in the long term; and (f) there
was an emphasis on higher education regulatory aspects that confounded the concepts of
regulation with those of evaluation (Verhine et al., 2006).
After the 2002 presidential elections, Brazil had a new president and a new commission to
discuss the Brazilian program of higher education evaluation. At that time, the objective was
to improve the ENC. Hence, the SINAES was proposed and debated at a national level, being
changed and later instituted in 2004 through Law number 10,861/04. These changes resulted
in a higher education evaluation model that is unlike that of any other country in the world
(Verhine & Dantas, 2009).
The SINAES is coordinated and supervised by the National Commission of Higher Education
Evaluation (CONAES), and it is operated by the INEP, an autarchy that is linked to the
Brazilian Ministry of Education. The current Brazilian program of higher education
evaluation is one of the broadest actions undertaken to collect, systematize, and analyze
data on higher education in Brazil, aiming at supporting decisions and improving the quality
of teaching and learning in colleges and universities (Inep, 2004).
The SINAES maintained, with some changes in its design, the evaluation of students’
performance, now called the National Exam of Students’ Performance (ENADE), and

36
introduced two new dimensions to the evaluation process: the programs’ evaluation and the
institutions’ evaluation. These two dimensions aim to improve the quality and guide the
expansion of higher education institutions (Gouveia et al., 2005).
The ENADE grade is comprised of four instruments: (a) a standardized test that aims to
measure the performance of undergraduate students, considering the curriculum contents,
skills and competencies; (b) the students’ perception of the test questionnaire; (c) the student
questionnaire; and (d) the program administrator questionnaire. The standardized test is
divided into two sections: the general knowledge test, which is the same for all programs
evaluated in the year, and the test of specific knowledge, which is based on the contents
provided in the guidelines for each program curriculum by the Ministry of Education. Until its
2010 edition, the ENADE was applied to freshmen and senior undergraduate students
annually, but the program evaluation was rotated so that each field of knowledge was
evaluated every three years (Zoghbi, Oliva, & Moriconi, 2010).
From the ENADE grades, it is possible to measure the Difference Indicator between the
Observed and the Expected Performance (IDD), a new concept created by the SINAES. This
indicator measures the colleges’ contribution to the undergraduate students’ professional
development. The IDD represents the difference between the seniors’ average performance in
a program and the estimated performance for seniors in that program. The variables used in
the calculation of the seniors’ estimated performance include the programs’ freshmen
performance in the ENADE; the educational degree of the seniors’ parents; and the programs’
selectivity, that is, the ratio of freshmen to seniors in the program (Verhine & Dantas, 2009).
The second dimension introduced by the SINAES was the program evaluation, which
corresponds to a program grade as measured through the Program Preliminary Grade (CPC).
The CPC components are related to the quality of the undergraduate programs and are as
follows: the ENADE grade, the IDD grade, the professor’s degree and hours worked, the
programs’ infrastructure, and the programs’ didactic-pedagogical organization. The
information about the professors’ degrees and hours worked are taken from the Brazilian
higher education census. The programs’ infrastructure and didactic-pedagogical organization
components are measured based on the student’s perceptions, which are collected through the
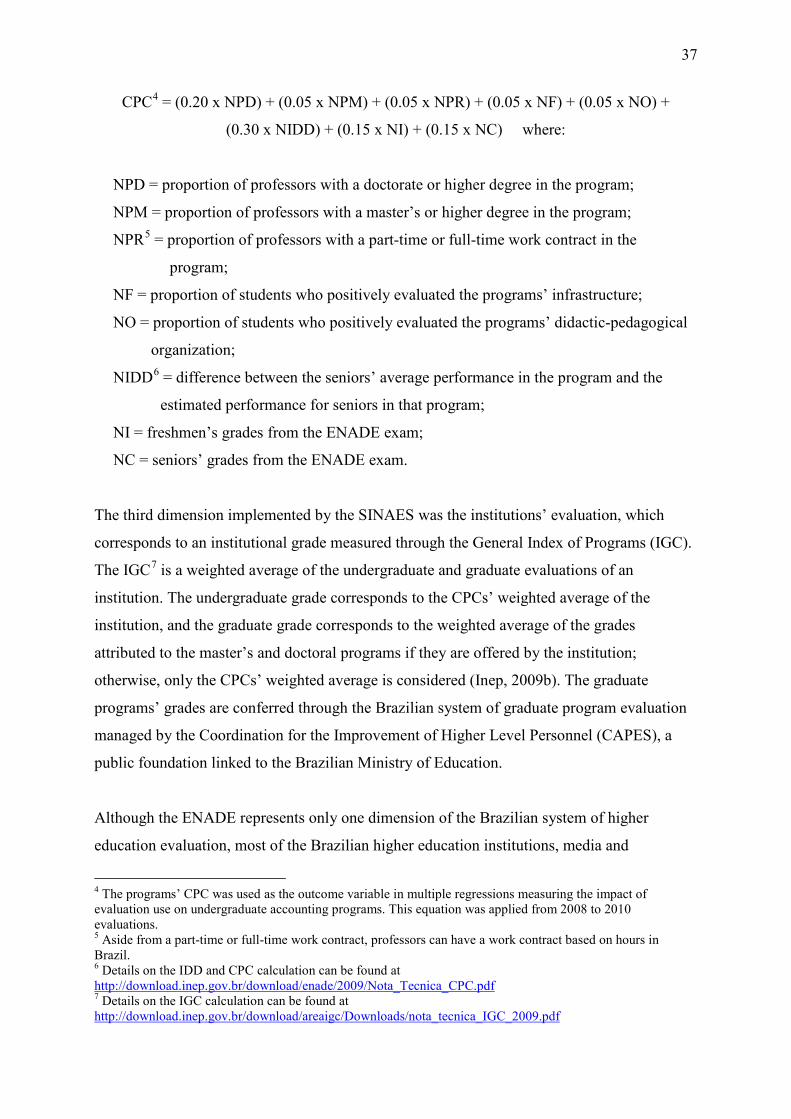
students’ questionnaire. Thus, the CPC is calculated as follows (Inep, 2009a):
37
CPC4 = (0.20 x NPD) + (0.05 x NPM) + (0.05 x NPR) + (0.05 x NF) + (0.05 x NO) +
(0.30 x NIDD) + (0.15 x NI) + (0.15 x NC) where:
NPD = proportion of professors with a doctorate or higher degree in the program;
NPM = proportion of professors with a master’s or higher degree in the program;
NPR5 = proportion of professors with a part-time or full-time work contract in the
program;
NF = proportion of students who positively evaluated the programs’ infrastructure;
NO = proportion of students who positively evaluated the programs’ didactic-pedagogical
organization;
NIDD6 = difference between the seniors’ average performance in the program and the
estimated performance for seniors in that program;
NI = freshmen’s grades from the ENADE exam;
NC = seniors’ grades from the ENADE exam.
The third dimension implemented by the SINAES was the institutions’ evaluation, which
corresponds to an institutional grade measured through the General Index of Programs (IGC).
The IGC7 is a weighted average of the undergraduate and graduate evaluations of an
institution. The undergraduate grade corresponds to the CPCs’ weighted average of the
institution, and the graduate grade corresponds to the weighted average of the grades
attributed to the master’s and doctoral programs if they are offered by the institution;
otherwise, only the CPCs’ weighted average is considered (Inep, 2009b). The graduate
programs’ grades are conferred through the Brazilian system of graduate program evaluation
managed by the Coordination for the Improvement of Higher Level Personnel (CAPES), a
public foundation linked to the Brazilian Ministry of Education.
Although the ENADE represents only one dimension of the Brazilian system of higher
education evaluation, most of the Brazilian higher education institutions, media and
4 The programs’ CPC was used as the outcome variable in multiple regressions measuring the impact of evaluation use on undergraduate accounting programs. This equation was applied from 2008 to 2010 evaluations. 5 Aside from a part-time or full-time work contract, professors can have a work contract based on hours in Brazil. 6 Details on the IDD and CPC calculation can be found at http://download.inep.gov.br/download/enade/2009/Nota_Tecnica_CPC.pdf 7 Details on the IGC calculation can be found at http://download.inep.gov.br/download/areaigc/Downloads/nota_tecnica_IGC_2009.pdf

38
undergraduate students emphasize it. In some cases, there is a belief that the Brazilian
program of higher education evaluation corresponds to the ENADE, a concept that is
reinforced in the media (Bittencourt, Viali, Casartelli, & Rodrigues, 2008; Ristoff & Giolo,
2006). Thus, in the present research, the expression ENADE evaluation is used to represent
the Brazilian evaluation process that is responsible for assessing the undergraduate programs’
performance as determined through the CPC and based on the ENADE standardized test,
ENADE questionnaires, and data from the higher education census.
Programs that receive a grade in the ENADE evaluation also receive a report that comprises
detailed information about the grade achieved by the program, the performance of students on
the large-scale test, the students’ perceptions of the large-scale test, and information about the
students’ socioeconomic status. Comparative data from the national average student’s
performance and perceptions are also presented in the report. Thus, program stakeholders can
utilize that information in their daily work to persuade people, to support their decisions,
and/or to better know their students’ characteristics and academic strengths and weaknesses.
A threat to the reliability of the ENADE outcomes is the students’ lack of commitment to
collaborating with the evaluation process (Leitão et al., 2010). A study developed by Leitão et
al. (2010) verified the magnitude and type of a phenomenon known as a boycott, that is, the
students’ refusal to participate in the large-scale test. The authors found that when analyzed
generically, the phenomenon did not appear to be significant because boycotts were engaged
in by less than 3.5% of the students. However, when the data from each field of knowledge
were analyzed individually, a large variability was verified. It is interesting to highlight that
among all of the fields of knowledge evaluated by the ENADE, the accounting field had the
second lowest (less than 1%) probability of a student boycott (Leitão et al., 2010). This
finding increases the reliability of the ENADE accounting programs’ outcomes that were used
in the development of the present study.
Additional criticisms related to the ENADE are that it is a mandatory exam, that the same
evaluative instrument is used in the entire country without regard for Brazilian regional
differences, and that the evaluation process is heavily weighted toward the students’
performance on the standardized test (Burlamaqui, 2008; Gouveia et al., 2005; Ristoff &
Giolo, 2006). However, inasmuch as the ENADE data have become a potential source of
information, it is worthwhile to attempt to better understand the variables underlying the

39
teaching and learning processes and the impact of the evaluation process on higher education
programs and institutions in Brazil. Therefore, studies that analyze the ENADE experience
are important (Verhine & Dantas, 2009).
2.3.2 Previous studies on higher education evaluation in Brazil
From the review of the literature on Brazilian higher education evaluation, empirical studies
that addressed different aspects of the Brazilian program of higher education evaluation were
found (Barbosa, 2011; Miranda, 2011; Nogueira, 2008; Real, 2007; Santana, 2009; Silva,
2007).
However, special attention was given to research on the factors associated with the
performance of students on the ENC and ENADE inasmuch as the independent variables
tested in the regressions in the present study were defined based on previous studies (Diaz,
2007; Gracioso, 2006; Moreira, 2010; Santos, Cunha, & Cornachione Jr., 2009; Santos, 2012;
Silva, 2011; Soares, Ribeiro, & Castro, 2001; Souza, 2008). These previous studies are
presented in Table 2.

40
Table 2 - Brazilian empirical studies on factors associated with students’ performance on the ENC and ENADE
Type of study Evaluation Evaluation
year Level of analysis Programs Dependent
variable Independent variables Significant variables Statistical approach
Soares, J. F.; Ribeiro, L.M.; Castro, C. M., 2001
Paper ENC 1996-1999 State
(Minas Gerais)
Law, Business, and Civil
Engineering
Student grades
University entrance grades, Gender, Socioeconomic
indicator, Peer effect
University entrance grades, Gender,
Socioeconomic indicator, Peer effect
HLM
Gracioso, A., 2006
Doctoral dissertation ENC 2003 National Business Student
grades
Race, Previous grades, English level, Computer use level, Student’s perception of infrastructure, Student’s perception of pedagogical
project, Student’s perception of teachers’ evaluation, Student’s perception of competences acquired, Family income, Parents
educational level, Candidate per place indicator, Average
student evaluation of infrastructure, Percentage of
doctors, Average student evaluation of professors, Percentage of white and
Asian students, Percentage of students with high family
income, Percentage of students with a high English level, Percentage of students
that use a computer regularly, Percentage of
students that studied only at private high schools,
Average student evaluation of pedagogical project,
Average student evaluation of competences acquired
Race, Previous grades, English level, Computer
use level, Family income, Candidate per
place indicator, Percentage of doctors,
Average student evaluation of professors, Percentage of white and
Asian students, Percentage of students
that use a computer regularly, Percentage of
students with a high English level, Average student evaluation of competences acquired
HLM
(table continues)
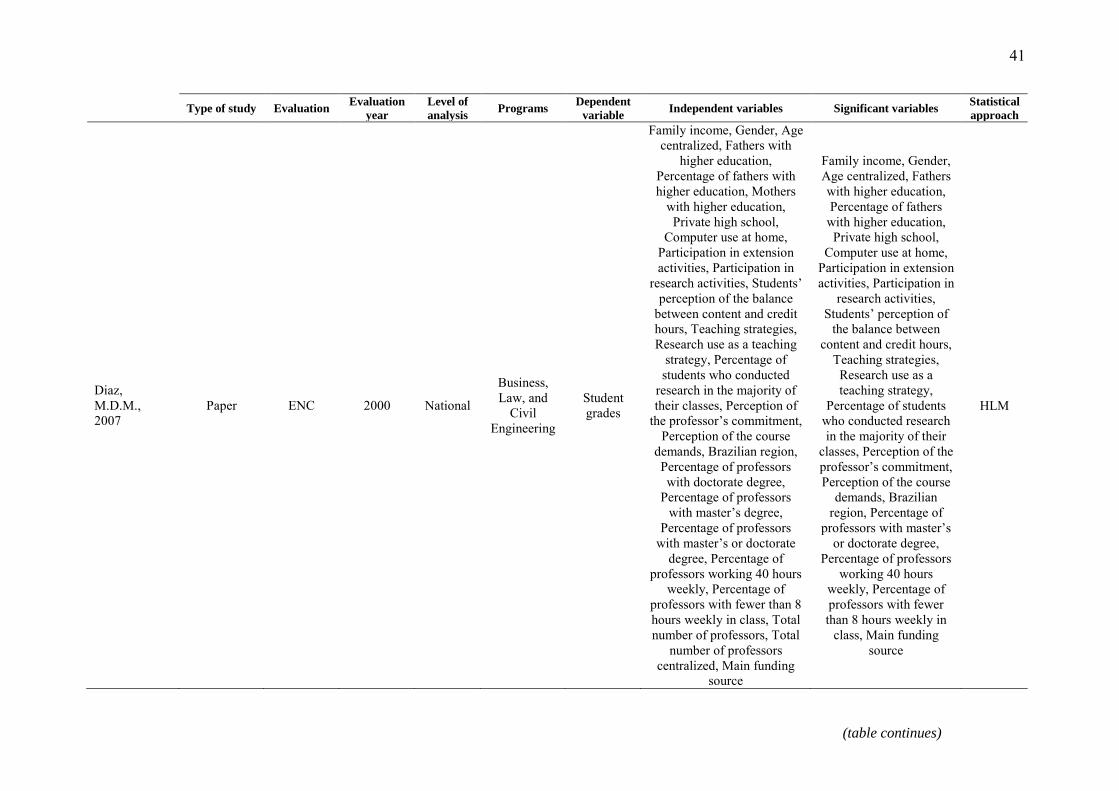
41
Type of study Evaluation Evaluation year
Level of analysis Programs Dependent
variable Independent variables Significant variables Statistical approach
Diaz, M.D.M., 2007
Paper ENC 2000 National
Business, Law, and
Civil Engineering
Student grades
Family income, Gender, Age centralized, Fathers with
higher education, Percentage of fathers with higher education, Mothers
with higher education, Private high school,
Computer use at home, Participation in extension activities, Participation in
research activities, Students’ perception of the balance
between content and credit hours, Teaching strategies, Research use as a teaching
strategy, Percentage of students who conducted
research in the majority of their classes, Perception of
the professor’s commitment, Perception of the course
demands, Brazilian region, Percentage of professors with doctorate degree,
Percentage of professors with master’s degree,
Percentage of professors with master’s or doctorate
degree, Percentage of professors working 40 hours
weekly, Percentage of professors with fewer than 8 hours weekly in class, Total number of professors, Total
number of professors centralized, Main funding
source
Family income, Gender, Age centralized, Fathers with higher education, Percentage of fathers
with higher education, Private high school,
Computer use at home, Participation in extension activities, Participation in
research activities, Students’ perception of
the balance between content and credit hours,
Teaching strategies, Research use as a teaching strategy,
Percentage of students who conducted research in the majority of their
classes, Perception of the professor’s commitment, Perception of the course
demands, Brazilian region, Percentage of
professors with master’s or doctorate degree,
Percentage of professors working 40 hours
weekly, Percentage of professors with fewer than 8 hours weekly in
class, Main funding source
HLM
(table continues)

42
Type of study Evaluation Evaluation year
Level of analysis Programs Dependent
variable Independent variables Significant variables Statistical approach
Souza, E. S., 2008
Master’s thesis ENADE 2006 National Accounting IDC
Freshman grades, Family income, Job, Father’s
educational level, Mother’s educational level, Public high school, Student’s personal commitment
Freshman grades, Family income, Father’s educational level,
Mother’s educational level, Student’s personal
commitment
OLS
Santos, N.A., Cunha, J.V.A.; Cornacchione Jr., E.B., 2009
Conference paper ENADE 2006
State (Minas Gerais)
Accounting IDD
Professors’ academic degree, Program age, Daily operational period, Credit hours, Year-based or half-
year-based courses, Minimal number of years to finish the program, Average number of
students by class, Federal institution, Freshmen’s average grades on the
ENADE, Seniors’ average grades on the ENADE
Professors’ academic degree, Seniors’ average grades on the ENADE
MLR
Moreira, A.M.A., 2010
Doctoral dissertation ENADE 2005 National
Biology, Civil
Engineering, History, and Pedagogy
Student grades
(seniors)
Academic organization, Brazilian regions, Age,
Gender, Fathers with higher education, Family income, Academic extra activities, Indicator of institutional
quality, Professors’ availability for extra class
advising, Professors’ academic degree, Perception
of the course demands
Academic organization, Brazilian regions, Age, Gender, Fathers with
higher education, Family income, Academic extra activities, Indicator of institutional quality,
Professors’ availability for extra class advising, Professors’ academic
degree, Perception of the course demands
OLS
Silva, M.C.R., 2011
Doctoral dissertation ENADE 2006 National Business
Specific knowledge
student grades
(seniors)
Parents’ educational level; Family income; Job; Freshman specific knowledge grades; Freshman general knowledge grades
Family income, Job, Freshman specific knowledge grades, Freshman general knowledge grades
HLM
(table continues)

43
Type of study Evaluation Evaluation year
Level of analysis Programs Dependent
variable Independent variables Significant variables Statistical approach
Santos, N.A., 2012
Doctoral dissertation
ENC, and ENADE
ENC 2002-2003, and ENADE
2006
National Accounting Student grades
Age, Gender, Ethnic group, At least one hour of extra class study, Marital status,
Children, Brothers or sisters, Family income, Fathers with higher education, Mothers
with higher education, Public high school,
Participation in extension activities, Participation in
research activities, Research use as a teaching strategy,
Book use as a learning support, Lecture as the most frequent teaching strategy,
Course-provided knowledge on accounting information systems, Course-provided
knowledge on tax planning, Percentage of professors
with master’s and doctorate degree, Percentage of
professors with 40 hours weekly worked, Students’ perception that majority of professors have domain of knowledge, Proportion of
fathers with higher education by program,
Proportion of mothers with higher education by
program, Average students’ age by program, Academic organization, Main funding
source
Age, Gender, Ethnic group, At least one hour
of extra class study, Marital status, Brothers
or sisters, Family income, Fathers with
higher education, Public high school, Participation
in extension activities, Participation in research activities, Research use as a teaching strategy, Book use as a learning support, Lecture as the most frequent teaching strategy, Percentage of
professors with master’s and doctorate degree,
Percentage of professors with 40 hours weekly
worked, Students’ perception that majority
of professors have domain of knowledge, Proportion of fathers
with higher education by program, Proportion of
mothers with higher education by program,
Academic organization, Main funding source
HLM
Note. The significant variables correspond to variables with p < .10, p < .05, or p < .001, considering at least one year or one program analyzed. IDC= programs’ performance indicator; IDD= difference indicator between seniors’ observed and seniors’ expected performance; HLM= hierarchical linear model; MLR= multinomial logistic regression; OLS= ordinary least squares regression; ENC= national exam of programs; ENADE= national exam of students’ performance.

44
Another study on Brazilian higher education evaluation deserves to be highlighted because it
had an objective similar to that of the present research, but it applied different methods and
focused on a different field of knowledge. In her master’s thesis, Reis (2009) studied the
utilization of the 2005 ENADE results by two Physics programs in Brasília, using interviews
with one member of the INEP and with program administrators, professors, and managers of
the two institutions researched. The research findings indicated that the ENADE results
influenced the didactic-pedagogical organization, the professors’ maintenance, and the
institutional infrastructure in the private institution, whereas the latter influence was not
verified in the public institution according to the interviewees. In addition, the interviewees
also recognized the importance of the Brazilian program of higher education evaluation to the
betterment of higher education quality but pointed the lack of potential user participation as
one weakness in the evaluation program (Reis, 2009).
The necessity of providing more attention to the utilization of evaluation results in Brazil has
also been addressed by other researchers who advocate for using the evaluation outcomes to
promote program improvement and, in particular, to help in the decision making of
stakeholders, such as higher education managers, government, students, and parents (Souza &
Oliveira, 2003; Verhine et al., 2006; Vianna, 2009).
Therefore, all efforts to increase the usefulness of educational evaluation outcomes should be
employed because, as stated by Verhine, Dantas and Soares (2006), “this endeavor [ENC and
ENADE] is only justified if its results are effectively used...” (p. 307) [translation mine].
Hence, it is essential to know the framework for evaluation utilization to better understand the
role of evaluation use in influencing and contributing to program improvement.
2.4 Utilization-focused evaluation
Concerns regarding evaluation utilization began in the 1960s (Alkin & Taut, 2003;
Fitzpatrick, Sanders, & Worthen, 2010; Owen & Lambert, 1995; Russ-Eft & Preskill, 2009),
in response to the concern that, after all of the investment devoted to an evaluation, including
money, time, human resources, and materials, the evaluation process, results and/or report

45
should be used. It is important to highlight that the words use and utilization are considered to
be synonyms in the present study, as they are in some of the seminal literature on the topic
(Alkin & Taut, 2003; Cousins & Leithwood, 1986; Patton, 2008).
In the initial discussions about use, the main concept of evaluation utilization was strict and
related to the direct impact of the evaluation on the decision making process (Preskill &
Torres, 2000; Weiss, 1998). Thus, this restriction on the meaning of utilization led to the
conclusion that evaluations were underutilized because in many cases, it was difficult to
identify direct decisions that were related to evaluation results (Alkin, Daillak, & White,
1979; Dickey, 1980). More inclusive definitions of use were then suggested.
There are diverse definitions of use available in the evaluation utilization literature. Table 3
presents some of these definitions. In addition, the utilization-focused evaluation theory
(Patton, 2008) has been the main support for studies on use during or after the evaluation
process. According to this theory, “utilization-focused evaluation is evaluation done for and
with specific intended primary users for specific, intended uses” (Patton, 2008, p. 37).
Table 3 - Evaluation use/utilization definitions
Authors Evaluation use/utilization definitions
Alkin, 2010, p. 206 “Evaluation use refers to how the evaluation process and information obtained from an evaluation affects the program that is being evaluated.”
Alkin and Taut, 2003, p. 1
“… refers to the way in which an evaluation and information from the evaluation impacts the program that is being evaluated.”
Christie, 2007, p. 8 “the effect the evaluation has on the evaluand - the ‘thing’ being evaluated - and those connected to the evaluand.”
Cousins and Leithwood, 1986, p. 332
“… the mere psychological processing of evaluation results constitutes use, without necessarily informing decisions, dictating actions, or changing thinking.”
Hall, 1982, p. 186 “Utilization is defined in terms of decisions based on evaluations and observable consequences of these decisions.”
King and Pechman, 1984, p. 244
“… intentional and serious consideration of evaluation information by an individual with the potential to act on it.”
Leviton and Boruch, 1983, p. 564
“… serious consideration of findings, which may or may not relate to decisions.”
Among the concepts of evaluation use/utilization presented in Table 3, the concept developed
by Cousins and Leithwood (1986) perfectly matches the objectives of the present research

46
because, as defined, an ordinary activity such as reading the evaluation report can be
considered to be evaluation use. This definition is different from those concepts that require
final actions such as making a decision, possible effects, impacts and consequences, or serious
considerations arising from the evaluation outcomes or process to consider that any utilization
has occurred.
The discussions about evaluation use also include the distinction between process use and use
of findings. Greene’s (1988b) paper contributed to the process use debate, providing a
conceptual framework that found the analysis of the impacts of the process use itself (Preskill
& Caracelli, 1997). As defined in a 1997 survey by Preskill and Caracelli, process use “refers
to the cognitive and behavioral changes resulting from users’ engagement in the evaluation
process,” whereas the use of findings “refers to the results of the evaluation and decisions
made about changing programs on the basis of the evaluation findings…” (Preskill &
Caracelli, 1997, p. 217).
Hence, evaluation utilization can occur during evaluation development (process use) or after
the evaluation conclusion (use of findings). Table 4 presents the six primary uses of findings
and the six types of process use identified by Patton (2008).
Table 4 - Primary use of findings and types of process use
Primary use of findings Types of process use
1. judging overall merit or worth 1. infusing evaluative thinking into the organizational culture
2. improving programs 2. enhancing shared understandings among those involved in a program
3. accountability 3. supporting and reinforcing the program interventions
4. monitoring 4. instrumentation effects and reactivity
5. development 5. supporting participant engagement
6. generating knowledge 6. developing programs and organizations Note. Adapted from “Utilization-focused evaluation,” by M. Q. Patton, 2008, p. 571.
According to the evaluation utilization literature, the use of evaluation findings can improve
programs (Dawson & D'amico, 1985; Patton, 2008; Wholey, 1981). Through evaluation
participation (process use), people can learn more about the program, developing a broader
understanding of the programs’ operation and a positive attitude toward the evaluation,

47
thereby changing their beliefs (Greene, 1988b; Henry & Mark, 2003a). Comparing these two
topics, most of the research on evaluation utilization refers to the use of findings (Johnson et
al., 2009). In the present research, the study object was also related to the use of findings.
Utilization has been the most researched area of evaluation (Christie, 2007). Due to the large
number of evaluators applying efforts on evaluation utilization, it is possible to find a vast
number of propositions and classifications suggested by senior evaluators, some of them
broadly tested and discussed. Examples of these propositions and classifications are
foundations for use (Patton, 2008) and policy actors use (Weiss, 1988).
Patton (2008) stated that credibility affects utilization and that the information provided
through an evaluation report “should be as accurate and believable as possible” (p. 396).
Furthermore, the author presented the standards required as a foundation for use as follows:
(a) report clarity, (b) full and frank disclosure of the data’s strengths and weaknesses, (c)
balanced reporting, (d) defensible information sources, (e) valid and reliable measurement, (f)
justified conclusions, and (g) impartial reporting. On this same topic, Henry and Rog (1998)
affirmed that “for an evaluation to be utilized, the evaluation must be designed, implemented,
analyzed, and reported in ways that are sensitive to the different processes that operate in the
world of social policy-making and programming” (p. 89).
Also with regard to propositions and classifications for the evaluation utilization literature,
Weiss (1988) discussed four ways that policy actors use evaluations, that is, the usefulness of
evaluations:
(a) warning – evaluation can provide an indication of problems;
(b) guidance – evaluation informs direction for improvement;
(c) reconceptualization – evaluation can provide new approaches or ways to think about
an issue; and
(d) mobilization of support – evaluation helps to gather support to reinforce a point of
view or to persuade others through its information.
Therefore, due to the great volume of discussion on evaluation utilization, some important
conclusions resulted from the development of this evaluation area. Greene (1988a) stated that
“the quality of an evaluation is now judged, in part, by how useful it is, and the effectiveness

48
of an evaluator rests, in part, on his or her skills in promoting utilization” (p. 341). In addition,
a useful evaluation is described by Ginsburg and Rhett (2003) as “one that adds to the body of
timely, relevant evidence to increase the likelihood that policy decisions improve program
performance” (p. 490).
Other topics related to evaluation utilization, such as the factors associated with use, the types
of use, the nonuse of evaluation findings, and the misuse of evaluation findings are discussed
in the sections below.
2.4.1 Factors associated with evaluation use
Many studies have discussed the factors associated with evaluation utilization. This section
addresses some of these studies, but it is first necessary to conceptualize what a factor means
in the evaluation context. According to Alkin (1985), “a factor is any characteristic or element
present in a given evaluation situation that can affect the evaluation’s potential for use” (p.
24). The same author also stated that the factors associated with evaluation utilization can be
divided into three categories: human factors, context factors, and evaluation factors (Alkin,
1985).
The human factors are related to the users’ and the evaluators’ personal characteristics that
might have an effect on the evaluation utilization, such as the user’s attitudes toward the
evaluation, the evaluator or the project. The context factors are related to the setting where the
evaluation is conducted, including elements such as organizational characteristics and social
and political climate. Lastly, the evaluation factors are related to the evaluation aspects, such
as its procedures, the information collected and how the findings are reported (Alkin, 1985).
Another term presented in the literature on evaluation use is the personal factor (Patton,
2008). The personal factor is related to the influence that one or more individuals can exert to
induce evaluation utilization due to their participation in the evaluation process (Patton,
2008). A case study developed by Rockwell et al. (1990) analyzed evaluation use when the
personal factor is considered in the evaluation planning stage. The study identified six factors
that appear to support evaluation use in that context: (a) the intended user’s desire for

49
information, (b) the timeliness of the study, (c) the intended user’s ownership of the
information, (d) the team interaction, (e) the methodological appropriateness and quality, and
(f) the uses for the results (Rockwell et al., 1990, p. 392).
The factors associated with evaluation use were also studied by Boyer and Langbein (1991),
who correlated evaluation use with the possible factors associated with evaluation utilization
in the American legislative setting. The multiple regression results indicated that the proper
timing of the report, the clarity of the report, and the methodological credibility had a
significant effect on the amount of evaluation use by the 100 members of Congress and/or the
staffers researched (Boyer & Langbein, 1991).
Beyond studying the factors associated with evaluation utilization, Cousins and Leithwood
(1986) also developed a meta-analytic method to measure the relative weight of the factors
influencing use after analyzing 65 empirical evaluation studies. First, these authors clustered
the factors associated with use into two categories: (a) the characteristics of evaluation
implementation, which are comprised of the factors evaluation quality, credibility, relevance,
communication quality, findings, and timeliness of evaluations for users; and (b) the
characteristics of the decision or policy setting, which are comprised of the factors
information needs of users, decision characteristics, political climate, competing information,
personal characteristics of users, and user commitment and receptiveness to evaluation
information. After the clustering, based on the method developed, the authors found that
evaluation quality was the most influential characteristic in evaluation use, followed by the
decision characteristics, the findings, the commitment and/or the receptiveness to evaluation,
and the relevance (Cousins & Leithwood, 1986).
In the present research, the study of factors associated with evaluation utilization aimed to
identify the main characteristics that may influence the use of the ENADE evaluation report.
The factors tested were defined from the research by Shulha and Cousins (1997) that
reviewed the evaluation use literature published from 1986 to 1996 and identified the most
frequent factors. These frequently used factors were clustered as follows: (a) relevance, (b)
credibility, (c) user involvement, (d) communication effectiveness, (e) potential for
information processing, (f) clients’ need for information, (g) anticipated degree of program
change, (h) perceived value of evaluation as a management tool, (i) quality of evaluation

50
implementation, and (j) contextual characteristics of the decision or policy setting (Shulha &
Cousins, 1997, p. 196).
2.4.2 Types of use
In an attempt to better distinguish the evaluation uses presented in the literature, Leviton and
Hughes (1981) summarized the categories for the most frequent uses described at that time
and classified them into the current and broadly known types of use, which include conceptual
use, instrumental use, and persuasive use. This nomenclature is generally accepted when
describing the uses of evaluation findings (Alkin & Taut, 2003; Preskill & Caracelli, 1997).
The conceptual type of use, also known as enlightenment (Braskamp, 1982; Owen &
Lambert, 1995; Weiss, 1980), refers to improving the understanding regarding aspects of the
program, such as its participants, its context, or its outcomes, through the evaluation. The
conceptual use is also related to developing new views of the program and identifying
problems (Alkin, 2010; Braskamp, 1982; Henry & Mark, 2003a). In addition, the
enlightenment type of use is considered to be a key element in the evaluation literature,
preceding the other types of use (Johnson, 1998; Owen & Lambert, 1995).
The instrumental use, “perhaps the earliest type of use examined in the literature” (Johnson,
1998, p. 93), is related to the purposes of decision making or problem solving using the
information provided through the evaluation. This type of use refers to direct actions aimed at
modifying the program in some way, symbolizing an objective use of evaluative information
(Henry & Mark, 2003a; Shadish et al., 1991; Shulha & Cousins, 1997).
Lastly, the persuasive use is related to convincing others to agree with or support some
specific choice or political position or to persuading stakeholders about the programs’ values
using evaluation findings, often in a selective way (Fleischer & Christie, 2009; Leviton &
Hughes, 1981; Patton, 2008). As explained by Leviton and Hughes (1981), “the difference
between persuasive use and the other two categories listed above is that persuasive use
involves interpersonal influence, getting others to go along with the implications of
evaluation” (p. 529).

51
Although some researchers classify persuasive and symbolic uses in the same category
(Allen, 2010; Fleischer & Christie, 2009), the persuasive nomenclature is preferred in the
present study. Thus, the other use of findings categories, also defined as types of use by the
evaluation utilization literature, such as legitimative use and symbolic use (Alkin & Taut,
2003; Patton, 2008), were not studied in the present research, which is why they are not
discussed here.
In a three-year study focused on stakeholders’ participation in the evaluation process and its
impact on evaluation utilization, Greene (1988b) documented some specific uses of
evaluation findings by type of use, proposing a subdivision of instrumental use as follows:
(a) significant new program developments, policy implementation, and/or planning activities (major instrumental use) and (b) smaller procedural changes in program operations and activities (minor instrumental use), both of which appeared to be grounded in (c) a broader and deeper program understanding, representing important confirmation of existing intuitions (conceptual use), (d) citation of results in reports and proposals to external audiences (persuasive use), and (e) enhanced prestige and visibility for the program within the larger community (symbolic use). (p. 100)
Other research efforts that studied the use of evaluation findings and the incidence of each
type of use described in the literature found that the conceptual use was the most frequent or
the most significant type of use verified among the groups researched (Mccormick, 1997;
Shea, 1991). At the same time, the instrumental use was considered “often restricted to
relatively low-level decisions” (Weiss, 1982, p. 135).
2.4.3 Nonuse and misuse of evaluation findings
The last two important aspects from the evaluation utilization literature analyzed in the
present research are the concepts of nonuse and misuse. “While nonuse is a measure of degree
or magnitude, misuse is a measure of manner of use” (Alkin, Patton, & Weiss, 1990, p. 290).
The discussion about nonuse originated from a widespread concern among evaluators on the
lack of use of evaluation findings by stakeholders (Dickey & Hampton, 1981; King &

52
Thompson, 1983). The discussion about misuse, however, has remained informal, with few
published studies dedicated solely to misuse (Stevens & Dial, 1994).
In general, nonuse represents a potential waste of money and effort (Thompson, 1994), but
there are different nonuse classifications and nomenclature in the evaluation use literature,
including justified nonuse (Alkin & Coyle, 1988). To better understand the justified nonuse
concept, it is necessary to consider two opposite scenarios: a properly performed evaluation
and a poorly performed evaluation. In a properly performed evaluation scenario, the
motivation for nonuse needs to be linked to a nonuse classification such that only
unintentional nonuse would be considered evaluation nonuse; a purposeful nonuse would be
considered misuse; and an intentional/blatant nonuse would be considered abuse. However, in
a poorly performed evaluation scenario, nonuse would be considered justified inasmuch as the
findings reported misrepresent the programs’ condition (Alkin & Coyle, 1988).
Patton (2008) stated that “from a utilization-focused evaluation perspective, nonuse represents
some kind of failure in the evaluation process” (p. 106). However, the author agreed that in
some cases, such as an evaluation report with weak evidence, a late report, or a poor evaluator
performance, among others, the nonuse of an evaluation is appropriate. Patton (2008) also
described two categories of nonuse:
a) political nonuse – occurs when evaluation findings are ignored by stakeholders
because they conflict with their interests; and
b) aggressive nonuse – occurs when the evaluation or evaluator are attacked because the
results contradict some stakeholders’ position.
Also with regard to the nonuse of evaluation findings, King and Pechman (1984) divided
nonuse into intentional and unintentional and discussed combining the nonuse concept with
the types of use concepts. The authors classified intentional nonuse into instrumental and
persuasive nonuse. The former refers to nonuse by lack of action due to personal or
organizational restrictions. The latter refers to the lack of evaluation findings application due
to beliefs that it is the best action considering the administrators’ own interest or the
program’s interest. Lastly, unintentional nonuse refers to the lack of evaluation use for an
unintended reason or as a result of external factors that impact the opportunities for use, such
as changes in administrative or leadership positions (King & Pechman, 1984).

53
According to Stevens and Dial (1994), “misuse of evaluation means that an evaluation has
been used for the wrong purpose or that the results of an evaluation have been misapplied or
used improperly” (p. 3), whereas Alkin and Coyle (1988) defined misuse as “the intentional
(and even malicious) manipulation of some aspect of an evaluation (evaluative results, for
example) in order to gain something, position or support, for instance” (p. 334).
Although studying misuse empirically is quite difficult (Shulha & Cousins, 1997), some
authors have provided valuable insights into misuse. Palumbo (1994) stated that misuse is not
a single phenomenon but assumes different forms, such as the distortion or rejection of
evaluation findings. Vroom, Colombo, and Nahan (1994) affirmed that “deliberate or
inadvertent misuse of evaluation often arises from self-interest” (p. 49). In addition, as
examples of the misuse of evaluation findings, Stevens and Dial (1994) included “using the
results to further a political career, or to end one; using results to reward or punish staff; or
not distributing findings to other stakeholders” (p. 7).
Moreover, based on the cases of misuse cited in the evaluation use literature, Alkin and Coyle
(1988) identified the major categories of misuse as follows: (a) misuse in commissioning an
evaluation (before the evaluation process in the contract phase), (b) misuse of the evaluation
process (during the evaluation), and (c) misuse of the evaluative findings (after the evaluation
is completed, in the use of its results).
In research developed with American Evaluation Association members (evaluation use TIG8)
to investigate their perceptions and experiences with evaluation use in general, Preskill and
Caracelli (1997) also included aspects on evaluation nonuse and misuse in their applied
survey. From the answers of 282 respondents (an answer rate of 54%), these authors found
that the nonuse of evaluation findings was considered to be a major problem by 46% of the
respondents. The evaluators researched also related that they had their findings misused
frequently (9%), sometimes (43%), and rarely (34%).
Fleischer and Christie (2009) developed similar research with the American Evaluation
Association members to verify their current perceptions and experiences with evaluation use,
8 TIG is the acronym of the Topical Interest Group.

54
receiving 1,140 completed surveys. Regarding evaluation nonuse and misuse, and considering
only the answers from evaluation use TIG members, the study found that 10 years later, 74%
of the respondents considered nonuse to be a major problem. The same respondents also
reported intentional misuse (29%) and unintentional misuse (33%) to be a major problem. In
the Preskill and Caracelli (1997) research, these rates were 26% and 24%, respectively. Thus,
a greater concern regarding evaluation nonuse and misuse was verified among the evaluators
researched in 2006, in particular regarding the nonuse of evaluation findings.
2.4.4 Previous research on evaluation utilization
In addition to the studies cited in previous sections, other important studies on evaluation
utilization related to the present research deserve to be mentioned because they served as a
source of information and orientation. These studies are summarized in the following
paragraphs.
Bober and Bartlett (2004) examined the use of evaluation results in four corporate
universities, aiming to verify which organizational members use the results, for what
purposes, and which factors are related to the use of the evaluation findings. Through a case
study using on-site interviews and an in-depth document review, these authors found that the
main users were the evaluation staff, the instructional design and development staff, the
instructors and trainers, the dean or director of the corporate university, and the upper-level
and senior management. Nine main uses of evaluation results were identified among the four
institutions: to modify aspects of the course or curriculum, to train or replace instructors, to
justify training programs, to influence course continuation decisions, to identify when
advanced courses are needed, to determine employee job placement, to market programs, to
identify barriers within the organization that affect the transfer of training, and to continue or
discontinue contracts with external vendors. Lastly, the factors associated with evaluation use
were communication quality, timeliness, commitment or receptiveness to evaluation,
evaluation quality, credibility, relevance, and findings.
Mccormick (1997) studied the correlations between the type of use and the users’
commitment to the program, involvement with the program, attitude toward the evaluation,
55
and organizational position as well as the correlation with the type of organization. The
research subjects were 89 potential evaluation users, and a survey was conducted to collect
the data. The test outcomes indicated that only the involvement with the program was
positively and significantly correlated with the conceptual and process use; the managers’ and
legislators’ organizational positions presented significant differences in their process use; and
there was no significant difference in the use of evaluation findings between the respondents
from public/governmental institutions and those from private nonprofit institutions.
Tackett (2004) researched the use of evaluation findings within grant programs. A survey was
applied to collect data from 43 federally funded Century Community Learn Centers (CCLCs).
The results revealed that the most common use of evaluation findings was summative, and the
least common use was to revise program goals and objectives. Regarding the types of use, the
instrumental use exhibited a moderate positive correlation with report clarity. A secondary
analysis indicated that stakeholder satisfaction with the evaluation exhibited a moderate
positive correlation with the prior knowledge of the community and prior CCLCs experience.
Barrios (1986) developed an investigation to measure evaluation utilization in a large state
agency using a case study. She found that the major factor influencing utilization was the
relevance of the evaluation results to decision making. Other important factors reported to
influence utilization include the support for user involvement in the study formulation, the
credibility of the information, the evaluator’s credibility in terms of program knowledge, and
the evaluation quality.
Vanek (2004) researched the influence of the evaluation process and the use of evaluation
findings on school board decision making. A survey was conducted in Washington State, with
168 completed surveys received from school board members. The results indicated that the
main factors influencing evaluation use were the superintendent’s input and presentation of
the evaluation information, the decision making model, the characteristics of the individual
presenting the information, and the type of information presented. The results also indicated
that both the evaluation process and the use of evaluation findings influenced the school
board’s decision making.
Finally, Cornachione Jr. et al. (2010) examined the role of intense and direct involvement of
the internal stakeholders in the evaluation process on the evaluation utilization using a non-

56
degree online program case study that was comprised of surveys answers (n = 42), interviews
(n = 40), and archival data (n = 34). The findings verified a clear and strong influence of the
internal stakeholders’ participation on the evaluation process and the evaluation use,
indicating that intense and direct evaluation participation had a significant role on the
evaluation utilization in the context analyzed.
As seen from the studies reviewed here, the concepts of types of use, the factors associated
with use, and the process use are more frequently analyzed in the empirical research than
other aspects of evaluation utilization. Those studies offer context for the present research,
which also explores aspects such as nonuse and misuse combined with the accountability
focus of the Brazilian program of higher education evaluation.

57
CHAPTER III
THE METHOD
In this chapter, the description of the data collection instrument and the data analysis models,
the definition of the study hypotheses, variables, population and sample, and the pilot test
results are presented.
3.1 Introduction
The underlying idea of program evaluation is that the information provided from evaluations
will be used (Hatry, Wholey, & Newcomer, 2010). Within this context, the present research
intended to explore the extent to which the ENADE evaluation report is used by the
undergraduate accounting program administrators. Five complementary analyses based on the
evaluation utilization literature were designed to achieve this objective: (a) the factors
associated with evaluation use, (b) the types of evaluation use, (c) the nonuse of the
evaluation report, (d) the misuse of the evaluation report, and (e) the impact of evaluation use
on the accounting programs’ performance.
Each analysis was developed using information from the data collection instrument and/or the
database provided by the INEP for the 2006 and 2009 ENADEs. Table 5 shows the different
statistical approaches applied to each evaluation use analysis.
Table 5 - Evaluation use analyses versus statistical approaches
Evaluation use analyses Statistical approaches
Factors associated with the ENADE report use Logistic regression
Types of evaluation use plus misuse scale Confirmatory factor analysis
Nonuse of the ENADE report Descriptive analysis
Impact of the ENADE report use on accounting programs’ performance
Ordinary least squares regressions

58
The next sections present the data collection instrument, explain how each analysis was
designed, describe the population and sample compositions, and discuss the results from the
data collection instrument piloting test.
3.2 The study data collection instrument
Only one data collection instrument was developed and applied in this research. This
instrument was structured in five parts: (a) the factors associated with evaluation use, (b) the
evidence of use, (c) the types of evaluation use plus misuse, (d) the reasons for nonuse, and
(e) demographic information (see Appendix A for a copy of the survey instrument). Figure 1
shows how these five parts are related and how the data collection instrument was organized.
Figure 1. Data collection instrument design.
As shown in Figure 1, the research subjects began by answering a questionnaire on the factors
associated with use and then were directed to the next section, which was designed to verify
whether they were familiar with the ENADE evaluation report. In the case of a positive

59
answer, respondents were redirected to the types of use plus misuse scale; otherwise, they
were redirected to the nonuse reasons questionnaire. Both groups of respondents completed
their participation by answering the demographic information questionnaire, which was
positioned as the last section of the data collection instrument.
The questionnaires were created as a single document on Survey Monkey, a web-based
survey software, where the responses were also stored. The first page of the electronic survey
asked the respondents the name of the institution at which they were a program administrator.
A response was not obligatory, but this information was necessary to correlate the evaluation
use with the programs’ outcomes, as described in the study hypotheses in section 3.3. Each
questionnaire is broadly discussed below.
3.2.1 Factors associated with evaluation use
The first part of the instrument was developed to verify the main factors associated with
ENADE report use incidence with an exploratory intent. The inclusion of these factors in this
evaluation use study was based on King’s (1988) affirmation that “some people are more
likely to use evaluation information than others” (p. 288). The same author also emphasized
that the personal factor (a person’s particular interest in putting information to use) is
fundamental in the process of evaluation utilization (King, 1988).
The statements designed for the factors associated with use questionnaire were based on
Shulha and Cousins (1997). According to their results, previous studies most frequently
investigated factors associated with use that were related to relevance, credibility, user
involvement, communication effectiveness, potential for information processing, clients’ need
for information, anticipated degree of program change, perceived value of evaluation as a
management tool, quality of evaluation implementation, and contextual characteristics of the
decision or policy setting. These items were divided into five questions that involved nine of
the ten groups presented in the paper by Shulha and Cousins. One of the factors, the
anticipated degree of program change, was not included in the questionnaire used in the
present study because it was not compatible with the Brazilian educational evaluation context.

60
The prior reading of the ENADE evaluation report was not required to answer those questions
because only the respondents’ perceptions of the evaluation process were being studied here.
However, prior knowledge of or experience with the ENADE was expected from program
administrators as a responsibility of their positions. Table 6 presents the matching between the
factors associated with use and the questionnaire statements and questions.
Table 6 - Matching between the factors associated with use and the questionnaire statements/questions
Factors Questionnaire statements/questions
Relevance Relevance to your job as a program administrator
Credibility Credibility conferred by the Ministry of Education to the evaluation
User involvement My level of involvement in the 2006 National Exam of Students Performance (ENADE) was…
Communication effectiveness Communication effectiveness (INEP – Accounting Program) during the evaluation process
Potential for information processing Elapsed time between the evaluation and the report availability
Clients’ need for information As a program administrator, I believe that the evaluation report provided through the ENADE can potentially support my decision making process
Perceived value of evaluation as a management tool
The National Exam of Students Performance (ENADE) is an important management tool for my program
Quality of evaluation implementation In my opinion, the quality of the National Exam of Students Performance (ENADE) implementation is…
Contextual characteristics of the decision or policy setting
Importance given to the local characteristics of the programs
The answers obtained and some information on the characteristics of the administrators and
their institutions were correlated with the real use, which was verified through the second part
of the data collection instrument, with the intent of analyzing which of these factors were
associated with the use or nonuse incidence in the ENADE context. The inclusion of
information on the characteristics of the program administrators in the analysis was based on
Cousins and Leithwood’s (1986) findings about the relationship between evaluation use and
user attributes in previous research on evaluation utilization.
Because the dependent variable in the regression to test which factors were associated with
the ENADE report use is binary, the most appropriate model to treat the data is a logistic

61
regression (Field, 2009). Furthermore, measuring use as a likelihood instead of a specific
value appears to be more interesting in the context of this study and represents another
worthwhile attribute of the logistic regression as described by Field (2009), “In logistic
regression, instead of predicting the value of a variable Y from a predictor variable X1 or
several predictor variables (Xs), we predict the probability of Y occurring given known values
of X1 (or Xs)” (p. 266). The logistic regression is represented by a general model as follows:
𝑃(𝑦) = 11 + e−(b0+ b1X1i + b2X2i+ … + bkXki)
where:
P(y) = the probability of y occurring;
e = the base of natural logarithms;
b0 = constant;
b1, b2, bk = predictors’ coefficients;
X1, X2, Xk = predictors of the model.
Lastly, as previously noted, the dependent variable in the logistic regression was defined as
the use or nonuse incidence that was verified in the second part of the data collection
instrument, and the predictors were defined as the nine factors associated with use plus six
personal and organizational characteristics of the accounting program administrators and the
programs. All of the variables and their measurements are presented in section 3.4.
3.2.2 Evidence of use
The second part of the data collection instrument was intended to identify whether the
accounting program administrators made any use of the 2006 ENADE evaluation report.
Here, use was defined as the action of simply reading the cited evaluation report. This
definition was used in accordance with the concept of use proposed by Cousins and
Leithwood (1986).
To verify the evidence of use, an objective yes or no question was asked. Depending upon the
answer, the respondents were redirected to one of the two sets of specific questions. The first

62
set was created to explore the most frequent types of use, or even misuse, of the ENADE
evaluation report (people who answered yes), and the second was created to examine the main
reasons for nonuse (people who answered no) among the accounting program administrators.
It is important to highlight that the answers from this section of the data collection instrument
were used as the dependent variable in the logistic regression of the factors associated with
use and as an explanatory variable for the hypothesis test that verified the impact of the use of
the evaluation report on the performance of accounting programs.
3.2.3 Types of use plus misuse scale
The third part of the data collection instrument was a scale that aimed to identify the most
frequent types of use practiced by the accounting program administrators. The statements that
represent the types of use were defined in accordance with Leviton and Hughes’s (1981)
study, which summarized three types of use posteriorly consolidated by the evaluation
utilization literature: (a) conceptual, (b) instrumental, and (c) persuasive.
In addition to these three types of use, the present study was interested in verifying possible
misuse of the ENADE evaluation report. The misuse statements in the scale were developed
primarily based on the definition of misuse proposed by Alkin and Coyle (1988) and on the
description of misuse offered by Stevens and Dial (1994). The study of misuse in this research
is corroborated by Cook, Levinson-Rose and Pollard (1981), who emphasized that studies on
the utilization of evaluation findings would not be complete without the inclusion of aspects
of misuse.
Twenty-one statements and one descriptive question were developed to identify how
accounting program administrators use the ENADE evaluation report. These statements were
presented in a random way to avoid bias in the answers. Table 7 presents the statements
divided by type of use plus misuse.
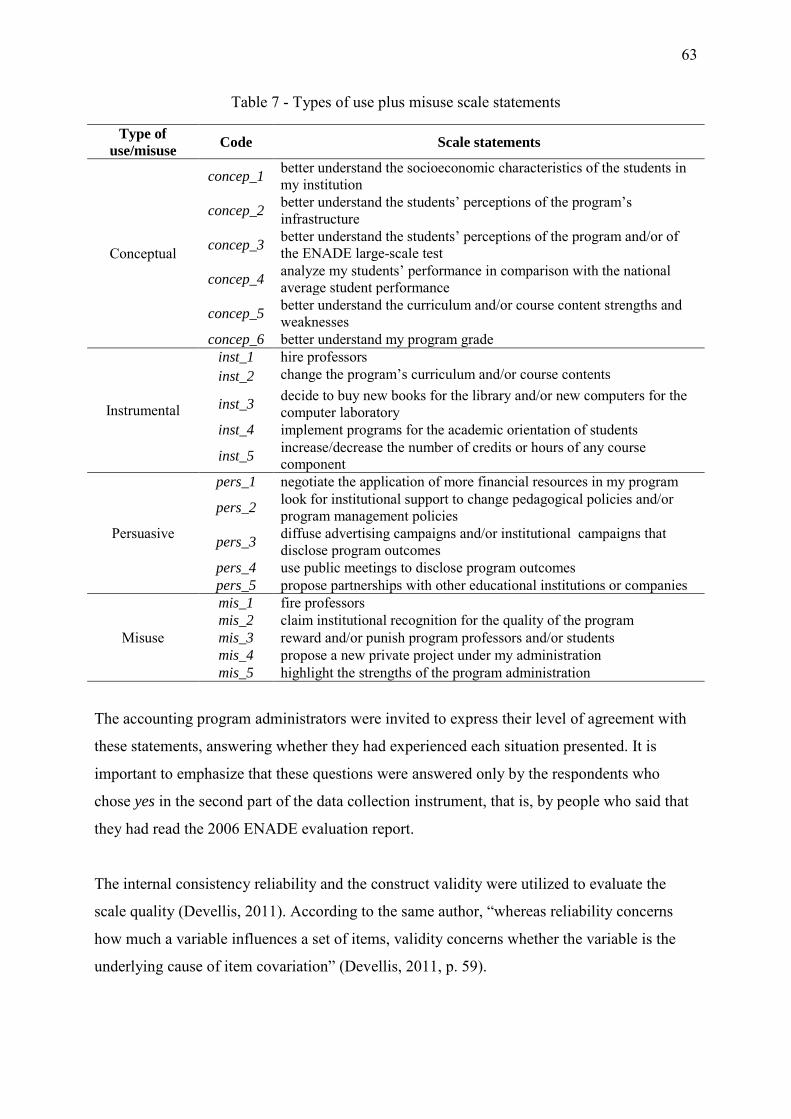
63
Table 7 - Types of use plus misuse scale statements
Type of use/misuse Code Scale statements
Conceptual
concep_1 better understand the socioeconomic characteristics of the students in my institution
concep_2 better understand the students’ perceptions of the program’s infrastructure
concep_3 better understand the students’ perceptions of the program and/or of the ENADE large-scale test
concep_4 analyze my students’ performance in comparison with the national average student performance
concep_5 better understand the curriculum and/or course content strengths and weaknesses
concep_6 better understand my program grade
Instrumental
inst_1 hire professors inst_2 change the program’s curriculum and/or course contents
inst_3 decide to buy new books for the library and/or new computers for the computer laboratory
inst_4 implement programs for the academic orientation of students
inst_5 increase/decrease the number of credits or hours of any course component
Persuasive
pers_1 negotiate the application of more financial resources in my program
pers_2 look for institutional support to change pedagogical policies and/or program management policies
pers_3 diffuse advertising campaigns and/or institutional campaigns that disclose program outcomes
pers_4 use public meetings to disclose program outcomes pers_5 propose partnerships with other educational institutions or companies
Misuse
mis_1 fire professors mis_2 claim institutional recognition for the quality of the program mis_3 reward and/or punish program professors and/or students mis_4 propose a new private project under my administration mis_5 highlight the strengths of the program administration
The accounting program administrators were invited to express their level of agreement with
these statements, answering whether they had experienced each situation presented. It is
important to emphasize that these questions were answered only by the respondents who
chose yes in the second part of the data collection instrument, that is, by people who said that
they had read the 2006 ENADE evaluation report.
The internal consistency reliability and the construct validity were utilized to evaluate the
scale quality (Devellis, 2011). According to the same author, “whereas reliability concerns
how much a variable influences a set of items, validity concerns whether the variable is the
underlying cause of item covariation” (Devellis, 2011, p. 59).
64
The internal consistency reliability was verified through the coefficient alpha (Cronbach,
1951; Netemeyer, Bearden, & Sharma, 2003). Referring to internal consistency, Churchill Jr.
(1979) stated that “coefficient alpha absolutely should be the first measure one calculates to
assess the quality of the instrument” (p. 68). In addition, to establish the construct validity, the
measurement of convergent validity and discriminant validity was required (Campbell &
Fiske, 1959; Churchill Jr., 1979).
The confirmatory factor analysis (CFA) enables the test of convergent and discriminant
validity (Steenkamp & Van Trijp, 1991). For the CFA, the number of factors, the factor
structure and the relationships between factors are defined by the researcher based on the
theories that support the study. Therefore, the objective of the CFA is to determine whether
the hypothesized model is corroborated by the data collected (Netemeyer et al., 2003; Sharma,
1996).
Partial least squares path modeling (PLS-PM) was chosen as the estimator of the CFA
because its indicators are weighted to optimize the prediction of relationships among latent
variables, and it estimates the direct and indirect effects between factors (Kline, 2011).
Through the CFA, it was possible to assess Cronbach’s alpha, the factor loadings, the cross-
factor correlations, and the average variances extracted (AVE), which are the components of
the convergent and discriminant validities, and the reliability tests. In addition, the factor
scores, or latent variable scores, generated by the CFA were used as explanatory variables in
the ordinary least squares (OLS) regression that was applied to test whether the utilization of
the ENADE evaluation report impacted the performance of the undergraduate accounting
programs (details are presented in section 3.3).
Lastly, the descriptive question asked the respondents to describe other utilizations that they
had made of the 2006 ENADE evaluation report. Some interesting answers are discussed as
additional analyses in the next chapter (section 4.7.3).
3.2.4 Nonuse reasons
The fourth part of the data collection instrument was dedicated to the respondents who did not
have a chance to read the ENADE evaluation report (those who answered no in the incidence
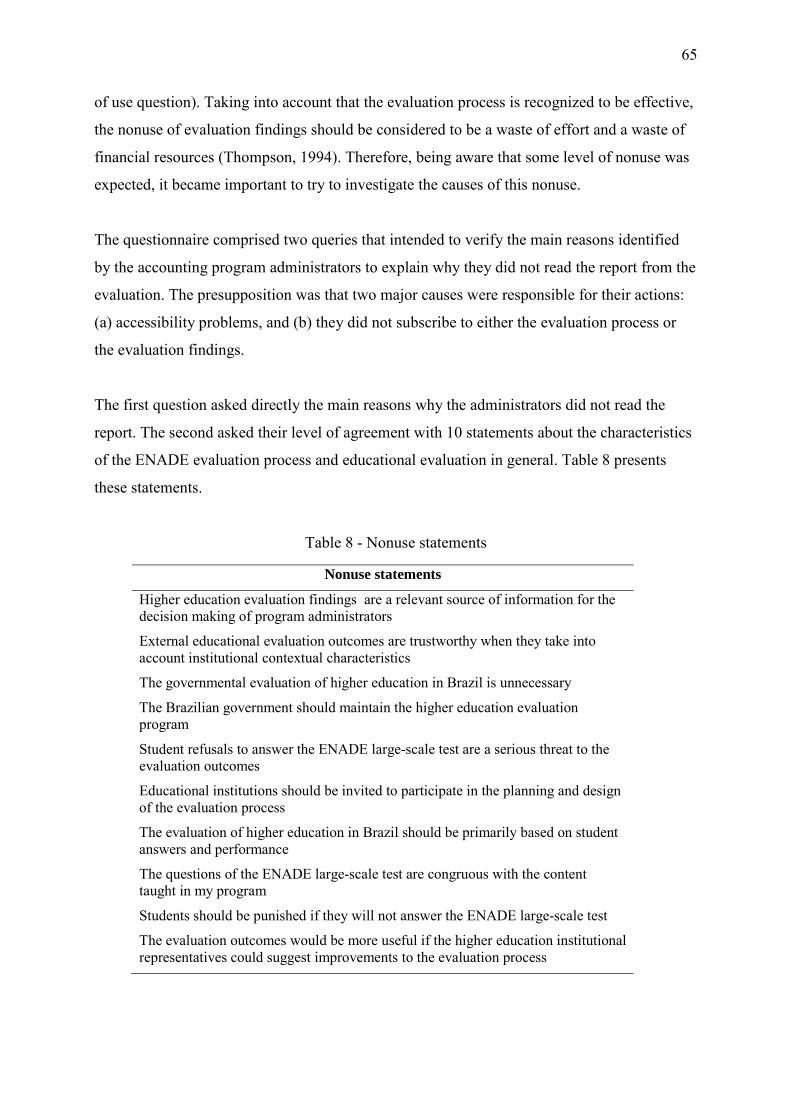
65
of use question). Taking into account that the evaluation process is recognized to be effective,
the nonuse of evaluation findings should be considered to be a waste of effort and a waste of
financial resources (Thompson, 1994). Therefore, being aware that some level of nonuse was
expected, it became important to try to investigate the causes of this nonuse.
The questionnaire comprised two queries that intended to verify the main reasons identified
by the accounting program administrators to explain why they did not read the report from the
evaluation. The presupposition was that two major causes were responsible for their actions:
(a) accessibility problems, and (b) they did not subscribe to either the evaluation process or
the evaluation findings.
The first question asked directly the main reasons why the administrators did not read the
report. The second asked their level of agreement with 10 statements about the characteristics
of the ENADE evaluation process and educational evaluation in general. Table 8 presents
these statements.
Table 8 - Nonuse statements
Nonuse statements Higher education evaluation findings are a relevant source of information for the decision making of program administrators
External educational evaluation outcomes are trustworthy when they take into account institutional contextual characteristics
The governmental evaluation of higher education in Brazil is unnecessary
The Brazilian government should maintain the higher education evaluation program
Student refusals to answer the ENADE large-scale test are a serious threat to the evaluation outcomes
Educational institutions should be invited to participate in the planning and design of the evaluation process
The evaluation of higher education in Brazil should be primarily based on student answers and performance
The questions of the ENADE large-scale test are congruous with the content taught in my program
Students should be punished if they will not answer the ENADE large-scale test
The evaluation outcomes would be more useful if the higher education institutional representatives could suggest improvements to the evaluation process

66
Answers from both questions were descriptively analyzed, and possible explanations for
evaluation nonuse were gathered to provide information that could be used to reduce the
ENADE nonuse occurrence among program administrators.
3.2.5 Demographic information
The fifth and last part of the data collection instrument was designed to obtain demographic
information from the respondents. This section was comprised of three questions about the
accounting program administrators’ personal characteristics and one opinion question. The
first three questions asked the respondents their gender, their highest degree obtained, and
how long they had been in the program administration position. The fourth question asked
their opinion regarding the full availability of the ENADE evaluation report. The objective of
this last question was to determine what the accounting program administrators thought about
the fact that anyone can access their institutional evaluation reports.
Other descriptive information was obtained from the database provided by the INEP about the
ENADE, such as the Brazilian region where each institution is located (north; northeast; west-
center; south; and southeast), the institutional academic organization (university; university
center; college; and federal institute of education, science and technology), and the
institutional main funding source (public; and private).
The first three questions on the demographic information questionnaire and the institutional
data provided by the INEP were used as explanatory variables in the logistic regression (in the
study of the factors associated with the use of the evaluation report) and in the ordinary least
squares regression (in the study of the impact of evaluation utilization on the performance of
accounting programs).
3.3 The study hypotheses
After verifying the factors that were associated with the use of the ENADE evaluation report,
the incidence of use, the types of use, and why some accounting program administrators did

67
not use the report, the final analysis investigated the consequences of evaluation utilization.
Hatry, Wholey and Newcomer (2010) stated that “…a major purpose of most program
evaluations should be to provide information that helps to improve programs and services, not
solely to save money” (p. 672). Hence, to obtain a complete view about the ENADE report
use, it was important to verify the impact of report utilization on the accounting programs’
performance. Although the present study is primarily exploratory, three hypotheses were
formulated regarding the impact of report use.
According to the evaluation utilization literature, the use of evaluation findings can improve
programs (Dawson & D'amico, 1985; Patton, 2008; Wholey, 1981). Based on this
assumption, it is reasonable to expect that the undergraduate accounting programs where the
administrators used the 2006 ENADE evaluation report would present a better result in the
2009 evaluation than the programs that did not use the report. Therefore, a positive correlation
between the use of the 2006 ENADE evaluation report and the programs’ outcomes in the
2009 ENADE evaluation was expected.
Aiming to verify whether the utilization of the evaluation report impacted the accounting
programs’ performance, three hypotheses were developed:
H1: There is a positive correlation between the use of the ENADE evaluation report and
the performance of the undergraduate accounting programs.
H2: There is a positive correlation between the intensity of use of the ENADE evaluation
report and the performance of the undergraduate accounting programs.
H3: There is a positive correlation between at least one type of use of the ENADE
evaluation report and the performance of the undergraduate accounting programs.
Inasmuch as the individual and group effects of more than two independent variables on a
dependent variable needed to be analyzed, multiple OLS regressions were applied based on
the regression general model (Pedhazur, 1997):
Y = β0 + β1X1 + β2X2 +...+ βkXk + ε where:
68
Y = the dependent or outcome variable;
β0 = the intercept of the model;
β1, β 2, β k = the predictors’ coefficients;
X1, X2, Xk = the predictors of the model;
ε = the error, or residual.
The dependent variable was the same in the tests of each of the three hypotheses, namely, the
grade achieved by the accounting programs in the 2009 ENADE evaluation9. However, a
different measure of evaluation utilization from the data collection instrument was applied to
each regression defined to test the three hypotheses. In addition, other covariates were added
to the models according to previous studies on the factors associated with the performance of
undergraduate programs in Brazil. The intention was to test whether the evaluation utilization
predictor variable would make a significant contribution to the model after it was added.
Considering that the models correspond to the classical linear regression, the OLS estimator
choice can be justified by its remarkable popularity as the best linear unbiased estimator
(Kennedy, 2008).
3.4 The study variables and measurements
This research intended to apply different analyses to achieve its objective to better understand
the extent to which the ENADE evaluation reports are utilized by the undergraduate
accounting program administrators. Among the analyses proposed, a logistic regression and
the OLS regressions were designed to study the factors associated with evaluation use and the
impact of using the evaluation report on the accounting programs’ performance, respectively.
The logistic regression variables were primarily based on the studies of Shulha and Cousins
(1997) and Cousins and Leithwood (1986), and the OLS regression variables were primarily
based on the studies of Diaz (2007), Moreira (2010), and Santos (2012). In addition, the
program administrator highest degree variable was also tested in the OLS regressions with an
9 The grade achieved by the undergraduate programs in the ENADE evaluation used in this research was the continuum value of the programs’ preliminary grade (CPC).

69
exploratory intent because of the relevance of the professors’ degree variable in previous
studies (Diaz, 2007; Gracioso, 2006; Moreira, 2010; and Santos, 2012). Two data sources
were utilized to gather all of the variables tested in this research: (a) the data collection
instrument, and (b) the 2009 ENADE evaluation database provided by the INEP.
From the data collection instrument, the variables related to the accounting program
administrators’ perceptions of the ENADE evaluation, their personal characteristics, and their
evaluation use were obtained. Table 9 presents the data collection instrument variables plus
their descriptions, measurements, and an indication about the regression in which each
variable was applied.
Table 9 - Description of the data collection instrument variables
Variable Description Measure Regression
relev Perception of the relevance of the ENADE evaluation
Grade ranging from 1 (lowest) to 5 (highest) Logistic
credib Perception of the Ministry of Educations’ credibility as an evaluator
Grade ranging from 1 (lowest) to 5 (highest) Logistic
communic Perception of the effectiveness of the communication process between INEP and the program
Grade ranging from 1 (lowest) to 5 (highest) Logistic
rep_ava Perception of the suitability of the elapsed time between the ENADE evaluation and the report availability
Grade ranging from 1 (lowest) to 5 (highest) Logistic
loc_charac Perception of the importance given to the program’s local characteristics
Grade ranging from 1 (lowest) to 5 (highest) Logistic
involv Accounting program administrator level of involvement in the 2006 ENADE evaluation
Scale ranging from 1 (none) to 5 (very high) Logistic
manag_tool Perception of the ENADE as an important management tool
Scale ranging from 1 (strongly disagree) to 5 (strongly agree)
Logistic
imp_qua Perception of the quality of the ENADE evaluation implementation
Scale ranging from 1 (very bad) to 5 (very good)
Logistic
sup_dec Perception of the potential of the ENADE report to support a decision making process
Scale ranging from 1 (strongly disagree) to 5 (strongly agree)
Logistic
use* Incidence of evaluation use through the reading of the 2006 ENADE evaluation report
Binary in which 1 means use and 0 means nonuse
Logistic and OLS
concep Conceptual type of use Factor score OLS
(table continues)

70
inst Instrumental type of use Factor score OLS
pers Persuasive type of use Factor score OLS
mis Misuse of the evaluation report Factor score OLS
use_int Intensity of the ENADE evaluation report use
Sum of the conceptual, instrumental and persuasive factor scores
OLS
pos_time Tenure of the administrator in the position Scale ranging from 1 (less than one year) to 4 (six or more years)
Logistic
gender Accounting program administrator gender Binary in which 1 means male and 0 means female
Logistic
hig_deg Highest degree obtained by the accounting program administrator
Scale ranging from 1 (bachelor) to 4 (doctorate)
Logistic and OLS
Note. OLS = ordinary least squares. *Outcome variable in the logistic regression.
The INEP provided the second data source utilized in this research. The INEP database
contained the data related to the 2009 ENADE evaluation. Table 10 presents the variables
tested in this study plus their descriptions and measurements and an indication about the
regression in which each variable was applied.
Table 10 - Description of the 2009 ENADE database variables
Variable Description Measure Regression
cpc_cont* Grades obtained by the undergraduate accounting programs in the evaluation10
Continuum ranging from 0 to 5 OLS
adm_dep Undergraduate accounting programs’ main funding source
Binary in which 1 means private and 0 means public
Logistic and OLS
college Undergraduate accounting programs’ academic organization – college
Binary in which 1 means college and 0 means otherwise
Logistic and OLS
fiest Undergraduate accounting programs’ academic organization – federal institute of education, science and technology
Binary in which 1 means federal institute of education, science and technology and 0 means otherwise
Logistic and OLS
univ_cent Undergraduate accounting programs’ academic organization – university center
Binary in which 1 means university center and 0 means otherwise
Logistic and OLS
10 For more information on the calculus of the programs’ grades, as measured through the CPC, see section 2.3.1 The Brazilian program of higher education evaluation in Chapter II.
(table continues)

71
univ Undergraduate accounting programs’ academic organization – university
Binary in which 1 means university and 0 means otherwise
Logistic and OLS
north Brazilian region where the undergraduate accounting program is located – north
Binary in which 1 means north and 0 means otherwise
Logistic and OLS
west-center Brazilian region where the undergraduate accounting program is located – west-center
Binary in which 1 means west-center and 0 means otherwise
Logistic and OLS
northeast Brazilian region where the undergraduate accounting program is located – northeast
Binary in which 1 means northeast and 0 means otherwise
Logistic and OLS
southeast Brazilian region where the undergraduate accounting program is located – southeast
Binary in which 1 means southeast and 0 means otherwise
Logistic and OLS
south Brazilian region where the undergraduate accounting program is located – south
Binary in which 1 means south and 0 means otherwise
Logistic and OLS
Note. OLS = ordinary least squares. *Outcome variable in the OLS regressions.
It is important to highlight that the INEP did not release the full version11 of the 2009 ENADE
database until June of 2012. Thus, other possible variables related to the factors associated
with use or the predictors of the programs’ performance were not included in the models.
3.5 The study population and sample
The study population consisted of the Brazilian undergraduate accounting programs that
participated and obtained a grade in the National Exam of Students’ Performance in both the
2006 and 2009 editions. From the first edition (2006), the grades were not relevant, but only
the programs with grades had a complete evaluation report available. From the second edition
(2009), the grades were used as the dependent variable in the regression models. It is
important to highlight that a different methodology was used to measure the grades in each
edition, which is why no comparison was made of the two grades.
A total of 772 undergraduate accounting programs were evaluated in the 2006 ENADE, but
only 570 obtained a grade12 and consequently had an evaluation report available. From the 11 The 2009 ENADE microdata.

72
570 accounting programs evaluated in 2006, only 518 were evaluated with grades in 2009 and
currently continue their operations. Therefore, this study population was equal to 518
undergraduate accounting programs, as shown in Figure 2.
Figure 2. Study population.
The study subjects were the current undergraduate accounting program administrators from
the 518 institutions researched. The program administrators are responsible for the academic
management of educational programs and can be considered to be one of the parties who are
the most interested in the evaluation results.
A power analysis conducted through the freeware G*Power 3.1 established the minimal
sample size for this study. The estimation of the sample size based on the power analysis
requires a priori definitions of the statistical power and the effect size desirables. Ellis (2010)
stated that “statistical power describes the probability that a test will correctly identify a
genuine effect” (p. 52). The same author explained that “an effect size refers to the magnitude
of the result as it occurs, or would be found, in the population” (Ellis, 2010, p. 4). In addition
to the statistical power and effect size, other necessary variables to estimate the sample size
include the alpha significance level and the study population.
The study population was known. The further parameters were defined according to Cohen
(1988), who suggested for the a priori values for the definition of the sample size, when
previous research measures are not available, a statistical power of 0.8, a medium effect size,
and an alpha significance level of 0.5. Using these standards, the minimal sample size found
for this study was 131 respondents, which is approximately 25% of the population studied. 12 At least two senior students must take the test for a program to receive a grade.

73
3.6 The study pilot test
Before the application of the data collection instrument, a pretest was performed with 33
former accounting program administrators to generate feedback on the statements’
comprehensibility, answer timing and feasibility. To generate the feedback from the pretest
volunteers, a text box was added after each question on the data collection instrument, and a
question asked for opinions, suggestions and any comments about the clarity of the wording.
The pilot ran from October 10th, 2011, to November 16th, 2011. The volunteers were
contacted by email, and the majority were doctorate students who had been in a program
administration position in the past. These respondents answered the web-based survey and
tested the data collection process. The average time to complete the survey was nine minutes.
Aside from the textual feedback on the web survey form, additional comments from the
experience were gathered through informal conversations with colleagues who participated in
the pilot. Although the information, questions and statements of the survey were considered to
be perfectly understandable for the majority of respondents, some adjustments to the
statements were made based on the suggestions received to improve their clarity.

74

75
CHAPTER IV
RESULTS
The extent to which the ENADE evaluation report is used by accounting program
administrators is explored in this chapter through the presentation of the data collection
results, the factors associated with evaluation use, the most frequent types of use, the impacts
of evaluation use on the programs’ performance and some additional analyses.
4.1 Data collection
The data collection occurred from December 2011 to April 2012. This interval covered two
months of academic recess, January and February, and the ending and the beginning of the
academic semesters, which explains why almost five months were needed to conclude this
phase of the research.
Prior to sending the invitation letter to the programs studied (see Appendix C for a copy of the
invitation letter to the accounting program administrators), a web search was conducted to
find the names, emails and institutional telephone numbers of the accounting program
administrators using the name of each institution from the INEP database. If any of this
information was not available on the institutional website, the program was contacted by
phone.
The entire study population of 518 undergraduate accounting program administrators was
invited to participate in this research, and some strategies were adopted to increase the
response rate. First, a personal invitation to each program administrator was made by email.
This message provided the survey and the web link and informed the respondents that they
would be entered in a raffle for a best-selling financial accounting book if they completed the
survey. The message was sent twice. Any administrators who did not answer the
questionnaire were contacted by phone at their educational institutions, and a new invitation
was sent to them by email.

76
A total of 359 surveys were received. From these surveys, 326 were completed, a 63%
response rate. The 33 incomplete responses were excluded from all analyses because they did
not present an answer to the second part of the data collection instrument, that is, the
incidence of use, which was fundamental information for the statistical tests. Thus, only the
completed surveys were utilized. Table 11 details the response rate for the completed surveys
by Brazilian region.
Table 11 - Response rate for completed surveys by Brazilian region
Research population
Completed surveys
% of surveys
completed
North 30 20 67
% of total 5.8% 6.1% West-Center 68 40
59 % of total 13.1% 12.2% Northeast 91 56
62 % of total 17.6% 17.2%
Southeast 204 127 62
% of total 39.4% 39.0%
South 125 83 66
% of total 24.1% 25.5%
Total 518 326 63
% of total 100.0% 100.0%
After examining the data and the regression outcomes, it was possible to identify the outliers
among the institutions’ respondents. Four surveys were identified to be outliers and were
excluded from all analyses. These surveys presented a standardized residual greater than three
standard deviations from the mean standardized residual score and caused a heteroscedasticity
problem. After the exclusion of the four outliers, two from west-central and two from
southeastern institutions, no heteroscedasticity was verified in the multiple regressions.
Therefore, the final sample was comprised of 322 institutions, 20 from the north, 38 from the
west-central region, 56 from the northeast, 125 from the southeast and 83 from the south of
Brazil.

77
4.2 Demographics
Before proceeding to the main analyses, it was important to know the demographic and
descriptive aspects of the group studied, which were captured by three personal characteristics
of the accounting program administrators and three institutional characteristics of the
accounting programs. Because this research primarily aimed to study the use of the ENADE
report, all of the characteristics were related to the incidence of use verified by the second part
of the data collection instrument. Thus, it was possible to analyze the prevalence of evaluation
report use or nonuse based on the particular characteristics. Table 12 presents the gender
statistics for the undergraduate accounting program administrators who completed the data
collection instrument.
Table 12 - Gender versus use or nonuse
GENDER
Total Female Male
USE
No Count 40 86 126 % within gender 42.1% 37.9% 39.1%
Yes Count 55 141 196 % within gender 57.9% 62.1% 60.9%
Total Count 95 227 322
% within gender 100.0% 100.0% 100.0%
As can be inferred from Table 12, 70.5% of the respondents were men; thus, male was the
most frequent gender among the accounting program administrators researched. Regarding
the use of the 2006 ENADE evaluation report, approximately 61% of the respondents
affirmed that they used it by stating that they read the report. The proportion of use among
men was 62%, and 58% among women, according to the data gathered. Table 13 describes
the highest degree among the program administrators.

78
Table 13 - Highest degree versus use or nonuse
HIGHEST DEGREE
Total Bachelor Specialization Master’s Doctorate U
SE
No Count 3 43 69 11 126 % within highest degree 100.0% 52.4% 33.0% 39.3% 39.1%
Yes Count 0 39 140 17 196 % within highest degree 0% 47.6% 67.0% 60.7% 60.9%
Total Count 3 82 209 28 322
% within highest degree 100.0% 100.0% 100.0% 100.0% 100.0%
Table 13 shows that a master’s degree was the highest degree obtained by the majority of the
accounting program administrators researched. This finding can potentially be explained by
the small number of accounting doctors in the country, despite the ongoing expansion of
accounting graduation programs in Brazil (Miranda, 2011). Another interesting finding is a
possible association between the highest degree obtained and the use of the 2006 ENADE
evaluation report. As shown in Table 13, the frequency of nonuse within the accounting
programs’ administrators is higher than that of use among those with bachelor’s degrees and
specialists. The majority of the administrators with master’s (67%) and doctorate (61%)
degrees are in the users group. Table 14 shows how long the respondents were in their
administrative position.
Table 14 - Position tenure for accounting program administrators versus use or nonuse
POSITION TENURE Less
than one year
Between one and
three years
More than three and less than six years
Six or more years
Total
USE
No Count 33 56 27 10 126 % within position tenure 71.7% 59.6% 29.0% 11.2% 39.1%
Yes Count 13 38 66 79 196 % within position tenure 28.3% 40.4% 71.0% 88.8% 60.9%
Total Count 46 94 93 89 322
% within position tenure 100.0% 100.0% 100.0% 100.0% 100.0%
In most of the cases (57%), the respondents were in their administrative position for over
three years, which means that they were involved in at least one ENADE evaluation process,

79
inasmuch as the answers were collected between December 2011 and April 2012 and the
previous evaluation occurred in 2009. Previous studies have reported that the involvement of
the users in the evaluation process tends to strengthen the use of evaluation information
(Dawson & D'amico, 1985; Greene, 1988b; Roseland, 2011). It is important to highlight that
approximately 28% of the people researched were the program administrators when the 2006
ENADE evaluation was completed. Table 14 also indicated a possible association between
the number of years in the program administration position and the use of evaluation findings
because the nonuse rate progressively decreased as the number of years increased: for less
than one year (72%), between one and three years (60%), more than three and fewer than six
years (29%), and six or more years (11%).
The tables below present some of the characteristics of the educational institutions and their
relationship with the use or nonuse of the 2006 ENADE evaluation report by the accounting
program administrators. Table 15 presents the institutional main funding source by frequency
of use.
Table 15 - Main funding source versus use or nonuse
USE
MAIN FUNDING
SOURCE Total Public Private
No Count 36 90 126 % within main funding source 61.0% 34.2% 39.1%
Yes Count 23 173 196 % within main funding source 39.0% 65.8% 60.9%
Total Count 59 263 322
% within main funding source 100.0% 100.0% 100.0%
Table 15 demonstrates that the majority of the undergraduate accounting programs studied
(81.7%) were private institutions, and the incidence of use among their program
administrators was more frequent than that of their colleagues from the public institutions. In
fact, nonuse was more common (61%) than use among the program administrators of public
institutions. A possible explanation for this outcome is the policy of regular succession of
professors to the program administration position; this policy has been established in public
higher education institutions that, in many cases, also limit the maximum number of
consecutive years that a professor can stay in that position, usually to four years. In an effort

80
to verify this supposition, Table 16 was developed to match the main funding source with the
position tenure and the use incidence of the respondents from public institutions.
Table 16 - Main funding source and position tenure versus use or nonuse in public institutions
POSITION TENURE Less
than one year
Between one and
three years
More than three and
less than six years
Six or more years
Total
PUB
LIC
USE
No Count 7 20 9 0 36 % within position tenure 77.8% 66.7% 56.3% 0% 61.0%
Yes Count 2 10 7 4 23 % within position tenure 22.2% 33.3% 43.8% 100.0% 39.0%
Total Count 9 30 16 4 59
% within position tenure 100.0% 100.0% 100.0% 100.0% 100.0%
As Table 16 shows, nonuse grows progressively less common as the number of years on the
job increases, but the majority (66.1%) of the program administrators had held the position for
fewer than three years. The opposite situation was verified among the private institutions, as
presented in Table 17.
Table 17 - Main funding source and position tenure versus use or nonuse in private institutions
POSITION TENURE Less
than one year
Between one and
three years
More than three and
less than six years
Six or more years
Total
PRIV
AT
E
USE
No Count 26 36 18 10 90 % within position tenure 70.3% 56.3% 23.4% 11.8% 34.2%
Yes Count 11 28 59 75 173 % within position tenure 29.7% 43.8% 76.6% 88.2% 65.8%
Total Count 37 64 77 85 263
% within position tenure 100.0% 100.0% 100.0% 100.0% 100.0%
Among the undergraduate accounting programs at the private institutions studied, most of the
program administrators (61.6%) had held the position for over three years, and the same

81
progressive reduction of the nonuse incidence was verified. Hence, a previous analysis of the
data from both public and private institutions suggests that retaining the same administrator
longer in the position could increase the chance that the evaluation report would be used in
the group researched. Table 18 presents the academic organization of the institutions and its
relationship with the incidence of use or nonuse.
Table 18 - Academic organization versus use or nonuse
ACADEMIC ORGANIZATION Federal
institute of education, science and technology
College University center University Total
USE
No Count 0 61 19 46 126 % within academic organization 0% 40.7% 36.5% 38.7% 39.1%
Yes Count 1 89 33 73 196 % within academic organization 100.0% 59.3% 63.5% 61.3% 60.9%
Total Count 1 150 52 119 322
% within academic organization 100.0% 100.0% 100.0% 100.0% 100.0%
College was the most common academic organization among the accounting programs
studied (46.6%), followed by universities (37%). Regarding the use of the 2006 ENADE
evaluation report, all types of academic organizations presented a higher incidence of use than
nonuse. Excluding the federal institute of education, science and technology because it was
comprised of only one institution, the university centers presented a proportionally highest
incidence of use (63.5%) among the programs studied. Table 19 shows the institutions’
respondents divided into Brazilian regions and related to the use incidence.

82
Table 19 - Brazilian region versus use or nonuse
BRAZILIAN REGIONS
North West-center Northeast Southeast South Total
USE
No Count 9 21 26 39 31 126 % within Brazilian region 45.0% 55.3% 46.4% 31.2% 37.3% 39.1%
Yes Count 11 17 30 86 52 196 % within Brazilian region 55.0% 44.7% 53.6% 68.8% 62.7% 60.9%
Total Count 20 38 56 125 83 322
% within Brazilian region 100.0% 100.0% 100.0% 100.0% 100.0% 100.0%
Following the frequency of institutions in the study population (see Table 11), the southeast
of Brazil was the region with the highest number of respondents (38.8%) in the sample. The
same region also presented the highest proportional incidence of use of the 2006 ENADE
evaluation report (68.8%) by its institutions, followed by the south (62.7%), north (55%) and
northeast (53.6%). The west-central region was the only region where the incidence of nonuse
(55.3%) was higher than that of use. According to the previous tables, a possible explanation
for this outcome in the west-central region is the position tenure and the highest degree of
their program administrators. Tables 20 and 21 connect these variables to verify whether this
possible explanation is corroborated by the data.
Table 20 - Position tenure versus use or nonuse of west-center institutions
POSITION TENURE Less
than one year
Between one and
three years
More than three and less than six years
Six or more years
Total
WE
ST-C
EN
TE
R
USE
No Count 5 11 4 1 21 % within position tenure 83.3% 73.3% 57.1% 10.0% 55.3%
Yes Count 1 4 3 9 17 % within position tenure 16.7% 26.7% 42.9% 90.0% 44.7%
Total Count 6 15 7 10 38 % within position tenure 100.0% 100.0% 100.0% 100.0% 100.0%

83
Table 21 - Highest degree versus use or nonuse of west-center institutions
HIGHEST DEGREE Specialization Master’s Doctorate Total
WE
ST-C
EN
TE
R
USE
No Count 11 10 0 21
% within highest degree 55.0% 58.8% 0% 55.3%
Yes Count 9 7 1 17 % within highest degree 45.0% 41.2% 100.0% 44.7%
Total Count 20 17 1 38
% within highest degree 100.0% 100.0% 100.0% 100.0%
Tables 20 and 21 show that the majority of accounting program administrators from the
institutions researched in the west-central region had fewer than three years in their position
(55.3%) and had a specialization degree (52.6%). Thus, the data suggest that the higher
nonuse incidence verified in that region can be partially explained by these characteristics of
their program administrators. However, the real significance of these variables to the
incidence of use of the 2006 ENADE evaluation report is tested through the logistic
regression below.
4.3 Factors associated with evaluation use
As part of the analysis on evaluation use by undergraduate accounting program
administrators, this research verified the factors associated with the ENADE report use
through a logistic regression. As presented in Table 9, the outcome variable was the use or
nonuse as captured by the second section of the data collection instrument. The explanatory
variables were some perceptions and attributes of the program administrators and some
characteristics of the undergraduate accounting programs, as follows: (a) program
administrators’ perceptions of the ENADE (relevance, credibility, communication, report
availability, local characteristics, involvement, management tool, implementation quality, and
support decision), (b) attributes of the program administrators (tenure in the administrative
position, gender, and highest degree), and (c) characteristics of the programs (main funding
source, academic organization, and Brazilian region).

84
The logistic regression analysis was carried out in PASW Statistics 17.0. Due to the
exploratory character of this analysis and because no similar prior Brazilian research
indicating potential predictive variables could be found, a forward stepwise (Likelihood
Ratio) model selection was chosen. Thus, Table 22 presents the statistically significant
variables to predict the use of the 2006 ENADE evaluation report among the programs
researched.
Table 22 - Factors associated with the ENADE evaluation report use
B SE Wald p-valor Exp(B)
pos_time 0.895 0.161 30.959 0.000 2.45
hig_deg 0.780 0.247 9.981 0.002 2.18
adm_dep(1) 0.793 0.357 4.918 0.027 2.21
communic 0.439 0.135 10.554 0.001 1.55
involve 0.412 0.105 15.400 0.000 1.51
constant -7.118 1.086 42.978 0.000 0.001
Chi-square = 117.95 (df = 5); p < .000
-2 Log likelihood = 313.09
Nagelkerke R2 = 0.416
Note. N = 322. communic = communication; involv = involvement; pos_time = tenure of the administrator in the position; hig_deg = highest degree; adm_dep = main funding source. (1) = private institutions.
The test of the full model presented a statistically significant contribution when compared
with the constant-only model (chi-square = 117.95, p < .000 with df = 5), indicating that the
predictors as a set reliably distinguished between the users and nonusers of the 2006 ENADE
evaluation report.
As shown in Table 22, the statistically significant variable that made the greatest contribution
to predicting the 2006 ENADE evaluation use was tenure of the administrator in the position
(Wald = 30.96), followed by, in descending order, involvement in the 2006 ENADE (Wald =
15.40), communication (Wald = 10.55), highest degree (Wald = 9.98), and main funding
source (Wald = 4.92). It is important to highlight that the statistics for this last variable refer
to private institutions because they were assigned code 1 in the database (see Table 10).
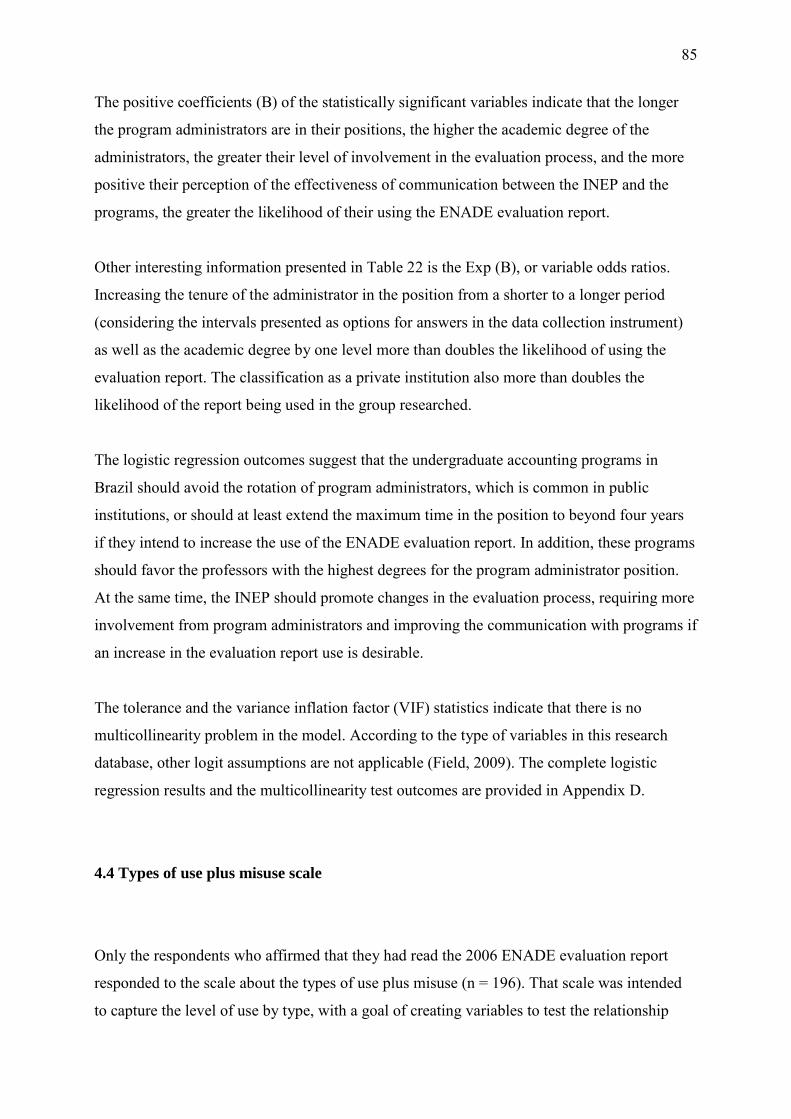
85
The positive coefficients (B) of the statistically significant variables indicate that the longer
the program administrators are in their positions, the higher the academic degree of the
administrators, the greater their level of involvement in the evaluation process, and the more
positive their perception of the effectiveness of communication between the INEP and the
programs, the greater the likelihood of their using the ENADE evaluation report.
Other interesting information presented in Table 22 is the Exp (B), or variable odds ratios.
Increasing the tenure of the administrator in the position from a shorter to a longer period
(considering the intervals presented as options for answers in the data collection instrument)
as well as the academic degree by one level more than doubles the likelihood of using the
evaluation report. The classification as a private institution also more than doubles the
likelihood of the report being used in the group researched.
The logistic regression outcomes suggest that the undergraduate accounting programs in
Brazil should avoid the rotation of program administrators, which is common in public
institutions, or should at least extend the maximum time in the position to beyond four years
if they intend to increase the use of the ENADE evaluation report. In addition, these programs
should favor the professors with the highest degrees for the program administrator position.
At the same time, the INEP should promote changes in the evaluation process, requiring more
involvement from program administrators and improving the communication with programs if
an increase in the evaluation report use is desirable.
The tolerance and the variance inflation factor (VIF) statistics indicate that there is no
multicollinearity problem in the model. According to the type of variables in this research
database, other logit assumptions are not applicable (Field, 2009). The complete logistic
regression results and the multicollinearity test outcomes are provided in Appendix D.
4.4 Types of use plus misuse scale
Only the respondents who affirmed that they had read the 2006 ENADE evaluation report
responded to the scale about the types of use plus misuse (n = 196). That scale was intended
to capture the level of use by type, with a goal of creating variables to test the relationship
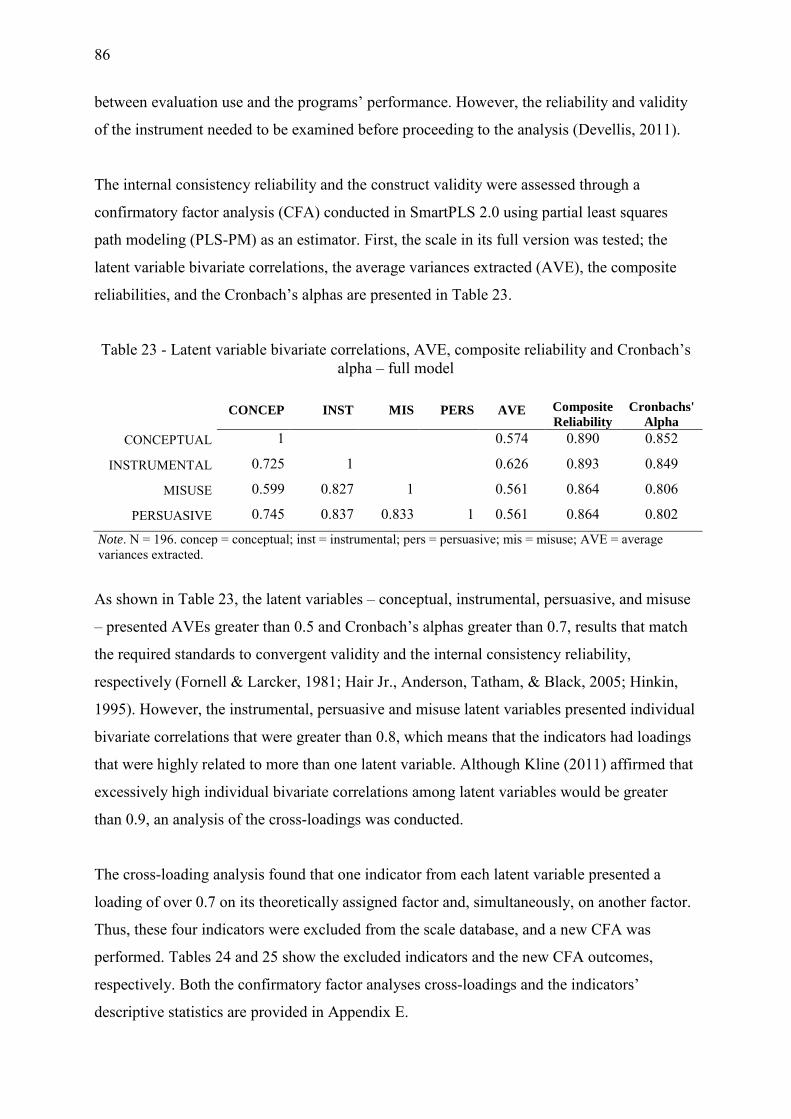
86
between evaluation use and the programs’ performance. However, the reliability and validity
of the instrument needed to be examined before proceeding to the analysis (Devellis, 2011).
The internal consistency reliability and the construct validity were assessed through a
confirmatory factor analysis (CFA) conducted in SmartPLS 2.0 using partial least squares
path modeling (PLS-PM) as an estimator. First, the scale in its full version was tested; the
latent variable bivariate correlations, the average variances extracted (AVE), the composite
reliabilities, and the Cronbach’s alphas are presented in Table 23.
Table 23 - Latent variable bivariate correlations, AVE, composite reliability and Cronbach’s alpha – full model
CONCEP INST MIS PERS AVE Composite
Reliability Cronbachs'
Alpha CONCEPTUAL 1
0.574 0.890 0.852
INSTRUMENTAL 0.725 1
0.626 0.893 0.849
MISUSE 0.599 0.827 1
0.561 0.864 0.806
PERSUASIVE 0.745 0.837 0.833 1 0.561 0.864 0.802
Note. N = 196. concep = conceptual; inst = instrumental; pers = persuasive; mis = misuse; AVE = average variances extracted.
As shown in Table 23, the latent variables – conceptual, instrumental, persuasive, and misuse
– presented AVEs greater than 0.5 and Cronbach’s alphas greater than 0.7, results that match
the required standards to convergent validity and the internal consistency reliability,
respectively (Fornell & Larcker, 1981; Hair Jr., Anderson, Tatham, & Black, 2005; Hinkin,
1995). However, the instrumental, persuasive and misuse latent variables presented individual
bivariate correlations that were greater than 0.8, which means that the indicators had loadings
that were highly related to more than one latent variable. Although Kline (2011) affirmed that
excessively high individual bivariate correlations among latent variables would be greater
than 0.9, an analysis of the cross-loadings was conducted.
The cross-loading analysis found that one indicator from each latent variable presented a
loading of over 0.7 on its theoretically assigned factor and, simultaneously, on another factor.
Thus, these four indicators were excluded from the scale database, and a new CFA was
performed. Tables 24 and 25 show the excluded indicators and the new CFA outcomes,
respectively. Both the confirmatory factor analyses cross-loadings and the indicators’
descriptive statistics are provided in Appendix E.

87
Table 24 - Scale-excluded indicators
Latent variable Code Scale statement
CONCEPTUAL concep_5 better understand the curriculum and/or course content strengths and weaknesses
INSTRUMENTAL inst_1 hire professors
MISUSE mis_2 claim institutional recognition for the quality of the program
PERSUASIVE pers_2 look for institutional support to change pedagogical policies and/or program management policies
These four indicators were excluded to reduce the correlations between factors and improve
the discriminant power of the latent variables. However, a reduction of the Cronbach alphas
was also expected because they are directly related to the number of indicators in the scale
(Hair Jr. et al., 2005).
Table 25 - Latent variables correlations, AVE, composite reliability and Cronbach’s alpha – reduced model
CONCEP INST MIS PERS AVE Composite
Reliability Cronbachs'
Alpha CONCEPTUAL 0.885 0.606 0.885 0.836
INSTRUMENTAL 0.680 0.896 0.682 0.896 0.845
MISUSE 0.505 0.735 0.856 0.599 0.856 0.778
PERSUASIVE 0.681 0.786 0.771 0.831 0.552 0.831 0.727
Note. N = 196. Diagonal entries are composite reliabilities. concep = conceptual; inst = instrumental; pers = persuasive; mis = misuse; AVE = average variances extracted.
The scale reliability and construct validity were verified using the new CFA outcomes, which
are presented in Table 25. As was expected, there was a reduction in the Cronbach alphas, but
it was not enough to diminish the reliability of the scale. Cronbach’s alpha, which, according
to Hair Jr. et al. (2005), is the most common measure used to evaluate the internal consistency
reliability, indicated reliabilities greater than 0.7, suggesting that the responses were
consistent across the latent variables within the scale.
The construct validity was assessed through the convergent and discriminant validities. The
average variances extracted (AVE) were greater than 0.5, indicating convergent validity
according to Fornell and Larcker (1981); that is, the indicators of each factor were able to
measure its construct. The assessment of the discriminant validity was conducted through a
comparative analysis between the latent variable bivariate correlations and the composite

88
reliabilities (O'cass & Ngo, 2007). Latent variables with composite reliabilities greater than
their bivariate correlations indicate discriminant validity. As shown in Table 25, the
correlations ranged from 0.505 to 0.786, and the reliabilities ranged from 0.831 to 0.896,
suggesting that the indicators were able to differentiate the constructs measured by each latent
variable.
Therefore, the types of use plus misuse scale fulfills its objective of measuring an “attribute or
quality which is not operationally defined” (Cronbach & Meehl, 1955, p. 282) because it
achieves reliability and construct validity. Thus, the latent variable scores from the second
confirmatory factor analysis were utilized in the OLS regressions as estimates of their
constructs, that is, the conceptual, instrumental, and persuasive types of use in addition to
misuse.
It is important to highlight that one persuasive indicator, pers_4, did not achieve the 0.7 factor
loading standard, which may be a cause for caution (Kline, 2011). However, a third CFA was
performed that excluded that indicator, and no significant difference was verified in the
outcomes, which is why it was retained in the analysis. Table 26 presents the descriptive
statistics of the constructs.
Table 26 - Descriptive statistics from the scale constructs
Minimum Maximum Mean
Std. Deviation
Conceptual 5 25 19.31 4.10
Instrumental 4 20 14.23 4.12
Persuasive 4 20 13.28 3.74
Misuse 4 20 10.92 4.04
Note. N = 196.
Table 26 shows that the conceptual type of use indicators received the highest level of use, as
measured through the statement agreements among the respondents, and also presented the
lowest proportional deviation. This preliminary outcome is in accordance with previous
studies that indicated conceptual use, or utilization for enlightenment, as the most common
type of use for evaluation findings (Mccormick, 1997; Shea, 1991; Thompson, 1994). The
persuasive type of use was the least frequent among the accounting program administrators

89
researched. A misuse incidence was also verified among the program administrators. Lastly,
the significance of the types of use on the programs’ performance was tested through the OLS
regressions.
4.5 Hypothesis tests
This research put forward three hypotheses concerning the impacts of evaluation use on the
performance of undergraduate accounting programs. Ordinary least squares regressions were
applied to test these hypotheses using the freeware gretl 1.9.9. The outcome variable in all of
these regressions was the grades achieved by the programs in the 2009 ENADE evaluation.
Table 27 shows the descriptive statistics of the outcome variable.
Table 27 - Descriptive statistics of the outcome variable
Minimum Maximum Mean Std.
Deviation cpc_cont 0.772 4.124 2.270 0.586
Note. N = 322. cpc_cont = programs’ grades.
The explanatory variables were mostly defined from previous research on factors associated
with undergraduate program performance in Brazil (all predictors are presented in Tables 9
and 10). The approach was to add variables related to evaluation use to test whether they
contribute to program performance. These evaluation use variables were created from the data
collection instrument used in this research.
All of the hypotheses were tested in two stages, first using simple regression and second using
multiple regression to verify the outcomes’ robustness. The first hypothesis was there is a
positive correlation between the use of the ENADE evaluation report and the performance of
the undergraduate accounting programs. This first hypothesis tested the variable use. Table
28 presents the results from the simple regression.

90
Table 28 - Relationship between the use of the ENADE evaluation report and the undergraduate accounting programs’ performance
B S.E. t p-valor
const 2.1765 0.0518 41.9950 <0.00001***
use 0.1542 0.0664 2.3216 0.0209**
F = 5.3899
R2 = 0.0166
Note. N = 322. S.E. = standard error. *** p < .001, **p < .05.
The first regression aimed to verify whether the binary variable use alone was sufficient to
predict the programs’ performance. The positive and statistically significant coefficient of the
variable tested indicates that the act of reading the 2006 ENADE evaluation report is
positively correlated with the 2009 evaluation program’s outcome in the group researched.
The low R2 is understandable because it was not assumed that the programs’ grades would
only be explained by the evaluation report use. Additionally, the previous research developed
in Brazil has identified other important variables that are related to the ENADE outcomes.
Some of those variables were added to the model in the next regression to test whether the
variable use would remain statistically significant. Table 29 presents the results from the
second regression.
Table 29 - Relationships between the use of the ENADE evaluation report and the undergraduate accounting programs’ performance with additional control variables
B S.E. t p-valor
const 2.3199 0.1786 12.9904 <0.00001 ***
use 0.1299 0.0594 2.1895 0.0293 **
hig_deg 0.1475 0.0505 2.9207 0.0038 ***
north -0.3443 0.1210 -2.8455 0.0047 ***
northeast -0.2283 0.0824 -2.7720 0.0059 ***
west-center -0.2441 0.0962 -2.5388 0.0116 **
south -0.0039 0.0722 -0.0538 0.9571
univ_cent -0.2098 0.0870 -2.4105 0.0165 **
college -0.4115 0.0681 -6.0446 <0.00001 ***
fiest -0.5278 0.5015 -1.0524 0.2935
adm_dep -0.2762 0.0820 -3.3690 0.0009 ***
F = 14.0068 (table continues)
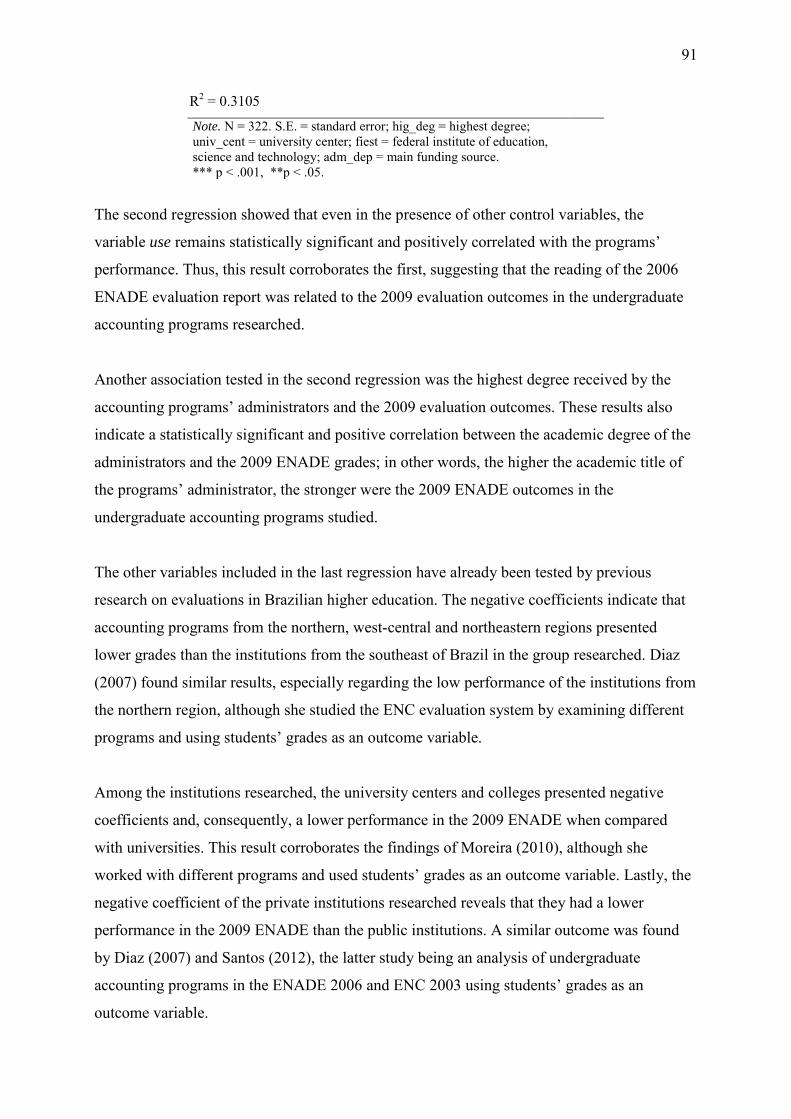
91
R2 = 0.3105
Note. N = 322. S.E. = standard error; hig_deg = highest degree; univ_cent = university center; fiest = federal institute of education, science and technology; adm_dep = main funding source. *** p < .001, **p < .05.
The second regression showed that even in the presence of other control variables, the
variable use remains statistically significant and positively correlated with the programs’
performance. Thus, this result corroborates the first, suggesting that the reading of the 2006
ENADE evaluation report was related to the 2009 evaluation outcomes in the undergraduate
accounting programs researched.
Another association tested in the second regression was the highest degree received by the
accounting programs’ administrators and the 2009 evaluation outcomes. These results also
indicate a statistically significant and positive correlation between the academic degree of the
administrators and the 2009 ENADE grades; in other words, the higher the academic title of
the programs’ administrator, the stronger were the 2009 ENADE outcomes in the
undergraduate accounting programs studied.
The other variables included in the last regression have already been tested by previous
research on evaluations in Brazilian higher education. The negative coefficients indicate that
accounting programs from the northern, west-central and northeastern regions presented
lower grades than the institutions from the southeast of Brazil in the group researched. Diaz
(2007) found similar results, especially regarding the low performance of the institutions from
the northern region, although she studied the ENC evaluation system by examining different
programs and using students’ grades as an outcome variable.
Among the institutions researched, the university centers and colleges presented negative
coefficients and, consequently, a lower performance in the 2009 ENADE when compared
with universities. This result corroborates the findings of Moreira (2010), although she
worked with different programs and used students’ grades as an outcome variable. Lastly, the
negative coefficient of the private institutions researched reveals that they had a lower
performance in the 2009 ENADE than the public institutions. A similar outcome was found
by Diaz (2007) and Santos (2012), the latter study being an analysis of undergraduate
accounting programs in the ENADE 2006 and ENC 2003 using students’ grades as an
outcome variable.

92
Therefore, considering that the program grades used as an outcome variable in this research
included the students’ grades, it is reasonable to compare the current results with the results of
the previous research. The findings of this research appear to be in accordance with those
from other studies on Brazilian higher education evaluation even when an evaluation use
variable is added. It is important to highlight that the regression assumptions were tested for
both regressions, and a non-normal distribution of error terms was identified in the simple
regression. The results of the assumption tests are provided in Appendix F.
The second hypothesis was that there is a positive correlation between the intensity of use of
the ENADE evaluation report and the performance of the undergraduate accounting
programs. In this case, the variable use_int was tested through a simple and a multiple
regression. Table 30 shows the simple regression outcomes.
Table 30 - Relationship between the intensity of the ENADE evaluation report use and the undergraduate accounting programs’ performance
B S.E. t p-valor
const 2.1814 0.0499 43.7417 <0.00001 ***
use_int 0.0136 0.0058 2.3494 0.0194 **
F = 5.5199
R2 = 0.0170
Note. N = 322. S.E. = standard error; use_int = intensity of use. *** p < .001, **p < .05.
The use_int variable measures the intensity of use, that is, the degree of utilization based on
the types of use diversity and volume as indicated by the accounting programs’ administrators
through their agreement level on the scale statements. The coefficient for this variable
indicates that the intensity of the 2006 ENADE evaluation report use is positively correlated
with the 2009 evaluation programs’ outcomes in the group researched. Thus, the greater the
three types of use were verified jointly, the higher programs’ grade. Again, in this case, the
low R2 is understandable because it was not assumed that the programs’ grades would be
explained only by the intensity of the evaluation report use. As in the first hypothesis test,
additional variables were added to the model to test whether the variable use_int would
remain statistically significant. Table 31 presents the results from the multiple regression.

93
Table 31 - The relationship between the intensity of the ENADE evaluation report use and the undergraduate accounting programs’ performance with additional control variables
B S.E. t p-valor
const 2.3210 0.1781 13.0343 <0.00001 ***
use_int 0.0132 0.0051 2.5651 0.0108 **
hig_deg 0.1478 0.0502 2.944 0.0035 ***
north -0.3422 0.1207 -2.8359 0.0049 ***
northeast -0.2301 0.0821 -2.8035 0.0054 ***
west-center -0.2450 0.0958 -2.5578 0.0110 **
south -0.0068 0.0720 -0.0941 0.9251
univ_cent -0.2127 0.0867 -2.4535 0.0147 **
college -0.4114 0.0679 -6.0632 <0.00001 ***
fiest -0.5418 0.5001 -1.0833 0.2795
adm_dep -0.2855 0.0820 -3.4829 0.0006 ***
F = 14.2619
R2 = 0.3144
Note. N = 322. S.E. = standard error; use_int = intensity of use; hig_deg = highest degree; univ_cent = university center; fiest = federal institute of education, science and technology; adm_dep = main funding source. *** p < .001, **p < .05.
As shown in Table 31, the use_int variable coefficient remains statistically significant and
positively correlated with the programs’ performance in the 2009 ENADE evaluation even
when the control variables were included in the model, presenting a slightly greater
contribution (t = 2.5651) to that model than the use variable (t = 2.1895). Therefore, the
intensity of use explained part of the program’s performance variance in the group researched.
When compared to the prior multiple regression, the other variables retain the same signal
direction and almost the same weight in relation to the outcome variable. Hence, the
substitution of the variable use for the variable use_int in the model did not cause significant
changes in the control variables’ results and, consequently, in their regression analyses.
It is important to note that the simple regression presented heteroscedasticity and non-normal
distribution of error terms problems but that in the multiple regression, after the inclusion of
the control variables, these problems were solved. As in the first multiple regression analysis,
there was no multicollinearity among variables verified (see Appendix F for the results of the
regression assumption tests).

94
The last analysis related to the impacts of the evaluation use on the programs’ performance
examined whether the types of use variables were correlated with the programs’ grades. The
third hypothesis tested was that there is a positive correlation between at least one type of use
of the ENADE evaluation report and the performance of the undergraduate accounting
programs. Tables 32, 33, and 34 present the simple regression outcomes for the conceptual,
instrumental and persuasive types of use variables, respectively.
Table 32 - The relationship between the conceptual use of the ENADE evaluation report and the undergraduate accounting programs’ performance
B S.E. t p-valor
const 2.1527 0.0499 43.172 <0.00001 ***
concep 0.0501 0.0162 3.093 0.0022 ***
F = 9.5665
R2 = 0.0290
Note. N = 322. S.E. = standard error; concep = conceptual. *** p < .001.
The conceptual type of use presented a positive and statistically significant (p = 0.0022)
coefficient that was correlated with the programs’ performance. Thus, the fact that the
programs’ administrators had read the 2006 ENADE evaluation report to gather information
about the student’s perceptions and outcomes appears to be positively associated with the
results obtained by the undergraduate accounting programs in the 2009 evaluation,
considering the group researched.
Table 33 - The relationship between the instrumental use of the ENADE evaluation report and the undergraduate accounting programs’ performance
B S.E. t p-valor
const 2.2033 0.0492 44.825 <0.00001 ***
inst 0.0310 0.017 1.8223 0.0693 *
F = 3.3209
R2 = 0.0103
Note. N = 322. S.E. = standard error; inst = instrumental. *** p < .001, **p < .05, and * p < .10.
When compared with the conceptual type of use, the second type of use, instrumental,
presented a positive and statistically less significant (p = 0.0693) coefficient correlated with

95
the undergraduate accounting programs’ performance in the ENADE 2009. This result
indicates that the use of the 2006 ENADE evaluation report to make specific decisions
produced a lower association with the 2009 evaluation outcomes than the use of the report to
learn and better understand the evaluation outcomes.
Table 34 - The relationship between the persuasive use of the ENADE evaluation report and the undergraduate accounting programs’ performance
B S.E. t p-valor
const 2.197 0.0493 44.6059 <0.00001 ***
pers 0.0363 0.0183 1.9831 0.0482 **
F = 3.9325
R2 = 0.0121
Note. N = 322. S.E. = standard error; pers = persuasive. *** p < .001, **p < .05.
As shown in Table 34, the persuasive coefficient was statistically significant (p = 0.0482),
indicating that, among the programs researched, using the 2006 ENADE results politically,
such as to convince others or to reinforce a point of view in a negotiation or discussion, was
positively correlated with the accounting programs’ 2009 evaluation outcomes.
However, all simple regressions related to the types of use presented a non-normal
distribution of error terms, and the instrumental and persuasive regressions also presented a
heteroscedasticity problem. Hence, multiple regressions were performed to test the robustness
of the coefficients found in the simple regressions and to correct the problems related to the
regression assumptions. Due to the multicollinearity that exists among the three types of use
variables, they were not tested together. Table 35 shows the conceptual use variable multiple
regression outcomes.
Table 35 - The relationship between the conceptual use of the ENADE evaluation report and the undergraduate accounting programs’ performance with additional control variables
B S.E. t p-valor
const 2.3200 0.1775 13.0713 <0.00001 ***
concep 0.0426 0.0145 2.9404 0.0035 ***
hig_deg 0.1424 0.0502 2.8380 0.0048 ***
north -0.3410 0.1203 -2.8351 0.0049 ***
(table continues)
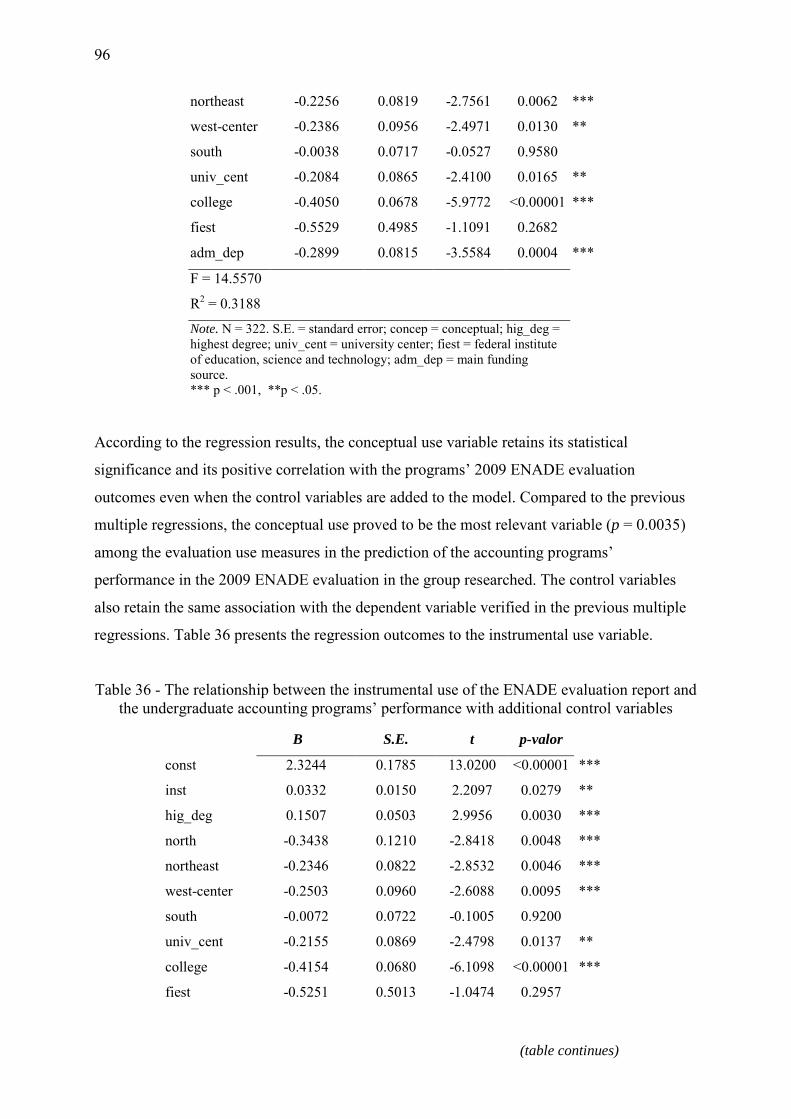
96
northeast -0.2256 0.0819 -2.7561 0.0062 ***
west-center -0.2386 0.0956 -2.4971 0.0130 **
south -0.0038 0.0717 -0.0527 0.9580
univ_cent -0.2084 0.0865 -2.4100 0.0165 **
college -0.4050 0.0678 -5.9772 <0.00001 ***
fiest -0.5529 0.4985 -1.1091 0.2682
adm_dep -0.2899 0.0815 -3.5584 0.0004 ***
F = 14.5570
R2 = 0.3188
Note. N = 322. S.E. = standard error; concep = conceptual; hig_deg = highest degree; univ_cent = university center; fiest = federal institute of education, science and technology; adm_dep = main funding source. *** p < .001, **p < .05.
According to the regression results, the conceptual use variable retains its statistical
significance and its positive correlation with the programs’ 2009 ENADE evaluation
outcomes even when the control variables are added to the model. Compared to the previous
multiple regressions, the conceptual use proved to be the most relevant variable (p = 0.0035)
among the evaluation use measures in the prediction of the accounting programs’
performance in the 2009 ENADE evaluation in the group researched. The control variables
also retain the same association with the dependent variable verified in the previous multiple
regressions. Table 36 presents the regression outcomes to the instrumental use variable.
Table 36 - The relationship between the instrumental use of the ENADE evaluation report and the undergraduate accounting programs’ performance with additional control variables
B S.E. t p-valor
const 2.3244 0.1785 13.0200 <0.00001 ***
inst 0.0332 0.0150 2.2097 0.0279 **
hig_deg 0.1507 0.0503 2.9956 0.0030 ***
north -0.3438 0.1210 -2.8418 0.0048 ***
northeast -0.2346 0.0822 -2.8532 0.0046 ***
west-center -0.2503 0.0960 -2.6088 0.0095 ***
south -0.0072 0.0722 -0.1005 0.9200
univ_cent -0.2155 0.0869 -2.4798 0.0137 **
college -0.4154 0.0680 -6.1098 <0.00001 ***
fiest -0.5251 0.5013 -1.0474 0.2957
(table continues)

97
adm_dep -0.2772 0.0820 -3.3789 0.0008 ***
F = 14.0195
R2 = 0.3107
Note. N = 322. S.E. = standard error; inst = instrumental; hig_deg = highest degree; univ_cent = university center; fiest = federal institute of education, science and technology; adm_dep = main funding source. *** p < .001, **p < .05.
The instrumental use variable presented a greater statistical significance (p = 0.0279) for
predicting the accounting programs’ performance in the 2009 ENADE in the presence of the
control variables than the significance resulting from the simple regression. Additionally, the
same positive correlation was verified, suggesting that the greater the instrumental use of the
2006 ENADE evaluation report, the greater the 2009 ENADE programs’ performance,
considering this study sample. Again, the control variables presented similar results to the
previous regressions. Table 37 shows the persuasive use variable regression results.
Table 37 - The relationship between the persuasive use of the ENADE evaluation report and the undergraduate accounting programs’ performance with additional control variables
B S.E. t p-valor
const 2.3189 0.1783 13.0046 <0.00001 ***
pers 0.0391 0.0162 2.4059 0.0167 **
hig_deg 0.1516 0.0501 3.0237 0.0027 ***
north -0.3424 0.1208 -2.8343 0.0049 ***
northeast -0.2301 0.0822 -2.7998 0.0054 ***
west-center -0.2466 0.0959 -2.5718 0.0106 **
south -0.0091 0.0721 -0.1264 0.8995
univ_cent -0.2144 0.0868 -2.4700 0.0141 **
college -0.4140 0.0679 -6.0965 <0.00001 ***
fiest -0.5392 0.5008 -1.0765 0.2825
adm_dep -0.2842 0.0823 -3.4554 0.0006 ***
F = 14.1488
R2 = 0.3127
Note. N = 322. S.E. = standard error; pers = persuasive; hig_deg = highest degree; univ_cent = university center; fiest = federal institute of education, science and technology; adm_dep = main funding source. *** p < .001, **p < .05.

98
Table 37 indicates that no important variation occurred with the persuasive use variable or the
control variables in this new multiple regression. The third type of use remains statistically
significant (p = 0.0167) and positively correlated with the 2009 ENADE programs’
performance. Hence, the regression outcomes suggest that the persuasive use of the 2006
ENADE evaluation report, verified among the institutions researched, is also related to their
grades in the subsequent evaluation.
Analyzing the regression outcomes jointly revealed that the use of the 2006 ENADE
evaluation report by the undergraduate accounting program administrators researched was
related to improved program performance in the 2009 ENADE evaluation independently of
how this use was measured (binary, sum of factor scores, or individual factor scores),
suggesting that the use of the ENADE evaluation report should be incentivized to increase the
chances of achieving an evaluation performance improvement through the enhancement of the
programs’ quality (Patton, 2008).
Based on the regression results, it is also possible to affirm that the conceptual type of use
was the most strongly correlated with the accounting programs’ performance in the 2009
ENADE evaluation in the group researched. This result is in accordance with previous studies
that indicated that the conceptual type of use was the most frequent and significant among the
evaluation users (Mccormick, 1997; Shea, 1991).
The control variables presented a stable behavior throughout the multiple regressions. The
exploratory test of the highest degree of the program administrator variable (hig_deg)
remained statistically significant and positively correlated with the 2009 ENADE programs’
performance, suggesting that undergraduate accounting program administrators with a
doctorate or a master’s degree are related to programs that achieved better performances.
Thus, if better grades in the ENADE evaluation are desirable, then program administrators
with the highest degrees should be preferred.
Concurrently, the other control variables already tested by previous research on Brazilian
higher education evaluation demonstrated the usual results as follows: the institutions from
the northern, west-central and northeastern regions presented a lower performance than the
southeastern region; university centers and colleges showed a lower performance than the
universities; and private institutions received lower grades than public institutions (Diaz,

99
2007; Moreira, 2010; Santos, 2012). Possible explanations for these results include the
association between the educational development and the regional socioeconomic
development, inasmuch as the north, northeast and west-center present the lowest
socioeconomic indicators in Brazil; the more complex organizational and academic structure
may lead the universities to better program performance when compared to colleges and
university centers; and the public institutions may attract more of the educationally most
prepared students when compared with the private institutions.
Therefore, after examining the regression outcomes, none of the three hypotheses could be
rejected because in each analysis, the variable related to the 2006 ENADE evaluation report
use was statistically significant and positively correlated with the 2009 ENADE evaluation
performance for the undergraduate accounting programs researched. The first hypothesis
tested the binary variable use, the second tested the intensity of use, and the third tested the
types of use; all three types of use were statistically significant and positively correlated with
the undergraduate accounting programs’ performance in the 2009 ENADE evaluation.
Lastly, the non-normal distribution of error terms and the heteroscedasticity problems that
were verified in the simple regressions were solved through the multiple regressions. The
multiple regressions also presented no multicollinearity problems (see Appendix F for the
results of the regression assumption tests).
4.6 Statistical power and effect size
To evaluate the magnitude of the results presented in the multiple regressions that tested this
study hypotheses and the probability that the tests correctly identified a true effect, effect size
and statistical power analyses were conducted using the freeware G*Power 3.1. The effect
size was calculated based on Pearson’s correlation coefficient, r, of the predictors and the
outcome variable. The parameters that should be applied to calculate the statistical power,
according to Cohen, Cohen, West, and Aiken (2003), were effect size, degrees of freedom
(determined primarily by sample size, n = 322), and alpha significance level (α = 0.05). Table
38 presents the effect size and the statistical power for each multiple regression that was
applied to test the study hypotheses.
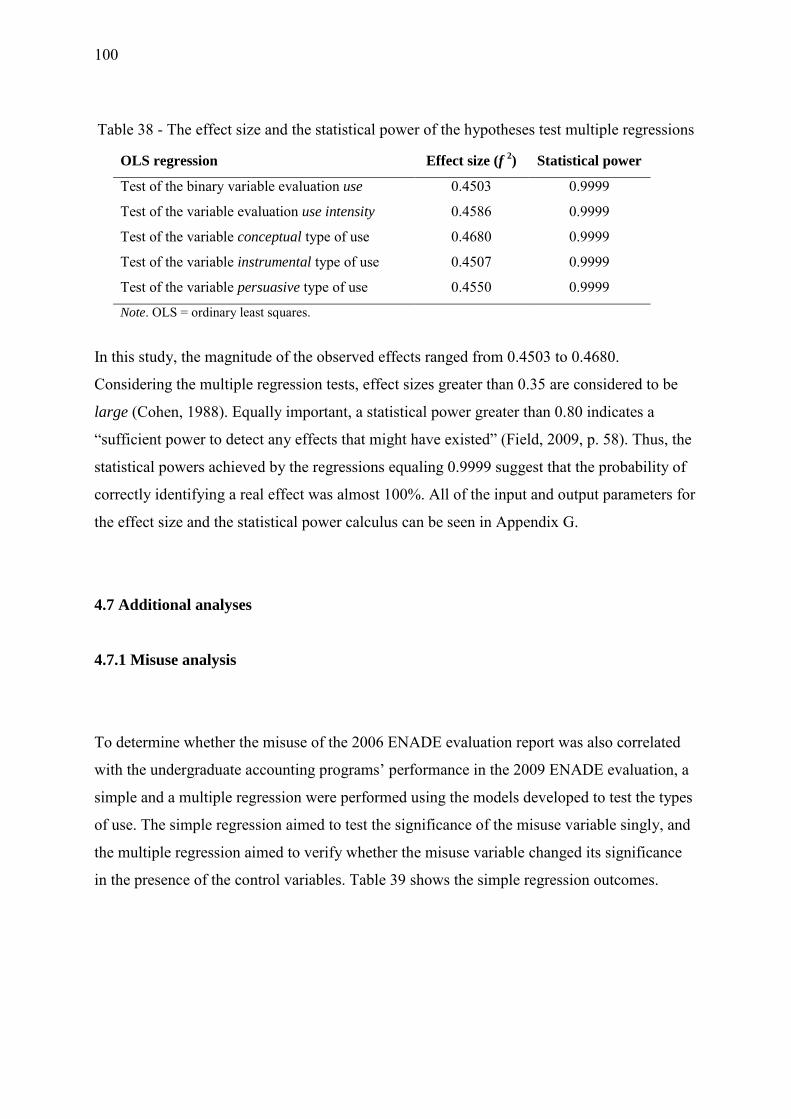
100
Table 38 - The effect size and the statistical power of the hypotheses test multiple regressions
OLS regression Effect size (f 2) Statistical power
Test of the binary variable evaluation use 0.4503 0.9999
Test of the variable evaluation use intensity 0.4586 0.9999
Test of the variable conceptual type of use 0.4680 0.9999
Test of the variable instrumental type of use 0.4507 0.9999
Test of the variable persuasive type of use 0.4550 0.9999
Note. OLS = ordinary least squares.
In this study, the magnitude of the observed effects ranged from 0.4503 to 0.4680.
Considering the multiple regression tests, effect sizes greater than 0.35 are considered to be
large (Cohen, 1988). Equally important, a statistical power greater than 0.80 indicates a
“sufficient power to detect any effects that might have existed” (Field, 2009, p. 58). Thus, the
statistical powers achieved by the regressions equaling 0.9999 suggest that the probability of
correctly identifying a real effect was almost 100%. All of the input and output parameters for
the effect size and the statistical power calculus can be seen in Appendix G.
4.7 Additional analyses
4.7.1 Misuse analysis
To determine whether the misuse of the 2006 ENADE evaluation report was also correlated
with the undergraduate accounting programs’ performance in the 2009 ENADE evaluation, a
simple and a multiple regression were performed using the models developed to test the types
of use. The simple regression aimed to test the significance of the misuse variable singly, and
the multiple regression aimed to verify whether the misuse variable changed its significance
in the presence of the control variables. Table 39 shows the simple regression outcomes.

101
Table 39 - The relationship between misuse of the ENADE evaluation report and the undergraduate accounting programs’ performance
B S.E. t p-valor
const 2.2225 0.0478 46.4544 <0.00001 ***
mis 0.0288 0.0211 1.367 0.1726
F = 1.8686
R2 = 0.0058
Note. N = 322. S.E. = standard error; mis = misuse. *** p < .001.
The correlation between misuse and the 2009 ENADE evaluation outcomes was not
statistically significant (p = 0.1726) according to the regression results. Thus, the inadequate
use of the 2006 ENADE evaluation report appears to have no association with the next
evaluation performance. However, the regression outcomes presented non-normal distribution
of error terms. Control variables were added to the model, and a new test was performed.
Table 40 presents the misuse variable multiple regression results.
Table 40 - The relationship between misuse of the ENADE evaluation report and the undergraduate accounting programs’ performance with additional control variables
B S.E. t p-valor
const 2.3217 0.1790 12.9727 <0.00001 ***
mis 0.0345 0.0186 1.8527 0.0649 *
hig_deg 0.1562 0.0502 3.1098 0.0021 ***
north -0.3434 0.1213 -2.8320 0.0049 ***
northeast -0.2364 0.0824 -2.8683 0.0044 ***
west-center -0.2525 0.0962 -2.6261 0.0091 ***
south -0.0123 0.0724 -0.1695 0.8655
univ_cent -0.2166 0.0871 -2.4859 0.0135 **
college -0.4164 0.0681 -6.1115 <0.00001 ***
fiest -0.5121 0.5024 -1.0192 0.3089
adm_dep -0.2720 0.0824 -3.3000 0.0011 ***
F = 13.8123
R2 = 0.3075
Note. N = 322. S.E. = standard error; mis = misuse; hig_deg = highest degree; univ_cent = university center; fiest = federal institute of education, science and technology; adm_dep = main funding source. *** p < .001, **p < .05, and * p < .10.

102
The multiple regression outcomes presented in Table 40 indicate that the misuse variable
changed from being not statistically significant, in the simple regression, to being statistically
significant (p = 0.0649) when analyzed together with the control variables. The misuse
variable presents a positive correlation with the undergraduate accounting programs’
performance in the 2009 ENADE evaluation, although with a lower contribution to the model
compared to the other statistically significant variables. The control variables retained the
statistical significance of their coefficients and in the same direction as presented in the types
of use multiple regressions and analyzed in the hypothesis tests section.
Although the literature defines misuse as an inadequate form of use, according to the
regression outcomes, the 2006 ENADE evaluation report misuse was positively correlated
with the 2009 ENADE evaluation performance for the undergraduate accounting programs
researched. Thus, independently of how misuse is classified by theory, ENADE evaluation
report use appears to be beneficial to the accounting programs researched, even when this use
is motivated by the program administrators’ self-promotion or vanity. It is important to
highlight that the misuse scale does not include statements that are related to fraud,
manipulation or the omission of evaluation findings, as proposed in the misuse literature.
Although the questionnaire guaranteed anonymity, only the less severe examples of misuse
were presented to avoid the embarrassment of the respondents.
Finally, the non-normal distribution of error terms verified in the simple regression was
solved through the multiple regression. The multiple regression also presented no
multicollinearity problems (see Appendix F for the results of the regression assumption tests).
4.7.2 Nonuse analysis
The data collection found that almost 40% (n = 126) of the undergraduate accounting program
administrators did not read the 2006 ENADE evaluation report. Aiming to better understand
why they did not read the report, two questions related to nonuse reasons and perceptions of
the evaluation process and results were formulated and answered by the nonusers. Table 41
shows the answers on the reasons for nonuse.

103
Table 41 - ENADE evaluation report nonuse reasons
Response Percent
Response Count*
My institution did not receive it 7% 9
I did not know about the existence of the report 22% 28
I did not have time during my work hours 6% 8
I am new in the program administrator position, and I did not receive the report from the previous program administrator
71% 90
I do not know where the report for my program is to be found 18% 23
I do not believe in the outcomes provided by the ENADE evaluation 2% 2
The text is too complex 3% 4
The text is not interesting 1% 1
Other 12% 15
Note. N = 126. *More than one answer option could be chosen for this question.
The answers from the program administrators reveal that at least 71% did not know that the
2006 ENADE evaluation report was available on the INEP website, and 22% affirmed that
they did not even know that the report existed. Hence, it appears that there was a lack of
information about the disclosure of the ENADE evaluation findings among the accounting
programs’ administrators researched. Considering that the ENADE evaluation was properly
conducted, the nonuse verified among the majority of the program administrators (nonusers)
appears to be unintentional (Alkin & Coyle, 1988; King & Pechman, 1984).
Using the other answer option, the respondents indicated some additional nonuse reasons; for
example, they were not the programs’ administrator when the evaluation was performed
(33%), or the dean of the institution did not refer the report to the programs’ administration
(33%). In this latter case, the answers could be included among the group that did not know
about the availability of the EANDE report on the internet, increasing that statistic. Another
interesting answer affirmed that the elapsed time between the evaluation and the report
availability made the information useless.
The next question asked the undergraduate accounting program administrators their level of
agreement with statements that aimed to verify their perceptions of three main topics: (a) the
importance of higher education evaluation in Brazil, (b) some aspects of the ENADE
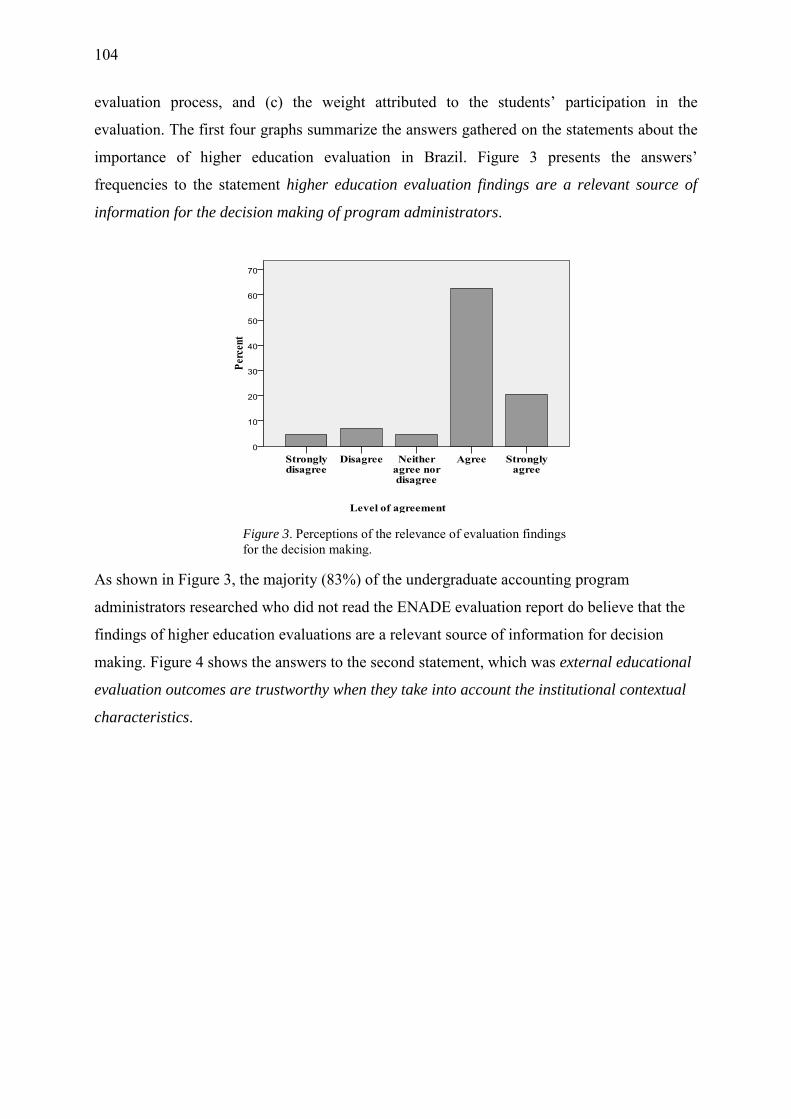
104
evaluation process, and (c) the weight attributed to the students’ participation in the
evaluation. The first four graphs summarize the answers gathered on the statements about the
importance of higher education evaluation in Brazil. Figure 3 presents the answers’
frequencies to the statement higher education evaluation findings are a relevant source of
information for the decision making of program administrators.
Figure 3. Perceptions of the relevance of evaluation findings for the decision making.
As shown in Figure 3, the majority (83%) of the undergraduate accounting program
administrators researched who did not read the ENADE evaluation report do believe that the
findings of higher education evaluations are a relevant source of information for decision
making. Figure 4 shows the answers to the second statement, which was external educational
evaluation outcomes are trustworthy when they take into account the institutional contextual
characteristics.

105
Figure 4. Perceptions of the importance of contextual characteristics to the trustworthiness of the evaluation outcomes.
Figure 4 shows that 75% of the program administrators researched believe that institutional
contextual characteristics, when considered in an external educational evaluation, improve the
reliability of the evaluation outcomes. Figure 5 presents the responses to the statement the
governmental evaluation of higher education in Brazil is unnecessary.
Figure 5. Perceptions of the lack of necessity for governmental evaluation of higher education in Brazil.
The answers from the research participants to the third statement about the importance of
higher education evaluation in Brazil indicated that most people who affirmed that they did
not read the 2006 ENADE evaluation report recognized that the governmental evaluation of

106
higher education in Brazil is necessary (78%). The final statement on the topic was the
Brazilian government should maintain its higher education evaluation program.
Figure 6. Agreement on the maintenance of the Brazilian higher education evaluation program.
Figure 6 shows that the respondents (86%) believed that the Brazilian government should
maintain its program of higher education evaluation. Thus, according to the answers to the
four statements above, it appears that the undergraduate accounting program administrators
did not disapprove of the Brazilian program of higher education evaluation, despite the fact
that they did not read the evaluation report. Hence, criticisms of the Brazilian evaluation
program cannot be considered a possible reason for the evaluation report nonuse occurrences
that were verified.
The next three graphs present the respondents’ perceptions of some aspects of the ENADE
evaluation process. The first statement on this topic was educational institutions should be
invited to participate in the planning and design of the evaluation process. Figure 7 shows the
answers obtained.

107
Figure 7. Perceptions of the necessity of evaluand participation in the planning and design of the ENADE evaluation process.
The majority of the undergraduate accounting program administrators researched who did not
read the ENADE evaluation report (88%) said that the institutions should be invited to
participate in the planning and design of the evaluation. Thus, they assumed that the
institutions could collaborate more in the conception of the evaluation program. Figure 8
presents the answers to the statement the questions of the ENADE large-scale test are
congruous with the content taught in my program.
Figure 8. Perceptions of the congruousness of the ENADE large-scale test questions.
According to the data, 82% of the research respondents believe that there is no divergence
between the content taught at the institutions and the content presented in the ENADE large-

108
scale test. Hence, the accounting knowledge components of the test appear to be in
accordance with the programs’ course contents. Figure 9 shows the perceptions regarding the
statement the evaluation outcomes would be more useful if the higher education institutional
representatives could suggest improvements to the evaluation process.
Figure 9. Agreement on the link between evaluation outcomes’ usefulness and evaluand participation in the evaluation.
The graph in Figure 9 reveals that the accounting program administrators who did not read the
evaluation report (93%) believe that the usefulness of the ENADE evaluation findings could
be increased with suggestions from the institutions evaluated. Therefore, the answers
presented in the last three graphs regarding some aspects related to the ENADE process give
the impression that there are no criticisms on the content of the students’ large-scale test but
that the research respondents would like a higher level of participation by educational
institutions in the evaluation process to be considered.
The final group of statements regarded the weight attributed to the students’ large-scale test
on the programs’ outcomes. Figure 10 presents the respondents’ perceptions of the
affirmation student refusals to answer the ENADE large-scale test are a serious threat to the
evaluation outcomes.

109
Figure 10. Perception regarding student refusals to answer the test as a threat to the evaluation outcomes.
Most of the program administrators researched (87%) believe that the students’ refusal to
participate in the ENADE large-scale test is a serious threat to the evaluation outcomes. Thus,
information that indicates a lack of commitment from students may induce the program
administrators to consider the evaluation results to be unreliable and, consequently, may
provide a possible reason for evaluation report nonuse. Figure 11 shows the answers to the
statement the evaluation of higher education in Brazil should be primarily based on student
answers and performance.
Figure 11. Agreement on the use of student answers and performance as the main parameter in the evaluation.

110
Figure 11 presents the highest level of respondent divergence among the evaluation nonuse
statements. Exactly 44% of the accounting program administrators researched are in
accordance, whereas another 44% are not in accordance with the affirmation presented. Due
to this great divergence of responses, it is not possible to draw a general conclusion about the
respondents’ positions. The last chart will be presented in Figure 12, which reports the
respondents’ answers to the statement students should be punished if they do not answer the
ENADE large-scale test.
Figure 12. Perceptions regarding the necessity of punishing students who do not answer the large-scale test.
The majority of respondents (79%) believe that students should be penalized when they do
not answer the ENADE large-scale test because that decision impacts the programs’ outcomes
in the evaluation. Therefore, the data suggest that the weight of the students’ test performance
in the evaluation results is a concern to the undergraduate accounting program administrators
researched. That concern was also the object of comments in the descriptive box in the end of
the second question, where the respondents expressed their additional opinions about the
Brazilian program of higher education evaluation.
A total of 38 comments were posted, and among them, the main topics were the lack of
commitment from students and the necessity of including their test grades in their academic
records or diploma (42%), criticisms of the evaluation process or of the lack of participation
from educational institutions in the evaluation design (39%), the different student profile for

111
the public and private institutions (5%), and compliments about the importance of the
ENADE evaluation for higher education institutions (5%).
Three other original comments deserve to be highlighted. First, there was a narration about
the differences between the attention given to the ENADE outcomes in private and public
institutions, where a respondent affirmed that when she was in the program administration of
a private institution, the ENADE results were discussed in more detail and there was a greater
expectation and preoccupation with being highly evaluated than she is experiencing now in
the same position at a public institution. Second, there was a suggestion that an assessment,
similar to a large-scale test, should be included for the professors as part of the ENADE
evaluation process. Lastly, there was a suggestion that the ENADE large-scale test should be
used as a substitute for the sufficiency exam13, which would solve the problems related to the
lack of commitment to that test from students.
On the whole, it is not possible to determine the reasons that motivate the nonuse occurrence
among the accounting program administrators researched, but according to the descriptive
data analysis, most of them revealed that they did not know where to access the ENADE
evaluation report. It is also important to highlight that 71% of the nonusers had been in the
program administration position for fewer than three years, and that position tenure is
positively correlated with the evaluation report use (see Table 22). Lastly, it appears that the
confidence of 87% of the nonusers in the ENADE outcomes is affected by the students’ lack
of commitment (see Figure 10); however, this result does not mean that they did not use that
report because of this perception.
4.7.3 Other uses
The types of use plus misuse scale, which was answered by 196 undergraduate accounting
program administrators who read the 2006 ENADE evaluation report, asked the respondents
to describe other uses that they have made of the ENADE evaluation report or outcomes. A
total of 24 comments on evaluation utilization were received. Among these comments, five
13 The sufficiency exam is required by the Brazilian Federal Accounting Council (CFC) before applying to the accounting professional practice.

112
main topics were identified: (a) faculty group discussions, (b) development of tests and
didactic planning, (c) discussions with students, (d) comparative analysis, and (e) goal setting
or strategy definition.
The first topic was mentioned by 16% of the respondents. These respondents described their
experiences in using the ENADE evaluation report and outcomes in meetings and group
discussions with professors or with all faculty members with the goal of disclosing the results
and analyzing the strengths and weaknesses of the program.
The second topic was related to the elaboration of materials that should be utilized by
professors in their daily work. These descriptions represented 25% of the comments and
emphasized the use of the ENADE large-scale test as a model to be followed, especially in the
accounting knowledge assessment tests, with a goal of training the students for that large-
scale test.
The third topic is characterized by answers that allude to meetings with students to discuss the
ENADE large-scale test or results. The respondents (20%) used words such as motivate and
prepare to justify the necessity of these meetings and to discuss the importance of student
engagement in the ENADE evaluation.
The next topic corresponds to the comments related to all types of comparisons that the
respondents (16%) made regarding the ENADE evaluation outcomes. Public, private,
regional, and benchmark institutions were mentioned in the answers as the objects of analyses
performed to better understand the evaluation results and identify institutional strengths and
weaknesses.
The last topic refers to the comments on goal setting, planning or strategy definition from the
accounting program administrators (20%). The use of the ENADE evaluation report to define
strategies to improve the students’ performance, to ground the programs’ reformulation, to
support new projects, and to set clear goals were described.
However, one surprising comment about the use of the ENADE evaluation report was also
received. A program administrator affirmed that the information provided by the ENADE
evaluation would be used to punish students. The comment talked about inscribing notes on

113
the students’ diploma in case of a low performance. Nevertheless, he did not detail how it
would be done.
Thus, aside from the uses verified through the scale, other evaluation report utilizations were
cited, showing that the ENADE evaluation report has been useful in different ways to the
undergraduate accounting program administrators researched, despite the small number of
textual descriptions and the potential misuse related. Interestingly, all 24 comments came
from accounting program administrators at private institutions.
4.7.4 Perceptions of the ENADE
Before concluding this chapter on results, a few graphs present the accounting program
administrators’ perceptions of the Brazilian higher education evaluation program. These
perceptions were collected from the first and last part of the data collection instrument, and all
322 respondents answered the questions.
At this time, the main objective is to clarify what the program administrators researched think
about the ENADE. The first question asked the respondents to give a grade from 1 (lowest) to
5 (highest) according to their perceptions of the credibility conferred by the Ministry of
Education to the evaluation. Figure 13 presents the answers.
Figure 13. Perceptions of the credibility conferred by the Ministry of Education to the evaluation.

114
Figure 13 shows that most of the respondents (57%) chose grades of four and five, which
means that they consider the Brazilian Ministry of Education to be a credible agency to
conduct the higher education evaluation program. However, 16% of the respondents chose
grades of one and two, indicating the lack of credibility of that agency, and 27% demonstrated
an intermediate reliability when they chose grade three. The next question asked the program
administrators’ opinion about the quality of the National Exam of Students’ Performance
(ENADE) implementation. Figure 14 presents the answers.
Figure 14. Opinions about the quality of the ENADE implementation.
As shown in Figure 14, the quality of the ENADE implementation was considered to be good
or very good by 73% of the undergraduate accounting program administrators researched,
whereas 19% considered it poor or very poor. The subsequent question asked the respondents
their level of agreement on the affirmation as a program administrator, I believe that the
evaluation report provided through the ENADE can potentially support my decision making
process. Figure 15 presents the answers.

115
Figure 15. Agreement on the statement that the ENADE report potentially supports decision making processes.
The respondents mostly agree or strongly agree that the ENADE evaluation report can
potentially support their decision making process; thus, 85% of the program administrators
researched appear to believe that the ENADE evaluation report can be useful to the programs’
management. Lastly, the respondents were asked whether, in their opinion, the ENADE
evaluation report distribution should be restricted to each institution evaluated. Figure 16
shows the opinions.
Figure 16. Agreement on the restricted disclosure of the ENADE evaluation reports.
The unrestricted disclosure of the ENADE evaluation report was defended by 53% of the
respondents. Therefore, public access to the evaluation report divided the opinions of the
accounting program administrators researched inasmuch as 47% believed that the reports

116
should be restricted to the institution evaluated, but it did not appear to represent a cause of
complaint among the survey respondents; at least, no comment regarding this issue was made.
Analyzing the answers jointly, it is possible to infer that the undergraduate accounting
program administrators researched have positive perceptions of the Brazilian program of
higher education evaluation and its report. First, the majority of respondents indicated that the
Brazilian Ministry of Education is a credible institution to conduct the evaluation program.
Second, they mostly agreed that the implementation of the evaluation program is good. Third,
they mostly agreed that the ENADE evaluation report could potentially support their
decisions. Hence, these answers demonstrate that a favorable environment for evaluation
report utilization appears to be present among the program administrators who participated in
this survey.

117
CHAPTER V
CONCLUSION
In this final chapter, the main finds of this study and their implications for the management of
higher education institutions are emphasized along with the recommendations for future
research on Brazilian higher education evaluation utilization.
5.1 Study purpose and procedures
The Brazilian program of higher education evaluation, broadly known by the National Exam
of Students’ Performance (ENADE), represents a governmental effort to gather information
on undergraduate educational quality with the goal of following the development of activities
by the institutions and recommending changes if necessary. As a product of that evaluation,
reports are made available to each program evaluated. The main intentions of the present
study were to determine to what extent those reports are used by undergraduate accounting
program administrators as well as the impacts of evaluation utilization.
Different aspects of the evaluation use were studied in this research, as follows: (a) the factors
associated with use, (b) the most frequent types of use, (c) the reasons for evaluation report
nonuse, (d) the incidence of misuse, and (e) the impact of evaluation utilization on the
programs’ performance. Thus, through this broad view of the ENADE evaluation report
utilization, it was possible to respond to the proposed research question: to what extent are the
Brazilian higher education evaluation reports used by undergraduate accounting programs?
A data collection instrument was developed for this study. The instrument was comprised of
five parts (factors associated with use questionnaire, incidence of use question, types of use
plus misuse scale, reasons for nonuse questionnaire, and demographic information
questionnaire). The instrument was applied through a web-based survey, and, from a study
population of 518 institutions, 326 completed answers were received, of which 322 were
utilized in the research tests and analyses.

118
The extent to which the ENADE evaluation report was utilized by undergraduate accounting
program administrators was studied in four steps: (1) a logistic regression to verify which
factors were associated with the ENADE evaluation report use, (2) a descriptive verification
of the evaluation report use incidence among the undergraduate accounting program
administrators and the most frequent types of use reported by them, (3) multiple regressions
to analyze the impacts of evaluation report use and misuse on the programs’ performance in
the subsequent evaluation, and (4) a descriptive analysis of the reasons for evaluation report
nonuse.
5.2 Key findings and implications
The key conclusion based on the evidence yielded by this research is that ENADE evaluation
report use is positively correlated with the undergraduate accounting programs’ performance
in the subsequent evaluation. Therefore, actions to increase the potential use of that report
among program administrators should be incentivized.
The factors associated with the 2006 ENADE evaluation report use by the undergraduate
accounting program administrators researched, identified from the logistic regression results,
were the tenure of the administrator in the position (Wald = 30.96, p = .000), the
administrator’s involvement in the 2006 ENADE evaluation (Wald = 15.40, p = .000), the
administrator’s perception of the effectiveness of the communication process between the
INEP and the accounting programs (Wald = 10.55, p = .001), the highest degree obtained by
the program administrator (Wald = 9.98, p = .002), and the institutional main funding source
(Wald = 4.92, p = .027).
All of these variables presented positive coefficients, indicating that the longer the program
administrator is in the position, the higher the academic degree of the administrators, the
greater their involvement in the evaluation process, and the more positive their perception of
the effectiveness of the communication between the INEP and the programs, the greater the
likelihood of ENADE evaluation report utilization. Additionally, the private institutions
presented a greater likelihood of evaluation report use than the public institutions.

119
Considering that the undergraduate accounting programs intend to increase the ENADE
evaluation report use among their program administrators, the main implications of the factors
associated with use analysis are that the regular succession of program administrators should
be avoided or that the maximum time in the position should be extended to over four years
and that professors with higher degrees should be favored for the position. Considering that
the INEP also intends to encourage the use of the ENADE evaluation report among the
educational programs, the INEP should also promote a greater involvement of program
administrators in the evaluation process in addition to increasing their communications with
programs during the evaluation process, according to this study’s findings.
Taking into account the self-reporting of the undergraduate accounting program
administrators researched, the incidence of the ENADE evaluation report use was greater
(61%) than the nonuse (39%). Additionally, the most frequent type of use verified was
conceptual, followed by instrumental and persuasive. These results indicate that the
respondents who utilized the ENADE report primarily used it to better understand their
programs and better comprehend their programs’ grades, gathering information about their
students’ socioeconomic status, their performance on the large-scale test, and their
perceptions of the programs’ infrastructure and quality.
After these uses, the administrators most frequently used the ENADE report to support their
decision making processes, for example, utilizing the information from the report as a basis
for decisions such as hiring professors, buying learning supplies, implementing student
activities, and changing the program’s curriculum. Persuasive uses were also identified
through actions that involved convincing other people to agree with pedagogical changes,
recruiting students to the program, marketing the quality of the program, or convincing other
institutions to cooperate with the program. Lastly, it is important to highlight that the
reliability of the types of use plus misuse scale was tested successfully through the
confirmatory factor analysis, which measured the Cronbach alpha for each construct:
conceptual (α = .836), instrumental (α = .845), persuasive (α = .727), and misuse (α = .778).
The three hypotheses tested could not be rejected inasmuch as independently of how the
ENADE evaluation report use was measured (by the reading of the report, by the types of use
described, or by the intensity of use represented by the sum of the types of use), the use was

120
positively correlated with the performance achieved by the undergraduate accounting
programs in the subsequent evaluation.
Considering that the grades achieved by the programs in the evaluation process reflect their
quality, the regression results suggest that the information presented in the ENADE
evaluation report can help the undergraduate programs to better understand themselves and to
improve their decision making process. Hence, the potential benefits from the evaluation
report utilization indicate that efforts should be made to convince the nonusers to read the
report.
The primary reason for the nonuse of the ENADE evaluation report indicated by the
accounting program administrators researched was their lack of knowledge about where to
find the report. Therefore, the insufficient disclosure of the evaluation results appears to be
responsible for the nonuse among at least 71% of the respondents who had not read the report.
Changes in the communication process between the INEP and the undergraduate programs
can help to decrease the nonuse incidence and to promote the greater involvement of the
program administrators, which would also reinforce a favorable attitude toward the evaluation
report utilization according to the factors associated with the use analysis.
The other variables tested in this study showed statistical significance in explaining the
performance of the undergraduate accounting programs in the 2009 ENADE evaluation. The
academic degree of the program administrator was positively correlated with the programs’
outcomes, suggesting that institutions where the program administrators have a master’s or a
doctorate degree tend to perform better than those where the administrators have a
specialization or a bachelor’s degree. This variable was also positively correlated with the use
of the ENADE evaluation report for the factors associated with use analysis. Therefore, these
research results indicate that the professors with higher degrees should be favored for the
program administration positions because, in addition to being more likely to use the
evaluation report, their degree will also be related to better program performance.
Additionally, the traditional outcomes derived from institutional characteristics and their
correlation with program performance were confirmed in this study. Institutions from the
southeast performed better in the evaluation than institutions from the north, west-central and
northeast regions of Brazil; private institutions performed worse than the public institutions;

121
and universities performed better than colleges and university centers. The association
between educational development and regional socioeconomic development, the absorption of
the educationally most prepared students by public institutions, and the greater organizational
and academic structure of the universities are possible explanations for these regression
outcomes.
Other findings deserve to be highlighted. First, the program administrators related that the
ENADE large-scale test has influenced the teaching of accounting at undergraduate programs,
especially in private institutions, where that test has served as parameter of didactic
instruments and as an assessment model. This type of utilization can be less beneficial if the
main objective is only to train students to that test to the detriment of discussing important
accounting issues. Thus, a diversification of the test design for each evaluation edition could
prevent the institutions from adopting this practice and should be considered by the INEP.
Second, the program administrators researched appeared to be enthusiastic about the Brazilian
program of higher education evaluation, although they related that they would like to
participate more actively in the evaluation process. Therefore, an increase in the users’
involvement and participation throughout the ENADE evaluation could stimulate the
evaluation report use and, consequently, reinforce the chances of increasing the quality of
programs.
Lastly, the program administrators showed a strong concern about the lack of commitment to
the ENADE large-scale test among the undergraduate accounting students. The administrators
believe that there should be consequences for the students who refuse to take the test
seriously, such as the registration of their test grades in their academic records or diploma.
Inasmuch as the students’ participation is fundamental to the ENADE evaluation process,
they should be prepared and motivated to fulfill the test requirement to the best of their
ability. Thus, government actions to stimulate and reinforce the importance of the students’
participation to the success of the evaluation are desirable because they would increase the
reliability of the evaluation outcomes.
The misuse of the ENADE evaluation report was also studied, and even the uses that are
considered by the literature to be inappropriate were shown to be positively correlated with
the programs’ performance in the presence of control variables. However, no misuse related

122
to fraud or corruption was tested in this research, which analyzed only the misuses related to
the program administrators’ self-benefit. Therefore, all of the types of ENADE evaluation
report utilization tested appear to be beneficial to the educational institutions researched,
suggesting that the reading of that report could help institutions to improve their quality.
Inasmuch as a positive association between the ENADE evaluation report use and one
dimension of the educational institutions’ performance (CPC) has been verified and
considering that, according to evaluation utilization literature, the use can have a broadly
organizational effect, this study produced evidence about the relevance of evaluation
utilization to program management. The question is therefore raised as to whether that use is
also associated with other aspects of the educational institutions that were not examined in
this research.
Finally, because the ENADE reports are already produced by the INEP after the evaluation
process, promoting the use of the evaluation findings is only a matter of stimulus and
knowledge about the potential usefulness of this managerial instrument. Through its results,
this study reinforces the idea that undergraduate accounting institutions can improve their
internal understanding by using the ENADE evaluation report, which would also contribute to
improving the programs.
5.3 Recommendations for future research
Five recommendations for future research can be derived from this study experience and
results: (a) an analysis of factors associated with types of use, (b) a measurement of the
impact of evaluation use at the student level, (c) an investigation of evaluation use by
different stakeholders, (d) research on evaluation use at programs from other fields of
knowledge, and (e) a retest of this study using data from the 2012 ENADE evaluation.
In this study, the outcome variable chosen to produce the factors associated with use analysis
was the binary answer about the utilization (reading) of the ENADE evaluation report. In
future studies, the types of use could be chosen as an outcome variable to identify the users’
and institutional characteristics that are related to each type of use (conceptual, instrumental

123
and persuasive). Based on this new analysis, it would be possible to know and to encourage
specific evaluation uses by type.
Another research alternative would be to change the outcome variable and the statistical
approach used in the analysis about the impact of evaluation utilization. Instead of using the
programs’ performance (grades), the students’ grades could be used as the outcome variable,
and a hierarchical linear model (HLM) could be performed. Hence, aside from verifying the
impact of evaluation utilization only on the program level, it would be possible to also verify
it on the student level, increasing the understanding of the relationship between evaluation
utilization and the program and student performances.
This study considered the undergraduate accounting program administrators to be the main
stakeholders and only research subject. Thus, all analyses (factors influencing utilization,
types of use, motivations for nonuse, impacts of evaluation utilization, and possible misuses)
were based on that stakeholder viewpoint and answers. Other potential users, such as
professors, students, college or university deans, and parents could be used as subjects in
future research on ENADE evaluation report utilization.
Other fields of knowledge could also be the object of studies on ENADE evaluation report
utilization. Comparative studies among programs in different fields or single-field program
analysis could be performed to examine the impact of evaluation utilization on program
performance. The factors associated with use, the most frequent types of use and the reasons
for nonuse could also be verified.
A final recommendation is to retest this study with data collected from the 2012 ENADE
evaluation. It would be interesting to verify whether the results are similar or if divergences
are found. It is reasonable to believe that many of the research subjects could be the same as
in this research; however, considering that the evaluation report utilized in the analyses would
be from the 2009 ENADE evaluation, different accounting programs would certainly
compose the new study population.

124

125
REFERENCES14
Alkin, M. C. (1985). A guide for evaluation decision makers. Beverly Hills, CA: Sage.
Alkin, M. C. (2010). Evaluation essentials: From A to Z. New York: The Guilford Press.
Alkin, M. C., & Coyle, K. (1988). Thoughts on evaluation utilization, misutilization and non-utilization. Studies in Educational Evaluation, 14(3), 331-340. doi: 10.1016/0191-491x(88)90027-2
Alkin, M. C., Daillak, R., & White, P. (1979). Using evaluations: Does evaluation make a difference? (Vol. 76). Beverly Hills, CA: Sage.
Alkin, M. C., Patton, M. Q., & Weiss, C. H. (1990). Debates on evaluation. Newbury Park, CA: Sage.
Alkin, M. C., & Taut, S. M. (2003). Unbundling evaluation use. Studies in Educational Evaluation, 29(1), 1-12. doi: 10.1016/s0191-491x(03)90001-0
Allen, M. (2010). Steeping the organization’s tea: Examining the relationship between evaluation use, organizational context, and evaluator characteristics. (Doctoral dissertation), Case Western Reserve University, Cleveland, OH.
Ball, S. (1981). Outcomes, the size of the impacts, and program evaluation. New Directions for Program Evaluation, 1981(9), 71-86. doi: 10.1002/ev.1270
Barbosa, G. C. (2011). Análise da associação entre os indicadores de gestão das universidades federais e o desempenho discente no Enade. [Analysis of the association between indicators of management of federal universities and students' performance in the Enade]. (Master's thesis), Universidade de Brasília, Brasília, Brasil.
Barrios, N. B. (1986). Utilization of evaluation information: A case study approach investigating factors related to evaluation utilization in a large state agency. (Doctoral dissertation), The Florida State University, Tallahassee, FL. ProQuest Dissertations and Theses database.
14 According to the American Psychological Association (APA) style.

126
Bertolin, J., & Leite, D. (2008). Quality evaluation of the Brazilian higher education system: Relevance, diversity, equity and effectiveness. Quality in Higher Education, 14(2), 121-133. doi: 10.1080/13538320802279980
Betoret, F. D., & Tomás, A. D. (2003). Evaluation of the university teaching/learning process for the improvement of quality in higher education. Assessment & Evaluation in Higher Education, 28(2), 165-178.
Bittencourt, H. R., Viali, L., Casartelli, A. O., & Rodrigues, A. C. M. (2008). Uma análise da relação entre os conceitos Enade e IDD. [An analysis of the relationship between Enade and IDD concepts]. Estudos em Avaliação Educacional, 19(40), 247-262.
Bober, C. F., & Bartlett, K. R. (2004). The utilization of training program evaluation in corporate universities. Human Resource Development Quarterly, 15(4), 363-383. doi: 10.1002/hrdq.1111
Bonamino, A., Coscarelli, C., & Franco, C. (2002). Avaliação e letramento: Concepções de aluno letrado subjacentes ao Saeb e ao Pisa. [Assessment and Literacy: literate student conceptions underlying Saeb and Pisa]. Educação e Sociedade, 23(81), 91-114.
Boyer, J. F., & Langbein, L. I. (1991). Factors influencing the use of health evaluation research in congress. Evaluation Review, 15(5), 507-532.
Braskamp, L. A. (1982). A definition of use. Studies in Educational Evaluation, 8(2), 169-174. doi: 10.1016/0191-491x(82)90009-8
Braskamp, L. A., Brown, R. D., & Newman, D. L. (1978). The credibility of a local educational program evaluation report: Author source and client audience characteristics. American Educational Research Journal, 15(3), 441-450. doi: 10.3102/00028312015003441
Brown-Mcgowan, S. (1992). Effects of decision maker and context variables on evaluation utilization. (Doctoral dissertation), University of Pittsburgh, Pittsburgh, PA. ProQuest Dissertations and Theses database.
Burlamaqui, M. G. B. (2008). Avaliação e qualidade na educação superior: Tendências na literatura e algumas implicações para o sistema de avaliação Brasileiro. [Evaluation and quality in higher education: trends in literature and some implications for the Brazilian evaluation system]. Estudos em Avaliação Educacional, 19(39), 133-154.

127
Byrne, M., & Flood, B. (2003). Assessing the teaching quality of accounting programmes: An evaluation of the course experience questionnaire. Assessment & Evaluation in Higher Education, 28(2), 135-145.
Cai, M. (1996). An empirical examination of participatory evaluation: Teachers' perceptions of their involvement and evaluation use. (Doctoral dissertation), State University of New York at Albany, New York. ProQuest Dissertations and Theses database. (UMI No. 9629749)
Campbell, D. T., & Fiske, D. W. (1959). Convergent and discriminant validation by the multitrait-multimethod matrix. Psychological Bulletin, 56(2), 81-105.
Chelimsky, E. (1998). The role of experience in formulating theories of evaluation practice. American Journal of Evaluation, 19(1), 35-55. doi: 10.1016/s1098-2140(99)80179-9
Chelimsky, E. (2007). Factors influencing the choice of methods in federal evaluation practice. New Directions for Evaluation, 2007(113), 13-33. doi: 10.1002/ev.213
Christie, C. A. (2007). Reported influence of evaluation data on decision makers' actions: An empirical examination. American Journal of Evaluation, 28(1), 8-25. doi: 10.1177/1098214006298065
Churchill Jr., G. A. (1979). A paradigm for developing better measures of marketing constructs. Journal of Marketing Research, 16, 64-73.
Cohen, J. (1988). Statistical power analysis for the behavioral sciences. (2nd ed.). Hillsdale, MI: Lawrence Erlbaum.
Cohen, J., Cohen, P., West, S. G., & Aiken, L. S. (2003). Applied multiple regression/correlation analysis for behavioral sciences. (3rd ed.). Mahwah, NJ: Lawrence Erlbaum.
Conner, R. F. (1998). Toward a social ecological view of evaluation use. American Journal of Evaluation, 19(2), 237-241. doi: 10.1016/s1098-2140(99)80201-x
Cook, T. D., Levinson-Rose, J., & Pollard, W. E. (1981). The misutilization of evaluation research: Some pitfalls of definition. In H. E. Freeman & M. A. Solomon (Eds.), Evaluation studies: Review annual (Vol. 6). Beverly Hills, CA: Sage.
Cornachione Jr., E. B., Trombetta, M. R., & Casa Nova, S. P. C. (2010). Evaluation use and involvement of internal stakeholders: The case of a new non-degree online program in

128
Brazil. Studies in Educational Evaluation, 36(1-2), 69-81. doi: 10.1016/j.stueduc.2010.09.001
Cousins, J. B., & Leithwood, K. A. (1986). Current empirical research on evaluation utilization. Review of Educational Research, 56(3), 331-364. doi: 10.3102/00346543056003331
Cousins, J. B., & Shulha, L. (2006). A comparative analysis of evaluation utilization and its cognate fields of inquiry: Current issues and trends. In I. Shaw, J. C. Greene & M. M. Mark (Eds.), The Sage handbook of evaluation (pp. 266-291). Thousand Oaks, CA: Sage.
Cronbach, L. J. (1951). Coefficient alpha and the internal structure of tests. Psychometrika, 16(3), 297-334.
Cronbach, L. J. (1982). Designing evaluations of educational and social programs. San Francisco: Jossey-Bass.
Cronbach, L. J., & Meehl, P. E. (1955). Construct validity in psychological tests. Psychological Bulletin, 52(4), 281-302.
Dantas, L. M. V. (2009). As contribuições das políticas de avaliação educacional em larga escala: O caso da avaliação de aprendizagem na Bahia. [The contributions of policies of large-scale educational evaluation: The case of learning assessment in Bahia]. (Doctoral dissertation), Universidade Federal da Bahia, Salvador, Brasil.
Datta, L-E. (2000). Seriously seeking fairness: Strategies for crafting non-partisan evaluations in a partisan world. American Journal of Evaluation, 21(1), 1-14. doi: 10.1016/s1098-2140(00)00062-x
Dawson, J. A., & D'amico, J. J. (1985). Involving program staff in evaluation studies: A strategy for increasing information use and enriching the data base. Evaluation Review, 9(2), 173-188. doi: 10.1177/0193841x8500900205
Devellis, R. F. (2011). Scale development: Theory and applications. (3rd ed.). Thousand Oaks, CA: Sage.
Diaz, M. D. M. (2007). Efetividade no ensino superior brasileiro: Aplicaçao de modelos multinıvel à análise dos resultados do Exame Nacional de Cursos. [Effectiveness in Brazilian higher education: Applying multilevel models to the analysis of the National Exam of Programs' outcomes]. Revista EconomiA, 8(1), 93-120.

129
Dickey, B. (1980). Utilization of evaluations of small-scale innovative educational projects. Educational Evaluation and Policy Analysis, 2(6), 65-77. doi: 10.3102/01623737002006065
Dickey, B., & Hampton, E. (1981). Effective problem-solving for evaluation utilization. Science Communication, 2(3), 361-374. doi: 10.1177/107554708100200305
Ellis, P. D. (2010). The essential guide to effect sizes: Statistical power, meta-analysis, and the interpretation of research results. Cambridge: Cambridge University Press.
Field, A. P. (2009). Discovering statistics using SPSS. (3rd ed.). Thousand Oaks, CA: Sage.
Fitzpatrick, J. L., Sanders, J. R., & Worthen, B. R. (2010). Program evaluation: Alternative approaches and practical guidelines. (4th ed.). Saddle River, NJ: Prentice Hall.
Fleischer, D. N., & Christie, C. A. (2009). Evaluation use: Results from a survey of U.S. American Evaluation Association members. American Journal of Evaluation, 30(2), 158-175. doi: 10.1177/1098214008331009
Fornell, C., & Larcker, D. F. (1981). Evaluating structural equation models with unobservable variables and measurement error. Journal of Marketing Research, 18(February 1981), 39-50.
Gatti, B. A. (2002). Avaliação educacional no Brasil: Pontuando uma história de ações. [Educational evaluation in Brazil: Pointing a history of actions]. EccoS Revista Científica, 4(1), 17-41.
Gatti, B. A. (2009). Avaliação de sistemas educacionais no Brasil. [Evaluation of educational systems in Brazil]. Revista de Ciências da Educação, mai/ago(9), 7-18.
Gentili, P. (1996). Neoliberalismo e educação: Manual do usuário. [Neoliberalism and education: Users' manual]. In T. S. SILVA & P. Gentili (Eds.), Escola S.A.: Quem ganha e quem perde no mercado educacional do neoliberalismo (pp. 9-49). Brasília, Brasil: CNTE.
Ginsburg, A., & Rhett, N. (2003). Building a better body of evidence: New opportunities to strengthen evaluation utilization. American Journal of Evaluation, 24(4), 489-498.
Gouveia, A. B., Silva, A. A., Silveria, A. A. D., Jacomini, M. A., & Braz, T. P. (2005). Trajetória da avaliação da educação superior no Brasil: Singularidades e contradições

130
(1983-2004). [Trajectory of higher education evaluation in Brazil: Singularities and contradictions (1983-2004)]. Estudos em Avaliação Educacional, 16(31), 101-132.
Gracioso, A. (2006). Análise da eficácia escolar e do efeito-escola nos cursos de administração de empresas no Brasil. [Analysis of the school effectiveness and of the school effects in business undergraduate programs in Brazil]. (Doctoral dissertation), Escola de Administração de Empresas de São Paulo - FGV, São Paulo, Brasil.
Greene, J. C. (1988a). Communication of results and utilization in participatory program evaluation. Evaluation and Program Planning, 11(4), 341-351. doi: 10.1016/0149-7189(88)90047-x
Greene, J. C. (2005). A value-engaged approach for evaluating the bunche–da vinci learning academy. New Directions for Evaluation, 2005(106), 27-45.
Greene, J. G. (1988b). Stakeholder participation and utilization in program evaluation. Evaluation Review, 12(2), 91-116. doi: 10.1177/0193841x8801200201
Hair Jr., J. F., Anderson, R., Tatham, R., & Black, W. (2005). Análise multivariada de dados. [Multivariate data analysis]. (5th ed.). Porto Alegre, Brasil: Bookman.
Hall, G. V. (1982). Viewing evaluation utilization as an innovation. Studies in Educational Evaluation, 8(2), 185-196. doi: 10.1016/0191-491x(82)90011-6
Hanushek, E. A. (2002). Publicly provided education. In A. J. AUERBACH & M. FELDSTEIN (Eds.), Handbook of public economics (Vol. 4, pp. 2045-2141). Stanford, CA: Elsevier.
Hatry, H. P., Wholey, J. S., & Newcomer, K. E. (2010). Evaluation challenges, issues, and trends. In J. S. Wholey, H. P. Hatry & K. E. Newcomer (Eds.), Handbook of practical program evaluation (3rd ed., pp. 668-679). San Francisco: Jossey-Bass.
Henry, G. T. (2000). Why not use? New Directions for Evaluation, 2000(88), 85-98. doi: 10.1002/ev.1193
Henry, G. T., & Mark, M. M. (2003a). Beyond use: Understanding evaluation's influence on attitudes and actions. American Journal of Evaluation, 24(3), 293-314. doi: 10.1016/s1098-2140(03)00056-0
Henry, G. T., & Mark, M. M. (2003b). Toward an agenda for research on evaluation. New Directions for Evaluation, 2003(97), 69-80. doi: 10.1002/ev.77

131
Henry, G. T., & Rog, D. J. (1998). A realist theory and analysis of utilization. New Directions for Evaluation, 1998(78), 89-102. doi: 10.1002/ev.1102
Hinkin, T. R. (1995). A review of scale development practices in the study of organizations. Journal of Management, 21(5), 967-988.
Inep. (2004). Sinaes - Sistema Nacional de Avaliação da Educação Superior: Da concepção à regulamentação. [Sinaes - National System of Higher Education Evaluation: From conception to regulation]. Brasília, Brasil: Instituto Nacional de Estudos e Pesquisas Educacionais - Anísio Teixeira Retrieved from http://www.cpa.uem.br/Download/SINAES.pdf?pub=3707.
Inep. (2009a). Cálculo do conceito preliminar de curso (CPC). [Calculating the Program Preliminary Concept]. Brasília, Brasil: Instituto Nacional de Estudos e Pesquisas Educacionais - Anísio Teixeira Retrieved from http://download.inep.gov.br/download/enade/2009/Nota_Tecnica_CPC.pdf.
Inep. (2009b). Índice geral de cursos da instituição – IGC. [The general index of programs of the institution]. Brasília, Brasil: Instituto Nacional de Estudos e Pesquisas Educacionais - Anísio Teixeira Retrieved from http://download.inep.gov.br/download/areaigc/Downloads/nota_tecnica_IGC_2009.pdf.
Jesus, G. R. (2004). Fatores que afetam o desempenho em Português: Um estudo multinível com dados do Saeb 2001. [Factors affecting performance in Portuguese course: A multilevel study with data from Saeb 2001]. (Master's thesis), Universidade de Brasília, Brasília, Brasil.
Johnson, K., Greenseid, L. O., Toal, S. A., King, J. A., Lawrenz, F., & Volkov, B. (2009). Research on evaluation use: A review of the empirical literature from 1986 to 2005. American Journal of Evaluation, 30(3), 377-410. doi: 10.1177/1098214009341660
Johnson, R. B. (1993). An exploratory conjoint measurement study of selected variables related to innovative educational evaluation participation and instrumental utilization. (Doctoral dissertation), University of Georgia, Athens, GA. ProQuest Dissertations and Theses database.
Johnson, R. B. (1998). Toward a theoretical model of evaluation utilization. Evaluation and Program Planning, 21(1), 93-110. doi: 10.1016/s0149-7189(97)00048-7
Kennedy, P. (2008). A guide to econometrics. (6th ed.). Malden, MA: Blackwell.

132
King, J. A. (1988). Research on evaluation use and its implications for evaluation research and practice. Studies in Educational Evaluation, 14(3), 285-299. doi: 10.1016/0191-491x(88)90025-9
King, J. A., & Pechman, E. M. (1984). Pinning a wave to the shore: Conceptualizing evaluation use in school systems. Educational Evaluation and Policy Analysis, 6(3), 241-251. doi: 10.3102/01623737006003241
King, J. A., & Thompson, B. (1983). Research on school use of program evaluation: A literature review and research agenda. Studies in Educational Evaluation, 9(1), 5-21. doi: 10.1016/0191-491x(83)90003-2
Kline, R. B. (2011). Principles and practice of structural equation modeling. (3rd ed.). New York: The Guilford Press.
Leitão, T. M. S. P., Moriconi, G. M., Abrão, M., & Silva, D. S. (2010). Análise acerca do boicote dos estudantes aos exames de avaliação do ensino superior. [Analysis about the students' boycott of higher education evaluation standardized tests]. Estudos em Avaliação Educacional, 21(45), 87-106.
Leviton, L. C., & Boruch, R. F. (1983). Contributions of evaluation to education programs and policy. Evaluation Review, 7(5), 563-598. doi: 10.1177/0193841x8300700501
Leviton, L. C., & Hughes, E. F. X. (1981). Research on the utilization of evaluations: A review and synthesis. Evaluation Review, 5(4), 525-548. doi: 10.1177/0193841x8100500405
Lipsey, M. W. (2001). Re: Unsolved problems and unfinished business. American Journal of Evaluation, 22(3), 325-328. doi: 10.1177/109821400102200306
Lundquist, R. (1997). Quality systems and iso 9000 in higher education. Assessment & Evaluation in Higher Education, 22(2), 159-172.
Marchelli, P. S. (2007). O sistema de avaliação externa dos padrões de qualidade da educação superior no Brasil: Considerações sobre os indicadores. [The external evaluation system of the higher education quality standards in Brazil: Considerations on the indicators]. Estudos em Avaliação Educacional, 18(37), 189-216.
Mark, M. M., Henry, G. T., & Julnes, G. (2000). Evaluation: An integrated framework for understanding, guiding, and improving policies and programs. San Francisco: Jossey-Bass.

133
Mccormick, E. R. (1997). Factors influencing the use of evaluation results. (Doctoral dissertation), University of Minnesota, Minneapolis, MN. ProQuest Dissertations and Theses database. (UMI No. 9815051)
Mendonça, A. W. P. C. (2000). A universidade no Brasil. [The university in Brazil]. Revista Brasileira de Educação, Mai/Jun/Jul/Ago(14), 131-150.
Miranda, G. J. (2011). Relações entre as qualificações do professor e o desempenho discente nos cursos de graduação em contabilidade no Brasil. [Relations between professors' qualifications and students' performance in undergraduate accounting programs in Brazil]. (Doctoral dissertation), Universidade de São Paulo, São Paulo, Brasil.
Moreira, A. M. A. (2010). Fatores institucionais e desempenho acadêmico no Enade: Um estudo sobre os cursos de biologia, engenharia civil, história e pedagogia. [Institutional factors and academic performance in the Enade: A study of the biology, civil engineering, history and pedagogy programs]. (Doctoral dissertation), Universidade de Brasília, Brasília, Brasil.
Netemeyer, R. G., Bearden, W. O., & Sharma, S. (2003). Scaling procedures: Issues and applications. Thousand Oaks, CA: Sage.
Nevo, D. (1995). School-based evaluation: A dialogue for school improvement. Oxford: Pergamon.
Nevo, D. (2006). Evaluation in education. In I. Shaw, J. C. Greene & M. M. Mark (Eds.), The Sage handbook of evaluation (pp. 441-460). Thousand Oaks, CA: Sage.
Nogueira, S. O. (2008). Enade: Análise de itens de formação geral e de estatística pela TRI. [Enade: Analyses of general knowledge items and statistics by TRI]. (Master's thesis), Universidade São Francisco, Itatiba, SP, Brasil.
O'cass, A., & Ngo, L. V. (2007). Balancing external adaptation and internal effectiveness: Achieving better brand performance. Journal of Business Research, 60(1), 11-20. doi: 10.1016/j.jbusres.2006.08.003
Owen, J. M., & Lambert, F. C. (1995). Roles for evaluation in learning organizations. Evaluation, 1(2), 237-250. doi: 10.1177/135638909500100207
Paiva, G. S. (2008). Avaliação do desempenho dos estudantes da educação superior: A questão da equidade e obrigatoriedade no Provão e Enade. [Evaluation of the students'

134
performance in higher education: The question of the Provão and Enade fairness and obligation]. Ensaio: Avaliação e Políticas Públicas em Educação, 16(58), 31-46.
Palumbo, D. J. (1994). The political roots of misuse of evaluation. New Directions for Program Evaluation, 1994(64), 15-23. doi: 10.1002/ev.1691
Patton, M. Q. (2008). Utilization-focused evaluation. (4th ed.). Thousand Oaks, CA: Sage.
Pedhazur, E. J. (1997). Multiple regression in behavioral research: Explanation and prediction. (3rd ed.). Stamford, CT: Thomson Learning.
Pereira, D. R. M. (2006). Fatores associados ao desempenho escolar nas disciplinas de Matemática e de Português no ensino fundamental: Uma perspectiva longitudinal. [Factors associated with academic performance in Mathematics and Portuguese courses in elementary school: A longitudinal perspective]. (Doctoral dissertation), Universidade Federal de Minas Gerais, Belo Horizonte, Brasil.
Preskill, H., & Caracelli, V. (1997). Current and developing conceptions of use: Evaluation use tig survey results. Evaluation Practice, 18(3), 209-225. doi: 10.1016/s0886-1633(97)90028-3
Preskill, H., & Torres, R. T. (2000). The learning dimension of evaluation use. New Directions for Evaluation, 2000(88), 25-37. doi: 10.1002/ev.1189
Real, G. C. M. (2007). A qualidade revelada na educação superior: Impactos da política de avaliação no Brasil. [The quality revealed in higher education: Impacts of evaluation policy in Brazil]. (Doctoral dissertation), Universidade de São Paulo, São Paulo, Brasil.
Rebien, C. C. (1997). Development assistance evaluation and the foundations of program evaluation. Evaluation Review, 21(4), 438-460. doi: 10.1177/0193841x9702100402
Reis, C. B. (2009). O uso dos resultados do Exame Nacional de Desempenho dos Estudantes nos cursos de física da Universidade de Brasília e da Universidade Católica de Brasília (2005). [The use of the results of the National Exam of Students’ Performance in physics programs at the University of Brasilia and the Catholic University of Brasilia (2005)]. (Master's thesis), Universidade de Brasília, Brasília, Brasil.
Rezende, M. (2010). The effects of accountability on higher education. Economics of Education Review, 29(5), 842-856.
135
Ristoff, D., & Giolo, J. (2006). O Sinaes como sistema. [The Sinaes as a system]. Revista Brasileira de Pós-Graduação - RBPG, 3(6), 193-213.
Rockwell, S. K., Dickey, E. C., & Jasa, P. J. (1990). The personal factor in evaluation use : A case study of a steering committee's use of a conservation tillage survey. Evaluation and Program Planning, 13(4), 389-394. doi: 10.1016/0149-7189(90)90024-q
Roseland, D. L. (2011). An investigation of the relationship between involvement in and use of evaluation in three multi-site evaluations when those involved are not the primary intended users. (Doctoral dissertation), University of Minnesota, Minneapolis, MN. ProQuest Dissertations and Theses database. (UMI No. 3450815)
Russ-Eft, D., & Preskill, H. (2009). Evaluation in organizations: A systematic approach to enhancing learning, performance, and change. New York: Basic Books.
Ryan, K. E., & Cousins, J. B. (2009). The Sage international handbook of educational evaluation. Thousand Oaks, CA: Sage.
Santana, A. L. A. (2009). O perfil do professor de ciências contábeis e seu reflexo no Exame Nacional de Desempenho dos Estudantes: Um estudo nas universidades federais do Brasil. [The profile of accounting professors and its reflection on the National Exam of Students’ Performance: A study in the Brazilian federal universities]. (Master's thesis), Universidade de São Paulo, Ribeirão Preto, SP, Brasil.
Santos, N. A. (2012). Determinantes do desempenho acadêmico dos alunos dos cursos de ciências contábeis. [Determinants of accounting students academic performance]. (Doctoral dissertation), Universidade de São Paulo, São Paulo, Brasil.
Santos, N. A., Cunha, J. V. A., & Cornachione Jr., E. B. (2009). Análise do desempenho dos cursos de ciências contábeis do estado de Minas Gerais no Enade/2006. [Performance analysis of accounting programs of the state of Minas Gerais in the Enade/2006]. Paper presented at the 3rd International Accounting Congress – IAAER & ANPCONT, São Paulo, Brasil.
Schwandt, T. A. (1997). The landscape of values in evaluation: Charted terrain and unexplored territory. New Directions for Evaluation, 1997(76), 25-39. doi: 10.1002/ev.1085
Schwartzman, S. (2010). The national assessment of courses in Brazil. In D. D. Dill & M. Beerkens (Eds.), Public policy for academic quality: Analyses of innovative policy instruments (pp. 293-312). New York: Springer.

136
Scriven, M. (1967). The methodology of evaluation. In R. W. Tyler, R. M. Gagne & M. Scriven (Eds.), Perspectives of curriculum evaluation (pp. 39-83). Chicago: Rand McNally.
Scriven, M. (2001). Evaluation: Future tense. American Journal of Evaluation, 22(3), 301-307. doi: 10.1177/109821400102200303
Shadish, W. R., Cook, T. D., & Leviton, L. C. (1991). Foundations of program evaluation: Theories of practice. Thousand Oaks, CA: Sage.
Sharma, S. (1996). Applied multivariate techniques. New York: John Wiley & Sons.
Shea, M. P. (1991). Program evaluation utilization in Canada and its relationship to evaluation process, evaluator and decision context variables. (Doctoral dissertation), University of Windsor, Windsor, Ontario, Canada. ProQuest Dissertations and Theses database.
Shulha, L. M., & Cousins, J. B. (1997). Evaluation use: Theory, research, and practice since 1986. American Journal of Evaluation, 18(1), 195-208. doi: 10.1177/109821409701800121
Silva, M. A. R. (2007). A institucionalização da avaliação da educação superior: Uma análise comparada do Brasil e do México. [The institutionalization of higher education evaluation: A comparative analysis of Brazil and Mexico]. (Doctoral dissertation), Universidade de Brasília, Brasília, Brasil.
Silva, M. C. R. (2011). A validade do ENADE para avaliação da qualidade dos cursos: Modelo de rasch e multinível. [The validity of the ENADE to evaluate the quality of programs: Rasch and multilevel models]. (Doctoral dissertation), Universidade São Francisco, Itatiba, SP, Brasil.
Smith, M. F. (2001). Evaluation: Preview of the future #2. American Journal of Evaluation, 22(3), 281-300. doi: 10.1177/109821400102200302
Soares, J. F., Ribeiro, L. M., & Castro, C. M. (2001). Valor agregado de instituições de ensino superior em Minas Gerais para os cursos de direito, administração e engenharia civil. [Added value of higher education institutions in Minas Gerais for law, business and civil engineering programs]. Dados, 44(2), 363-396.

137
Sousa, S. M. Z. L. (2003). Possíveis impactos das políticas de avaliação no currículo escolar. [Possible impacts of evaluation policy in the school curriculum]. Cadernos de Pesquisa(119), 175-190.
Souza, E. S. (2008). Enade 2006: Determinantes do desempenho dos cursos de ciências contábeis. [Enade 2006: Determinants of the accounting programs' performance]. (Master's thesis), Universidade de Brasília, Brasília, Brasil.
Souza, L. G. (2009). Avaliação de políticas educacionais: Contexto e conceitos em busca da avaliação pública. [Evaluation of educational policy: Context and concepts in the search of public evaluation]. In J. A. C. Lordêlo & M. V. Dazzani (Eds.), Avaliação educacional desatando e reatando nós (pp. 17-29). Salvador, Brasil: EDUFBA.
Souza, S. Z. L., & Oliveira, R. P. (2003). Políticas de avaliação da educação e quase mercado no Brasil. [Educational evaluation policies and almost market in Brazil]. Educação & Sociedade, 24(84), 873-895.
Stake, R. E. (2004). Standards-based and responsive evaluation. Thousand Oaks, CA: Sage.
Steenkamp, J-B. E. M., & Van Trijp, H. C. M. (1991). The use of lisrel in validating marketing constructs. International Journal of Research in Marketing, 8(4), 283-299. doi: 10.1016/0167-8116(91)90027-5
Stevens, C. J., & Dial, M. (1994). What constitutes misuse? New Directions for Program Evaluation, 1994(64), 3-13. doi: 10.1002/ev.1690
Stufflebeam, D. (2001). Evaluation models. New Directions for Evaluation, 2001(89), 7-98.
Tackett, W. L. (2004). Use of evaluation findings in Michigan's 21st century community learning center programs. (Doctoral dissertation), Western Michigan University, Kalamazoo, MI. ProQuest Dissertations and Theses database. (UMI No. 3132871)
Tenório, R. M., & Andrade, M. A. B. (2009). A avaliação da educação superior no Brasil: Desafios e perspectivas. [The evaluation of higher education in Brazil: Challenges and perspectives]. In J. A. C. Lordêlo & M. V. Dazzani (Eds.), Avaliação educacional desatando e reatando nós (pp. 31-55). Salvador, Brasil: EDUFBA.
Thompson, B. (1994). The revised program evaluation standards and their correlation with the evaluation use literature. Journal of Experimental Education, 63(1), 54-82.

138
Turnbull, B. (1999). The mediating effect of participation efficacy on evaluation use. Evaluation and Program Planning, 22(2), 131-140. doi: 10.1016/s0149-7189(99)00012-9
Ursin, J., Huusko, M., Aittola, H., Kiviniemi, U., & Muhonen, R. (2008). Evaluation and quality assurance in Finnish and Italian universities in the Bologna process. Quality in Higher Education, 14(2), 109-120. doi: 10.1080/13538320802278222
Van Kemenade, E., Pupius, M., & Hardjono, T. W. (2008). More value to defining quality. Quality in Higher Education, 14(2), 175-185. doi: 10.1080/13538320802278461
Vanek, G. T. (2004). The influence of program evaluation on school board decision making. (Doctoral dissertation), Washington State University, Pullman, WA. ProQuest Dissertations and Theses database. (UMI No. 3165136)
Verhine, R. E., & Dantas, L. M. V. (2009). A avaliação do desempenho de alunos de educação superior: Uma análise a partir da experiência do Enade. [The evaluation of students' performance in higher education: An analysis from the Enade experience]. In J. A. C. Lordêlo & M. V. Dazzani (Eds.), Avaliação educacional desatando e reatando nós (pp. 173-199). Salvador, Brasil: EDUFBA.
Verhine, R. E., Dantas, L. M. V., & Soares, J. F. (2006). Do Provão ao ENADE: Uma análise comparativa dos exames nacionais utilizados no ensino superior Brasileiro. [From the Provão to the ENADE: A comparative analysis of national exams used in Brazilian higher education]. Ensaio: Avaliação Políticas Públicas Educacionais, 14(52), 291-310.
Vianna, H. M. (2009). Fundamentos de um programa de avaliação educacional. [Fundamentals of an educational evaluation program]. Meta: Avaliação, 1(1), 11-27.
Vroom, P. I., Colombo, M., & Nahan, N. (1994). Confronting ideology and self-interest: Avoiding misuse of evaluation. New Directions for Program Evaluation, 1994(64), 49-59. doi: 10.1002/ev.1694
Weiss, C. H. (1980). Knowledge creep and decision accretion. Science Communication, 1(3), 381-404. doi: 10.1177/107554708000100303
Weiss, C. H. (1982). Measuring the use of evaluation. In E. R. House, Mathison, S., Pearsol, J. A., Preskill, H. (Ed.), Evaluation studies review annual (Vol. 7, pp. 129-145). Beverly Hills, CA: Sage.
Weiss, C. H. (1988). Evaluation for decisions: Is anybody there? Does anybody care? Evaluation Practice, 9(1), 5-19. doi: 10.1016/s0886-1633(88)80017-5

139
Weiss, C. H. (1998). Have we learned anything new about the use of evaluation? American Journal of Evaluation, 19(1), 21-33. doi: 10.1177/109821409801900103
Wholey, J. S. (1981). Using evaluation to improve program performance. In H. E. Freeman, Solomon, M. A. (Ed.), Evaluation studies review annual (Vol. 6, pp. 55-69). Beverly Hills, CA: Sage.
Wingate, L. A. (2009). The program evaluation standards applied for metaevaluation purposes: Investigating interrater reliability and implications for use. (Doctoral dissertation), Western Michigan University, Kalamazoo, MI. ProQuest Dissertations and Theses database. (UMI No. 3392166)
Yarbrough, D. B., Shulha, L. M., Hopson, R. K., & Caruthers, F. A. (2010). The program evaluation standards: A guide for evaluators and evaluation users. (3rd ed.). Thousand Oaks, CA: Sage.
Zoghbi, A. C. P., Oliva, B. T., & Moriconi, G. M. (2010). Aumentando a eficácia e a eficiência da avaliação do ensino superior: A relação entre o Enem e o Enade. [Increasing the efficiency and effectiveness of higher education evaluation: The relationship between the Enem and the Enade]. Estudos em Avaliação Educacional, 21(45), 45-66.

140
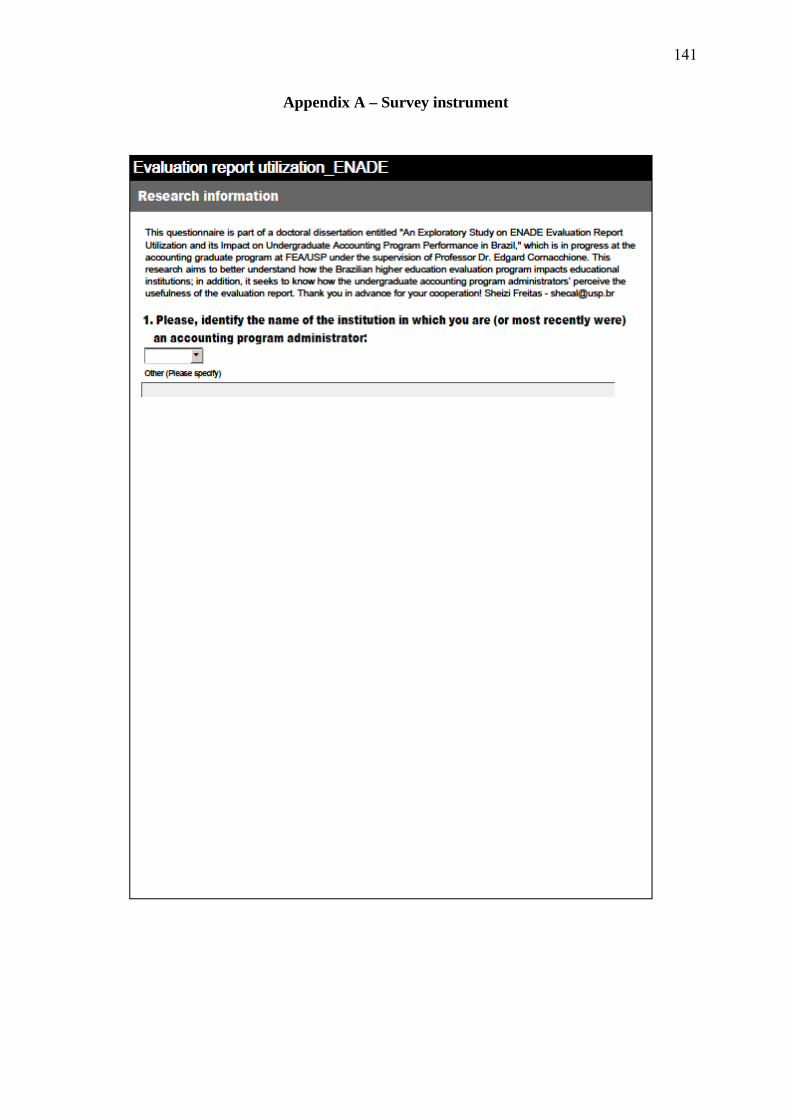
141
Appendix A – Survey instrument

142
143

144

145

146

147

148

149
Appendix B – Survey instrument (Portuguese)

150

151

152

153

154

155

156

157
Appendix C – Invitation letter to the accounting program administrators
Dear Professor,
Your institution was selected to participate in research on The National Exam of Students’
Performance (ENADE) as part of the National System of Higher Education Evaluation (SINAES).
This research is part of a doctoral dissertation developed in the Accounting Graduation Program at
FEA/USP, and it intends to study how the use of evaluation findings impacts the undergraduate
accounting programs in Brazil. The advisor for this research is Professor Edgard Cornacchione. Your
participation is fundamental to the success of this study; therefore, I would appreciate your
collaboration by answering the survey available at
https://www.surveymonkey.com/s/Sheizi_Freitas
The estimated answer time is approximately 10 minutes, and you are free to abandon the survey at any
time. The data collected will be used aggregately, and neither you nor your institution will be
identified in the research results.
Lastly, a best-selling financial accounting book will be raffled among the respondents as a way to
thank you for your participation. The book can be donated to your institution’s library if you already
have it.
Thank you very much for your understanding and your assistance!
Sheizi Freitas

158
Prezado(a) Professor(a),
A sua instituição foi selecionada para participar de uma pesquisa sobre o Exame Nacional de
Desempenho de Estudantes (ENADE), enquanto parte integrante do Sistema Nacional de Avaliação da
Educação Superior (SINAES). Tal pesquisa é orientada pelo Prof. Dr. Edgard Cornacchione e está
vinculada a uma tese de doutorado, desenvolvida no Programa de Pós-graduação em Controladoria e
Contabilidade da FEA/USP, que intenciona estudar como o uso do relatório do ENADE impacta os
cursos de Contabilidade brasileiros. A sua participação é de fundamental importância para a
continuidade dessa pesquisa, por isso gostaria de contar com a sua especial colaboração no que se
refere ao preenchimento do questionário disponível em
https://www.surveymonkey.com/s/Sheizi_Freitas
Gostaria ainda de informá-lo que o tempo estimado para o preenchimento do questionário é de,
aproximadamente, 10 minutos, e que você é livre para deixar de participar da pesquisa a qualquer
momento. Os dados coletados serão utilizados de forma agregada, de modo que o senhor e a sua
instituição não serão identificados nos resultados da pesquisa.
Por fim, como uma forma singela de agradecer pela sua participação, será sorteado, entre os
respondentes, um exemplar do livro Manual de Contabilidade Societária: Aplicável a todas as
Sociedades de Acordo com as Normas Internacionais e do CPC de autoria de Sérgio de
Iudícibus, Eliseu Martins, Ernesto Rubens Gelbcke e Ariovaldo dos Santos, 2010, que poderá ser
doado para a biblioteca da instituição caso o senhor já possua a referida obra.
Muito obrigada pela sua compreensão e colaboração!
Atenciosamente,
Sheizi Freitas

159
Appendix D – Logistic regression results
Variables in the Equation
B S.E. Wald df Sig. Exp(B)
95% C.I. for EXP(B)
Lower Upper Step 1a
pos_time 1.066 .141 57.362 1 .000 2.903 2.203 3.825 Constant -2.325 .376 38.156 1 .000 .098
Step 2b
pos_time .845 .151 31.469 1 .000 2.329 1.733 3.129 involv .441 .100 19.369 1 .000 1.555 1.277 1.893 Constant -2.866 .414 48.012 1 .000 .057
Step 3c
pos_time .918 .158 33.791 1 .000 2.504 1.837 3.412 communic .415 .130 10.286 1 .001 1.515 1.175 1.953 involv .429 .102 17.756 1 .000 1.535 1.258 1.874 Constant -4.320 .653 43.815 1 .000 .013
Step 4d
pos_time .919 .159 33.324 1 .000 2.506 1.834 3.423 hig_deg .690 .238 8.373 1 .004 1.993 1.249 3.180 communic .446 .133 11.295 1 .001 1.563 1.204 2.027 involv .431 .104 17.304 1 .000 1.540 1.256 1.887 Constant -6.367 .998 40.703 1 .000 .002
Step 5e
pos_time .895 .161 30.959 1 .000 2.446 1.785 3.353 hig_deg .780 .247 9.981 1 .002 2.180 1.344 3.536 adm_dep .793 .357 4.918 1 .027 2.209 1.096 4.451 communic .439 .135 10.554 1 .001 1.551 1.190 2.020 involv .412 .105 15.400 1 .000 1.509 1.229 1.853 Constant -7.118 1.086 42.978 1 .000 .001
a. Variable(s) entered on step 1: pos_time (tenure of the administrator in the position). b. Variable(s) entered on step 2: involv (involvement). c. Variable(s) entered on step 3: communic (communication). d. Variable(s) entered on step 4: hig_deg (highest degree). e. Variable(s) entered on step 5: adm_dep (main funding source).
Multicollinearity test
Model
Unstandardized Coefficients
Standardized Coefficients
t Sig.
Collinearity Statistics
B Std. Error Beta Tolerance VIF
1 (Constant) -.737 .151 -4.885 .000 communic .068 .020 .156 3.342 .001 .985 1.015 involv .074 .018 .222 4.170 .000 .763 1.311 pos_time .158 .025 .331 6.227 .000 .762 1.313 hig_deg .140 .039 .168 3.575 .000 .978 1.022 adm_dep .138 .061 .110 2.268 .024 .924 1.082

160
Constant only modela,b,c
Iteration -2 Log
likelihood Coefficients
Constant Step 0 1 431.051 .435
2 431.047 .442 3 431.047 .442
a. Constant is included in the model. b. Initial -2 Log Likelihood: 431.047 c. Estimation terminated at iteration number 3 because parameter estimates changed by less than .001.

161
Appendix E – Confirmatory factor analysis
Cross-loadings - full model
CONCEPTUAL INSTRUMENTAL MISUSE PERSUASIVE
CONCEP_1 0.7137 0.4927 0.4483 0.4865 CONCEP_2 0.8179 0.577 0.4714 0.575 CONCEP_3 0.7249 0.4852 0.3969 0.5219 CONCEP_4 0.7841 0.4978 0.4588 0.5946 CONCEP_5 0.7485 0.7072 0.5217 0.6587 CONCEP_6 0.7523 0.4831 0.4014 0.5181 INST_1 0.3529 0.7006 0.7101 0.5739 INST_2 0.6672 0.8341 0.6384 0.6901 INST_3 0.5952 0.819 0.6804 0.6836 INST_4 0.5968 0.7647 0.5871 0.6811 INST_5 0.6244 0.8282 0.6681 0.6733 MIS_1 0.3037 0.569 0.718 0.5358 MIS_2 0.5351 0.6423 0.7511 0.7147 MIS_3 0.3356 0.5471 0.7298 0.5136 MIS_4 0.4287 0.6586 0.7869 0.6567 MIS_5 0.58 0.6596 0.7565 0.6585 PERS_1 0.4519 0.6185 0.6893 0.7566 PERS_2 0.6157 0.7349 0.6825 0.8355 PERS_3 0.5797 0.5711 0.598 0.7245 PERS_4 0.6395 0.5393 0.4367 0.6403 PERS_5 0.5143 0.6514 0.6918 0.7737
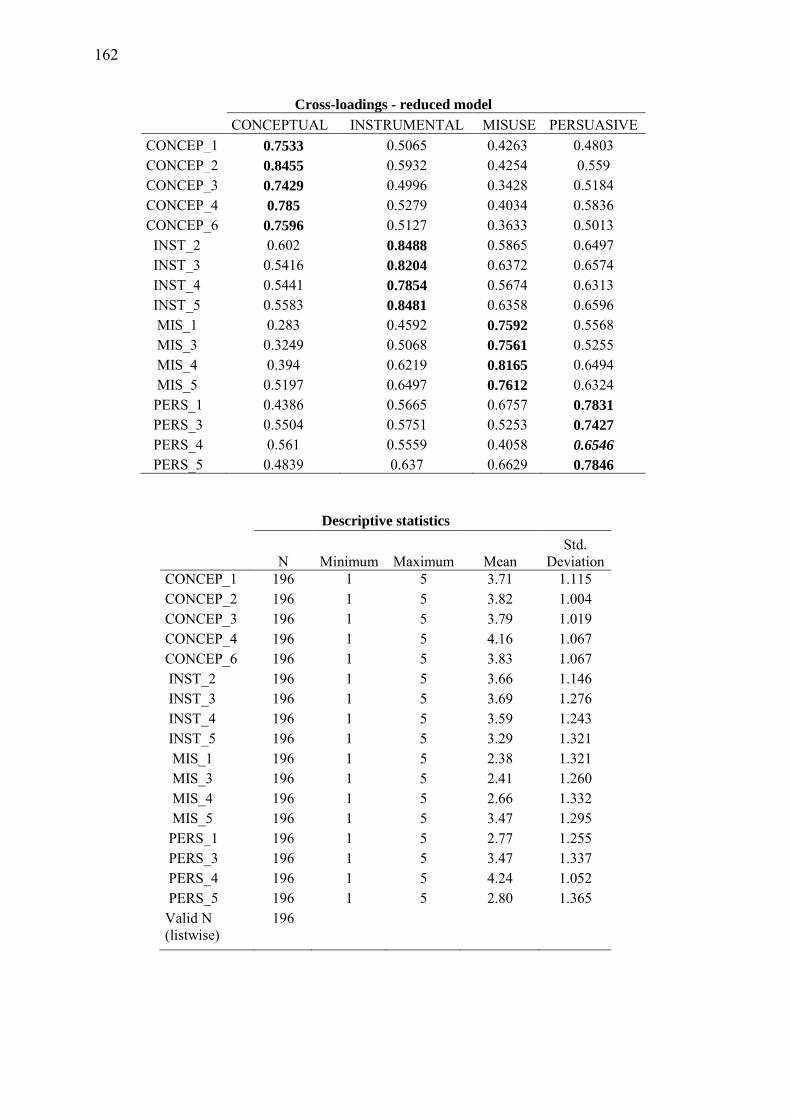
162
Cross-loadings - reduced model CONCEPTUAL INSTRUMENTAL MISUSE PERSUASIVE CONCEP_1 0.7533 0.5065 0.4263 0.4803 CONCEP_2 0.8455 0.5932 0.4254 0.559 CONCEP_3 0.7429 0.4996 0.3428 0.5184 CONCEP_4 0.785 0.5279 0.4034 0.5836 CONCEP_6 0.7596 0.5127 0.3633 0.5013 INST_2 0.602 0.8488 0.5865 0.6497 INST_3 0.5416 0.8204 0.6372 0.6574 INST_4 0.5441 0.7854 0.5674 0.6313 INST_5 0.5583 0.8481 0.6358 0.6596 MIS_1 0.283 0.4592 0.7592 0.5568 MIS_3 0.3249 0.5068 0.7561 0.5255 MIS_4 0.394 0.6219 0.8165 0.6494 MIS_5 0.5197 0.6497 0.7612 0.6324 PERS_1 0.4386 0.5665 0.6757 0.7831 PERS_3 0.5504 0.5751 0.5253 0.7427 PERS_4 0.561 0.5559 0.4058 0.6546 PERS_5 0.4839 0.637 0.6629 0.7846
Descriptive statistics
N Minimum Maximum Mean
Std. Deviation
CONCEP_1 196 1 5 3.71 1.115 CONCEP_2 196 1 5 3.82 1.004 CONCEP_3 196 1 5 3.79 1.019 CONCEP_4 196 1 5 4.16 1.067 CONCEP_6 196 1 5 3.83 1.067 INST_2 196 1 5 3.66 1.146 INST_3 196 1 5 3.69 1.276 INST_4 196 1 5 3.59 1.243 INST_5 196 1 5 3.29 1.321 MIS_1 196 1 5 2.38 1.321 MIS_3 196 1 5 2.41 1.260 MIS_4 196 1 5 2.66 1.332 MIS_5 196 1 5 3.47 1.295 PERS_1 196 1 5 2.77 1.255 PERS_3 196 1 5 3.47 1.337 PERS_4 196 1 5 4.24 1.052 PERS_5 196 1 5 2.80 1.365 Valid N (listwise)
196

163
Appendix F – Regression assumption tests
Simple regression
Variable tested: use
Heteroscedasticity (White test) p-valor = 0.38091 Normal distribution of error terms (Doornik-Hansen test) p-valor = 0.04230
Simple regression
Variable tested: use_int Heteroscedasticity (White test) p-valor = 0.00805 Normal distribution of error terms (Doornik-Hansen test) p-valor = 0.01943

164
Multiple regression
Variable tested: use Heteroscedasticity (White test) p-valor = 0.23109 Normal distribution of error terms (Doornik-Hansen test) p-valor = 0.34172
Multicollinearity (variance inflation factor - VIF): use 1.106
hig_deg 1.158 north 1.125
northeast 1.286 west-center 1.269
south 1.315 univ_cent 1.353
college 1.521 fiest 1.027
adm_dep 1.327

165
Multiple regression
Variable tested: use_int Heteroscedasticity (White test) p-valor = 0.20202 Normal distribution of error terms (Doornik-Hansen test) p-valor = 0.29927
Multicollinearity (variance inflation factor - VIF): use_int 1.101
hig_deg 1.15 north 1.125
northeast 1.283 west-center 1.266
south 1.314 univ_cent 1.35
college 1.52 fiest 1.027
adm_dep 1.333

166
Simple regression
Variable tested: concep Heteroscedasticity (White test) p-valor = 0.11658 Normal distribution of error terms (Doornik-Hansen test) p-valor = 0.021829
Simple regression
Variable tested: inst Heteroscedasticity (White test) p-valor = 0.04759 Normal distribution of error terms (Doornik-Hansen test) p-valor = 0.02061

167
Simple regression
Variable tested: pers Heteroscedasticity (White test) p-valor = 0.01938 Normal distribution of error terms (Doornik-Hansen test) p-valor = 0.01768
Simple regression
Variable tested: mis Heteroscedasticity (White test) p-valor = 0.10197 Normal distribution of error terms (Doornik-Hansen test) p-valor = 0.01965

168
Multiple regression
Variable tested: concep Heteroscedasticity (White test) p-valor = 0.25689 Normal distribution of error terms (Doornik-Hansen test) p-valor = 0.34184
Multicollinearity (variance inflation factor - VIF): concep 1.107
hig_deg 1.157 north 1.125
northeast 1.285 west-center 1.269
south 1.314 univ_cent 1.352
college 1.525 fiest 1.027
adm_dep 1.326
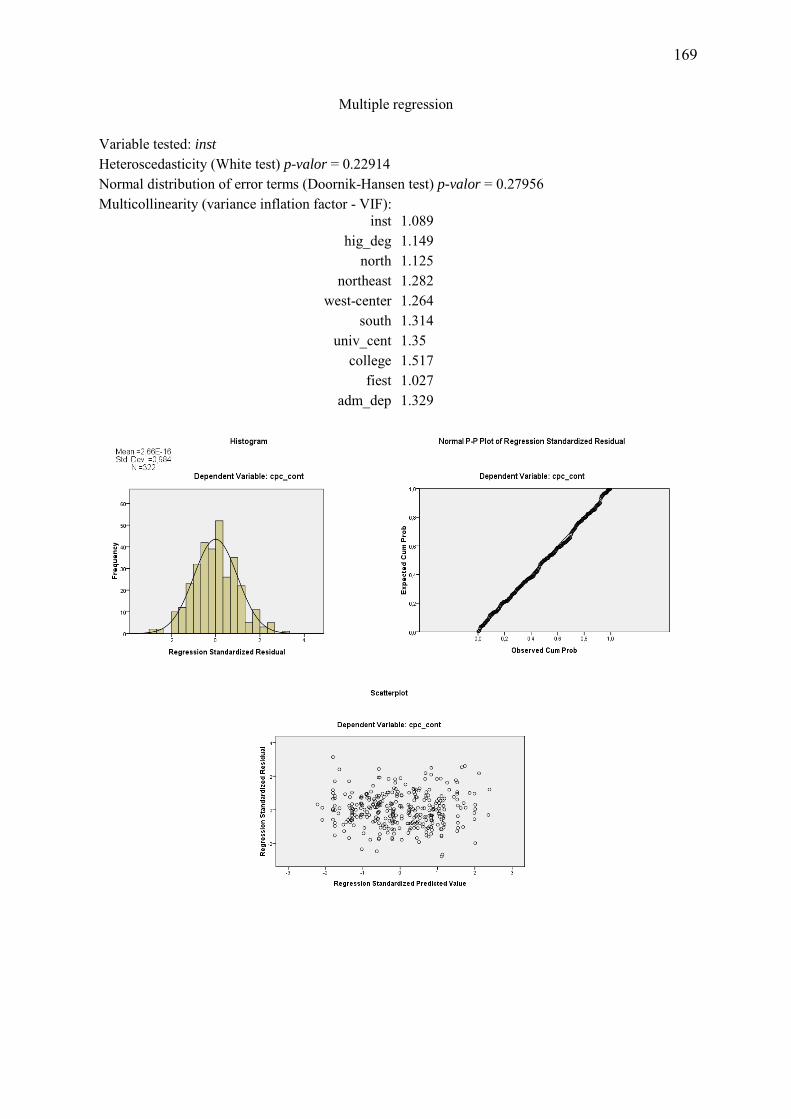
169
Multiple regression
Variable tested: inst Heteroscedasticity (White test) p-valor = 0.22914 Normal distribution of error terms (Doornik-Hansen test) p-valor = 0.27956
Multicollinearity (variance inflation factor - VIF): inst 1.089
hig_deg 1.149 north 1.125
northeast 1.282 west-center 1.264
south 1.314 univ_cent 1.35
college 1.517 fiest 1.027
adm_dep 1.329

170
Multiple regression
Variable tested: pers Heteroscedasticity (White test) p-valor = 0.14094 Normal distribution of error terms (Doornik-Hansen test) p-valor = 0.27424
Multicollinearity (variance inflation factor - VIF): pers 1.101
hig_deg 1.144 north 1.125
northeast 1.284 west-center 1.266
south 1.314 univ_cent 1.35
college 1.518 fiest 1.027
adm_dep adm_dep
1.34
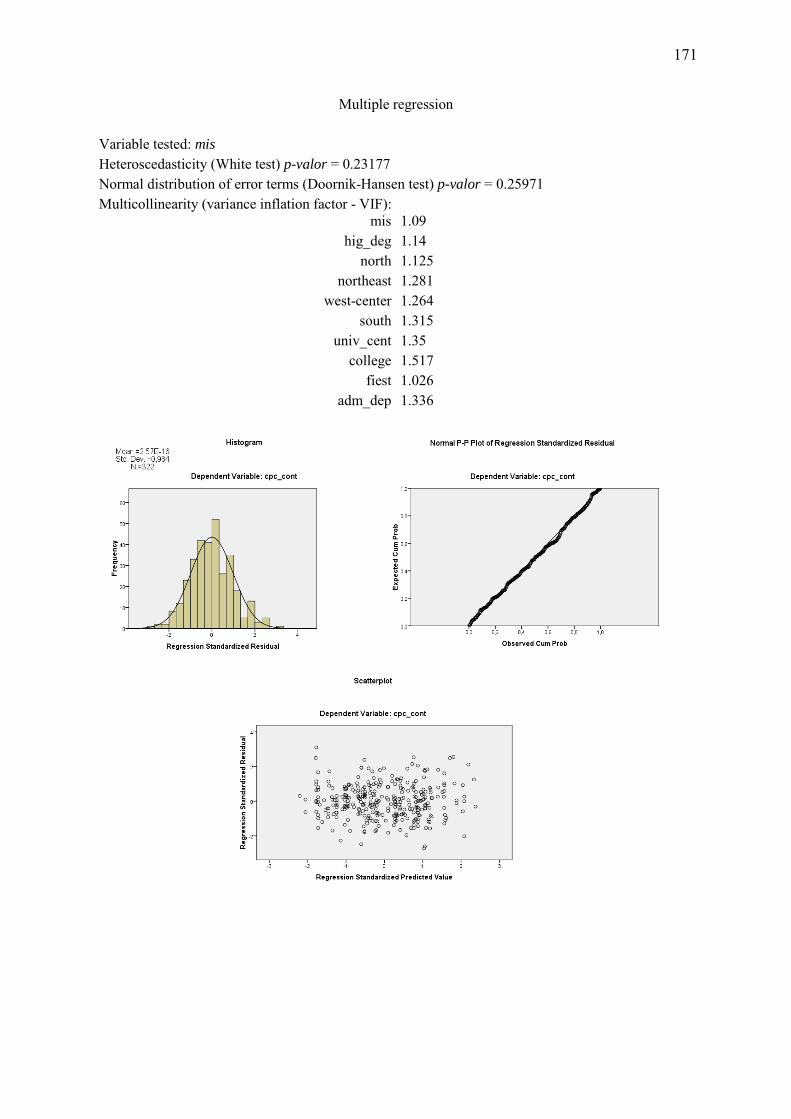
171
Multiple regression
Variable tested: mis Heteroscedasticity (White test) p-valor = 0.23177 Normal distribution of error terms (Doornik-Hansen test) p-valor = 0.25971
Multicollinearity (variance inflation factor - VIF): mis 1.09
hig_deg 1.14 north 1.125
northeast 1.281 west-center 1.264
south 1.315 univ_cent 1.35
college 1.517 fiest 1.026
adm_dep 1.336

172
Multiple regression – types of use B S.E. t p-valor
const 2.3168 0.1773 13.0706 <0.00001 *** hig_deg 0.1356 0.0504 2.6889 0.0076 *** north -0.3403 0.1200 -2.8357 0.0049 *** northeast -0.2127 0.0821 -2.5919 0.0100 *** west-center -0.2238 0.0957 -2.3391 0.0200 ** south 0.0035 0.0718 0.0487 0.9612 univ_cent -0.1977 0.0865 -2.2863 0.0229 ** college -0.3884 0.0682 -5.6938 <0.00001 *** fiest -0.5489 0.4975 -1.1033 0.2707 adm_dep -0.2807 0.0817 -3.4339 0.0007 *** concep 0.1287 0.0521 2.4714 0.0140 ** inst -0.0797 0.0590 -1.3508 0.1778 pers -0.0150 0.0653 -0.2297 0.8184 F = 12.4708 R2 = 0.3263
Note. N = 322. S.E. = standard error; concep = conceptual; inst = instrumental; pers = persuasive; hig_deg = highest degree; univ_cent = university center; fiest = federal institute of education, science and technology; adm_dep = main funding source. *** p < .001, **p < .05.
Heteroscedasticity (White test) p-valor = 0.23313
Normal distribution of error terms (Doornik-Hansen test) p-valor = 0.40805 Multicollinearity (variance inflation factor - VIF):
hig_deg 1.174 north 1.125
northeast 1.297 west-center 1.278
south 1.324 univ_cent 1.358
college 1.553 fiest 1.028
adm_dep 1.341 concep 14.405
inst 17.062 pers 18.07
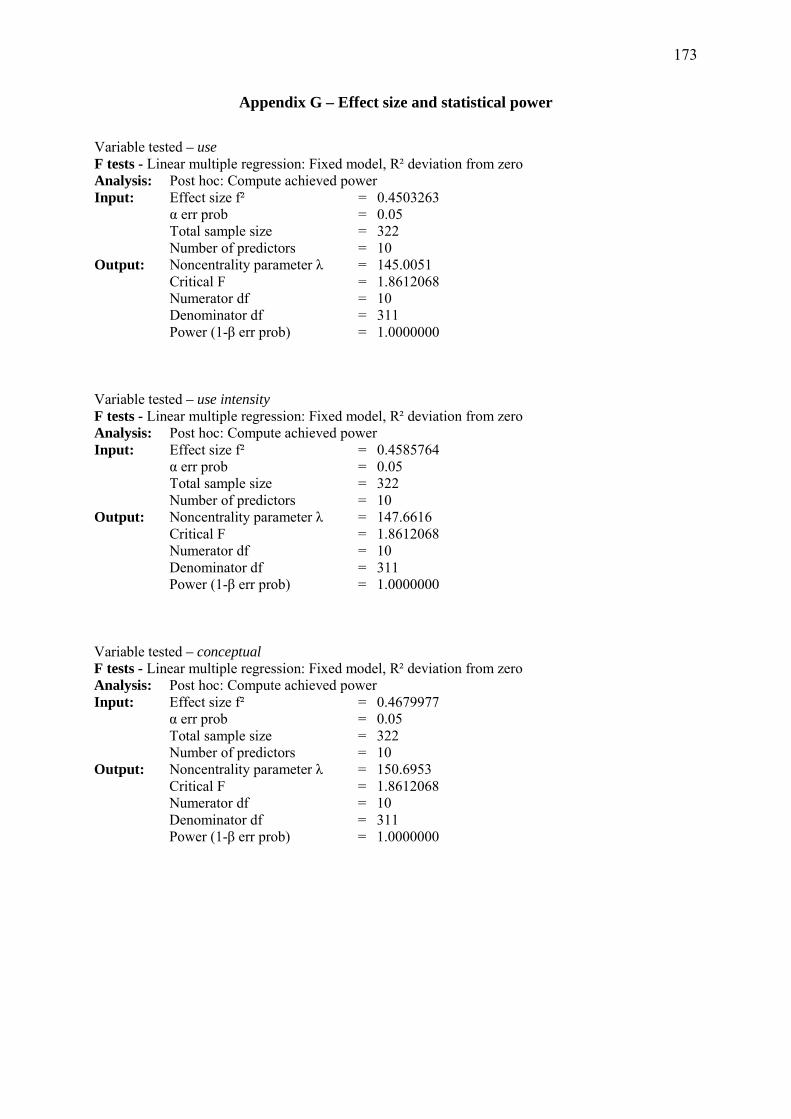
173
Appendix G – Effect size and statistical power
Variable tested – use F tests - Linear multiple regression: Fixed model, R² deviation from zero Analysis: Post hoc: Compute achieved power Input: Effect size f² = 0.4503263 α err prob = 0.05 Total sample size = 322 Number of predictors = 10 Output: Noncentrality parameter λ = 145.0051 Critical F = 1.8612068 Numerator df = 10 Denominator df = 311 Power (1-β err prob) = 1.0000000 Variable tested – use intensity F tests - Linear multiple regression: Fixed model, R² deviation from zero Analysis: Post hoc: Compute achieved power Input: Effect size f² = 0.4585764 α err prob = 0.05 Total sample size = 322 Number of predictors = 10 Output: Noncentrality parameter λ = 147.6616 Critical F = 1.8612068 Numerator df = 10 Denominator df = 311 Power (1-β err prob) = 1.0000000 Variable tested – conceptual F tests - Linear multiple regression: Fixed model, R² deviation from zero Analysis: Post hoc: Compute achieved power Input: Effect size f² = 0.4679977 α err prob = 0.05 Total sample size = 322 Number of predictors = 10 Output: Noncentrality parameter λ = 150.6953 Critical F = 1.8612068 Numerator df = 10 Denominator df = 311 Power (1-β err prob) = 1.0000000

174
Variable tested – instrumental F tests - Linear multiple regression: Fixed model, R² deviation from zero Analysis: Post hoc: Compute achieved power Input: Effect size f² = 0.4507471 α err prob = 0.05 Total sample size = 322 Number of predictors = 10 Output: Noncentrality parameter λ = 145.1406 Critical F = 1.8612068 Numerator df = 10 Denominator df = 311 Power (1-β err prob) = 1.0000000 Variable tested – persuasive F tests - Linear multiple regression: Fixed model, R² deviation from zero Analysis: Post hoc: Compute achieved power Input: Effect size f² = 0.4549687 α err prob = 0.05 Total sample size = 322 Number of predictors = 10 Output: Noncentrality parameter λ = 146.4999 Critical F = 1.8612068 Numerator df = 10 Denominator df = 311 Power (1-β err prob) = 1.0000000