Embed Size (px)
Citation preview

UNIVERSITY OF LJUBLJANA
FACULTY OF PHARMACY
BARBARA SOKOLOVIČ
MASTER'S THESIS
UNIFORM MASTER’S STUDY PROGRAMME PHARMACY
Ljubljana, 2018

UNIVERSITY OF LJUBLJANA
FACULTY OF PHARMACY
BARBARA SOKOLOVIČ
DETECTION OF POLYMORPHS OF PRISTINE PARACETAMOL AND
PARACETAMOL WITH MACROMOLECULAR ADDITIVES ON GLASS
SURFACE
DETEKCIJA POLIMORFOV PARACETAMOLA IN PARACETAMOLA Z
MAKROMOLEKULSKIMI DODATKI NA STEKLENIH POVRŠINAH
UNIFORM MASTER’S STUDY PROGRAMME PHARMACY
Ljubljana, 2018

I
This Master's thesis was performed at the Institute of Pharmaceutical Science in the
Department of Pharmaceutical Technology located at the Karl-Franzens University Graz
under the academic supervision of Prof. Dr. Dr.h.c. Stane Srčič from Faculty of Pharmacy,
University Ljubljana, Slovenia and co-supervision of DI Dr. Oliver Werzer, from the Karl-
Franzens University Graz, Austria.
Acknowledgements
I am thanking my foreign mentor Oliver Werzer for guiding me every step on my master
thesis path, molding my scientific writing skills and overall helping me to make one step
up as a pharmacist. Thank you for your patience, help, all of the passed knowledge and
genuine kindness.
I am also grateful for Christian Röthel at the Department of Pharmaceutical technology at
Karl-Franzens University Graz for setting me up with the Matlab and teaching me the
basics.
Additionally, I am thanking to my favorite person in my life, A.C.L. Firstly, for teaching
me how to work in Corel Draw in order to make all the images for my thesis. Secondly, for
always being there for me, encouraging me and reminding me every day to reach for
impossible and believe in myself.
Statement
I hereby declare that this Master's thesis was done by me, Barbara Sokolovič, under the
academic supervision of Prof. Dr. Stane Srčič from the Faculty of Pharmacy, University of
Ljubljana, Slovenia and co-supervision of DI Dr. Oliver Werzer from Karl-Franzens
University Graz, Austria.
Barbara Sokolovič
Head of MSc Thesis Committee: Assoc. Prof. Matjaž Jeras., Ph.D. (izr. prof. dr. Matjaž
Jeras)
Member of MSc Thesis Committee: Assist. Prof. Izidor Sosič, M. Pharm., Ph. D. (doc. dr.
Izidor Sosič)

II
ABSTRACT
Scientists are often encountered with poorly soluble and hence poorly bioavailable active
pharmaceutical ingredients. Crystal morphology and molecular arrangement within the
crystal and its unit cell have a profound impact on the drugs dissolution rate and its
bioavailability. Therefore, enhanced solubility via thin film is of a great interest. Within
this model study, the active pharmaceutical ingredient paracetamol and its behavior in the
proximity of glass surfaces are investigated. The thin film preparation techniques
employed in this work are drop casting and spin coating. Effects of solvent, matrix
incorporation, and temperature exposure are evaluated for diverse paracetamol samples.
Polarized optical microscopy reveals various morphologies including Maltese cross-like
structures, long and short fan like structures, high-dense, and perforated plaques.
Additionally, X-ray diffraction experiments were done on samples prepared from different
concentrations. Using drop casting from low paracetamol concentrations or spin coating
revealed mainly paracetamol in form III with a preferred 004 texture. Meanwhile, drop
casted samples from high concentration resulted in a powder like behavior and often two
polymorph being present simultaneously but both with preferred orientation; a 004 texture
of form III and a -101 texture of polymorph I. In-situ heat treatment shows that the
polymorphic form can be adjusted so that either polymorph I, II or III can be solely
obtained.
Keywords: paracetamol, polymorphism, spin coating, drop casting, x-ray powder
diffraction, polarized light microscopy, hydroxypropyl methylcellulose, hydroxyethyl
cellulose, methyl cellulose, carboxymethyl cellulose, polymethyl methacrylate, polyvinyl
alcohol, polystyrene.
III
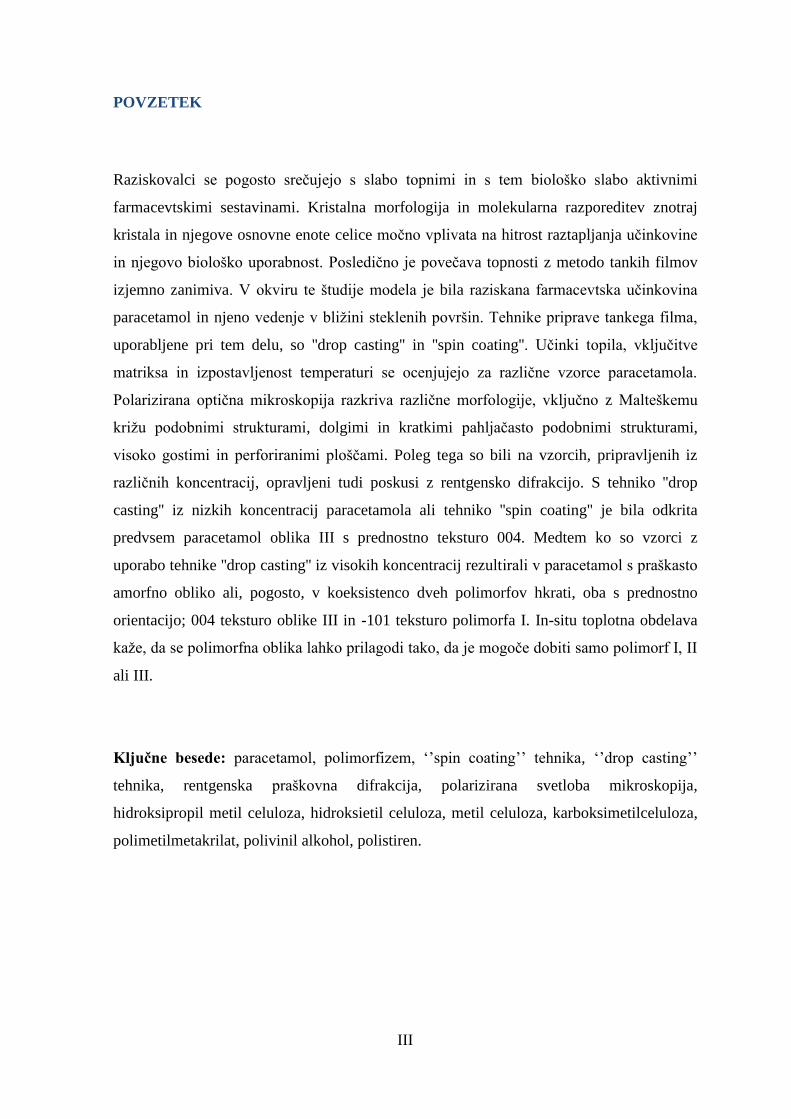
POVZETEK
Raziskovalci se pogosto srečujejo s slabo topnimi in s tem biološko slabo aktivnimi
farmacevtskimi sestavinami. Kristalna morfologija in molekularna razporeditev znotraj
kristala in njegove osnovne enote celice močno vplivata na hitrost raztapljanja učinkovine
in njegovo biološko uporabnost. Posledično je povečava topnosti z metodo tankih filmov
izjemno zanimiva. V okviru te študije modela je bila raziskana farmacevtska učinkovina
paracetamol in njeno vedenje v bližini steklenih površin. Tehnike priprave tankega filma,
uporabljene pri tem delu, so ''drop casting'' in ''spin coating''. Učinki topila, vključitve
matriksa in izpostavljenost temperaturi se ocenjujejo za različne vzorce paracetamola.
Polarizirana optična mikroskopija razkriva različne morfologije, vključno z Malteškemu
križu podobnimi strukturami, dolgimi in kratkimi pahljačasto podobnimi strukturami,
visoko gostimi in perforiranimi ploščami. Poleg tega so bili na vzorcih, pripravljenih iz
različnih koncentracij, opravljeni tudi poskusi z rentgensko difrakcijo. S tehniko ''drop
casting'' iz nizkih koncentracij paracetamola ali tehniko ''spin coating'' je bila odkrita
predvsem paracetamol oblika III s prednostno teksturo 004. Medtem ko so vzorci z
uporabo tehnike ''drop casting'' iz visokih koncentracij rezultirali v paracetamol s praškasto
amorfno obliko ali, pogosto, v koeksistenco dveh polimorfov hkrati, oba s prednostno
orientacijo; 004 teksturo oblike III in -101 teksturo polimorfa I. In-situ toplotna obdelava
kaže, da se polimorfna oblika lahko prilagodi tako, da je mogoče dobiti samo polimorf I, II
ali III.
Ključne besede: paracetamol, polimorfizem, ‘’spin coating’’ tehnika, ‘’drop casting’’
tehnika, rentgenska praškovna difrakcija, polarizirana svetloba mikroskopija,
hidroksipropil metil celuloza, hidroksietil celuloza, metil celuloza, karboksimetilceluloza,
polimetilmetakrilat, polivinil alkohol, polistiren.

IV
TABLE OF CONTENTS
1. INTRODUCTION ................................................................................................................... 1
2. AIM ........................................................................................................................................... 4
3. MATERIALS AND METHODS ............................................................................................ 5
3.1 MATERIALS ........................................................................................................................ 5
3.1.1 POLYMORPHIC FORMS OF PARACETAMOL ......................................................... 5
3.1.2 EXCIPIENTS .............................................................................................................. 10
3.2 METHODS ......................................................................................................................... 11
3.2.1 PREPARATION OF THIN FILMS / DEPOSITION TECHNIQUE ............................ 11
3.2.1.1 Drop casting (35) ...................................................................................................... 11
3.2.1.2 Spin coating (35,40–42) ............................................................................................... 12
3.2.2 CHARACTERIZATION OF MATERIAL and THIN FILMS / CHARACTERIZATION
TECHNIQUES ......................................................................................................................... 13
3.2.2.1 Differential scanning calorimetry (DSC) (43) .......................................................... 13
3.2.2.2 Polarized light microscopy (PLM) (44–46) ................................................................ 14
3.2.2.3 X-ray diffraction (XRD) (47) ................................................................................... 15
4. EXPERIMENTAL WORK .................................................................................................. 17
4.1 MATERIAL CHARACTERIZATION - DIFFERENTIAL SCANNING CALORIMETRY
(DSC) ........................................................................................................................................... 17
4.2 SAMPLE PREPARATION AND CHARACTERIZATION .............................................. 18
4.2.1 PREPARATION OF PURE PARACETAMOL SAMPLES / PRISTINE SAMPLES .... 18
4.2.1.1 Preparation of concentrated paracetamol solutions(48) ........................................... 19
4.2.1.2 The concentration of diluted solutions in steps of halving ................................ 19
4.2.1.3 Sample preparation................................................................................................. 19
4.2.2 PREPARATION OF PARACETAMOL SAMPLES with CELLULOSE ...................... 20
4.2.2.1 Preparation of solutions.......................................................................................... 20
4.2.2.2 Sample preparation................................................................................................. 21
4.2.3 PREPARATION OF PARACETAMOL SAMPLES with SYNTHETIC POLYMERS .. 21
4.2.3.1 Preparation of PVA paracetamol solutions ............................................................ 21
4.2.3.2 PVA sample preparation ........................................................................................ 22
4.2.3.3 Preparation of PS and PMAA paracetamol solutions ............................................ 22
4.2.3.4 PMMA and PS sample preparation ........................................................................ 23
4.3 SAMPLE CHARACTERIZATION .................................................................................... 24
4.3.1 Polarized light microscopy (PLM) ............................................................................. 24

V
4.3.2 X-ray diffraction pattern (XRD) ................................................................................. 24
5. RESULTS AND DISCUSSION ............................................................................................ 25
5.1 CHARACTERIZATION OF THE AS DELIVERED PARACETAMOL POWDER ........ 25
5.1.1 X-ray powder diffraction pattern (XRPD) .................................................................. 25
5.1.2 Differential scanning calorimetry (DSC) ................................................................... 27
5.2 CHARACTERIZATION OF PURE PARACETAMOL SAMPLES .................................. 29
5.2.1 TETRAHYDROFURAN solutions ............................................................................... 29
5.2.2 ACETONE solutions ................................................................................................... 32
5.2.3 WATER solutions ........................................................................................................ 34
5.2.4 96% ETHANOL solutions........................................................................................... 37
5.2.5 ACETONITRILE solutions ......................................................................................... 40
5.2.6 57.6 % ETHANOL solutions....................................................................................... 42
5.3 CHARACTERIZATION OF PARACETAMOL SAMPLES WITH CELLULOSE .......... 45
5.3.1 Carboxymethylcellulose (CMC) ................................................................................. 45
5.3.2 Methylcellulose (MC) ................................................................................................. 48
5.3.3 Hydroxyethyl cellulose (HEC) .................................................................................... 50
5.3.4 Hydroxypropylmethylcellulose (HPMC) .................................................................... 53
5.4 CHARACTERIZATION OF PARACETAMOL SAMPLES WITH SYNTHETIC
POLYMERS ................................................................................................................................ 55
5.4.1 Polyvinyl alcohol (PVA) ............................................................................................. 55
5.4.2 Polymethyl methacrylate (PMMA) ............................................................................. 58
5.4.3 Polystyrene (PS) ......................................................................................................... 63
6. SUMMARY AND CONCLUSION ...................................................................................... 69
7. REFERENCES ...................................................................................................................... 72
LIST OF TABLES
Table I: PARA molecule, crystal system and lattice parameters of PARA polymorphic forms I, II
and III, with corresponding CSD code, cell volume, and space group. Carbon atoms in PARA
molecules are presented in grey color, hydrogen atoms in white color, oxygen atoms in red color
and a nitrogen atom in light violet color. ........................................................................................... 5
Table II: List of solvents and macromolecular additives applied as-purchased. .............................. 10
Table III: Experimental process scheme. ......................................................................................... 18

VI
Table IV: PARA concentrations in final solutions of various solvents. ........................................... 19
Table V: Concentrations of PARA commixed with cellulose in deionized water. .......................... 21
Table VI: Concentration of PARA commixed with 2.00 mg/ml of PVA in 57.6% EtOH solution. 22
Table VII: Concentrations of PARA commixed with either 3.50 mg/ml of PS of 1.29 mg/ml of
PMMA in THF. ................................................................................................................................ 23
LIST OF FIGURES
Figure 1: Visualization of molecular packing of PARA monoclinic form I into herringbone pattern
(A) and it's orientation and H-bonding ring within the unit cell in a direction of a-axis (B) and
along b-axis (C). Unit cell is presented as black edged cube where red color edge indicates a-axis,
green edge indicates b-axis and blue line indicates c-axis. ................................................................ 6
Figure 3: Visual presentation of crystal packing of orthorhombic form III of paracetamol along
random directions. A) Layers of paracetamol with intersheet H-bonding (light blue color) viewed
along b-axis. B) Position of paracetamol molecules and formed hydrogen bonds within the unit cell
viewed along the direction of b-axis. Molecules are displayed without hydrogen atoms for clarity.
C) Position of paracetamol molecules within the unit cell along the c-axis perspective. Unit cell is
presented as black cube where red color edge indicates a-axis, green color edge indicates b-axis and
blue line indicates c-axis. ................................................................................................................... 7
Figure 2: Visual image of orthorhombic PARA form II packing and H-bonding (light blue color)
along b-axis (A), layout of the PARA molecules inside the unit cell along b-axis (B) and H-
bonding circle inside the unit cell along c-axis (C). Unit cell is depicted as black cube where red
color edge indicates a-axis, green edge indicates b-axis and blue line indicates c-axis. For clarity,
images A and B are shown without hydrogen atoms of PARA molecules (white color). ................. 7
Figure 4: X-ray diffraction powder patterns derived from literature data summarized in Table I for
paracetamol in its various forms. ....................................................................................................... 9
Figure 5: Scheme of sample preparation route via drop casting. ..................................................... 11
Figure 6: 4 step scheme of sample preparation via spin coating. ..................................................... 12
Figure 7: Light microscope Axiovert 40 CFL with crossed polarizers (right) and schematic
presentation of the light path through birefringent material (left). ................................................... 14
Figure 8: PANalytical X-ray diffraction intrument and it's main components. ............................... 15

VII
Figure 9: A shematic representation of X-ray diffraction on molecular atoms. Incident beams (k),
coming from X-ray source, hit planes (hkl) in crystal lattice and diffract on atoms. Constructive
diffracted beams (k') are detected..................................................................................................... 16
Figure 10: Intensity as a function of scattering angle for as-purchased paracetamol, Paracetamol
Genericon and Mexalen 500 paracetamol powdered tablet. Patterns are obtain with X-ray
diffraction maschine and shifted for comprehensibility. Vertical lines mark peak positions of
known paracetamol polymorphic forms (I...black, II... blue and III … red). ................................... 26
Figure 11: DSC heating and cooling curves of as-purchased paracetamol powder. The heating
programs are given in the box. Program 1 – blue color, program 2 – red color, program 3 – green
color.................................................................................................................................................. 27
Figure 12: Optical microscopy images of various paracetamol samples prepared via drop casting
from different THF solution: a) 31.15, b) 17.08, c) 8.54, d) 4.27, e) 2.13 and f) 1.07 mg/ml. Images
were taken under crossed polarizers. All images were taken with the same magnification. ............ 29
Figure 13: X-ray diffraction pattern of various drop casted samples prepared from THF solutions
containing different paracetamol amounts; 31.15 (violet), 17.08 (blue), 8.54 (dark green), 4.27
(light green), 2.13 (orange) and 1.07 (brown) mg/ml. Vertical lines mark peak positions of known
paracetamol polymorphic forms (I...black, II... blue and III … red), also known as hkl lines. Curves
are shifted for clarity. ....................................................................................................................... 30
Figure 14: Optical microscopy images of various PARA samples prepared via drop casting from
different acetone solutions: a) 74.97, b) 37.49, c) 18.74 and d) 9.37 mg/ml. Images were taken
under crossed polarizers. All images were taken with the same magnification. .............................. 32
Figure 15: X-ray diffraction pattern of various drop casted samples prepared from acetone solutions
containing different paracetamol amounts; 74.97 (violet), 37.49 (blue), 18.74 (dark green), 9.37
(light green) and 4.69 (orange) mg/ml. Vertical lines (hkl lines) mark peak positions of known
paracetamol polymorphic forms (I ...black and III ... red). Curves were shifted for clarity. ........... 33
Figure 16: Optical microscopy images under crossed polarizer of paracetamol drop casted onto
glass surface from a) 12.61, b) 6.31, c) 3.15, d) 1.58 and e) 0.79 mg/ml water solution. Images were
taken under crossed polarizers. All images were taken with the same magnification. .................... 35
Figure 17: XRD pattern of paracetamol drop casted onto glass surface from 12.61 (violet), 6.31
(blue), 3.15 (dark green), 1.58 (light green) and 0.79 mg/ml (orange) water solutions. Vertical lines
are indicating literature values of paracetamol polymorphs: monoclinic form I (black) and
orthorhombic form III (red). Curves are shifted for clarity. ............................................................. 36
VIII
Figure 18: Optical microscopy images under crossed polarizer of PARA drop casted onto glass
surface from a) 22.96, b) 11.48, c) 5.74, d) 2.87 and e) 1.44 mg/ml 96% EtOH solution. Images
were taken under crossed polarizers. All images were taken with the same magnification. ............ 38
Figure 19: X-ray diffraction pattern of 22.96 (violet), 11.48 (blue), 5.74 (dark green), 2.87 (light
green) and 1.44 (orange) mg/mL paracetamol concentration in 96% EtOH solution drop casted onto
a glass solid surface. Vertical lines mark literature Bragg reflection peak positions of paracetamol
polymorphs: monoclinic form I. (black) and orthorhombic form III (red). Curves were shifted for
clarity................................................................................................................................................ 39
Figure 20: Optical microscopy images of various paracetamol samples prepared via drop casting
from different acetonitrile solutions: a) 11.88, b) 5.94, c) 2.97, d) 1.49, e) 0.74 and f) 0.37 mg/m.
Images were taken under crossed polarizers. All images were taken with the same magnification. 40
Figure 21: X-ray diffraction pattern of 11.88 (violet), 5.94 (blue), 2.97 (dark green), 1.49 (light
green), 0.74 (orange) and 0.37 (brown) mg/mL paracetamol concentration in acetonitrile solution
drop casted onto a glass solid surface. Vertical lines identify literature Bragg reflection peak
positions of paracetamol monoclinic polymorphic form I (black) and orthorhombic form III (red).
Curves were shifted for clarity. ........................................................................................................ 41
Figure 22: Optical microscopy images of various paracetamol samples prepared via drop casting
from different 57.6% EtOH solutions: a) 3.65, b) 1.82, c) 0.91, d) 0.46, e) 0.23 and f) 0.11 mg/ml.
Images were taken under crossed polarizers. All images were taken with the same magnification. 43
Figure 23: X-ray diffraction pattern of 3.65 (violet), 1.82 (blue), 0.91 (dark green), 0.46 (light
green), 0.23 (orange) and 0.11 (brown) mg/ml paracetamol concentration in 57.6% EtOH solution
drop casted onto a glass solid surface. Vertical lines mark literature Bragg reflection peak positions
of paracetamol polymorphs: monoclinic form I. (black) and orthorhombic form III (red). Curves
were shifted for clarity. .................................................................................................................... 44
Figure 24: Images of 8.73% w/w CMC in PARA concentration of A) 11.46 mg/ml, B) 5.73 mg/ml,
C) 2.87 mg/ml and D) 1.43 mg/ml in water solution. Images were obtained with an optical
microscope with crossed polarizers with the same magnification. .................................................. 46
Figure 25: X-ray diffraction pattern of 8.73% w/w CMC in paracetamol concentration of 11.46
mg/ml (violet color), 5.73 mg/ml (blue color), 2.87 mg/ml (dark green color) and 1.43 mg/ml (light
green color) in water solution. Curves were shifted for clarity. Vertical lines indicated form I (black
color), form III (red color) and paracetamol dehydrate (blue color). ............................................... 47

IX
Figure 26: Images of 8.73% w/w MC in PARA concentration of A) 11.46 mg/ml, B) 5.73 mg/ml,
C) 2.87 mg/ml, D) 1.43 mg/ml and E) 0.72 mg/ml in water solution. Images were obtained with an
optical microscope with crossed polarizers with the same magnification. ...................................... 48
Figure 27: X-ray diffraction pattern of 8.73% w/w MC in paracetamol concentration of 11.46
mg/ml (violet color), 5.73 mg/ml (blue color), 2.87 mg/ml (dark green color), 1.43 mg/ml (light
green color) and 0.72 mg/ml (orange color) in water solution. Curves were shifted for clarity.
Vertical lines indicate form I (black color) and form III (red color). ............................................... 49
Figure 28: Images of 8.73% w/w HEC in PARA concentration of A) 11.46 mg/ml, B) 5.73 mg/ml,
C) 2.87 mg/ml, D) 1.43 mg/ml, E) 0.72 mg/ml and F) 0.36 mg/ml in water solution. Images were
obtained with an optical microscope with crossed polarizers with the same magnification. ........... 51
Figure 29: X-ray diffraction pattern of 8.73% w/w HEC in paracetamol concentration of 11.46
mg/ml (violet color), 5.73 mg/ml (blue color), 2.87 mg/ml (dark green color) 1.43 mg/ml (light
green color), 0.72mg/ml (orange color) and 0.36 mg/ml (brown color) in water solution. Curves
were shifted for clarity. Vertical lines indicate form I (black color), form III (red color) and
paracetamol dehydrate (blue color). ................................................................................................. 52
Figure 30: Images of 51.53% w/w HPMC in PARA concentration of A) 11.23 mg/ml, B) 5.62
mg/ml, C) 2.81 mg/ml and D) 1.40 mg/ml in water solution. Images were obtained with an optical
microscope with crossed polarizers with the same magnification. .................................................. 53
Figure 31: X-ray diffraction pattern of 51.53% w/w HPMC in paracetamol concentration of 11.23
mg/ml (violet color), 5.62 mg/ml (blue color), 2.81 mg/ml (dark green color) and 1.40 mg/ml (light
green color) in water solution. Curves were shifted for clarity. Vertical lines indicated form I (black
color), form III (blue color) and paracetamol dehydrate (red color). ............................................... 54
Figure 32: Optical microscopy images of various PARA samples, comixed with 0.02 mg/ml PVA,
prepared via drop casting from 57.60% EtOH solutions. The concentrations used were a) 1.83, b)
0.91, c) 0.46, d) 0.23, e) 0.11 and f) 0.08 mg/ml. All images were taken under crossed polarizers
and same magnification. ................................................................................................................... 56
Figure 33: X-ray diffraction patterns of various paracetamol concentrations: 1.83 (violet), 0.91
(blue), 0.46 (dark green), 0.23 (light green), 0.11 (orange), 0.06 mg/ml (brown) and constant 0.02
mg/ml concentration of PVA drop casted from 57.6% EtOH solution. Curves were shifted for
clarity. Red vertical lines correspond to paracetamol polymorph III. .............................................. 56
Figure 34: X-ray diffraction patterns of various paracetamol concentrations: 1.83 (violet), 0.91
(blue), 0.46 (dark green), 0.23 (light green), 0.11 (orange), 0.06 mg/ml (brown) and constant 0.02

X
mg/ml concentration of PVA in 57.6% EtOH solution. Technique of sample preparation was spin
coating. Curves were shifted for clarity. Red vertical lines correspond to paracetamol polymorph
III. ..................................................................................................................................................... 58
Figure 35: Optical microscopy images of various PARA samples, comixed with 1.29 mg/ml of
PMMA, prepared via drop casting from THF solutions: a) 27.60, b)13.80, c) 6.90, d) 3.45, e) 1.72
and f) 0.86 mg/ml. Images were taken under crossed polarizers and the same magnification. ....... 59
Figure 36: X-ray diffraction patterns of various paracetamol concentrations: 27.60 (violet), 13.80
(blue), 6.90 (dark green), 3.45 (light green), 1.72 (orange), 0.86 mg/ml (brown) and constant 1.29
mg/ml of PMMA drop casted from THF solution. Curves were shifted for clarity. Red vertical
lines correspond to paracetamol polymorph III, black vertical correspond to form I. ..................... 60
Figure 37: : X-ray diffraction patterns of various paracetamol concentrations: 27.60 (violet), 13.80
(blue), 6.90 (dark green), 3.45 (light green), 1.72 (orange), 0.86 mg/ml (brown) and constant 1.29
mg/ml of PMMA drop casted from THF solution and exposed to 80°C. Curves were shifted for
clarity. Red vertical lines correspond to paracetamol polymorph III, black vertical correspond to
form I. ............................................................................................................................................... 61
Figure 38: Optical microscopy images of various PARA samples, comixed with 1.29 mg/ml of
PMMA, prepared from THF solutions: a) 27.60, b)13.80, c) 6.90, d) 3.45, e) 1.72 and f) 0.86
mg/ml. Sample preparation technique was spin coating. Images were taken under crossed
polarizers. All images were taken with the same magnification. ..................................................... 62
Figure 39: : X-ray diffraction patterns of various paracetamol concentrations: 27.60 (violet), 13.80
(blue), 6.90 (dark green), 3.45 (light green), 1.72 (orange), 0.86 mg/ml (brown) and constant 1.29
mg/ml of PMMA in THF solution. Sample preparation technique was spin coating. Curves were
shifted for clarity. Black vertical lines correspond to paracetamol polymorph I. ............................ 62
Figure 40: Optical microscopy images of various paracetamol samples, comixed with 3.50 mg/ml
PS, prepared via drop casting from THF EtOH solutions: a) 27.60, b) 13.80, c) 6.90, d) 3.45, e)
1.72 and f) 0.86 mg/ml. Images were taken under crossed polarizers. All images were taken with
the same magnification..................................................................................................................... 63
Figure 41: X-ray diffraction patterns of various paracetamol concentrations: 27.60 (violet), 13.80
(blue), 6.90 (dark green), 3.45 (light green), 1.72 (orange), 0.86 mg/ml (brown) and constant 3.50
mg/ml of PS drop casted from THF solution. Curves were shifted for clarity. Red vertical lines
correspond to paracetamol polymorph III, black vertical correspond to form I............................... 64

XI
Figure 42: Optical microscopy images of various PARA samples, comixed with 3.50 mg/ml of PS,
prepared via drop casting from THF solutions: a) 27.60, b)13.80, c) 6.90, d) 3.45, e) 1.72 and f)
0.86 mg/ml. Samples were exposed to an elevated temperature of 80°C. Images were taken under
crossed polarizers. All images were taken with the same magnification. ........................................ 65
Figure 43: X-ray diffraction patterns of various paracetamol concentrations: 27.60 (violet), 13.80
(blue), 6.90 (dark green), 3.45 (light green), 1.72 (orange), 0.86 mg/ml (brown) and constant 3.50
mg/ml of PS drop casted from THF solution and exposed to 80°C. Curves were shifted for clarity.
Red vertical lines correspond to paracetamol polymorph III, black vertical correspond to form I. . 66
Figure 44: Optical microscopy images of various PARA samples, comixed with 3.00 mg/ml of PS,
prepared from THF solutions: a) 27.60, b)13.80, c) 6.90, d) 3.45, e) 1.72 and f) 0.86 mg/ml.
Sample preparation technique was spin coating. Images were taken under crossed polarizers and
under the same magnification. ......................................................................................................... 67
Figure 45: X-ray diffraction patterns of various paracetamol concentrations: 1.83 (violet), 0.91
(blue), 0.46 (dark green), 0.23 (light green), 0.11 (orange), 0.06 mg/ml (brown) and constant 3.50
mg/ml concentration of PS in THF solution. Technique of sample preparation was spin coating.
Curves were shifted for clarity. Red vertical lines correspond to paracetamol polymorph III. ....... 68
Figure 46: Illustration of the A) paracetamol form III with the 004 contact net plane and B)
paracetamol polymorph I in the proximity of a glass surface with the net plane -101 and -202. .... 69

XII
LIST OF ABBREVIATIONS
API = Active Pharmaceutical Ingredient
PARA = Paracetamol
BCS = Biopharmaceutics Classification System
SIP = surface induced polymorphs
OTC = over the counter
H-bonding = hydrogen bonding
US = United States
Ch. Nr. = chemical number
T = temperature
P = pressure
DSC = differential scanning calorimetry
PLM = Polarized light microscopy
XRD = X-ray diffraction
XRPD = X-ray powder diffraction
EtOH = ethanol
THF = tetrahydrofuran
wt% = percentage by mass / percentage by weight
CSD = Cambridge Structural Database reference code
GPa = gigapascal
Å = length unit Ångström = 10−10 m
rps = rounds per second
HPMC = hydroxypropyl methyl cellulose
HEC = hydroxyethyl cellulose
MC = methyl cellulose
CMC = carboxymethyl cellulose
PMMA = Polymethly methacrylate
PVA = Polyvinyl alcohol
PS = Polystyrene

1
1. INTRODUCTION
Regarding the fact, that approximately ''85% of the most sold drugs in the USA and Europe
are orally administered''(1), it is safe to state that aqueous solubility factor is of the highest
importance. For almost half of the active pharmaceutical substances (API) low solubility
rates have usually been, and still are, a huge drawback especially when oral administration
is considered. Low aqueous solubility leads to a lower amount of drug available in a
solution form which is the necessary state for sufficient gastrointestinal tract absorption of
the API. This reduction in systemic absorption can consequently cause poor drug
bioavailability thus lower therapeutic efficiency. Consequently, higher amounts of API are
usually used to counteract, meaning, the peak plasma levels can be still increased. But the
higher dose might cause a greater risk of severe side effects. Therefore, it is necessary to
enhance dissolution properties and aqueous solubility for API classified by
Biopharmaceutics Classification System (BCS) as class II or IV, that is, API with a low
solubility parameter(1). Although the improvement of solubility can be sometimes very
challenging, it is true that several effective techniques have already been developed.
Some of the most exposed and used approaches for overcoming poor solubility is a
reduction of particle size (2–7), preparation of solid dispersions (8), use of surfactants and
solubilizers (9), use of supercritical fluid processes (4) and complexation with cyclodextrins
(3,10). In addition, many researchers focus on the solubility enhancement with the formation
of amorphous forms (7,11–15), modification of crystalline forms, such as co-crystals (14–17) or
the formation of favorable polymorphs (14,15). One might say that the amorphous form is the
most favored due to the enhanced solubility and dissolution rate. The biggest disadvantage
of a high energetic amorphous state is its short shelf life, nevertheless, this state is still not
eliminated for application purposes. The second law of thermodynamics states that the
energy systems have a tendency to increase their entropy, in other words, increase disorder.
On the contrary, different rules apply here. Amorphous drugs, which have no long-range
molecular order, have a thermodynamic tendency to crystallize over time, that is, organize
in a translation lattice also known as the crystal structure. These transitions are difficult to
predict and are undesirable. And even though researches are finding some new ways to
prolong the shelf life of amorphous drugs (7,11,13,18,19), however, the majority of studies
nowadays are focusing on the polymorphs control. Furthermore, it is important to

2
emphasize that despite crystalline form being far more stable and expressing stronger
molecular bonding than amorphous form, not all crystalline forms have equal long-term
stability and physiochemical properties. This follows from the fact that APIs molecules can
arrange in a variety of ways, which influences these differences between many polymorphs
of API. According to the Ostwald rule of stages, the first form to crystallize from
amorphous solid or amorphous liquid is the most unstable one. Throughout the time
crystals convert to the thermodynamically most stable form. This follows from the fact that
the system strives to move to equilibrium, i.e., to the stable polymorph, with the least effort
via minimum energy route (20).
One of the ways to control and modify crystallization of an API into a specific, desired
metastable polymorph and its morphology is a preparation into thin films. This means the
API is in proximity to a substrate surface, which might be made of the cellulose, other
polymers, single crystal metals or silica surfaces. Often fast preparation into thin film
results in amorphous layers, through which crystallization can take place. Depending on
the material the amorphous state may prevail long or crystallization might even be
accelerated (12). The acceleration typically results from the surface acting as nucleation or
crystallization catalyst while it reduces the entropy of the system (21). The surface can even
stabilize to a certain extend metastable polymorphs (22,23). For example, prolonged
stabilization of paracetamol elusive form III (22). In addition, accelerated crystallization
often promotes the formation of surface-induced polymorphs (SIPs), that is new
polymorphic forms which are induced only in the proximity of a surface (21). A nice
example of such API is phenytoin (21,24–27). Moreover, API crystals in the proximity of the
solid surface (in a thin film) very often arrange systematically with defined facets with
respect to the surface which is often referred as texture (12,13,18,22,25,27,28).
Two of the most uncomplicated and straightforward techniques for preparation of thin
films on a solid surface are drop casting and spin coating. In spite of the simplicity of these
two methods and their potential for swiftly obtained crystals, they are rarely used for mass
production in pharmaceutics. Therefore, it is interesting for discovering new and unknown
polymorphic forms, as well as stabilization of certain polymorphs.

3
Additional ways to manipulating crystalline forms are process parameter modifications
such as the solvent choice(28), API concentration, temperature, pressure, relative humidity,
route of preparation and its parameters, and the addition of matrix molecules amongst
others. All these parameters can also show a significant impact on the morphology, which
has also a profound impact on the dissolution rate. For example, having a larger surface
area means that a faster dissolution is expected which might be obtained by a rough surface
or smaller particle dimensions.
In this work, the model API chosen for investigation is paracetamol. Widely and most
commonly used prescribed and OTC drug as antipyretic and analgesic. Some of the
advantages of it as a model drug is related to its capability to grow and evolve in various
different polymorphs on a surface, that is, the monoclinic form I and orthorhombic forms II
and III (23). Which type of polymorph will develop depends on many various conditions, as
mentioned in previous paragraphs. For instance, Yeager et al. reported dip coating of
paracetamol from an ethanol (EtOH) solution produced large crystals of orthorhombic
form. Meanwhile, when using water as a solvent, a film with mixed characters developed.
(23) A few years later, Ehmann et al. published one of the most valuable research which set
the base for this work. They revealed a process carried out at ambient conditions which
lead to obtaining and stabilizing elusive orthorhombic polymorph II when preparing a thin
film with a spin coating on the glass surface using THF solution. Meanwhile, if the act of
rapidly exposing the sample to the elevated temperature of 110°C occurs, stabilized form
III is obtained. (22)
Stabilization of paracetamol metastable polymorphs III is also possible to achieve with the
incorporation of molecular additives. Undoubtedly, not all additives have this ability. Some
were reported to enhance crystallization time, while other suppressed or had no influence
on it. One of the examples that support the enhancement is hydroxypropyl methylcellulose
(HPMC), 10 wt% of it to be exact. With its presence in paracetamol, form III can be
produced. When exposing this binary mixture to elevated temperatures over 130°C it
transforms to form II. (29) A couple of years later, the use of ß-1,4-saccharides was
demonstrated to produce and stabilize paracetamol form III, which withstand a one-year
stability test. (30) In any way, the inclusion of an excipient matrix, as well as temperature
regulation, alters the crystallization kinetics and thus alters APIs morphology and crystal
forms.

4
2. AIM
The aim of this work is to study the polymorphic behavior of paracetamol (PARA)
employing typical thin film preparation techniques. This means the API is deposited onto a
solid support and samples can then be studied using a variety of techniques including
microscopy and X-ray diffraction. The impact of variation in the solvent and the API
concentration will be investigated as well as the change in the process conditions.
Moreover, we will test binary mixtures of PARA with various cellulose derivatives, such
as carboxymethyl cellulose, methyl cellulose, hydroxyethyl cellulose, hydroxypropyl
methylcellulose and various synthetic polymers, such as polyvinyl alcohol, polystyrene,
polymethyl methacrylate. Additionally, the effect of exposing binary mixtures as well as
pure PARA thin films to the room and elevated temperatures is elucidated.

5
3. MATERIALS AND METHODS
3.1 MATERIALS
Paracetamol (PARA) known also as acetaminophen on the US market is the API chosen as
a model drug. Its chemical structure is C8H9NO2 and the steric arrangement is depicted in
Table I. The material used is a ready to go commercial powder typically accessible for
direct tableting and was kindly provided by G.L. Pharma GmbH (Ch. Nr: 09/1391). For
our studies the material was used as received, i.e. no further purification was done.
3.1.1 POLYMORPHIC FORMS OF PARACETAMOL
It is well known that three polymorphic forms of PARA exist which are experimentally
accessible under moderate environments and some others form only under more sever
conditions (see below). Hereby the molecules adapt differently in the solid state which then
leads to its different properties in the application. As the first three are relevant for this
study the information on their unit cell are summarized in Table 1.
Table I: PARA molecule, crystal system and lattice parameters of PARA polymorphic forms I, II and III, with
corresponding CSD code, cell volume, and space group. Carbon atoms in PARA molecules are presented in grey
color, hydrogen atoms in white color, oxygen atoms in red color and a nitrogen atom in light violet color.
Paracetamol
molecule
Polymorph Form I Form II Form III
Crystal system monoclinic orthorhombic orthorhombic
a [Å] 7.09 17.17 11.84
b [Å] 9.21 11.78 8.56
c [Å] 11.60 7.21 14.82
α [°] 90.00 90.00 90.00
β [°] 97.84 90.00 90.00
γ [°] 90.00 90.00 90.00
Cell volume 750.39 1458.02 1501.41
Space group P 21/n P b c a P c a 21
6
Polymorph Form I Form II Form III
CSD code HXACAN30 HXACAN08 HXACAN29
Source (31,*) (31,*) (32;*)
*CSD data obtained from https://www.ccdc.cam.ac.uk
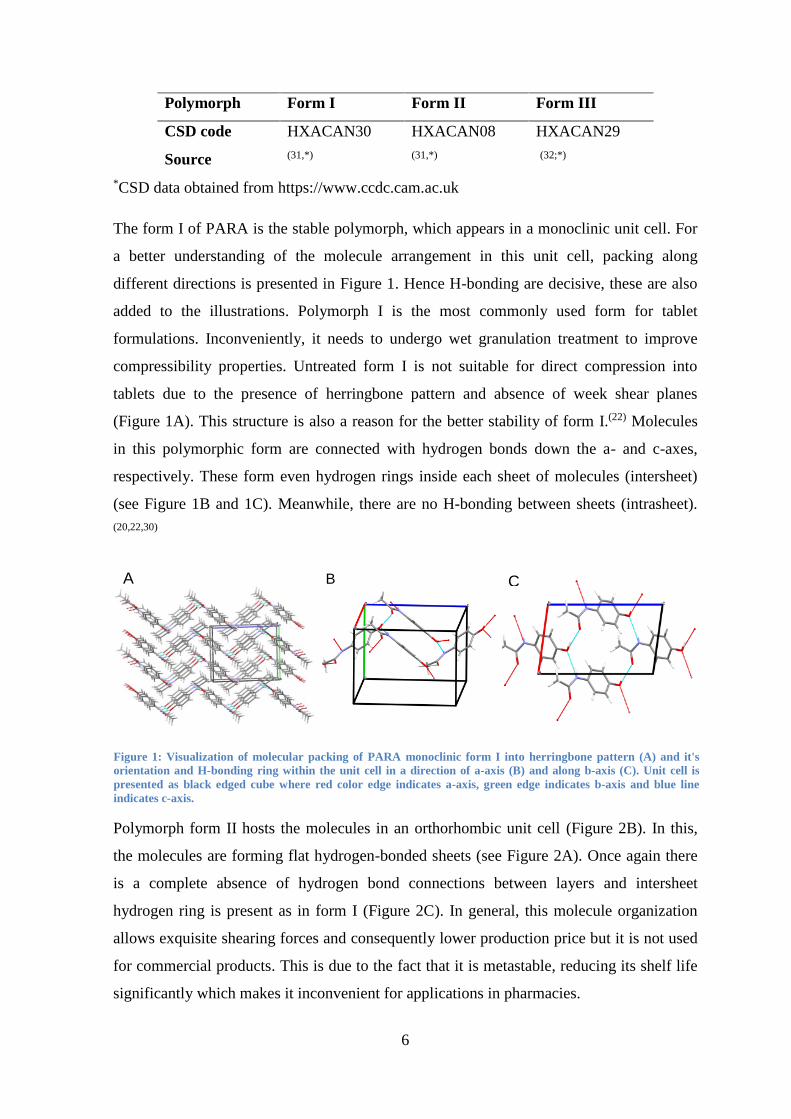
The form I of PARA is the stable polymorph, which appears in a monoclinic unit cell. For
a better understanding of the molecule arrangement in this unit cell, packing along
different directions is presented in Figure 1. Hence H-bonding are decisive, these are also
added to the illustrations. Polymorph I is the most commonly used form for tablet
formulations. Inconveniently, it needs to undergo wet granulation treatment to improve
compressibility properties. Untreated form I is not suitable for direct compression into
tablets due to the presence of herringbone pattern and absence of week shear planes
(Figure 1A). This structure is also a reason for the better stability of form I.(22) Molecules
in this polymorphic form are connected with hydrogen bonds down the a- and c-axes,
respectively. These form even hydrogen rings inside each sheet of molecules (intersheet)
(see Figure 1B and 1C). Meanwhile, there are no H-bonding between sheets (intrasheet).
(20,22,30)
Polymorph form II hosts the molecules in an orthorhombic unit cell (Figure 2B). In this,
the molecules are forming flat hydrogen-bonded sheets (see Figure 2A). Once again there
is a complete absence of hydrogen bond connections between layers and intersheet
hydrogen ring is present as in form I (Figure 2C). In general, this molecule organization
allows exquisite shearing forces and consequently lower production price but it is not used
for commercial products. This is due to the fact that it is metastable, reducing its shelf life
significantly which makes it inconvenient for applications in pharmacies.
Figure 1: Visualization of molecular packing of PARA monoclinic form I into herringbone pattern (A) and it's
orientation and H-bonding ring within the unit cell in a direction of a-axis (B) and along b-axis (C). Unit cell is
presented as black edged cube where red color edge indicates a-axis, green edge indicates b-axis and blue line
indicates c-axis.
A B C

7
Form III is an elusive form as it hardly forms in bulk solution environments. In this form
the packing and bonding of molecules are similar to form II, herefore we see flat layers
with intersheet H-bonding and complete lack of those in intrasheet (Figure 3A and 3B).
One of the differences between form II and III is in the tilting angle of benzene rings in
respect to the hydrogen bonding (H-bonding) plane. The second difference is in the
number of layers that expand over a unit cell. In form II the unit cell consists of two layers,
while in form III there are four (Figure 2 B and 3B) (32). Typically form III is also
metastable, but as already mentioned by Ehmann et. all. form III might be stabilized by
using a solid supports (substrate) which will be also demonstrated in this work.
Neumann and Perrin mentioned even putative new form IV (33). This was experimentally
confirmed with use of high pressure (8.1 GPa) by Smith et al., who additionally provided
evidence of the existence of polymorphic form V. By increasing pressure to 11 GPa a
A B C
Figure 3: Visual image of orthorhombic PARA form II packing and H-bonding (light blue color) along b-axis (A),
layout of the PARA molecules inside the unit cell along b-axis (B) and H-bonding circle inside the unit cell along c-
axis (C). Unit cell is depicted as black cube where red color edge indicates a-axis, green edge indicates b-axis and
blue line indicates c-axis. For clarity, images A and B are shown without hydrogen atoms of PARA molecules
(white color).
A B C
Figure 2: Visual presentation of crystal packing of orthorhombic form III of paracetamol along random directions.
A) Layers of paracetamol with intersheet H-bonding (light blue color) viewed along b-axis. B) Position of
paracetamol molecules and formed hydrogen bonds within the unit cell viewed along the direction of b-axis.
Molecules are displayed without hydrogen atoms for clarity. C) Position of paracetamol molecules within the unit
cell along the c-axis perspective. Unit cell is presented as black cube where red color edge indicates a-axis, green
color edge indicates b-axis and blue line indicates c-axis.

8
transition from form IV to form V occurs. (34) To this day their crystal structure is still
unknown.
The different packing of the PARA molecules in these different polymorphs makes it
possible to identify them by employing X-ray diffraction measurements. Therefore the
experimental results are compared to literature data which often is referred to as qualitative
phase analysis. In Figure 4, the calculated powder patterns for the various forms are
summarized. As the most intense peaks are observed for scattering angles located between
10° and 30° only this region is discussed here.
The X-ray powder pattern of PARA form I, II and III reveal various peaks over the entire
angular range. For the form I the first peak at around 12.30° is followed by a series of
many other peaks of comparable intensity. The strongest peak is close to 27.00° and
corresponds to the -122 reflections.
In the form II, the first peak is located at 10.30° followed by many other peaks. Compared
to the form I the number of peaks appear to be smaller which results from the fact of higher
symmetry being present, which make different reflection occurring at the same scattering
angle more likely. The strongest peak resulting from form II is the 002 reflection which is
located at 24.67°. Having peaks of much higher intensity often means that the (electron)
density variation in this direction is more pronounced, thus some information on the
packing can be directly derived.
In the pattern of form III, there is also a peak at low scattering angles, but its intensity is
very low. Nevertheless, similar to form II there are many different peaks with two strong
peaks located at 19.18° and 24.00°. These two reflections correspond to the 202 or 004
reflections, respectively.
The X-ray diffraction pattern shows that there are many different peaks for the various
polymorphic forms which for this thesis, allows identifying the polymorphic form being
present. It should be noted in addition that the patterns in Fig. 4 are those for a perfect
powder. A perfect powder in general means that many crystals in the sample exists,
whereby their spatial orientation is completely random. Having than peak intensities that
deviate from those of a perfect powder sample allow to conclude that the sample is
textured, i.e. one net plane is statistically more often parallel to the surface compared to the

9
others. As will be shown, this occurs quite frequently for samples prepared on solid
supports.
Figure 4: X-ray diffraction powder patterns derived from literature data
summarized in Table I for paracetamol in its various forms.

10
3.1.2 EXCIPIENTS
Other substances, that is, solvents and macromolecular additives, which were used as-
purchased in this work are listed in Table II. A stock solution of 57,6% EtOH was prepared
as described below.
Table II: List of solvents and macromolecular additives applied as-purchased.
Substances CAS number Manufacturer
Aceton 67-64-1 Carl Roth GmbH+Co.KG,
Acetonitrile 75-05-8 VWR International, LLC (Germany)
THF 109-99-9 VWR International, LLC (Germany)
EtOH 96% 64-17-5 Merck KGaA (Germany)
Distilled Water / Institute of Pharmaceutical Sciences,
University of Graz
HPMC 9004-65-3 Alfa Aesar (Germany)
CMC 70293 /
MC 9004-67-5 Caelo; Caesar & Loretz GmbH
(Germany)
HEC 9004-62-0 Merck KGaA (Germany)
PVA 821038 Merck KGaA (Germany)
PS Mw
of 100 kDa
9003-53-6 Sigma-Aldrich Chemie GmbH
(Germany)
PMMA 9011-14-7 Sigma-Aldrich Chemie GmbH
(Germany)
STOCK SOLUTION OF 57.6% EtOH
500 ml of 57.6% EtOH solution was prepared with mixing water and 96% EtOH in ratio
2:3 (= water:96% EtOH). This solution was primarily prepared to dissolve PVA.
11
3.2 METHODS
3.2.1 PREPARATION OF THIN FILMS / DEPOSITION TECHNIQUE
Two conventional methods of thin film preparation from solution were applied in this
research: i) drop casting and ii) spin coating.
3.2.1.1 Drop casting (35)
Drop casting is the simplest and very inexpensive deposition technique for thin film
fabrication. It prides on the low waste of used material and no need for any special
equipment. (36) Some of the limitations of this method are poor homogeneousness of
material layer and tremendous challenge when wanting to predict sample thickness. While
this thesis is not a formulation study, but a model study, these downsides does not have an
impact on the experimental work.
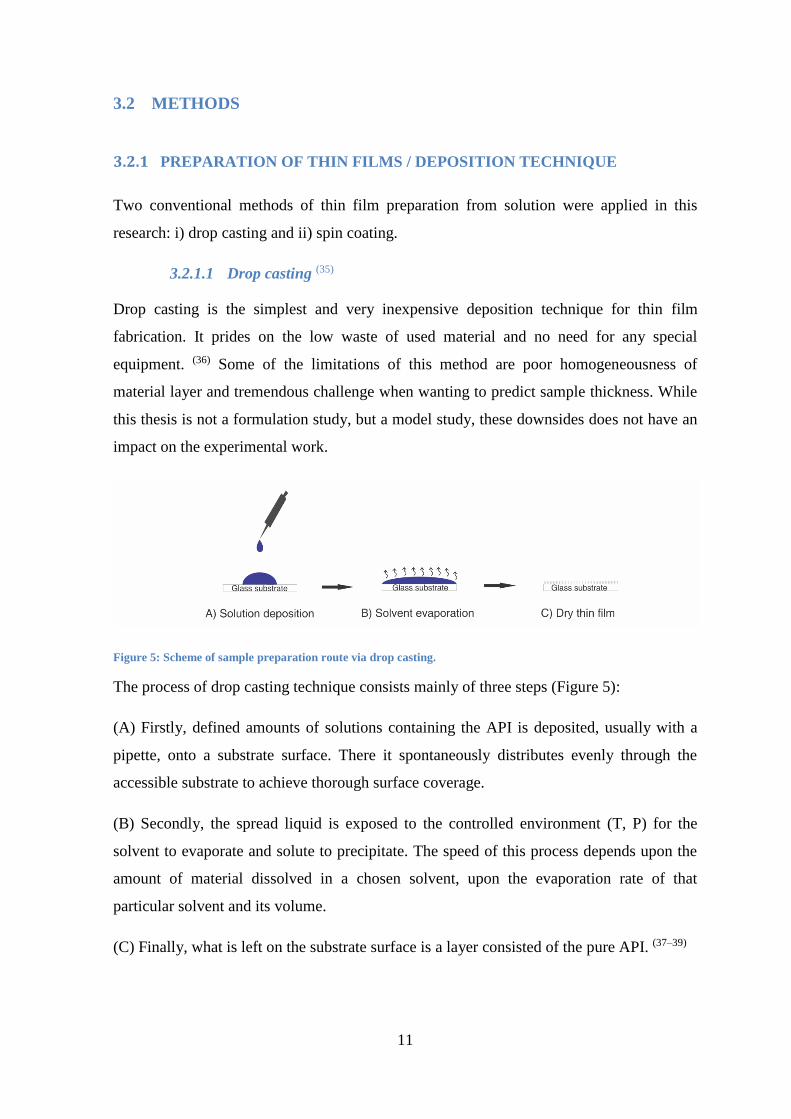
Figure 5: Scheme of sample preparation route via drop casting.
The process of drop casting technique consists mainly of three steps (Figure 5):
(A) Firstly, defined amounts of solutions containing the API is deposited, usually with a
pipette, onto a substrate surface. There it spontaneously distributes evenly through the
accessible substrate to achieve thorough surface coverage.
(B) Secondly, the spread liquid is exposed to the controlled environment (T, P) for the
solvent to evaporate and solute to precipitate. The speed of this process depends upon the
amount of material dissolved in a chosen solvent, upon the evaporation rate of that
particular solvent and its volume.
(C) Finally, what is left on the substrate surface is a layer consisted of the pure API. (37–39)

12
The thickness of the layer is highly influenced by concentration and volume of the
deposited solution. Meanwhile, the variability of film thickness is a result of solvent choice
and its evaporation rate. Usually, the majority of deposited material accumulates on the
edges of the drop due to convection which often is named coffee ring/stain effect.
Nevertheless, the film on the substrate is neatly arranged. (39,40) While the solvent is
evaporating, the molecules are spontaneously reordering. Temperature and solvent choice
significantly influence the process of self-assembly or crystallization. Higher temperatures
and higher solvent evaporation rates often result in a lower quality of crystal growth due to
the lower time available for molecular organizing.
3.2.1.2 Spin coating (35,40–42)
Spin coating is an advanced deposition technique used when required thin films on the
nanometer scale. Unlike drop casting, spin coating produces more homogeneous thin films.
(37,39) The method is still simple, but slightly more complex in its optimization due to more
steps being involved (Figure 6).
Figure 6: 4 step scheme of sample preparation via spin coating.
In principle four steps can identify which are worth mentioning for the purpose of this
thesis:
(A) Coating process starts with depositing solution on the center of the flat substrate
surface. The substrate is usually already placed onto a spin coater stage.
(B) Immediately after the application of coating material, the substrate is initiated to spin at
high speed in order to produce a uniform liquid film. Rotation at higher speed produces a
centrifugal force which causes the material to spread evenly through the substrate surface
and flung off the waste material. Consequently, the primarily deposited material layer
becomes thinner.s

13
(C) Following, the specimen is continued to spin under defined environments of set
temperatures, humidity or pressure. There it is left for complete solvent evaporation, which
causes additional thinning of the film. (37–39,42)
(D) The result of a very thin layer is fast drying which leaves less time for molecules to
properly arrange compared to the drop casting process, therefore, produces less ordered
film on the sample surface. Even the formation of amorphous layers is therefore
achievable.
3.2.2 CHARACTERIZATION OF MATERIAL and THIN FILMS /
CHARACTERIZATION TECHNIQUES
3.2.2.1 Differential scanning calorimetry (DSC) (43)
Differential scanning calorimetry is one of the techniques of thermal analysis. It measures
the temperature difference between samples and reference, which are submitted to the
same temperature program. ''A sample of known mass is heated or cooled while the
changes in its heat capacity are tracked as changes in the heat flow.'' (43) Heat flow in watts
(W) refers to the amount of heat transferred in a time unit, i.e. how much heat is going into
or out of the sample. If the sample receives energy, the detected change is endothermic,
when the sample releases the energy, we are talking about the exothermic process. Results
of DSC measurement offers information about thermic events, which are characterized by
enthalpy change in a given temperature interval.
There are two types of DSC calorimeters. DPSC; power compensation and DTSC; heat
flux. Here, we used a DSC 204 F1 Phoenix (Netzsch, Selb, Germany) which represents a
DTSC type setup. The feature of DTSC is single heater simultaneously heating the
reference and the sample. Meanwhile, we are measuring the difference in temperature
between both pans, which occurs while heating. Heating and cooling process can be done
one or multiple times. In some cases, the cycling process is efficient while it is possible to
achieve a new polymorphic form.
The exact position and height of peaks which are detectable from thermograms are
dependent upon the heating rate. Increased heating rate increases measured heat flow, i.e.
bigger peaks, and increases sensitivity, but on the account of decreased resolution. At
increased heat flow the thermic events start to overlap. Even the sensor has some time

14
lapse due to its thermal conductivity and structure. Altogether this leads to decreased
resolution. It follows, decreased heat flow results in increased resolution, but reduced
sensitivity.
3.2.2.2 Polarized light microscopy (PLM) (44–46)
Polarized optical microscopy (PLM) is a technique used for observing and studying the
morphology of birefringent materials, such as crystals, with the help of polarized light.
PLM helps us to distinguish crystalline and amorphous areas of a sample and sometimes
even the crystal form can be identified. Besides a standard optical setup for conventional
microscopes, the PLM requires additional key components, i.e. crossed polarizers.
Here a first polarizer is set prior to the sample. Polarized light is hereby achieved with
simple plastic foils which are uni-directional drawn. Such foils are capable to absorb
particular waves so that after the polarizer the light is linearly polarized. Besides the
polarizer, it is necessary to place a second polarizer (now called analyzer) behind the
specimen. The polarization direction is set perpendicular (90°) onto this of the polarizer
(see Figure 7). Without any further component, i.e. birefringent specimen, an observer will
not experience any information, i.e. a screen will remain dark.
As already emphasized, PLM requires a special type of samples; optical anisotropic or
birefringent specimens which most of the crystals are. The capability of birefringent
materials is to rotate polarized light due to an anisotropic wave propagating properties.
Figure 7: Light microscope Axiovert 40 CFL with crossed polarizers (right) and schematic presentation of the
light path through birefringent material (left).

15
This means that an observer experiences information also after the analyzer. The type of
the image and colors that we see depends on the type of object, the density or thickness of
the sample and orientation of the sample on the specimen slide.
3.2.2.3 X-ray diffraction (XRD) (47)
''Powder X-ray diffraction (PXRD) is the front-line technology to analyze polymorphs.'' (48)
It is an efficient, non-destructive method used for the study of the molecular structure of
crystals. In this work, XRD was used with the aim to identify the polymorphic form
achieved in specific recrystallized paracetamol specimens. But rather than using a powder
diffraction setup a reflectometer setup is used, which better suited the investigations of thin
films.
The setup used was an Empyrean Reflectometer from Panalytical (Netherlands). A copper
sealed tube and a parallel beam mirror provided monochromatic X-rays with a wavelength
λ of 0.154nm. For sample alignment, a Eulerian cradle with additional height alignment
was set. The diffracted intensity was collected using a 3d-PixelTM solid state area detector.
For the experiment, the X-ray beam was shot onto the sample under defined angles theta
(θ) and the diffracted beam was collected at a mirror position. Such a scan is often referred
to θ/2θ scan. And such scans were done over a large variety of angles.
As already determined by Bragg and his son, X-ray will be bounced back from the net
planes. Constructive interference only occurs in this situation, if the phase shift from one
layer to a next is multiple integers of the wavelength (see Figure 9) which can be written in
the famous Bragg's Law:
Figure 8: PANalytical X-ray diffraction intrument and it's main components.

16
nλ=2d sin θ.
Here d denotes the separation of the net plane. Further, the relative orientation of the net
plane with the incident and diffracted beam is decisive. Only in the case of a mirror
symmetric arrangement constructive interference can take place which derives from the
Laue conditions. (49)
The data sets produced from measurements are plotted as intensity versus the diffraction
angle, as it was already introduced. Identification of the sample is achieved by comparing
the experimental X-ray diffraction patterns with reference patterns in Figure 4. The
comparison is accompanied with the opportunity to assign Miler indices (hkl) to obtained
peaks in the X-ray curve. Gathered net planes (hkl) reveal to us a polymorphic form of
grown crystals. Assuming crystallites possess random orientation, there will be diffraction
on different hkl planes at specific angles. Having the low amount of peaks this typically
shows preferred orientation is present, thus favorable contacting facets of the crystals exist.
Figure 9: A shematic representation of X-ray diffraction on molecular atoms.
Incident beams (k), coming from X-ray source, hit planes (hkl) in crystal
lattice and diffract on atoms. Constructive diffracted beams (k') are detected.

17
4. EXPERIMENTAL WORK
4.1 MATERIAL CHARACTERIZATION - DIFFERENTIAL SCANNING
CALORIMETRY (DSC)
13.8 mg of as-purchased paracetamol powder of form I was loaded onto an aluminum pan
and sealed with pierced aluminum crucible using a standard crucible sealing press. The lid
was perforated in order to allow the atmosphere above the sample to expand if necessary.
Sealed pan with perforated lead is supposed to provide its own atmospheric pressure at
normal pressure, which usually leads to narrower peaks.
The measurement was performed using DSC 204F1 Phoenix Differential Scanning
Calorimeter. Measured data were evaluated using the Proteus Software and Microsoft
Excel 2010.
The sample was subjected to a temperature program as follows:
1. Program I: heating from room temperature (26°C) to 200 °C with the heating rate
10 °C/min, isotherm for 5 min, cooling back to 20° (heating rate of -5 °C/min).
After isotherm for 8 min, we continued with program II.
2. Program II: heating from 20 to 200 °C using heating rate 10 °C/min, isotherm for
15 min, cooling to 20°C with the rate of -2 °C/min. Isotherm for 8 min, followed by
program III.
3. Program III: heating from 20 to 200 °C (heating rate 5 °C/min), isotherm for 6 min,
cooling to 20°C with the rate of -1 °C/min.

18
4.2 SAMPLE PREPARATION AND CHARACTERIZATION
A schematic of the experimental process is given in Table III. The first step was the
preparation of paracetamol solutions. We have prepared pure paracetamol, paracetamol
comixed with natural macromolecules, i.e. cellulose, and paracetamol comixed with
synthetic polymers in various solvents. The next step was typically the preparation of
samples using either drop casting or spin coating from the previously prepared solutions.
Furthermore, prepared samples were exposed to room or elevated temperature in the order
of change the solvent evaporation and crystals growth conditions. The last step of the
experimental process involved the examination of samples with polarized light microscopy
and X-ray diffraction techniques.
4.2.1 PREPARATION OF PURE PARACETAMOL SAMPLES / PRISTINE
SAMPLES
The effect of the solvent choice, as well as the solvent concentration of the solute, was
investigated in order to evaluate if morphology and obtained polymorph alter with
changing parameters, i.e. a solvent and paracetamol (PARA) amount. Firstly, highly
concentrated PARA solutions in various solvents were prepared.
Table III: Experimental process scheme.

19
4.2.1.1 Preparation of concentrated paracetamol solutions(48)
A series of PARA solutions were prepared in glass dram vials, respectively, in acetone,
tetrahydrofuran (THF), acetonitrile, water, 57.60% EtOH and 96.00% EtOH. For each
solvent, a highly concentrated solution containing PARA was prepared by adding more
and more solvent to pre-weighted PARA powder until to the naked eye no visible particles
were seen in the saturated solution. The values are summarized in Table IV.
4.2.1.2 The concentration of diluted solutions in steps of halving
This was obtained by adding the same amount of solvent so that the actual dilution factor
was two. The resulting concentration values for each solution used are given in Table IV.
Table IV: PARA concentrations in final solutions of various solvents.
Paracetamol concentration [mg/mL]
Solvent C
THF 34.15 17.08 8.54 4.27 2.13 1.07
Purified Water 12.61 6.31
3.15 1.58 0.79 /
96% EtOH 22.96 11.48 5.74 2.87 1.44 /
Acetonitrile 11.88 5.94 2.97 1.49 0.74 0.37
Acetone 74.97 37.49 18.74 9.37 4.69 /
57.6% EtOH 3.65 1.82 0.91 0.46 0.23 0.11
4.2.1.3 Sample preparation
As substrates, standard microscope glass slides (Carl Roth GmbH+Co.KG, Germany) were
manually precut into the quadratic shape of 1.25 cm x 1.25 cm. During the procedure,
sterile gloves were used in order to prevent greasy stains on the glass. Additionally, high
pressured air was applied in order to dust off the particles which could also potentially
serve as crystal nucleation seeds. Then defined amount of 80 µl of each solution was drop
casted, with the use of micropipette, onto the clean and precisely leveled glass substrate.
These samples were left in the fume hood at room temperature until the solvent completely
evaporated and a homogenous layer of approximately 0,09 µm– 30,23 µm remained,
typically 24h was chosen.

20
4.2.2 PREPARATION OF PARACETAMOL SAMPLES with CELLULOSE
The effect of cellulose on PARA crystallization from a purified water solution was
investigated. Therefore, a series of water solutions were prepared, respectively, with
carboxymethyl cellulose (CMC), methylcellulose (MC), hydroxyethyl cellulose (HEC) and
hydroxypropyl methylcellulose (HPMC), cosoluted with PARA.
4.2.2.1 Preparation of solutions
Preparation of CELLULOSE STOCK SOLUTIONS
HPMC: 10 ml HPMC stock solution of concentration 53 mg/ml was prepared.
Firstly, 2/3 of the required amount of deionized water was heated up in a glass Erlenmeyer
flask on a magnetic stirrer to around 70°C. Next, pre-weighted HPMC powder was
dispersed in a hot water. Lastly, the remaining amount of cold water was mixed into the
hot slurry. In order to ensure complete dissolution of HPMC, a prepared solution was
additionally magnetically stirred until cooling for about 1 hour.
CMC, HEC, and MC: 2 ml stock solutions, each of 10 mg/ml concentration, were
prepared simply by mixing pre-weighted cellulose powder into purified water with gentle
stirring.
Preparation of CONCENTRATED PARACETAMOL STOCK SOLUTIONS
63.05 mg of as-purchased PARA powder was dissolved in 5 ml of purified water
resulting in a PARA concentration of 12.61 mg/ml.
Preparation of FINAL SOLUTIONS
CMC, HEC, and MC: Sample solutions were prepared by mixing 1 ml of PARA
stock solution with 0.10 ml CMC, HEC or MC stock solution. Therefore, a drug to
polymer ratio was of 10:1 in weight.
HPMC: Sample solution was prepared by mixing 1 ml of PARA stock solution
with 0.13 ml HPMC stock solution. Hence, a drug to polymer ratio was 13:1 in weight.
As before, the concentration of diluted solutions was prepared by adding the same amount
of solvent so that the actual dilution factor was two. Final concentration values for each
prepared solution are presented in Table V.

21
Table V: Concentrations of PARA commixed with cellulose in deionized water.
Paracetamol concentration [mg/mL]
Cellulose C
10% HPMC 11.23 5.62 2.81 1.40 / /
13% CMC 11.46 5.73 2.87 1.43 / /
13% MC 11.46 5.73 2.87 1.43 0.72 /
13% HEC 11.46 5.73 2.87 1.43 0.72 0.36
4.2.2.2 Sample preparation
The samples were prepared like before, keeping the amount of solution constant at 80 µl as
well as the size of the glasses used. 1.56 cm2 glass surface were cut and cleaned prior to
deposition. Solvent evaporation was executed at ambient temperature until completely
evaporated and a homogenous layer of dissolved material remained, i.e. for about 1 day.
4.2.3 PREPARATION OF PARACETAMOL SAMPLES with SYNTHETIC
POLYMERS
Various solutions were prepared, respectively, with polyvinyl alcohol, polystyrene, and
PMMA in order to investigate their impact on PARA. The different composition required
different preparation routes as the solubility changed drastically.
4.2.3.1 Preparation of PVA paracetamol solutions
Preparation of PVA STOCK SOLUTIONS
40 mL of purified water and 30 ml of 96% EtOH was mixed and heated up to around 70°C.
4 mg of polyvinyl alcohol was slowly stirred into the solvent mixture. Afterward, 30 ml of
96% EtOH was poured into it and heated until a clear solution was achieved.
Preparation of PARACETAMOL SOLUTIONS
Firstly, CONCENTRATED PARACETAMOL STOCK SOLUTIONS were prepared.
10.1 mg of as-purchased pristine PARA powder was dissolved with 57.6% EtOH
until no PARA particles were visible; i.e. 2.76 ml of 57.6% EtOH. Therefore, PARA
concentration was 3.65 mg/ml.

22
Finally, the concentration of diluted solutions was obtained by adding the same amount of
solvent so that the actual dilution factor was two.
Preparation of FINAL SOLUTIONS
1 ml of each diluted PARA concentration solution was mixed with 1ml of PVA stock
solution. Therefore, the final PVA concentration in each sample was 2.00 mg/ml. Final
PARA concentration values for each prepared solution are presented in Table VI.
Table VI: Concentration of PARA commixed with 2.00 mg/ml of PVA in 57.6% EtOH solution.
4.2.3.2 PVA sample preparation
For PVA samples two different methods of preparation were used.
First: 80 µl of prepared solution was drop casted with the use of micropipette onto a 1.56
cm2 glass surface and left on room temperature until there were no traces of solvent seen,
i.e. for about 1 day.
Second: 80 µl of prepared solution was deposited with the use of micropipette onto a 1.56
cm2 glass surface and spin coated for 60 seconds on 15 rps (=round per second) setting.
Afterward, it was left at room temperature for about 24h.
4.2.3.3 Preparation of PS and PMAA paracetamol solutions
Preparation of PS STOCK SOLUTIONS
Polystyrene concentration of 7 mg/ml was achieved with dissolving 65.20 mg of
polystyrene into 9.31 ml of THF.
Preparation of PMMA STOCK SOLUTIONS
PMMA concentration of 2.58 mg/ml was achieved with dissolving 31.34 mg of PMMA
into 12.15 ml of THF.
Paracetamol concentration [mg/mL]
Solvent C
2.00 mg/ml
PVA 1.83 0.91 0.46 0.23 0.11 0.05

23
Preparation of PARACETAMOL SOLUTIONS
First, Preparation of CONCENTRATED PARACETAMOL STOCK SOLUTIONS
540 mg of as-purchased pristine PARA powder was dissolved with THF until no
PARA particles were visible; i.e. 9.79 ml of THF. Therefore, the PARA concentration was
55.18 mg/ml.
Prepared concentrated PARA stock solution was diluted by factor two, four, eight, sixteen
and by factor thirty-two with THF solvent. We prepared 1 ml of each solution.
Preparation of FINAL SOLUTIONS
Polystyrene solutions: 1 ml of each diluted PARA concentration solution was mixed with
1ml of PS stock solution. Therefore, the final PS concentration in each sample was 3.50
mg/ml. Final PARA concentration values for each prepared solution are presented in Table
VII.
Polymethyl methacrylate solutions: 1 ml of each diluted PARA concentration solution
was mixed with 1ml of PMMA stock solution. Therefore, final PMMA concentration in
each sample was 1.29 mg/ml. Final PARA concentration values are presented in Table VII.
Table VII: Concentrations of PARA commixed with either 3.50 mg/ml of PS of 1.29 mg/ml of PMMA in THF.
Paracetamol concentration [mg/mL]
Solvent C
3.50 mg/ml PS 27.58 13.79 6.89 3.45 1.72 0.86
1.29 mg/ml PMMA 27.58 13.79 6.89 3.45 1.72 0.86
4.2.3.4 PMMA and PS sample preparation
For PMMA and PS samples three different methods of preparation were used.
First: 80 µl of prepared solution was drop casted with the use of micropipette onto a 1.56
cm2 glass surface and left on room temperature until there were no traces of solvent seen.
i.e. for about 24 hours.

24
Second: 80 µl of prepared solution was drop casted with the use of micropipette onto a
1.56 cm2 glass surface and put into an oven on a heat-equilibrated glass plate where it was
exposed to an elevated temperature of 80°C for 2 hours.
Third: 80 µl of prepared solution was deposited with the use of micropipette onto a 1.56
cm2 glass surface and spin coated for 60 seconds on 15 rps setting. Afterward, it was left at
room temperature for about 24h.
4.3 SAMPLE CHARACTERIZATION
4.3.1 Polarized light microscopy (PLM)
PLM was performed on an inverted microscope Axiovert 40 CFL equipped with an HBO
50/AC lamp and using crossed polarizers. Images were taken with Nikon camera D5100
using software Camera Control Pro c. For the investigations, samples were placed on a
stage and magnified with 2,5x objective lenses.
4.3.2 X-ray diffraction pattern (XRD)
Specular X-ray diffraction experiments were tested initially with two systems. But for the
results used in this work measurements were mostly carried out on a PANalytical
EMPYREAN diffractometer with a copper sealed tube (wavelength λ = 0.154 nm) and a
PIXcel3D detector stationed at the Institute for Solid State Physics, Graz University of
Graz, Austria. Further, this setup contained an 8 mm fixed anti-scatter slit, a 1/8° fixed
divergence slit and a 0.02 rad Soller slit. The detector was set to the one-dimensional
scanning line mode with a counting time of 18.87 seconds per step. The scan range was set
for 4.99 to 44.00°. Data point for Omega was 12.50°, therefore 2 Theta was 25.00°. Data,
obtained with PANalytical EMPYREAN System, was processed with a Matlab script
provided by MSc. Dr. techn. Paul Christian.

25
5. RESULTS and DISCUSSION
5.1 CHARACTERIZATION OF THE AS DELIVERED PARACETAMOL
POWDER
Paracetamol powders of different sources were characterized using X-ray powder
diffraction. This involved the as- purchased powder and the preparation of two powder
samples from commercial products. Additionally, the as–purchased powder was analyzed
by using differential scanning calorimetry as well. Such experiments are typically done to
check for the crystallographic structure and check for impurities.
5.1.1 X-ray powder diffraction pattern (XRPD)
As-purchased PARA powder was analyzed with X-ray powder diffraction on a Philips
Empyrean reflectometer and compared to other PARA sources directly from commercially
available tablet formulation. The first was a generic product labeled as PARA Genericon
(Genericon Pharma) and the second was the original Mexalen 500 tablet (Bayer GmbH).
While the as-purchased powder was used without further treatment, the two tablets were
carefully ground so that a loose powder resulted which then was transferred to the X-ray
setup. For each powder, a scan was taken and the data is shown in Figure 10. The intensity
as a function of scattering angle in the range between 5° and 45° reveal various Bragg
peaks located at a different position for the as-purchased powder (green curve). The most
intense peaks are located in the range from about 12 – 30° but also a lot of peaks are
present above. Having a lot of different peaks is typically a sign for many different crystal
planes fulfilling the Bragg equation, which in turn mean a statistical random arrangement
exists. This is very typical for a powder like sample containing no preferred orientation.
The X-ray spectrum from the generic PARA powder derived from the tablet (red curve)
revealed the very same peak positions compared to the as-purchased powder. As the peak
positions are a measure of the polymorphic form, this means that both materials consist of
the very same form. There are some differences in the peak intensities, best noted for the
example peak at about 20.5°. In general, there are many different reasons possible to result
in deviating peak intensities. For instance, a slightly different amount of powder that was
in the X-ray beam, meaning that the amount of PARA diffracting is different. In fact, the

26
integral intensities in the red curve seem to be slightly smaller meaning that the amount in
this sample was lower. Another reason might be deviating crystal sizes or impurities in the
samples. We have to acknowledge that our loosely packed PARA powder is more exposed
to the environment, such as temperature changes or high humidity which potentially
contaminates our powder sample. Meanwhile, the original and generic PARA tablets
formulation are protected from the environmental impact of blister packs, which is a unit-
dose packaging and is opened right before filling it to the X-ray machine.
Nevertheless, the peaks also have a relative deviating level, meaning that some peaks are
stronger in the one sample and weaker in the other samples. This means that these two
samples possess different textures. In fact, comparisons with a peak position of potential
PARA polymorphs show that both these samples contain crystal of PARA form I (see lines
in Figure 10) which is also supposed to be the most stable form. From the known structure,
a theoretical powder pattern can be generated assuming a perfectly random orientation is
present. From this, the relative peak intensities very similar to those of the generic product
are obtained. In turn, this means that the PARA powder sample used in our experiments
contain crystals of slightly preferred orientation. But as we dissolved the material prior to
any experiment this initial texture effect is of no importance for any conclusion derived
here.
As purchased
II
Paracetamol Genericon
Mexalen 500
II
Figure 10: Intensity as a function of scattering angle for as-purchased
paracetamol, Paracetamol Genericon and Mexalen 500 paracetamol powdered
tablet. Patterns are obtain with X-ray diffraction maschine and shifted for
comprehensibility. Vertical lines mark peak positions of known paracetamol
polymorphic forms (I...black, II... blue and III … red).

27
The Mexalen Sample, which might be something like a standard reveals a very excellent
match to the generic product. This means that also in this tablet formulation a perfect
powder behavior is obtained. Or in other words, treatments of our powder would be
required to achieve a very similar powder distribution. Likely grinding might reduce
particle size which eventually may get rid of the texture.
Some of the peaks in the spectra are not represented by the PARA of form I. While some
of the peaks might correspond to peaks of PARA of form II one also needs to keep in mind
that additional material, excipient, are present, which might diffract in these very positions.
But as this was of no interest further investigations were not done.
5.1.2 Differential scanning calorimetry (DSC)
As-purchased PARA powder analyzed with differential scanning calorimetry according to
the program described in section 4.1, is presented in Figure 11.
During the first cycle of heating the specimen from room temperature up to 200°C (Figure
11, blue color), the single endothermic event appeared at around 169°C. The endothermic
peak illustrates the absorption of the energy from the surrounding. Meaning, the melting
(phase transition from solid to liquid) of the sample occurred. The melting started at
around 168.8° (i.e. onset of the melting peak – Tm onset) with the melting peak at 175°C
Figure 11: DSC heating and cooling curves of as-purchased paracetamol powder. The
heating programs are given in the box. Program 1 – blue color, program 2 – red color,
program 3 – green color.

28
(Tm) and enthalpy 178.1 J/g. This melting temperature value was in the great number of
scientific articles reported as characteristic of form I (50–52). Based on this literature data it
was safe to evaluate that as-purchased APAP powder, prior DSC analysis, existed in
monoclinic form, i.e. polymorph I. During the melt event the slope of the baseline rose
significantly. This was a consequence of a higher heat capacity of liquefied material than
that of a crystal form (53). Heat capacity increased also on account of increased temperature,
so looking closely we noticed that the baseline was inclined throughout the scan (53). As
described in section 4.1., after the heating, the sample was cooled to 20°C and rescanned to
200°C. Cooling from melt produced an amorphous solid material, which remained in this
glassy state through this process (54).
In the second heating step (Figure 11, red color), first exothermic peak appeared at around
77.2°C (i.e. onset of the crystallization peak – Tc onset) with the peak at 82.5°C (Tc) and
enthalpy -117.9 J/g. This large negative heat flow characterized the recrystallization of
material from an amorphous state into crystalized form III, as reported by PerkinElmer and
many others. (20,54) The second exothermic event occurred at Tc onset = 120.8°C, with the
peak at Tc = 128.7°C and enthalpy -9.2 J/g. This weaker negative heat flow most likely
indicated the direct conversion in the crystalline state from polymorphic form III to
polymorph II, as reported by Burley et al. (20), and many others (50,54). Increasing the
temperature to around 160°C the melt of form II occurred, which was indicated with a
strong endothermic peak showing the Tm onset = 155.7°C and Tm = 175.9° with enthalpy
value of 170.4 J/g.(20,29,30,50,51) When reaching 200°C, the cooling-heating cycle repeated.
The DSC heating curve of the third cycle exposed three major thermal events: two
exothermic processes, crystallization with the following polymorphic transition, and one
endothermic process, melting (Figure 11, green color). Crystallization occurred at around
Tc onset = 72.5°C, with the Tc = 77.3°C and enthalpy value of -114.7 J/g. Meanwhile, the
transformation from polymorphic form III to II took place at around Tc onset = 125.8°C,
with the Tc at 131.3°C with enthalpy value of -9.2 J/and melting of form II at onset
temperature 155.7°C with enthalpy value of 167.8 J/g.
Looking at the obtained experimental results, it was clear that they are in accordance with
findings published by other scientists (50,53,54).

29
5.2 CHARACTERIZATION OF PURE PARACETAMOL SAMPLES
The effect of the solvent choice, as well as the solvent concentration of the solute, were
investigated and the effect on the morphology and crystallographic properties are discussed
in this section. Therefore, a series of solutions were prepared, respectively, in acetone,
tetrahydrofuran, acetonitrile, water or 57.60% and 96.00% EtOH.
5.2.1 TETRAHYDROFURAN solutions
Drop casted samples of PARA on glass surfaces were prepared from various THF
solutions. Starting with the highest concentration of 31.15 mg/ml, very large crystals
developed which even without using a microscope were clearly visible. An exemplary
optical microscope image is shown in Figure 12a revealing extended spherulitic structures
of up to 1.1 cm in size. The bright colors suggest that these structures were thick. Variation
in the color typically means that there exist some regions of different thicknesses.
Typically, the spherulitic center was highest and was surrounded by areas of lower
elevation.
In order to identify the crystalline structure of the sample, X-ray diffraction experiments
were carried out. The X-ray diffraction experiment performed on this very sample is shown
in Figure 13 (violet curve). The pattern shows various peaks distributed over the entire
Figure 12: Optical microscopy images of various paracetamol samples prepared via drop casting from different
THF solution: a) 31.15, b) 17.08, c) 8.54, d) 4.27, e) 2.13 and f) 1.07 mg/ml. Images were taken under crossed
polarizers. All images were taken with the same magnification.

30
scan range with peaks starting to appear at scattering angles of 13.70° followed by several
others. The indexation of this violet pattern shows that only polymorph I is required to
explain all the peaks in the pattern. As there are several peaks present simultaneously in
this specular scan it can be followed that this samples contained crystals of form I but of
arbitrary direction, i.e. it behaves like a PARA powder.
Using the half of the amount of PARA the morphology remains very similar with extended
spherulitic structures running several mm over the sample surface. Compared to the
previous sample the crystallization took place at the sample edge of the sample rather than
in an intermediate point like observed before. The color change was less dominant which
suggests that the crystal thickness variation was less pronounced, which might be clear to
the amount of PARA available for crystallization was much lower.
On the first glance, the X-ray diffraction pattern contains many peaks identical to those of
the first sample, i.e. PARA in the form I was the majority crystal species in this sample
too. At 10.2° there is another peak present. At this position form II and form III have each
a peak which makes a unique identification error prone. A comparison with the next
samples shows that most often form III was developing in samples of lower concentration
from which one might suggest, that these peaks derived also from form III. In any case, the
powder like the character of randomly oriented crystals remained the same too.
Figure 13: X-ray diffraction pattern of various drop casted samples prepared
from THF solutions containing different paracetamol amounts; 31.15 (violet),
17.08 (blue), 8.54 (dark green), 4.27 (light green), 2.13 (orange) and 1.07
(brown) mg/ml. Vertical lines mark peak positions of known paracetamol
polymorphic forms (I...black, II... blue and III … red), also known as hkl lines.
Curves are shifted for clarity.

31
At a PARA concentration of about 8.54 mg/ml, the spherulites were still present but
compared to the first two samples their extension is significantly smaller. The thickness in
the center was larger than on the outside. Compared to the others the arms of the
spherulites developed much more branches. On a different scale (data not shown) the
colors of the adjacent were slightly different which suggest that their orientation was
distinct from those in the middle. In the corresponding X-ray pattern again form I and form
III could be identified whereby a preferred orientation for both forms was absent. The
lower intensity of the peaks was simply a result of less PARA being present.
Using concentration below 4.27 mg/ml resulted in a strong change of the sample
appearance (Figure 12 d-f). First, the size of spherulites reduced significantly so that in the
same area a much larger number was visible. Second, a lack of color suggests that these
structures were of much less height, which can be expected from the low amount of PARA
present. In addition, crystals packed very densely which allows the Maltese cross-like
spherulites typically present in such structures to be clearly visible. For concentrations of
2.13 or 1.07 mg/ml, the situation remained similar but with the size being further
decreased. Compared to the 4.27 mg/ml sample there was much more vacant areas. Due to
the uncertainty, if the reason for these vacant areas was an amorphous state of the film or
lack of material, specimens were re-miscroscoped after about 4 months. There was no
visual change of specimen surface, i.e. reason for blank space was lack of PARA available
for crystallization.
Besides this very significant morphological change, the X-ray pattern of this low
concentrated samples was very distinct from the previous. In the entire scan range of 22°,
there was only one strong peak present, which after indexation can be addressed to the 004
peak of PARA in form III.
In the various X-ray patterns, there were some peaks that cannot be explained either by
PARA in form I, II or III neither by monohydrate or dehydrate PARA. For instance, at
23.50° all spectra independent on the PARA amount revealed a small peak which turned
out to be a parasitic diffraction from the setup in use. Additionally, it is important to
acquaint that amorphous sections of PARA are, as a rule, undetected. The reason behind
this is the insufficient thickness of the thin film and therefore it does not reach the
detection limit within the specular experiments carried out in this master thesis. (18)

32
5.2.2 ACETONE solutions
Specimens were prepared from acetone solutions with various amounts of PARA and drop
casted on a glass surface. The highest amount; 74.97 mg/ml, resulted in a very thick film.
Even with the naked eye, it was possible to see small, but extremely high and dense
crystals in white color. On an exemplary polarized image (Figure 14a) these, on the eye,
tiny pieces of crystals are shown as black colored structures. The bright colors around and
under them represent the depressed areas. No organized or symmetrical crystal growth
could be seen.
Figure 14: Optical microscopy images of various PARA samples prepared via drop casting from different acetone
solutions: a) 74.97, b) 37.49, c) 18.74 and d) 9.37 mg/ml. Images were taken under crossed polarizers. All images
were taken with the same magnification.
The sample was additionally scanned with the X-ray diffraction. The result is presented in
Figure 15 as a violet curve. The model shows various peaks distributed over the entire scan
range. Peaks started to appear at scattering angles around 12.10° followed by many other
and ended with the last peak around 37.80°. Comparing all the peaks to reference data of
all PARA polymorphs (vertical lines on Figure 15) reveals mismatch for several peaks.
This inadequacy makes it hard to index this black pattern with complete certainty. Most of
the peaks lay either on the or near the hkl lines belonging to form I (black vertical lines). A
few peaks lay either on or close to the hkl lines belonging to form III (red vertical lines). It
can be followed that this sample contained crystals of polymorph I and polymorph III both
of arbitrary direction, i.e. behaves similarly to a PARA powder.
c

33
Using half of the PARA, there was a drastic visual change of the specimen. Arranged and
symmetrical structures extended up to 0.6 cm in size were clearly seen even without using
a microscope. Polarized microscopic image shown in Figure 14b reveals spherulites of
quadratic shapes and vivid colors, meaning diverse thickness of crystals areas existed.
Some of them had very dense nucleation points, which are presented with a darker color on
the polarized picture.
X-ray diffraction analysis was performed on (Figure 15, blue curve) and on the first glance
the curve contains many peaks identical to those of the first sample, i.e. form I and form III
are formed in this specimen too. The lower intensity of peaks simply means that less
PARA was available for forming polymorphic crystals. Peaks at 27.1°and 27.8° vice versa
show higher intensities, which might suggest that, compared to the previous sample, higher
amounts of molecules ended in 210 and -202 net planes of polymorph I.
At a PARA concentration of 18.74 mg/ml, the crystal morphology remained very similar to
the previous specimen. Extended spherulitic structures with dense nucleation points were
still present. A smaller number of crystals formed, running up to 0.8 mm over the sample
surface. An exemplary optical microscope image, using crossed polarizers, is depicted in
Figure 14c. Vivid colors suggest that crystal thickness variation remained present. In the
corresponding X-ray pattern again form I and form III remained recognized with numerous
Figure 15: X-ray diffraction pattern of various drop casted samples prepared
from acetone solutions containing different paracetamol amounts; 74.97
(violet), 37.49 (blue), 18.74 (dark green), 9.37 (light green) and 4.69 (orange)
mg/ml. Vertical lines (hkl lines) mark peak positions of known paracetamol
polymorphic forms (I ...black and III ... red). Curves were shifted for clarity.

34
orientations for both forms still present (Figure 15, dark green curve). The drastic decrease
in peaks intensity or even absence of some peaks was a result of less PARA being used.
Decreasing concentration to 9.37 mg/ml caused the existence of smaller crystals. This
resulted in a higher number of spherulites present on the same area of the glass surface
with some vacant space left. Less material available for crystallization also resulted in less
pronounced variation of crystal thickness. This is shown in Figure 14D as a slightly less
dominant color change. This morphology change is accompanied by a change in X-ray
diffraction pattern presented with a green curve in Figure 10. On a 32° scan range, various
smaller Bragg reflections representing PARA polymorph I are visible. Nevertheless, the
strongest peak positioned at scattering angle 24.0° declared the existence of the textured
polymorph III.
Drop casting a concentration of 4.69 mg/ml was a vain attempt. Optical microscopy did not
reveal any structures on a glass surface. Re-evaluating it 4 months later showed no change.
Additional X-ray diffraction analysis showed no peaks belonging to any of the
polymorphic forms (Figure 15, orange pattern). Two peaks at around 22.50° and 34.00°
turned out to be a parasitic diffraction from the setup in use present through all
measurements of acetone samples. The lack of information might be simply a result of the
films being too thin or even no PARA being present in most areas.
5.2.3 WATER solutions
Another series of PARA thin films were drop casted from water solutions with decreasing
amount of PARA. Soon after preparation, all the deposited material condensed in a smaller
area on the glass leaving most of the surface uncovered of material. Beginning with the
highest concentration 12.61 mg/ml, at first glance different middle size Maltese cross-like
spherulites were noticed (Figure 16a). Along with them, short-range fan-like structures
were formed. Lack of colors suggests that the thickness of crystals was low, whereas no
variety in colors means that the height of all crystals was very much alike.

35
The X-ray diffraction pattern for this sample revealed three strong Bragg peaks distributed
over an angular range of 20 degrees (Figure 17, violet color) starting with a peak at
scattering angle around 13.70° and ending with peak positioned at 27.80°. Both peaks
identify monoclinic form I of the same direction. The middle peak at 24.0° which
corresponds to the 004 net plane, revealed orthorhombic form III. As there is only one
peak seen, it means that the crystals representing this form were one direction oriented, i.e.
a strong texture is present.
Diluting the concentration to 6.31 mg/ml did a partial change in morphology (Figure 16b).
A lot of big spherulites with very smooth looking surfaces were observed, while there
remained short range fan-like structures spread all over the surface and on top of some
spherulites. Like before, every now and then spherulites with Maltese cross design were
spotted. Interestingly, there were noticed smaller holes vacant of PARA. The height of all
present crystals resembled the previous sample.
At first glance, the X-ray diffraction pattern for this concentration (Figure 17, blue line)
looks the same as the previous one (violet line). Both peaks indicating monoclinic form
were still present. The only difference was that form III might be absent. The peak at 24.0°
has in this pattern shifted to around 24.5°. This made it difficult to match it with any
literature Bragg reflections of PARA polymorphs or hydrates, leaving it unidentified.
Figure 16: Optical microscopy images under crossed polarizer of paracetamol drop casted onto glass surface from
a) 12.61, b) 6.31, c) 3.15, d) 1.58 and e) 0.79 mg/ml water solution. Images were taken under crossed polarizers. All
images were taken with the same magnification.

36
Using a concentration of 3.15 mg/ml reduced the amount of Maltese spehuriles and
increased the number of smooth crystals of various shapes and sizes. Additionally, as also
observed in the previous sample, most of the structures seemed perforated. The changes
can be seen in Figure 16c. The thickness of the sample stayed leveled.
In the corresponding X-ray scan form I and III were present (Figure 17, dark green line).
This time both forms had preferred orientations. Form I crystals positioned into preferred -
101 contact net plane with the surface, while form III crystals oriented with 004 contact
plane. The peak at 27.90° which have been seen in both previous curves was here absent.
Additional dilution with water to achieve 1.58 mg/ml did a small change in morphology
compared to the sample of 3.15 mg/ml. Again, a great number of smooth-surfaced, as well
as Maltese cross-like spherulites, were observed (Figure 16d). All the material was like in
all previous sample condensed on one part of the glass surface.
In the corresponding X-ray pattern again form I and form III can be identified (Figure 17,
light green line). The last, Bragg reflection at 27.8° that disappeared from the previous
pattern of 3.15 mg/ml reappeared on 1.58 mg/ml curve. Although a preferred orientation
for the form I was lost, form III kept it.
Using concentration of 0.79 mg/ml resulted in a drastic change of the sample morphology
(Figure 16e). Firstly, there are almost no typically spherulites visible. Only a small
Figure 17: XRD pattern of paracetamol drop casted onto glass surface from
12.61 (violet), 6.31 (blue), 3.15 (dark green), 1.58 (light green) and 0.79 mg/ml
(orange) water solutions. Vertical lines are indicating literature values of
paracetamol polymorphs: monoclinic form I (black) and orthorhombic form
III (red). Curves are shifted for clarity.

37
formation can be seen on the left side of the sample image. Instead, there was a big
sponge-like, perforated structure. Secondly, compared to previous samples there were
much more vacant areas among crystals and their surrounding surface. This might be
expected due to the low amount of PARA present. This hypothesis was confirmed after
about 4 months with re-microscoping the specimen surface to clarify if this area might be
just of amorphous nature. But as the picture did not change, this means these areas were
vacant of PARA.
Interestingly, the diffraction pattern for this low concentration sample was not observable.
In the entire scan range of 20°, there were no strong peaks present. The possible
explanation is that the number of crystals was so low or that they were really thin so that
the X-ray detector could not detect it.
5.2.4 96% ETHANOL solutions
Samples with different PARA concentrations were made by drop-casting 96% EtOH
solutions onto a glass surface. Structures on the specimen with the highest concentration of
22.96 mg/ml can be examined with the naked eye. Feather-like crystals grew up to the
length of 1 cm on a 1.56 cm2 glass. A close-up with an optical microscope, shown in
Figure 18a, confirmed the extended growth in one direction with branches coming out of
main crystal lines. The colorfulness of the image presents the variation in crystal thickness
throughout the sample. Areas with bright color were uplifted, while the regions with darker
color lied closer to the glass surface.
The X-ray pattern for this exact specimen is shown in Figure 19 with violet color. The
curve reveals strong Braggs reflections through the 20° scanning range with the strongest
peak starting at scattering angle 13.70°, correlating to -101 net plane. Several small
intensity peaks follow, with the last one at 27.80°, which correlates to -202 net plane. All
peaks can be explained by monoclinic form I. The only exception is the middle peak at
20.40° which cannot uniquely correspond to a peak of a specific form of PARA.
Using half of the amount of PARA did not significantly change the morphology (Fig. 18b).
Only the length and thickness of the crystals were different. Fan-like structures grew on
this sample less than 0.8 cm long and more areas with low thickness were present. The last
resulted in smaller color variations.

38
Figure 18: Optical microscopy images under crossed polarizer of PARA drop casted onto glass surface from a)
22.96, b) 11.48, c) 5.74, d) 2.87 and e) 1.44 mg/ml 96% EtOH solution. Images were taken under crossed
polarizers. All images were taken with the same magnification.
The diffraction pattern (Figure 19, blue curve) this time lost all the peaks between the two
highest peaks already mentioned when describing the violet curve. Meaning, only Bragg
reflections at 13.7° and 27.8° were observed. After indexation, it follows that polymorph I
remained the primary polymorph obtained when using 96% EtOH at this concentration, but
of only one direction.
Using PARA concentration of around 5.74 mg/ml ended in a mix of different structures.
Half of the glass surface was occupied by branched feather-like structures. The variation in
colors was almost identical as in the previous two samples (poor presentation in the lower
part of Figure 18c). These areas of different thickness transitioned into thinner areas of
short and branched fan-like structures. The transition is seen on the horizontal middle of
the Figure 18c.
The X-ray diffraction experiment executed on this sample is shown in Figure 19 (dark
green curve). Again, the monoclinic form was detected whereby a preferred orientation
was absent. With a good eye, a small peak at 24.00° was detected, belonging to an
orthorhombic form III suggesting little amounts of the other are present.
In previous samples crystallization always started on the edge of the surface, whether in
following lower concentrations material regrouped, taking the space close to the edge, but
not nucleating and then crystallizing from there. Diluting concentration to about 2.87
mg/ml radically transformed morphology of PARA crystals. The first thing we noticed was

39
icicles-like structures. They showed a little variation in colors. This suggests that the
regions closest to the nucleation points were thicker than the regions further away. Again,
some short fan-like structures and spherulites were observable.
The indexation of the corresponding specular scan (Figure 19, light green curve) showed
that form I and form III are necessary to explain all the peaks of the curve. As there are
several peaks present simultaneously it can be followed that this sample contained crystals
of arbitrary direction for both polymorphs.
Applying the lowest concentration of 1.44 mg/ml of PARA in water solution resulted in a
strong change of the sample appearance (Figure 18e). A mix of leaf-like crystals,
stalagmite-like crystals, and a few small spherulites formed, all trapped inside and
nucleated from a colorful ring of crystals. Almost no color diversity inside the crystal
circle suggests small variation in thickness between all structures.
Besides this very significant morphological change, the X-ray diffraction for this exact
sample was very distinct from the previous ones (Figure 19, orange curve). In the entire
scan range from 10° to 30°, there was only one strong peak. This Bragg reflection, which
appeared at 24.00°, is the 004 net plane of polymorph III.
Figure 19: X-ray diffraction pattern of 22.96 (violet), 11.48 (blue), 5.74 (dark
green), 2.87 (light green) and 1.44 (orange) mg/mL paracetamol concentration
in 96% EtOH solution drop casted onto a glass solid surface. Vertical lines
mark literature Bragg reflection peak positions of paracetamol polymorphs:
monoclinic form I. (black) and orthorhombic form III (red). Curves were
shifted for clarity.
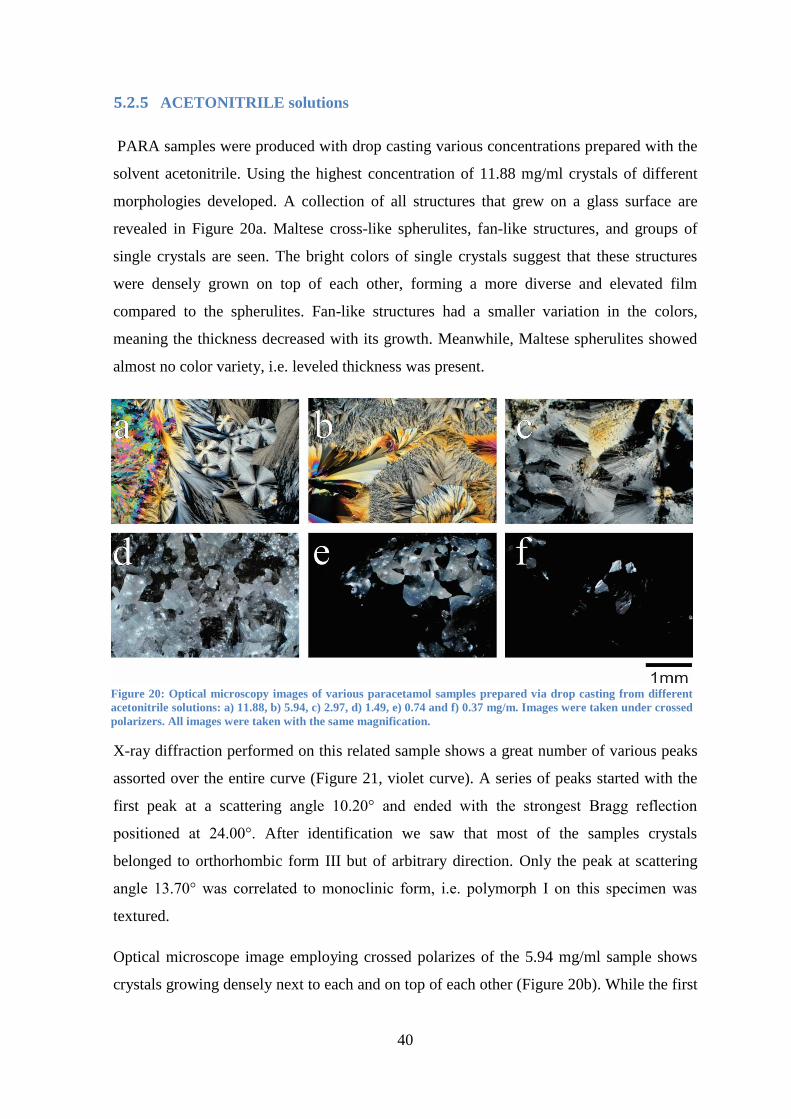
40
5.2.5 ACETONITRILE solutions
PARA samples were produced with drop casting various concentrations prepared with the
solvent acetonitrile. Using the highest concentration of 11.88 mg/ml crystals of different
morphologies developed. A collection of all structures that grew on a glass surface are
revealed in Figure 20a. Maltese cross-like spherulites, fan-like structures, and groups of
single crystals are seen. The bright colors of single crystals suggest that these structures
were densely grown on top of each other, forming a more diverse and elevated film
compared to the spherulites. Fan-like structures had a smaller variation in the colors,
meaning the thickness decreased with its growth. Meanwhile, Maltese spherulites showed
almost no color variety, i.e. leveled thickness was present.
X-ray diffraction performed on this related sample shows a great number of various peaks
assorted over the entire curve (Figure 21, violet curve). A series of peaks started with the
first peak at a scattering angle 10.20° and ended with the strongest Bragg reflection
positioned at 24.00°. After identification we saw that most of the samples crystals
belonged to orthorhombic form III but of arbitrary direction. Only the peak at scattering
angle 13.70° was correlated to monoclinic form, i.e. polymorph I on this specimen was
textured.
Optical microscope image employing crossed polarizes of the 5.94 mg/ml sample shows
crystals growing densely next to each and on top of each other (Figure 20b). While the first
Figure 20: Optical microscopy images of various paracetamol samples prepared via drop casting from different
acetonitrile solutions: a) 11.88, b) 5.94, c) 2.97, d) 1.49, e) 0.74 and f) 0.37 mg/m. Images were taken under crossed
polarizers. All images were taken with the same magnification.

41
crystal habit stopped growing, the second one continued. There was a constant transition
from long fan-like structures to shorter ones. The bright colors suggest the thickness of
most of the fan-like structures. Typically, the surrounding of nucleation points had a higher
elevation, while remote areas had lower.
A corresponding X-ray scan showed a significant change in the pattern (Figure 21, blue
color). On first look, only one strong peak stands out of the entire scan range of 25°. The
peak corresponds to the net plane 004 and it identifies orthorhombic form III. After a
thorough examination of the pattern, a few smaller peaks were noticed. Only one of them
matches with the literature values for PARA polymorphs. After indexation this peak
positioned at scattering angle 13.70° can be addressed to polymorph I.
Halving the concentration to 2.97 mg/ml resulted in drastic morphology change into radial
symmetrical spherulites growing up to 1.5 mm in diameter. An exemplary optical
microscope image is shown in Figure 20c. Color variation was not as prominent as it was
in previous samples. The thickness in the center was in most structures comparable to that
on the outside. On top of some Maltese cross-like spherulites, single crystals were
scattered. Consequently, this elevated the height of samples and generated light dark green
color on the polarized picture.
Figure 21: X-ray diffraction pattern of 11.88 (violet), 5.94 (blue), 2.97 (dark
green), 1.49 (light green), 0.74 (orange) and 0.37 (brown) mg/mL paracetamol
concentration in acetonitrile solution drop casted onto a glass solid surface.
Vertical lines identify literature Bragg reflection peak positions of paracetamol
monoclinic polymorphic form I (black) and orthorhombic form III (red).
Curves were shifted for clarity.

42
Performed X-ray diffraction gave us a pattern almost identical to the previous one (Figure
21, dark green). This time in the entire scan range only a peak at scattering angle 24.00°
was present. As already mentioned, this Bragg reflection can be addressed to the 004 net
plane of polymorph III, i.e. all PARA molecules oriented in one direction.
Reducing the PARA concentrations to 1.49 mg/ml lowers the size of spherulites (Figure
20d). A lower amount of PARA resulted in the lower height of spherulites which reflected
in lack of color.
With a further decrease in concentrations of 0.74 or 0.37 mg/ml, the morphology remained
similar (Figure 20e and 20f). Lowering the amount of PARA further reduced the size of
structures while it increased the number of vacant areas. Specimens reviewed after 4
months showed no change, i.e. vacant areas were not areas of amorphous PARA deposited
but were indeed vacant of API used.
As was crystal appearance similar for concentrations below 1.49 mg/ml, so did X-rays
diffraction curves follow this rule (Figure 20; light green, orange and brown lines). The
strong peak at 24.00° stayed present in all the patterns. Meaning, lower PARA
concentrations in acetonitrile always favorized orthorhombic form III with preferred
orientation unquestionably present.
In all the X-ray patterns, there was a peak present at around 22.5° that could not be
explained either by PARA in form I, II or III neither by PARA hydrates. I.e. peak was a
result of an error made with the setup of X-ray diffraction machine, likely some diffraction
from the sample stage.
5.2.6 57.6 % ETHANOL solutions
A series of PARA specimens was prepared also in a 57.6% EtOH solution and deposited
onto a solid surface. Drop casting the highest concentration of 3.65 mg/ml resulted in a
formation of crystals with different morphology. An exemplary image of all present
structures was obtained with optical microscopy using crossed polarizers (Figure 22a). In
the corner of the glass surface crystallization of elongated fan like structures started. These
extended structures grew up to 0.7 mm in length. On the rest of the sample space, short
range fan-like structures grew. Lack of colors proposes that the diversity of crystals

43
thickness was low. There were some vacant areas, which was clearly a result from the
small amount of PARA available.
An X-ray diffraction pattern is presented in Figure 23 with a violet color. The curve shows
two strong Braggs peaks on the 20° range. The first peak is positioned at scattering angle
around 13.8 degrees and corresponds to the -101 net plane. The second peak was detected
at the 22.8 ° and corresponds to the -202 net plane. After identification, crystals formed
from the highest concentration were assigned to monoclinic form I.
Using half the value of PARA concentration crystal morphology remained similar (Figure
22b). Short range fan-like structures were still observable. Elongated fan like-structures
from the previous sample were replaced with Maltese-cross like spherulites. Small
diversity in colors stayed present, suggesting that sample thickness was similar to the
previous one. The number of vacant areas was also in no difference when comparing to the
specimen with the highest concentration. However, the corresponding X-ray pattern shows
a great visual and polymorphic change (Figure 23, blue curve). In the entire scan range,
there was only one strong peak. It was positioned at a scattering angle of 24.0°, which was
after indexation addresses to the 004 peak of PARA polymorphic form III.
Figure 22: Optical microscopy images of various paracetamol samples prepared via drop casting from different
57.6% EtOH solutions: a) 3.65, b) 1.82, c) 0.91, d) 0.46, e) 0.23 and f) 0.11 mg/ml. Images were taken under
crossed polarizers. All images were taken with the same magnification.

44
Observation of PARA sample of 0.91 mg/ml unfolds significant morphological change.
After specimen deposition all material assembled in a 0.8 cm2 area, leaving more vacant
space on the sample surface. The microscopic image depicted in Figure 22c shows mostly
very large crystals with the mostly smooth looking surface with little perforation in the left
part of the image. This clean look suggests that there was no variation in the thickness of
the crystal surface, meaning crystals surfaces were leveled. Crystals were surrounded with
a bright, colorful ring.
With decreasing concentration, the perforation look of the sample increased (Figure 22, d-
f). The number of vacant areas was growing, which was a result of lowering the API
amount available for crystallization. Bright, colorful rings surrounding these perforated
crystals were constantly present. It was hypothesized that it contains material yet to be
crystallized. 2 months after this hypothesis was confirmed with re-microscoping
specimens.
While morphology changed with decreasing concentration, X-rays diffraction pattern
changed insignificantly (Figure 23, light green, orange and brown curve). A single Bragg
reflection appears in every curve below the concentration of 1.82 mg/ml. With decreasing
concentration, the intensity of this peak at 24.0° reduced. As already identified, this 004 net
Figure 23: X-ray diffraction pattern of 3.65 (violet), 1.82 (blue), 0.91 (dark
green), 0.46 (light green), 0.23 (orange) and 0.11 (brown) mg/ml paracetamol
concentration in 57.6% EtOH solution drop casted onto a glass solid surface.
Vertical lines mark literature Bragg reflection peak positions of paracetamol
polymorphs: monoclinic form I. (black) and orthorhombic form III (red).
Curves were shifted for clarity.

45
plane belongs to the orthorhombic polymorph III, i.e. these samples all contain crystals
with the prefered orientation.
5.3 CHARACTERIZATION OF PARACETAMOL SAMPLES WITH
CELLULOSE
The effect of cellulose on PARA crystallization from solution was investigated with drop
casting various PARA concentration incorporated with cellulose on the glass surface.
Therefore, a series of binary water solutions were prepared, respectively, with
carboxymethyl cellulose, methyl cellulose, hydroxyethyl cellulose and hydroxypropyl
methylcellulose. Obtained crystal morphologies and polymorphic forms are reported in the
following sections.
5.3.1 Carboxymethylcellulose (CMC)
Drop casted samples of various amounts of PARA and 8.73% w/w carboxymethyl
cellulose were prepared from aqueous solutions at room temperature. When inspecting the
microscopic image of the specimen with the highest concentration of PARA 11.46 mg/ml
(Figure 24A) bright spots of carboxymethyl cellulose branches appear rolled into tubes.
Around it grew fan-like crystals of PARA. Together they formed a circle which was
mostly reshaped due to the limited space on a glass surface. We could note a color
progression of PARA crystal from black to blue and white indicating the difference in the
crystal thickness, white being the thickest. Typically, the grain borders between crystals
were white color, indicating elevated areas.
The results of the X-ray diffraction experiment performed on this sample are shown in
Figure 25 (violet curve). The pattern showed several peaks in the range of 10 to 30°. The
first and the highest peak appeared at 13.9°, continued by three small ones. The analysis of
each peak revealed that most belong to the form I. An exception was the high-intensity
peak at 24.0° which corresponded to 004 Bragg reflection of polymorphic form III. As
there are several peaks presented simultaneously in this specular scan it can be followed
that this sample contained crystals of form I of arbitrary direction and crystals of form III
of one direction/texture.

46
Continuing with the PARA concentration of 5.73 mg/ml, the microscopic image (Figure
24B) showed similar structures as in the previous sample. Additional to fan like structures
spherulites grew. The color variation and consequently thickness stayed similar. The X-ray
diffraction scan performed on this exact sample is presented in Figure 25 (blue curve). The
number and the position of peaks are similar to the previous sample. There are only two
differences. First, the intensity of the peak at 13.8° decreased while the intensity of the
peak at 24.0° increased. Meaning, the amount of crystals arranged in monoclinic form
dropped while the amount of crystals arranged in orthorhombic form III raised. The second
difference, compared to the specimen with the highest concentration of PARA, was the
missing peak at around 15.5°. Instead, a peak at around 18.4° appears which after
analyzing explained with PARA dehydrate.
Figure 24: Images of 8.73% w/w CMC in PARA concentration of A) 11.46 mg/ml, B) 5.73 mg/ml, C) 2.87 mg/ml
and D) 1.43 mg/ml in water solution. Images were obtained with an optical microscope with crossed polarizers
with the same magnification.
Additional halving the PARA and CMC concentration resulted in a drastic change in the
crystal morphology obtained from the thin film (Figure 24C). Firstly, two significantly
contrasting morphologies were visible. There was a significant amount of crystals
assembled in a formation with a smooth like surface and even more in a sponge-like
structure. Secondly, compared to previous samples there were much more vacant areas,
which was expected due to the smaller amount of material. For the same reason, the light
brown spots of CMC were more difficult to notice.

47
A specular scan for PARA concentration of 2.87 mg/ml is presented with dark green color
in Figure 25. The decrease in the amount of PARA resulted in the loss of polymorphic
form III. Peaks stationed at 24.0° did not show in the pattern, while two peaks, positioned
at 13.8° and 27.9° remained identical compared to the previous sample. I.e., this specimen
contained crystals of form I of one direction; -101 and -202 net planes are just the same
direction in the crystal.
Microscopic observation of the last specimen with the PARA concentration of 1.43 mg/ml
showed the similar image as the former sample (Figure 24D). Smaller and bigger
formations of CMC were visible surrounded with diversely arranged PARA crystals. From
fan-like structures and elevated ridges to sponge-like crystal structures. A limited amount
of PARA available for crystallization resulted in even greater vacant space on the sample
surface. On the corresponding X-ray pattern (Figure 25, light green) the reappearance of
the peak at 24.0° together with the other peaks, this means polymorph I and polymorph III
were present. Preferred orientation for the form I, as well as form III, was present.
Additionally, a peak at around 18.4° appeared, corresponding to PARA dehydrate.
Figure 25: X-ray diffraction pattern of 8.73% w/w CMC in paracetamol
concentration of 11.46 mg/ml (violet color), 5.73 mg/ml (blue color), 2.87
mg/ml (dark green color) and 1.43 mg/ml (light green color) in water solution.
Curves were shifted for clarity. Vertical lines indicated form I (black color),
form III (red color) and paracetamol dehydrate (blue color).

48
5.3.2 Methylcellulose (MC)
Another series of PARA thin films were prepared from water solutions with decreasing
amount of PARA mixed with 8.73% of methylcellulose. Drop casted solution with the
highest PARA concentration of 11.46 mg/ml covered 90% of the available glass surface in
the shape of a circle with an elevated edge. Meaning, most of the material seemed to gather
on the edge, due to the coffee stain effect reflecting the convection of material toward
evaporating areas. Crystallization that occurred during slow evaporation of solvent resulted
in Maltese cross-like spherulites of inhomogeneous sizes extended up to a few millimeters
visible with an optical microscope (Figure 26A). When observing the biggest crystals we
saw fan-like branches so detailed that the growth of crystals could be predicted. Small
color variation from black to blue proposes that the diversity in crystals thickness was a
minute. Colorful spots were seen on the top edge and right edge which probably belonged
to methylcellulose.
Figure 26: Images of 8.73% w/w MC in PARA concentration of A) 11.46 mg/ml, B) 5.73 mg/ml, C) 2.87 mg/ml, D)
1.43 mg/ml and E) 0.72 mg/ml in water solution. Images were obtained with an optical microscope with crossed
polarizers with the same magnification.
X-ray diffraction was performed on this exact sample (Figure 27, violet curve). The pattern
showed various small peaks distributed over the entire scan range of 20° scattering angle.
Peaks started to appear at scattering angles around 11.80° followed by the strongest one at
13.7° and a few others. The indexation of this violet pattern shows that the presence of
polymorph I and III were required to explain the peaks in the pattern. A few peaks located
between 25° and 30° could not be indexed with any polymorphic forms or hydrates of

49
PARA. As there are several peaks present simultaneously in this specular scan it can be
followed that these samples contain crystals behaving similarly to a PARA powder.
Using halve the amount of PARA and MC the morphology remained very similar. (Figure
26B). Extended and round spherulitic structures remained present with identical color
variation. The only difference was the coverage of the glass surface with the material.
Clearly, a lower amount of drop casted material resulted in a slightly bigger surface
vacancy. Although this unnoticeable change in morphology, change in X-ray patterns was
major (Figure 27, blue curve). In the entire scan range, only one strong Bragg reflection
showed at 24.0° scattering angle. Meaning, the textured sample contained crystals of form
III.
At a PARA concentration of 2.87 mg/ml, the spherulites were still present but compared to
the first two samples their extension and size was significantly smaller (Figure 26C). The
surface coverage and the thickness of crystals stayed similar to the previous two samples.
On the first glance, it looked like the resolution of the image was poor, but looking closely
we saw that crystals were sparkling. The reason behind this was methyl cellulose spread
over the entire specimen homogeneously. In the corresponding X-ray pattern (Figure 27,
dark green color) again form I and form III could be identified with a preferred orientation
for both forms.
Figure 27: X-ray diffraction pattern of 8.73% w/w MC in paracetamol
concentration of 11.46 mg/ml (violet color), 5.73 mg/ml (blue color), 2.87
mg/ml (dark green color), 1.43 mg/ml (light green color) and 0.72 mg/ml
(orange color) in water solution. Curves were shifted for clarity. Vertical lines
indicate form I (black color) and form III (red color).

50
Using concentration of 1.43 mg/ml resulted in a small change of the sample appearance
seen under the microscope while looking with the naked eye no distinction could be made
between previous samples. In Figure 26D we could see extended spherulites, fan-like
structures, and smaller round Maltese-like spherulites. Methylcellulose was again seen
with bright colors, spread over crystals or gathered in smaller spots. The X-ray pattern
(Figure 27, light green color) obtained addressed textured form III with the presence of
Bragg reflection solely from the 004 net plane.
Reducing the PARA concentration to 0.72 mg/ml significantly increased vacant areas on
the glass surface. Observing the specimen under the microscope showed a drastic change
in crystal morphology. The number of spherulites reduced (see right side of the image E on
Figure 26). Most of the surface was covered with undefined and hardly observable
structures (left side of the Figure 26E). MC was once again mostly spread over the entire
surface or assembled in long lines. In the parallel X-ray diffraction curve aligned form III
is present (Figure 27, orange curve). The peak at 24.0° showed lower intensity due to the
lower amount of PARA available for crystallization.
5.3.3 Hydroxyethyl cellulose (HEC)
Drop casted samples of PARA and 8.73% w/w HEC on a glass surface were prepared from
various water solutions. From the highest PARA concentration of 11.46 mg/ml, Maltese-
like crystals grew up to 2.5 mm in diameter (Figure 28A). Small color variation of crystals
was noted from black to light blue which suggested that the structures were thin. A few
crystals had more branched arms than others, which resulted in the loss of Maltese like
appearance. In the center of some crystals, grain areas shaped as a butterfly exist. Some of
these sparkling spots, assigned to hydroxyethyl cellulose, were noticed throughout the
specimen. X-ray diffraction that was carried out on this specimen is depicted in Figure 18
with a violet curve. The pattern showed one Bragg reflection on the entire scan range with
peak positioned at scattering angle 24.00°. The identification with literature values showed
that polymorph III was required for explaining the polymorphic form of crystals obtained
with this sample. Once again, as there was only one peak, it was clear that all the specimen
crystals aligned in one direction.

51
Diluting to PARA concentration of 5.73 mg/ml morphology remained practically the same
with HEC spread homogeneously over the entire thin film (Figure 28B). Compared to the
previous sample small vacant areas appeared in the corners of the glass surface. This could
be explained by the lesser quantity of the solid material used and slight de-wetting. On the
affiliated X-ray scan additional peaks appeared (Figure 29, blue curve) compared to the
previous sample. The first Bragg reflection on the pattern emerged at the scattering angle
of 16.6°. After the examination, it was concluded that it was related to the PARA
dehydrate. The later peak appeared at around 23.5°. At this position form I and form III
have each a peak which makes a unique identification error prone. While there is already a
peak of form III present at 24.0° we presumed that this peak derives also from form III.
Figure 28: Images of 8.73% w/w HEC in PARA concentration of A) 11.46 mg/ml, B) 5.73 mg/ml, C) 2.87 mg/ml,
D) 1.43 mg/ml, E) 0.72 mg/ml and F) 0.36 mg/ml in water solution. Images were obtained with an optical
microscope with crossed polarizers with the same magnification.
The appearance of crystals acquired from PARA concentration of 2.87 mg/ml preserved in
Maltese-like shapes (Figure 28C). The size of crystals reduced which ended with a higher
amount of spherulites on the same surface area. HEC was once again unequally spread
over the structures (see grain areas on the left and upper side of the image C on Figure 28).
At the first glance, the X-ray diffraction pattern for this specimen (Figure 29, dark green
line) looks the same as the first one (violet line), only this time narrower and smaller. The
reason for lower intensity was limited material available, while narrow peak suggested that
the crystals were bigger, which was contradictory when comparing to the microscopic
image. Nevertheless, form III crystals were present with absent arbitrary direction.

52
When observing the image of the sample with the PARA concentration of 1.43 mg/ml it
was hard to determine the specific shape of crystals (Figure 28D). The reason behind that
was the HEC spread all over the specimen which made a grain look of the specimen. Even
so, we assumed the spherulitic shape of the crystals. No variation in colors occurred,
meaning that the thickness of the sample stayed low and leveled.
Continuing with a specimen with PARA concentration of 0.72 mg/ml we noticed Maltese-
like spherulites some black and grey color variation (Figure 28E; right side), other in black
and blue color variation. Darker grey color signified a gaunt height of crystals. The Larger
area of the surface was covered with crystals of undefined morphology, where dots of HEC
got to the expression (Figure 28E; middle of the image). This appearance repeats on the
following sample of PARA concentration of 0.36 mg/ml (Figure 28F).
X-ray diffractions performed on the samples with PARA concentration lower than 1.43
mg/ml all presented similar results (see Figure 29, light green, orange and brown curve). In
the entire scan range of 20°, there was only one strong Bragg reflection present. After the
examination, it was addressed to the 004 peak of PARA polymorph III. Clearly, the
intensity of the peak got smaller with the decrease of material used. On the light green and
orange curve, additional peaks at around 13.6°and 20.5° displayed. In spite of the thorough
inspection, we were not able to identify them.
Figure 29: X-ray diffraction pattern of 8.73% w/w HEC in paracetamol
concentration of 11.46 mg/ml (violet color), 5.73 mg/ml (blue color), 2.87
mg/ml (dark green color) 1.43 mg/ml (light green color), 0.72mg/ml (orange
color) and 0.36 mg/ml (brown color) in water solution. Curves were shifted for
clarity. Vertical lines indicate form I (black color), form III (red color) and
paracetamol dehydrate (blue color).

53
5.3.4 Hydroxypropylmethylcellulose (HPMC)
Another series of PARA thin films were drop casted from water solutions with decreasing
amount of PARA mixed with 51.53% w/w hydroxypropylmethylcellulose. After
preparation, all the deposited material condensed and shaped in a circle with an elevated
edge, meaning a lot of material ended on the outside due to the coffee stain effect.
Beginning with the highest concentration of 11.23 mg/ml at first glance different middle
size and small Maltese cross-like spherulites were noticed (Figure 30A). Along with them,
a lot of shapeless crystals were formed. Color variation progressed from black, blue to light
brown. This lack of colors suggested that the thickness of crystals was low, whereas lesser
variety in colors meant that the height of all crystals was very much alike.
Hydroxypropylmethylcellulose seemed to be spread over the entire sample.
Figure 30: Images of 51.53% w/w HPMC in PARA concentration of A) 11.23 mg/ml, B) 5.62 mg/ml, C) 2.81 mg/ml
and D) 1.40 mg/ml in water solution. Images were obtained with an optical microscope with crossed polarizers
with the same magnification.
Analyzed sample with X-ray diffraction revealed a lot of peaks over the entire scan range
of 20° scattering angle (Figure 31, violet curve). First peaks at 13.8° represented form I.
Variety of small peaks followed before the biggest Bragg reflection at 24.0°. At position
around 17.3° form II and form III have peaks which could result in an error-prone
interpretation when analyzing. While the majority of crystal species concerned
polymorphic form III, it most likely belongs to the same category. In any case, this
specimen was a close demonstration to the powder like a sample of haphazardly oriented
crystals.

54
Reducing the PARA concentration to 5.62 mg/ml resulted in sizable, extended and more
branched crystals (Figure 30B). The color diversity stayed similar. Visibility of HPMC was
on this specimen clearer with white dots all over the thin film. The corresponding X-ray
diffraction pattern showed a cleaner curve with only two strong peaks (Figure 31, blue
color). The first identified form I at around 13.6° and the second identified form III at
24.0°. From this follows that crystals of each species oriented in one direction.
Diluting the PARA concentration to 2.81 mg/ml resulted in a partial change in morphology
(Figure 30C). Again, round and extended crystals with a clean shape appeared. HPMC
seemed to have condensed in a more round spherulite crystal. The height of all present
crystals resembled the previous sample. The X-ray pattern for this exact sample (Figure 31,
dark green curve) remained the same as for the previous one, i.e. again form I and form III
were necessary to explain the obtained polymorphic forms. Additionally, the height of both
peaks are more or less even, which suggests that the amount of each form is equally likely.
Using PARA concentration of 1.40 mg/ml with 51.53% w/w HPMC resulted in a similar
crystal appearance (Figure 30D). Again some crystals contained more HPMC than other.
Measurement with X-ray diffractometer presented light green curve (Figure 31) with only
one intensity peak at 24.0°. Peak was reasonably lower due to the lesser amount of material
used. Nevertheless, this textured specimen was assembled of polymorph III crystals.
Figure 31: X-ray diffraction pattern of 51.53% w/w HPMC in paracetamol
concentration of 11.23 mg/ml (violet color), 5.62 mg/ml (blue color), 2.81
mg/ml (dark green color) and 1.40 mg/ml (light green color) in water solution.
Curves were shifted for clarity. Vertical lines indicated form I (black color),
form III (blue color) and paracetamol dehydrate (red color).

55
5.4 CHARACTERIZATION OF PARACETAMOL SAMPLES with
SYNTHETIC POLYMERS
5.4.1 Polyvinyl alcohol (PVA)
Several binary solutions of various paracetamol amounts and a constant 0.02 mg/ml
of Polyvinyl alcohol (PVA) fraction was prepared in 57.6% EtOH and drop casted on a
glass surface. Shortly after deposition, all the material condensed in a smaller area on the
glass leaving most of the surface vacant. Decreasing the PARA quantity with constant
PVA concentrations ended in smaller rings of matter and might be correlated to a large
contact angle of 57.6% EtOH on a glass surface. After the solvent evaporated, elevated
edges of sample rings were observed on every specimen (exemplarily shown in the images
Fig 32A and 32C) typically for coffee ring effect. Also, a phase separation might be
responsible, but as all areas appear bright under the crosses polarizers these must be
crystalline. Similar behaviors were observed also on specimens acquired from concentrated
PARA solutions prepared with water, 57.6% EtOH and 96% EtOH. (see Chapters 5.2.3,
5.2.4 and 5.2.6).
On the specimen with a PARA concentration of 1.83 mg/ml and 2% w/w of PVA, we saw
spherulites with the leveled surface, which resulted in a smooth appearance of crystals
(Figure 32A). The color variety among spherulites was an outcome of slightly different
heights of each crystal. Dark colored crystals were thinner than the bright and colored
ones. PVA appears as bright dots spread over the matter. A corresponding X-ray
diffraction experiment is presented in Figure 33 using a violet color (top curve). On a scan
range between 10 and 30 degrees scattering angle, two peaks with different intensity were
noticed. The first peak appeared at 17.5° and the strongest one at 24.0°. When analyzed,
both peaks were recognized as a result of polymorph III.

56
Figure 32: Optical microscopy images of various PARA samples, comixed with 0.02 mg/ml PVA, prepared via
drop casting from 57.60% EtOH solutions. The concentrations used were a) 1.83, b) 0.91, c) 0.46, d) 0.23, e) 0.11
and f) 0.08 mg/ml. All images were taken under crossed polarizers and same magnification.
Dilution with 57.6% EtOH to PARA concentration of 0.91 mg/ml produced larger
spherulites of Maltese cross-like appearance Figure 32B. The high density of molecules
gave the glossy surface appearance to crystals. Color progression from blue to black this
time occurred mostly inside of the spherulite. As on the previous sample, the white color
ring was visible. In the meanwhile, crystallization from PARA concentration of 0.46
mg/ml resulted in smaller (Maltese cross-like) spherulites with mate surface appearance
Figure 33: X-ray diffraction patterns of various paracetamol concentrations:
1.83 (violet), 0.91 (blue), 0.46 (dark green), 0.23 (light green), 0.11 (orange),
0.06 mg/ml (brown) and constant 0.02 mg/ml concentration of PVA drop
casted from 57.6% EtOH solution. Curves were shifted for clarity. Red
vertical lines correspond to paracetamol polymorph III.

57
and slightly lesser color variation (Figure 32C). Meaning, the crystals on this specimen
were thinner than the one on the previous samples. Once more, the elevated edge of the
specimen ring was seen with a bright white color.
Using the PARA concentration of 0.23 mg/ml, which corresponded to 15% w/w PVA,
images of significantly smaller and in some areas perforated crystals were seen (Figure
32D). The edges of the sample ring were understandably lower compared to the prior
samples and were seen with less intense white color. Empty space on surface increased due
to the cutback of material. Meantime, the amount of material in the last two specimens was
so low that it was possible to present all the visible material on each sample with a single
image (Figure 32E and 32F). Remember, the material de-wets the surface and typically
assembled in small areas. Specimen with PARA concentration of 0.11 mg/ml revealed
perforated crystals inside the ring mainly with a star-like structure. Meantime, the image of
the lowest PARA concentration showed perforated crystals grown from the edge of the
ring, leaving the middle of it empty. PVA on these last two samples was not detectable.
X-ray pattern obtained from a specimen of PARA concentration below 0.91 mg/ml (Figure
33, dark green, light green, orange and brown color pattern) have revealed only one peak at
24.0°. The intensities of these peaks decreased with a diminishing amount of PARA and
PVA available. Nevertheless, all samples ended with textured crystals of polymorph III.
Further experiments were performed with a spin coating technique, using the same
solutions. Although we used lower rotation speed, i.e. 15 rounds per second (rps), the
spinning effect flung off the majority of the material. The rotation speed was probably too
high and the duration of the spinning performance, i.e. the 60s, was almost certainly too
long. These settings gave us close to perfect transparent looking glass substrates after one
day and after a few months when looking with the naked eye. Even when observing
samples under an optical microscope using crossed polarizers almost no material was
detected, when any, no crystals were discerned. Clearly, a very low amount of PARA
deposited on the surface additionally contributed to this result condition. Meanwhile, when
performing XRD we got interesting results only with the second sample, in which was the
PARA concentration before spin coating process 0.91 mg/ml (see Figure 34). One small
Braggs reflection was detected, corresponding to PARA polymorphic form III. The reason
behind the poor spin coating results was most likely the very small mass of PARA and

58
PVA, or perhaps the amorphous state of the material that remained on the glass surface, for
even after a few months the state of the sample did not change.
5.4.2 Polymethyl methacrylate (PMMA)
Specimens of different amounts of PARA with 1.29 mg/ml of PMMA were
prepared using drop casting onto glass surfaces from THF solution and left at room
temperature for solvent evaporation. From the highest PARA concentration of 27.60
mg/ml, two enormous crystals grew covering almost entire glass surface of 1.56 cm2
(Figure 35A). An exemplary microscope image under crossed polarizers showed extended
spherulitic structures similar to those when using pure PARA in THF without commixture
of PMMA (see Chapter 5.2.1). The bright colors were a result of PMMA, while black and
white colors presented the thickest part of the crystals.
The X-ray diffraction investigation executed on this specific specimen is presented in
Figure 36, violet pattern. The curve displayed three significant peaks on the scan range
from 10° to 30° of scattering angle. First two appeared at small scattering angle at around
13° to 14°, which on first sight look as double peak, while the last one emerged at a large
scattering angle of 27.2°. After indexation of this peaks, we explained the second and the
third peak with polymorph I, while the first one did not correspond with any of polymorph
or hydrate of PARA.
Figure 34: X-ray diffraction patterns of various paracetamol
concentrations: 1.83 (violet), 0.91 (blue), 0.46 (dark green), 0.23
(light green), 0.11 (orange), 0.06 mg/ml (brown) and constant
0.02 mg/ml concentration of PVA in 57.6% EtOH solution.
Technique of sample preparation was spin coating. Curves were
shifted for clarity. Red vertical lines correspond to paracetamol
polymorph III.

59
Figure 35: Optical microscopy images of various PARA samples, comixed with 1.29 mg/ml of PMMA, prepared
via drop casting from THF solutions: a) 27.60, b)13.80, c) 6.90, d) 3.45, e) 1.72 and f) 0.86 mg/ml. Images were
taken under crossed polarizers and the same magnification.
Halving the PARA concentration, there was a small change in the appearance. Two
extended spherulites formed from the edge which expanded up to 1.1 cm. In the middle
extended spherulite with a clear Maltese cross appearance formed (Figure 35B). Created
crystals were very thin and with very little height diversity, which was indicated with small
color variation from brown to black. Vivid colors in some areas were the result of PMMA.
The correlated X-ray diffraction pattern followed the morphological change. On the 20°
scan range two low-intensity peaks, at around 10.2° and 20.7° of scattering angle, and one
high-intensity peak at 24° appeared; identification of those revealed PARA polymorph III.
At a PARA concentration of around 6.9 mg/ml, a major morphology changes on the glass
surface occurred. When inspected by the naked eye, on one half we saw drainage system
formation of crystals, while the other half seemed empty. An exemplary optical
microscope image of the transition from one half to another is shown in Figure 36C. The
image revealed multiple of short fan-like structures with diverse orientation in the
transparent part of the specimen (bottom of Figure 35C). Meanwhile, the drainage system,
that is the visible structures, consisted of more oriented fan like structures (upper part of
Figure 35C). The elevation of this formation decreased from the middle towards the
outside. Strong color variations propose that this part of the specimen contained all of the
PMMA. The corresponding X-ray diffraction pattern (Figure 36, dark green color)
revealed two low-intensity peaks at wide angles. The width of the peaks suggested that the

60
sample contained smaller (in size) but bigger amounts of crystals. Both of the peaks were
explained by polymorph III.
When employing 3.45 mg/ml of PARA and 1.29 mg/ml of PMMA, optical microscope
showed crystal of spherulitic morphology (Figure 35D). Most of the structures had a blue
to black color variation, while some varied from light green to black, probably a result of
PMMA. The result from X-ray diffraction analysis for this exact sample (Figure 36, light
green curve) was similar as for the previous sample (dark green curve). I.e., form III was
still the only polymorph for classification of crystals on this specimen. Lower peak
intensities was a result of the smaller amount of PARA available for crystallization.
Reducing PARA concentration to 1.72 mg/ml structures that were seen on the last sample
strongly reduced (Figure 35E). Most of the solid surface was covered with very thin
crystals that take over the entire surface of the last sample with PARA concentration of
0.86 mg/ml (Figure 35 F). X-ray patterns for both samples displayed no peaks over the
entire 20° scan range (Figure 36, orange and brown curve). This was a consequence of the
small amount of material on both specimens.
Figure 36: X-ray diffraction patterns of various paracetamol concentrations:
27.60 (violet), 13.80 (blue), 6.90 (dark green), 3.45 (light green), 1.72 (orange),
0.86 mg/ml (brown) and constant 1.29 mg/ml of PMMA drop casted from
THF solution. Curves were shifted for clarity. Red vertical lines correspond to
paracetamol polymorph III, black vertical correspond to form I.

61
When exposing all six nominally and methodically equally prepared samples to an
environment of elevated temperatures of 80°C a similar outcome resulted (Figure 37). The
crystals evolved almost identical, as under room temperature, i.e. elevated temperature had
almost no impact on crystal morphology or on the polymorphic selection (data not shown).
The only difference worth mentioning was concerning the sample with the highest PARA
concentration and its XRD pattern of polymorph I. Raised temperature resulted in the
slightly higher amount of small intensity peaks, meaning sample showed powder like
characteristic.
PMMA samples prepared with spin coating method from solutions of higher PARA
concentrations, i.e. 27.60, 13.80 and 6.90 mg/ml, showed similar crystal morphology when
inspected with an optical polarized microscope, i.e. Maltese cross-like spherulites. In
Figure 39A one of these crystals extended like a fan throughout the entire length of the
sample surface. When reducing PARA concentration by half (Figure 39B) surface was
covered with spherulites with a diameter of 3-4 mm. Color variation for these first two
samples went from black to light blue, suggesting that the entire sample is leveled.
Continuing with a sample of 6.90 mg/ml PARA concentration, single spherulites were
observed (Figure 38C). On account of the reduction of deposited material, vacant surface
areas enlarged. In addition, the color intensities of present crystals reduced. On the
contrary, using concentration below 3.45 mg/ml did not produce any detectable crystals.
Figure 37: : X-ray diffraction patterns of various paracetamol concentrations:
27.60 (violet), 13.80 (blue), 6.90 (dark green), 3.45 (light green), 1.72 (orange),
0.86 mg/ml (brown) and constant 1.29 mg/ml of PMMA drop casted from
THF solution and exposed to 80°C. Curves were shifted for clarity. Red
vertical lines correspond to paracetamol polymorph III, black vertical
correspond to form I.

62
There was some material observed with a polarized optical microscope, however, only
some semitransparent lines.
Figure 38: Optical microscopy images of various PARA samples, comixed with 1.29 mg/ml of PMMA, prepared
from THF solutions: a) 27.60, b)13.80, c) 6.90, d) 3.45, e) 1.72 and f) 0.86 mg/ml. Sample preparation technique
was spin coating. Images were taken under crossed polarizers. All images were taken with the same magnification.
X-ray diffraction showed small Bragg reflections but just on corresponding samples of
27.60 – 6.90 mg/ml (Figure 39, violet, blue and dark green curve). The highest PARA
concentration, violet curve, exposed two peaks, which could not be marked by any PARA
polymorph. Whereas, blue and dark green curve revealed form III crystals of 004 net plane
at a scattering angle of 24.0°, i.e. textured form III.
Figure 39: : X-ray diffraction patterns of various paracetamol concentrations:
27.60 (violet), 13.80 (blue), 6.90 (dark green), 3.45 (light green), 1.72 (orange),
0.86 mg/ml (brown) and constant 1.29 mg/ml of PMMA in THF solution.
Sample preparation technique was spin coating. Curves were shifted for
clarity. Black vertical lines correspond to paracetamol polymorph I.

63
5.4.3 Polystyrene (PS)
Commixtures of 3.50 mg/ml PS and six different concentrations of PARA (PARA) in THF
solutions led to diverse results when changing the deposition procedure or ambient
temperature. When applying thin layers from drop casting and letting crystals grow on
room temperature, rough surfaces were created. On each of six specimens, small, white,
elevated spots of material were observed. Under an optical microscope, using polarizers,
these marks appeared as black circles, which reduced in size and number when reducing
PARA concentration. This suggested that mentioned structures are composed of PARA but
either strongly absorbing or of bad crystalline quality. Beneath these circular structures,
crystals of various morphologies formed. On specimen with the highest PARA
concentration of 27.60 mg/ml colorful and long fan-like structures were observed (Figure
40A). Usually, variation in the color suggests that there exist some regions of different
thicknesses. In this case colorfulness of crystals was probably a result of PS. When PARA
concentration decreased to 13.80 mg/ml long fan-like structures shortened and the
colorfulness faded into the prevalence of bright blue color (Figure 40B). Using
concentration below 6.90 mg/ml reduced the size, while increased a number of black
marks. The shape of crystals remained undefined.
Figure 40: Optical microscopy images of various paracetamol samples, comixed with 3.50 mg/ml PS, prepared via
drop casting from THF EtOH solutions: a) 27.60, b) 13.80, c) 6.90, d) 3.45, e) 1.72 and f) 0.86 mg/ml. Images were
taken under crossed polarizers. All images were taken with the same magnification.

64
Besides these insignificant changes in morphology between specimens, the X-ray curves of
the specimen with PARA concentration from 27.60 to 6.31 mg/ml followed a similar
pattern (Figure 41, violet, blue, dark green and light green curves). On a 10° to 30° angle
scan range three strong Bragg reflections appeared repeatedly. The first and the strongest
peak appeared at around 13.8° and derives from the with -101 net plane. Other strong
peaks appeared at 27.3°, corresponding to 210 net planes, and at 27.9°, corresponding -202
net plane. The intensity of these three peaks declined parallel with the decreasing amount
of material available for crystallization. Additionally, these curves insignificantly
distinguish in the section between 15 to 25°. X-ray diffraction analysis performed on a
specimen of 27.60 mg/ml PARA revealed additional small intensity peaks at 13.9° and
23.4° (Figure 41, violet). Meanwhile, on the XRD pattern of 13.80 mg/ml PARA the
lowest two peaks in the middle were not detected (Figure 41, blue curve). Nevertheless,
after indexation, we concluded that both samples contained polymorph I crystals. Using a
concentration of 6.90 mg/ml in the scan range between 15 to 25° low-intensity peak
appeared in the position of 24.0° and corresponded to 004 net planes (Figure 41, dark
green curve). This exact peak was in traces observed on a specimen of 3.45 mg/ml PARA.
After analysis peak was addressed to form III. Consequently, we concluded that form I was
no longer the only form present on these last two specimens. Even so, polymorph I was the
dominant polymorphic form.
Figure 41: X-ray diffraction patterns of various paracetamol concentrations:
27.60 (violet), 13.80 (blue), 6.90 (dark green), 3.45 (light green), 1.72 (orange),
0.86 mg/ml (brown) and constant 3.50 mg/ml of PS drop casted from THF
solution. Curves were shifted for clarity. Red vertical lines correspond to
paracetamol polymorph III, black vertical correspond to form I.

65
Concerning the samples of 1.72 and 0.86 mg/ml, there was a more obvious change in
pattern noted (Figure 41, orange and brown curve). Beginning with a sample of 1.72
mg/ml (orange), the only representative of form I left was a peak at 13.9° with very weak
intensity if comparing to all the previous X-ray curves. Meanwhile, the peak at 24.0°
strengthened. Consequently, polymorphic dominance was designated to form III. In the
case of PARA concentration of 0.86 mg/ml (brown) pattern was almost identical to the one
before. In contrast, peak at 24° was of noticeably smaller intensity.
When exposing samples prepared with drop casting to an elevated temperature of
80°C, obvious changes in morphology and X-ray results were noticed. Starting with the
highest concentration of 27.60 mg/ml, the microscopic images (Figure 42A) revealed up to
6 mm prolonged fan-like crystals of vivid colors. The last was probably a consequence of a
PS. A fair amount of surface was additionally covered with black, elevated marks.
Downsizing PARA concentration to 13.80 mg/ml resulted in a greater number of much
smaller fan-like crystals (Figure 42B). Like in the sample in Figure 40B vivid colors of
crystals toned down to light elevated nucleation marks. This sizeable spots incorporated
PS, which generated bright colors.
Figure 42: Optical microscopy images of various PARA samples, comixed with 3.50 mg/ml of PS, prepared via
drop casting from THF solutions: a) 27.60, b)13.80, c) 6.90, d) 3.45, e) 1.72 and f) 0.86 mg/ml. Samples were
exposed to an elevated temperature of 80°C. Images were taken under crossed polarizers. All images were taken
with the same magnification.

66
A thin layer prepared with 6.90 mg/ml PARA made a shift when exposing to 80°C (Figure
42C). Organized crystal formation was hardly noticeable. A fair amount of surface was
additionally covered with droplets, which incorporated tiny crystals. PS was unevenly
spread through the surface. Samples with PARA concentrations lower than 3.45 mg/ml
exposed mostly perforated structures. Perforation increased with the downscaling amount
of PARA available. In some pores visible in the 3.45 mg/ml sample, crystals formed,
which with decreasing concentration vanished completely (Figure 42D). The effect of PS
was hardly even noticed.
The elevated temperature, that caused the evaporation rate of THF to increase, drastically
transformed the appearance of X-ray curves (Figure 43). There were several peaks of
different intensity present along each 10 to 30° specular scan. Meaning, all the samples
hold the crystals of arbitrary direction which gave the PARA powder-like properties. Peak
analysis showed that each sample is monomorphic; i.e. only one polymorphic form was
present on a single specimen. On samples of 27.60, 13.80 and 0.86 mg/ml PARA
polymorphic form I was present, while on samples of 6.90 and 1.72 mg/ml polymorphic
form III, with the strongest Bragg reflection at 24°, correlating to 004 net planes. A sample
of 3.45 mg/ml PARA did not reveal any strong Bragg reflection; hence it was not possible
to assign it to any of the polymorphic forms of PARA.
Figure 43: X-ray diffraction patterns of various paracetamol concentrations:
27.60 (violet), 13.80 (blue), 6.90 (dark green), 3.45 (light green), 1.72 (orange),
0.86 mg/ml (brown) and constant 3.50 mg/ml of PS drop casted from THF
solution and exposed to 80°C. Curves were shifted for clarity. Red vertical lines
correspond to paracetamol polymorph III, black vertical correspond to form I.

67
As already mentioned, some specimens were prepared with spinning first PS followed by
spinning PARA solutions. Optical images of these observed under crossed polarizers
showed very thin and grainy structures with light blue to black color variation (Figure 44).
When inspecting the highest concentrations, 27.60, 13.80 and 6.90 mg/ml, we noticed
Maltese cross-like spherulites extended up to 5mm on a glass surface (Figure 44A-44C).
On the contrary, samples of lower concentrations, 4.5, 1.72, 0.86 mg/ml, showed only
linear structures (Figure 45D- 44F). Interestingly, there were no clear signs indicating the
presence of PS.
Figure 44: Optical microscopy images of various PARA samples, comixed with 3.00 mg/ml of PS, prepared from
THF solutions: a) 27.60, b)13.80, c) 6.90, d) 3.45, e) 1.72 and f) 0.86 mg/ml. Sample preparation technique was spin
coating. Images were taken under crossed polarizers and under the same magnification.
X-ray diffraction analysis performed on spin coating samples showed interesting result
only on samples with 27.60 and 6.90 mg/ml (Figure 45, violet and dark green curve). That
is a singular peak at 24.0° on the entire 10 to 30° scan range. Similar to the previous
graphs, at this specific position, this was designated to form III. Interestingly, all other
curves (Figure 45, blue, light green, orange and brown curve) showed no Bragg reflections,
i.e. curve was straight. This was most likely a result of the strongly low amount of material
available for crystallization.

68
Figure 45: X-ray diffraction patterns of various paracetamol concentrations:
1.83 (violet), 0.91 (blue), 0.46 (dark green), 0.23 (light green), 0.11 (orange),
0.06 mg/ml (brown) and constant 3.50 mg/ml concentration of PS in THF
solution. Technique of sample preparation was spin coating. Curves were
shifted for clarity. Red vertical lines correspond to paracetamol polymorph
III.

69
6. SUMMARY and CONCLUSION
The experiments performed in this work show that solvent choice, type of preparation,
matrix material, and temperature treatment have a significant impact on the morphology
and structure of PARA crystals grown on the glass surface.
Over the course of this work, PARA molecule mostly organized into two of the three
known PARA polymorphs, i.e. form I and form III. These two forms occurred either
simultaneously or separately. When drop casting lower PARA concentrations solutions
from various solvents, i.e. THF, acetone, acetonitrile, water, 96% EtOH and 57.6% EtOH,
respectively, samples resulted in preferred 004 texture of PARA form III with respect to
the surface (Figure 46A). The most differences showed when using higher concentrated
PARA solutions. Thin films from THF and acetone solutions of highest PARA
concentrations resulted in powder like samples. PARA molecules from water and 57.6%
EtOH samples shaped into a textured crystalline form I only at the highest PARA
concentration, that is a saturated solution, whereby when using 96% EtOH textured form I
grew from the highest three concentrations. On the other hand, acetonitrile solution
resulted in textured form III with 004 net planes even from higher concentrations.
The reason behind the different behavior might be best explained by the differences in the
evaporation rates of the various solvents. THF and acetone have both a high evaporation
rate, therefore PARA molecules have very limited amount of time available for properly
reorganizing during solidification. Meanwhile, when in other solvents, PARA has extended
time available for assembling while evaporation. In water, one needs to wait for the longest
until the entire solvent is evaporated. Moreover, solutions with lower PARA
B
B
A
A
Figure 46: Illustration of the A) paracetamol form III with the 004 contact net plane and B) paracetamol
polymorph I in the proximity of a glass surface with the net plane -101 and -202.
A B

70
concentrations have, relatively speaking, more solvent available. Therefore, evaporation
time is additionally increased. PARA molecules had, therefore, time to slowly arrange and
grow into metastable form III and organize into 004 contact plane with respect to the glass
surface.
Besides this kinetic aspect, the level of supersaturation during the nucleation stage is
another decisive aspect. At high API concentrations, the supersaturation is reached much
quicker. In this supersaturation, nucleation is more likely to happen and spontaneous
formation of nuclei results in the bulk solution. Most of these nuclei then transit into
crystals of form I, i.e. the stable form. This is in accordance with the Ostwald rules of
ripening, which states, that a system with sufficient time will likely transform into the most
stable form. At lower concentration, the supersaturation level is lover so that the amount of
nuclei formation is reduced. This can even lead to the formation of amorphous films as
previously found by Ehmann et. al. which eventually transits toward a crystalline film. But
then, the film is often of form III. While in this work an amorphous phase was not directly
observed, the spin coating process might have resulted in an initial amorphous film which
during the residual spinning transferred into crystals.
The different forms of PARA also result in the molecular contact with the surface being
different. When a form I is present, most often the -101 net plane (Figure 46B) is parallel
to the surface. On the molecular level, this means that molecules incline so that the contact
of the individual molecule with the substrate minimizes. For form III the contact with the
surface is significantly larger, as the lying molecules fully contact the substrate. From this
follows, that the interaction forces with the substrate play a much more important role for
form III than form I. This might also explain, why the degree of texture is much larger in
form III samples than in form I.
The different samples of co-processed materials show that form I and form III can be
formed. But as the cellulose required the usage of the water also some hydrate formation of
PARA is recognized. In the case of commixing HEC or PVA to PARA, textured form III
of 004 net planes was obtained, no matter the PARA concentration. Similar results were
obtained with MC, i.e., PARA molecules mainly organized into textured form III, with the
additional textured form I with -101 net plane (Figure 46B) at some higher concentrations.
Furthermore, CMC thin films resulted mainly in the coexistence of form I and form III
which both displayed textured properties. The most diverse were samples with HPMC. The
71
highest concentration produced a powder-like sample of form I and III. When increasing
the volume of solvent, the textured form I and III were obtained, while at lower
concentrations solely textured form III. When manipulating with PS, higher-concentration
samples evolved mostly into a form I of arbitrary direction, whereby low-concentration
samples resulted in form I and form III, both textured.
In conclusion, employing thin film preparation enables crystallizing PARA in various
forms. While the usage of glass substrates might not allow a direct application, the
information provides additional information on layer formation of PARA. Employing then
more suitable substrates like sheets made from cellulose or biodegradable polymers a
transfer into more application relevant forms might be easily realizable. Using than thin
film techniques like drop casting, spin coating or some advanced therefrom (ink-jet
printing or spray coating) this might be very powerful tools to generate personalized
medicine for which only a small number of dosage per patient is required.

72
7. REFERENCES
1. Savjani KT, Gajjar AK, Savjani JK. Drug Solubility: Importance and Enhancement
Techniques. ISRN Pharmaceutics, 2012; 2012(100 mL):1–10.
2. Mazumder S, Dewangan AK, Pavurala N. Enhanced dissolution of poorly soluble
antiviral drugs from nanoparticles of cellulose acetate based solid dispersion
matrices. Asian Journal of Pharmaceutical Sciences, 2017; 12(6):532–541.
3. Hou X, Zhang W, He M, Lu Y, Lou K, Gao F. Preparation and characterization of
β-cyclodextrin grafted N-maleoyl chitosan nanoparticles for drug delivery. Asian
Journal of Pharmaceutical Sciences, 2017; 12(6):558–568.
4. Abuzar SM, Hyun SM, Kim JH, Park HJ, Kim MS, Park JS, Hwang SJ. Enhancing
the solubility and bioavailability of poorly water-soluble drugs using supercritical
antisolvent (SAS) process. International Journal of Pharmaceutics, 2018; 538(1–
2):1–13.
5. Kumar S, Dilbaghi N, Saharan R, Bhanjana G. Nanotechnology as Emerging Tool
for Enhancing Solubility of Poorly Water-Soluble Drugs. BioNanoScience, 2012;
2(4):227–250.
6. Alshora DH, Ibrahim MA, Alanazi FK. Nanotechnology from particle size reduction
to enhancing aqueous solubility. Pp. 163–191 in Surface Chemistry of
Nanobiomaterials. Elsevier, 2016.
7. Lindfors L, Skantze P, Skantze U, Westergren J, Olsson U. Amorphous drug
nanosuspensions. 3. Particle dissolution and crystal growth. Langmuir, 2007;
23(19):9866–9874.
8. Tambe A, Pandita N. Enhanced solubility and drug release profile of boswellic acid
using a poloxamer-based solid dispersion technique. Journal of Drug Delivery
Science and Technology, 2018; 44(August 2017):172–180.
9. Chaudhari SP, Dugar RP. Application of surfactants in solid dispersion technology
for improving solubility of poorly water soluble drugs. Journal of Drug Delivery
Science and Technology, 2017; 41:68–77.
10. Meinguet C, Masereel B, Wouters J. Preparation and characterization of a new
73
harmine-based antiproliferative compound in complex with cyclodextrin: Increasing
solubility while maintaining biological activity. European Journal of Pharmaceutical
Sciences, 2015; 77:135–140.
11. Kanaujia P, Poovizhi P, Ng WK, Tan RBH. Amorphous formulations for dissolution
and bioavailability enhancement of poorly soluble APIs. Powder Technology, 2015;
285:2–15.
12. Christian P, Ehmann HMA, Coclite AM, Werzer O. Polymer Encapsulation of an
Amorphous Pharmaceutical by initiated Chemical Vapor Deposition for Enhanced
Stability. ACS Applied Materials and Interfaces, 2016; 8(33):21177–21184.
13. Schrode B, Bodak B, Riegler H, Zimmer A, Christian P, Werzer O. Solvent Vapor
Annealing of Amorphous Carbamazepine Films for Fast Polymorph Screening and
Dissolution Alteration. ACS Omega, 2017; 2(9):5582–5590.
14. Liu C, Liu Z, Chen Y, Chen Z, Chen H, Pui Y, Qian F. Oral bioavailability
enhancement of β-lapachone, a poorly soluble fast crystallizer, by cocrystal,
amorphous solid dispersion, and crystalline solid dispersion. European Journal of
Pharmaceutics and Biopharmaceutics, 2018; 124(December 2017):73–81.
15. Omar M, Makary P, Wlodarski M. A Review of Polymorphism and the Amorphous
State in the Formulation Strategy of Medicines and Marketed Drugs. 2015; 3(6):60–
66.
16. Bavishi DD, Borkhataria CH. Spring and parachute: How cocrystals enhance
solubility. Progress in Crystal Growth and Characterization of Materials, 2016;
62(3):1–8.
17. Zhou Z, Li W, Sun WJ, Lu T, Tong HHY, Sun CC, Zheng Y. Resveratrol cocrystals
with enhanced solubility and tabletability. International Journal of Pharmaceutics,
2016; 509(1–2):391–399.
18. Ehmann HMA, Zimmer A, Roblegg E, Werzer O. Morphologies in solvent-annealed
clotrimazole thin films explained by hansen-solubility parameters. Crystal Growth
and Design, 2014; 14(3):1386–1391.
19. Sun Y, Zhu L, Wu T, Cai T, Gunn EM, Yu L. Stability of Amorphous
Pharmaceutical Solids: Crystal Growth Mechanisms and Effect of Polymer

74
Additives. The AAPS Journal, 2012; 14(3):380–388.
20. Burley JC, Duer MJ, Stein RS, Vrcelj RM. Enforcing Ostwald’s rule of stages:
Isolation of paracetamol forms III and II. European Journal of Pharmaceutical
Sciences, 2007; 31(5):271–276.
21. Reischl D, Röthel C, Christian P, Roblegg E, Ehmann HMA, Salzmann I, Werzer O.
Surface-Induced Polymorphism as a Tool for Enhanced Dissolution: The Example
of Phenytoin. Crystal Growth and Design, 2015; 15(9):4687–4693.
22. Ehmann HMA, Werzer O. Surface mediated structures: Stabilization of metastable
polymorphs on the example of paracetamol. Crystal Growth and Design, 2014;
14(8):3680–3684.
23. Yeager JD, Ramos KJ, MacK NH, Wang HL, Hooks DE. Transformation and
growth of polymorphic nuclei through evaporative deposition of thin films. Crystal
Growth and Design, 2012; 12(11):5513–5520.
24. Röthel C, Ehmann HMA, Baumgartner R, Reischl D, Werzer O. Alteration of
texture and polymorph of phenytoin within thin films and its impact on dissolution.
CrystEngComm, 2016; 18(4):588–595.
25. Ehmann HMA, Baumgartner R, Kunert B, Zimmer A, Roblegg E, Werzer O.
Morphologies of phenytoin crystals at silica model surfaces: Vapor annealing versus
drop casting. Journal of Physical Chemistry C, 2014; 118(24):12855–12861.
26. Werzer O, Baumgartner R, Zawodzki M, Roblegg E. Particular film formation of
phenytoin at silica surfaces. Molecular Pharmaceutics, 2014; 11(2):610–616.
27. Ehmann HMA, Baumgartner R, Reischl D, Roblegg E, Zimmer A, Resel R, Werzer
O. One polymorph and various morphologies of phenytoin at a silica surface due to
preparation kinetics. Crystal Growth and Design, 2015; 15(1):326–332.
28. Chakravarty P, Alexander KS, Riga AT, Chatterjee K. Crystal forms of tolbutamide
from acetonitrile and 1-octanol: Effect of solvent, humidity and compression
pressure. International Journal of Pharmaceutics, 2005; 288(2):335–348.
29. Rossi A, Savioli A, Bini M, Capsoni D, Massarotti V, Bettini R, Gazzaniga A,
Sangalli ME, Giordano F. Solid-state characterization of paracetamol metastable
polymorphs formed in binary mixtures with hydroxypropylmethylcellulose.

75
Thermochimica Acta, 2003; 406(1–2):55–67.
30. Telford R, Seaton CC, Clout A, Buanz A, Gaisford S, Williams GR, Prior TJ,
Okoye CH, Munshi T, Scowen IJ. Stabilisation of metastable polymorphs: the case
of paracetamol form III. Chem. Commun., 2016; 52(81):12028–12031.
31. Nicnols G, Frampton CS. Physicochemical characterization of the orthorhombic
polymorph of paracetamol crystallized from solution. Journal of Pharmaceutical
Sciences, 1998; 87(6):684–693.
32. Perrin M-A, Neumann MA, Elmaleh H, Zaske L. Crystal structure determination of
the elusive paracetamol Form III. Chemical Communications, 2009; (22):3181.
33. Neumann MA, Perrin M-A. Can crystal structure prediction guide experimentalists
to a new polymorph of paracetamol? CrystEngComm, 2009; 11(11):2475.
34. Smith KB, Bridson RH, Leeke G a. Crystallisation control of paracetamol from
ionic liquids. CrystEngComm, 2014; 16:10797–10803.
35. Scriven LE. Physics and Applications of DIP Coating and Spin Coating. MRS
Proceedings, 1988; 121:717.
36. Liu Y, Zhao X, Cai B, Pei T, Tong Y, Tang Q, Liu Y. Controllable fabrication of
oriented micro/nanowire arrays of dibenzo-tetrathiafulvalene by a multiple drop-
casting method. Nanoscale, 2014; 6(3):1323–1328.
37. Christian P. Polymorphism of the Drug Carbamazepine in Proximity to Solid
Surfaces. 2014; (December).
38. Wedl B. Structure and morphology of CuGaS thin films. 2010; (October).
39. Cavallini M. Status and perspectives in thin films and patterning of spin crossover
compounds. Physical Chemistry Chemical Physics, 2012; 14(34):11867.
40. Ossila Ltd, Kroto Innovation Centre, Broad Lane SS 7HQ. Spin Coating: A Guide to
Theory and Techniques. 2016.
41. Bornside DE, Macosko CW, Scriven LE. Spin coating: One-dimensional model.
Journal of Applied Physics, 1989; 66(11):5185–5193.
42. Hall DB, Underhill P, Torkelson JM. Spin coating of thin and ultrathin polymer
films. Polymer Engineering and Science, 1998; 38(12):2039–2045.
76
43. Elmer P. Differential Scanning Calorimetry ( DSC ) A Beginner ’ s Guide. 2013:1–
9.
44. Department of Physics, University of California. Basics of Polarizing Microscopy.
Olympus,:28. (accessed on october 2017).
45. Dongre A, Bhisey P, Khopkar U. Polarized light microscopy. Indian journal of
dermatology, venereology and leprology, 2007; 73(3):206–8.
46. Allen CR. Pharmaceutical Microscopy. 1st ed. New York: Springer-Verlag New
York, 2011.
47. Barbara L Dutrow, Louisiana State University , Christine M. Clark EMU. X-ray
Powder Diffraction (XRD).
48. Lee EH. A practical guide to pharmaceutical polymorph screening & selection.
Asian Journal of Pharmaceutical Sciences, 2014; 9(4):163–175.
49. Birkholtz M. Principles of X-Ray Diffraction., 2006.
50. Boldyreva E V., Drebushchak VA, Paukov IE, Kovalevskaya YA, Drebushchak TN.
DSC and adiabatic calorimetry study of the polymorphs of paracetamol: An old
problem revisited. Journal of Thermal Analysis and Calorimetry, 2004; 77(2):607–
623.
51. Di Martino P, Conflant P, Drache M, Huvenne J-P, Guyot-Hermann A-M.
Preparation and Physical Characterization of Forms H and Hi of Paracetamol.
Journal of Thermal Analysis, 1997; 48:447–458.
52. Reis NM, Liu ZK, Reis CM, Mackley M. Article HPMC as a novel tool for
isothermal solution crystallisation of micronized Paracetamol HPMC as a novel tool
for isothermal solution crystallisation of micronized Paracetamol. 2014; (Cm).
53. PerkinElmer. Differential Scanning Calorimetry ( DSC ) A Beginner ’ s Guide.
2014:1–9.
54. Perkin Elmer. Polymorphism in Acetaminophen Studied by Simultaneous DSC and
Raman Spectroscopy. Technical Information, 2010:3.