Embed Size (px)
Citation preview

University of Groningen
Enzymatic biodiesel synthesis using novel process intensification principlesIlmi, Miftahul
IMPORTANT NOTE: You are advised to consult the publisher's version (publisher's PDF) if you wish to cite fromit. Please check the document version below.
Document VersionPublisher's PDF, also known as Version of record
Publication date:2017
Link to publication in University of Groningen/UMCG research database
Citation for published version (APA):Ilmi, M. (2017). Enzymatic biodiesel synthesis using novel process intensification principles. [Groningen]:University of Groningen.
CopyrightOther than for strictly personal use, it is not permitted to download or to forward/distribute the text or part of it without the consent of theauthor(s) and/or copyright holder(s), unless the work is under an open content license (like Creative Commons).
Take-down policyIf you believe that this document breaches copyright please contact us providing details, and we will remove access to the work immediatelyand investigate your claim.
Downloaded from the University of Groningen/UMCG research database (Pure): http://www.rug.nl/research/portal. For technical reasons thenumber of authors shown on this cover page is limited to 10 maximum.
Download date: 03-05-2020

Continuous fatty acid butyl ester synthesis using a Rhizomucor miehei lipase in a biphasic aqueous-organic system
3CHAPTER
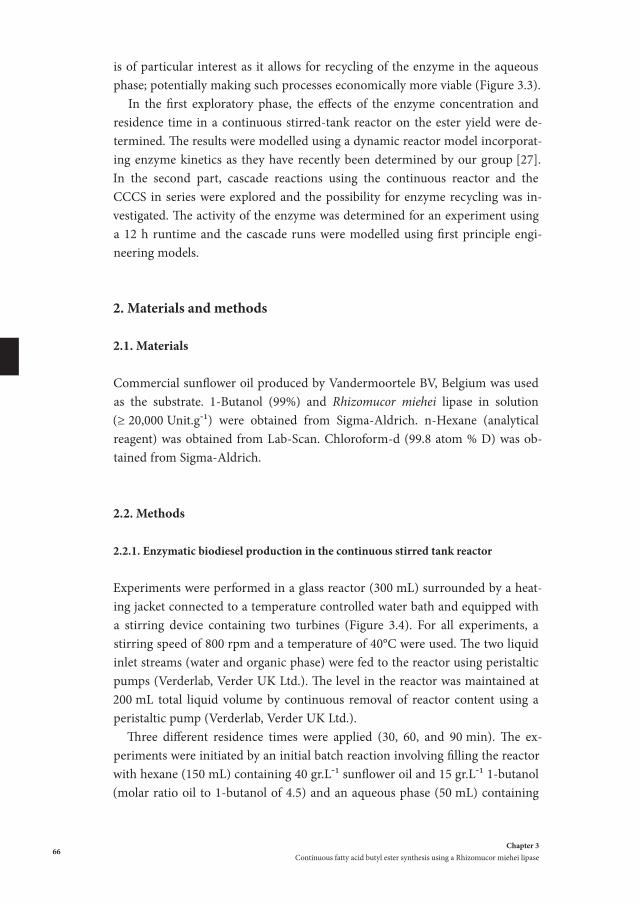
Abstract
Fatty acid butyl esters were synthesized from sunflower oil with 1- butanol using a homogenous Rhizomucor miehei lipase in a biphasic oil (triglyceride, 1-butanol, hexane)/water (with enzyme) system in a continuous set-up consisting of a cascade of a stirred tank reactor and a Contactor Centrifugal Separator (CCCS) device. Initially, the effect of process conditions (enzyme concentration, residence times) in the stirred tank reactor operated in a continuous mode was established and fatty acid butyl esters in a (non-optimized) yield of 60% was ob-tained (150 gr.Laq-1 enzyme, 90 minutes residence time, 800 rpm stir-ring speed, 40°C, organic to aqueous phase ratio 3:1). A significant increase in the yield up to 93% was obtained by placing a CCCS de-vice after the first stirred tank reactor with the additional advantage that both liquid phases are separated efficiently in the CCCS. The cas-cade was run for eight hours without operational problems. Enzyme recycling was studied by re-introduction of the water phase from the CCCS outlet to the stirred tank reactor. It was found that the product yield decreased over time to an average of 50% from the initial value. Accumulation of 1-butanol in water phase in combination with loss of enzyme due to agglomeration and the formation of a separate phase is suspected to be the cause of this decrease in enzyme activity.
Keywords: biphasic system, biocatalysis, Contactor Centrifugal Separator, continuous system, enzyme recycle, Rhizomucor miehei lipase, sunflower oil transesterification, modelling
M. Ilmi, M.Y. Abduh, A. Hommes, J.G.M. Winkelman, C. Hidayat, H.J. Heeres, Continuous fatty acid butyl ester synthesis using a Rhizomucor miehei lipase in a biphasic aqueous-organic system, submit-ted to Industrial & Engineering Chemistry Research.

Chapter 31. Introduction
63
1. Introduction
Biodiesel has become an important biofuel in recent years. It is renewable and can be used in existing compression ignition engines without substantial modifica-tions [1,2]. The global annual production of biodiesel has increased dramatically in the last decade; from 2.4 billion litres in 2004 to 29.7 billion litres in 2014 [3]. The biodiesel demand is expected to increase even more in the years ahead.
Biodiesel is composed of methyl esters of long chain fatty acids and is pro-duced from vegetable or animal oils and fats [4]. Biodiesel production is typi-cally performed using a base catalysed transesterification of the oil/fat with an alcohol [4–6]. Methanol is the most frequently used alcohol due to its low cost and the availability of globally accepted product specifications for methylest-ers [5,7]. However, recent studies have shown that esters from longer chain alco-hols such as propanol and butanol may have some advantages compared to es-ters from methanol or ethanol [7]. For instance, the cetane number of biodiesel, a prime fuel quality indicator in diesel engines, increases when using higher al-cohols instead of methanol [7].
More and more, enzymes are being used for the transesterification of tri-glycerides as they have certain advantages over basic chemical catalysts. These include a better compatibility with feeds with high free fatty acid (FFA) con-tents; no possibility for soap formation; simplified product work-up and a lower energy input [1,4]. However, higher costs and lower reaction rates limit their commercial use. One of the methods to allow for the enzymes to be recycled and to reduce costs is the use of immobilised enzymes. However, these are in general more expensive than the free enzymes and diffusion limitation of reac-tants/products in the immobilised enzyme matrix may reduce the overall rate of individual reactions considerably.
In this study we have explored the use of a free enzyme in a biphasic aque-ous-organic system (Figure 3.1). A biphasic approach allows for an efficient re-cycling of the enzyme after the reaction is complete by a simple separation of the organic product phase and the water phase with the free enzyme. The ad-vantages compared to the use of immobilised enzymes are a potential reduction of the production costs and the absence of intra-particle diffusion limitations that may have a negative effect on product formation rates. In addition, the presence of water during the transesterification reaction is known to increase enzyme activity and to prevent hydrophobic substrate and/or product inhibi-tion [8–10]. However, reactions in water only may lead to incomplete conver-sions due to equilibrium constraints and the formation of fatty acids. By using a biphasic aqueous-organic system, equilibrium constraint may be partly over-come and the rate of hydrolysis may be reduced [10,11].

Chapter 3Continuous fatty acid butyl ester synthesis using a Rhizomucor miehei lipase
64
Biodiesel synthesis using homogenous enzymes in biphasic aqueous-organic systems has been studied and modelled [8,11–14], however most of the studies were performed in a batch reactor set-up. A fed-batch approach has also been reported recently with stepwise alcohol addition to minimize alcohol inhibi-tion of the enzyme [15–17]. Studies on biodiesel synthesis and related fatty acid esters using free enzymes in continuous units are limited. Price et al. [17-20] in collaboration with Novozymes, performed studies at various process scales including in continuous stirred tank reactors using free enzymes for biodiesel synthesis. A kinetic model based on the Ping Pong Bi-Bi model was developed for biodiesel synthesis from rapeseed oil and methanol using a liquid formula-tion of the Thermomyces lanuginosus lipase (CalleraTM Trans L) [18]. In further studies, the model was used to compare performance between fed batch reac-tors and continuous stirred tank reactors (CSTRs). The model predicted that a cascade of 5 CSTRs are required (with a combined residence time of 30 hours) to reach a final biodiesel concentration within 2% of the 95.6 mass % achieved in a fed-batch operation, for 24 hours [19]. Finally, an experimental scale up study using both fed batch and CSTRs for biodiesel synthesis using liquid Thermomyces lanuginosus lipase (NS-40116) was performed successfully [20]. These studies clearly show the interest in the use of liquid enzyme formulations for biodiesel synthesis.
A continuous centrifugal contactor separator (CCCS) is a device that that in-tegrates both the intense mixing of two immiscible liquids and the subsequent separation (Figure 3.2) [21,22]. The device basically consists of a hollow rotor
Figure 3.1. Simplified schematic representation of an enzymatic transesterification in an aqueous- organic biphasic system.

Chapter 31. Introduction
65
positioned in a larger vessel. The two immiscible liquid phases are introduced in the annular zone between the outside of the rotor and the inside of the outer housing. Here, an efficient and fast mixing between the two phases occurs, which is advantageous for a two-phase liquid-liquid catalytic reaction to elim-inate mass transfer limitations. The mixture is then transferred inside the cen-trifuge through a hole in the bottom plate, where the two phases are separated by centrifugal forces whilst moving upwards, after which they leave the device through separate exits making use of an ingenious weir system [23]. As such, the device is an interesting example of process-intensification, acting both as a mixer and settler for biphasic liquid-liquid systems.
We have reported on the use of the CCCS device for esterification of fatty acids and the transesterifications of plant oils with alcohols [23-26]. For exam-ple, Kraai, et al. [23] used the CCCS device for the transesterification of sun-flower oil with methanol using an alkaline catalyst. They found excellent bio-diesel yields and volumetric production rates. Base catalysed biodiesel synthesis was further studied in the CCCS device, including optimization studies [24], as well as ethyl ester synthesis from Jatropha oil and ethanol [25], and synthesis and refining of methyl esters from sunflower oil using a cascade of two CCCS devices [26]. In addition to chemo-catalysis, the esterification of a long chain fatty acid with 1-butanol in a biphasic organic-water system using an enzyme was also reported by us [23]. However, enzyme-catalysed transesterification re-actions of plant oils with alcohols have not been reported using the CCCS and this is the focus of the research reported in this manuscript. Here, we provide the proof of concept for the synthesis of butyl esters from sunflower oil and 1-butanol in a cascade of a continuous stirred-tank reactor and a CCCS device using a homogenous Rhizomucor miehei lipase. In this concept, the majority of the reaction is performed in the stirred tank reactor, whereas the CCCS device acts as a second reactor as well as an efficient liquid phase separator. The concept
Figure 3.2. Continuous cen-trifugal contactor separator (CCCS). Reproduced from [24].
Chapter 3Continuous fatty acid butyl ester synthesis using a Rhizomucor miehei lipase
66
is of particular interest as it allows for recycling of the enzyme in the aqueous phase; potentially making such processes economically more viable (Figure 3.3).
In the first exploratory phase, the effects of the enzyme concentration and residence time in a continuous stirred-tank reactor on the ester yield were de-termined. The results were modelled using a dynamic reactor model incorporat-ing enzyme kinetics as they have recently been determined by our group [27]. In the second part, cascade reactions using the continuous reactor and the CCCS in series were explored and the possibility for enzyme recycling was in-vestigated. The activity of the enzyme was determined for an experiment using a 12 h runtime and the cascade runs were modelled using first principle engi-neering models.
2. Materials and methods
2.1. Materials
Commercial sunflower oil produced by Vandermoortele BV, Belgium was used as the substrate. 1-Butanol (99%) and Rhizomucor miehei lipase in solution (≥ 20,000 Unit.g-1) were obtained from Sigma-Aldrich. n-Hexane (analytical reagent) was obtained from Lab-Scan. Chloroform-d (99.8 atom % D) was ob-tained from Sigma-Aldrich.
2.2. Methods
2.2.1. Enzymatic biodiesel production in the continuous stirred tank reactor
Experiments were performed in a glass reactor (300 mL) surrounded by a heat-ing jacket connected to a temperature controlled water bath and equipped with a stirring device containing two turbines (Figure 3.4). For all experiments, a stirring speed of 800 rpm and a temperature of 40°C were used. The two liquid inlet streams (water and organic phase) were fed to the reactor using peristaltic pumps (Verderlab, Verder UK Ltd.). The level in the reactor was maintained at 200 mL total liquid volume by continuous removal of reactor content using a peristaltic pump (Verderlab, Verder UK Ltd.).
Three different residence times were applied (30, 60, and 90 min). The ex-periments were initiated by an initial batch reaction involving filling the reactor with hexane (150 mL) containing 40 gr.L-1 sunflower oil and 15 gr.L-1 1-butanol (molar ratio oil to 1-butanol of 4.5) and an aqueous phase (50 mL) containing

Chapter 32. Materials and methods
67
the enzyme (20 to 250 gr.L-1). The reactor was heated to 40°C under stirring and the reaction was allowed to proceed for a time equal to the pre-determined residence time. The continuous experiment was started by starting the feed and outlet pumps. For the experiment at a residence time of 60 min, the feed rates of the feed pumps were set at 2.5 mL.min-1 for the organic phase and 0.83 mL.min-1 for the aqueous phase (Table 3.1). The exit feed pump was set at 3.33 mL.min-1 to maintain a constant liquid volume in the reactor (200 mL). The feed rate was adjusted for experiments at other residence times. The runtime of each experi-ment was at least equal to three times the residence time. An overview of the ex-perimental conditions is given in Table 3.1. Samples were taken from the outlet stream during the experiment every 15 minutes within the first hour and every 30 minutes afterward. The phases were separated using a separation funnel. The hexane and 1-butanol in the organic phase were removed using a rotary evapo-rator (60°C, 300 mbar), and the remained product was analysed using 1H- NMR.
Figure 3.3. Scheme of the concept of biodiesel synthesis in a cascade of a continuous stirred-tank reactor and a CCCS device with catalyst recycle.
Figure 3.4. Schematic representation of the continuous stirred tank reactor.

Chapter 3Continuous fatty acid butyl ester synthesis using a Rhizomucor miehei lipase
68
2.2.2. Enzymatic biodiesel production in a cascade of a continuous stirred tank reactor and a CCCS
Experiments were done in a cascade of two reactors consisting of a con-tinuous stirred tank reactor as described above (Figure 3.4) and a subsequent CCCS device (Figure 3.2). The CCCS used in this study is a CINC V02 (350 mL geometric volume) equipped with a heating/cooling jacket connected to a tem-perature-controlled waterbath and a high-mix bottom plate. The two liquid inlet streams (water and organic phase) were fed to the continuous stirred tank re-actor using peristaltic pumps (Verderlab, Verder UK Ltd.), while a peristaltic pump (Verderlab, Verder UK Ltd.) was used to remove the liquids from the stirred tank vessel. A schematic representation of the experimental set-up is given in Figure 3.5.
In the first stage of experimentation, optimisation of the weir size, of partic-ular relevance to obtain a good separation of the organic and aqueous phase in the outlet of the CCCS, was performed. For this purpose, experiments using three different weir sizes (23.5, 26.04, and 27.94 mm) were carried out. A rep-resentative feed stream consisting of a representative reaction product obtained from experiments carried out in the stirred tank reactor (vide supra was fed into the CCCS device at a flow rate of 3.3 mL/min. The CCCS temperature was maintained at 40°C and stirring speed was set at 1800 rpm. The output of each liquid phase was collected and the amount was measured using a volumetric cylinder. The separation performance for a particular weir was determined by measuring the amounts of the two phases in each of the outlet streams.
The cascade experiments were performed by initially filling the stirred tank reactor with hexane (225 mL) containing 40 gr.L-1 sunflower oil and 15 gr.L-1 1-butanol (oil to 1-butanol molar ratio of 4.5) and an aqueous phase (75 mL) containing 150 gr.L-1 enzyme and stirred at 800 rpm and 40°C for 1 h. After 1 h, 100 mL of this biphasic mixture was transferred to the CCCS. The actual experi-ment was then started by switching on the feed pumps to the stirred tank reactor and the intermediate feed pump to the CCCS. The runtime for each experiment was 8 h (τCSTR = 60 min; τCCCS = 69 min). The volumetric flow rates of the pumps were as follows: organic input: 2.5 mL.min-1; aqueous input: 0.8 mL.min-1; con-tinuous reactor output/CCCS input: 3.3 mL.min-1. The heavy and light phase outlets of the CCCS were collected and measured using a volumetric cylinder. The quality of the phase separation in the separation part of the CCCS device was determined visually and quantitatively by placing the outlet streams in vol-umetric cylinder for 1 h and then measuring the volumes of both liquid phases.
Samples of the mixed phase from the stirred tank reactor (Figure 3.5, sam-pling point 1) and the organic outlet phase of the CCCS (Figure 3.5, sampling

Chapter 32. Materials and methods
69
point 2) were taken every hour and analysed using 1H-NMR after removal of the solvents. An overview of experimental conditions is given in Table 3.1.
2.2.3. Experiments in the cascade of a continuous stirred tank reactor and a CCCS with enzyme recycle.
Enzyme recycle in the continuous stirred tank– CCCS set up was done using the set-up and conditions mentioned above. The system was run with fresh en-zyme in aqueous phase for three hours before using aqueous phase collected from CCCS heavy phase output as input of stirred tank reactor (Figure 3.6).
Table 3.1. Experimental conditions for the experiments in the continuous stirred tank reactor and a cascade with a stirred tank reactor and a CCCS
Variable Value Range Stirred tank reactorT (°C) 40 -Stirring speed (rpm) 800τ (min) in stirred tank reactor experiments - 30 – 90τ (min) for cascade experiments 60 -Organic feed rate (mLmin-1)a 2.5 -
Oil feed rate (mLmin-1) 0.109 -1-butanol feed rate (mL.min-1) 0.046 -
Aqueous feed rate (mL.min-1)a 0.83 -Enzyme feed rate (mL.min-1) 0.104 -Enzyme concentration (gr.L-1) - 20 – 250
Liquid volume in reactor (mL) 200 -CCCS deviceT (°C) 40 -Stirring speed (rpm) 1800 -Weir size (mm) 27.94 -Liquid feed (mL.min-1) 3.33 -τ (min) 69 -
a for experiments with a residence time of 60 min in the stirred tank reactor
Figure 3.5. Schematic representation of the cascade with a stirred tank and CCCS in series.

Chapter 3Continuous fatty acid butyl ester synthesis using a Rhizomucor miehei lipase
70
Samples of mixed phase from stirred tank reactor (Figure 3.6, sampling point 1) and organic phase from CCCS (Figure 3.6, sampling point 2) were drawn every hour and analysed using 1H-NMR after solvent removal. A sample of the aque-ous phase was taken from sampling point 3 (Figure 3.6) every two hours and analysed for enzyme activity and protein, glycerol, and 1-butanol content. An overview of experimental conditions for the recycle experiments is given in Table 3.2.
Table 3.2. Experimental conditions for the experiments in a continuous stirred tank reactor and a cascade with a stirred tank reactor and a CCCS including enzyme recycle
Variable ValueStirred tank reactor (CSTRT (°C) 40Stirring speed (rpm) 800ΤCSTR (min) 60Organic feed rate (mL.min-1) 2.5
Oil feed rate (mL.min-1) 0.1091-butanol feed rate (mL.min-1) 0.046
Aqueous feed rate (mL.min-1) 0.83Enzyme feed rate (mL.min-1) 0.104Enzyme concentration (gr.L1) 150
Liquid volume in the reactor (mL) 200CCCS deviceT (°C) 40Stirring speed (rpm) 1800Weir size (mm) 27.94 Liquid feed rate (mL.min-1) 3.33ΤCCCS (min) 69
Figure 3.6. Schematic representation of the continuous cascade consisting of a stirred tank reactor and CCCS device

Chapter 32. Materials and methods
71
2.3 Analytical methods
The FABE yield was determined using 1H-NMR. Samples of 1 mL were taken from the CSTR and CCCS outlet streams. Absolute acetic acid (0.1 mL) was added to the samples from the CSTR outlet to inactive the enzyme, and subse-quently the organic and aqueous layers were separated. The samples from the CCCS outlet were already phase separated and were analysed as such. Hexane and 1-butanol were removed from the organic layer of all CSTR and CCCS sam-ples using a rotary evaporator (60°C, 300 mbar). 50 μL of the hexane-and-1-bu-tanol-free sample was mixed with 700 μL CDCl3 in an NMR tube. The mixture was analysed using a 300 MHz NMR (Varian Inc.). The FABE yield was deter-mined by comparing the intensity of quartet signal of CH2 group of the ester end group (δ 4.1 ppm) with respect to signal intensity of the methyl end group of fatty acids (δ 0.89 ppm) [25].
Lipase activity was determined using a method described by Kwon and Rhee [28], while the protein concentration was determined gravimetrically using the TCA precipitation method. For this purpose, 1000 μL of the sample was added to a 250 μL TCA solution (from a stock solution consisting of 5 g TCA diluted with 3.5 mL distilled water) and incubated for 10 minutes at 4°C. The mixture centrifuged at 14000 rpm for 5 minute, and then the supernatant separated for glycerol and 1-butanol concentration determination. The residue (proteins) was washed and centrifuged using cold acetone twice, and then dried at 60°C and weighted.
The glycerol and 1-butanol concentration in the recycled aqueous enzyme solution were determined using HPLC. Before injection, the sample was diluted 100 times using distilled water. The solution was injected into an HPLC (HP 1200 series) equipped with Biorad organic column (Aminex HPX-87H, 60°C) and UV and RI detector (HP 1260). The samples were run for 80 minutes with sulphuric acid (5 mM, 0.05 mL.min-1) as the eluent. Glycerol and 1-butanol concentration were determined by comparing peak intensities with a calibration curve made by using pure compounds.
2.4 Definitions
The residence time in the continuously stirred tank reactor was defined as the total liquid volume in the reactor (
73
2.3 Analytical methods The FABE yield was determined using 1H-NMR. Samples of 1 mL were taken from the CSTR
and CCCS outlet streams. Absolute acetic acid (0.1 mL) was added to the samples from the CSTR
outlet to inactive the enzyme, and subsequently the organic and aqueous layers were separated.
The samples from the CCCS outlet were already phase separated and were analysed as such. Hexane
and 1-butanol were removed from the organic layer of all CSTR and CCCS samples using a rotary
evaporator (60 °C, 300 mbar). 50 μL of the hexane-and-1-butanol-free sample was mixed with 700
μL CDCl3 in an NMR tube. The mixture was analysed using a 300 MHz NMR (Varian Inc.). The FABE
yield was determined by comparing the intensity of quartet signal of CH2 group of the ester end
group (δ 4.1 ppm) with respect to signal intensity of the methyl end group of fatty acids (δ 0.89 ppm)
[25].
Lipase activity was determined using a method described by Kwon and Rhee [28], while the
protein concentration was determined gravimetrically using the TCA precipitation method. For this
purpose, 1000 μL of the sample was added to a 250 μL TCA solution (from a stock solution consisting
of 5 g TCA diluted with 3.5 ml distilled water) and incubated for 10 minutes at 4°C. The mixture
centrifuged at 14000 rpm for 5 minute, and then the supernatant separated for glycerol and 1-
butanol concentration determination. The residue (proteins) was washed and centrifuged using cold
acetone twice, and then dried at 60 °C and weighted.
The glycerol and 1-butanol concentration in the recycled aqueous enzyme solution were
determined using HPLC. Before injection, the sample was diluted 100 times using distilled water. The
solution was injected into an HPLC (HP 1200 series) equipped with Biorad organic column (Aminex
HPX-87H, 60°C) and UV and RI detector (HP 1260). The samples were run for 80 minutes with
sulphuric acid (5 mM, 0.05 mL.min-1) as the eluent. Glycerol and 1-butanol concentration were
determined by comparing peak intensities with a calibration curve made by using pure compounds.
2.4 Definitions The residence time in the continuously stirred tank reactor was defined as the total liquid
volume in the reactor (��������) divided by the total liquid stream (organics plus water) entering the
reactor per minute (��������), see Eq. 3.1 for details.
����� ������� ������� �
(3.1)
The residence time in the CCCS was defined similarly, see Eq. 3.2 for details.
) divided by the total liquid stream (or-ganics plus water) entering the reactor per minute (
73
2.3 Analytical methods The FABE yield was determined using 1H-NMR. Samples of 1 mL were taken from the CSTR
and CCCS outlet streams. Absolute acetic acid (0.1 mL) was added to the samples from the CSTR
outlet to inactive the enzyme, and subsequently the organic and aqueous layers were separated.
The samples from the CCCS outlet were already phase separated and were analysed as such. Hexane
and 1-butanol were removed from the organic layer of all CSTR and CCCS samples using a rotary
evaporator (60 °C, 300 mbar). 50 μL of the hexane-and-1-butanol-free sample was mixed with 700
μL CDCl3 in an NMR tube. The mixture was analysed using a 300 MHz NMR (Varian Inc.). The FABE
yield was determined by comparing the intensity of quartet signal of CH2 group of the ester end
group (δ 4.1 ppm) with respect to signal intensity of the methyl end group of fatty acids (δ 0.89 ppm)
[25].
Lipase activity was determined using a method described by Kwon and Rhee [28], while the
protein concentration was determined gravimetrically using the TCA precipitation method. For this
purpose, 1000 μL of the sample was added to a 250 μL TCA solution (from a stock solution consisting
of 5 g TCA diluted with 3.5 ml distilled water) and incubated for 10 minutes at 4°C. The mixture
centrifuged at 14000 rpm for 5 minute, and then the supernatant separated for glycerol and 1-
butanol concentration determination. The residue (proteins) was washed and centrifuged using cold
acetone twice, and then dried at 60 °C and weighted.
The glycerol and 1-butanol concentration in the recycled aqueous enzyme solution were
determined using HPLC. Before injection, the sample was diluted 100 times using distilled water. The
solution was injected into an HPLC (HP 1200 series) equipped with Biorad organic column (Aminex
HPX-87H, 60°C) and UV and RI detector (HP 1260). The samples were run for 80 minutes with
sulphuric acid (5 mM, 0.05 mL.min-1) as the eluent. Glycerol and 1-butanol concentration were
determined by comparing peak intensities with a calibration curve made by using pure compounds.
2.4 Definitions The residence time in the continuously stirred tank reactor was defined as the total liquid
volume in the reactor (��������) divided by the total liquid stream (organics plus water) entering the
reactor per minute (��������), see Eq. 3.1 for details.
����� ������� ������� �
(3.1)
The residence time in the CCCS was defined similarly, see Eq. 3.2 for details.
), see Eq. 3.1 for details.

Chapter 3Continuous fatty acid butyl ester synthesis using a Rhizomucor miehei lipase
72
73
2.3 Analytical methods The FABE yield was determined using 1H-NMR. Samples of 1 mL were taken from the CSTR
and CCCS outlet streams. Absolute acetic acid (0.1 mL) was added to the samples from the CSTR
outlet to inactive the enzyme, and subsequently the organic and aqueous layers were separated.
The samples from the CCCS outlet were already phase separated and were analysed as such. Hexane
and 1-butanol were removed from the organic layer of all CSTR and CCCS samples using a rotary
evaporator (60 °C, 300 mbar). 50 μL of the hexane-and-1-butanol-free sample was mixed with 700
μL CDCl3 in an NMR tube. The mixture was analysed using a 300 MHz NMR (Varian Inc.). The FABE
yield was determined by comparing the intensity of quartet signal of CH2 group of the ester end
group (δ 4.1 ppm) with respect to signal intensity of the methyl end group of fatty acids (δ 0.89 ppm)
[25].
Lipase activity was determined using a method described by Kwon and Rhee [28], while the
protein concentration was determined gravimetrically using the TCA precipitation method. For this
purpose, 1000 μL of the sample was added to a 250 μL TCA solution (from a stock solution consisting
of 5 g TCA diluted with 3.5 ml distilled water) and incubated for 10 minutes at 4°C. The mixture
centrifuged at 14000 rpm for 5 minute, and then the supernatant separated for glycerol and 1-
butanol concentration determination. The residue (proteins) was washed and centrifuged using cold
acetone twice, and then dried at 60 °C and weighted.
The glycerol and 1-butanol concentration in the recycled aqueous enzyme solution were
determined using HPLC. Before injection, the sample was diluted 100 times using distilled water. The
solution was injected into an HPLC (HP 1200 series) equipped with Biorad organic column (Aminex
HPX-87H, 60°C) and UV and RI detector (HP 1260). The samples were run for 80 minutes with
sulphuric acid (5 mM, 0.05 mL.min-1) as the eluent. Glycerol and 1-butanol concentration were
determined by comparing peak intensities with a calibration curve made by using pure compounds.
2.4 Definitions The residence time in the continuously stirred tank reactor was defined as the total liquid
volume in the reactor (��������) divided by the total liquid stream (organics plus water) entering the
reactor per minute (��������), see Eq. 3.1 for details.
����� ������� ������� �
(3.1)
The residence time in the CCCS was defined similarly, see Eq. 3.2 for details.
(3.1)
The residence time in the CCCS was defined similarly, see Eq. 3.2 for details.
74
����� ���������������
(3.2)
����� was determined by measuring the liquid volume left in CCCS after closing the valves of the
inlet and outlets of the CCS after an experiment. The liquid was drained from a valve in the bottom
of the CCCS and collected and measured using a volumetric cylinder.
The FABE yield is expressed in %-mol and determined by comparing the peak area of butyl ester
group of the ester group of FABE (δ 4.1 ppm) with respect to signal intensity of the methyl end
groups (δ 0.89 ppm):
�������� � ���� ��������� � �� ���������������� �� � ����� (3.3)
The reported FABE yield for a continuous experiment is the average FABE yield during steady state
operation of the cascade.
The volumetric production rate of FABE is defined as the amount of FABE produced per
volume liquid per time (kg.m-3.min-1).
�������������������������� � ��������
����¡¢�����
£¤���
������ (3.4)
Where:
¥�¦ volumetric flow rate of the sunflower oil (m3.min-1)
§�¦ oil density (kg.m-3)
¨ FABE yield (%-mol)
����� liquid volume (m3)
©ª«¬®¯ molecular weight of FABE (kg.mol-1)
©ª�¦ molecular weight of oil (kg.mol-1)
For calculations of the volumetric production rate in the stirred tank reactor, the total liquid volume
in the stirred tank reactor was taken. For reactions in the cascade, the ����� is the sum of the total
liquid volume in the stirred tank reactor and the CCCS device.
(3.2)
was determined by measuring the liquid volume left in CCCS after closing the valves of the inlet and outlets of the CCS after an experiment. The liquid was drained from a valve in the bottom of the CCCS and collected and measured using a volumetric cylinder.
The FABE yield is expressed in %-mol and determined by comparing the peak area of butyl ester group of the ester group of FABE (δ 4.1 ppm) with re-spect to signal intensity of the methyl end groups (δ 0.89 ppm):
74
����� ���������������
(3.2)
����� was determined by measuring the liquid volume left in CCCS after closing the valves of the
inlet and outlets of the CCS after an experiment. The liquid was drained from a valve in the bottom
of the CCCS and collected and measured using a volumetric cylinder.
The FABE yield is expressed in %-mol and determined by comparing the peak area of butyl ester
group of the ester group of FABE (δ 4.1 ppm) with respect to signal intensity of the methyl end
groups (δ 0.89 ppm):
�������� � ���� ��������� � �� ���������������� �� � ����� (3.3)
The reported FABE yield for a continuous experiment is the average FABE yield during steady state
operation of the cascade.
The volumetric production rate of FABE is defined as the amount of FABE produced per
volume liquid per time (kg.m-3.min-1).
�������������������������� � ��������
����¡¢�����
£¤���
������ (3.4)
Where:
¥�¦ volumetric flow rate of the sunflower oil (m3.min-1)
§�¦ oil density (kg.m-3)
¨ FABE yield (%-mol)
����� liquid volume (m3)
©ª«¬®¯ molecular weight of FABE (kg.mol-1)
©ª�¦ molecular weight of oil (kg.mol-1)
For calculations of the volumetric production rate in the stirred tank reactor, the total liquid volume
in the stirred tank reactor was taken. For reactions in the cascade, the ����� is the sum of the total
liquid volume in the stirred tank reactor and the CCCS device.
(3.3)
The reported FABE yield for a continuous experiment is the average FABE yield during steady state operation of the cascade.
The volumetric production rate of FABE is defined as the amount of FABE produced per volume liquid per time (kg.m-3.min-1).
74
����� ���������������
(3.2)
����� was determined by measuring the liquid volume left in CCCS after closing the valves of the
inlet and outlets of the CCS after an experiment. The liquid was drained from a valve in the bottom
of the CCCS and collected and measured using a volumetric cylinder.
The FABE yield is expressed in %-mol and determined by comparing the peak area of butyl ester
group of the ester group of FABE (δ 4.1 ppm) with respect to signal intensity of the methyl end
groups (δ 0.89 ppm):
�������� � ���� ��������� � �� ���������������� �� � ����� (3.3)
The reported FABE yield for a continuous experiment is the average FABE yield during steady state
operation of the cascade.
The volumetric production rate of FABE is defined as the amount of FABE produced per
volume liquid per time (kg.m-3.min-1).
�������������������������� � ��������
����¡¢�����
£¤���
������ (3.4)
Where:
¥�¦ volumetric flow rate of the sunflower oil (m3.min-1)
§�¦ oil density (kg.m-3)
¨ FABE yield (%-mol)
����� liquid volume (m3)
©ª«¬®¯ molecular weight of FABE (kg.mol-1)
©ª�¦ molecular weight of oil (kg.mol-1)
For calculations of the volumetric production rate in the stirred tank reactor, the total liquid volume
in the stirred tank reactor was taken. For reactions in the cascade, the ����� is the sum of the total
liquid volume in the stirred tank reactor and the CCCS device.
(3.4)
Where:
74
����� ���������������
(3.2)
����� was determined by measuring the liquid volume left in CCCS after closing the valves of the
inlet and outlets of the CCS after an experiment. The liquid was drained from a valve in the bottom
of the CCCS and collected and measured using a volumetric cylinder.
The FABE yield is expressed in %-mol and determined by comparing the peak area of butyl ester
group of the ester group of FABE (δ 4.1 ppm) with respect to signal intensity of the methyl end
groups (δ 0.89 ppm):
�������� � ���� ��������� � �� ���������������� �� � ����� (3.3)
The reported FABE yield for a continuous experiment is the average FABE yield during steady state
operation of the cascade.
The volumetric production rate of FABE is defined as the amount of FABE produced per
volume liquid per time (kg.m-3.min-1).
�������������������������� � ��������
����¡¢�����
£¤���
������ (3.4)
Where:
¥�¦ volumetric flow rate of the sunflower oil (m3.min-1)
§�¦ oil density (kg.m-3)
¨ FABE yield (%-mol)
����� liquid volume (m3)
©ª«¬®¯ molecular weight of FABE (kg.mol-1)
©ª�¦ molecular weight of oil (kg.mol-1)
For calculations of the volumetric production rate in the stirred tank reactor, the total liquid volume
in the stirred tank reactor was taken. For reactions in the cascade, the ����� is the sum of the total
liquid volume in the stirred tank reactor and the CCCS device.
volumetric flow rate of the sunflower oil (m3.min-1)
74
����� ���������������
(3.2)
����� was determined by measuring the liquid volume left in CCCS after closing the valves of the
inlet and outlets of the CCS after an experiment. The liquid was drained from a valve in the bottom
of the CCCS and collected and measured using a volumetric cylinder.
The FABE yield is expressed in %-mol and determined by comparing the peak area of butyl ester
group of the ester group of FABE (δ 4.1 ppm) with respect to signal intensity of the methyl end
groups (δ 0.89 ppm):
�������� � ���� ��������� � �� ���������������� �� � ����� (3.3)
The reported FABE yield for a continuous experiment is the average FABE yield during steady state
operation of the cascade.
The volumetric production rate of FABE is defined as the amount of FABE produced per
volume liquid per time (kg.m-3.min-1).
�������������������������� � ��������
����¡¢�����
£¤���
������ (3.4)
Where:
¥�¦ volumetric flow rate of the sunflower oil (m3.min-1)
§�¦ oil density (kg.m-3)
¨ FABE yield (%-mol)
����� liquid volume (m3)
©ª«¬®¯ molecular weight of FABE (kg.mol-1)
©ª�¦ molecular weight of oil (kg.mol-1)
For calculations of the volumetric production rate in the stirred tank reactor, the total liquid volume
in the stirred tank reactor was taken. For reactions in the cascade, the ����� is the sum of the total
liquid volume in the stirred tank reactor and the CCCS device.
oil density (kg.m-3)
74
����� ���������������
(3.2)
����� was determined by measuring the liquid volume left in CCCS after closing the valves of the
inlet and outlets of the CCS after an experiment. The liquid was drained from a valve in the bottom
of the CCCS and collected and measured using a volumetric cylinder.
The FABE yield is expressed in %-mol and determined by comparing the peak area of butyl ester
group of the ester group of FABE (δ 4.1 ppm) with respect to signal intensity of the methyl end
groups (δ 0.89 ppm):
�������� � ���� ��������� � �� ���������������� �� � ����� (3.3)
The reported FABE yield for a continuous experiment is the average FABE yield during steady state
operation of the cascade.
The volumetric production rate of FABE is defined as the amount of FABE produced per
volume liquid per time (kg.m-3.min-1).
�������������������������� � ��������
����¡¢�����
£¤���
������ (3.4)
Where:
¥�¦ volumetric flow rate of the sunflower oil (m3.min-1)
§�¦ oil density (kg.m-3)
¨ FABE yield (%-mol)
����� liquid volume (m3)
©ª«¬®¯ molecular weight of FABE (kg.mol-1)
©ª�¦ molecular weight of oil (kg.mol-1)
For calculations of the volumetric production rate in the stirred tank reactor, the total liquid volume
in the stirred tank reactor was taken. For reactions in the cascade, the ����� is the sum of the total
liquid volume in the stirred tank reactor and the CCCS device.
FABE yield (%-mol)
74
����� ���������������
(3.2)
����� was determined by measuring the liquid volume left in CCCS after closing the valves of the
inlet and outlets of the CCS after an experiment. The liquid was drained from a valve in the bottom
of the CCCS and collected and measured using a volumetric cylinder.
The FABE yield is expressed in %-mol and determined by comparing the peak area of butyl ester
group of the ester group of FABE (δ 4.1 ppm) with respect to signal intensity of the methyl end
groups (δ 0.89 ppm):
�������� � ���� ��������� � �� ���������������� �� � ����� (3.3)
The reported FABE yield for a continuous experiment is the average FABE yield during steady state
operation of the cascade.
The volumetric production rate of FABE is defined as the amount of FABE produced per
volume liquid per time (kg.m-3.min-1).
�������������������������� � ��������
����¡¢�����
£¤���
������ (3.4)
Where:
¥�¦ volumetric flow rate of the sunflower oil (m3.min-1)
§�¦ oil density (kg.m-3)
¨ FABE yield (%-mol)
����� liquid volume (m3)
©ª«¬®¯ molecular weight of FABE (kg.mol-1)
©ª�¦ molecular weight of oil (kg.mol-1)
For calculations of the volumetric production rate in the stirred tank reactor, the total liquid volume
in the stirred tank reactor was taken. For reactions in the cascade, the ����� is the sum of the total
liquid volume in the stirred tank reactor and the CCCS device.
liquid volume (m3)
74
����� ���������������
(3.2)
����� was determined by measuring the liquid volume left in CCCS after closing the valves of the
inlet and outlets of the CCS after an experiment. The liquid was drained from a valve in the bottom
of the CCCS and collected and measured using a volumetric cylinder.
The FABE yield is expressed in %-mol and determined by comparing the peak area of butyl ester
group of the ester group of FABE (δ 4.1 ppm) with respect to signal intensity of the methyl end
groups (δ 0.89 ppm):
�������� � ���� ��������� � �� ���������������� �� � ����� (3.3)
The reported FABE yield for a continuous experiment is the average FABE yield during steady state
operation of the cascade.
The volumetric production rate of FABE is defined as the amount of FABE produced per
volume liquid per time (kg.m-3.min-1).
�������������������������� � ��������
����¡¢�����
£¤���
������ (3.4)
Where:
¥�¦ volumetric flow rate of the sunflower oil (m3.min-1)
§�¦ oil density (kg.m-3)
¨ FABE yield (%-mol)
����� liquid volume (m3)
©ª«¬®¯ molecular weight of FABE (kg.mol-1)
©ª�¦ molecular weight of oil (kg.mol-1)
For calculations of the volumetric production rate in the stirred tank reactor, the total liquid volume
in the stirred tank reactor was taken. For reactions in the cascade, the ����� is the sum of the total
liquid volume in the stirred tank reactor and the CCCS device.
molecular weight of FABE (kg.mol-1)
74
����� ���������������
(3.2)
����� was determined by measuring the liquid volume left in CCCS after closing the valves of the
inlet and outlets of the CCS after an experiment. The liquid was drained from a valve in the bottom
of the CCCS and collected and measured using a volumetric cylinder.
The FABE yield is expressed in %-mol and determined by comparing the peak area of butyl ester
group of the ester group of FABE (δ 4.1 ppm) with respect to signal intensity of the methyl end
groups (δ 0.89 ppm):
�������� � ���� ��������� � �� ���������������� �� � ����� (3.3)
The reported FABE yield for a continuous experiment is the average FABE yield during steady state
operation of the cascade.
The volumetric production rate of FABE is defined as the amount of FABE produced per
volume liquid per time (kg.m-3.min-1).
�������������������������� � ��������
����¡¢�����
£¤���
������ (3.4)
Where:
¥�¦ volumetric flow rate of the sunflower oil (m3.min-1)
§�¦ oil density (kg.m-3)
¨ FABE yield (%-mol)
����� liquid volume (m3)
©ª«¬®¯ molecular weight of FABE (kg.mol-1)
©ª�¦ molecular weight of oil (kg.mol-1)
For calculations of the volumetric production rate in the stirred tank reactor, the total liquid volume
in the stirred tank reactor was taken. For reactions in the cascade, the ����� is the sum of the total
liquid volume in the stirred tank reactor and the CCCS device.
molecular weight of oil (kg.mol-1)For calculations of the volumetric production rate in the stirred tank reactor,
the total liquid volume in the stirred tank reactor was taken. For reactions in the cascade, the
74
����� ���������������
(3.2)
����� was determined by measuring the liquid volume left in CCCS after closing the valves of the
inlet and outlets of the CCS after an experiment. The liquid was drained from a valve in the bottom
of the CCCS and collected and measured using a volumetric cylinder.
The FABE yield is expressed in %-mol and determined by comparing the peak area of butyl ester
group of the ester group of FABE (δ 4.1 ppm) with respect to signal intensity of the methyl end
groups (δ 0.89 ppm):
�������� � ���� ��������� � �� ���������������� �� � ����� (3.3)
The reported FABE yield for a continuous experiment is the average FABE yield during steady state
operation of the cascade.
The volumetric production rate of FABE is defined as the amount of FABE produced per
volume liquid per time (kg.m-3.min-1).
�������������������������� � ��������
����¡¢�����
£¤���
������ (3.4)
Where:
¥�¦ volumetric flow rate of the sunflower oil (m3.min-1)
§�¦ oil density (kg.m-3)
¨ FABE yield (%-mol)
����� liquid volume (m3)
©ª«¬®¯ molecular weight of FABE (kg.mol-1)
©ª�¦ molecular weight of oil (kg.mol-1)
For calculations of the volumetric production rate in the stirred tank reactor, the total liquid volume
in the stirred tank reactor was taken. For reactions in the cascade, the ����� is the sum of the total
liquid volume in the stirred tank reactor and the CCCS device.
is the sum of the total liquid volume in the stirred tank reactor and the CCCS device.

Chapter 33. Results and discussion
73
3. Results and discussion
3.1. Enzymatic biodiesel production in the continuous stirred tank reactor
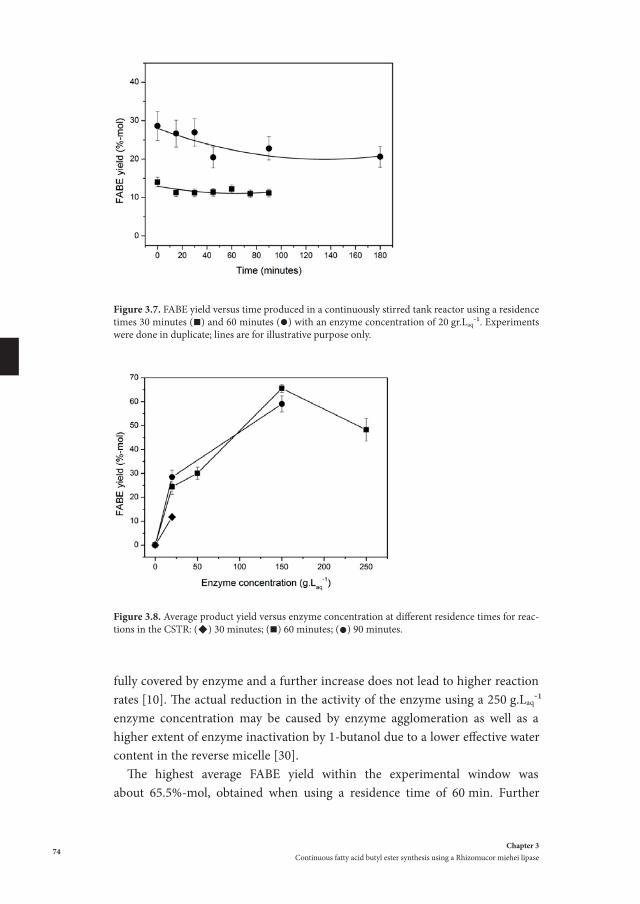
Exploratory biphasic experiments with sunflower oil as a representative example of a pure plant oil and 1-butanol as the alcohol were done in a continuously stirred tank reactor (CSTR) to determine the optimum residence time and en-zyme concentration. The experiments were performed at 40°C with an organic to aqueous volume ratio of 3 and an oil to 1-butanol molar ratio of 4.5. These values were taken from optimized batch experiments performed earlier in our group [27]. An overview of experimental conditions is given in Table 3.1. All experiments were carried out in duplicate to gain insights in the reproducibility of the reaction. The reactions were started up in a batch mode and at t = 0 the pumps were started. The FABE yield versus the runtime for two typical experi-ments at different residence times using an enzyme concentration of 20 gr.Laq-1 enzyme is given in Figure 7. At the lower residence time (30 minutes) an aver-age of FABE yield of 12%-mol was obtained. Improved yields (22%-mol) were obtained by increasing the residence time to 60 min. The slight decrease in yield over time when using the 60 minutes residence time is likely related to the rel-atively short runtime, and as such the steady state may not have been reached already. This is confirmed by performing experiments at prolonged runtimes (up to 8 h, see the next section). Experiments in the CSTR were performed in duplicate and the FABE yield at a certain time is the average of a duplicate or triplicate. The results as given in Figure 3.7 show that the reproducibility of the reactions is good. These preliminary experiments clearly show that the enzyme is capable of catalysing the transesterification of pure plant oil with 1-butanol in a biphasic system, though optimisation of process conditions will be required to improve the yields.
To further enhance the FABE yield, a number of experiments with higher en-zyme concentrations and longer residence times were performed at otherwise similar conditions (Table 3.1) and the results are shown in Figure 3.8. The FABE yield is a clear function of the enzyme concentration (Figure 3.8) and a clear op-timum at about 150 g.Laq-1 is visible when using a residence time of 60 minutes. This maximum is most likely related to the available interfacial area in relation to the amount of enzyme. The enzymatic reaction is known to be an interfacial reaction, with the enzyme residing in the water phase and the oil substrate in the organic phase (Figure 3.1). When considering the volumetric phase ratio used in the experiment (Vorg/Vaq = 3), the biphasic system is best described as a reverse micellar system [29], with the enzyme contained in an aqueous drop-let. At enzyme concentration of about 150 g.Laq-1, the interface surface is likely
Chapter 3Continuous fatty acid butyl ester synthesis using a Rhizomucor miehei lipase
74
fully covered by enzyme and a further increase does not lead to higher reaction rates [10]. The actual reduction in the activity of the enzyme using a 250 g.Laq-1 enzyme concentration may be caused by enzyme agglomeration as well as a higher extent of enzyme inactivation by 1-butanol due to a lower effective water content in the reverse micelle [30].
The highest average FABE yield within the experimental window was about 65.5%-mol, obtained when using a residence time of 60 min. Further
Figure 3.7. FABE yield versus time produced in a continuously stirred tank reactor using a residence times 30 minutes () and 60 minutes () with an enzyme concentration of 20 gr.Laq-1. Experiments were done in duplicate; lines are for illustrative purpose only.
Figure 3.8. Average product yield versus enzyme concentration at different residence times for reac-tions in the CSTR: () 30 minutes; () 60 minutes; () 90 minutes.
Chapter 33. Results and discussion
75
optimisation studies e.g. by prolonging residence times and the use of other phase ratio’s, was not performed as a FABE yield of 65.5%-mol was considered optimal with respect to subsequent experimentation in a cascade of a stirred tank reactor and a CCCS device.
The volumetric production rate of the experiment using 150 g.Laq-1 of enzyme calculated using Eq. 3.4 was 0.25 kg FABE.m-3.min-1 when using a 90 min resi-dence time, and 0.38 kg.m-3.min-1 when using a residence time of 60 min. These volumetric production rates are slightly lower than those reported by Price et al. for a Thermomyces lanuginosus lipase (CalleraTM Trans L) in a fed batch reactor (0.47 kg.m-3.min-1) [17].
3.2 CSTR modelling
The experimental data obtained in the CSTR reactor (Figure 3.8) were modelled using the mass balances in combination with the known enzyme kinetics for sunflower oil transesterification with 1-butanol using the homogeneous lipase (Rhizomucor miehei) in an aqueous-organic biphasic system (Ping Pong Bi Bi mechanism with non-competitive inhibition by 1-butanol and a term for irre-versible enzyme deactivation during reaction) [27].
3.2.1 Model development
The continuous stirred tank experiments were operated in two stages. In a first stage the reactor was operated in batch mode during a time batchtt ≤≤0 . After this initial batch stage the operation in actual continuous mode started by switching on the organic and aqueous feed pumps and outlet pump.
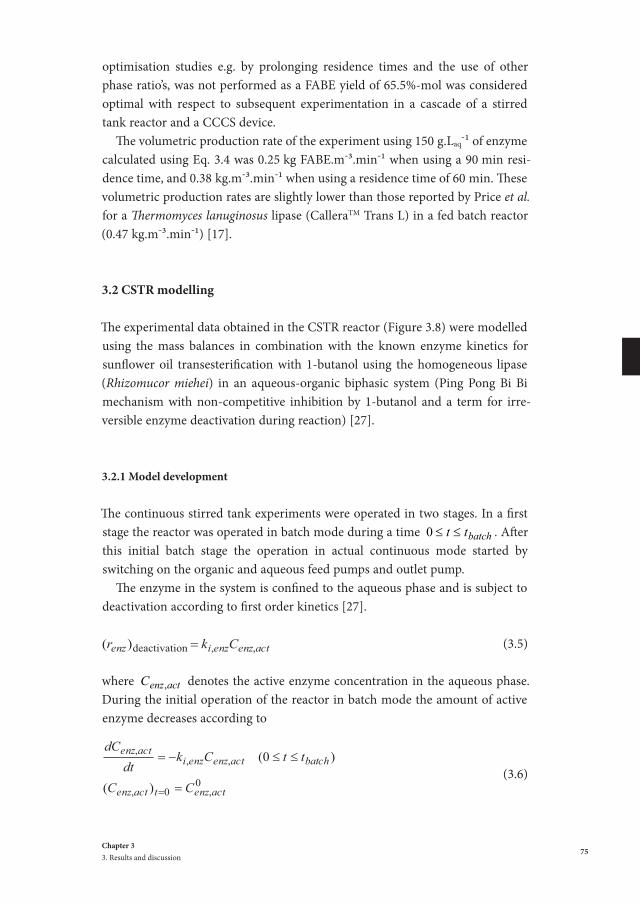
The enzyme in the system is confined to the aqueous phase and is subject to deactivation according to first order kinetics [27].
78
opera�on in actual con�nuous mode started by switching on the organic and aqueous feed pumps
and outlet pump.
The enzyme in the system is confined to the aqueous phase and is subject to deac�va�on
according to first order kine�cs [27].
actenzenzienz Ckr ,,)( deactivation (3.5)
where actenzC , denotes the ac�ve enzyme concentra�on in the aqueous phase. During the ini�al
opera�on of the reactor in batch mode the amount of ac�ve enzyme decreases according to
0,0,
,,,
)(
)0(
actenztactenz
batchactenzenziactenz
CC
ttCkdt
dC (3.6)
In the second stage, where the reactor is operated in the con�nuous stirred tank mode, the amount
of ac�ve enzyme varies in �me due to the addi�on of ac�ve enzyme with the inflowing aqueous
stream, inactenzinaqv C ,,, , the ou�low with aqueous stream, actenzoutaqv C ,,, and the decrease caused
deac�va�on aqactenzenzi VCk ,, . Thus the amount of ac�ve enzyme in the con�nuous s�rred tank
reactor is described by
0,0,
,,,,,,
)(
)()(
actenztactenz
batchaqactenzenziactenzinactenzaqv
actenzaq
CC
ttVCkCCdt
dCV
(3.7)
The equa�ons 3.5 and 3.6 can be solved for the concentra�on of ac�ve enzyme
]exp[:0 ,0,, tkCCtt enziactenzactenzbatch (3.8)
aqenzi
aq
batchaqenzi
inactenz
aq
batchaqenzibatchenziactenzactenzbatch
k
ttk
C
ttktkCCtt
,
,
,
,,0,,
1
])1(exp[1
])1(exp[:
(3.9)
(3.5)
where actenzC , denotes the active enzyme concentration in the aqueous phase. During the initial operation of the reactor in batch mode the amount of active enzyme decreases according to
(3.6)
78
opera�on in actual con�nuous mode started by switching on the organic and aqueous feed pumps
and outlet pump.
The enzyme in the system is confined to the aqueous phase and is subject to deac�va�on
according to first order kine�cs [27].
actenzenzienz Ckr ,,)( deactivation (3.5)
where actenzC , denotes the ac�ve enzyme concentra�on in the aqueous phase. During the ini�al
opera�on of the reactor in batch mode the amount of ac�ve enzyme decreases according to
0,0,
,,,
)(
)0(
actenztactenz
batchactenzenziactenz
CC
ttCkdt
dC (3.6)
In the second stage, where the reactor is operated in the con�nuous stirred tank mode, the amount
of ac�ve enzyme varies in �me due to the addi�on of ac�ve enzyme with the inflowing aqueous
stream, inactenzinaqv C ,,, , the ou�low with aqueous stream, actenzoutaqv C ,,, and the decrease caused
deac�va�on aqactenzenzi VCk ,, . Thus the amount of ac�ve enzyme in the con�nuous s�rred tank
reactor is described by
0,0,
,,,,,,
)(
)()(
actenztactenz
batchaqactenzenziactenzinactenzaqv
actenzaq
CC
ttVCkCCdt
dCV
(3.7)
The equa�ons 3.5 and 3.6 can be solved for the concentra�on of ac�ve enzyme
]exp[:0 ,0,, tkCCtt enziactenzactenzbatch (3.8)
aqenzi
aq
batchaqenzi
inactenz
aq
batchaqenzibatchenziactenzactenzbatch
k
ttk
C
ttktkCCtt
,
,
,
,,0,,
1
])1(exp[1
])1(exp[:
(3.9)

Chapter 3Continuous fatty acid butyl ester synthesis using a Rhizomucor miehei lipase
76
In the second stage, where the reactor is operated in the continuous stirred tank mode, the amount of active enzyme varies in time due to the addition of active enzyme with the inflowing aqueous stream,
78
opera�on in actual con�nuous mode started by switching on the organic and aqueous feed pumps
and outlet pump.
The enzyme in the system is confined to the aqueous phase and is subject to deac�va�on
according to first order kine�cs [27].
actenzenzienz Ckr ,,)( deactivation (3.5)
where actenzC , denotes the ac�ve enzyme concentra�on in the aqueous phase. During the ini�al
opera�on of the reactor in batch mode the amount of ac�ve enzyme decreases according to
0,0,
,,,
)(
)0(
actenztactenz
batchactenzenziactenz
CC
ttCkdt
dC (3.6)
In the second stage, where the reactor is operated in the con�nuous stirred tank mode, the amount
of ac�ve enzyme varies in �me due to the addi�on of ac�ve enzyme with the inflowing aqueous
stream, inactenzinaqv C ,,, , the ou�low with aqueous stream, actenzoutaqv C ,,, and the decrease caused
deac�va�on aqactenzenzi VCk ,, . Thus the amount of ac�ve enzyme in the con�nuous s�rred tank
reactor is described by
0,0,
,,,,,,
)(
)()(
actenztactenz
batchaqactenzenziactenzinactenzaqv
actenzaq
CC
ttVCkCCdt
dCV
(3.7)
The equa�ons 3.5 and 3.6 can be solved for the concentra�on of ac�ve enzyme
]exp[:0 ,0,, tkCCtt enziactenzactenzbatch (3.8)
aqenzi
aq
batchaqenzi
inactenz
aq
batchaqenzibatchenziactenzactenzbatch
k
ttk
C
ttktkCCtt
,
,
,
,,0,,
1
])1(exp[1
])1(exp[:
(3.9)
, the outflow with aqueous stream,
78
opera�on in actual con�nuous mode started by switching on the organic and aqueous feed pumps
and outlet pump.
The enzyme in the system is confined to the aqueous phase and is subject to deac�va�on
according to first order kine�cs [27].
actenzenzienz Ckr ,,)( deactivation (3.5)
where actenzC , denotes the ac�ve enzyme concentra�on in the aqueous phase. During the ini�al
opera�on of the reactor in batch mode the amount of ac�ve enzyme decreases according to
0,0,
,,,
)(
)0(
actenztactenz
batchactenzenziactenz
CC
ttCkdt
dC (3.6)
In the second stage, where the reactor is operated in the con�nuous stirred tank mode, the amount
of ac�ve enzyme varies in �me due to the addi�on of ac�ve enzyme with the inflowing aqueous
stream, inactenzinaqv C ,,, , the ou�low with aqueous stream, actenzoutaqv C ,,, and the decrease caused
deac�va�on aqactenzenzi VCk ,, . Thus the amount of ac�ve enzyme in the con�nuous s�rred tank
reactor is described by
0,0,
,,,,,,
)(
)()(
actenztactenz
batchaqactenzenziactenzinactenzaqv
actenzaq
CC
ttVCkCCdt
dCV
(3.7)
The equa�ons 3.5 and 3.6 can be solved for the concentra�on of ac�ve enzyme
]exp[:0 ,0,, tkCCtt enziactenzactenzbatch (3.8)
aqenzi
aq
batchaqenzi
inactenz
aq
batchaqenzibatchenziactenzactenzbatch
k
ttk
C
ttktkCCtt
,
,
,
,,0,,
1
])1(exp[1
])1(exp[:
(3.9)
, and the decrease caused deactivation
78
opera�on in actual con�nuous mode started by switching on the organic and aqueous feed pumps
and outlet pump.
The enzyme in the system is confined to the aqueous phase and is subject to deac�va�on
according to first order kine�cs [27].
actenzenzienz Ckr ,,)( deactivation (3.5)
where actenzC , denotes the ac�ve enzyme concentra�on in the aqueous phase. During the ini�al
opera�on of the reactor in batch mode the amount of ac�ve enzyme decreases according to
0,0,
,,,
)(
)0(
actenztactenz
batchactenzenziactenz
CC
ttCkdt
dC (3.6)
In the second stage, where the reactor is operated in the con�nuous stirred tank mode, the amount
of ac�ve enzyme varies in �me due to the addi�on of ac�ve enzyme with the inflowing aqueous
stream, inactenzinaqv C ,,, , the ou�low with aqueous stream, actenzoutaqv C ,,, and the decrease caused
deac�va�on aqactenzenzi VCk ,, . Thus the amount of ac�ve enzyme in the con�nuous s�rred tank
reactor is described by
0,0,
,,,,,,
)(
)()(
actenztactenz
batchaqactenzenziactenzinactenzaqv
actenzaq
CC
ttVCkCCdt
dCV
(3.7)
The equa�ons 3.5 and 3.6 can be solved for the concentra�on of ac�ve enzyme
]exp[:0 ,0,, tkCCtt enziactenzactenzbatch (3.8)
aqenzi
aq
batchaqenzi
inactenz
aq
batchaqenzibatchenziactenzactenzbatch
k
ttk
C
ttktkCCtt
,
,
,
,,0,,
1
])1(exp[1
])1(exp[:
(3.9)
. Thus the amount of active enzyme in the continuous stirred tank reactor is described by
78
opera�on in actual con�nuous mode started by switching on the organic and aqueous feed pumps
and outlet pump.
The enzyme in the system is confined to the aqueous phase and is subject to deac�va�on
according to first order kine�cs [27].
actenzenzienz Ckr ,,)( deactivation (3.5)
where actenzC , denotes the ac�ve enzyme concentra�on in the aqueous phase. During the ini�al
opera�on of the reactor in batch mode the amount of ac�ve enzyme decreases according to
0,0,
,,,
)(
)0(
actenztactenz
batchactenzenziactenz
CC
ttCkdt
dC (3.6)
In the second stage, where the reactor is operated in the con�nuous stirred tank mode, the amount
of ac�ve enzyme varies in �me due to the addi�on of ac�ve enzyme with the inflowing aqueous
stream, inactenzinaqv C ,,, , the ou�low with aqueous stream, actenzoutaqv C ,,, and the decrease caused
deac�va�on aqactenzenzi VCk ,, . Thus the amount of ac�ve enzyme in the con�nuous s�rred tank
reactor is described by
0,0,
,,,,,,
)(
)()(
actenztactenz
batchaqactenzenziactenzinactenzaqv
actenzaq
CC
ttVCkCCdt
dCV
(3.7)
The equa�ons 3.5 and 3.6 can be solved for the concentra�on of ac�ve enzyme
]exp[:0 ,0,, tkCCtt enziactenzactenzbatch (3.8)
aqenzi
aq
batchaqenzi
inactenz
aq
batchaqenzibatchenziactenzactenzbatch
k
ttk
C
ttktkCCtt
,
,
,
,,0,,
1
])1(exp[1
])1(exp[:
(3.9)
(3.7)
The equations 3.5 and 3.6 can be solved for the concentration of active enzyme
78
opera�on in actual con�nuous mode started by switching on the organic and aqueous feed pumps
and outlet pump.
The enzyme in the system is confined to the aqueous phase and is subject to deac�va�on
according to first order kine�cs [27].
actenzenzienz Ckr ,,)( deactivation (3.5)
where actenzC , denotes the ac�ve enzyme concentra�on in the aqueous phase. During the ini�al
opera�on of the reactor in batch mode the amount of ac�ve enzyme decreases according to
0,0,
,,,
)(
)0(
actenztactenz
batchactenzenziactenz
CC
ttCkdt
dC (3.6)
In the second stage, where the reactor is operated in the con�nuous stirred tank mode, the amount
of ac�ve enzyme varies in �me due to the addi�on of ac�ve enzyme with the inflowing aqueous
stream, inactenzinaqv C ,,, , the ou�low with aqueous stream, actenzoutaqv C ,,, and the decrease caused
deac�va�on aqactenzenzi VCk ,, . Thus the amount of ac�ve enzyme in the con�nuous s�rred tank
reactor is described by
0,0,
,,,,,,
)(
)()(
actenztactenz
batchaqactenzenziactenzinactenzaqv
actenzaq
CC
ttVCkCCdt
dCV
(3.7)
The equa�ons 3.5 and 3.6 can be solved for the concentra�on of ac�ve enzyme
]exp[:0 ,0,, tkCCtt enziactenzactenzbatch (3.8)
aqenzi
aq
batchaqenzi
inactenz
aq
batchaqenzibatchenziactenzactenzbatch
k
ttk
C
ttktkCCtt
,
,
,
,,0,,
1
])1(exp[1
])1(exp[:
(3.9)
(3.8)
78
opera�on in actual con�nuous mode started by switching on the organic and aqueous feed pumps
and outlet pump.
The enzyme in the system is confined to the aqueous phase and is subject to deac�va�on
according to first order kine�cs [27].
actenzenzienz Ckr ,,)( deactivation (3.5)
where actenzC , denotes the ac�ve enzyme concentra�on in the aqueous phase. During the ini�al
opera�on of the reactor in batch mode the amount of ac�ve enzyme decreases according to
0,0,
,,,
)(
)0(
actenztactenz
batchactenzenziactenz
CC
ttCkdt
dC (3.6)
In the second stage, where the reactor is operated in the con�nuous stirred tank mode, the amount
of ac�ve enzyme varies in �me due to the addi�on of ac�ve enzyme with the inflowing aqueous
stream, inactenzinaqv C ,,, , the ou�low with aqueous stream, actenzoutaqv C ,,, and the decrease caused
deac�va�on aqactenzenzi VCk ,, . Thus the amount of ac�ve enzyme in the con�nuous s�rred tank
reactor is described by
0,0,
,,,,,,
)(
)()(
actenztactenz
batchaqactenzenziactenzinactenzaqv
actenzaq
CC
ttVCkCCdt
dCV
(3.7)
The equa�ons 3.5 and 3.6 can be solved for the concentra�on of ac�ve enzyme
]exp[:0 ,0,, tkCCtt enziactenzactenzbatch (3.8)
aqenzi
aq
batchaqenzi
inactenz
aq
batchaqenzibatchenziactenzactenzbatch
k
ttk
C
ttktkCCtt
,
,
,
,,0,,
1
])1(exp[1
])1(exp[:
(3.9)
(3.9)
The build-up of the product, acyl butyl ester, in the organic phase of the reactor can be described by the differential equations
79
The build-up of the product, acyl butyl ester, in the organic phase of the reactor can be described by
the differential equations
0)(
)()(
)0(
0,0,
,,,,
,
��
����
���
� orgPtorgP
batchorgPorgPin
orgPorgvorgP
org
batchorgPorgP
org
CC
ttVrCCdt
dCV
ttVrdt
dCV
� (3.10)
where again the two stages of batch and continuous operation of the reactor have to be taken into
account. Previously we established the production rate of acyl butyl ester by the enzymatic
transesterification of triglycerides with n-butanol in an aqueous-organic two-phase system based on
the Ping Pong mechanism as [27].
)1)(1(,
,
,
,
,
AI
orgA
orgS
Sm
actenzenzP
KC
CK
Ckr
��� (3.11)
where orgSC , denotes the acyl concentration in the organic phase and orgAC , the butanol
concentration also in the organic phase.
Similarly, we can write the balance for the amounts of acyl, S in the reactor
0,0,
,,,,
,
)(
)()(
)0(
orgStorgS
batchorgPorgSin
orgSorgvorgS
org
batchorgPorgS
org
CC
ttVrCCdt
dCV
ttVrdt
dCV
�
����
����
�
� (3.12)
The number of moles of butanol in the reactor, AN , is given by
aqAaqorgAorgA CVCVN ,, �� (3.13)
and its variation by
(3.10)
where again the two stages of batch and continuous operation of the reactor have to be taken into account. Previously we established the production rate of acyl butyl ester by the enzymatic transesterification of triglycerides with n- butanol in an aqueous-organic two-phase system based on the Ping Pong mech-anism as [27].
Chapter 33. Results and discussion
77
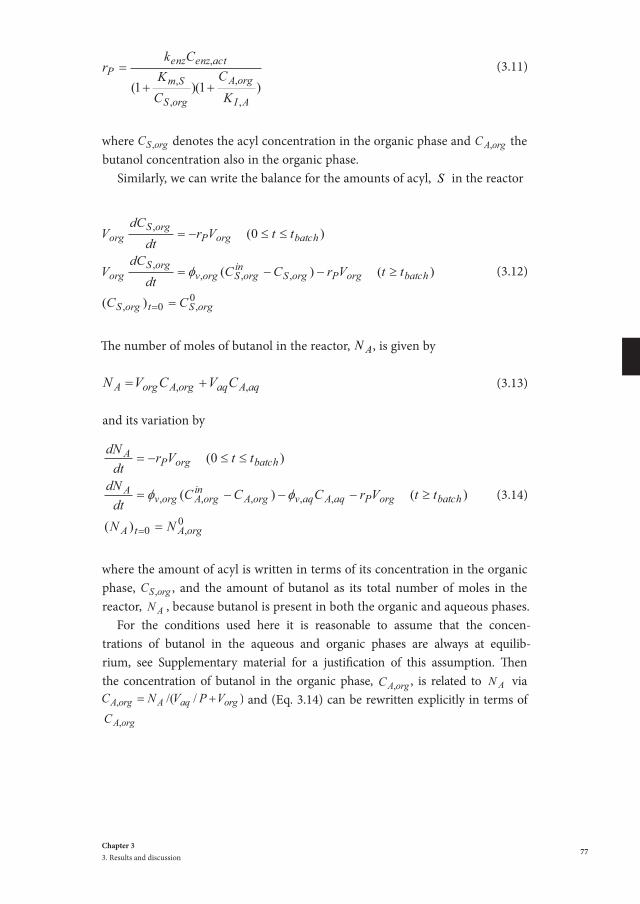
(3.11)
where
80
0,0
,,,,,
)(
)()(
)0(
orgAtA
batchorgPaqAaqvorgAinorgAorgv
A
batchorgPA
NN
ttVrCCCdtdN
ttVrdtdN
�
�����
����
�
�� (3.14)
where the amount of acyl is written in terms of its concentration in the organic phase, orgSC , , and
the amount of butanol as its total number of moles in the reactor, AN , because butanol is present in
both the organic and aqueous phases.
For the conditions used here it is reasonable to assume that the concentrations of butanol in
the aqueous and organic phases are always at equilibrium, see Supplementary material for a
justification of this assumption. Then the concentration of butanol in the organic phase, orgAC , , is
related to AN via )//(, orgaqAorgA VPVNC �� and (Eq. 3.14) can be rewritten explicitly in terms of
orgAC ,
0,0
,
,
,,,
,
)(
)(/
)/
(1
1
)0(1
orgAtA
batchaqaq
orgAP
orgvorg
orgAin
orgAv
v
orgA
batchv
vP
orgA
NN
ttVC
rV
CCPR
PRdtdC
ttPR
PRr
dtdC
�
���
�
�
��
�
���
�
��
���
��
�
�� (3.15)
where aqorgV VVR /� denotes the volume ratio of the organic and aqueous phases.
The observable is the yield of FABE which was defined as:
%100��
�SP
PCC
Cyield (3 .16)
3.2.2 Model results The parameters used for the modelling activities are provided in Table 3.3.
denotes the acyl concentration in the organic phase and
80
0,0
,,,,,
)(
)()(
)0(
orgAtA
batchorgPaqAaqvorgAinorgAorgv
A
batchorgPA
NN
ttVrCCCdtdN
ttVrdtdN
�
�����
����
�
�� (3.14)
where the amount of acyl is written in terms of its concentration in the organic phase, orgSC , , and
the amount of butanol as its total number of moles in the reactor, AN , because butanol is present in
both the organic and aqueous phases.
For the conditions used here it is reasonable to assume that the concentrations of butanol in
the aqueous and organic phases are always at equilibrium, see Supplementary material for a
justification of this assumption. Then the concentration of butanol in the organic phase, orgAC , , is
related to AN via )//(, orgaqAorgA VPVNC �� and (Eq. 3.14) can be rewritten explicitly in terms of
orgAC ,
0,0
,
,
,,,
,
)(
)(/
)/
(1
1
)0(1
orgAtA
batchaqaq
orgAP
orgvorg
orgAin
orgAv
v
orgA
batchv
vP
orgA
NN
ttVC
rV
CCPR
PRdtdC
ttPR
PRr
dtdC
�
���
�
�
��
�
���
�
��
���
��
�
�� (3.15)
where aqorgV VVR /� denotes the volume ratio of the organic and aqueous phases.
The observable is the yield of FABE which was defined as:
%100��
�SP
PCC
Cyield (3 .16)
3.2.2 Model results The parameters used for the modelling activities are provided in Table 3.3.
the butanol concentration also in the organic phase.
Similarly, we can write the balance for the amounts of acyl, S in the reactor
79
The build-up of the product, acyl butyl ester, in the organic phase of the reactor can be described by
the differential equations
0)(
)()(
)0(
0,0,
,,,,
,
��
����
���
� orgPtorgP
batchorgPorgPin
orgPorgvorgP
org
batchorgPorgP
org
CC
ttVrCCdt
dCV
ttVrdt
dCV
� (3.10)
where again the two stages of batch and continuous operation of the reactor have to be taken into
account. Previously we established the production rate of acyl butyl ester by the enzymatic
transesterification of triglycerides with n-butanol in an aqueous-organic two-phase system based on
the Ping Pong mechanism as [27].
)1)(1(,
,
,
,
,
AI
orgA
orgS
Sm
actenzenzP
KC
CK
Ckr
��� (3.11)
where orgSC , denotes the acyl concentration in the organic phase and orgAC , the butanol
concentration also in the organic phase.
Similarly, we can write the balance for the amounts of acyl, S in the reactor
0,0,
,,,,
,
)(
)()(
)0(
orgStorgS
batchorgPorgSin
orgSorgvorgS
org
batchorgPorgS
org
CC
ttVrCCdt
dCV
ttVrdt
dCV
�
����
����
�
� (3.12)
The number of moles of butanol in the reactor, AN , is given by
aqAaqorgAorgA CVCVN ,, �� (3.13)
and its variation by
(3.12)
The number of moles of butanol in the reactor, AN , is given by
79
The build-up of the product, acyl butyl ester, in the organic phase of the reactor can be described by
the differential equations
0)(
)()(
)0(
0,0,
,,,,
,
��
����
���
� orgPtorgP
batchorgPorgPin
orgPorgvorgP
org
batchorgPorgP
org
CC
ttVrCCdt
dCV
ttVrdt
dCV
� (3.10)
where again the two stages of batch and continuous operation of the reactor have to be taken into
account. Previously we established the production rate of acyl butyl ester by the enzymatic
transesterification of triglycerides with n-butanol in an aqueous-organic two-phase system based on
the Ping Pong mechanism as [27].
)1)(1(,
,
,
,
,
AI
orgA
orgS
Sm
actenzenzP
KC
CK
Ckr
��� (3.11)
where orgSC , denotes the acyl concentration in the organic phase and orgAC , the butanol
concentration also in the organic phase.
Similarly, we can write the balance for the amounts of acyl, S in the reactor
0,0,
,,,,
,
)(
)()(
)0(
orgStorgS
batchorgPorgSin
orgSorgvorgS
org
batchorgPorgS
org
CC
ttVrCCdt
dCV
ttVrdt
dCV
�
����
����
�
� (3.12)
The number of moles of butanol in the reactor, AN , is given by
aqAaqorgAorgA CVCVN ,, �� (3.13)
and its variation by
(3.13)
and its variation by
80
0,0
,,,,,
)(
)()(
)0(
orgAtA
batchorgPaqAaqvorgAinorgAorgv
A
batchorgPA
NN
ttVrCCCdtdN
ttVrdtdN
�
�����
����
�
�� (3.14)
where the amount of acyl is written in terms of its concentration in the organic phase, orgSC , , and
the amount of butanol as its total number of moles in the reactor, AN , because butanol is present in
both the organic and aqueous phases.
For the conditions used here it is reasonable to assume that the concentrations of butanol in
the aqueous and organic phases are always at equilibrium, see Supplementary material for a
justification of this assumption. Then the concentration of butanol in the organic phase, orgAC , , is
related to AN via )//(, orgaqAorgA VPVNC �� and (Eq. 3.14) can be rewritten explicitly in terms of
orgAC ,
0,0
,
,
,,,
,
)(
)(/
)/
(1
1
)0(1
orgAtA
batchaqaq
orgAP
orgvorg
orgAin
orgAv
v
orgA
batchv
vP
orgA
NN
ttVC
rV
CCPR
PRdtdC
ttPR
PRr
dtdC
�
���
�
�
��
�
���
�
��
���
��
�
�� (3.15)
where aqorgV VVR /� denotes the volume ratio of the organic and aqueous phases.
The observable is the yield of FABE which was defined as:
%100��
�SP
PCC
Cyield (3 .16)
3.2.2 Model results The parameters used for the modelling activities are provided in Table 3.3.
(3.14)
where the amount of acyl is written in terms of its concentration in the organic phase,
80
0,0
,,,,,
)(
)()(
)0(
orgAtA
batchorgPaqAaqvorgAinorgAorgv
A
batchorgPA
NN
ttVrCCCdtdN
ttVrdtdN
�
�����
����
�
�� (3.14)
where the amount of acyl is written in terms of its concentration in the organic phase, orgSC , , and
the amount of butanol as its total number of moles in the reactor, AN , because butanol is present in
both the organic and aqueous phases.
For the conditions used here it is reasonable to assume that the concentrations of butanol in
the aqueous and organic phases are always at equilibrium, see Supplementary material for a
justification of this assumption. Then the concentration of butanol in the organic phase, orgAC , , is
related to AN via )//(, orgaqAorgA VPVNC �� and (Eq. 3.14) can be rewritten explicitly in terms of
orgAC ,
0,0
,
,
,,,
,
)(
)(/
)/
(1
1
)0(1
orgAtA
batchaqaq
orgAP
orgvorg
orgAin
orgAv
v
orgA
batchv
vP
orgA
NN
ttVC
rV
CCPR
PRdtdC
ttPR
PRr
dtdC
�
���
�
�
��
�
���
�
��
���
��
�
�� (3.15)
where aqorgV VVR /� denotes the volume ratio of the organic and aqueous phases.
The observable is the yield of FABE which was defined as:
%100��
�SP
PCC
Cyield (3 .16)
3.2.2 Model results The parameters used for the modelling activities are provided in Table 3.3.
, and the amount of butanol as its total number of moles in the reactor,
80
0,0
,,,,,
)(
)()(
)0(
orgAtA
batchorgPaqAaqvorgAinorgAorgv
A
batchorgPA
NN
ttVrCCCdtdN
ttVrdtdN
�
�����
����
�
�� (3.14)
where the amount of acyl is written in terms of its concentration in the organic phase, orgSC , , and
the amount of butanol as its total number of moles in the reactor, AN , because butanol is present in
both the organic and aqueous phases.
For the conditions used here it is reasonable to assume that the concentrations of butanol in
the aqueous and organic phases are always at equilibrium, see Supplementary material for a
justification of this assumption. Then the concentration of butanol in the organic phase, orgAC , , is
related to AN via )//(, orgaqAorgA VPVNC �� and (Eq. 3.14) can be rewritten explicitly in terms of
orgAC ,
0,0
,
,
,,,
,
)(
)(/
)/
(1
1
)0(1
orgAtA
batchaqaq
orgAP
orgvorg
orgAin
orgAv
v
orgA
batchv
vP
orgA
NN
ttVC
rV
CCPR
PRdtdC
ttPR
PRr
dtdC
�
���
�
�
��
�
���
�
��
���
��
�
�� (3.15)
where aqorgV VVR /� denotes the volume ratio of the organic and aqueous phases.
The observable is the yield of FABE which was defined as:
%100��
�SP
PCC
Cyield (3 .16)
3.2.2 Model results The parameters used for the modelling activities are provided in Table 3.3.
, because butanol is present in both the organic and aqueous phases. For the conditions used here it is reasonable to assume that the concen-
trations of butanol in the aqueous and organic phases are always at equilib-rium, see Supplementary material for a justification of this assumption. Then the concentration of butanol in the organic phase,
80
0,0
,,,,,
)(
)()(
)0(
orgAtA
batchorgPaqAaqvorgAinorgAorgv
A
batchorgPA
NN
ttVrCCCdtdN
ttVrdtdN
�
�����
����
�
�� (3.14)
where the amount of acyl is written in terms of its concentration in the organic phase, orgSC , , and
the amount of butanol as its total number of moles in the reactor, AN , because butanol is present in
both the organic and aqueous phases.
For the conditions used here it is reasonable to assume that the concentrations of butanol in
the aqueous and organic phases are always at equilibrium, see Supplementary material for a
justification of this assumption. Then the concentration of butanol in the organic phase, orgAC , , is
related to AN via )//(, orgaqAorgA VPVNC �� and (Eq. 3.14) can be rewritten explicitly in terms of
orgAC ,
0,0
,
,
,,,
,
)(
)(/
)/
(1
1
)0(1
orgAtA
batchaqaq
orgAP
orgvorg
orgAin
orgAv
v
orgA
batchv
vP
orgA
NN
ttVC
rV
CCPR
PRdtdC
ttPR
PRr
dtdC
�
���
�
�
��
�
���
�
��
���
��
�
�� (3.15)
where aqorgV VVR /� denotes the volume ratio of the organic and aqueous phases.
The observable is the yield of FABE which was defined as:
%100��
�SP
PCC
Cyield (3 .16)
3.2.2 Model results The parameters used for the modelling activities are provided in Table 3.3.
, is related to
80
0,0
,,,,,
)(
)()(
)0(
orgAtA
batchorgPaqAaqvorgAinorgAorgv
A
batchorgPA
NN
ttVrCCCdtdN
ttVrdtdN
�
�����
����
�
�� (3.14)
where the amount of acyl is written in terms of its concentration in the organic phase, orgSC , , and
the amount of butanol as its total number of moles in the reactor, AN , because butanol is present in
both the organic and aqueous phases.
For the conditions used here it is reasonable to assume that the concentrations of butanol in
the aqueous and organic phases are always at equilibrium, see Supplementary material for a
justification of this assumption. Then the concentration of butanol in the organic phase, orgAC , , is
related to AN via )//(, orgaqAorgA VPVNC �� and (Eq. 3.14) can be rewritten explicitly in terms of
orgAC ,
0,0
,
,
,,,
,
)(
)(/
)/
(1
1
)0(1
orgAtA
batchaqaq
orgAP
orgvorg
orgAin
orgAv
v
orgA
batchv
vP
orgA
NN
ttVC
rV
CCPR
PRdtdC
ttPR
PRr
dtdC
�
���
�
�
��
�
���
�
��
���
��
�
�� (3.15)
where aqorgV VVR /� denotes the volume ratio of the organic and aqueous phases.
The observable is the yield of FABE which was defined as:
%100��
�SP
PCC
Cyield (3 .16)
3.2.2 Model results The parameters used for the modelling activities are provided in Table 3.3.
via
80
0,0
,,,,,
)(
)()(
)0(
orgAtA
batchorgPaqAaqvorgAinorgAorgv
A
batchorgPA
NN
ttVrCCCdtdN
ttVrdtdN
�
�����
����
�
�� (3.14)
where the amount of acyl is written in terms of its concentration in the organic phase, orgSC , , and
the amount of butanol as its total number of moles in the reactor, AN , because butanol is present in
both the organic and aqueous phases.
For the conditions used here it is reasonable to assume that the concentrations of butanol in
the aqueous and organic phases are always at equilibrium, see Supplementary material for a
justification of this assumption. Then the concentration of butanol in the organic phase, orgAC , , is
related to AN via )//(, orgaqAorgA VPVNC �� and (Eq. 3.14) can be rewritten explicitly in terms of
orgAC ,
0,0
,
,
,,,
,
)(
)(/
)/
(1
1
)0(1
orgAtA
batchaqaq
orgAP
orgvorg
orgAin
orgAv
v
orgA
batchv
vP
orgA
NN
ttVC
rV
CCPR
PRdtdC
ttPR
PRr
dtdC
�
���
�
�
��
�
���
�
��
���
��
�
�� (3.15)
where aqorgV VVR /� denotes the volume ratio of the organic and aqueous phases.
The observable is the yield of FABE which was defined as:
%100��
�SP
PCC
Cyield (3 .16)
3.2.2 Model results The parameters used for the modelling activities are provided in Table 3.3.
and (Eq. 3.14) can be rewritten explicitly in terms of
80
0,0
,,,,,
)(
)()(
)0(
orgAtA
batchorgPaqAaqvorgAinorgAorgv
A
batchorgPA
NN
ttVrCCCdtdN
ttVrdtdN
�
�����
����
�
�� (3.14)
where the amount of acyl is written in terms of its concentration in the organic phase, orgSC , , and
the amount of butanol as its total number of moles in the reactor, AN , because butanol is present in
both the organic and aqueous phases.
For the conditions used here it is reasonable to assume that the concentrations of butanol in
the aqueous and organic phases are always at equilibrium, see Supplementary material for a
justification of this assumption. Then the concentration of butanol in the organic phase, orgAC , , is
related to AN via )//(, orgaqAorgA VPVNC �� and (Eq. 3.14) can be rewritten explicitly in terms of
orgAC ,
0,0
,
,
,,,
,
)(
)(/
)/
(1
1
)0(1
orgAtA
batchaqaq
orgAP
orgvorg
orgAin
orgAv
v
orgA
batchv
vP
orgA
NN
ttVC
rV
CCPR
PRdtdC
ttPR
PRr
dtdC
�
���
�
�
��
�
���
�
��
���
��
�
�� (3.15)
where aqorgV VVR /� denotes the volume ratio of the organic and aqueous phases.
The observable is the yield of FABE which was defined as:
%100��
�SP
PCC
Cyield (3 .16)
3.2.2 Model results The parameters used for the modelling activities are provided in Table 3.3.
79
The build-up of the product, acyl butyl ester, in the organic phase of the reactor can be described by
the differential equations
0)(
)()(
)0(
0,0,
,,,,
,
��
����
���
� orgPtorgP
batchorgPorgPin
orgPorgvorgP
org
batchorgPorgP
org
CC
ttVrCCdt
dCV
ttVrdt
dCV
� (3.10)
where again the two stages of batch and continuous operation of the reactor have to be taken into
account. Previously we established the production rate of acyl butyl ester by the enzymatic
transesterification of triglycerides with n-butanol in an aqueous-organic two-phase system based on
the Ping Pong mechanism as [27].
)1)(1(,
,
,
,
,
AI
orgA
orgS
Sm
actenzenzP
KC
CK
Ckr
��� (3.11)
where orgSC , denotes the acyl concentration in the organic phase and orgAC , the butanol
concentration also in the organic phase.
Similarly, we can write the balance for the amounts of acyl, S in the reactor
0,0,
,,,,
,
)(
)()(
)0(
orgStorgS
batchorgPorgSin
orgSorgvorgS
org
batchorgPorgS
org
CC
ttVrCCdt
dCV
ttVrdt
dCV
�
����
����
�
� (3.12)
The number of moles of butanol in the reactor, AN , is given by
aqAaqorgAorgA CVCVN ,, �� (3.13)
and its variation by

Chapter 3Continuous fatty acid butyl ester synthesis using a Rhizomucor miehei lipase
78
(3.15)
where
80
0,0
,,,,,
)(
)()(
)0(
orgAtA
batchorgPaqAaqvorgAinorgAorgv
A
batchorgPA
NN
ttVrCCCdtdN
ttVrdtdN
�
�����
����
�
�� (3.14)
where the amount of acyl is written in terms of its concentration in the organic phase, orgSC , , and
the amount of butanol as its total number of moles in the reactor, AN , because butanol is present in
both the organic and aqueous phases.
For the conditions used here it is reasonable to assume that the concentrations of butanol in
the aqueous and organic phases are always at equilibrium, see Supplementary material for a
justification of this assumption. Then the concentration of butanol in the organic phase, orgAC , , is
related to AN via )//(, orgaqAorgA VPVNC �� and (Eq. 3.14) can be rewritten explicitly in terms of
orgAC ,
0,0
,
,
,,,
,
)(
)(/
)/
(1
1
)0(1
orgAtA
batchaqaq
orgAP
orgvorg
orgAin
orgAv
v
orgA
batchv
vP
orgA
NN
ttVC
rV
CCPR
PRdtdC
ttPR
PRr
dtdC
�
���
�
�
��
�
���
�
��
���
��
�
�� (3.15)
where aqorgV VVR /� denotes the volume ratio of the organic and aqueous phases.
The observable is the yield of FABE which was defined as:
%100��
�SP
PCC
Cyield (3 .16)
3.2.2 Model results The parameters used for the modelling activities are provided in Table 3.3.
denotes the volume ratio of the organic and aqueous phases. The observable is the yield of FABE which was defined as:
80
0,0
,,,,,
)(
)()(
)0(
orgAtA
batchorgPaqAaqvorgAinorgAorgv
A
batchorgPA
NN
ttVrCCCdtdN
ttVrdtdN
�
�����
����
�
�� (3.14)
where the amount of acyl is written in terms of its concentration in the organic phase, orgSC , , and
the amount of butanol as its total number of moles in the reactor, AN , because butanol is present in
both the organic and aqueous phases.
For the conditions used here it is reasonable to assume that the concentrations of butanol in
the aqueous and organic phases are always at equilibrium, see Supplementary material for a
justification of this assumption. Then the concentration of butanol in the organic phase, orgAC , , is
related to AN via )//(, orgaqAorgA VPVNC �� and (Eq. 3.14) can be rewritten explicitly in terms of
orgAC ,
0,0
,
,
,,,
,
)(
)(/
)/
(1
1
)0(1
orgAtA
batchaqaq
orgAP
orgvorg
orgAin
orgAv
v
orgA
batchv
vP
orgA
NN
ttVC
rV
CCPR
PRdtdC
ttPR
PRr
dtdC
�
���
�
�
��
�
���
�
��
���
��
�
�� (3.15)
where aqorgV VVR /� denotes the volume ratio of the organic and aqueous phases.
The observable is the yield of FABE which was defined as:
%100��
�SP
PCC
Cyield (3 .16)
3.2.2 Model results The parameters used for the modelling activities are provided in Table 3.3.
(3.16)
3.2.2 Model results
The parameters used for the modelling activities are provided in Table 3.3.The modelled concentration profiles of the substrates and the products as
well as the enzyme concentration versus the time for an experiment in the CSTR with a residence time of 60 min and an inlet enzyme concentration of 20 gr.L-1 is given in Figure 3.9. Clearly, the non-stationary behaviour at the start-up of the reactor in batch mode is visible. Of interest is the modelled steady state
80
0,0
,,,,,
)(
)()(
)0(
orgAtA
batchorgPaqAaqvorgAinorgAorgv
A
batchorgPA
NN
ttVrCCCdtdN
ttVrdtdN
�
�����
����
�
�� (3.14)
where the amount of acyl is written in terms of its concentration in the organic phase, orgSC , , and
the amount of butanol as its total number of moles in the reactor, AN , because butanol is present in
both the organic and aqueous phases.
For the conditions used here it is reasonable to assume that the concentrations of butanol in
the aqueous and organic phases are always at equilibrium, see Supplementary material for a
justification of this assumption. Then the concentration of butanol in the organic phase, orgAC , , is
related to AN via )//(, orgaqAorgA VPVNC �� and (Eq. 3.14) can be rewritten explicitly in terms of
orgAC ,
0,0
,
,
,,,
,
)(
)(/
)/
(1
1
)0(1
orgAtA
batchaqaq
orgAP
orgvorg
orgAin
orgAv
v
orgA
batchv
vP
orgA
NN
ttVC
rV
CCPR
PRdtdC
ttPR
PRr
dtdC
�
���
�
�
��
�
���
�
��
���
��
�
�� (3.15)
where aqorgV VVR /� denotes the volume ratio of the organic and aqueous phases.
The observable is the yield of FABE which was defined as:
%100��
�SP
PCC
Cyield (3 .16)
3.2.2 Model results The parameters used for the modelling activities are provided in Table 3.3.
Table 3.3. Parameters of modelling activities
Parameters ValueExperimental conditions
Vorg 0.15 L
Vaq 0.05 L
CC,org[g/L] 40 grLorg-1
Kinetic parameters
kenz 0.794 × 10⁻³
ki,enz 0.007
Km,S 0.335 mol.Lorg-1
KI,A 0.0715 mol.Lorg-1
Physical properties
P 0.6
MA = Mbutanol 74.1 gr.mol-1
MS = Moil 885 gr.mol-1
81
Table 3.3. Parameters of modelling activities
Parameters Value
Experimental conditions
����� 0.15 L
��� 0.05 L
������������� 40 grLorg
-1
Kinetic parameters
���� 0.794 x 10⁻³ ��� �������� ��� �
���
������ 0.007 �
� �� 0.335 mol.Lorg-1
���� 0.0715 mol.Lorg-1
Physical properties P
0.6 � ���� ������ ��� ���� � �
�����������
������� ���
�� � ��������� 74.1 gr.mol-1
�� � ����� 885 gr.mol-1
The modelled concentration profiles of the substrates and the products as well as the
enzyme concentration versus the time for an experiment in the CSTR with a residence time of 60 min
and an inlet enzyme concentration of 20 gr.L-1 is given in Figure 3.9. Clearly, the non-stationary
behaviour at the start-up of the reactor in batch mode is visible. Of interest is the modelled steady
state concentration of the enzyme, which is about 16.5 gr.L-1, due to enzyme deactivation; this value
is lower than the inlet enzyme concentration (20 gr.L-1).
Figure 3.9. Concentrations calculated with τ = 60 min and ����� = 20 gr.L-1
⁰

Chapter 33. Results and discussion
79
concentration of the enzyme, which is about 16.5 gr.L-1, due to enzyme deacti-vation; this value is lower than the inlet enzyme concentration (20 gr.L-1).
The modelled FABE yields in the steady state versus the enzyme concentra-tion for various experiments at different residence times are given in Figure 3.10.
The model lines predict that the FABE is a function of the enzyme concen-tration, with higher concentrations leading to higher FABE yields. In addition, it also clearly shows that, as expected, the residence time is of importance and
-20 0 20 40 60 80 100 120 140 160 180
time [min]
0
0.05
0.1
0.15
0.2
0.25
conc
entra
tion
[mol
/L]
15
16
17
18
19
20
activ
e en
zym
e co
ncen
tratio
n [g
/L]
BuOH (aq)
BuOH (org)
acyl
ester
Figure 3.9. Concentrations calculated with τ = 60 min and = 20 gr.L-1
0 50 100 150 200 250
enzyme concentration [g/L]
0
10
20
30
40
50
60
70
80
90
100
FABE
yie
ld [%
]
90 min
60 min
30 min
Figure 3.10. Modelling results parameters given in Table 3.3. Symbols: experimental data.

Chapter 3Continuous fatty acid butyl ester synthesis using a Rhizomucor miehei lipase
80
highest FABE yields are attained at the highest residence times, However, the effect of changing the residence times from 60 to 90 min is by far less than when going from 30 to 60 min, particularly when considering intermediate enzyme concentrations (50-150 gr.L-1).
The experimental data points are also given in Figure 3.10. Clearly, the fit be-tween model and experiments at low enzyme concentrations is reasonably good whereas the deviation between experiment and model is considerable at the highest enzyme concentration. In addition, the model predicts a steady increase in the FABE yield versus enzyme concentration whereas the experimental point at higher enzyme concentrations (τ of 60 min) shows a reduction. The latter may be explained by considering that the kinetic model has only been derived for enzyme concentrations below 200 gr.L-1.
Possible explanations for the deviation between the model and experimental data points are related to the actual enzyme concentration in the CSTR reac-tor. It is well possible that the shear forces in this device are higher than for the set-up used to determine the enzyme kinetics and these are known to af-fect the deactivation rate of the enzyme. In addition, the formation of a small amount of a third layer between the glycerol and ester layer was observed ex-perimentally which may be enriched in enzymes due to agglomeration [31,32]. Both effects will lead to an effective reduction of the enzyme concentration in the CSTR, leading to reduced FABE yields. To gain some insights in the im-portance of these effects, the effect of higher levels of enzyme deactivation and effective removal of the enzyme to a third phase were modelled using the fol-lowing equations:
83
amount of a third layer between the glycerol and ester layer was observed experimentally which
may be enriched in enzymes due to agglomeration [31,32]. Both effects will lead to an effective
reduction of the enzyme concentration in the CSTR, leading to reduced FABE yields. To gain some
insights in the importance of these effects, the effect of higher levels of enzyme deactivation and
effective removal of the enzyme to a third phase were modelled using the following equations:
1,,, Fkk enzioptimizedenzi �� (3.16)
20,
0,, FCC actenzoptimizedactenz �� (3.17)
The experimental point with an enzyme concentration of 250 gr.L-1 is neglected in the
optimization. However the number of data points proved to be insufficient to obtain reliable values
for the parameters Fn (n= 1,2). The result for a manual optimization is given in Figure 3.11. As such, it
seems that the experimental data can be modelled using a 3 time higher value for the kinetic
constant of enzyme deactivation and by halving the amount of enzyme due to the formation of a
third layer with inactive enzyme.
Figure 3.11. Results for manual optimization of kinetic constants (dashed lines). Symbols:
experimental data, solid lines: modelling results.
(3.17)
83
amount of a third layer between the glycerol and ester layer was observed experimentally which
may be enriched in enzymes due to agglomeration [31,32]. Both effects will lead to an effective
reduction of the enzyme concentration in the CSTR, leading to reduced FABE yields. To gain some
insights in the importance of these effects, the effect of higher levels of enzyme deactivation and
effective removal of the enzyme to a third phase were modelled using the following equations:
1,,, Fkk enzioptimizedenzi �� (3.16)
20,
0,, FCC actenzoptimizedactenz �� (3.17)
The experimental point with an enzyme concentration of 250 gr.L-1 is neglected in the
optimization. However the number of data points proved to be insufficient to obtain reliable values
for the parameters Fn (n= 1,2). The result for a manual optimization is given in Figure 3.11. As such, it
seems that the experimental data can be modelled using a 3 time higher value for the kinetic
constant of enzyme deactivation and by halving the amount of enzyme due to the formation of a
third layer with inactive enzyme.
Figure 3.11. Results for manual optimization of kinetic constants (dashed lines). Symbols:
experimental data, solid lines: modelling results.
(3.18)
The experimental point with an enzyme concentration of 250 gr.L-1 is ne-glected in the optimization. However the number of data points proved to be insufficient to obtain reliable values for the parameters Fn (n = 1,2). The result for a manual optimization is given in Figure 3.11. As such, it seems that the experimental data can be modelled using a 3 time higher value for the kinetic constant of enzyme deactivation and by halving the amount of enzyme due to the formation of a third layer with inactive enzyme.

Chapter 33. Results and discussion
81
3.3. Enzymatic biodiesel production using a cascade of a continuously stirred tank reactor and a CCCS
3.3.1. Phase separation optimization in the CCCS
Before performing actual enzymatic reactions in the CCCS device, the phase separation performance for the organic and aqueous phase outlets was inves-tigated. This is a critical performance indicator, as it is essential to have good separation between the two outlet liquid streams. Phase separation optimisation experiments were carried out using a representative reaction product of exper-iments carried out in the stirred tank reactor containing glycerides, fatty acids, butyl ester and 1-butanol in hexane (organic phase), and enzyme, glycerol and 1-butanol in water (aqueous phase). The inlet flow rate of the CCCS feed was set at 3.3 mL.min-1. Separation performance is a strong function of the size of certain rings in the top of the CCCS device (weir size). When using a weir size of 23.49 mm; as suggested by the supplier based on amongst others density dif-ferences between the two phases to be separated, separation performance was not on par. A small amount of aqueous phase was present in light phase output, while significant amount of the organic phase were found in the heavy phase output (Table 3.4). Optimisation of the weir size revealed that good separation performance was obtained with a size of 27.94 mm, though quantitative separa-tion is not possible, possibly due to the presence of the enzyme at the interface, affecting surface related properties (e.g. surface tension).
0 50 100 150 200 250
enzyme concentration [g/L]
0
10
20
30
40
50
60
70
80
90
100
FABE
yie
ld [%
]
kenz*1.00 ...kienz*3.00 ...Cenz*0.50
90 min
60 min
Figure 3.11. Results for manual optimization of kinetic constants (dashed lines). Symbols: experi-mental data, solid lines: modelling results.
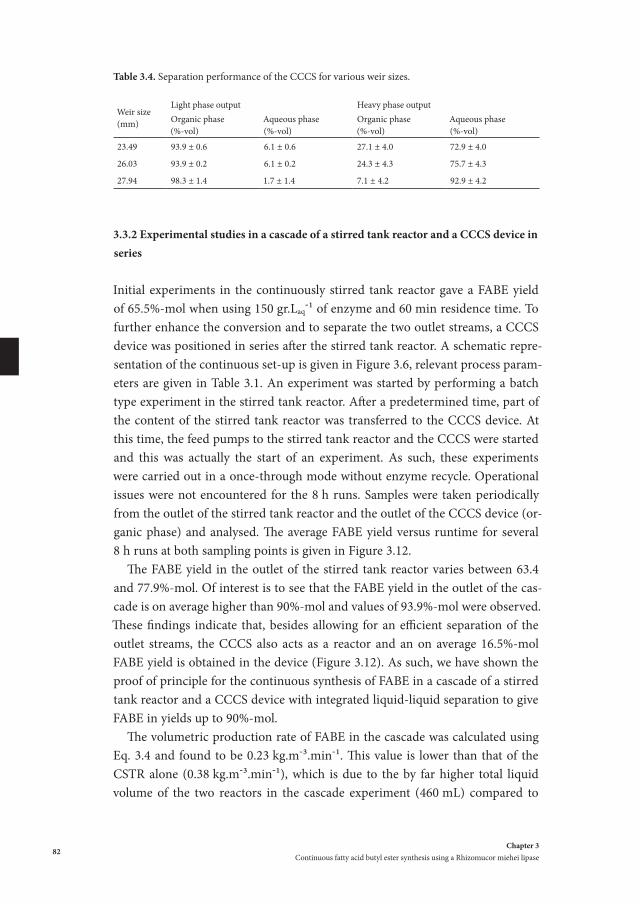
Chapter 3Continuous fatty acid butyl ester synthesis using a Rhizomucor miehei lipase
82
Table 3.4. Separation performance of the CCCS for various weir sizes.
Weir size(mm)
Light phase output Heavy phase outputOrganic phase (%-vol)
Aqueous phase (%-vol)
Organic phase (%-vol)
Aqueous phase (%-vol)
23.49 93.9 ± 0.6 6.1 ± 0.6 27.1 ± 4.0 72.9 ± 4.0
26.03 93.9 ± 0.2 6.1 ± 0.2 24.3 ± 4.3 75.7 ± 4.3
27.94 98.3 ± 1.4 1.7 ± 1.4 7.1 ± 4.2 92.9 ± 4.2
3.3.2 Experimental studies in a cascade of a stirred tank reactor and a CCCS device in series
Initial experiments in the continuously stirred tank reactor gave a FABE yield of 65.5%-mol when using 150 gr.Laq-1 of enzyme and 60 min residence time. To further enhance the conversion and to separate the two outlet streams, a CCCS device was positioned in series after the stirred tank reactor. A schematic repre-sentation of the continuous set-up is given in Figure 3.6, relevant process param-eters are given in Table 3.1. An experiment was started by performing a batch type experiment in the stirred tank reactor. After a predetermined time, part of the content of the stirred tank reactor was transferred to the CCCS device. At this time, the feed pumps to the stirred tank reactor and the CCCS were started and this was actually the start of an experiment. As such, these experiments were carried out in a once-through mode without enzyme recycle. Operational issues were not encountered for the 8 h runs. Samples were taken periodically from the outlet of the stirred tank reactor and the outlet of the CCCS device (or-ganic phase) and analysed. The average FABE yield versus runtime for several 8 h runs at both sampling points is given in Figure 3.12.
The FABE yield in the outlet of the stirred tank reactor varies between 63.4 and 77.9%-mol. Of interest is to see that the FABE yield in the outlet of the cas-cade is on average higher than 90%-mol and values of 93.9%-mol were observed. These findings indicate that, besides allowing for an efficient separation of the outlet streams, the CCCS also acts as a reactor and an on average 16.5%-mol FABE yield is obtained in the device (Figure 3.12). As such, we have shown the proof of principle for the continuous synthesis of FABE in a cascade of a stirred tank reactor and a CCCS device with integrated liquid-liquid separation to give FABE in yields up to 90%-mol.
The volumetric production rate of FABE in the cascade was calculated using Eq. 3.4 and found to be 0.23 kg.m-3.min-1. This value is lower than that of the CSTR alone (0.38 kg.m-3.min-1), which is due to the by far higher total liquid volume of the two reactors in the cascade experiment (460 mL) compared to

Chapter 33. Results and discussion
83
that of the CSTR alone (200 mL). The volumetric production rate is much lower than the one reported by Kraai et al. for a base catalysed biodiesel synthesis re-action [24], which was 61 kg.m-3.min-1 using a standalone CCCS device. These differences are due to the by far lower intrinsic reaction rates of enzymes com-pared to base catalysts for biodiesel synthesis [33].
3.3. Effect of enzyme recycle on product yield
Recycle of the homogeneous enzyme is of high importance to reduce the cost of enzymatic biodiesel production [20]. The concept using a biphasic liquid-liq-uid systems with the enzyme having a preference for the water phase allows in theory for efficient enzyme recycle (Figure 3.3). The effect of enzyme recycle was experimentally investigated by reintroducing the aqueous phase outlet of the CCCS device back to the continuously stirred tank reactor. The experiment was started by performing a reaction for 3 h in the cascade at similar condi-tions as the cascade experiment discussed above (Table 3.2). During this pe-riod, the aqueous stream from the CCCS outlet containing the enzyme was collected. Subsequently, this enzyme containing recycle stream was reintro-duced into the stirred tank reactor and the feeding of fresh enzyme was ceased (Figure 3.6). After enzyme recycle was started, the experiment was run for an-other 9 h. Samples to determine the product yield were taken from CSTR out-let/CCCS inlet (sampling point 1, Figure 3.6) and from the CCCS light phase
Figure 3.12. FABE yield for a cascade experiment using a continuous stirred tank reactor coupled with the CCCS: () outlet of stirred tank reactor () yield of CCCS output.
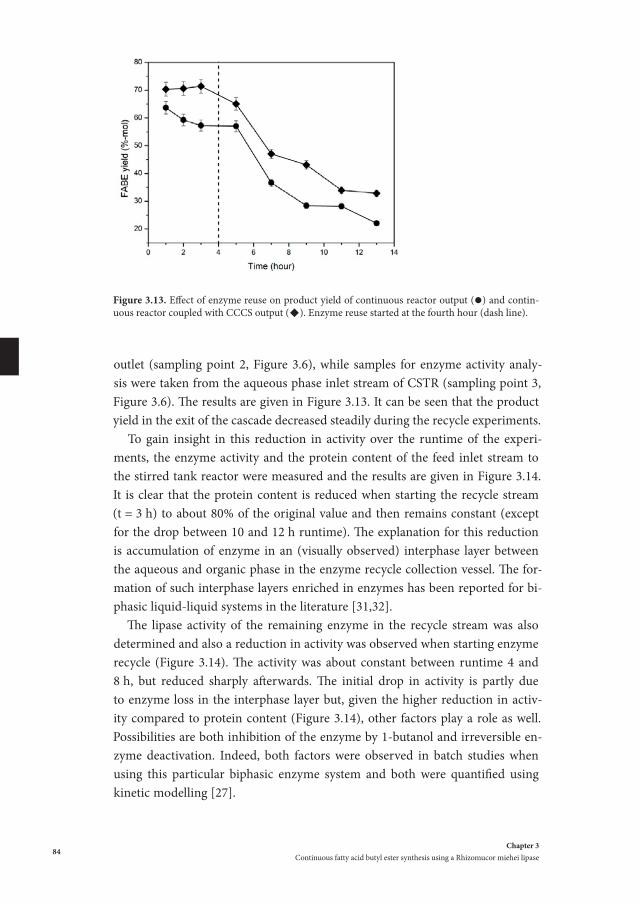
Chapter 3Continuous fatty acid butyl ester synthesis using a Rhizomucor miehei lipase
84
outlet (sampling point 2, Figure 3.6), while samples for enzyme activity analy-sis were taken from the aqueous phase inlet stream of CSTR (sampling point 3, Figure 3.6). The results are given in Figure 3.13. It can be seen that the product yield in the exit of the cascade decreased steadily during the recycle experiments.
To gain insight in this reduction in activity over the runtime of the experi-ments, the enzyme activity and the protein content of the feed inlet stream to the stirred tank reactor were measured and the results are given in Figure 3.14. It is clear that the protein content is reduced when starting the recycle stream (t = 3 h) to about 80% of the original value and then remains constant (except for the drop between 10 and 12 h runtime). The explanation for this reduction is accumulation of enzyme in an (visually observed) interphase layer between the aqueous and organic phase in the enzyme recycle collection vessel. The for-mation of such interphase layers enriched in enzymes has been reported for bi-phasic liquid-liquid systems in the literature [31,32].
The lipase activity of the remaining enzyme in the recycle stream was also determined and also a reduction in activity was observed when starting enzyme recycle (Figure 3.14). The activity was about constant between runtime 4 and 8 h, but reduced sharply afterwards. The initial drop in activity is partly due to enzyme loss in the interphase layer but, given the higher reduction in activ-ity compared to protein content (Figure 3.14), other factors play a role as well. Possibilities are both inhibition of the enzyme by 1-butanol and irreversible en-zyme deactivation. Indeed, both factors were observed in batch studies when using this particular biphasic enzyme system and both were quantified using kinetic modelling [27].
Figure 3.13. Effect of enzyme reuse on product yield of continuous reactor output () and contin-uous reactor coupled with CCCS output (). Enzyme reuse started at the fourth hour (dash line).
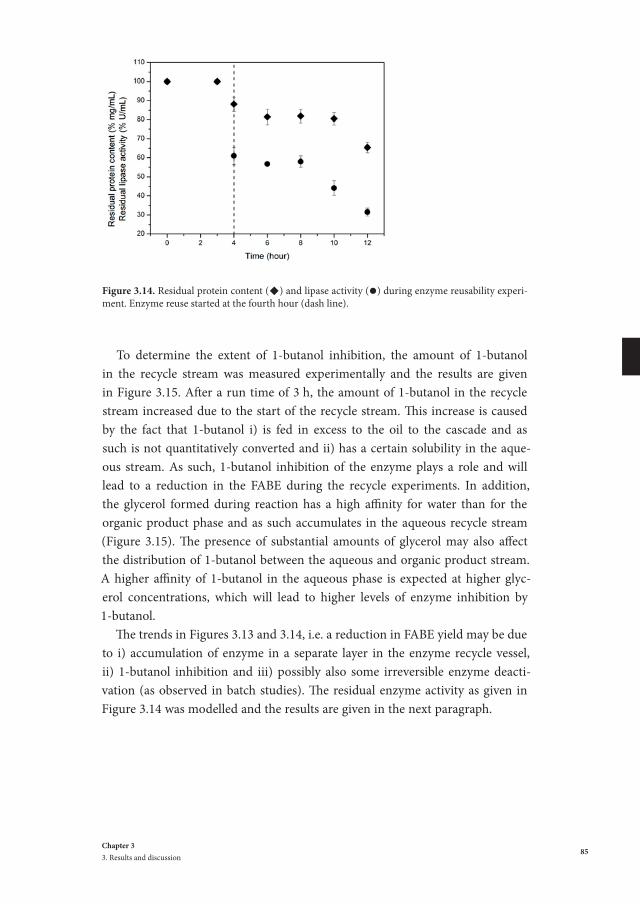
Chapter 33. Results and discussion
85
To determine the extent of 1-butanol inhibition, the amount of 1-butanol in the recycle stream was measured experimentally and the results are given in Figure 3.15. After a run time of 3 h, the amount of 1-butanol in the recycle stream increased due to the start of the recycle stream. This increase is caused by the fact that 1-butanol i) is fed in excess to the oil to the cascade and as such is not quantitatively converted and ii) has a certain solubility in the aque-ous stream. As such, 1-butanol inhibition of the enzyme plays a role and will lead to a reduction in the FABE during the recycle experiments. In addition, the glycerol formed during reaction has a high affinity for water than for the organic product phase and as such accumulates in the aqueous recycle stream (Figure 3.15). The presence of substantial amounts of glycerol may also affect the distribution of 1-butanol between the aqueous and organic product stream. A higher affinity of 1-butanol in the aqueous phase is expected at higher glyc-erol concentrations, which will lead to higher levels of enzyme inhibition by 1-butanol.
The trends in Figures 3.13 and 3.14, i.e. a reduction in FABE yield may be due to i) accumulation of enzyme in a separate layer in the enzyme recycle vessel, ii) 1-butanol inhibition and iii) possibly also some irreversible enzyme deacti-vation (as observed in batch studies). The residual enzyme activity as given in Figure 3.14 was modelled and the results are given in the next paragraph.
Figure 3.14. Residual protein content () and lipase activity () during enzyme reusability experi-ment. Enzyme reuse started at the fourth hour (dash line).

Chapter 3Continuous fatty acid butyl ester synthesis using a Rhizomucor miehei lipase
86
3.4 Modelling of the enzyme activity for the cascade experiment with enzyme recycle
A model was developed for the concentration of active enzyme in the system for the experiment where the effects of enzyme recycling on the product yield were studied. The enzyme is again assumed to deactivate according to first order ki-netics as shown in Eq. 3.5. These experiments are characterized by 4 consecutive stages concerning the way the reactors are operated.
In the first stage the stirred tank reactor (STR) is filled with the two-phase reaction mixture, and operated in batch mode over the time interval of
batchtt ≤≤0 . The amount of active enzyme decreases according the first order rate law:
89
In the first stage the stirred tank reactor (STR) is filled with the two-phase reaction mixture,
and operated in batch mode over the time interval of batchtt ��0 . The amount of active enzyme
decreases according the first order rate law:
)0(,,, batchstraqstrenzistr
straq ttVCkdt
dCV ���� . (3.18)
In this section the subscripts actenz, and aq are dropped from the symbol C for shortness and all
concentrations denote the concentrations of the active enzyme in the aqueous phase.
In the second stage, an amount 0,ccsV of reaction mixture is transferred from the STR to the
continuous contactor centrifugal separator (CCCS). The STR is from now operated in a continuous
mode with its aqueous feed stream containing fresh enzyme at a concentration of instrC and its exit
flow is input to the CCCS. This way the CCCS is gradually filling-up while operating in a semi-batch
mode over the time interval of fillbatch ttt �� . The concentrations follow from
)()( ,,,, fillbatchstraqstrenzistrinstraqv
strstraq tttVCkCC
dtdC
V ������ (3.19)
)()(,,,
)(,
fillbatchtccsaqccsenzistraqvccstccsaq tttVCkC
dtCdV
����� (3.20)
where the volume of the aqueous phase in the CCCS increases over time according to �)(, tccsaqV
�0,,ccsaqV )(, batchaqv tt �� .
In the third stage, both the STR and CCCS are completely filled and operated in a continuous
mode. The exit of the STR is input to the CCCS, and the aqueous exit of the CCCS is accumulated in a
storage vessel (SV). The amounts of active enzyme in the STR, CCCS and the SV follow from
)()( ,,,, switchfillstraqstrenzistrinstraqv
strstraq tttVCkCC
dtdC
V ������ (3.21)
)()( ,,,, switchfillccsaqccsenziccsstraqvccs
ccsaq tttVCkCCdt
dCV ������ (3.22)
)(,)(,
switchfillccsaqvsvtsvaq tttC
dtCdV
���� (3.23)
(3.19)
In this section the subscripts
89
In the first stage the stirred tank reactor (STR) is filled with the two-phase reaction mixture,
and operated in batch mode over the time interval of batchtt ��0 . The amount of active enzyme
decreases according the first order rate law:
)0(,,, batchstraqstrenzistr
straq ttVCkdt
dCV ���� . (3.18)
In this section the subscripts actenz, and aq are dropped from the symbol C for shortness and all
concentrations denote the concentrations of the active enzyme in the aqueous phase.
In the second stage, an amount 0,ccsV of reaction mixture is transferred from the STR to the
continuous contactor centrifugal separator (CCCS). The STR is from now operated in a continuous
mode with its aqueous feed stream containing fresh enzyme at a concentration of instrC and its exit
flow is input to the CCCS. This way the CCCS is gradually filling-up while operating in a semi-batch
mode over the time interval of fillbatch ttt �� . The concentrations follow from
)()( ,,,, fillbatchstraqstrenzistrinstraqv
strstraq tttVCkCC
dtdC
V ������ (3.19)
)()(,,,
)(,
fillbatchtccsaqccsenzistraqvccstccsaq tttVCkC
dtCdV
����� (3.20)
where the volume of the aqueous phase in the CCCS increases over time according to �)(, tccsaqV
�0,,ccsaqV )(, batchaqv tt �� .
In the third stage, both the STR and CCCS are completely filled and operated in a continuous
mode. The exit of the STR is input to the CCCS, and the aqueous exit of the CCCS is accumulated in a
storage vessel (SV). The amounts of active enzyme in the STR, CCCS and the SV follow from
)()( ,,,, switchfillstraqstrenzistrinstraqv
strstraq tttVCkCC
dtdC
V ������ (3.21)
)()( ,,,, switchfillccsaqccsenziccsstraqvccs
ccsaq tttVCkCCdt
dCV ������ (3.22)
)(,)(,
switchfillccsaqvsvtsvaq tttC
dtCdV
���� (3.23)
and
89
In the first stage the stirred tank reactor (STR) is filled with the two-phase reaction mixture,
and operated in batch mode over the time interval of batchtt ��0 . The amount of active enzyme
decreases according the first order rate law:
)0(,,, batchstraqstrenzistr
straq ttVCkdt
dCV ���� . (3.18)
In this section the subscripts actenz, and aq are dropped from the symbol C for shortness and all
concentrations denote the concentrations of the active enzyme in the aqueous phase.
In the second stage, an amount 0,ccsV of reaction mixture is transferred from the STR to the
continuous contactor centrifugal separator (CCCS). The STR is from now operated in a continuous
mode with its aqueous feed stream containing fresh enzyme at a concentration of instrC and its exit
flow is input to the CCCS. This way the CCCS is gradually filling-up while operating in a semi-batch
mode over the time interval of fillbatch ttt �� . The concentrations follow from
)()( ,,,, fillbatchstraqstrenzistrinstraqv
strstraq tttVCkCC
dtdC
V ������ (3.19)
)()(,,,
)(,
fillbatchtccsaqccsenzistraqvccstccsaq tttVCkC
dtCdV
����� (3.20)
where the volume of the aqueous phase in the CCCS increases over time according to �)(, tccsaqV
�0,,ccsaqV )(, batchaqv tt �� .
In the third stage, both the STR and CCCS are completely filled and operated in a continuous
mode. The exit of the STR is input to the CCCS, and the aqueous exit of the CCCS is accumulated in a
storage vessel (SV). The amounts of active enzyme in the STR, CCCS and the SV follow from
)()( ,,,, switchfillstraqstrenzistrinstraqv
strstraq tttVCkCC
dtdC
V ������ (3.21)
)()( ,,,, switchfillccsaqccsenziccsstraqvccs
ccsaq tttVCkCCdt
dCV ������ (3.22)
)(,)(,
switchfillccsaqvsvtsvaq tttC
dtCdV
���� (3.23)
are dropped from the symbol C for shortness and all concentrations denote the concentrations of the active en-zyme in the aqueous phase.
In the second stage, an amount
89
In the first stage the stirred tank reactor (STR) is filled with the two-phase reaction mixture,
and operated in batch mode over the time interval of batchtt ��0 . The amount of active enzyme
decreases according the first order rate law:
)0(,,, batchstraqstrenzistr
straq ttVCkdt
dCV ���� . (3.18)
In this section the subscripts actenz, and aq are dropped from the symbol C for shortness and all
concentrations denote the concentrations of the active enzyme in the aqueous phase.
In the second stage, an amount 0,ccsV of reaction mixture is transferred from the STR to the
continuous contactor centrifugal separator (CCCS). The STR is from now operated in a continuous
mode with its aqueous feed stream containing fresh enzyme at a concentration of instrC and its exit
flow is input to the CCCS. This way the CCCS is gradually filling-up while operating in a semi-batch
mode over the time interval of fillbatch ttt �� . The concentrations follow from
)()( ,,,, fillbatchstraqstrenzistrinstraqv
strstraq tttVCkCC
dtdC
V ������ (3.19)
)()(,,,
)(,
fillbatchtccsaqccsenzistraqvccstccsaq tttVCkC
dtCdV
����� (3.20)
where the volume of the aqueous phase in the CCCS increases over time according to �)(, tccsaqV
�0,,ccsaqV )(, batchaqv tt �� .
In the third stage, both the STR and CCCS are completely filled and operated in a continuous
mode. The exit of the STR is input to the CCCS, and the aqueous exit of the CCCS is accumulated in a
storage vessel (SV). The amounts of active enzyme in the STR, CCCS and the SV follow from
)()( ,,,, switchfillstraqstrenzistrinstraqv
strstraq tttVCkCC
dtdC
V ������ (3.21)
)()( ,,,, switchfillccsaqccsenziccsstraqvccs
ccsaq tttVCkCCdt
dCV ������ (3.22)
)(,)(,
switchfillccsaqvsvtsvaq tttC
dtCdV
���� (3.23)
of reaction mixture is transferred from the STR to the continuous contactor centrifugal separator (CCCS). The STR is from now operated in a continuous mode with its aqueous feed stream con-taining fresh enzyme at a concentration of
89
In the first stage the stirred tank reactor (STR) is filled with the two-phase reaction mixture,
and operated in batch mode over the time interval of batchtt ��0 . The amount of active enzyme
decreases according the first order rate law:
)0(,,, batchstraqstrenzistr
straq ttVCkdt
dCV ���� . (3.18)
In this section the subscripts actenz, and aq are dropped from the symbol C for shortness and all
concentrations denote the concentrations of the active enzyme in the aqueous phase.
In the second stage, an amount 0,ccsV of reaction mixture is transferred from the STR to the
continuous contactor centrifugal separator (CCCS). The STR is from now operated in a continuous
mode with its aqueous feed stream containing fresh enzyme at a concentration of instrC and its exit
flow is input to the CCCS. This way the CCCS is gradually filling-up while operating in a semi-batch
mode over the time interval of fillbatch ttt �� . The concentrations follow from
)()( ,,,, fillbatchstraqstrenzistrinstraqv
strstraq tttVCkCC
dtdC
V ������ (3.19)
)()(,,,
)(,
fillbatchtccsaqccsenzistraqvccstccsaq tttVCkC
dtCdV
����� (3.20)
where the volume of the aqueous phase in the CCCS increases over time according to �)(, tccsaqV
�0,,ccsaqV )(, batchaqv tt �� .
In the third stage, both the STR and CCCS are completely filled and operated in a continuous
mode. The exit of the STR is input to the CCCS, and the aqueous exit of the CCCS is accumulated in a
storage vessel (SV). The amounts of active enzyme in the STR, CCCS and the SV follow from
)()( ,,,, switchfillstraqstrenzistrinstraqv
strstraq tttVCkCC
dtdC
V ������ (3.21)
)()( ,,,, switchfillccsaqccsenziccsstraqvccs
ccsaq tttVCkCCdt
dCV ������ (3.22)
)(,)(,
switchfillccsaqvsvtsvaq tttC
dtCdV
���� (3.23)
and its exit flow is input to the CCCS. This way the CCCS is gradually filling-up while operating in a semi-batch mode over the time interval of fillbatch ttt ≤≤ . The concentrations follow from
Figure 3.15. Glycerol () and 1-butanol () accumulation in aqueous phase during enzyme recycle experiments. Enzyme reuse started at the fourth hour (dash line).

Chapter 33. Results and discussion
87
(3.20)
89
In the first stage the stirred tank reactor (STR) is filled with the two-phase reaction mixture,
and operated in batch mode over the time interval of batchtt ��0 . The amount of active enzyme
decreases according the first order rate law:
)0(,,, batchstraqstrenzistr
straq ttVCkdt
dCV ���� . (3.18)
In this section the subscripts actenz, and aq are dropped from the symbol C for shortness and all
concentrations denote the concentrations of the active enzyme in the aqueous phase.
In the second stage, an amount 0,ccsV of reaction mixture is transferred from the STR to the
continuous contactor centrifugal separator (CCCS). The STR is from now operated in a continuous
mode with its aqueous feed stream containing fresh enzyme at a concentration of instrC and its exit
flow is input to the CCCS. This way the CCCS is gradually filling-up while operating in a semi-batch
mode over the time interval of fillbatch ttt �� . The concentrations follow from
)()( ,,,, fillbatchstraqstrenzistrinstraqv
strstraq tttVCkCC
dtdC
V ������ (3.19)
)()(,,,
)(,
fillbatchtccsaqccsenzistraqvccstccsaq tttVCkC
dtCdV
����� (3.20)
where the volume of the aqueous phase in the CCCS increases over time according to �)(, tccsaqV
�0,,ccsaqV )(, batchaqv tt �� .
In the third stage, both the STR and CCCS are completely filled and operated in a continuous
mode. The exit of the STR is input to the CCCS, and the aqueous exit of the CCCS is accumulated in a
storage vessel (SV). The amounts of active enzyme in the STR, CCCS and the SV follow from
)()( ,,,, switchfillstraqstrenzistrinstraqv
strstraq tttVCkCC
dtdC
V ������ (3.21)
)()( ,,,, switchfillccsaqccsenziccsstraqvccs
ccsaq tttVCkCCdt
dCV ������ (3.22)
)(,)(,
switchfillccsaqvsvtsvaq tttC
dtCdV
���� (3.23)
(3.21)
where the volume of the aqueous phase in the CCCS increases over time accord-ing to
89
In the first stage the stirred tank reactor (STR) is filled with the two-phase reaction mixture,
and operated in batch mode over the time interval of batchtt ��0 . The amount of active enzyme
decreases according the first order rate law:
)0(,,, batchstraqstrenzistr
straq ttVCkdt
dCV ���� . (3.18)
In this section the subscripts actenz, and aq are dropped from the symbol C for shortness and all
concentrations denote the concentrations of the active enzyme in the aqueous phase.
In the second stage, an amount 0,ccsV of reaction mixture is transferred from the STR to the
continuous contactor centrifugal separator (CCCS). The STR is from now operated in a continuous
mode with its aqueous feed stream containing fresh enzyme at a concentration of instrC and its exit
flow is input to the CCCS. This way the CCCS is gradually filling-up while operating in a semi-batch
mode over the time interval of fillbatch ttt �� . The concentrations follow from
)()( ,,,, fillbatchstraqstrenzistrinstraqv
strstraq tttVCkCC
dtdC
V ������ (3.19)
)()(,,,
)(,
fillbatchtccsaqccsenzistraqvccstccsaq tttVCkC
dtCdV
����� (3.20)
where the volume of the aqueous phase in the CCCS increases over time according to �)(, tccsaqV
�0,,ccsaqV )(, batchaqv tt �� .
In the third stage, both the STR and CCCS are completely filled and operated in a continuous
mode. The exit of the STR is input to the CCCS, and the aqueous exit of the CCCS is accumulated in a
storage vessel (SV). The amounts of active enzyme in the STR, CCCS and the SV follow from
)()( ,,,, switchfillstraqstrenzistrinstraqv
strstraq tttVCkCC
dtdC
V ������ (3.21)
)()( ,,,, switchfillccsaqccsenziccsstraqvccs
ccsaq tttVCkCCdt
dCV ������ (3.22)
)(,)(,
switchfillccsaqvsvtsvaq tttC
dtCdV
���� (3.23)
.
In the third stage, both the STR and CCCS are completely filled and operated in a continuous mode. The exit of the STR is input to the CCCS, and the aque-ous exit of the CCCS is accumulated in a storage vessel (SV). The amounts of active enzyme in the STR, CCCS and the SV follow from
89
In the first stage the stirred tank reactor (STR) is filled with the two-phase reaction mixture,
and operated in batch mode over the time interval of batchtt ��0 . The amount of active enzyme
decreases according the first order rate law:
)0(,,, batchstraqstrenzistr
straq ttVCkdt
dCV ���� . (3.18)
In this section the subscripts actenz, and aq are dropped from the symbol C for shortness and all
concentrations denote the concentrations of the active enzyme in the aqueous phase.
In the second stage, an amount 0,ccsV of reaction mixture is transferred from the STR to the
continuous contactor centrifugal separator (CCCS). The STR is from now operated in a continuous
mode with its aqueous feed stream containing fresh enzyme at a concentration of instrC and its exit
flow is input to the CCCS. This way the CCCS is gradually filling-up while operating in a semi-batch
mode over the time interval of fillbatch ttt �� . The concentrations follow from
)()( ,,,, fillbatchstraqstrenzistrinstraqv
strstraq tttVCkCC
dtdC
V ������ (3.19)
)()(,,,
)(,
fillbatchtccsaqccsenzistraqvccstccsaq tttVCkC
dtCdV
����� (3.20)
where the volume of the aqueous phase in the CCCS increases over time according to �)(, tccsaqV
�0,,ccsaqV )(, batchaqv tt �� .
In the third stage, both the STR and CCCS are completely filled and operated in a continuous
mode. The exit of the STR is input to the CCCS, and the aqueous exit of the CCCS is accumulated in a
storage vessel (SV). The amounts of active enzyme in the STR, CCCS and the SV follow from
)()( ,,,, switchfillstraqstrenzistrinstraqv
strstraq tttVCkCC
dtdC
V ������ (3.21)
)()( ,,,, switchfillccsaqccsenziccsstraqvccs
ccsaq tttVCkCCdt
dCV ������ (3.22)
)(,)(,
switchfillccsaqvsvtsvaq tttC
dtCdV
���� (3.23)
(3.22)
89
In the first stage the stirred tank reactor (STR) is filled with the two-phase reaction mixture,
and operated in batch mode over the time interval of batchtt ��0 . The amount of active enzyme
decreases according the first order rate law:
)0(,,, batchstraqstrenzistr
straq ttVCkdt
dCV ���� . (3.18)
In this section the subscripts actenz, and aq are dropped from the symbol C for shortness and all
concentrations denote the concentrations of the active enzyme in the aqueous phase.
In the second stage, an amount 0,ccsV of reaction mixture is transferred from the STR to the
continuous contactor centrifugal separator (CCCS). The STR is from now operated in a continuous
mode with its aqueous feed stream containing fresh enzyme at a concentration of instrC and its exit
flow is input to the CCCS. This way the CCCS is gradually filling-up while operating in a semi-batch
mode over the time interval of fillbatch ttt �� . The concentrations follow from
)()( ,,,, fillbatchstraqstrenzistrinstraqv
strstraq tttVCkCC
dtdC
V ������ (3.19)
)()(,,,
)(,
fillbatchtccsaqccsenzistraqvccstccsaq tttVCkC
dtCdV
����� (3.20)
where the volume of the aqueous phase in the CCCS increases over time according to �)(, tccsaqV
�0,,ccsaqV )(, batchaqv tt �� .
In the third stage, both the STR and CCCS are completely filled and operated in a continuous
mode. The exit of the STR is input to the CCCS, and the aqueous exit of the CCCS is accumulated in a
storage vessel (SV). The amounts of active enzyme in the STR, CCCS and the SV follow from
)()( ,,,, switchfillstraqstrenzistrinstraqv
strstraq tttVCkCC
dtdC
V ������ (3.21)
)()( ,,,, switchfillccsaqccsenziccsstraqvccs
ccsaq tttVCkCCdt
dCV ������ (3.22)
)(,)(,
switchfillccsaqvsvtsvaq tttC
dtCdV
���� (3.23)
(3.23)
89
In the first stage the stirred tank reactor (STR) is filled with the two-phase reaction mixture,
and operated in batch mode over the time interval of batchtt ��0 . The amount of active enzyme
decreases according the first order rate law:
)0(,,, batchstraqstrenzistr
straq ttVCkdt
dCV ���� . (3.18)
In this section the subscripts actenz, and aq are dropped from the symbol C for shortness and all
concentrations denote the concentrations of the active enzyme in the aqueous phase.
In the second stage, an amount 0,ccsV of reaction mixture is transferred from the STR to the
continuous contactor centrifugal separator (CCCS). The STR is from now operated in a continuous
mode with its aqueous feed stream containing fresh enzyme at a concentration of instrC and its exit
flow is input to the CCCS. This way the CCCS is gradually filling-up while operating in a semi-batch
mode over the time interval of fillbatch ttt �� . The concentrations follow from
)()( ,,,, fillbatchstraqstrenzistrinstraqv
strstraq tttVCkCC
dtdC
V ������ (3.19)
)()(,,,
)(,
fillbatchtccsaqccsenzistraqvccstccsaq tttVCkC
dtCdV
����� (3.20)
where the volume of the aqueous phase in the CCCS increases over time according to �)(, tccsaqV
�0,,ccsaqV )(, batchaqv tt �� .
In the third stage, both the STR and CCCS are completely filled and operated in a continuous
mode. The exit of the STR is input to the CCCS, and the aqueous exit of the CCCS is accumulated in a
storage vessel (SV). The amounts of active enzyme in the STR, CCCS and the SV follow from
)()( ,,,, switchfillstraqstrenzistrinstraqv
strstraq tttVCkCC
dtdC
V ������ (3.21)
)()( ,,,, switchfillccsaqccsenziccsstraqvccs
ccsaq tttVCkCCdt
dCV ������ (3.22)
)(,)(,
switchfillccsaqvsvtsvaq tttC
dtCdV
���� (3.23)
(3.24)
where the volume of the aqueous phase in the SV increases over time according to
90
where the volume of the aqueous phase in the SV increases over time according to �)(, tsvaqV
)(, fillaqv tt �� .
Finally in the fourth stage of operation, starting at switchtt � , all 3 vessels are operated in a
continuous mode where the aqueous input stream to the STR is switched from the fresh enzyme
solution to the enzyme solution in the SV. This way a closed cycle of the aqueous enzyme solution is
established and the system operates with a complete recirculation of enzyme without any addition
of fresh enzyme as shown in Fig. 6. The concentrations of active enzyme can now be calculated from
)()( ,,,, switchstraqstrenzistrsvaqvstr
straq ttVCkCCdt
dCV ����� (3.24)
)()( ,,,, switchccsaqccsenziccsstraqvccs
ccsaq ttVCkCCdt
dCV ����� (3.25)
)()(,, switchsvccsaqvsv
svaq ttCCdt
dCV ���� (3.26)
The resulting equations (3.18 – 3.26) describe the various stages of operation of the
experiment with enzyme recycling. The equations were solved to obtain calculated values of the
residual enzyme activity at sampling point 3 (see Figure 3.6) at the entrance of the STR. For the time
interval switchtt ��0 this value is associated with the make-up enzyme concentration in the feed
stream from the stock solution of enzyme, while for the time switchtt � the value is associated with
the concentration of active enzyme in the SV.
Figure 3.16 shows a comparison of the modelling results and the measured data points,
where the calculated line for switchtt � was obtained with a manually optimized correction factor of
0.55 for the deactivation rate constant enzik , as obtained from our previous work [27]. A reasonably
good fit is obtained this way, especially when taking into account the complexity of the recirculation
system, including a stirred reactor, a centrifugal reactor and a storage vessel, over a period of 12
hours.
.
Finally in the fourth stage of operation, starting at switchtt = , all 3 vessels are operated in a continuous mode where the aqueous input stream to the STR is switched from the fresh enzyme solution to the enzyme solution in the SV. This way a closed cycle of the aqueous enzyme solution is established and the system operates with a complete recirculation of enzyme without any addition of fresh enzyme as shown in Fig. 3.6. The concentrations of active enzyme can now be calculated from
90
where the volume of the aqueous phase in the SV increases over time according to �)(, tsvaqV
)(, fillaqv tt �� .
Finally in the fourth stage of operation, starting at switchtt � , all 3 vessels are operated in a
continuous mode where the aqueous input stream to the STR is switched from the fresh enzyme
solution to the enzyme solution in the SV. This way a closed cycle of the aqueous enzyme solution is
established and the system operates with a complete recirculation of enzyme without any addition
of fresh enzyme as shown in Fig. 6. The concentrations of active enzyme can now be calculated from
)()( ,,,, switchstraqstrenzistrsvaqvstr
straq ttVCkCCdt
dCV ����� (3.24)
)()( ,,,, switchccsaqccsenziccsstraqvccs
ccsaq ttVCkCCdt
dCV ����� (3.25)
)()(,, switchsvccsaqvsv
svaq ttCCdt
dCV ���� (3.26)
The resulting equations (3.18 – 3.26) describe the various stages of operation of the
experiment with enzyme recycling. The equations were solved to obtain calculated values of the
residual enzyme activity at sampling point 3 (see Figure 3.6) at the entrance of the STR. For the time
interval switchtt ��0 this value is associated with the make-up enzyme concentration in the feed
stream from the stock solution of enzyme, while for the time switchtt � the value is associated with
the concentration of active enzyme in the SV.
Figure 3.16 shows a comparison of the modelling results and the measured data points,
where the calculated line for switchtt � was obtained with a manually optimized correction factor of
0.55 for the deactivation rate constant enzik , as obtained from our previous work [27]. A reasonably
good fit is obtained this way, especially when taking into account the complexity of the recirculation
system, including a stirred reactor, a centrifugal reactor and a storage vessel, over a period of 12
hours.
(3.25)
90
where the volume of the aqueous phase in the SV increases over time according to �)(, tsvaqV
)(, fillaqv tt �� .
Finally in the fourth stage of operation, starting at switchtt � , all 3 vessels are operated in a
continuous mode where the aqueous input stream to the STR is switched from the fresh enzyme
solution to the enzyme solution in the SV. This way a closed cycle of the aqueous enzyme solution is
established and the system operates with a complete recirculation of enzyme without any addition
of fresh enzyme as shown in Fig. 6. The concentrations of active enzyme can now be calculated from
)()( ,,,, switchstraqstrenzistrsvaqvstr
straq ttVCkCCdt
dCV ����� (3.24)
)()( ,,,, switchccsaqccsenziccsstraqvccs
ccsaq ttVCkCCdt
dCV ����� (3.25)
)()(,, switchsvccsaqvsv
svaq ttCCdt
dCV ���� (3.26)
The resulting equations (3.18 – 3.26) describe the various stages of operation of the
experiment with enzyme recycling. The equations were solved to obtain calculated values of the
residual enzyme activity at sampling point 3 (see Figure 3.6) at the entrance of the STR. For the time
interval switchtt ��0 this value is associated with the make-up enzyme concentration in the feed
stream from the stock solution of enzyme, while for the time switchtt � the value is associated with
the concentration of active enzyme in the SV.
Figure 3.16 shows a comparison of the modelling results and the measured data points,
where the calculated line for switchtt � was obtained with a manually optimized correction factor of
0.55 for the deactivation rate constant enzik , as obtained from our previous work [27]. A reasonably
good fit is obtained this way, especially when taking into account the complexity of the recirculation
system, including a stirred reactor, a centrifugal reactor and a storage vessel, over a period of 12
hours.
(3.26)
90
where the volume of the aqueous phase in the SV increases over time according to �)(, tsvaqV
)(, fillaqv tt �� .
Finally in the fourth stage of operation, starting at switchtt � , all 3 vessels are operated in a
continuous mode where the aqueous input stream to the STR is switched from the fresh enzyme
solution to the enzyme solution in the SV. This way a closed cycle of the aqueous enzyme solution is
established and the system operates with a complete recirculation of enzyme without any addition
of fresh enzyme as shown in Fig. 6. The concentrations of active enzyme can now be calculated from
)()( ,,,, switchstraqstrenzistrsvaqvstr
straq ttVCkCCdt
dCV ����� (3.24)
)()( ,,,, switchccsaqccsenziccsstraqvccs
ccsaq ttVCkCCdt
dCV ����� (3.25)
)()(,, switchsvccsaqvsv
svaq ttCCdt
dCV ���� (3.26)
The resulting equations (3.18 – 3.26) describe the various stages of operation of the
experiment with enzyme recycling. The equations were solved to obtain calculated values of the
residual enzyme activity at sampling point 3 (see Figure 3.6) at the entrance of the STR. For the time
interval switchtt ��0 this value is associated with the make-up enzyme concentration in the feed
stream from the stock solution of enzyme, while for the time switchtt � the value is associated with
the concentration of active enzyme in the SV.
Figure 3.16 shows a comparison of the modelling results and the measured data points,
where the calculated line for switchtt � was obtained with a manually optimized correction factor of
0.55 for the deactivation rate constant enzik , as obtained from our previous work [27]. A reasonably
good fit is obtained this way, especially when taking into account the complexity of the recirculation
system, including a stirred reactor, a centrifugal reactor and a storage vessel, over a period of 12
hours.
(3.27)
89
In the first stage the stirred tank reactor (STR) is filled with the two-phase reaction mixture,
and operated in batch mode over the time interval of batchtt ��0 . The amount of active enzyme
decreases according the first order rate law:
)0(,,, batchstraqstrenzistr
straq ttVCkdt
dCV ���� . (3.18)
In this section the subscripts actenz, and aq are dropped from the symbol C for shortness and all
concentrations denote the concentrations of the active enzyme in the aqueous phase.
In the second stage, an amount 0,ccsV of reaction mixture is transferred from the STR to the
continuous contactor centrifugal separator (CCCS). The STR is from now operated in a continuous
mode with its aqueous feed stream containing fresh enzyme at a concentration of instrC and its exit
flow is input to the CCCS. This way the CCCS is gradually filling-up while operating in a semi-batch
mode over the time interval of fillbatch ttt �� . The concentrations follow from
)()( ,,,, fillbatchstraqstrenzistrinstraqv
strstraq tttVCkCC
dtdC
V ������ (3.19)
)()(,,,
)(,
fillbatchtccsaqccsenzistraqvccstccsaq tttVCkC
dtCdV
����� (3.20)
where the volume of the aqueous phase in the CCCS increases over time according to �)(, tccsaqV
�0,,ccsaqV )(, batchaqv tt �� .
In the third stage, both the STR and CCCS are completely filled and operated in a continuous
mode. The exit of the STR is input to the CCCS, and the aqueous exit of the CCCS is accumulated in a
storage vessel (SV). The amounts of active enzyme in the STR, CCCS and the SV follow from
)()( ,,,, switchfillstraqstrenzistrinstraqv
strstraq tttVCkCC
dtdC
V ������ (3.21)
)()( ,,,, switchfillccsaqccsenziccsstraqvccs
ccsaq tttVCkCCdt
dCV ������ (3.22)
)(,)(,
switchfillccsaqvsvtsvaq tttC
dtCdV
���� (3.23)

Chapter 3Continuous fatty acid butyl ester synthesis using a Rhizomucor miehei lipase
88
The resulting equations (3.19 – 3.27) describe the various stages of oper-ation of the experiment with enzyme recycling. The equations were solved to obtain calculated values of the residual enzyme activity at sampling point 3 (see Figure 3.6) at the entrance of the STR. For the time interval switchtt ≤≤0 this value is associated with the make-up enzyme concentration in the feed stream from the stock solution of enzyme, while for the time switchtt > the value is associated with the concentration of active enzyme in the SV.
Figure 3.16 shows a comparison of the modelling results and the measured data points, where the calculated line for switchtt > was obtained with a manually opti-mized correction factor of 0.55 for the deactivation rate constant enzik , as obtained from our previous work [27]. A reasonably good fit is obtained this way, especially when taking into account the complexity of the recirculation system, including a stirred reactor, a centrifugal reactor and a storage vessel, over a period of 12 hours.
4. Conclusions
In this study, we have shown the proof of concept for the continuous production of butyl ester biodiesel from sunflower oil and 1-butanol using a free lipase in an aqueous-organic biphasic in a single CSTR and CCCS as well as a cascade of a CSTR and CCCS reactor. The experimental data obtained in the CSTR re-actor were successfully modelled using the mass balances in combination with the known enzyme kinetics for sunflower oil transesterification with 1-butanol using the homogeneous lipase (Rhizomucor miehei) in an aqueous-organic bi-phasic system (Ping Pong Bi Bi mechanism with non-competitive inhibition by 1-butanol and a term for irreversible enzyme deactivation during reaction). Optimisation studies in the cascade lead to steady state FABE yields of up to 92%-mol for a runtime of 8 h. Operational issues were not observed for these continuous once-through experiments. Volumetric production rates were close to those reported for biodiesel synthesis in fed batch and continuous set-ups using a free enzyme (Thermomyces lanuginosus lipase). Enzyme recycling was investigated by reintroduction of the aqueous phase containing the enzyme in the feed of the cascade. FABE yield was shown to decrease over the runtime, likely due to enzyme loss by the formation of an interfacial layer combined with enzyme inhibition by 1-butanol and irreversible enzyme deactivation. The enzyme activity versus runtime was measured and successfully modelled. Measures to improve the concept and to allow for a more efficient recycle strat-egy involve the use of a separation unit in the recycle stream to remove butanol and glycerol (bleed) and as such reduce enzyme inhibition by 1-butanol. These dedicated process studies are beyond the scope of this manuscript.

Chapter 35. Nomenclature
89
5. Nomenclature
A, P, S denotes the components n-butanol, ester and acyl, respectively C concentration, mol.L-1 CCCS continuous contactor centrifugal separatorCenz,act concentration of active enzyme in the aqueous phase, gr.L-1 Cenz,act initial concentration of active enzyme in the aqueous phase in
the batch operation stage, gr.L-1 Cenz,act concentration of active enzyme in the aqueous feed in the
continuous operation stage, gr.L-1 Km,S Michaelis Menten constant, = 0.355 mol.L-1 kenz kinetic rate constant, = 0.794 × 10⁻³ mol.Lorg-1.gr-1.Laq.s-1 ki,enz deactivation constant of the enzyme, = 0.007 s-1 P distribution coefficient of butanol, P = (CA,org / CA,aq)eq
RV phase volume ration, RV = Vorg / Vaq
(renz)deactivation deactivation rate of the enzyme, gr.Laq-1.s-1STR stirred tank reactorSV storage vesseltbatch time of the initial stage of operation in batch mode, s V volume, L Vaq,ccs,0 amount of aqueous phase transferred, with the reaction mix-
ture, from the STR to the CCS at the time t = tbatch, L
0 2 4 6 8 10 12 14
time [h]
0
20
40
60
80
100
resi
dual
enz
yme
activ
ity [%
]
Figure 3.16. Residual lipase activity measured at sampling point 3 in the enzyme recycling test. Sym-bols: measured; solid lines: calculated from Equations 3.19 – 3.27; dashed line: start of enzyme recycling.
⁰
iⁿ
Chapter 3Continuous fatty acid butyl ester synthesis using a Rhizomucor miehei lipase
90
Greek symbols
vφ volumetric flow rate, L.min-1 τ average residence time (= vV ϕ/ ), s
Subscripts
A, P, S denotes the components n-butanol, ester and acyl, respectively aq aqueous phase ccs contactor centrifugal separatoreq at equilibrium org organic phasestr stirred tank reactorvs storage vessel
References
[1] P.M. Nielsen, J. Brask, L. Fjerbaek, Enzymatic bio-diesel production: Technical and economical consid-erations, Eur. J. Lipid Sci. Technol. 110 (2008) 692–700.
[2] A.K. Agarwal, L.M. Das, Biodiesel Development and Characterization for Use as a Fuel in Compression Igni-tion Engines, J. Eng. Gas Turbines Power. 123 (2001) 440.
[3] REN21, Renewables 2015 Global Status Report, REN21 Secretariat, Paris, 2015.
[4] D.Y.C. Leung, X. Wu, M.K.H. Leung, A review on biodiesel production using catalyzed transesterifica-tion, Appl. Energy. 87 (2010) 1083–1095.
[5] F. Ma, M.A. Hanna, Biodiesel production: a review, Bioresour. Technol. 70 (1999) 1–15.
[6] A.E. Atabani, A.S. Silitonga, I.A. Badruddin, T.M.I. Mahlia, H.H. Masjuki, S. Mekhilef, A comprehensive review on biodiesel as an alternative energy resource and its characteristics, Renew. Sustain. Energy Rev. 16 (2012) 2070–2093.
[7] G. Knothe, Dependence of biodiesel fuel properties on the structure of fatty acid alkyl esters, Fuel Pro-cess. Technol. 86 (2005) 1059–1070.
[8] A.C. Oliveira, M.F. Rosa, Enzymatic transesterifica-tion of sunflower oil in an aqueous-oil biphasic sys-tem, J. Am. Oil Chem. Soc. 83 (2006) 21–25.
[9] N.R. Kamini, H. Iefuji, Lipase catalyzed methanoly-sis of vegetable oils in aqueous medium by Crypto-coccus spp. S-2, Process Biochem. 37 (2001) 405–410.
[10] X. Chen, W. Du, D. Liu, Effect of several factors on soluble lipase-mediated biodiesel preparation in the biphasic aqueous-oil systems, World J. Microbiol. Biotechnol. 24 (2008) 2097–2102.
[11] A. Toftgaard Pedersen, M. Nordblad, P.M. Nielsen, J.M. Woodley, Batch production of FAEE-biodiesel using a liquid lipase formulation, J. Mol. Catal. B En-zym. 105 (2014) 89–94.
[12] G.N. Kraai, J.G.M. Winkelman, J.G. de Vries, H.J. Heeres, Kinetic studies on the Rhizomucor miehei lipase cata-lyzed esterification reaction of oleic acid with 1-butanol in a biphasic system, Biochem. Eng. J. 41 (2008) 87–94.
[13] S. Al-Zuhair, K.V. Jayaraman, S. Krishnan, W.-H. Chan, The effect of fatty acid concentration and wa-ter content on the production of biodiesel by lipase, Biochem. Eng. J. 30 (2006) 212–217.
[14] A.C. Oliveira, M.F. Rosa, M.R. Aires-Barros, J.M.S. Cabral, Enzymatic esterification of ethanol and oleic acid — a ki-netic study, J. Mol. Catal. B Enzym. 11 (2001) 999–1005.
[15] S. Al-Zuhair, Production of biodiesel by lipase-cata-lyzed transesterification of vegetable oils: a kinetics study., Biotechnol. Prog. 21 (2005) 1442–8.
[16] L. Fjerbaek, K. V. Christensen, B. Norddahl, A review of the current state of biodiesel production using enzymatic trans-esterification, Biotechnol. Bioeng. 102 (2009) 1298–1315.
[17] J. Price, M. Nordblad, J.M. Woodley, J.K. Huusom, Fed-Batch Feeding Strategies for Enzymatic Bio-diesel Production, in: B. Edward (Ed.), IFAC Proc. Vol., 2014: pp. 6204–6209.
[18] J. Price, B. Hofmann, V.T.L. Silva, M. Nordblad, J.M. Woodley, J.K. Huusom, Mechanistic modeling of biodiesel production using a liquid lipase formula-tion., Biotechnol. Prog. 30 (2014) 1277–90.
[19] J. Price, M. Nordblad, J.M. Woodley, From Fed-batch to Continuous Enzymatic Biodiesel Production, Comput. Aided Chem. Eng. 37 (2015) 1337–1342.

Chapter 3References
91
[20] J. Price, M. Nordblad, H.H. Martel, B. Chrabas, H. Wang, P.M. Nielsen, et al., Scale-up of industrial bio-diesel production to 40 m(3) using a liquid lipase for-mulation., Biotechnol. Bioeng. (2016).
[21] D.H. Meikrantz, L.L. Macaluso, H.W. Sams, C.H. Schardin, A.G. Federici, Centrifugal separator, (1998).
[22] B. Schuur, J. Floure, A.J. Hallett, J.G.M. Winkelman, J.G. DeVries, H.J. Heeres, Continuous Chiral Separa-tion of Amino Acid Derivatives by Enantioselective Liquid-Liquid Extraction in Centrifugal Contactor Separators, Org. Process Res. Dev. 12 (2008) 950–955.
[23] G.N. Kraai, F. van Zwol, B. Schuur, H.J. Heeres, J.G. de Vries, Two-phase (bio)catalytic reactions in a ta-ble-top centrifugal contact separator., Angew. Chem. Int. Ed. Engl. 47 (2008) 3905–8.
[24] G.N. Kraai, B. Schuur, F. van Zwol, H.H. van de Boven-kamp, H.J. Heeres, Novel highly integrated biodiesel production technology in a centrifugal contactor sep-arator device, Chem. Eng. J. 154 (2009) 384–389.
[25] M.Y. Abduh, W. van Ulden, V. Kalpoe, H.H. van de Bovenkamp, R. Manurung, H.J. Heeres, Biodiesel synthesis from Jatropha curcas L. oil and ethanol in a continuous centrifugal contactor separator, Eur. J. Lipid Sci. Technol. 115 (2013) 123–131.
[26] M.Y. Abduh, W. van Ulden, H.H. van de Bovenkamp, T. Buntara, F. Picchioni, R. Manurung, et al., Synthe-sis and refining of sunflower biodiesel in a cascade of continuous centrifugal contactor separators, Eur. J. Lipid Sci. Technol. 117 (2015) 242–254.
[27] M. Ilmi, A. Hommes, J.G.M. Winkelman, C. Hidayat, H.J. Heeres, Kinetic studies on the transesterification of sunflower oil with 1-butanol catalyzed by Rhizomu-cor miehei lipase in a biphasic aqueous-organic sys-tem, Biochem. Eng. J. 114 (2016) 110–118.
[28] D.Y. Kwon, J.S. Rhee, A simple and rapid colorimet-ric method for determination of free fatty acids for li-pase assay, J. Am. Oil Chem. Soc. 63 (1986) 89–92.
[29] C. Oldfield, Enzymes in Water-in-oil Microemul-sions (“Reversed Micelles”): Principles and Applica-tions, Biotechnol. Genet. Eng. Rev. 12 (1994) 255–327.
[30] M. Kaieda, T. Samukawa, A. Kondo, H. Fukuda, Effect of Methanol and water contents on production of bio-diesel fuel from plant oil catalyzed by various lipases in a solvent-free system, J. Biosci. Bioeng. 91 (2001) 12–15.
[31] M. van de Weert, J. Hoechstetter, W.E. Hennink, D.J.. Crommelin, The effect of a water/organic solvent in-terface on the structural stability of lysozyme, J. Con-trol. Release. 68 (2000) 351–359.
[32] H. Sah, Protein instability toward organic solvent/water emulsification: implications for protein micro-encapsulation into microspheres., PDA J. Pharm. Sci. Technol. 53 (1999) 3–10.
[33] I.M. Atadashi, M.K. Aroua, A.R. Abdul Aziz, N.M.N. Sulaiman, The effects of catalysts in biodiesel produc-tion: A review, J. Ind. Eng. Chem. 19 (2013) 14–26.