Embed Size (px)
Citation preview
* Corresponding author at: Tel.: +4790723929E-mail address: [email protected]
Please cite this article as: Ghoreishi S., Barth T., Derribsa H. Stirred and non-stirred lignin solvolysis with formic acid in aqueous and ethanolic solvent systems
at different levels of loading in a 5-L reactor. Biofuel Research Journal 21 (2019) 937-946. DOI: 10.18331/BRJ2019.6.1.5
Biofuel Research Journal 21 (2019) 937-946
Original Research Paper
Stirred and non-stirred lignin solvolysis with formic acid in aqueous and ethanolic solvent
systems at different levels of loading in a 5-L reactor
Solmaz Ghoreishi1,*, Tanja Barth1, Hailegebrel Derribsa2
1Department of Chemistry, University of Bergen, Norway, Allégaten 41, N-5007 Bergen, Norway.
2Mjøsvegen 6J, 2380 Brumunddal, Norway.
HIGHLIGHTS
Oil yields increased and char yields decreased with
a high loading in the reactor at stirred condition.
In comparison with water-based system, ethanol-
based system tended to give higher oil yields.
Oil yields decreased, more or less, with increasing
reaction temperature regardless of solvent type.
The bio-oils from ethanol-based experiments had
the highest H/C and O/C ratios.
The bio-oil composition produced in each solvent
system was quite stable and independent of other
reaction conditions.
GRAPHICAL ABSTRACT
ARTICLE INFO ABSTRACT
Article history:
Received 28 November 2018
Received in revised form 23 January 2019
Accepted 17 February 2019
Available online 1 March 2019
Keywords:
Lignin de-polymerization
Stabilization
Lignin-to-Liquid
5-L Scale
Stirring
Lignin polymer is biologically and chemically stable and requires highly vigorous conditions for de-polymerization, and
subsequent stabilization of the monomeric conversion products to prevent re-polymerization and char production. The Lignin-
to-Liquid (LtL) process is a solvolytic conversion of lignin with formic acid. Formic acid has been shown to both catalyze the
de-polymerization and supply hydrogen that stabilizes the de-polymerization products. In this paper, lignin from Eucalyptus
wood was used as the feedstock, and the LtL-process was performed in both aqueous and ethanolic solvent systems. The
experimental variables were different levels of loading in the reactor, stirred and non-stirred conditions, and different reaction
temperatures. The bio-oil consisted mostly of phenolic compounds, and the bio-oil yields differed with type of the solvent used,
level of loading in the reactor, stirring condition, and operating temperature. More than 55 wt.% of the lignin was recovered as
bio-oil at 320 °C at stirred conditions when the reactor was loaded at high level. Overall, the ethanolic solvent together with
maximum level of loading in the reactor under stirred condition resulted in the highest bio-oil yield. Elemental balance data for
bio-oil and char yields and the molecular composition of the bio-oils were also investigated using, respectively, elemental
analysis and GC-MS. Finally, principal component analysis was used as well to systematically explore the relationship between
the bio-oil and char yields and the reaction conditions. © 2019 BRTeam. All rights reserved.
Journal homepage: www.biofueljournal.com
Ghoreishi et al. / Biofuel Research Journal 21 (2019) 937-946
Please cite this article as: Ghoreishi S., Barth T., Derribsa H. Stirred and non-stirred lignin solvolysis with formic acid in aqueous and ethanolic solvent systems
at different levels of loading in a 5-L reactor. Biofuel Research Journal 21 (2019) 937-946. DOI: 10.18331/BRJ2019.6.1.5
1. Introduction
Environmental preservation is one of the major concerns in the 21st century.
Population growth, increasing living standards, increasing industrialization,
and the motorization of the world have led to a steep rise in energy and fossil fuel consumption. Excessive consumption of fossil fuels to fulfill the energy
demands has not only resulted in the depletion of the resources but also has
largely contributed to greenhouse gas (GHG) emissions and global warming (Nigam and Singh, 2011; Tanaka et al., 2012). Thus, it is necessary to develop
a bio-based economy, mainly based on renewable, sustainable, and
economically viable energy sources. Since there is no single solution to the challenges faced, there will be a need for combined actions, including changes
in behavior, changes in vehicle technology, expansion of public transport, and
introduction of innovative fuels and technologies (Cherubini, 2010; Singh et al., 2010; Haghighi Mood et al., 2013; Kim et al., 2013). Utilization of biomass
as a renewable and sustainable raw material for production of biofuels and other
value-added chemicals through a biorefinery approach has recently received a great deal of attention as a promising alternative to fossil resources (Cherubini
and Jungmeier, 2010; Bu et al., 2012; Kim et al., 2013). A biorefinery system
comprises optimal and sustainable use of the renewable resources where the
incoming raw material is completely converted into a range of products with
high values (Kleinert and Barth, 2008; Gasson et al., 2010; Oregui Bengoechea
et al., 2015). Emerging technologies for production of fuels from biomass have become
an important subject because of their potential environmental impacts.
Competition over biomass feedstocks as well as their different applications has been intensified because of increasing demands for biomass. Thus, to ensure
sustainable use of biomass, one needs to identify the most promising routes for
producing heat, power, fuels, and materials in terms of their technological, economic, and environmental performance (Gerber et al., 2011; Gerssen-
Gondelach et al., 2014). Biofuels, as an alternative to fossil fuels and a future
leading supply of energy, are believed to increase supply security, reduce vehicle emissions, and provide farmers with a steady income (Nigam and
Singh, 2011; Creutzig et al., 2015).
The greatest challenge faced in the biofuel arena is to produce renewable liquid fuels, which are suitable for use in motor vehicles. New fuels generated
from renewable sources should preferably be compatible with the existing
motor technology and infrastructure. This in fact facilitates direct substitution and mixing of conventional and renewable fuel types. Bioethanol produced
from edible sources of carbohydrates and biodiesel produced from edible
vegetable oils, are well-known examples of renewable and petroleum compatible first-generation biofuels. However, there are major challenges
associated with large-scale production of these first-generation biofuels such as
food vs. fuel conflicts, etc. Thus, much effort has been put into developing new processes for the production of second-generation biofuels from a variety of
non-edible resources such as lignocellulosic biomass (Kleinert and Barth,
2008). Lignocellulosic biomass is in fact considered as a suitable carbon raw
material for the synthesis of functional carbon materials. It is cheap, abundant
and does not negatively affect the human food supply chain (Zhang et al., 2011; Liu et al., 2015). Lignocellulosic biomass is a heterogeneous feedstock
composed of three principal components of different nature: cellulose, hemicelluloses, and lignin. Various types of biofuels and value-added
chemicals have been already produced from cellulose and hemicellulose, and
the technical feasibility of the processes involved have been well demonstrated. The third major consistent, i.e., lignin, is a cross-linked amorphous copolymer,
defined as a complex polyphenolic network of three basic phenylpropane
monomers (p-coumaryl alcohol, coniferyl alcohol, and sinapyl alcohol). Lignin as a feedstock has a significant potential for the production of bio-based
aromatic fuels and chemicals (Azadi et al., 2013; Løhre et al., 2016). Since, the
high cost of cellulosic ethanol has limited its market, it will be essential to develop an efficient and appropriate thermochemical method for conversion of
waste lignin streams into fuels and valuable bulk and specialty chemicals like
aromatics, phenols, aromatic ethers, vanillin, etc. However, there are still major challenges faced for the valorization of lignin to these valuable commodities
(Singh et al., 2014; Kristianto et al., 2017; Oregui Bengoechea et al., 2017).
Various methods have been, and are being, explored to develop high-yield processes for the conversion of lignin-rich residual materials to fuels and bulk
chemicals. One of such processes aimed at lignin valorization was reported by
Kleinert and Barth (2008), comprising simultaneous de-polymerization of the
lignin structures with subsequent hydro-deoxygenation of the lignin
monomers in a solvent with an in-situ hydrogen donor. This approach has
been termed as the Lignin-to-Liquid (LtL) process. It is in fact a
thermochemical solvolytic process performed in polar solvents such as
water and alcohols at high temperatures and high pressures. In the LtL process, formic acid is used as hydrogen donor, which is converted in situ
to molecular hydrogen and CO/CO2. The reaction product is a mixture of
monomeric alkylated phenols and aliphatic hydrocarbons, with a high H/C and a low O/C ratio. As shown by previous studies, the decomposition of
formic acid and the chemical reaction between lignin and formic acid are
competing reactions, and therefore, a formylation–elimination–hydrogenolysis mechanism for the formic acid aided lignin conversion has
been proposed (Kleinert et al., 2009; Oregui Bengoechea et al., 2015; Løhre
et al., 2017; Oregui Bengoechea et al., 2017). However, as highlighted in these works, optimization of such a process would be challenging and time-
consuming due to the interactions between different experimental
conditions. Nevertheless, there is ongoing research on this approach, and a number of papers have been published addressing subjects such as reaction
mechanisms (Holmelid et al., 2012; Oregui Bengoechea et al., 2017),
kinetic modelling (Gasson et al., 2012), and the effect of catalyst to increase
energy efficiency (Liguori and Barth, 2011; Oregui Bengoechea et al.,
2015). Most of the reported results have been obtained at small laboratory
scale though. In addition, upscaling is necessary to develop the process to industrial level and for the conversion needs to be optimized at larger
scales.
Therefore, the aim of this study is to evaluate the product yields and product composition of bio-oils through thermochemical conversion of
lignin at a 5-L pilot scale as a function of reaction parameters such as
solvent type, level of loading in the reactor, and reaction temperature under stirred and non-stirred conditions. In this study, lignin conversion was
investigated at two different temperatures (320 and 350 °C) using two
different reaction solvents (water and ethanol) by changing the stirring rate from 0 rpm to 400 rpm at different levels of loading in the reactor. For the
LtL-experiments carried out in this work, a fractional factorial design was
set up to determine the impacts of the experimental parameters on yields and product composition as well as to find the conditions leading to highest
oil yields and quality.
2. Materials and Methods
2.1. Chemicals
All reagents and solvents used in this experimental work were purchased
from Sigma Aldrich and were used without any further purification (≥98%). Ethanol, absolute prima, was purchased from Kemetyl Norway AS.
2.2. Feedstock characterization
The feedstock used in this work, herein termed as Eucalyptus lignin, was
a lignin rich residue isolated through the application of weak acid and enzymatic hydrolysis of Eucalyptus, at the Biorefinery Demo Plant (BDP)
located in Ӧrnskӧldsvik, Sweden. The lignin content of the feedstock
estimated from its elemental composition, was ∼ 50.1%. The ash content
of the feedstock was determined to be approximately 4.4% according to
protocol NREL/TP-510-42622 (Sluiter et al., 2008). The H/C and O/C
ratios of the feedstock also estimated through elemental analysis, were 1.41
and 0.59, respectively. The feedstock contained traces of cellulose and hemicellulose, which could explain the high value of the O/C ratio
compared to that of pure lignin.
Eucalyptus lignin was received as wet sample and was dried in an oven at 60 °C until constant weight before further grinding and sieving to a dry
powder of <500 μm particle size. The dried lignin powder was used as it
was without further purification.
2.3. Lignin to Liquid (LtL) experiments
2.3.1. Experimental set-up
Lignin (200 – 350 g), formic acid (244 – 427 g), and the solvent (500 –750 g of water or 394.5 – 690.4 g of ethanol) were added to a stirred 5.3 L
938
-
-
-
-
-
-
Ghoreishi et al. / Biofuel Research Journal 21 (2019) 937-946
Please cite this article as: Ghoreishi S., Barth T., Derribsa H. Stirred and non-stirred lignin solvolysis with formic acid in aqueous and ethanolic solvent systems
at different levels of loading in a 5-L reactor. Biofuel Research Journal 21 (2019) 937-946. DOI: 10.18331/BRJ2019.6.1.5
high-pressure autoclave reactor (ESTANIT GmbH). The autoclave was then
closed and heated to the desired temperatures (320 – 350 °C) with a stirring
rate of 0 – 400 rpm for a reaction time of 2 h. The heating time from room
temperature to the desired temperature (320 – 350 °C) ranged from 60 to 70
min, giving an approximate heating rate of 5 °C/min. Reaction time (2 h) was measured in addition to the heating period. The pressure and torque of the
stirrer were continuously monitored during the experiments.
The experimental conditions investigated are given in Table 1. The experiments are coded as shown below:
X.Y.Z-TX: Loading in the reactor; Y: Reaction solvent; Z: Stirring condition; T:
Reaction temperature
For instance;
L.W.S-320 indicating: Low level of loading Water as reaction solvent.
Stirred reaction at 320 °C.
Table 1.
Experimental conditions investigated in the LtL-process experiments.
Experiment*Lignin**
(g)
Formic
acid (g)
Water
(g)
EtOH
(g)
Stirrer
speed
(rpm)
Temperature
(°C)
L.W.S-320 191 244 500 ― 400 320
L.W.NS-320 191 244 500 ― 0 320
H.W.S-320 287 366 750 ― 400 320
H.W.NS-320 287 366 750 ― 0 320
L.W.S-350 191 244 500 ― 400 350
L.W.NS-350 191 244 500 ― 0 350
H.W.S-350 287 366 750 ― 400 350
H.W.NS-350 287 366 750 ― 0 350
L.Et.S-320 191 244 ― 394.5 400 320
L.Et.NS-320 191 244 ― 394.5 0 320
M.Et.S-320 335 427 ― 690.4 400 320
M.Et.NS-320 335 427 ― 690.4 0 320
L.Et.S-350 191 244 ― 394.5 400 350
L.Et.NS-350 191 244 ― 394.5 0 350
M.Et.S-350 335 427 ― 690.4 400 350
M.Et.NS-350 335 427 ― 690.4 0 350
* L: Low loading; H: High loading; M: Maximum loading; W: Water; Et: Ethanol; S: stirred;
NS: Non-stirred.
**: Lignin-enriched eucalyptus residue, measured on ash-free basis.
2.3.2. Work-up procedure
Upon the completion of the determined reaction time, the reactor heater was turned off and the reactor was cooled to the ambient temperature by flowing
cold water through the reactor’s cooling coil. The final products of the LtL-
process included a gas phase, a liquid phase, and a solid phase, containing both unreacted starting materials and the char produced during the conversion.
Nevertheless, based on the published literature, the bulk of the solid phase
produced under the given reaction conditions would be expected to be mainly in the form of char (Gasson et al., 2012). The produced gas was vented by
opening the gas-valve. Analysis of the gas composition was not performed as
a part of this study, but relevant data for the gas composition can be found in a previous work performed by our group (Oregui Bengoechea et al., 2015),
showing that the decomposition of formic acid was the source of the major part
of the gas produced. After the gas phase was vented, the reactor was opened and the liquid phase
was separated from the solid phase. In the water system, the liquid phase
consisted of a single aqueous phase while the LtL-oil was adsorbed to the
solid phase. The liquid phase was separated from the solid phase by opening
the valve on the container bottom. Then, the organic phase was extracted
by adding a solution of EtAc:THF (90:10) and subsequently, the solid phase
was filtered off.In the ethanol system, the liquid phase consisted of two immiscible
layers; a dark brown LtL-oil phase and a small clear ethanol/water phase.
The two layers were separated using the same work-up procedure as in the water system.
The extracted organic phase was dried over Na2SO4, while the solvent
and unreacted ethanol was removed from the LtL-oil using a rotary evaporator at 40 °C and 250 mbar (in the water system) and 175 mbar (in
the ethanol system) to yield a dark brown liquid. The final oil and solid
yields were determined by weight after solvent evaporation and drying,respectively. The mass balance was calculated as the sum of % oil and char
yield. The oil fraction was characterized by gas chromatography-mass
spectroscopy (GC-MS) and elemental analysis. The chars were characterized by elemental analysis.
2.4. Elemental analysis
All samples were analyzed for their elemental composition in the CHNS
mode with a Vario EL III instrument using helium as carrier gas. The amount of oxygen was calculated by difference.
2.5. GC–MS
The LtL-oil (1.0 mg) was dissolved in 1 mL ethyl
acetate:tetrahydrofuran (90:10) and the sample was analyzed using an Agilent Technologies 7890A GC-system with auto-sampler, coupled with
an Agilent 5977A MSD. The injection was run in splitless mode at 280 °C
(injector temperature) on a 30 m HP-5ms column with 250 μm ID and thickness of 0.25 μm from Agilent Technologies. The following GC-MS
instrumental conditions were applied:
Start temperature: 40 °C; Heating rate 1: 6 °C/min; Final temperature 1: 280 °C; Heating rate 2: 40 °C/min; Final temperature 2: 300 °C; Ion-source
temperature for MS: 250 °C; and Mass range: 50 – 400 u.
The GC–MS inter phase valve delay was set to 5 min and the MS detector was operated in positive mode at 70 eV. Compounds were
identified using the Enhanced MSD Chemstation software F.01.00.1903
and the NIST 2.0 library.
2.6. Experimental design
As mentioned earlier, for the LtL-experiments carried out in this work,
a fractional factorial design was set up. Experimental variables, which were
studied, were (1) level of loading in the reactor (the sum of input amountsof the reactants), (2) reaction solvent, (3) stirring condition, and (4) reaction
temperature. A high (+) and low (‒) value for the experimental variables
was selected for use in the design. The duration of the experiments was kept constant (2 h) in both reaction systems. A fractional factorial design (24-1)
which included a balanced half of all possible combinations of the variables was used to reduce the number of experiments required in each reaction
system. An overview of the experimental parameters is tabulated in Table
2.All the response factors, quantitative yields (% oil and % char), H/C and
O/C ratios, C recovery, H recovery, and O recovery from the design were
interpreted using principal component analysis (PCA) and Sirius 10.0 software. A biplot of a PCA reveals correlations between
loadings/descriptors and their potential association with the same properties
of an object. Loadings, which are projected close to each other with respect to the origin, are positively correlated, while loadings, which are projected
oppositely to each other, are negatively correlated. Loadings that have a
strong influence on the model will be projected far from the origin, and loadings with negligible or minor influence on the model will appear close
to the origin in the biplot (Carlson and Carlson, 2005).
In many cases, principal components are not the ideal latent variables. Partial Least Squares (PLS) regression analysis is a method that can
establish quantitative relations between two blocks of data, e.g., a block
consisting of descriptor data for a series of reaction systems and a block
939
-
Ghoreishi et al. / Biofuel Research Journal 21 (2019) 937-946
Please cite this article as: Ghoreishi S., Barth T., Derribsa H. Stirred and non-stirred lignin solvolysis with formic acid in aqueous and ethanolic solvent systems
at different levels of loading in a 5-L reactor. Biofuel Research Journal 21 (2019) 937-946. DOI: 10.18331/BRJ2019.6.1.5
consisting of response data measured on these systems (Carlson and Carlson,
2005). In line with that, such regression analysis was applied to each yield
variable in the data set.
Table 2.
Experimental details of the LtL-process experiments: Variable 1 (‒) = low loading (g), Variable
1 (+) = high or maximum loading, Variable 2 (-) = water, Variable 2 (+) = ethanol Variable 3 (‒)
= 0 rpm, Variable 3 (+) = 400 rpm, Variable 4 (‒) = 320 °C, Variable 4 (+) = 350 °C.
Experiment
Loading water-/ethanol-
system
(Lignin + solvent + FA
(g))
Solvent
type
Speed of
stirrer
(rpm)
Temperature
(°C)
L.W.S-320 (- - + -) 935 Water 400 320
L.W.NS-320 (- - - -) 935 Water 0 320
H.W.S-320 (+ - + -) 1403 Water 400 320
H.W.NS-320 (+ - - -) 1403 Water 0 320
L.W.S-350 (- - + +) 935 Water 400 350
L.W.NS-350 (- - - +) 935 Water 0 350
H.W.S-350 (+ - + +) 1403 Water 400 350
H.W.NS-350 (+ - - +) 1403 Water 0 350
L.Et.S-320 (- + + -) 830 Ethanol 400 320
L.Et.NS-320 (- + - -) 830 Ethanol 0 320
M.Et.S-320 (+ + + -) 1452 Ethanol 400 320
M.Et.NS-320 (+ + - -) 1452 Ethanol 0 320
L.Et.S-350 (- + + +) 830 Ethanol 400 350
L.Et.NS-350 (- + - +) 830 Ethanol 0 350
M.Et.S-350 (+ + + +) 1452 Ethanol 400 350
M.Et.NS-350 (+ + - +) 1452 Ethanol 0 350
3. Results and Discussion
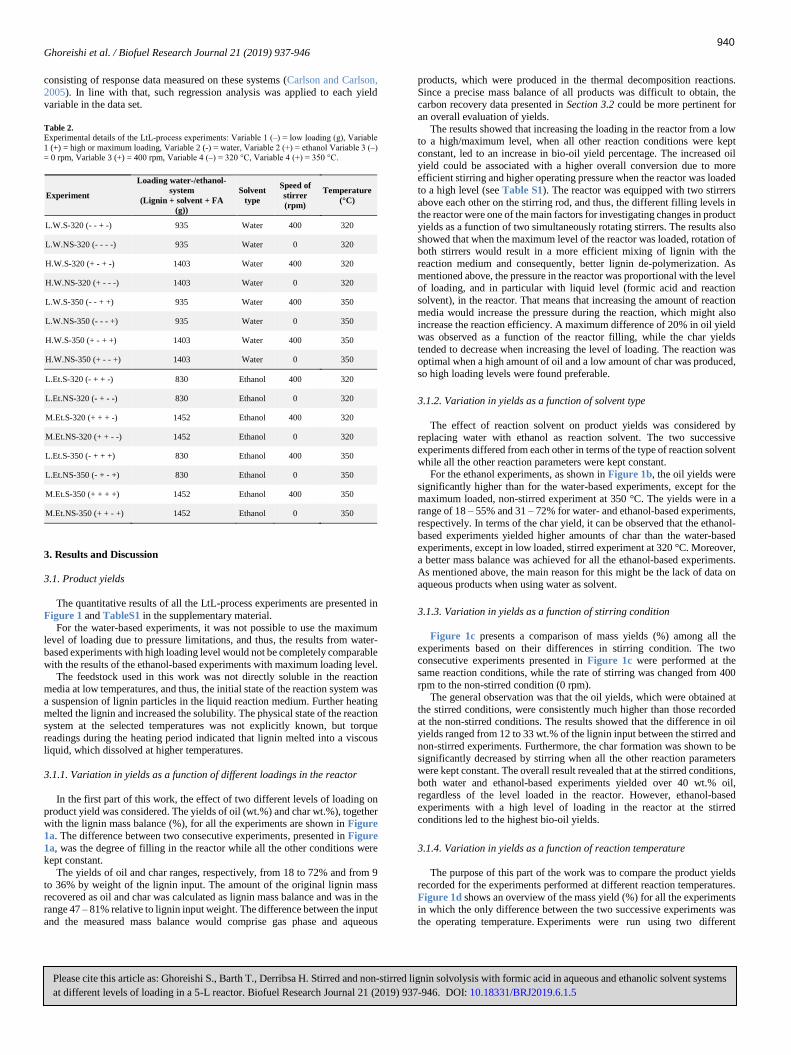
3.1. Product yields
The quantitative results of all the LtL-process experiments are presented in
Figure 1 and TableS1 in the supplementary material.
For the water-based experiments, it was not possible to use the maximum level of loading due to pressure limitations, and thus, the results from water-
based experiments with high loading level would not be completely comparable
with the results of the ethanol-based experiments with maximum loading level.The feedstock used in this work was not directly soluble in the reaction
media at low temperatures, and thus, the initial state of the reaction system was
a suspension of lignin particles in the liquid reaction medium. Further heating melted the lignin and increased the solubility. The physical state of the reaction
system at the selected temperatures was not explicitly known, but torque
readings during the heating period indicated that lignin melted into a viscous
liquid, which dissolved at higher temperatures.
3.1.1. Variation in yields as a function of different loadings in the reactor
In the first part of this work, the effect of two different levels of loading on
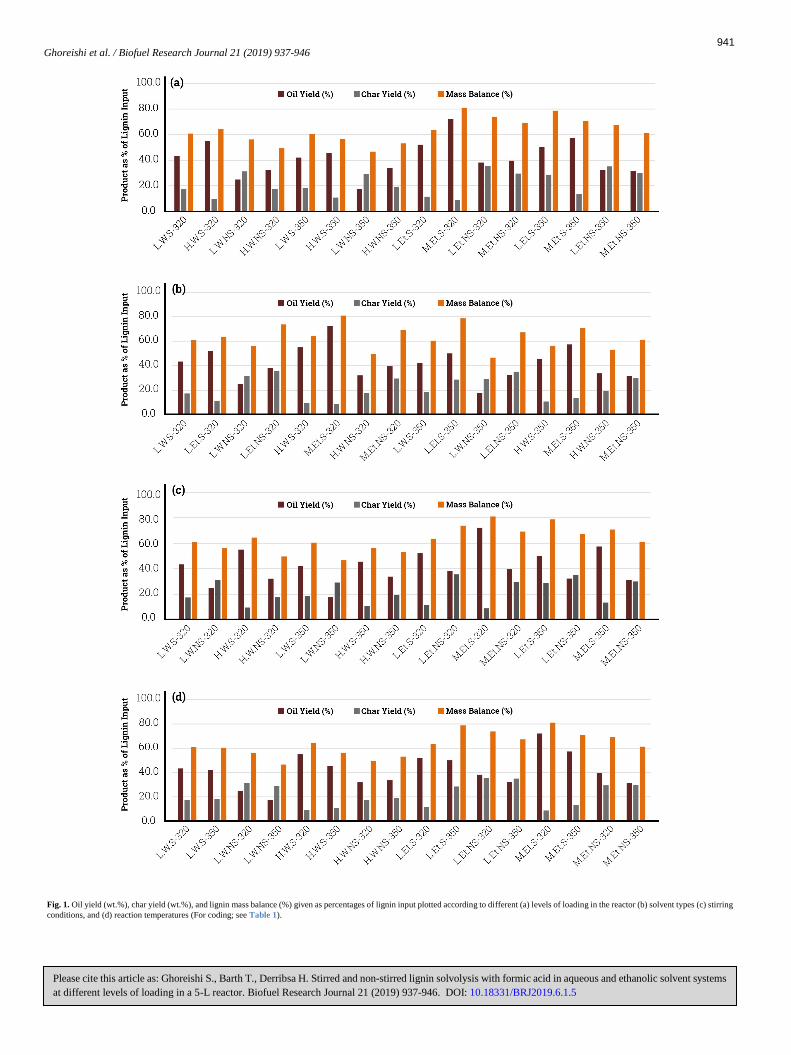
product yield was considered. The yields of oil (wt.%) and char wt.%), together with the lignin mass balance (%), for all the experiments are shown in Figure
1a. The difference between two consecutive experiments, presented in Figure
1a, was the degree of filling in the reactor while all the other conditions werekept constant.
The yields of oil and char ranges, respectively, from 18 to 72% and from 9
to 36% by weight of the lignin input. The amount of the original lignin mass recovered as oil and char was calculated as lignin mass balance and was in the
range 47 – 81% relative to lignin input weight. The difference between the input
and the measured mass balance would comprise gas phase and aqueous
products, which were produced in the thermal decomposition reactions.
Since a precise mass balance of all products was difficult to obtain, the
carbon recovery data presented in Section 3.2 could be more pertinent for
an overall evaluation of yields.
The results showed that increasing the loading in the reactor from a low to a high/maximum level, when all other reaction conditions were kept
constant, led to an increase in bio-oil yield percentage. The increased oil
yield could be associated with a higher overall conversion due to more efficient stirring and higher operating pressure when the reactor was loaded
to a high level (see Table S1). The reactor was equipped with two stirrers
above each other on the stirring rod, and thus, the different filling levels in the reactor were one of the main factors for investigating changes in product
yields as a function of two simultaneously rotating stirrers. The results also
showed that when the maximum level of the reactor was loaded, rotation of both stirrers would result in a more efficient mixing of lignin with the
reaction medium and consequently, better lignin de-polymerization. As
mentioned above, the pressure in the reactor was proportional with the level of loading, and in particular with liquid level (formic acid and reaction
solvent), in the reactor. That means that increasing the amount of reaction
media would increase the pressure during the reaction, which might also
increase the reaction efficiency. A maximum difference of 20% in oil yield
was observed as a function of the reactor filling, while the char yields
tended to decrease when increasing the level of loading. The reaction wasoptimal when a high amount of oil and a low amount of char was produced,
so high loading levels were found preferable.
3.1.2. Variation in yields as a function of solvent type
The effect of reaction solvent on product yields was considered by replacing water with ethanol as reaction solvent. The two successive
experiments differed from each other in terms of the type of reaction solvent
while all the other reaction parameters were kept constant.For the ethanol experiments, as shown in Figure 1b, the oil yields were
significantly higher than for the water-based experiments, except for the
maximum loaded, non-stirred experiment at 350 °C. The yields were in a range of 18 – 55% and 31 – 72% for water- and ethanol-based experiments,
respectively. In terms of the char yield, it can be observed that the ethanol-
based experiments yielded higher amounts of char than the water-based experiments, except in low loaded, stirred experiment at 320 °C. Moreover,
a better mass balance was achieved for all the ethanol-based experiments.
As mentioned above, the main reason for this might be the lack of data on aqueous products when using water as solvent.
3.1.3. Variation in yields as a function of stirring condition
Figure 1c presents a comparison of mass yields (%) among all the
experiments based on their differences in stirring condition. The two consecutive experiments presented in Figure 1c were performed at the
same reaction conditions, while the rate of stirring was changed from 400
rpm to the non-stirred condition (0 rpm).The general observation was that the oil yields, which were obtained at
the stirred conditions, were consistently much higher than those recorded at the non-stirred conditions. The results showed that the difference in oil
yields ranged from 12 to 33 wt.% of the lignin input between the stirred and
non-stirred experiments. Furthermore, the char formation was shown to be significantly decreased by stirring when all the other reaction parameters
were kept constant. The overall result revealed that at the stirred conditions,
both water and ethanol-based experiments yielded over 40 wt.% oil,regardless of the level loaded in the reactor. However, ethanol-based
experiments with a high level of loading in the reactor at the stirred
conditions led to the highest bio-oil yields.
3.1.4. Variation in yields as a function of reaction temperature
The purpose of this part of the work was to compare the product yields
recorded for the experiments performed at different reaction temperatures.
Figure 1d shows an overview of the mass yield (%) for all the experiments in which the only difference between the two successive experiments was
the operating temperature. Experiments were run using two different
940
Please cite this article as: Ghoreishi S., Barth T., Derribsa H. Stirred and non-stirred lignin solvolysis with formic acid in aqueous and ethanolic solvent systems
at different levels of loading in a 5-L reactor. Biofuel Research Journal 21 (2019) 937-946. DOI: 10.18331/BRJ2019.6.1.5
Fig. 1. Oil yield (wt.%), char yield (wt.%), and lignin mass balance (%) given as percentages of lignin input plotted according to different (a) levels of loading in the reactor (b) solvent types (c) stirring
conditions, and (d) reaction temperatures (For coding; see Table 1).
941Ghoreishi et al. / Biofuel Research Journal 21 (2019) 937-946
Ghoreishi et al. / Biofuel Research Journal 21 (2019) 937-946
Please cite this article as: Ghoreishi S., Barth T., Derribsa H. Stirred and non-stirred lignin solvolysis with formic acid in aqueous and ethanolic solvent systems
at different levels of loading in a 5-L reactor. Biofuel Research Journal 21 (2019) 937-946. DOI: 10.18331/BRJ2019.6.1.5
temperatures (320 and 350 °C), while all the other reaction parameters were
kept constant.
The results showed a trend of slightly decreasing oil yields with temperature.
The decreasing trend was more marked in the experiments performed at the
stirred conditions with a high level of loading in the reactor. The char yields were not significantly influenced by the reaction temperature, showing a slight
increase by elevating the temperature from 320 °C to 350 °C. The trends of the
results obtained for the two solvent systems were quite similar at both temperatures. The experiments performed at 320 °C with high level of filling
in the reactor under the stirred conditions led to over 55 wt.% oil regardless of
the solvent type.
3.2. Elemental analysis and carbon balance
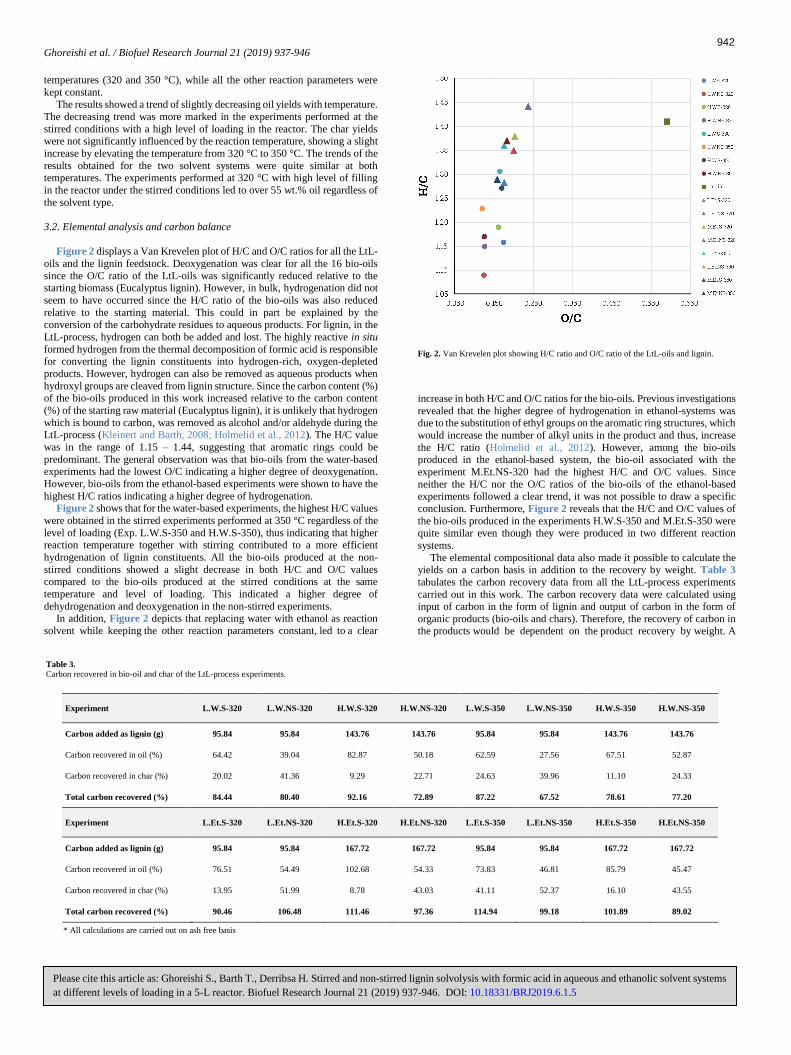
Figure 2 displays a Van Krevelen plot of H/C and O/C ratios for all the LtL-
oils and the lignin feedstock. Deoxygenation was clear for all the 16 bio-oils
since the O/C ratio of the LtL-oils was significantly reduced relative to the starting biomass (Eucalyptus lignin). However, in bulk, hydrogenation did not
seem to have occurred since the H/C ratio of the bio-oils was also reduced
relative to the starting material. This could in part be explained by the
conversion of the carbohydrate residues to aqueous products. For lignin, in the
LtL-process, hydrogen can both be added and lost. The highly reactive in situ
formed hydrogen from the thermal decomposition of formic acid is responsible for converting the lignin constituents into hydrogen-rich, oxygen-depleted
products. However, hydrogen can also be removed as aqueous products when
hydroxyl groups are cleaved from lignin structure. Since the carbon content (%) of the bio-oils produced in this work increased relative to the carbon content
(%) of the starting raw material (Eucalyptus lignin), it is unlikely that hydrogen
which is bound to carbon, was removed as alcohol and/or aldehyde during the LtL-process (Kleinert and Barth, 2008; Holmelid et al., 2012). The H/C value
was in the range of 1.15 – 1.44, suggesting that aromatic rings could be
predominant. The general observation was that bio-oils from the water-based experiments had the lowest O/C indicating a higher degree of deoxygenation.
However, bio-oils from the ethanol-based experiments were shown to have the
highest H/C ratios indicating a higher degree of hydrogenation.Figure 2 shows that for the water-based experiments, the highest H/C values
were obtained in the stirred experiments performed at 350 °C regardless of the
level of loading (Exp. L.W.S-350 and H.W.S-350), thus indicating that higher reaction temperature together with stirring contributed to a more efficient
hydrogenation of lignin constituents. All the bio-oils produced at the non-
stirred conditions showed a slight decrease in both H/C and O/C values compared to the bio-oils produced at the stirred conditions at the same
temperature and level of loading. This indicated a higher degree of
dehydrogenation and deoxygenation in the non-stirred experiments.In addition, Figure 2 depicts that replacing water with ethanol as reaction
solvent while keeping the other reaction parameters constant, led to a clear
Fig. 2. Van Krevelen plot showing H/C ratio and O/C ratio of the LtL-oils and lignin.
increase in both H/C and O/C ratios for the bio-oils. Previous investigations
revealed that the higher degree of hydrogenation in ethanol-systems wasdue to the substitution of ethyl groups on the aromatic ring structures, which
would increase the number of alkyl units in the product and thus, increase
the H/C ratio (Holmelid et al., 2012). However, among the bio-oils produced in the ethanol-based system, the bio-oil associated with the
experiment M.Et.NS-320 had the highest H/C and O/C values. Since
neither the H/C nor the O/C ratios of the bio-oils of the ethanol-based experiments followed a clear trend, it was not possible to draw a specific
conclusion. Furthermore, Figure 2 reveals that the H/C and O/C values of
the bio-oils produced in the experiments H.W.S-350 and M.Et.S-350 were
quite similar even though they were produced in two different reaction
systems.
The elemental compositional data also made it possible to calculate the yields on a carbon basis in addition to the recovery by weight. Table 3
tabulates the carbon recovery data from all the LtL-process experiments
carried out in this work. The carbon recovery data were calculated using input of carbon in the form of lignin and output of carbon in the form of
organic products (bio-oils and chars). Therefore, the recovery of carbon in the products would be dependent on the product recovery by weight. A
Experiment L.W.S-320 L.W.NS-320 H.W.S-320 H.W.NS-320 L.W.S-350 L.W.NS-350 H.W.S-350 H.W.NS-350
Carbon added as lignin (g) 95.84 95.84 143.76 143.76 95.84 95.84 143.76 143.76
Carbon recovered in oil (%) 64.42 39.04 82.87 50.18 62.59 27.56 67.51 52.87
Carbon recovered in char (%) 20.02 41.36 9.29 22.71 24.63 39.96 11.10 24.33
Total carbon recovered (%) 84.44 80.40 92.16 72.89 87.22 67.52 78.61 77.20
Experiment L.Et.S-320 L.Et.NS-320 H.Et.S-320 H.Et.NS-320 L.Et.S-350 L.Et.NS-350 H.Et.S-350 H.Et.NS-350
Carbon added as lignin (g) 95.84 95.84 167.72 167.72 95.84 95.84 167.72 167.72
Carbon recovered in oil (%) 76.51 54.49 102.68 54.33 73.83 46.81 85.79 45.47
Carbon recovered in char (%) 13.95 51.99 8.78 43.03 41.11 52.37 16.10 43.55
Total carbon recovered (%) 90.46 106.48 111.46 97.36 114.94 99.18 101.89 89.02
* All calculations are carried out on ash free basis
Table 3.
Carbon recovered in bio-oil and char of the LtL-process experiments.
942
Please cite this article as: Ghoreishi S., Barth T., Derribsa H. Stirred and non-stirred lignin solvolysis with formic acid in aqueous and ethanolic solvent systems
at different levels of loading in a 5-L reactor. Biofuel Research Journal 21 (2019) 937-946. DOI: 10.18331/BRJ2019.6.1.5
943
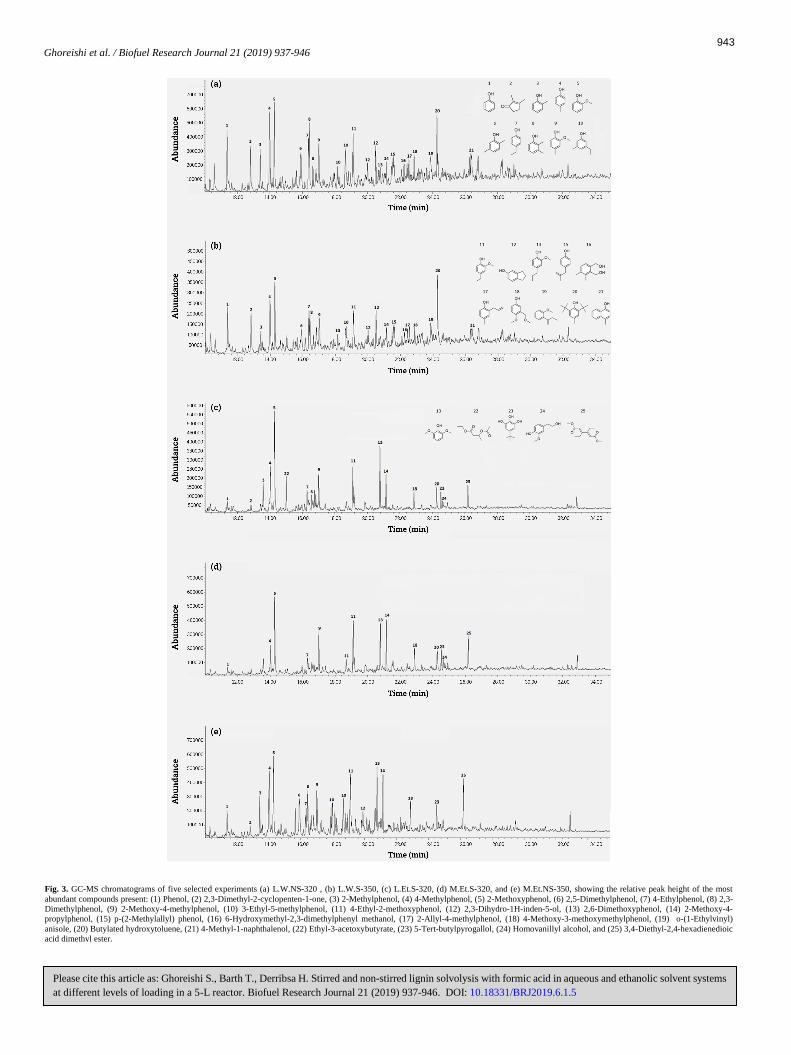
Fig. 3. GC-MS chromatograms of five selected experiments (a) L.W.NS-320 , (b) L.W.S-350, (c) L.Et.S-320, (d) M.Et.S-320, and (e) M.Et.NS-350, showing the relative peak height of the most
abundant compounds present: (1) Phenol, (2) 2,3-Dimethyl-2-cyclopenten-1-one, (3) 2-Methylphenol, (4) 4-Methylphenol, (5) 2-Methoxyphenol, (6) 2,5-Dimethylphenol, (7) 4-Ethylphenol, (8) 2,3-
Dimethylphenol, (9) 2-Methoxy-4-methylphenol, (10) 3-Ethyl-5-methylphenol, (11) 4-Ethyl-2-methoxyphenol, (12) 2,3-Dihydro-1H-inden-5-ol, (13) 2,6-Dimethoxyphenol, (14) 2-Methoxy-4-
propylphenol, (15) p-(2-Methylallyl) phenol, (16) 6-Hydroxymethyl-2,3-dimethylphenyl methanol, (17) 2-Allyl-4-methylphenol, (18) 4-Methoxy-3-methoxymethylphenol, (19) o-(1-Ethylvinyl)
anisole, (20) Butylated hydroxytoluene, (21) 4-Methyl-1-naphthalenol, (22) Ethyl-3-acetoxybutyrate, (23) 5-Tert-butylpyrogallol, (24) Homovanillyl alcohol, and (25) 3,4-Diethyl-2,4-hexadienedioic
acid dimethyl ester.
Ghoreishi et al. / Biofuel Research Journal 21 (2019) 937-946
Ghoreishi et al. / Biofuel Research Journal 21 (2019) 937-946
Please cite this article as: Ghoreishi S., Barth T., Derribsa H. Stirred and non-stirred lignin solvolysis with formic acid in aqueous and ethanolic solvent systems
at different levels of loading in a 5-L reactor. Biofuel Research Journal 21 (2019) 937-946. DOI: 10.18331/BRJ2019.6.1.5
major source of uncertainty was the lack of data for aqueous products and gases
produced from the lignin. However, unpublished results suggested that the
aqueous products were methanol, short chain organic acids, furfural from
carbohydrate residues, etc. The recovery figures were thus most useful for
comparative use. Calculations showed a carbon recovery ranging from 68to 92% for the water-based experiments, and a carbon recovery ranging from
89 to 115% for the ethanol based experiments. The incorporation of ethyl
groups from ethanol contributed to the high carbon recovery compared to the lignin carbon input in the products of the ethanol-based experiments.
Furthermore, a higher amount of carbon was recovered in the stirred
experiments compared to the non-stirred ones (except Exp. L.Et.S-320) which may be explained by increased gasification at non-stirred conditions due to high
temperature at the reactor walls above the solvent level. There was no clear
trend showing reduction or increase in carbon recovery, neither with the level of loading in the reactor nor when the reaction temperature was changed. The
elemental composition of all the bio-oil and char samples, including H/C and
O/C ratios, are presented in Table S2.
3.3. Molecular composition of bio-oils identified with GC–MS
The LtL-oils comprised a complex mixture of phenolic compounds. Figure
3 shows the chromatograms of five selected bio-oils. The volatile monomeric
phenols were identified using GC-MS library search. The chromatograms presented in Figure 3 show that the composition of the bio-oils were quite
similar in different oil samples from the same solvent system, while the
abundance of each component varied when the other reaction conditions werechanged. However, the compositional differences were more significant when
comparing oils from the water- and ethanol-based systems (Figs. 3a and b vs.
Figs. 3c, d , and e).A general observation was that 2-Methoxyphenol (Guaiacol) was the most
abundant compound in almost all of the chromatograms depicted in Figure 3,
while the proportion of the other compounds varied relative to this compound in the bio-oils produced at different reaction conditions. The GC-MS
chromatograms depicted in Figure 3a and b indicate that the bio-oils produced
in the water-based system, consisted mainly of alkylated phenols in high concentrations. More specifically, phenol, 2,3-dimethyl-2-cyclopenten-1-one,
methyl- and ethylphenol, guaiacol, allylphenol, and butylated hydroxytoluene
were the most abundant compounds identified. Identification of the most abundant peaks in the chromatograms related to the ethanol-based experiments
showed a higher amount of methoxy-substituted phenols such as 2,6-
dimethoxyphenol, 2-methoxy-4-propylphenol, 4-methoxy-3-methoxymethylphenol, and 5-tert-butylpyrogallol, corresponding to a
significantly higher O/C ratio (Figure 2) and a higher average molecular
weight in the oils obtained from this solvent system compared to the bio-oils associated with the water-based system. 3,4-diethyl-2,4-hexadienedioic acid
dimethyl ester was also one of the most abundant compounds in bio-oils
generated in the ethanol-based system which was possibly a condensations product of the ethanol in the reaction solvent.
The lower content of oxygen in the bio-oils of the water-based system
resulted in lower O/C ratios of the oils, corroborating the results of theelemental analysis (Figure 2), while the higher degree of alkyl-substitution in
the oils generated in the water-based system did not result in higher H/C ratioscompared to the bio-oils of the ethanol-based system. This could be explained
by the fact that only the volatile fraction of the bio-oils could be analyzed by
GC-MS, and since the composition of the heavier portion of the oils wasunknown, it was not possible to have a specific conclusion when it came to H/C
ratio.
Water as a solvent is undoubtedly cheaper and more readily available relative to ethanol. However, in the LtL-process, ethanol has been found to be
better suited as reaction solvent since it could act both as a solvent and as a
reactant (Holmelid et al., 2012). Products produced in ethanol-based experiments were considered to be more useful in large-scale production of bio-
oils and/or chemicals. Therefore, ethanol appeared to be more economically
viable in terms of industrial investment in product quality and application. One may also propose isopropanol as solvent. However, since isopropanol is even
more expensive than ethanol, it does not seem to be economically beneficial.
3.4. Principal component analysis (PCA)
In the defined experimental setup presented in Table 2, the following
parameters were studied: oil yield (%), char yield (%), H/C ratio and O/C
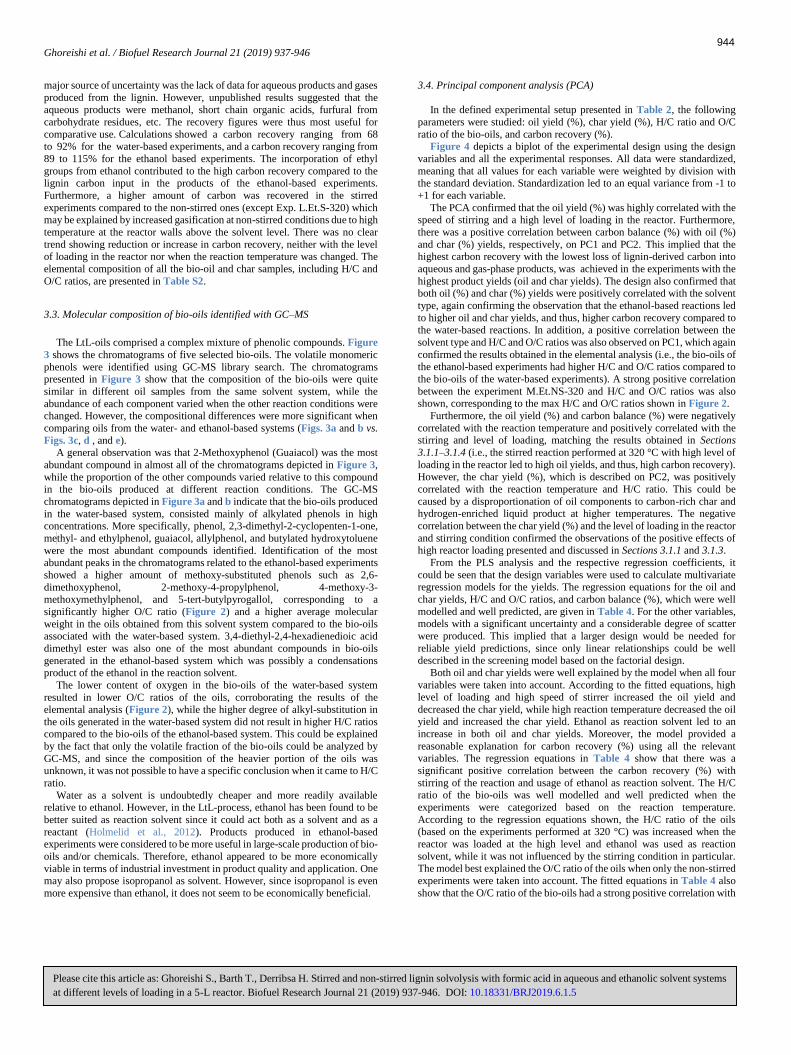
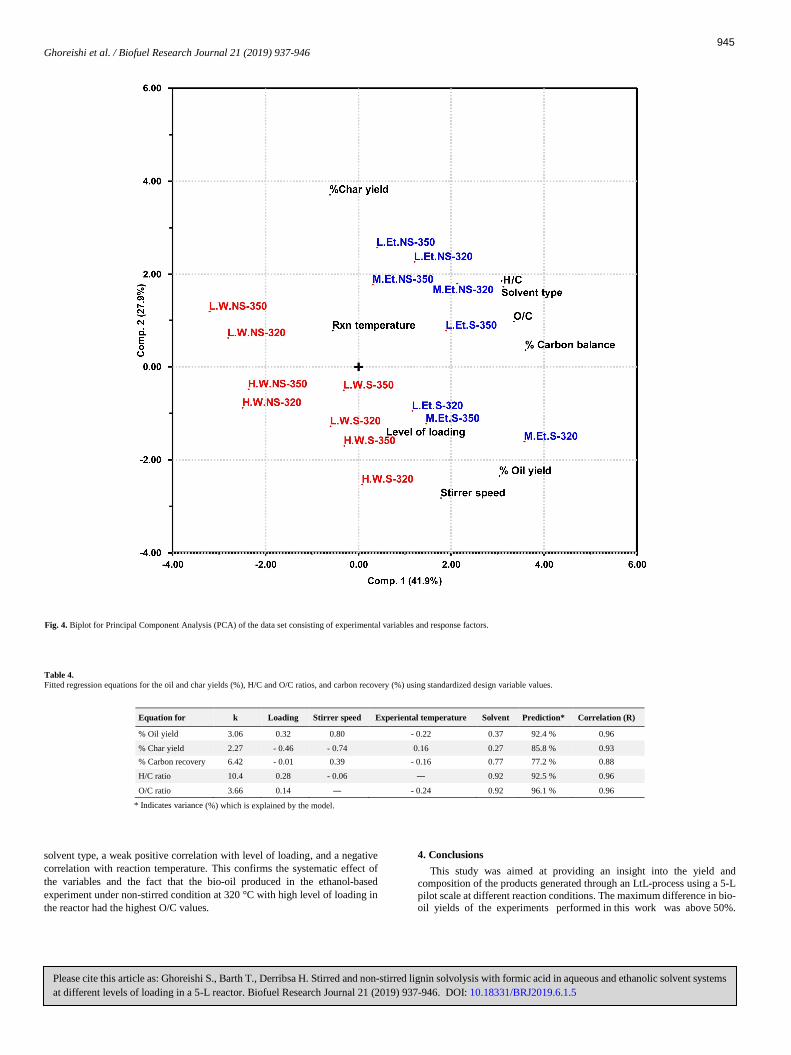
ratio of the bio-oils, and carbon recovery (%).Figure 4 depicts a biplot of the experimental design using the design
variables and all the experimental responses. All data were standardized,
meaning that all values for each variable were weighted by division with the standard deviation. Standardization led to an equal variance from -1 to
+1 for each variable.
The PCA confirmed that the oil yield (%) was highly correlated with the speed of stirring and a high level of loading in the reactor. Furthermore,
there was a positive correlation between carbon balance (%) with oil (%)
and char (%) yields, respectively, on PC1 and PC2. This implied that the highest carbon recovery with the lowest loss of lignin-derived carbon into
aqueous and gas-phase products, was achieved in the experiments with the
highest product yields (oil and char yields). The design also confirmed that both oil (%) and char (%) yields were positively correlated with the solvent
type, again confirming the observation that the ethanol-based reactions led
to higher oil and char yields, and thus, higher carbon recovery compared to
the water-based reactions. In addition, a positive correlation between the
solvent type and H/C and O/C ratios was also observed on PC1, which again
confirmed the results obtained in the elemental analysis (i.e., the bio-oils of the ethanol-based experiments had higher H/C and O/C ratios compared to
the bio-oils of the water-based experiments). A strong positive correlation
between the experiment M.Et.NS-320 and H/C and O/C ratios was also shown, corresponding to the max H/C and O/C ratios shown in Figure 2.
Furthermore, the oil yield (%) and carbon balance (%) were negatively
correlated with the reaction temperature and positively correlated with the stirring and level of loading, matching the results obtained in Sections
3.1.1–3.1.4 (i.e., the stirred reaction performed at 320 °C with high level of
loading in the reactor led to high oil yields, and thus, high carbon recovery). However, the char yield (%), which is described on PC2, was positively
correlated with the reaction temperature and H/C ratio. This could be
caused by a disproportionation of oil components to carbon-rich char and hydrogen-enriched liquid product at higher temperatures. The negative
correlation between the char yield (%) and the level of loading in the reactor
and stirring condition confirmed the observations of the positive effects of high reactor loading presented and discussed in Sections 3.1.1 and 3.1.3.
From the PLS analysis and the respective regression coefficients, it
could be seen that the design variables were used to calculate multivariate regression models for the yields. The regression equations for the oil and
char yields, H/C and O/C ratios, and carbon balance (%), which were well
modelled and well predicted, are given in Table 4. For the other variables, models with a significant uncertainty and a considerable degree of scatter
were produced. This implied that a larger design would be needed for
reliable yield predictions, since only linear relationships could be well described in the screening model based on the factorial design.
Both oil and char yields were well explained by the model when all four
variables were taken into account. According to the fitted equations, high level of loading and high speed of stirrer increased the oil yield and
decreased the char yield, while high reaction temperature decreased the oil yield and increased the char yield. Ethanol as reaction solvent led to an
increase in both oil and char yields. Moreover, the model provided a
reasonable explanation for carbon recovery (%) using all the relevant variables. The regression equations in Table 4 show that there was a
significant positive correlation between the carbon recovery (%) with
stirring of the reaction and usage of ethanol as reaction solvent. The H/C ratio of the bio-oils was well modelled and well predicted when the
experiments were categorized based on the reaction temperature.
According to the regression equations shown, the H/C ratio of the oils (based on the experiments performed at 320 °C) was increased when the
reactor was loaded at the high level and ethanol was used as reaction
solvent, while it was not influenced by the stirring condition in particular. The model best explained the O/C ratio of the oils when only the non-stirred
experiments were taken into account. The fitted equations in Table 4 also
show that the O/C ratio of the bio-oils had a strong positive correlation with
944
Ghoreishi et al. / Biofuel Research Journal 21 (2019) 937-946
Please cite this article as: Ghoreishi S., Barth T., Derribsa H. Stirred and non-stirred lignin solvolysis with formic acid in aqueous and ethanolic solvent systems
at different levels of loading in a 5-L reactor. Biofuel Research Journal 21 (2019) 937-946. DOI: 10.18331/BRJ2019.6.1.5
solvent type, a weak positive correlation with level of loading, and a negative
correlation with reaction temperature. This confirms the systematic effect of
the variables and the fact that the bio-oil produced in the ethanol-based
experiment under non-stirred condition at 320 °C with high level of loading in
the reactor had the highest O/C values.
4. Conclusions
This study was aimed at providing an insight into the yield and
composition of the products generated through an LtL-process using a 5-L
pilot scale at different reaction conditions. The maximum difference in bio-oil yields of the experiments performed in this work was above 50%.
Equation for k Loading Stirrer speed Experiental temperature Solvent Prediction* Correlation (R)
% Oil yield 3.06 0.32 0.80 - 0.22 0.37 92.4 % 0.96
% Char yield 2.27 - 0.46 - 0.74 0.16 0.27 85.8 % 0.93
% Carbon recovery 6.42 - 0.01 0.39 - 0.16 0.77 77.2 % 0.88
O/C ratio 3.66 0.14 ― - 0.24 0.92 96.1 % 0.96
* Indicates variance (%) which is explained by the model.
Table 4.
Fitted regression equations for the oil and char yields (%), H/C and O/C ratios, and carbon recovery (%) using standardized design variable values.
945
Fig. 4. Biplot for Principal Component Analysis (PCA) of the data set consisting of experimental variables and response factors.
H/C ratio 10.4 0.28 - 0.06 ― 0.92 92.5 % 0.96
Ghoreishi et al. / Biofuel Research Journal 21 (2019) 937-946
[1] Azadi, P., Inderwildi, O.R., Farnood, R., King, D.A., 2013. Liquid fuels,
hydrogen and chemicals from lignin: a critical review. Renew. Sust.
Energy Rev. 21, 506-523. [2] Bu, Q., Lei, H., Zacher, A.H., Wang, L., Ren, S., Liang, J., Wei, Y., Liu,
Y., Tang, J., Zhang, Q., Ruan, R., 2012. A review of catalytic
hydrodeoxygenation of lignin-derived phenols from biomass pyrolysis. Bioresour. Technol. 124, 470-477.
[3] Carlson, R., Carlson, J.E., 2005. Design and optimization in organic
synthesis. Elsevier, Amsterdam, The Netherlands. 24. [4] Cherubini, F., 2010. The biorefinery concept: using biomass instead of
oil for producing energy and chemicals. Energy Convers. Manage.
51(7), 1412-1421. [5] Cherubini, F., Jungmeier, G., 2010. LCA of a biorefinery concept
producing bioethanol, bioenergy, and chemicals from switchgrass. Int.
J. Life Cycle Assess. 15(1), 53-66. [6] Creutzig, F., Ravindranath, N.H., Berndes, G., Bolwig, S., Bright, R.,
Cherubini, F., Chum, H., Corbera, E., Delucchi, M., Faaji, A., Fargione,
J., Haberl, H., Heath, G., Lucon, O., Pelvin, R., Popp, A., Robledo-Abad, C., Rose, S., Smith, P., Stormmans, A., Suh, S., Masera, O., 2015.
Bioenergy and climate change mitigation: an assessment. GCB
Bioenergy. 7(5), 916-944. [7] Gasson, J.R., Kleinert, M., Barth, T., Forchheim, D., Sahin, E., Kruse,
A., Eide, I., 2010. Lignin solvolysis: upscaling of the Lignin-to-Liquid conversion process towards technical applicability. The 18th European
Biomass Conference and Exhibition, Lyon, France. 3-12.
[8] Gasson, J.R., Forchheim, D., Sutter, T., Hornung, U., Kruse, A., Barth, T., 2012. Modeling the lignin degradation kinetics in an ethanol/formic
acid solvolysis approach. part 1. kinetic model development. Ind. Eng.
Chem. Res. 51(32), 10595-10606. [9] Gerber, L., Gassner, M., Maréchal, F., 2011. Systematic integration of
LCA in process systems design: application to combined fuel and
electricity production from lignocellulosic biomass. Comput. Chem. Eng. 35(7), 1265-1280.
[10] Gerssen-Gondelach, S.J., Saygin, D., Wicke, B., Patel, M.K., Faaij,
A.P.C., 2014. Competing uses of biomass: assessment and comparison of the performance of bio-based heat, power, fuels and materials.
Renew. Sust. Energy Rev. 40, 964-998.
[11] Holmelid, B., Kleinert, M., Barth, T., 2012. Reactivity and reaction pathways in thermochemical treatment of selected lignin-like model
compounds under hydrogen rich conditions. J. Anal. Appl. Pyrolysis.
98, 37-44.
[12] Kim, J.Y., Oh, S., Hwang, H., Cho, T.S., Choi, I.G., Choi, J.W.,
2013. Effects of various reaction parameters on solvolytical
depolymerization of lignin in sub- and supercritical ethanol.
Chemosphere. 93(9), 1755-1764.
[13] Kleinert, M., Barth, T., 2008. Towards a lignincellulosic biorefinery: direct one-step conversion of lignin to hydrogen-
enriched biofuel. Energy Fuels. 22(2), 1371-1379.
[14] Kleinert, M., Gasson, J.R., Barth, T., 2009. Optimizing solvolysis conditions for integrated depolymerisation and hydrodeoxygenation
of lignin to produce liquid biofuel. J. Anal. Appl. Pyrolysis. 85(1-2),
108-117. [15] Kristianto, I., Limarta, S.O., Lee, H., Ha, J.M., Suh, D.J., Jae, J.,
2017. Effective depolymerization of concentrated acid hydrolysis
lignin using a carbon-supported ruthenium catalyst in ethanol/formic acid media. Bioresour. Technol. 234, 424-431.
[16] Liguori, L., Barth, T., 2011. Palladium-Nafion SAC-13 catalysed
depolymerisation of lignin to phenols in formic acid and water. J. Anal. Appl. Pyrolysis. 92(2), 477-484.
[17] Liu, W.J., Jiang, H., Yu, H.Q., 2015. Thermochemical conversion
of lignin to functional materials: a review and future directions.
Green Chem. 17(11), 4888-4907.
[18] Løhre, C., Barth, T., Kleinert, M., 2016. The effect of solvent and
input material pretreatment on product yield and composition of bio-oils from lignin solvolysis. J. Anal. Appl. Pyrolysis. 119, 208-216.
[19] Løhre, C., Kleinert, M., Barth, T., 2017. Organosolv extraction of
softwood combined with lignin-to-liquid solvolysis as a semi-continuous percolation reactor. Biomass Bioenergy. 99, 147-155.
[20] Mood, S.H., Golfeshan, A.H., Tabatabaei, M., Jouzani, G.S., Najafi,
G.H., Gholami, M., Ardjmand, M., 2013. Lignocellulosic biomass to bioethanol, a comprehensive review with a focus on pretreatment.
Renew. Sust. Energy Rev. 27, 77-93.
[21] Nigam, P.S., Singh, A., 2011. Production of liquid biofuels from renewable resources. Prog. Energy Combust. Sci. 37(1), 52-68.
[22] Oregui-Bengoechea, M., Hertzberg, A., Miletić, N., Arias, P.L.,
Barth, T., 2015. Simultaneous catalytic de-polymerization and hydrodeoxygenation of lignin in water/formic acid media with
Rh/Al2O3, Ru/Al2O3 and Pd/Al2O3 as bifunctional catalysts. J. Anal.
Appl. Pyrolysis. 113, 713-722. [23] Oregui-Bengoechea, M., Gandarias, I., Arias, P.L., Barth, T., 2017.
Unravelling the role of formic acid and the type of solvent in the
catalytic conversion of lignin: a holistic approach. ChemSusChem. 10(4), 754-766.
[24] Singh, A., Pant, D., Korres, N.E., Nizami, A.S., Prasad, S., Murphy,
J.D., 2010. Key issues in life cycle assessment of ethanol production from lignocellulosic biomass: challenges and perspectives.
Bioresour. Technol. 101(13), 5003-5012.
[25] Singh, R., Prakash, A., Dhiman, S.K., Balagurumurthy, B., Arora, A.K., Puri, S.K., Bhaskar, T., 2014. Hydrothermal conversion of
lignin to substituted phenols and aromatic ethers. Bioresour.
Technol. 165, 319-322. [26] Sluiter, A., Hames, B., Ruiz, R., Scarlata, C., Sluiter, J., Templeton,
D., 2008. Determination of ash in biomass, laboratory analytical procedure (LAP), Golden, CO, USA. NREL/TP-510-42622.
[27] Tanaka, K., Berntsen, T., Fuglestvedt, J.S, Rypdal, K., 2012.
Climate effects of emission standards: the case for gasoline and diesel cars. Environ. Sci. Technol. 46(9), 5205-5213.
[28] Zhang, X., Tu, M., Paice, M.G., 2011. Routes to potential
bioproducts from lignocellulosic biomass lignin and hemicelluloses. BioEnergy Res. 4(4), 246-257.
Please cite this article as: Ghoreishi S., Barth T., Derribsa H. Stirred and non-stirred lignin solvolysis with formic acid in aqueous and ethanolic solvent systems
at different levels of loading in a 5-L reactor. Biofuel Research Journal 21 (2019) 937-946. DOI: 10.18331/BRJ2019.6.1.5
946
The main conclusions drawn include:
- Ethanol-based experiments yielded the highest amounts of bio-oil with
the highest H/C and O/C ratios;- Stirred reactions led to higher bio-oil yields, lower char yields, and
higher carbon recovery compared to non-stirred reactions;
- Increased level of loading in the reactor led to an increase in bio-oil yield and a decrease in char yield.
- Guaiacol (2-Methoxyphenol) was the major component in most of the
LtL oils produced in both solvent systems regardless of the other reaction conditions.
- The highest bio-oil yield and lowest char yield were obtained through
the ethanol-based experiment performed under stirring at 320 °C with high level of loading in the reactor (i.e., Exp. M.Et.S-320).
Overall, the use of the 5-L pilot scale reactor was found very promising, as the highest yields of bio-oil were obtained at stirred, high loading conditions. It
should be emphasized that such conditions could not be tested at small
laboratory scale experiments.
Acknowledgements
We gratefully acknowledge LtLNOR, The Norwegian Research Council
(grant no. 190965/S60) and Statoil As for financial support and the use of the
5-L reactor. The authors would also like to thank I. J. Fjellanger for assisting with elemental analysis and Sekab for providing lignin.
References
Ghoreishi et al. / Biofuel Research Journal 21 (2019) 937-946
Please cite this article as: Ghoreishi S., Barth T., Derribsa H. Stirred and non-stirred lignin solvolysis with formic acid in aqueous and ethanolic solvent systems
at different levels of loading in a 5-L reactor. Biofuel Research Journal 21 (2019) 937-946. DOI: 10.18331/BRJ2019.6.1.5
Supplementary Material
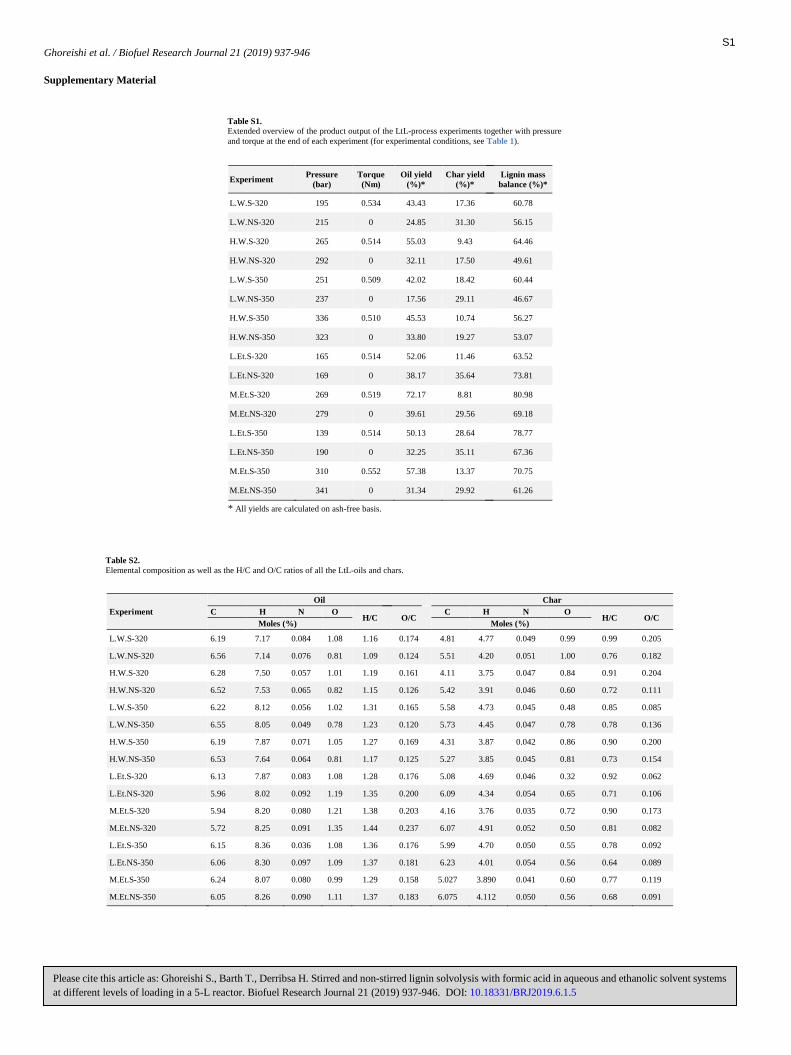
Table S1.
Extended overview of the product output of the LtL-process experiments together with pressure
and torque at the end of each experiment (for experimental conditions, see Table 1).
ExperimentPressure
(bar)
Torque
(Nm)
Oil yield
(%)*
Char yield
(%)*
Lignin mass
balance (%)*
L.W.S-320 195 0.534 43.43 17.36 60.78
L.W.NS-320 215 0 24.85 31.30 56.15
H.W.S-320 265 0.514 55.03 9.43 64.46
H.W.NS-320 292 0 32.11 17.50 49.61
L.W.S-350 251 0.509 42.02 18.42 60.44
L.W.NS-350 237 0 17.56 29.11 46.67
H.W.S-350 336 0.510 45.53 10.74 56.27
H.W.NS-350 323 0 33.80 19.27 53.07
L.Et.S-320 165 0.514 52.06 11.46 63.52
L.Et.NS-320 169 0 38.17 35.64 73.81
M.Et.S-320 269 0.519 72.17 8.81 80.98
M.Et.NS-320 279 0 39.61 29.56 69.18
L.Et.S-350 139 0.514 50.13 28.64 78.77
L.Et.NS-350 190 0 32.25 35.11 67.36
M.Et.S-350 310 0.552 57.38 13.37 70.75
M.Et.NS-350 341 0 31.34 29.92 61.26
* All yields are calculated on ash-free basis.
Table S2.
Elemental composition as well as the H/C and O/C ratios of all the LtL-oils and chars.
Experiment
Oil Char
C H N OH/C O/C
C H N OH/C O/C
Moles (%) Moles (%)
L.W.S-320 6.19 7.17 0.084 1.08 1.16 0.174 4.81 4.77 0.049 0.99 0.99 0.205
L.W.NS-320 6.56 7.14 0.076 0.81 1.09 0.124 5.51 4.20 0.051 1.00 0.76 0.182
H.W.S-320 6.28 7.50 0.057 1.01 1.19 0.161 4.11 3.75 0.047 0.84 0.91 0.204
H.W.NS-320 6.52 7.53 0.065 0.82 1.15 0.126 5.42 3.91 0.046 0.60 0.72 0.111
L.W.S-350 6.22 8.12 0.056 1.02 1.31 0.165 5.58 4.73 0.045 0.48 0.85 0.085
L.W.NS-350 6.55 8.05 0.049 0.78 1.23 0.120 5.73 4.45 0.047 0.78 0.78 0.136
H.W.S-350 6.19 7.87 0.071 1.05 1.27 0.169 4.31 3.87 0.042 0.86 0.90 0.200
H.W.NS-350 6.53 7.64 0.064 0.81 1.17 0.125 5.27 3.85 0.045 0.81 0.73 0.154
L.Et.S-320 6.13 7.87 0.083 1.08 1.28 0.176 5.08 4.69 0.046 0.32 0.92 0.062
L.Et.NS-320 5.96 8.02 0.092 1.19 1.35 0.200 6.09 4.34 0.054 0.65 0.71 0.106
M.Et.S-320 5.94 8.20 0.080 1.21 1.38 0.203 4.16 3.76 0.035 0.72 0.90 0.173
M.Et.NS-320 5.72 8.25 0.091 1.35 1.44 0.237 6.07 4.91 0.052 0.50 0.81 0.082
L.Et.S-350 6.15 8.36 0.036 1.08 1.36 0.176 5.99 4.70 0.050 0.55 0.78 0.092
L.Et.NS-350 6.06 8.30 0.097 1.09 1.37 0.181 6.23 4.01 0.054 0.56 0.64 0.089
M.Et.S-350 6.24 8.07 0.080 0.99 1.29 0.158 5.027 3.890 0.041 0.60 0.77 0.119
M.Et.NS-350 6.05 8.26 0.090 1.11 1.37 0.183 6.075 4.112 0.050 0.56 0.68 0.091
S1