Embed Size (px)
Citation preview

University of Greenwich
Business School
MSc in Finance & Financial Information Systems
2008-2009
Title of the Dissertation:
“DO DIVIDEND ANNOUNCEMENTS AFFECT THE STOCK
PRICES IN THE GREEK STOCK MARKET?
STUDENT:
SEREFIDIS THEOFILOS
(ID Number: 000538522)
SUPERVISOR:
Dr. S. Athianos
September 2009

1
Section TABLE OF CONTENTS page
Abstract…………………………………………………………………...3
1. Introduction............................................................................................4
2. Background information on the Athens Stock Exchange and the
Dividends Regime in Greece……………………………………………..6
3. Theories about the relevance between corporate dividend policy and
shareholders’ wealth……………………………………………………...7
3.1 The Middle of the Road……………………………………………………9
3.2 The Conservative Rightists........................................................................11
3.3 The Radical Leftists………………………………………………………16
4. Dividends and Taxes: “Clientele” effect..............................................18
5. The informational content of dividends and their signals to capital
markets…………………………………………………………………..22
6. Behavioural rationality of investors: the case of dividends…………..23
7. Dividend announcements and the Efficient Market Hypothesis……..24
8. Evidence of the Signalling Effect from different capital markets
globally………………………………………………………………….25
8.1 US Capital Market……………………………………………………......26
8.2 European Capital Markets………………………………………………..27
8.3 Asian Capital Markets……………………………………………………28
8.4 Other Capital Markets – the Greek Capital Market………………………30
9. Research Design and applied Methodology………………………….32
9.1 Sample and Data Selection……………………………………………….32
9.2 Hypothesis Development………………………………………………...32
9.3 Constructing the Event Study Window…………………………………..33
9.4 Raw Return Measures……………………………………………………35
9.5 Abnormal Return Measures…………………………………………...….35
10. Empirical Results………………………………………………...….36
11. Conclusions……………………………………………………...….63

2
References……………………………………………………………....65

3
DO DIVIDEND ANNOUNCEMENTS AFFECT THE STOCK PRICES IN THE
GREEK STOCK MARKET?
Serefidis Theofilos (ID Number: 000538522)
University of Greenwich, MSc in Finance & Financial Information Systems
Abstract
The reaction of the stock markets to dividend announcements by firms is a
financial issue, which has caused an intense debate between the academics, the
corporate officials and the shareholders of many companies for several years. The
current study attempts to examine the reaction of the Athens Stock Exchange (ASE)
to dividend announcements by a sample of firms negotiating on the indices
FTSE/ATHEX 20 and FTSE/ATHEX Mid 40 for a fixed period 2004-2008. It also
provides analytical information about the Greek Stock Market and the regulations that
underlie it, which have been taken into account in the present thesis. Moreover,
previous studies of important academic scholars are presented and discussed, in order
for the reader to attain the appropriate theoretical knowledge about the examined
issue. Finally, significant abnormal activity is documented throughout the multiple
event-windows that are employed and therefore, the null hypothesis, which supports
the irrelevance theory as introduced by Miller and Modigliani (1961), is rejected.
Keywords: Dividend announcements, stock prices, abnormal activity, Athens Stock
Exchange, signalling effect.

4
1. Introduction
There are numerous researchers, during the last decades, that have been
concerned in their papers the impact of the dividend announcements on the stock
prices. However, it is a matter of intense debate for the academics, the managers and
the shareholders of many companies for several years. The theories that have been
introduced by significant academics were essentially unable to terminate the above
mentioned debate, as the empirical results of various studies, in the most important
stock exchanges globally, concluded to different outcomes, supporting different
theories.
The main issue that occupied the mind of the financial economists was the
corporate dividend policy and how – if it affects the firm value and thus, the
shareholders’ wealth, as well as the existence of an optimal corporate dividend policy.
Lintner (1956) is considered to be a pioneer in the research of the relevance between
dividend policy and firm value. According to Lintner (1956), under the assumption
that capital markets are “imperfect”, the firms’ dividend policy plays a prominent role
in managements’ decision making and hence, in shareholders’ wealth. He claimed that
changes in corporate dividend policy may convey information to the market about
company’s current and future financial position; given that there are information
asymmetries between managers and investors (the former have information advantage
over the investors). Therefore, Lintner suggested that increases in the amount of
dividends that companies distribute to their shareholders lead to a positive market
reaction, while decreases in the amount of dividends lead to a negative reaction of the
stock prices. Similar outcomes about the reaction of the market to changes in
corporate dividend policy have been resulted from other important researchers as well
(Walter, 1956; Gordon, 1959; Gordon, 1962). On the other hand, Miller and
Modigliani (1961) postulated in their land-mark study the irrelevance between the
dividend policy a firm adopts and the value of the firm. In particular, they argued that
under the assumption that “perfect” capital markets with perfect certainty, no taxes
and transaction costs exist, dividend policy does not have any impact on the
shareholders’ wealth. Indeed, they suggested that managers can affect the firm value
only by changing the firm’s investment policy. Finally, a last group of researchers, the
most important of which were Brennan (1970) and Brennan and Thakor (1990),
declared that the corporate dividend policy is relevant as well as crucial to the value of

5
a corporation. Nevertheless, this group of academics claimed that an increase in
dividends has a negative effect on the stock prices due to the existence of taxation.
According to Brennan and Thakor (1990), most of a company’s shareholders prefer
dividend payments when distributions are small, while they prefer tender offer stock
repurchases when distributions are quite larger. The level of taxation seems to affect
stock prices considerably in many stock exchanges all over the world. The taxation
issue and the “clientele effect” will be discussed in a distinct chapter of the current
dissertation.
The aim of the current thesis – event study – is to investigate the reaction of
the stock prices to the announcements of dividends by Greek listed companies. It
applied the classical event study methodology used by Brown and Warner (1985), in
order to measure the abnormal returns of companies’ stock prices that occurred during
a fixed time period, before and after the day of the announcement (event day). The
sample consists of Greek firms listed on the Athens Stock Exchange (ASE), and more
particularly negotiating on the indices FTSE/ATHEX 20 and FTSE/ATHEX Mid 40.
FTSE/ATHEX 20 is an index dealing with the 20 largest blue chip companies on the
ASE, in terms of total capitalization, while FTSE/ATHEX Mid 40 is an index
comprises the next 40 listed companies that are classified as medium capitalization
companies on the ASE. The selected period refers to the 1st of January 2004 until the
31st of December 2008. It is a considerably important study, as it examines the
“dividend signaling hypothesis” in a capital market that is quite different from other
capital markets, in market capitalization, in the number and the size of listed
companies and in the regulations underlying it. Analytical information about the
Athens Stock Exchange as well as its special characteristics, having regard on the
amount of dividends that companies distribute, will be discussed in the next part of
the current study.
The rest of the dissertation is organized as follows. Chapter 2 introduces an
analytical background of the Athens Stock Exchange (ASE) and the regulations that
underlie it, in regard to the dividend amounts distributed by the listed companies.
Chapter 3 presents the most important theories that have been developed about the
relevance among the corporate dividend policy and the firm value. Moreover, chapter
4 provides extensively the “clientele effect”, the theory which assumes that stock
prices move accordingly to the aims and the demands of investors, in reaction to a
corporate policy and the taxation of dividend gains. Furthermore, chapter 5 discusses

6
the informational content of dividends and the signals they convey to the capital
markets. The behavioural rationality of investors is discussed in chapter 6, as it is
considered to be a very important issue, which has stimulated the interest of the
researchers for several years. Chapter 7 relates dividend announcements with the
efficient market hypothesis (EMH), an issue that firstly introduced by Fama (1965).
Finally, before presenting the methodology applied in the current event study, chapter
8 provides some of the most important empirical findings of various researches on the
largest capital markets globally.
In chapter 9 the applied methodology is presented, as well as the research
design of the present event study. Ultimately, chapter 10 demonstrates extensively the
empirical findings of the study, in order to support or to reject the developed null
hypothesis.
2. Background information on the Athens Stock Exchange and the Dividends
Regime in Greece
The Athens Stock Exchange (ASE) is considered to be a medium-sized
European capital market, quite smaller than the others in Europe, USA and Asia, in
terms of market capitalization, number of listed companies and trading volume. The
number of listed firms on the Athens Stock Exchange has reached the 350 at the
beginning of 2005. Its market capitalization witnessed an extraordinary upward slope
after 1995, having a remarkable growth since 1999, when the general index (ASEI) of
the ASE raised at historical levels. At this time, a lot of individuals invested their
savings on shares of stocks. However, a striking decline on the prices that began in
1999 and lasted until the middle of 2003, turned the dream of thousands of investors
into a nightmare (Dasilas, 2007).
As it was stated in chapter one, the current thesis aims to investigate the
reaction of the stock prices to the announcements of dividends by the Greek listed
companies negotiating on the indices FTSE/ATHEX 20 and FTSE/ATHEX Mid 40.
Although the Athens Stock Exchange is an emerging medium-sized stock market, it
seems to be an ideal candidate for this kind of study, due to some characteristics that
other stock exchanges do not have.
First of all, companies that have their shares listed on the Athens Stock
Exchange distribute dividends to their shareholders on a yearly basis, contrary to the

7
common practice of firms listed on many other developed stock exchanges
worldwide.
Secondly, the majority of the companies in Greece are individual-family
owned companies, and hence, they have a more concentrated ownership structure and
less information asymmetries between owners and managers. Therefore, the agency
costs are generally lower in Greek firms and thus, there is no motivation for the board
of directors to use the corporate dividend policy as a mechanism for monitoring the
managers, in order to avoid wasting capital in low-return investments (Jensen, 1986).
Thirdly, in Greece it is determined precisely by the law the minimum
percentage of net profits that companies have to distribute as dividends to their
shareholders. Anastasiou (2007) implied in his study that dividends in Greece are
proportional to earnings. In particular, companies have to distribute as cash dividends
the larger amount between the 6% of their equity and the 35% of their net profits
(Law 2190/1920). Nonetheless, the general assembly of shareholders can require the
lower amount to be distributed, taken for granted that the difference will be
capitalized and distributed as stock dividends in a subsequent financial year
(Asimakopoulos et al., 2007).
Finally, according to the Greek Law (2065/1992), dividends are not taxed both
at personal and at company level. Dividends are taxed only at personal level and
capital gains are not taxed at all. Therefore, the tax system in Greece does not impose
the double taxation on dividends that it is imposed on many of the biggest stock
exchanges all over the world, such as on the US capital market. Only a tax of 0.3% is
imposed on every transaction on the Athens Stock Exchange (Dasilas et al., 2008).
The above unique characteristic of the Greek Stock Market makes it quite attractive to
potential investors and an ideal case of study, as it allows examining the market
reaction to dividend announcements without considering the effects of double
taxation.
3. Theories about the relevance between corporate dividend policy and
shareholders’ wealth
The possible impact of corporate dividend policy on the price of a company’s
shares and, therefore on the shareholders’ wealth, is a significant issue of the financial
management that has puzzled the financial researchers throughout the last decades.
This issue is crucial not only for the corporate managers that seek to find the optimal

8
payout policy – if exists – for their companies, but also for the shareholders and the
potential investors that seek to find whether the decision of the corporate dividend
policy affects the current price of their shares. In order to interpret this matter and
answer to some basic questions that had been arisen, copiousness of theories has been
developed during the last fifty years. The current part of the present thesis aims to
introduce the most important of these theories about the firm’s dividend policy and
their empirical results, which keep on influencing the economists until today. It aims
for the reader to fully understand the theoretical basis of dividend policy, in order to
present on subsequent chapters the meaning of “information content hypothesis” and
the “dividends signaling effect”.
Brealey et al. (2006) suggested that investors can use dividends, in order to
separate a profitable company from a troubled one. They believe that “generous
firms”, in terms of cash dividends distribution, have reported high earnings at the end
of the respective financial period. As a result, investors may use dividend policy, in
order to learn about firms’ future prospects or other information that is available only
to corporate officials. Brealey et al. (2006) also claimed that the information that
dividends convey to the market is fairly reliable, as firms can overstate their earnings,
to enhance their financial position, only for a short period of time and not in the long
run.
To recapitulate, changes in corporate dividend policy can help market
participants to make presumptions about the firms’ future prospects. The question that
arises, however, is whether these changes in the payout policy can affect the value of
a firm or is just a signal of its stocks’ intrinsic value. The academic scholars that tried
to answer the previous question can be classified into three different groups,
according to the results of their researches. The first group, the so-called rightists,
asserts that increases in the payout ratio have a positive effect on the firm value. On
the other side, the so-called leftists declare that an increase in the dividend payments
lead to a decline in the stock prices, due to taxation issues. This group believes that
investors’ preferences do not centre upon high cash dividends, as they are imposed to
higher taxes, compared to capital gains. Therefore, they prefer firms to increase their
plowback ratios and retain their earnings, which are imposed to lower taxation. The
third party of theoreticians, who are placed in the “middle of the road”, asserts that
there is no relevance between the corporate dividend policy and the firm value. Thus,

9
changes – positive or negative – in the amount of dividends can not affect
shareholders’ wealth.
The figure below summarizes the three different groups of researchers, on how
changes in dividend policy affect the firm value.
3.1 The Middle of the Road
This group of theoreticians – supporters of the irrelevance theory – is mainly
represented by great academics, such as Modigliani, Miller, Black and Scholes, the
so-called middle of the roaders. Modigliani and Miller (M-M) had a profound
influence in the corporate capital structure theory, since they published their two land-
mark studies (Miller & Modigliani, 1958; 1961). Their first study (1958), based on the
assumptions of the “perfect” capital markets and the inexistence of taxation,
concluded that the firm value is not affected by the choice of the firm’s capital
structure. Thus, the firm value is irrelevant to the debt to equity ratio, which a firm
selects to adopt.
At this point of the study it is worth to present the assumptions that exist in the
“ideal world” of Modigliani and Miller. First of all, companies operate in “perfect”
capital markets. More particularly, in “perfect” capital markets all investors are
rational; the information is symmetrical and available to all market participants.
Therefore, everyone who participates in the capital markets has access to the same
information and shares the same expectations about the future prospects of the
10
companies. Furthermore, in “perfect” capital markets there are no transaction costs for
the buy or the sale of securities and no individual investor has the power to influence
the stock prices by buying or selling securities. Additionally, the companies’ net
profits are not imposed to any taxation. Moreover, companies are classified in risk
classes according to their business risk, and finally, the individual and institutional
investors can borrow and lend capital at the same interest rate that exists in the market
place, the risk-free interest rate.
Taken all the above into account, Modigliani and Miller (1958) revealed their
Proposition I: the value of the (i) company does not depend on its capital structure and
it is determined by the expected future return on assets (EBITi), discounted by a rate
of return (e) that is required by the shareholders and is the appropriate for the risk
class, which the company belongs. The mathematical expression of the above
proposition is depicted on the following formula.
))e
1( (EBIT Equity Debt Value Firm ,
Source: Miller, M., Modigliani, F., (1958), “The Cost of Capital, Corporation Finance and the
Theory of Investment”, The American Economic Review, Vol. 48, No. 3, pp. 261-297.
As a result, any increase in the firm’s debt is immediately offset by the increase in the
required rate of return by the shareholders, due to an increase in the amount of the
undertaken risk (M-M’s Proposition II).
Later on, in 1961 Modigliani and Miller stated in their ground-breaking study
that a firm’s value is not affected in any way by the adopted dividend policy by the
firm. They challenged the validity of the existence of an optimal payout ratio, by
suggesting that such a ratio – if exists – would be adopted by the managers of every
company, in order to maximize its stock value and hence, the shareholders’ wealth.
On the other hand, they declared that the amounts of dividends a company distribute
is where they are, in order to gratify their shareholders and because the corporate
officials do not believe that they can add to shareholders’ wealth by increasing or
decreasing the payout ratio. Instead, Modigliani and Miller pointed out in this article
that corporate managers can affect the firm value only by changing its investment

11
policy, which is considered to be its only determinant. These two studies by Miller
and Modigliani are extremely significant to financial theory, as they have influenced
several researchers later.
Another, essential study about the relationship between the dividend policy of
a firm and its common stock prices was accomplished by Black and Scholes (1974),
which challenged openly the “bird in the hand” theory by Graham and Dodd (1951)
that will be discussed in the next part of this thesis. They supported the irrelevance
theory demonstrated by Miller and Modigliani, as they found no significant
relationship between the corporate dividend policy and the shareholders’ wealth. They
argued that “the most correct manner to examine the impact of the dividend policy on
the firm value is to determine the effects of dividend yield on stock returns” (Black &
Scholes, 1974). Finally, Miller and Scholes (1982) provided empirical evidence about
the irrelevance between the dividend policy and the firm value that proposed by
Modigliani and Miller, by assuming, however, existence of taxation in dividends and
capital gains. Nevertheless, their research will be discussed comprehensively in a
subsequent part of the current thesis.
3.2 The Conservative Rightists
The above stated Modigliani and Miller’s argument entails that the value of
any firm is irrelevant to its corporate dividend policy. By saying “irrelevant” they
mean that all feasible payout decisions for the company are optimal (DeAngelo &
DeAngelo, 2004). Therefore, corporate officials can not change the shareholders’
wealth by increasing or decreasing its distributed dividends. However, a few years
before the publication of MM’s article, in the early fifties, a more conservative group
of important academic scholars, the so-called rightists, revealed their own view about
the relationship between the corporate dividend policy and the firm value. This party
of theoreticians believed that the firm value is positively related to the dividend
payments and hence, higher dividend payments can result in an increase to the
company’s stock price.
The first researchers that tried to demonstrate the above statement were
Graham and Dodd (1951). According to them, the only reason of companies’
existence is to pay dividends and thus, individual investors who evaluate and plan the
purchase of common stocks should take into account that companies with “liberal”
dividends are better than those with “niggardly” ones (Graham & Dodd, 1951). In
12
addition, institutional and individual investors seem to prefer stocks that pay high
dividends, because they consider dividends as “immediate spendable gain”, while
capital gains are considered as “additions to the existent capital”. Graham and Dodd
developed the following “traditional” model, as a standard practice for investors to
evaluate any common stock.
E)3
1(DMP ,
Source: Graham and Dodd (1951), as found at Walter, J., (1956), “Dividend policies and
common stock prices”, The Journal of Finance, Vol. 11, No. 1, p. 36.
where M is the multiplier, D is the expected dividend per ordinary share and E is
expected earnings per ordinary share.
Two years later, Harkavy (1953) demonstrated empirically that common stock
prices move at the same direction with the proportion of earnings distributed as
dividends. Therefore, all other things been equal, investors would pay a higher price
to purchase a stock that pays higher dividends from another that pays lower ones. On
the other hand, in the same article Harkavy (1953) implied that in the long run,
companies that distribute lower percentage of their earnings, having thus higher
plowback ratios, demonstrate finally the higher increases in their stock prices. This
statement applies in cases of small and developing companies that retain the higher
proportion of their earnings, in order to finance their expansion. However, it does not
apply at all events, as distributing low amounts of dividends and retaining high
proportion of earnings does not ensure a remarkable enhancement on the stock prices
in the future.
Based on Harkavy’s conclusion about the relationship between the common
stock prices and the proportion of retained earnings, James Walter (1956) is another
significant academic scholar belonging at the rightists’ party, who attempted to
develop a theoretical model, in order to explain the relationship between the different
corporate dividend policies and the firm value. His basic assertion, upon which he
based his theoretical model, is that in the long run the present values of expected

13
dividends are reflected on the stock prices. The Walter’s Model for the stock price
evaluation is illustrated below in a quantitative manner.
Rc
DE )(Rc
RaD
P
,
Source: Walter, J., (1956), “Dividend policies and common stock prices”, The Journal of
Finance, Vol. 11, No. 1, p. 32.
where D is cash dividend per ordinary share, E is earnings per ordinary share, Ra is
the internal rate of return on the investments and Rc is the market capitalization rate.
Walter’s Model was a revolution in financial theory and one of the most
important equity valuation models. By using the above equation Walter (1956)
investigated not only the relationship between the stock prices and the dividend
payout ratio, but also the relationship between the internal rate of return on additional
investments (Ra) and the market capitalization rate (cost of capital - Rc). However,
the former relationship is highly related with the latter one. Walter (1956) classified
the companies’ stocks as “growth”, “intermediate” and “creditor”, according to the
relationship between the rate of return and the cost of capital. According to his
assertion, when the internal rate of return is greater than the market capitalization rate
(Ra > Rc), then the stock price increases as the dividend payout ratio declines.
Therefore, corporate officials could maximize shareholders’ wealth only by retaining
the earnings and reinvesting them in the company, rather than by distributing them to
the shareholders. This is the case of growing companies, which have a lot of lucrative
investment opportunities (NPV>0) and have immediate needs of available cash. If
such a company distributes the earnings as dividends, it relinquishes lucrative projects
(Ra) and let the shareholders to invest the dividends in investments with lower rate of
return (Rc). The optimal payout ratio in this case is equal to nil and all earnings have
to be reinvested in the company.
Another category of stocks, according to Walter (1956), are the intermediate
stocks. Companies with intermediate stocks are characterized by medium to high
dividend ratios. In this case the internal rate of return is lower than the market

14
capitalization rate (Ra < Rc) and thus, the stock prices increase as the payout ratio
increases as well. In such a case it would be irrational for a company to retain its
earnings, without distributing them to the shareholders, as they have more profitable
investment opportunities (Rc) than the company has (Ra). The optimal payout ratio
for intermediate companies is 100%.
Finally, creditor stocks are those that are characterized by fixed dividend
payout ratios. In this case the internal rate of return is equal to the market
capitalization rate (Ra = Rc) and hence, the payout decision makes no difference to
the firm value. This case is accordant to the irrelevance theory suggested by
Modigliani and Miller (1961) and no payout ratio appears to be optimal for the firms.
The following figure summarizes the relation between dividend per share and
period of time, suggested by Harkavy (1953) and Walter (1956), illustrating the
dividend growth for two earnings reinvestment policies.
Figure 1.
Source: Bodie, Z., Kane, A., Marcus, A., (2009), Investments, McGraw-Hill – International
Edition, New York, p. 596.
Continuing presenting, in a chronological order, the results of the empirical
researches and the theoretical studies, Gordon and Lintner were another two important
theoreticians belonging in the conservative rightists’ group, who concerned in their
studies the relationship between the corporate dividend policy and the shareholders’
wealth. Firstly, Gordon (1959) implied that an investor by purchasing a common

15
stock, she actually buys its future price, hoping to be higher than its current one. He
also provided empirical evidence that its future price is related someway with the
expected dividend payouts and the expected earnings of the company. Therefore, he
demonstrated the relevance between the dividend policy and the stock prices.
However, he failed to fabricate at that time a theoretical model that links stock prices
and dividends, in order to support the results of his research.
In the early sixties, it was Gordon (1962) and Lintner (1962) who proposed the
so-called “bird in the hand” argument that came to be one of the most momentous
propositions of the rightists’ party. Gordon (1962) accomplished the construction of a
theoretical model that, contrary to Walter’s Model (1956), took into account the risk
incorporated in the stocks. He stated that current dividends are considered by the
investors to be less risky than the expected dividends and the future capital gains and
due to the low uncertainty, current dividends are discounted in the present with a
lower discount factor resulting in a higher stock value. The formula below illustrates
quantitatively the theoretical model developed by Gordon (1962).
,
Source: Gordon, M., J., (1962), “The Savings Investment and Valuation of a Corporation”,
The Review of Economics and Statistics, Vol. 44, No. 1, pp. 38.
where P is the stock price, E indicates the earnings per ordinary share, b is the
plowback ratio and hence, E * (1-b) = D, where D is the dividend per share, b * r = g
is the growth rate, and k is the rate of return required by the shareholders. Thus, the
stock value is equal to the ratio of current dividend and the difference between the rate
of return required by the shareholders and the growth rate of dividends.
It is quite straightforward from the above equation that Gordon (1962) based
his Model on Walter’s Model (1956). Additionally, he took similar assumptions to
Walters’, in order to construct his model. He assumed that companies can finance
their operations by using only their retained earnings. However, he dissociated his
rb-k
b)-(1EP

16
model from Walters’, as he assumed that companies can also use a stable debt to
equity ratio. Furthermore, he assumed that some of his model variables, such as b, g
and k would not be changed by the corporation in every future financial period. His
final assumption was that the model is valid only when the rate of return required by
the shareholders (k) is higher than the dividends’ growth rate (g). If future dividends
are expected to have a growth rate higher than the firm’s cost of capital, then the stock
price would tend to be infinite.
To conclude, the group of rightists comprises of major theoreticians who
suggested that there is a positive relationship between the corporate dividend policy
and the firm value, and constructed models that despite their shortcomings they have
managed to shed some light to the deep tunnel of the dividend puzzle.
3.3 The Radical Leftists
Contrary to what Modigliani and Miller (1961) and Black and Scholes (1974)
have said in their seminal works about the irrelevance theory, the group of radical
leftists, supporting the relevance theory, argued for a negative relationship between
the corporate dividend policy and the firm value, due to taxation issues. In particular,
they stated that whenever dividend payments are taxed more heavily than capital
gains, it is more beneficial for companies to transmute dividends into capital gains,
while the existing profit has to be either retained, or to be used in share repurchases.
Therefore, companies should adopt a very low payout ratio, in order to pay low cash
dividends, which results in lower tax payments. As regards to investors, they would
be satisfied to pay lower taxes, as “in cases where dividends are taxed more heavily
than capital gains, investor seek to purchase stocks with low dividend yields” (Brealey
et al., 2006).
The pioneer of this group of theoreticians and the most important of them is
Brennan (1970). He is considered to be a pioneer, as he was first developed the After-
Tax Capital Asser pricing Model, applied for differential corporate and personal taxes
(Litzenberger & Ramaswamy, 1980). The assumptions that Brennan (1970) based his
model are of great importance. He assumed that corporations and individual investors
can borrow and lend capital illimitably at the same interest rate which is equal to the
risk free rate of interest. Additionally, he assumed no restrictions on short sales and
that dividend payments are known precisely by the investors (Litzenberger &

17
Ramaswamy, 1982). Thus, the mathematical relationship that derives from the above
mentioned statements is the following.
)()RE( 00 rdcbr fift ,
Source: Litzenberger, R., Ramaswamy, K., (1982), “The Effects of Dividends on Common
Stock Prices Tax Effects or Information Effects?”, The Journal of Finance, Vol. 37, No. 2, p.
429.
where Rt is total rate of return on asset i before taxes, βi is the systematic risk, di is the
dividend yield and rf is the risk free interest rate. Brennan (1970) used this model in
his study to result that any increase in dividends causes a decrease in firm stock
prices, as investors do not have preference on dividend payments, except for the case
that taxes are inexistent.
Later on, Litzenberger and Ramaswamy (1979) developed a more extended
version of Brennan’s model by adding some constrains on unlimited borrowing by
individuals and corporations with risk-free rate. However, all other things that
Brennan assumed in his model were taken as given. The mathematical approach of
Litzenberger and Ramaswamy’s (1979) Model is the following:
)()RE( 111 rdcbr fiift ,
Source: Litzenberger, R., Ramaswamy, K., (1982), “The Effects of Dividends on Common
Stock Prices Tax Effects or Information Effects?”, The Journal of Finance, Vol. 37, No. 2, p.
429.
where α1 > 0 is the risk premium in a portfolio that has a beta equal to nil and a
dividend yield equal to the risk-free interest rate. The results of their research are
compatible with Brennan’s ones, although based on their altered assumptions about
unlimited borrowing constrains (Litzenberger & Ramaswamy, 1982).
Nevertheless, Litzenberger and Ramaswamy (1980; 1982) on their subsequent
articles argued that when there are restrictions on sales and the corporate dividend

18
policy is precisely known by the investors, there is a positive but not linear
relationship between the firm value and the dividend yields. Dividends can be
forecasted only by using information that is available to investors in advance.
It seems that there is no unambiguous conclusion derived from the above
discussed theories about the relationship among corporate dividend policy and firm
value. Far from it, the supporters of the three most important groups result in clearly
contradicting theoretical and empirical outcomes. Several recent researchers have
attempted to shed some light to the dividend controversy without giving, however,
any remarkable explanation. One of the academics’ major concerns all these years
was the role that taxation issues play in the decision of dividend policy by the
corporations. The next chapter of the current thesis deals with the relationship
between dividends and taxes and the so-called “clientele” effect, by presenting the
most significant studies, which have dealt with this subject.
4. Dividends and Taxes: “Clientele” effect
There are several financial academic scholars who dealt in the past, even in
separate studies, with the impact that taxes imposed on dividends have on the stock
prices and whether they can modify shareholders’ and investors’ preferences on stock
purchases. However, it seems that there is no coincidence of views even in this topic,
as the researchers that concerned with the “clientele” effect belong equally in the three
parties of theoreticians noticed above.
Although the economists who were involved in this matter belong in the three
groups as well, their studies are presented in the current chapter following a
chronological order. Modigliani and Miller (1961) are considered to be the first
economists who attempted to provide some insight in this matter. It is already known
that both authors are supporters of the irrelevance theory – middle of the road – and
stated that the value of a firm is not dependent in any way to its dividend policy. In
order to corroborate the validity of their theory, they assumed that capital markets are
“perfect” (costless access to information, no brokerage and transaction costs and no
tax differentials between dividends and capital gains), investors act rationally and are
perfectly certain about the future dividend policy of the firms. However, according to
Modigliani and Miller (1961), the only assumption that would barely diverge from
their theory is that there are no personal income taxation differentials between
dividends and capital gains. They suggested that in capital markets, where

19
imperfections at regard of taxes imposed on dividend and capital gains exist, investors
who behave rationally prefer to purchase stocks with high or low distributions with
reference to whether capital gains are taxed more heavily than dividends respectively.
Thus, the appearance of the “clientele” effect comes to be true.
In addition to the tax differentials between dividends and capital gains, market
imperfections comprise the existence of considerable transaction and brokerage fees,
as well as gaps between the interest rates. These imperfections are certainly not
consistent with the irrelevance theory suggested by Miller and Modigliani (1961).
“Clientele” theory claims that there is an inclination of dissimilar types of securities to
allure different types of investors, according to the dividend policy adopted by each
corporation. Hence, investors are not willing to purchase stocks with low dividend
payments, if capital gains are taxed more heavily than gains accruing from dividends
and when a company change its dividend policy, investors transform their stock
portfolio accordingly.
Few years later, Elton and Gruber (1970) made a quite important research,
resulting to outcomes consistent with Modigliani and Miller’s. In particularly, they
attempted fruitfully to determine the marginal shareholders’ tax brackets and their
relation – if any – with the corporate dividend policy, an issue that had not been
investigated till then, as well as the validity of the “clientele” effect, proposed by
Modigliani and Miller (1961). Their results demonstrated that shareholders’ tax
brackets are indisputably related with firm’s dividend payments, and consequently,
changes in dividend policy lead to changes in the firm value. Corporations having
high payout ratios would attract risk-averse investors from a comparatively low tax
bracket, who prefer a stable cash income from dividend payments. On the other hand,
growth companies, which need cash to finance their expansion in fruitful investment
opportunities, usually adopt more limited payout policies and attract investors who
belong in the high tax brackets, do not have immediate cash requirements, and hence
prefer capital gains over dividends.
Correspondingly, Black and Scholes (1974) supported in their article the
“clientele” effect. However, they postulated that the expected returns of high yield
ordinary stocks are the same with the expected returns of low yield ones, even
whether taxation exists. An investor, who has imposition of taxes, certainly adjusts
her portfolio to low-yield stocks and a “tax exempt” investor adjusts his portfolio to
high-yield securities. Nevertheless, both of them are not in the position to demonstrate
20
that these prompt adjustments add value on their portfolios. Therefore, the
independence between the dividend policy and the firm’s stock price is undoubtedly
supported.
Miller and Scholes (1978; 1982) published two successive studies in an
intense endeavour to examine the relationship between dividend policy and firm
value, under the existence of tax differentials between dividends and capital gains.
They concurred with Modigliani and Miller’s (1961) proposition that only investment
policy can affect the firm value, while changes in dividend policy can not provide
added value to shareholders’ wealth (Miller & Scholes, 1978; as found at Miller &
Scholes, 1982). In their subsequent research they attempted to use measures, which
subtract the tax burden from stocks that distribute dividends, in order to minimise in
the short-run the differences form the stocks that do not pay dividends (growth
stocks). However, they stipulated that such measures were not suitable for this reason,
as they provide biased results in the short-run, while in the long-run taxes do not
affect investors’ preferences for dividend policy, and hence irrelevance theory stands
true (Miller & Scholes, 1982).
Conversely, there were other researchers who investigated the impact that
dividend taxation has on the firm value, but their results were quite different from the
above mentioned results, since the former researchers belong either in the group of
rightists or in the group of leftists. Masulis and Trueman (1988) examined how
differential personal taxation affects the dividend and the investment policy of a firm.
They suggested that differential personal taxation can be harmful even for a company,
as shareholders who are differently imposed it have deviated opinions about the
optimal use of the internal funds in investment and dividend policies. More
particularly, shareholders in low tax brackets show a preference for high dividend
payouts and less reinvestment of the internal funds and vice versa for high tax bracket
shareholders. However, their model assumes that shareholders’ disagreement exists
when companies are not permitted to invest their internal funds in securities, but any
deviation of their views is shrunk when companies can invest internal capital in
securities.
In chapter three it was cited that Brennan (1970) was one of the most
important theoreticians and a pioneer of the radical leftists’ group. In a more recent
article of him about shareholders’ preferences among different cash distributions by
firms, Brennan and Thakor (1990) took into account the impact of taxation on realized

21
investors’ gains and implied that in spite of the differential taxation between
dividends and capital gains, shareholders, in an attempt to maximize their wealth, tend
to prefer cash dividends in cases of small distributions. For medium-sized
distributions they prefer shares repurchases by the company, while for large ones they
desire tender offer repurchases. Moreover, if the actual personal dividend tax is low,
then shareholders with small stakes of ownership would prefer cash dividends, while
shareholders with substantial participation in the firm’s ownership structure would
prefer a share repurchase.
In an attempt to scrutinize the dividend puzzle under the existence of taxation,
Bernheim (1991), a year later, published his article based on a model in which
dividend payments convey information to shareholders about firm’s profitability. He
assumed that although dividends are taxed more heavily, they are indistinguishable
with share repurchases. His results, which were consistent with the irrelevance theory,
revealed that the higher the dividend taxes, the lower the amount available for
distribution, without affecting the firm value at all.
Allen et al. (2000) questioned why companies continue to distribute dividends,
despite the fact that dividends are taxed more heavily than other forms of cash
distribution. In order to answer the preceding question, Allen et al. (2000) developed a
model, which classified investors as institutional and individuals and by taking into
consideration the “ownership clientele” effect, it attempted to investigate investors’
preferences. They stated that institutional investors have an indisputable preference to
dividends, and hence they are attracted by companies with high payout ratios.
Additionally, Allen et al. (2000) took in account the agency theory as well, by
suggesting that firms distribute dividends, in order to attract institutional investors.
Agency theory implies that institutional investors have generally greater incentives to
monitor the top managers, than the diffused small individual investors. Therefore, this
kind of ownership might have good effects on the financial performance of a company
(Barako & Tower 2007), and companies would like to magnetize this kind of
investors by distributing dividends, in order to sign a positive image outside.
To summarize, most of the above mentioned theories concluded that although
taxed dividends are in the position to change investors’ preferences, they can not
remarkably modify the firm’s stock prices. However, recent empirical findings
(mentioned in a subsequent chapter of the current study) report different results.
Anyway, as it was discussed in chapter one, dividends are not imposed to double

22
taxation in Greece, and thus it is assumed in the present event study that they would
not affect investors’ preferences.
5. The informational content of dividends and their signals to capital markets
In this part of the study it is worth to discuss about the various information
conveyed by dividends to market participants, the so-called “information content
hypothesis”, as well as the dividend “signalling effect”, which are extensively cited in
the financial literature. Modigliani and Miller (1961), in an attempt to bring together
the irrelevance proposition of their “ideal” world with the dividend policy, under
circumstances of uncertainty, introduced the informational content of dividends. They
suggested that dividends provide useful information about managers’ views of
company’s future profitability prospects. However, they also stated that a change in
the dividend policy is only the “handle” for a change on the stock prices and not its
cause.
He was Bhattacharya (1979) who reconciled in his study the Modigliani and
Miller’s information content hypothesis with the signaling effect. He assumed
existence of information asymmetries between outside investors and corporate
officials. In particular, he stated that managers have inside information that is not
available to outside investors and can be important if firm’s current investments
would have positive impact on its value. His model revealed that, in this case,
dividends serve as signals to investors about firms’ expected profitability.
Taking into consideration the valuable inside information about firms’ future
plans possessed by managers, Aharony and Swary (1980) named dividend
announcements as one of the various mechanisms that managers incorporate, in order
to signal information to market participants. According to the same authors, another
significant mechanism is the earnings figures. However, dividends offer more dubious
information than earnings, as their distribution is in managers’ discretion and can be
quite effortlessly manipulated by them.
Numerous other researchers suggested that dividends convey a substantial
amount of information to markets, when changes in dividend policies are observed.
Lintner (1962) provided empirical evidence that, in any case, managers in large firms
are likely to increase the payout ratios whenever they are convinced that future cash
inflows would be adequate to support the payments, and they decrease dividends
when they are not confident about the expected cash inflows. Watts (1973) applied

23
annual data to test the information content hypothesis, resulting to a positive, however
trivial, relationship between changes in future earnings and unanticipated changes in
dividends presently. On the other hand, Pettit (1972; 1976) used quarterly data to
conclude that the intrinsic value of any security can be accurately assessed by
evaluating the changes in dividend policies. His results are consorted with Lintner’s
proposition that managers hesitate to increase dividend payments before being certain
that the amount of expected future cash inflows would be sufficient to cover the
dividend distributions.
Definitely, the majority of financial researches concerning with this issue
conclude that dividend changes convey information to market participants, sometimes
beyond the information that has been already available by earnings figures.
Nevertheless, the main dispute between the academic scholars is whether market
participants comprehend the dividend signals and accordingly adjust their portfolios.
As noticed above, the group of rightists assumes a positive relationship between
changes in dividends and investors’ reaction, while leftists take for granted that
investors have a negative reaction to dividend changes, and finally, the middle of the
roaders presume no relevance between them.
6. Behavioural rationality of investors: the case of dividends
In the previous part, it was mentioned that one of the main disputes of the
researchers, concerning the information content hypothesis, is whether market
participants comprehend the dividend signals and adjust their portfolios accordingly.
Unquestionably, it is an issue that depends on the behavioural rationality of investors,
which has been occupied the mind of many researchers until nowadays.
Miller and Modigliani (1961) first introduced the concept of rational investors,
when they assumed in their seminal study that investors behave rationally when they
function in capital markets. Particularly, they stated that rational investors are those
who prefer to maximize their wealth than minimizing it, either by receiving high cash
dividends or by enjoying high capital gains. Miller (1986) developed an important
study, in order to demonstrate that “rationality-based models” are as significant as the
other economical and financial models. After classifying investors in institutional -
large investors - and individual - small investors -, he revealed that the behavioural
elements in decisions concerning dividend payments differ between institutional and
individual investors. More specifically, unlike institutional, individual investors carry

24
small amounts of securities and the majority of them do not count the experts’ advises
when they function in capital markets. He based his assumption in the fact that
individual investors do not view the purchase of securities solely as an immediate way
to maximize their wealth, but they relate securities with their families, their business
and other factors that financial models can not take into account.
Alternatively, he was Gordon (1959) who first established the so-called “bird
in the hand” argument. Gordon (1959) allied with Modigliani and Miller’s assumption
that investors behave rationally in capital markets, however, he implied that investors
generally show a preference in current cash dividends, as they consider being less
risky than future capital gains. Therefore, he dissociated his proposition from
Modigliani and Miller’s, suggesting that investors show a preference in the source
they use to maximize their wealth. He finally concluded that due to low uncertainty
that dividends involve, companies which distribute a high proportion of their earnings
tend to enjoy higher increases in their stock prices than those who adopt more
restricted dividend policies.
However, the “bird in the hand” theory has been challenged by several
researchers. One of those was Bhattacharya (1979), who called Gordon’s argument as
“the bird in the hand fallacy”. According to him, the low uncertainty of current cash
dividends is not a so important reason to convince the investors to show a preference
in current dividends against the future capital gains. Consequently, it is rather
straightforward that the behavioral rationality of investors is another issue of debate
between the financial scholars and there is no room for convergent views.
7. Dividend announcements and the Efficient Market Hypothesis
The “efficient market hypothesis” is an issue that firstly developed by Fama
(1965) and it has been the source for an incessant dispute in economic and academic
circles between its proponents and its rivals. Fama (1965) asserted that markets are
efficient when the current market prices of the securities reflect, without bias, all the
publicly available information. As a result, market prices reflect only information that
is available currently and not information that was accessible in previous economic
periods. In addition, it is impossible for any investor to use the publicly available
information, in order to outperform the market and to enjoy excess profits repetitively,
but only randomly. Moreover, Fama (1965) rejected the proposition that future
security prices can be predicted using past information and concur the theory of

25
“random walk”. According to “random walk” theory, security market prices have no
memory, and thus, their returns are independent of its overall past behaviour. Hence,
investors can not rely on past information, in order to precisely predict the future
behaviour of any security.
As regards to release of new information to participants of capital markets,
efficient market hypothesis asserts that any change in securities’ market prices must
be in reply to release of new information, which must be totally unpredictable.
Otherwise, if market participants are aware of the new information, they would have
already adjusted their portfolios according to this information (Bodie et al., 2009).
Harsh competition between investors, both individual and institutional, is considered
to be the main reason for the existence of “efficient” markets and does not allow any
security to be underpriced or overpriced. Capital markets incorporate all the essential
mechanisms, in order to immediately and without bias adjust any new information to
current market prices and give no room for “mispriced” stocks.
Taking all the above into consideration, dividend announcements are also
considered as releases of new information about the future prospects of a company.
Therefore, according to efficient market hypothesis they should instantaneously and
unbiasedly be adjusted and reflected on the current market prices (Pettit, 1972). In
contrast, Pettit (1972) implied that in “inefficient” capital markets stock prices tend to
show abnormal performance after the announcement of dividends by the companies.
The abnormal behaviour of the stock prices comes from the fact that it takes
substantial time for information to be adjusted on the stock prices. On the other hand,
abnormal security performance before the day of the announcement does not
automatically indicate an “inefficient” market. In this case, the market would be
inefficient only if some investors had the capability to predict precisely the
announcements that would be made and had taken all the necessary positions on their
portfolios.
8. Evidence of the Signalling Effect from different capital markets globally
In the previous parts of the current thesis different theories concerning the
relationship between corporate dividend policy and firm value have been discussed, as
well as the clientele effect and the information content hypothesis of dividend
announcements. In this part of the study it is considered worthy to examine the

26
empirical findings of different researches, which investigate the dividend signalling
hypothesis, as classified according to the market that the studies have taken effect.
8.1 US Capital Market
The US capital market is considered to be the biggest capital market in the
world, and thus, several researches regarding the information content hypothesis have
taken effect on this market. Watts (1973) was one the first who attempted to examine
the dividend signalling hypothesis on the US market. He partially rebutted Pettit’s
(1972) outcomes, as he stated that there is a positive relationship between changes in
future earnings and changes in the current amount of dividends that announced by the
firms. However, he implied that a small number of earnings’ changes were attributed
to unexpected dividend changes and hence, there is a positive while trivial
relationship, in contrast to Pettit (1972), who implied that investors use widely the
information content of dividend announcements.
Subsequently, in his successive article, Pettit (1976) tried to further investigate
the above issue, due to the contradictory outcomes of the two studies. By combining
and restructuring the two preceding models, he concluded that ultimately, dividend
announcements do convey information to participants of the US market, without
however determining the exact amplitude of investors’ reaction to this information.
The US capital market stimulated the interest of other important financial
economists as well, such as Black and Scholes (1974) and Aharony and Swary (1980),
and the outcomes of their studies have already been discussed in previous parts of the
current thesis. Few years later, they were Asquith and Mullins (1983), who examined
the effect of dividend initiations on the firm value. They found that dividend
initiations are connected with positive abnormal returns. The market reaction to these
announcements is larger than its reaction to future increases of dividend payments.
Therefore, the same authors concluded that both dividend initiations and later
dividend increases have a positive impact on shareholders’ wealth.
The previous part of the present thesis attempted to relate dividend
announcements with the efficient market hypothesis, introduced by Fama (1965).
Eades et al. (1985) were those, who endeavored to examine the US market reaction to
dividend announcements by concentrating on its timeliness and unbiasedness. They
focus to investigate whether participants of the US market react rationally to dividend
announcements. They concluded that market participants do not react rationally to

27
dividend announcements, as they are either pessimistic in estimating dividends or
optimistic in interpreting the informational content conveyed by their announcements.
However, dividends paid by firms on the US market are not always distributed
in a regular basis. DeAngelo et al. (2000) tested the dividend signalling hypothesis in
the case of special dividends paid by 942 NYSE firms. They stated that the majority
of the firms on the US market used to pay special dividends quite often, but nowadays
they rarely distribute this type of dividends. They indicated that special dividends are
paid by the companies as predictably as the regular dividend payments, in a way that
is difficult to distinguish the difference between them. In addition, they provided
empirical evidence that in spite of the general decline in the distribution of special
dividends by NYSE companies, very large firms keep on paying specials in a regular
basis. They finally suggested that the overall effacement of special dividends was not
the result of the increased share repurchases, as they can not serve as signaling
devices.
Nevertheless, there are studies concerning the US market that have challenged
the informational content of dividend announcements. Christie (1994) identified all
the reduction and omission announcements of dividends for a sample of firms listed
on the New York Stock Exchange (NYSE) and on the American Stock Exchange
(AMEX) for a period between 1967 and 1985. He provided evidence that future
dividends have completely no significant relation to market reaction. Therefore,
although studies which support the informational content hypothesis are by far more
than the challengers, the dividend signaling effect on the US market remains an
elusive issue.
8.2 European Capital Markets
Even though the largest firms in the world are listed on the US capital markets,
European capital markets, especially those in the UK, stimulated the interest of many
important academic scholars. According to Balachandran (1998), the UK capital
market has at least two basic differences compared with the respective ones in the
USA. Firstly, firms listed on the UK market usually pay dividends more frequently
than the US companies, and more particularly they usually pay twice per year.
Secondly, the tax treatment for companies listed on the UK market differs from the
corresponding treatment on the US markets. Balachandran (1998) stated that
“although the US has a traditional taxation system, the UK has an imputation system”.

28
Lonie et al. (1996) were from the first economists, who attempted to
investigate the dividend signaling phenomenon in a European capital market, using
UK data from a sample of listed companies on the London Stock Exchange. They
stated that in capital markets with information asymmetries, the market participants
try to explain correctly the managers’ announcements of dividends and earnings, in
order to make beneficial choices. Their results indicated that both dividends and
earnings announcements affect the share prices. However, they found that earnings
announcements have a more significant impact on them than dividend
announcements.
On the other hand, Abeyratna (1996) implied that the simultaneous
announcements of earnings and dividends are possible to interact with one another.
The possibility is even greater on the UK capital markets, where is a general practice
for firms to announce dividends and earnings on the same day of the economic year.
Therefore, the simultaneous signals of earnings and dividends may cause confusion to
market participants and possibly will make quite complex for them to decode the
conveyed information.
In addition, Balachandran (1998) scrutinized the dividend reductions in
accordance with the interim effect on the UK capital market. He provided empirical
evidence that the effect of dividend reductions on the firm value is quite significant
around the announcement date and leads to value declines. However, the reductions of
interim dividends have a more considerable impact on shareholders’ wealth than the
reductions on final dividends. According to the same author, the usual stability of
interim dividends and the managers’ reluctance to change them, compared to the final
dividends, are the main reasons for the market’s negative response.
8.3 Asian Capital Markets
The Asian capital markets have been emerged during the last two decades and
play an extremely important role in the global economic development. The most
important of the Asian capital markets and one the three largest markets globally is
the Japanese capital market. The above market has stimulated the interest of numerous
researchers, especially throughout the last decade, who attempted to examine the
effects of dividends announcements on the stock prices. However, the Japanese
market has some unique characteristics that have to be taken into account by the
sundry researchers. Firstly, the majority of the companies listed on the Japanese

29
market announce their dividends at the same time they announce their earnings as
well. Secondly, the firms simultaneously announce their forecasts for the next year’s
dividends and earnings figures. Thirdly, there are special analysts in Japanese market,
who make their own forecasts about the firms’ dividends few days before the
announcements. As a result, this kind of forecasts can be compared with the
announced figures, in order to observe the direction and the magnitude of the market’s
response.
Taken all the above characteristics of the Japanese market into consideration,
Conroy et al. (2000) examined the reaction of the market to 3,890 announcements of
Japanese companies for a period between 1988 and 1993. They suggested that stock
prices are affected in an important manner by the manager’s forecasts of the next
period’s earnings. On the other hand, they found marginal relevance, and not a
significant one, between the reactions of the stock prices and the announcements of
the current dividends, a result which is consistent with Modigliani and Miller’s (1961)
proposition about the irrelevance theory.
Moreover, Kato and Loewenstein, with a sequence of studies from 1995 to
2002, attempted to explain the dividend signaling effect on the Japanese market. Kato
and Loewenstein (1995) inspected the stock price behaviour around the date of the
dividend announcements for a sample of Japanese firms and found that the dividend
clientele effect seems to be trivial for the Japanese market. They are also the first
researchers, who identified the “fiscal-year-end effect” in an Asian market. According
to this effect, stock prices of Japanese firms appear to be pressured by selling forces
before the fiscal-year end, and by buying forces after the end of the fiscal year.
Furthermore, Kato et al. (1997) examined the market response to voluntary
announcements, an issue that appears in Japan contrary to what happens in the US
markets; it is not compulsory for Japanese firms to disclose any information about the
dividends before the announcement day. Kato et al. (1997) scrutinized that just as US
markets do, Japanese market react quite strongly to dividends announcements, since
market participants are actually interested to decode the information conveyed by the
dividend announcements about the firms’ financial future and take immediately the
appropriate actions. Their research has shown that the aggregate stock returns appear
to be positive, which denotes that managers are biased toward announcing optimistic
news. Nevertheless, unlike on the US markets, the announcements for no change in
the corporate dividend policy lead to extremely negative excess stock returns.

30
Therefore investors on the Japanese market have the “flair” to identify any managers’
bias including in dividend voluntary disclosures.
On the other hand their last study is in alignment with the above mentioned
study of Conroy et al. (2000). Kato et al. (2002) investigated the dividend policy of
firms in Japan and concluded to similar outcomes. They provided empirical evidence
that although the changes in corporate dividend policy may convey useful information
to market participants about the firms’ future cash flows; it is not used by the
managers as a device to control overinvestment problems, a result that challenges
Jensen’s (1986) theory about dividend policy, mentioned in chapter 2 of the present
study.
8.4 Other Capital Markets – the Greek Capital Market
Despite their limited size in terms of market capitalization and number of
listed firms, the capital markets of Greece and Cyprus have stimulated the interest of
several prominent financial researchers. In particular, numerous researchers have
examined the stock market response to changes in corporate dividend policy by firms
listed on those markets.
Beginning with the capital market of Cyprus, Travlos et al. (2001) investigated
the stock price reaction to announcements of cash dividend changes in the
environment of an emerging European market. In general, Travlos et al. (2001)
believe that firms operating in emerging markets have to adopt a payout policy based
on the special characteristics of the corresponding market, such as the market
microstructures and the tax treatment of the Cyprus-listed firms. The results of their
study demonstrated the existence of considerably positive abnormal returns associated
with the announcements of changes in the payout policy, results which are
conterminous with the information signalling hypothesis.
As it was mentioned in chapter 2 of the current thesis, the Greek stock market
is considered a medium-size one; however it seems to be quite attractive to potential
investors and an ideal case of study, as it allows examining the market response to
dividend announcements without considering the effects of double taxation.
Thereafter, the most essential studies concerning the Greek capital market will be
presented, in order for the reader to have a more integrated view about the Greek
market as well as its reaction to dividend announcements.

31
One of the first attempts to examine the dividend signaling hypothesis on the
Greek stock market was made by Papaioannou et al. (2000). It was a study that
analyzed the stock price response to dividend announcements for a sample of firms
listed on the Athens Stock Exchange. Their sample consisted of stocks traded on the
main segment of the ASE for a period between 1981 and 1994. Their empirical
findings seemed to be consistent with Modigliani and Miller’s irrelevance theory, as it
was not observed any significant abnormal return, as a result of the change in firms’
corporate payout policy, neither on the announcement nor on the ex-dividend day.
In addition, Asimakopoulos et al. (2007) explored the same hypothesis on the
ASE using a sample of listed firms, which distributed the lowest amount of dividend
required or above the lowest required amount. Their outcomes suggest that when the
listed companies on the ASE declared publicly the distribution of higher dividends
than the compulsory amount and when this increase was regarded by the market
participants as an unexpected one, then there was a negative stock price reaction.
Consequently, Asimakopoulos et al. (2007) implied that increases in dividends that
considered as unexpected changes in dividend policy convey “bad news” to the
market. However, the signaling effect does not apply for firms that pay only the
minimum required amount for dividends. Therefore, the results of their study are
consistent with the irrelevance theory about dividend policy.
Furthermore, Dasilas (2007) and Dasilas et al. (2008) examined the stock
market reaction on both final and interim dividend announcements on the Greek stock
market. Nevertheless, their findings are diametrically different form the results of
Asimakopoulos et al. (2007), as they found that positive changes in dividend policy,
and hence increases in the distributed amount of dividends, have a positive impact on
the stock prices, while decreases in the payout ratio lead to significantly opposite
results on the stock prices.
In conclusion, empirical findings supporting the three different theories of
dividend policy have been observed by the researchers in their studies concerning the
Athens Stock Exchange. The next chapters of the current thesis will present the
classical event study methodology that has been employed, as well as its empirical
findings.

32
9. Research Design and applied Methodology
As it was mentioned in the introduction, the current thesis employs the
conventional event study methodology, first applied by Brown and Warner (1985).
According to MacKinlay (1997), an event study is a statistical device which is used by
the financial researchers, in order to measure the economic effect that an “event” has
on the firm value, and hence, on the shareholders’ wealth. The main issue of an event
study is to determine the abnormal returns of the firm’s stock prices attributed to the
particular event being examined. MacKinlay (1997) implied that such a study has a lot
of advantages, as the impact of the event is instantly reflected on the stock prices,
taken for granted that market participants react rationally to new information
conveyed to the marketplace. In addition, event studies can be applied in many
sciences, especially in accounting and finance.
The classical event study methodology has been used by numerous academic
scholars, who tested the dividend signaling hypothesis on a particular capital market
(Brown & Warner, 1985; Abeyratna et al., 1996; Lonie et al., 1996; Travlos et al.,
2001; Asimakopoulos et al., 2007; Dasilas et al., 2008).
9.1 Sample and Data Selection
The sample of the current dissertation consists of 60 Greek companies, listed
on the Athens Stock Exchange (ASE). More particularly, the firms negotiate on the
FTSE/ATHEX 20 Index and the FTSE/ATHEX 40 Index. FTSE/ATHEX 20 is an
index comprised of the 20 largest blue chip companies in the ASE, in terms of total
capitalization, while FTSE/ATHEX 40 is an index which consists of the next 40 listed
companies that are classified as medium capitalization companies on the ASE. The
event study period will be from the 1st of January 2004 until the 31st of December
2008 and secondary data are used (daily closing stock prices and announced dividends
from 2004 to 2008), in an attempt to test the dividend signalling hypothesis on the
Greek capital market.
9.2 Hypothesis Development
In order to shed some light to the continual debate of the dividend signaling
effect, the current study attempts to examine whether the dividend announcements by
the listed firms on the ASE convey information to the marketplace that can be
evaluated by the investors and cause abnormal activity to the stock prices. The second

33
chapter of the present thesis presented analytically the three existed theories dealing
with the dividend policy and how changes in dividend policy affect the firm value.
Therefore, the current study aims to investigate the impact of the dividend
announcements on the value of the selected firms, taking into account the special
unique characteristics of the Greek stock market, in order to support one of the above
cited theories.
As a result, the null hypothesis that is tested by the current event study is the
following:
H0: Dividend announcements do not convey new information to the marketplace
and should bear no effect on the firm value.
i.e. No abnormal returns on the stock prices
In case of accepting the above null hypothesis, it means that there is no
significant abnormal activity by the stock prices during the examined period and thus,
the irrelevance theory introduced by Miller and Modigliani (1961) stands true.
Alternatively, in case of rejecting the null hypothesis, it means that statistically
significant abnormal activity – positive or negative – has been observed on the firms’
stock prices during the same period and hence, either the conservative rightists’ or the
radical leftists’ theory stands true.
9.3 Constructing the Event Study Window
Before constructing the proper event window, it is worth to determine the
event day of the analysis. It seems usual in many studies the event day to be called as
day 0. According to Papaioannou et al. (2000), in Greece there are five important
dates during the economic years related with cash dividends: (a) the meeting of the
board of directors, where it recommends the dividend payment and invites the
shareholders for another meeting, (b) the public declaration of the shareholders’
meeting, (c) the day of the dividend announcement, (d) the day of the shareholders’
meeting and, (e) the ex-dividend date. Consequently, it has to be clear that in the
current study it is defined as “day 0” the day that the amount of the distributed
dividend is publicly announced by the general assembly of the firm (Brown &
Warner, 1985; Strong, 1992; Travlos et al., 2001; Dasilas, 2007).

34
Moreover, the determination of the congruent event window length is a subject
that occupied the mind of several researchers. In the current study, the event occurs at
a distinctly identified time, and thus the start of the event period can be determined
easily (Krivin et al., 2003). The attention should be focused on how much time the
market needs to completely incorporate the new information on the stock prices.
Krivin et al., (2003) suggested in their study three possible approaches of an
appropriate event window length: (a) a fixed time period, (b) an ad hoc approach and,
(c) an approach that depends on how quickly does the market fully incorporates the
available information on the security prices.
Gurgul et al. (2003) used in their study a rather short event window, compared
with those in other event studies. In particular, Gurgul et al. (2003) attempted to
examine the impact of corporate dividend announcements on the Austrian security
prices by incorporating an event window which comprised five trading days – two
days before (-2), two days after (+2) and the event day (0). They justified their
statement on Brown and Warner’s (1985) article, where they implied that “the longer
the event window, the lower the reliability of the statistical results”.
An even shorter event window was used by Lonie et al. (1996) in an attempt to
scrutinize the UK market response to dividend announcements and identify any
abnormal share activity. Namely, they used a three-day event window – one day
before and one after the dividend declaration day.
On the other hand, Asquith and Mullins (1983) employed an event window
which consisted of 21 trading days – ten days surrounding the declaration day.
Moreover, Aharony and Swary (1980) applied a similar although non-symmetric
event window comprised of 19 trading days – ten days before (-10) and eight days
after (+8) the event day (0).
Furthermore, the majority of the researchers make use of 41-day event
window – 20 days before and 20 days after the announcement day (Divecha & Morse,
1983; Dasilas, 2007; Dasilas et al., 2008; Asimakopoulos et al., 2008). The above
researchers believe that this event window is the most appropriate, in order for the
stock prices to capture all the available information conveyed by the dividend
announcements.
Finally, it is a common practice for the most recent researchers the use of more
than one event window in their studies. Travlos et al. 2001 employed a symmetrical
event window of 31 days – 15 days before and 15 days after the event day (0). In

35
addition, Balachandran (1998) used multiple event windows, the larger of which did
not exceed 20 days before and 20 days after the announcement day.
The current study adopts an approach similar to Balachandran’s (1998), as it
employs more than one event window, without however, exceeding in length 20 days
before and after the event day. Therefore, the event window of the present thesis is 41
days (-20 days, +20 days) as it is defined day “0” the day of the dividend
announcement.
9.4 Raw Return Measures
In order to estimate the stock price reaction to corporate dividend
announcements, the current event study employs the use of logarithmic returns.
According to Strong (1992), log-returns are usually preferred in the event studies than
the discrete returns, as they can relate correctly returns over long time intervals.
Therefore, the raw returns (Ri,t) of the stock prices are calculated as follows:
Ri,t = ln(Pi,t) - ln(Pi,t-1) ,
where, Pi,t denotes the daily closing price of the stock i on day t and Pi,t-1 is the daily
closing price of the same stock on the previous day (t-1).
9.5 Abnormal Return Measures
Having calculated the actual logarithmic returns of every stock of the sample,
the classical event study methodology “necessitates” the measurement of the
abnormal – excess returns. By saying abnormal return, researchers mean the
percentage difference between the actual share return, which derives from the
occurrence of the particular event – dividend declaration, and the normal return,
which is expected by the investors to be received in the absence of the particular event
(Dasilas, 2007).
Thus, the abnormal return can be estimated using the following equation:
ARi,t = Ri,t – E(Ri,t) ,
where, ARi,t is the abnormal return on stock i on day t and E(Ri,t) is the expected
return on stock i on day t.
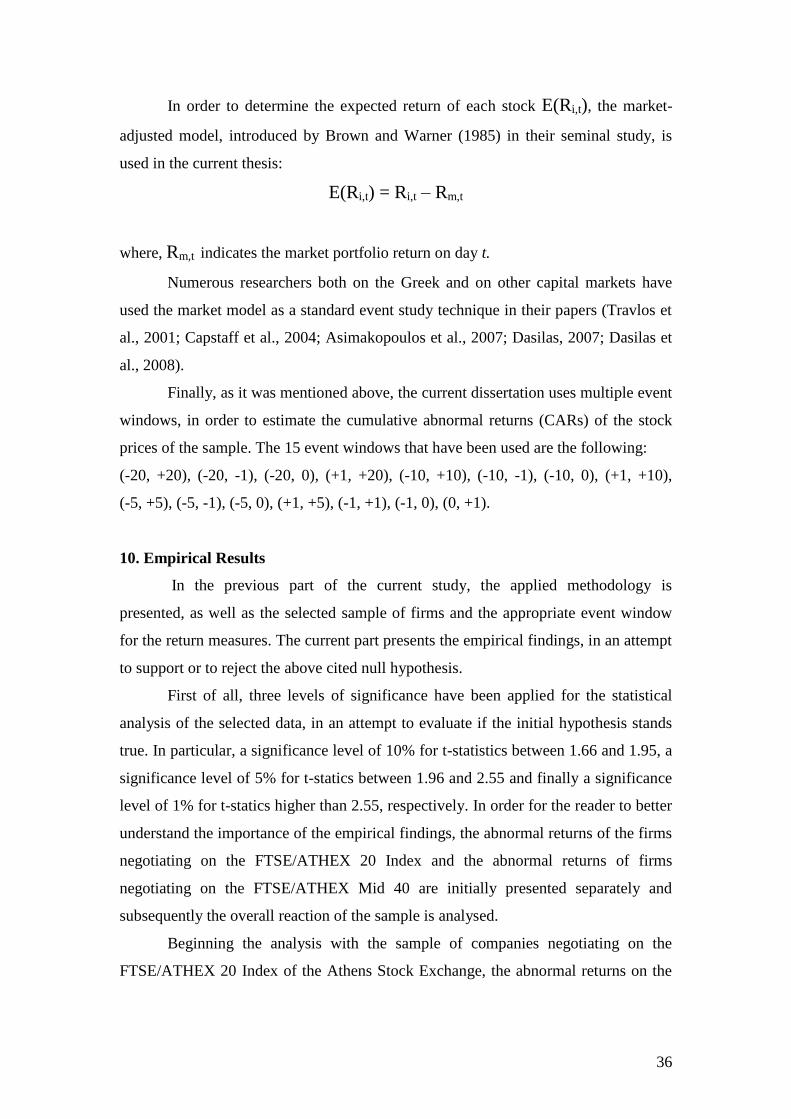
36
In order to determine the expected return of each stock E(Ri,t), the market-
adjusted model, introduced by Brown and Warner (1985) in their seminal study, is
used in the current thesis:
E(Ri,t) = Ri,t – Rm,t
where, Rm,t indicates the market portfolio return on day t.
Numerous researchers both on the Greek and on other capital markets have
used the market model as a standard event study technique in their papers (Travlos et
al., 2001; Capstaff et al., 2004; Asimakopoulos et al., 2007; Dasilas, 2007; Dasilas et
al., 2008).
Finally, as it was mentioned above, the current dissertation uses multiple event
windows, in order to estimate the cumulative abnormal returns (CARs) of the stock
prices of the sample. The 15 event windows that have been used are the following:
(-20, +20), (-20, -1), (-20, 0), (+1, +20), (-10, +10), (-10, -1), (-10, 0), (+1, +10),
(-5, +5), (-5, -1), (-5, 0), (+1, +5), (-1, +1), (-1, 0), (0, +1).
10. Empirical Results
In the previous part of the current study, the applied methodology is
presented, as well as the selected sample of firms and the appropriate event window
for the return measures. The current part presents the empirical findings, in an attempt
to support or to reject the above cited null hypothesis.
First of all, three levels of significance have been applied for the statistical
analysis of the selected data, in an attempt to evaluate if the initial hypothesis stands
true. In particular, a significance level of 10% for t-statistics between 1.66 and 1.95, a
significance level of 5% for t-statics between 1.96 and 2.55 and finally a significance
level of 1% for t-statics higher than 2.55, respectively. In order for the reader to better
understand the importance of the empirical findings, the abnormal returns of the firms
negotiating on the FTSE/ATHEX 20 Index and the abnormal returns of firms
negotiating on the FTSE/ATHEX Mid 40 are initially presented separately and
subsequently the overall reaction of the sample is analysed.
Beginning the analysis with the sample of companies negotiating on the
FTSE/ATHEX 20 Index of the Athens Stock Exchange, the abnormal returns on the

37
stock prices were estimated using the market-adjusted model. For the year 2004, the
following table illustrates the abnormal activity of the stock prices for this year.

38
Table 1. Average daily abnormal returns of the firms listed on the
FTSE/ATHEX 20 Index for the whole event window in 2004
Market-Adjusted Model
Days ARs% t-Statistic
-20 -0,621** -2,07
-19 -0,176 -0,39
-18 +0,621 +1,30
-17 +0,680** +2,20
-16 +0,593 +1,55
-15 +0,263 +0,99
-14 -0,414 -1,23
-13 +0,133 +0,37
-12 +0,266 +0,88
-11 -0,403 -1,58
-10 -0,429 -1,53
-9 +0,319 +1,52
-8 +0,658* +1,70
-7 +0,756 +1,65
-6 +0,797** +2,03
-5 +0,218 +0,57
-4 -0,129 -0,48
-3 -0,090 -0,27
-2 +0,073 +0,23
-1 -0,267 -0,63
0 +0,406 +0,80
1 -1,284** -2,41
2 -0,398 -1,40
3 -0,283 -0,91
4 -0,441 -1,23
5 -0,084 -0,29
6 +0,277 +0,92
7 +0,116 +0,31
8 -0,100 -0,46
9 +0,178 +0,68
10 +0,353 +0,92
11 -0,068 -0,22
12 +0,199 +0,69
13 -0,253 -0,79
14 -0,576** -2,14
15 -0,095 -0,39
16 -0,183 -0,56
17 +0,143 +0,46
18 +0,024 +0,07
19 +0,192 +0,69
20 -0,030 -0,11
Note: * indicates that the abnormal return is statistically significant at the 10% level, **
indicates that the abnormal return is statistically significant at the 5% level and *** indicates
that the abnormal return is statistically significant at the 1% level.

39
More specifically, throughout the days which precede the dividend
announcements (-20, -1) there is an abnormal activity on the stock prices, however
it seems to be statistically insignificant, except for the following days: t=-20, t=-17,
t=-6, where the abnormal returns (-0.621%), (+0.6796) and (+0.7972) respectively are
statistically significant at the 5% level, and on the day t=-8 (0.6577%), which is
statistically significant at the 10% level of significance. Moreover, on the event day
there is a positive, while statistically insignificant abnormal return of (0.406%).
Finally, there is a negative trend on the stock returns until the fifth day after the
announcement t=+5, but only on the first day t=+1 the abnormal return is statistically
significant (-1.284%) at the 5% level.
Similarly, during the event window before the event day (-20, -1), for the year
2005, there is a fluctuation of the stock returns without the existence of statistically
significant abnormal returns, apart from the fifteenth day t=-15 before the
announcement, where the abnormal return (0.696%) is significant at the 5% level. In
alignment with 2004, on the event day there is a positive, though statistical
insignificant abnormal activity. Moreover, there is a negative reaction of the market
following the announcement day, especially on the days t=+1, t=+8, t=+11, where the
abnormal returns (-1.139%), (-0.843%) and (-0.789%) are statistically significant at
the 5% level. The table below demonstrates the abnormal activity of the stock prices
for the whole event window (-20, +20) for the year 2005.
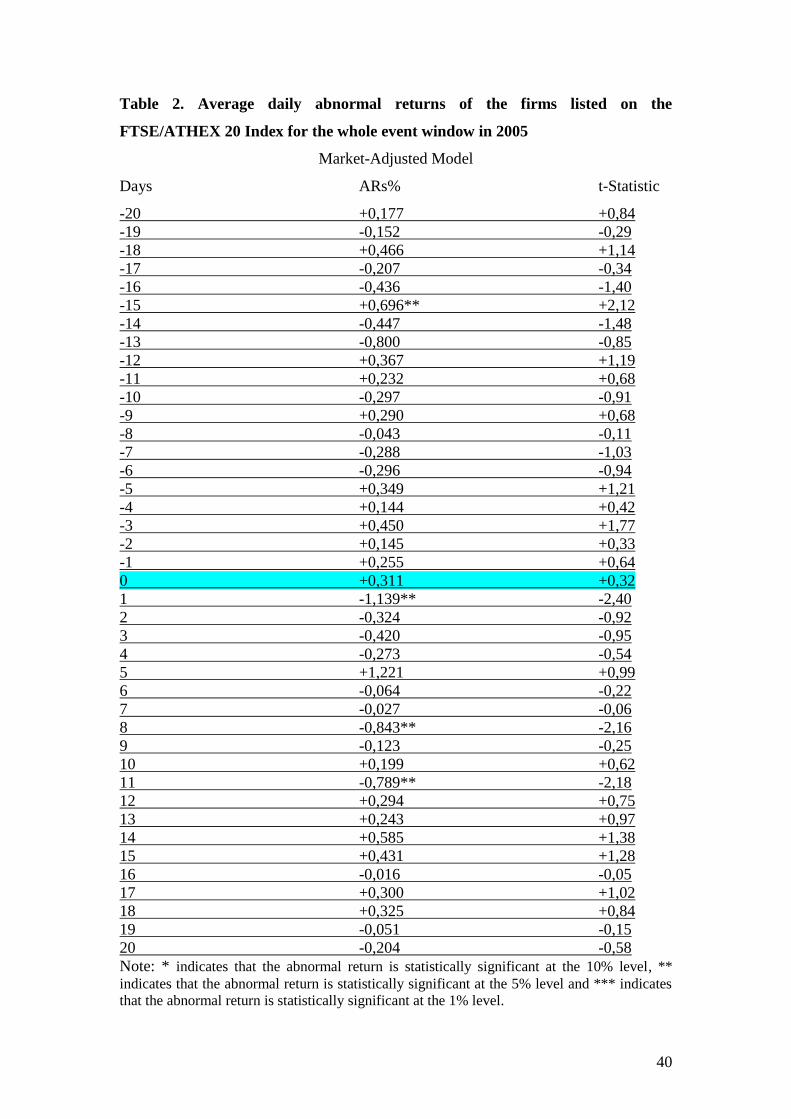
40
Table 2. Average daily abnormal returns of the firms listed on the
FTSE/ATHEX 20 Index for the whole event window in 2005
Market-Adjusted Model
Days ARs% t-Statistic
-20 +0,177 +0,84
-19 -0,152 -0,29
-18 +0,466 +1,14
-17 -0,207 -0,34
-16 -0,436 -1,40
-15 +0,696** +2,12
-14 -0,447 -1,48
-13 -0,800 -0,85
-12 +0,367 +1,19
-11 +0,232 +0,68
-10 -0,297 -0,91
-9 +0,290 +0,68
-8 -0,043 -0,11
-7 -0,288 -1,03
-6 -0,296 -0,94
-5 +0,349 +1,21
-4 +0,144 +0,42
-3 +0,450 +1,77
-2 +0,145 +0,33
-1 +0,255 +0,64
0 +0,311 +0,32
1 -1,139** -2,40
2 -0,324 -0,92
3 -0,420 -0,95
4 -0,273 -0,54
5 +1,221 +0,99
6 -0,064 -0,22
7 -0,027 -0,06
8 -0,843** -2,16
9 -0,123 -0,25
10 +0,199 +0,62
11 -0,789** -2,18
12 +0,294 +0,75
13 +0,243 +0,97
14 +0,585 +1,38
15 +0,431 +1,28
16 -0,016 -0,05
17 +0,300 +1,02
18 +0,325 +0,84
19 -0,051 -0,15
20 -0,204 -0,58
Note: * indicates that the abnormal return is statistically significant at the 10% level, **
indicates that the abnormal return is statistically significant at the 5% level and *** indicates
that the abnormal return is statistically significant at the 1% level.

41
In contrast to the preceding years, in 2006 the market does not seem to
experience so much significant abnormal activity, as only on a day before t=-5 and on
a day after the event day t=+2 there are significant abnormal returns on the 5%
significance level. On the other hand during the prior-announcement and the post-
announcement period as well as on the event day the stock prices fluctuate at
statistically insignificant levels. The table below shows the abnormal activity of the
stock prices for the whole event window (-20, +20) for the year 2006.

42
Table 3. Average daily abnormal returns of the firms listed on the
FTSE/ATHEX 20 Index for the whole event window in 2006
Market-Adjusted Model
Days ARs% t-Statistic
-20 +0,715 +1,41
-19 -0,397 -0,87
-18 -0,117 -0,44
-17 +0,519 +1,38
-16 +0,274 +0,89
-15 +0,454 +1,29
-14 +0,026 +0,07
-13 +0,623 +1,43
-12 -0,303 -0,75
-11 -0,514 -1,54
-10 +0,150 +0,28
-9 -0,364 -1,30
-8 +0,115 +0,21
-7 +0,433 +0,87
-6 +0,362 +0,78
-5 +0,907** +2,36
-4 -0,048 -0,11
-3 -0,509 -0,91
-2 +0,387 +0,82
-1 -0,265 -0,69
0 +0,185 +0,44
1 +0,294 +0,79
2 -0,977** -2,42
3 -0,221 -0,51
4 -0,199 -0,35
5 -0,492 -1,28
6 -0,390 -1,37
7 -0,722 -1,54
8 +0,578 +1,39
9 -0,031 -0,06
10 -0,039 -0,07
11 +0,061 +0,13
12 -0,352 -0,82
13 +0,281 +0,61
14 +0,054 +0,11
15 -0,775 -1,20
16 +0,497 +0,79
17 -0,843 -1,48
18 +0,418 +1,06
19 +0,023 +0,05
20 +0,045 +0,13
Note: * indicates that the abnormal return is statistically significant at the 10% level, **
indicates that the abnormal return is statistically significant at the 5% level and *** indicates
that the abnormal return is statistically significant at the 1% level.

43
In 2007, the market presents a quite similar tendency as in 2004 and in 2005.
Namely, the 20 days before the dividend announcements the stock prices presented
abnormal activity, which was however statistically insignificant, except for the second
day before the announcement t=-2. In particular, on this day t=-2 the abnormal stock
return was (+0.6729%), which is statistically significant at the 5% significance level.
Similarly on the event day, the stock prices experience negative and statistically
significant abnormal return at the 10% level. During the post-announcement period,
although the negative slope of the stock returns dominates, only the second day after
the announcement t=+2 there is a strong statistically significant negative abnormal
return (-1.677%) at the 1% level. The following table depicts the abnormal activity of
the stock prices for the whole event window (-20, +20) throughout 2007.

44
Table 4. Average daily abnormal returns of the firms listed on the
FTSE/ATHEX 20 Index for the whole event window in 2007
Market-Adjusted Model
Days ARs% t-Statistic
-20 +0,204 +0,73
-19 -0,255 -0,97
-18 -0,188 -0,66
-17 +0,220 +0,57
-16 -0,469 -1,47
-15 +0,509 +1,43
-14 -0,108 -0,40
-13 -0,800*** -2,62
-12 -0,176 -0,55
-11 +0,365 +1,02
-10 -0,295 -1,05
-9 -0,069 -0,31
-8 -0,160 -0,58
-7 +0,273 +1,11
-6 +0,145 +0,48
-5 +0,240 +0,70
-4 +0,250 +0,92
-3 +0,373 +1,18
-2 +0,673** +2,50
-1 +0,294 +0,97
0 -0,422* -1,66
1 -0,003 -0,01
2 -1,677*** -3,92
3 -0,658* -1,82
4 +0,358 +0,88
5 -0,245 -1,15
6 -0,259 -0,91
7 -0,036 -0,16
8 -0,213 -0,70
9 -0,180 -0,58
10 -0,027 -0,18
11 +0,132 +0,52
12 -0,103 -0,45
13 +0,264 +1,02
14 -0,058 -0,31
15 -0,463 -1,61
16 -0,252 -0,75
17 -0,136 -0,51
18 -1,993 -0,97
19 -0,090 -0,31
20 -0,204 -0,50
Note: * indicates that the abnormal return is statistically significant at the 10% level, **
indicates that the abnormal return is statistically significant at the 5% level and *** indicates
that the abnormal return is statistically significant at the 1% level.

45
Finally, the fifth and last year included in the current analysis is 2008. As one
can notice on the table 5 below, the positive abnormal returns monopolize throughout
this year both on the prior-announcement and on the post-announcement period.
Nevertheless, the majority of these returns are not statistically significant. The only
exceptions are on the day t=-6, where a very strong statistically significant abnormal
return can be observed (+1.655%) at the 1% significance level, and on the day t=+2
where a negative abnormal return (-1.157%) can be observed, which is statistically
significant at the 5% significance level.

46
Table 5. Average daily abnormal returns of the firms listed on the
FTSE/ATHEX 20 Index for the whole event window in 2008
Market-Adjusted Model
Days ARs% t-Statistic
-20 -0,208 -0,63
-19 +0,070 +0,16
-18 +0,360 +1,33
-17 +0,430 +0,87
-16 -0,576* -1,77
-15 +0,455 +0,98
-14 +0,429 +1,02
-13 -0,073 -0,17
-12 -0,446 -1,02
-11 +0,226 +0,45
-10 -0,785 -1,42
-9 +0,058 +0,16
-8 +0,433 +0,94
-7 +0,324 +0,85
-6 +1,655*** +4,08
-5 -0,627 -0,52
-4 +0,309 +0,48
-3 +0,021 +0,07
-2 -0,040 -0,11
-1 +0,177 +0,32
0 -0,119 -0,19
1 +0,103 +0,17
2 -1,157** -2,04
3 -0,182 -0,40
4 +0,193 +0,54
5 -0,275 -0,50
6 +0,085 +0,28
7 -0,323 -0,70
8 +0,261 +0,39
9 +0,080 +0,24
10 +0,470 +0,98
11 +0,190 +0,48
12 -0,211 -0,48
13 +0,429 +0,89
14 -0,187 -0,50
15 +0,089 +0,19
16 -0,287 -0,77
17 +0,008 +0,01
18 +0,415 +0,84
19 -1,174*** -3,49
20 +0,203 +0,60
Note: * indicates that the abnormal return is statistically significant at the 10% level, **
indicates that the abnormal return is statistically significant at the 5% level and *** indicates
that the abnormal return is statistically significant at the 1% level.

47
Having discussed explicitly the empirical findings of the companies
negotiating on the FTSE/ATHEX 20 Index, this part of the chapter analyses the
empirical results of the companies included in the rest of the selected sample, namely
the empirical findings of the firms negotiating on the FTSE/ATHEX Mid 40.
Beginning the analysis with 2004, there is a continual alteration of the
abnormal returns’ signs throughout the prior-announcement period (-20, -1).
However, only five abnormal returns seem to be statistically significant at an accepted
level. On the first event-window day (t=-20) the market reacts negatively
experiencing an abnormal return of -0.644%, which is statistically significant at the
5% level of significance. As the announcement day approaches the market gives the
impression to respond positively t=-18 (+0.491%), t=-14 (+0.838%) and t=-3
(+0.424%), with only exception the fifth day before the announcement (t=-5), where
there is a negative market reaction (-0.455%). Both the positive and the negative
abnormal returns are statistically significant at the 10% level of significance. On the
other hand on the event day (t=0) there is an abnormal return on the stock prices of
about (-0.923%), which is statistically significant at the 10% significance level. The
negative reaction of the market continues for at least six days, where very strong
negative abnormal returns can be noticed, t=+1 (-1.316%), t=+6 (-0.696%), which are
statistically significant at a 1% level, and t=+2 (-0.911%), which is statistically
significant at the 5% level. The table 6 below gives a picture of the average daily
abnormal activity analysed above.

48
Table 6. Average daily abnormal returns of the firms listed on the
FTSE/ATHEX Mid 40 Index for the whole event window in 2004
Market-Adjusted Model
Days ARs% t-Statistic
-20 -0,644** -2,30
-19 +0,162 +0,35
-18 +0,491* +1,74
-17 +0,146 +0,43
-16 -0,178 -0,62
-15 +0,079 +0,29
-14 +0,839* +1,78
-13 -0,051 -0,13
-12 -0,517 -1,31
-11 +0,245 +0,58
-10 +0,168 +0,44
-9 -0,097 -0,45
-8 +0,111 +0,28
-7 -0,052 -0,21
-6 +0,001 +0,01
-5 -0,456* -1,70
-4 -0,184 -0,66
-3 +0,424* +1,68
-2 +0,043 +0,15
-1 +0,567 +1,57
0 -0,923* -1,86
1 -1,317*** -4,24
2 -0,911** -2,07
3 -0,432 -1,30
4 -0,161 -0,48
5 -0,056 -0,15
6 -0,697*** -2,60
7 +0,408 +1,24
8 -0,212 -0,52
9 -0,041 -0,10
10 -0,325 -0,97
11 +0,344 +0,95
12 -0,258 -0,75
13 -0,169 -0,51
14 +0,120 +0,36
15 -0,075 -0,26
16 -0,194 -0,53
17 -0,064 -0,27
18 +0,037 +0,12
19 -0,091 -0,30
20 +0,486 +1,08
Note: * indicates that the abnormal return is statistically significant at the 10% level, **
indicates that the abnormal return is statistically significant at the 5% level and *** indicates
that the abnormal return is statistically significant at the 1% level.

49
There is a similar market reaction throughout 2005 as well, as there are
negative abnormal returns around the event day. Namely, on the days t=-14, t=-5 and
t=-1 the abnormal returns were (-0.540%), (-0.431%) and (-0.604%) correspondingly.
The negative slope continues to exist around the event day with statistically strong
negative abnormal returns. Specifically, on the event day (t=0) the abnormal return is
-1.521%, which is statistically significant at the 1% significance level. Moreover, the
subsequent day (t=+1) the abnormal return appears decreased (-1.046%) and
statistically significant at the 1% significance level. It can be clearly stated that the
dividend announcements conveyed negative news to the market place and this can be
reflected on the stock prices’ behaviour. The next table illustrates the above
mentioned behaviour analytically.

50
Table 7. Average daily abnormal returns of the firms listed on the
FTSE/ATHEX Mid 40 Index for the whole event window in 2005
Market-Adjusted Model
Days ARs% t-Statistic
-20 +0,296 +1,06
-19 +0,363 +0,79
-18 -0,256 -0,91
-17 +0,030 +0,08
-16 +0,411 +1,14
-15 -0,469 -1,24
-14 -0,540** -2,00
-13 +0,170 +0,92
-12 -0,267 -1,25
-11 -0,285 -1,22
-10 -0,299 -1,52
-9 +0,318 +1,28
-8 +0,215 +1,00
-7 +0,204 +0,65
-6 -0,108 -0,52
-5 -0,431* -1,85
-4 +0,085 +0,30
-3 -0,153 -0,60
-2 +0,026 +0,08
-1 -0,604** -2,08
0 -1,521*** -3,04
1 -1,046*** -2,62
2 -1,569 -1,30
3 -0,341 -1,01
4 -0,122 -0,40
5 +0,381 +1,01
6 +0,738** +2,43
7 +0,098 +0,28
8 +0,538 +1,28
9 -0,106 -0,40
10 -0,226 -0,65
11 -0,483 -1,43
12 -0,523 -1,35
13 +0,394 +1,08
14 -0,196 -0,59
15 +0,504 +1,26
16 +0,373 +0,89
17 -0,145 -0,34
18 +0,735** +2,24
19 +0,344 +1,05
20 +0,113 +0,19
Note: * indicates that the abnormal return is statistically significant at the 10% level, **
indicates that the abnormal return is statistically significant at the 5% level and *** indicates
that the abnormal return is statistically significant at the 1% level.

51
Contradicting with the preceding economic years, in 2006 there is not any
statistically significant abnormal activity during the period before the announcements.
On the event day there is a positive, while insignificant abnormal return. On the other
hand, throughout the post announcement period, the market appears to respond in
general positively to the announcements. Specifically, on the day t=+1 and on the day
t=+7 the abnormal returns equals to +0.634% and +0.674% and they are statistically
significant at the 5% level. However, a negative abnormal return of about -0.636%
intervenes the above ones on the day t=+4, and is statistically significant at the 5%
level of significance. Table 8 below depicts the abnormal returns and their statistical
significance in 2006.

52
Table 8. Average daily abnormal returns of the firms listed on the
FTSE/ATHEX Mid 40 Index for the whole event window in 2006
Market-Adjusted Model
Days ARs% t-Statistic
-20 -0,539 -1,04
-19 +0,036 +0,09
-18 +0,345 +0,99
-17 -0,242 -0,60
-16 -0,103 -0,19
-15 -0,041 -0,15
-14 -0,327 -0,96
-13 -0,667** -2,24
-12 -0,180 -0,27
-11 -0,327 -0,81
-10 +0,858 +1,39
-9 +0,764 +1,20
-8 -0,153 -0,28
-7 -0,109 -0,21
-6 +0,309 +0,61
-5 +0,332 +0,86
-4 +0,159 +0,48
-3 +0,665 +1,23
-2 -0,035 -0,08
-1 +0,273 +0,55
0 +0,305 +0,44
1 +0,634* +1,92
2 -0,340 -0,71
3 +0,386 +1,06
4 -0,636** -2,14
5 +0,267 +0,62
6 +0,059 +0,16
7 +0,674* +1,74
8 -0,268 -0,90
9 +0,171 +0,51
10 +0,001 +0,01
11 +0,177 +0,50
12 +0,077 +0,21
13 +0,159 +0,48
14 -0,034 -0,11
15 -0,032 -0,08
16 +0,417 +1,02
17 +0,027 +0,06
18 +0,023 +0,06
19 +0,256 +0,72
20 -0,466 -1,48
Note: * indicates that the abnormal return is statistically significant at the 10% level, **
indicates that the abnormal return is statistically significant at the 5% level and *** indicates
that the abnormal return is statistically significant at the 1% level.

53
Additionally, in 2007 during the event window statistically significant
abnormal returns can be observed only on three days before and on two days after the
event day. In particular, on the day t=-18 there is a positive abnormal return of about
+0.923% which is statistically significant at the 5% level. Also, on the next day t=-17
the abnormal return appears increased at +1.687%, which is significant at the 1%
level of significance, and finally on the day t=-2 the abnormal return equals to
+0.897%, which is significant at the 5% level. It can be stated that market participants
expect the dividend announcements to have a positive impact on the stock prices.
However, throughout the post-announcement period the only statistically significant
abnormal returns appear to have a negative sign. Namely, on the days t=+3, t=+19 and
t=+20 the abnormal returns were -0.607%, -0.865% and 1.201%, which are
statistically significant at 10%, 1% and 5% significance level, respectively. The table
below reviews the average abnormal activity of the stock prices for the whole event
window (-20, +20).

54
Table 9. Average daily abnormal returns of the firms listed on the
FTSE/ATHEX Mid 40 Index for the whole event window in 2007
Market-Adjusted Model
Days ARs% t-Statistic
-20 -0,401 -1,38
-19 -0,187 -0,65
-18 +0,925** +2,39
-17 +1,688*** +2,65
-16 -0,089 -0,32
-15 -0,083 -0,27
-14 -5,148 -0,95
-13 +5,652 +1,05
-12 +0,304 +0,83
-11 +0,788** +1,96
-10 +0,506 +1,44
-9 +0,680 +1,55
-8 -0,157 -0,62
-7 +0,246 +0,66
-6 -0,057 -0,24
-5 -0,194 -0,43
-4 +0,313 +0,91
-3 +0,194 +0,58
-2 +0,897** +2,33
-1 +0,079 +0,23
0 -0,181 -0,71
1 +0,673 +1,37
2 +0,076 +0,22
3 -0,607* -1,88
4 -0,128 -0,34
5 -0,361 -1,16
6 +0,548 +1,18
7 -0,253 -0,63
8 +0,427 +1,39
9 +0,012 +0,04
10 +0,036 +0,10
11 -0,225 -0,76
12 -2,544 -1,18
13 +0,278 +0,72
14 -0,308 -1,33
15 -0,007 -0,02
16 +0,365 +1,04
17 -0,064 -0,27
18 -0,240 -1,39
19 -0,865*** -3,62
20 -1,201** -2,16
Note: * indicates that the abnormal return is statistically significant at the 10% level, **
indicates that the abnormal return is statistically significant at the 5% level and *** indicates
that the abnormal return is statistically significant at the 1% level.

55
Finally in 2008, the period before the event day (-20, -1) appears to have a
quite strong positive abnormal activity for the stock prices, which increases near the
event day. As a whole, five days in the prior-announcement period present positive
statistically significant abnormal activity, t=-18 (+0.732%), which is significant at the
10% level, t=-11 (+0.662%), t=-7 (+0.878%), t=-4 (+0.591%), which are significant at
the 5% level, and finally t=-3 (+0.648%), which is statistically significant at the 1%
significance level. On the other hand, both on the event day and the post-event day
period the majority of the abnormal returns appear to be negative. However, the
negative abnormal returns both on the event day and the post-announcement period
are not statistically significant at any accepted level. The table 10 below illustrates the
average daily abnormal returns for the whole event window (-20, +20) in 2008.

56
Table 10. Average daily abnormal returns of the firms listed on the
FTSE/ATHEX Mid 40 Index for the whole event window in 2008
Market-Adjusted Model
Days ARs% t-Statistic
-20 +0,395 +0,86
-19 +0,174 +0,44
-18 +0,732 +1,77
-17 +0,739 +1,39
-16 -0,492 -1,29
-15 -0,498 -1,55
-14 +0,071 +0,23
-13 +0,280 +0,91
-12 +0,541 +0,93
-11 +0,662 +2,07
-10 +0,006 +0,02
-9 -0,028 -0,08
-8 +0,508 +1,18
-7 +0,878 +2,41
-6 -0,313 -0,93
-5 -0,126 -0,37
-4 +0,591 +2,02
-3 +0,648 +2,91
-2 -0,107 -0,33
-1 +0,355 +1,02
0 -0,114 -0,33
1 +0,242 +0,69
2 -1,053 -1,52
3 -0,106 -0,30
4 -0,238 -0,52
5 -0,270 -0,60
6 -0,548 -1,28
7 -0,346 -1,08
8 +0,806 +1,90
9 +0,394 +0,79
10 -0,621 -0,97
11 -0,115 -0,26
12 -0,304 -0,54
13 +0,152 +0,38
14 +0,021 +0,05
15 +0,364 +0,91
16 -0,315 -0,83
17 -0,147 -0,42
18 -0,164 -0,36
19 +0,138 +0,26
20 +0,092 +0,23
Note: * indicates that the abnormal return is statistically significant at the 10% level, **
indicates that the abnormal return is statistically significant at the 5% level and *** indicates
that the abnormal return is statistically significant at the 1% level.

57
In order for the reader to have a more aggregate and general view of the
market reaction, the table and the graph below illustrates the average abnormal returns
of the whole sample for all the examined years (2004-2008).

58
Table 11. Average daily abnormal returns of the whole sample of firms for the
event window for the all the examined years (2004-2008).
Market-Adjusted Model
Days ARs% t-Statistic
-20 -0,011 -0,08
-19 -0,045 -0,34
-18 +0,386*** +3,19
-17 +0,553*** +3,08
-16 -0,047 -0,35
-15 +0,026 +0,20
-14 -0,621 -0,96
-13 +0,578 +0,91
-12 +0,051 +0,29
-11 +0,166 +1,36
-10 +0,110 +0,66
-9 +0,236* +1,84
-8 +0,069 +0,56
-7 +0,200 +1,58
-6 +0,206 +1,47
-5 -0,143 -0,91
-4 +0,200 +1,48
-3 +0,160 +1,55
-2 +0,186* +1,67
-1 +0,079 +0,68
0 -0,209 -1,16
1 -0,226 -1,36
2 -0,876*** -3,44
3 -0,286** -2,34
4 -0,214 -1,61
5 -0,177 -0,90
6 -0,063 -0,46
7 -0,004 -0,03
8 +0,187 +1,22
9 +0,034 +0,26
10 -0,002 -0,01
11 -0,034 -0,30
12 -0,464 -1,57
13 +0,157 +1,31
14 -0,019 -0,19
15 +0,000 0,00
16 +0,073 +0,50
17 -0,067 -0,59
18 +0,025 +0,12
19 -0,095 -0,70
20 -0,077 -0,52
Note: * indicates that the abnormal return is statistically significant at the 10% level, **
indicates that the abnormal return is statistically significant at the 5% level and *** indicates
that the abnormal return is statistically significant at the 1% level.

59
As one can observe from table 11 and the above graph, the majority of the
abnormal returns in the prior-announcement period appear to have a positive sign,
although most of them move at statistically insignificant levels. However, on the day
t=-17 the market reacts abnormally, having a return of about +0.553%, which is
statistically significant at the 1% level. Additionally, on the days t=-9 and t=-2 the
abnormal returns are +0.236% and +0.186% correspondingly, which are statistically
significant at the 10% level of significance. As in the majority of the years that have
been examined separately, on the event day there is a negative, while statistically
insignificant abnormal return. At last, throughout the post-announcement period the
market seem to react negatively with strong abnormal returns around the
announcement day. Specifically, on the days t=+2 and t=+3 the abnormal returns -
0.876% and -0.286% respectively, and thus, it can be clearly stated that the market
has a general tendency to react negatively to dividend announcements.
As the reader can observe from the table below, the Cumulative Abnormal
Returns (CARs) follow, in general, a similar trend as the abnormal returns.
Average daily abnormal activity of the whole sample for all the
examined years (2004-2008)
-1,00%
-0,80%
-0,60%
-0,40%
-0,20%
0,00%
0,20%
0,40%
0,60%
0,80%
-20
-18
-16
-14
-12
-10 -8 -6 -4 -2 0 2 4 6 8 10 12 14 16 18 20

60
Table 12. Cumulative Abnormal Returns (CARs) of the whole sample of firms for the multiple selected event windows
Note: * indicates that the abnormal return is statistically significant at the 10% level, ** indicates that the abnormal return is statistically significant at the 5%
level and *** indicates that the abnormal return is statistically significant at the 1% level.
2004 2005 2006 2007 2008 2004-2008
Event
Windows
CAR% t-statistic CAR% t-statistic CAR% t-statistic CAR% t-statistic CAR% t-statistic CAR% t-statistic
(-20,+20) -1.603 -0.76 -1.882 -0.79 +1.606 0.95 -1.131 -0.21 +2.269 0.99 +0.002 0.00
(-20,-1) +1.829 1.24 -0.517 -0.31 +1.617 1.38 +4.083 1.06 +4.163*** 2.61 +2.340* 1.97
(-20,0) +1.463 0.96 -1.289 -0.75 +1.871 1.55 +3.810 0.96 +4.103** 2.51 +2.130* 1.75
(+1,+20) -3.066** -2.07 -0.593 -0.35 -0.265 -0.23 -4.941 -1.28 -1.834 -1.15 -2.128* -1.79
(-10,+10) -2.136 -1.41 -2.634 -1.54 +2.155* 1.79 +1.081 0.27 +0.584 0.36 -0.532 -0.44
(-10,-1) +1.103 1.05 -0.151 -0.13 +2.269*** 2.73 +2.209 0.81 +2.103* 1.87 +1.303 1.55
(-10,0) +0.737 0.67 -0.923 -0.74 +2.524*** 2.89 +1.936 0.68 +2.043* 1.73 +1.094 1.24
(+1, +10) -2.873*** -2.74 -1.711 -1.45 -0.369 -0.44 -0.856 -0.31 -1.459 -1.29 -1.626* -1.94
(-5, +5) -2.934*** -2.67 -2.835** -2.29 +0.775 0.89 +0.161 0.06 -0.842 -0.71 -1.506* -1.71
(-5, -1) +0.147 0.20 -0.087 -0.10 +1.008* 1.71 +1.495 0.78 +0.658 0.83 +0.482 0.81
(-5, 0) -0.219 -0.27 -0.859 -0.94 +1.262* 1.96 +1.222 0.58 +0.598 0.69 +0.272 0.42
(+1, +5) -2.715*** -3.67 -1.976** -2.36 -0.487 -0.83 -1.061 -0.55 -1.440* -1.81 -1.779*** -3.00
(-1, +1) -1.451** -2.53 -2.108*** -3.26 +0.794* 1.74 +0.304 0.20 +0.402 0.65 -0.356 -0.77
(-1, 0) -0.148 -0.32 -1.024* -1.94 +0.302 0.81 -0.112 -0.09 +0.234 0.46 -0.130 -0.35
(0, +1) -1.669*** -3.57 -1.856*** -3.51 +0.747** 2.01 +0.143 0.12 +0.109 0.22 -0.435 -1.16

61
Specifically, it is quite obvious that the market reacts positively during the
period before the dividend announcements, while throughout the first days of the post-
announcement period strong negative abnormal returns are observed. More
particularly, for the whole event window (-20, +20) the CAR seem to be marginally
positive, but statistically insignificant. On the other hand, throughout the event
windows that precede the announcement day, (-20, -1) and (-20, 0), there are positive
and statistically significant cumulative abnormal returns. For example, for all the
examined years simultaneously, the CARs are +2.340% and +2.130% for the above
event windows respectively, which are statistically significant at the 10% level. In
contrast, throughout the post announcement event windows, the sign of the CARs
turns to be negative. Namely, for all the examined years simultaneously it equals to
-2.128% and is statistically significant at the 10% level, as well. This is a result of the
strong negative CAR that can be noticed in 2004 (-3.066%), which is statistically
significant at the 5% significance level. However, the strongest negative abnormal
returns appear to be just few days after the event day and particularly during the
following event windows (+1, +5) and (0, +1). In 2004, an extremely statistically
strong CAR, of about -2.715%, exists and it is significant at the 1% level. Moreover,
in 2004 and 2005 there are statistically significant CARs in the short event window (0,
+1), -1.669% and -1.856% correspondingly, which are statistically significant at the
1% level.
In order to present the above results, the t-test has been applied in the current
thesis. The above discussed outcomes undoubtedly reject the null hypothesis that
supports the irrelevance theory proposed by Miller and Modigliani (1961), as
abnormal returns were sighted both before and after the dividend announcements.
Generally, the trend that has been followed by the abnormal returns is positive in the
prior-announcement period and negative in the post-announcement period.
Specifically for all the examined years simultaneously, in the event window (-20, -1)
the CAR is +2.340% (statistically significant at the 10% level), while in the event
window (+1, +20) the CAR is -2.128% (statistically significant at the 10% level).
Nevertheless, the results would be insufficient without mentioning two
important limitations that have been taken into account throughout the analysis.
Firstly, the composition of the indices was not unchanged during the examined years
(2004-2009). Moreover, the sample consists of firms that did not distribute dividends

62
some of the examined years. The following tables depict those companies, according
to their index, as well as the years that did not pay dividends.
Table 13.
FTSE/ATHEX 20 Index
Firm Year(s)
MARFIN INVESTMENT GROUP SA (CR)
2008
GREEK POSTAL SAVINGS BANK (CR)
2004, 2005, 2006, 2007
MARFIN POPULAR BANK PUBLIC CO
LTD (CR)
2004, 2005, 2006, 2007
Table 14.
FTSE/ATHEX Mid 40
Firm Year(s)
ALAPIS (CR)
2004, 2005, 2006, 2007
ASPIS BANK S.A. (CR)
2004, 2005, 2006
EUROBANK PROPERTIES R.E.I.C. (CR)
2004, 2005
INFO-QUEST S.A. (CR)
2004, 2005, 2006
PROTON BANK S.A. (CR)
2004, 2005
LAMBRAKIS PRESS S.A. (CR)
2004, 2005, 2006
HELLENIC EXCHANGES S.A. HOLDING
(CR)
2004
ATHENS MEDICAL C.S.A. (CR)
2004
FOURLIS S.A.(CR)
2004
LAMDA DEVELOPMENT S.A. (CR)
2005, 2006, 2008
ALFA-BETA VASSILOPOULOS S.A.(CR)
2005
ANEK LINES S.A. (CR)
2006
INTRACOM S.A. HOLDINGS (CR)
2006, 2007, 2008
MINOAN LINES S.A. (CR)
2006
DIAGNOSTIC&THERAPEUTIC CENTER
OF ATHENS YGEIA (CR)
2006, 2008
BABIS VOVOS INTER/NAL TECHNICAL
S.A. (CR)
2007, 2008

63
11. Conclusions
The relationship between the dividend policy and the value of the firm is an
issue that has been arisen many decades ago and stimulated the interest of many
economic researchers. However, it is also a matter of intense debate, as many theories
have been developed in an attempt to shed some light to this troublesome issue. The
aim of the current thesis was to examine the market reaction to dividend
announcements by Greek listed companies on the indices FTSE/ATHEX 20 and
FTSE/ATHEX Mid 40.
As it was mentioned in the second part of the study, the Greek stock market is
characterized by some unique characteristics that other stock markets do not have,
making it an ideal candidate for academic research. The absence of double taxation in
the Greek stock market, in contrast with other stock markets in the USA and Europe,
is a characteristic that may lead to different responses of the market participants to
dividend announcements.
The empirical findings of the current thesis obviously reject the null
hypothesis and challenge the irrelevance theory introduced by Miller and Modigliani
(1961), as they indicate the existence of abnormal activity in the stock market both
before and after the dividend announcements. In particular, they indicate positive
market reaction during the prior-announcement period (statistically significant at the
10% level) and negative market reaction throughout the post-announcement period
(statistically significant at the 10% level). On the other hand, on the event day, which
is the day that the amount of dividends is officially announced by the firms, most of
the abnormal returns that have been observed appear to be statistically insignificant at
any accepted level. Therefore, it can be clearly stated that market participants expect
the dividend announcements to have a positive impact on the stock prices, and they
adapt their own portfolios according to their expectations. However, investors seem to
interpret the news come from the dividend announcements, as ominous for the firms’
future, and thus they react with a negative manner.
As it was mentioned in the last chapter of the literature review, there are
numerous researches concerning the signaling effect on the Greek stock market.
Nevertheless, none of them has the same outcomes with the present study. Initially,
Papaioannou et al. (2000) did not observe any abnormal stock market activity around
the dividend announcements by the firms including in their sample. Moreover,
Asimakopoulos et al. (2007) stated that the signaling effect does not apply for firms

64
that distribute only the minimum required amount as dividends, even for unexpected
changes in their dividend policy. Therefore, the empirical findings of the above two
mentioned studies are undoubtedly aligned with the irrelevance theory and are in clear
contradiction with the results of the present thesis. Finally, Dasilas (2007) implied that
there are no abnormal stock returns during the prior-announcement period, a fact that
is clearly in contrast with the findings of the current dissertation, even if both studies
support the signaling effect of dividends.
Thus, in spite of the restricted number of limitations, the current study through
its empirical findings and based on previous relevant literature is an additional attempt
to shed some light to one of the most troublesome issues of the financial theory.

65
References
1. Abeyratna, G., Lonie, A., Power, D., Sinclair, C., (1996), “The influence of
company financial performance on the interpretation of dividend and earnings
signals: A study of accounting- and market based data”, British Accounting
Review, Vol. 28, pp. 229-247.
2. Aharony, J., Swary, I., (1980), “Quarterly Dividend and Earnings
Announcements and Stockholders' Returns: An Empirical Analysis”, The
Journal of Finance, Vol. 35, No. 1, pp. 1-12.
3. Allen, F., Bernardo, A., Welch, I., (2000), “A Theory of Dividends Based on
Tax Clienteles”, The Journal of Finance, Vol. 55, No. 6, pp. 2499-2536.
4. Anastasiou, T., (2007), “A dividend function for Greek manufacturing”,
Managerial Finance, Vol. 33, No. 5, pp 344-347.
5. Asimakopoulos, P., Lamprinoudakis, C., Tsangarakis, N., Tsiritakis, E.,
(2007), “Signalling with mandatory dividends: the case of the Greek Stock
Market, Working Paper, available at
http://papers.ssrn.com/sol3/papers.cfm?abstract_id=984445
6. Asquith, P., Mullins, D., (1983), “The Impact of Initiating Dividend Payments
on Shareholders' Wealth”, The Journal of Business, Vol. 56, No. 1, pp. 77-96.
7. Balachandran, B., (1998), “Dividend Reductions and Interim Effect: UK
Evidence”, Working Paper Series, available at
http://papers.ssrn.com/sol3/papers.cfm?abstract_id=114990
8. Barako, D., Tower, G., (2007), “Corporate Governance and Bank
Performance: Does ownership matter? Evidence from the Kenyan Baking
Sector”, Corporate Ownership & Control, Vol. 4, pp 133-144.
9. Bernheim, D., (1991), “Tax policy and the dividend puzzle”, The RAND
Journal of Economics, Vol. 22, No. 4, pp. 455-476.
10. Bhattacharya, S., (1979), “Imperfect Information, Dividend Policy, and "The
Bird in the Hand" Fallacy”, The Bell Journal of Economics, Vol. 10, No. 1, pp.
259-270.
11. Black, F., Scholes, M., (1974), “The effects of dividend yield and dividend
policy on common stock prices and returns”, Journal of Financial Economics,
Vol. 1, pp. 1-22.
12. Bodie, Z., Kane, A., Marcus, A., (2009), Investments, McGraw-Hill –
International Edition, New York.

66
13. Brennan, M., Thakor, A., (1990), “Shareholder Preferences and Dividend
Policy”, The Journal of Finance, Vol. 45, No. 4, pp. 993-1018.
14. Brealey, R., Myers S., Allen, F., (2006), Corporate Finance, New York:
McGraw Hill International Edition.
15. Brown, S., Warner, J., (1985), “Using daily stock return: The case of event
studies”, Journal of Financial Economics, Vol. 14, pp 3-32.
16. Capstaff, J., Klæboe, A., Marshall, A., (2004), “Share Price Reaction to
Dividend Announcements: Empirical Evidence on the Signaling Model from
the Oslo Stock Exchange”, Multinational Finance Journal, Vol. 8, No. 1, pp.
115–139.
17. Christie, W., (1994), “Are Dividend Omissions Truly the Cruelest Cut of
All?”, The Journal of Financial and Quantitative Analysis, Vol. 29, No. 3, pp.
459 -480.
18. Conroy, R., Eades, K., Harris, R., (2000), “A Test of the Relative Pricing
Effects of Dividends and Earnings: Evidence from Simultaneous
Announcements in Japan”, The Journal of Finance, Vol. 55, No. 3, pp. 1199-
1227.
19. Dasilas, A., (2007), “Stock market reaction to dividend announcements:
Evidence from the Greek Stock Market”, Working Paper, available at
http://papers.ssrn.com/sol3/papers.cfm?abstract_id=981885&rec=1&srcabs=9
55768
20. Dasilas, A., Lyroudi, K., Ginoglou, D., (2008), “Joint effects of interim
dividends and earnings announcements in Greece”, Studies in Economics and
Finance, Vol. 25, pp 212-232. (only electronically available at
http://www.emeraldinsight.com/Insight/viewContentItem.do;jsessionid=82459
A87431077AE8C8DC616EC47B9E0?contentType=Article&contentId=17480
79 )
21. DeAngelo, H., DeAngelo, L., Skinner, D., (2000), “Special dividends and the
evolution of dividend signaling”, Journal of Financial Economic, Vol. 57, pp.
309-354.
22. DeAngelo, H., DeAngelo, L., (2004), “The Irrelevance of the MM Dividend
Irrelevance Theorem”, Working Paper, available at
http://papers.ssrn.com/sol3/paper's.cfm?abstract_id=680855

67
23. Divecha, A., Morse, D., (1983), “Market Responses to Dividend Increases and
Changes in Payout Ratios”, The Journal of Financial and Quantitative
Analysis, Vol. 18, No. 2, pp. 163 -173.
24. Eades, K., Hess, P., Han KIM, E., (1985), “Market Rationality and Dividend
Announcements”, Journal of Financial Economics, Vol. 14, pp. 581-604.
25. Elton, E., Gruber, M., (1970), “Marginal Stockholder Tax Rates and the
Clientele Effect”, The Review of Economics and Statistics, Vol. 52, No. 1, pp.
68-74.
26. Fama, E., (1965), “The Behavior of Stock-Market Prices”, The Journal of
Business, Vol. 38, No. 1, pp. 34-105.
27. Gordon, M., J., (1959), “Dividends, Earnings, and Stock Prices”, The Review
of Economics and Statistics, Vol. 41, No. 2, pp. 99-105.
28. Gordon, M., J., (1962), “The Savings Investment and Valuation of a
Corporation”, The Review of Economics and Statistics, Vol. 44, No. 1, pp. 37-
51.
29. Graham, B., Dodd, D., (1951), “Security Analysis”, McGraw-Hill, New York.
30. Gurgul, H., Majdosz, P., Mestel, R., (2003), “GARCH Modelling of Austrian
Stock Market Reactions on Dividend Announcement”, available at
http://www.dem.umk.pl/2003/080_gurgul.pdf
31. Harkavy, O., (1953), “The Relation between Retained Earnings and Common
Stock Prices for Large, Listed Corporations”, The Journal of Finance, Vol. 8,
No. 3, pp. 283-297.
32. Jensen, M., (1986), “Agency Costs of Free Cash Flow, Corporate Finance, and
Take-overs”, American Economics Review, Vol. 76, No. 2, pp 323-329.
33. Kato, K., Loewenstein, U., (1995), “The Ex-Dividend-Day Behavior of Stock
Prices: The Case of Japan”, The Review of Financial Studies, Vol. 8, No. 3,
pp. 817-847.
34. Kato, K., Loewenstein, U., Tsay, W., (1997), “Voluntary dividend
announcements in Japan”, Pacific-Basin Finance Journal, Vol. 5, pp. 167-193.
35. Kato, K., Loewenstein, U., Tsay, W., (2002), “Dividend policy, cash flow, and
investment in Japan”, Pacific-Basin Finance Journal, Vol. 10, pp. 443– 473.
36. Krivin, D., Patton, R., Rose, E., Tabak, D., (2003), “Determination of the
Appropriate Event Window Length in Individual Stock Event Studies”,

68
Working Paper Series, available at
http://papers.ssrn.com/sol3/papers.cfm?abstract_id=466161
37. Lintner, J., (1956), “Distribution of Incomes of Corporations among
Dividends, Retained Earnings, and Taxes”, The American Economic Review,
Vol. 46, No. 2, pp. 97-113.
38. Lintner, J., (1962), “Dividends, Earnings, Leverage, Stock Prices and the
Supply of Capital to Corporations”, The Review of Economics and Statistics,
Vol. 44, No. 3, pp. 243-269.
39. Litzenberger, R., Ramaswamy, K., (1980), “Dividends, Short Selling
Restrictions, Tax-Induced Investors Clienteles and Market Equilibrium”, The
Journal of Finance, Vol. 35, No. 2, pp. 469-482.
40. Litzenberger, R., Ramaswamy, K., (1982), “The Effects of Dividends on
Common Stock Prices Tax Effects or Information Effects?”, The Journal of
Finance, Vol. 37, No. 2, pp. 429-443.
41. Lonie, A., Abeyratna, G., Power, D., Sinclair, C., (1996), “The Stock Market
Reaction to Dividend Announcements: A UK study of complex market
signals” Journal of Economic Studies, Vol. 23, No. 1, pp. 32-52.
42. MacKinlay, G., (1997), “Event Studies in Economics and Finance”, Journal of
Economic Literature, Vol. 35, pp. 13-39.
43. Masulis, R., Trueman, B., (1988), “Corporate investment and dividend
decisions under differential personal taxation”, Journal of Financial and
Quantitative Analysis, Vol. 23, No. 4, pp. 369–385.
44. Miller, M., (1986), “Behavioral Rationality in Finance: The Case of
Dividends”, The Journal of Business, Vol. 59, No. 4, pp. S451-S468.
45. Miller, M., Modigliani, F., (1958), “The Cost of Capital, Corporation Finance
and the Theory of Investment”, The American Economic Review, Vol. 48, No.
3, pp. 261-297.
46. Miller, M., Modigliani, F., (1961), “Dividend policy, growth, and the
valuation of shares”, Journal of Business, Vol. 34, pp 411-433.
47. Miller, M., Scholes, M., (1982), “Dividends and Taxes: Some Empirical
Evidence”, The Journal of Political Economy, Vol. 90, No. 6, pp. 1118-1141.
48. Papaioannou, G., Travlos, N., Tsangarakis, N., (2000), “Valuation Effects of
Greek Stock Dividend Distribution”, European Financial Management, Vol.
6, No. 4, pp. 515-531.

69
49. Petit, R., (1972), “Dividend announcements, security performance and capital
market efficiency”, Journal of Finance, Vol. 27, No. 5, pp 993-1007.
50. Petit, R., (1976), “The Impact of Dividend and Earnings Announcements:
Reconciliation”, The Journal of Business, Vol. 49, No. 1, pp 86-96.
51. Strong, N., (1992), “Modelling Abnormal Returns: A Review Article”,
Journal of Business Finance & Accounting, Vol. 19, No. 4, pp. 533-553.
52. Travlos, N., Trigeorgis, L., Vafeas, N., (2001), “Shareholder Wealth Effects of
Dividend Policy Changes in an Emerging Stock Market: The Case of Cyprus”,
Multinational Finance Journal, Vol. 5, No.2, pp. 87–112.
53. Walter, J., (1956), “Dividend Policies and Common Stock Prices”, The
Journal of Finance, Vol. 11, No. 1, pp. 29-41.
54. Watts, R., (1973), “The Information Content of Dividends”, The Journal of
Business, Vol. 46, No. 2, pp. 191-211.

70

71