Embed Size (px)
Citation preview
University of Birmingham
The Birmingham Urban Climate LaboratoryChapman, Lee; Muller, Catherine; Young, Duick; Warren, Elliott; Grimmond, C. S B; Cai,Xiaoming; Sakamoto Ferranti, EmmaDOI:10.1175/BAMS-D-13-00193.1
License:None: All rights reserved
Document VersionPublisher's PDF, also known as Version of record
Citation for published version (Harvard):Chapman, L, Muller, C, Young, D, Warren, E, Grimmond, CSB, Cai, X & Sakamoto Ferranti, E 2015, 'TheBirmingham Urban Climate Laboratory: an open meteorological test bed and challenges of the smart city',Bulletin of the American Meteorological Society, vol. 96, no. 9, pp. 1545-1560. https://doi.org/10.1175/BAMS-D-13-00193.1
Link to publication on Research at Birmingham portal
Publisher Rights Statement:Checked for eligibility 08/01/2016
General rightsUnless a licence is specified above, all rights (including copyright and moral rights) in this document are retained by the authors and/or thecopyright holders. The express permission of the copyright holder must be obtained for any use of this material other than for purposespermitted by law.
•Users may freely distribute the URL that is used to identify this publication.•Users may download and/or print one copy of the publication from the University of Birmingham research portal for the purpose of privatestudy or non-commercial research.•User may use extracts from the document in line with the concept of ‘fair dealing’ under the Copyright, Designs and Patents Act 1988 (?)•Users may not further distribute the material nor use it for the purposes of commercial gain.
Where a licence is displayed above, please note the terms and conditions of the licence govern your use of this document.
When citing, please reference the published version.
Take down policyWhile the University of Birmingham exercises care and attention in making items available there are rare occasions when an item has beenuploaded in error or has been deemed to be commercially or otherwise sensitive.
If you believe that this is the case for this document, please contact [email protected] providing details and we will remove access tothe work immediately and investigate.
Download date: 13. Dec. 2021
Existing urban meteorological networks have an important role to play as test beds for
inexpensive and more sustainable measurement techniques that are now becoming possible
in our increasingly smart cities.
THE BIRMINGHAM URBAN CLIMATE LABORATORY
An Open Meteorological Test Bed and Challenges of the Smart City
by Lee Chapman, Catherine L. muLLer, DuiCk t. young, eLLiott L. Warren, C. S. b. grimmonD, Xiao-ming Cai, anD emma J. S. Ferranti
AFFILIATIONS: Chapman, muLLer, Warren, Cai, anD Ferranti—School of Geography, Earth and Environmental Sciences, Uni-versity of Birmingham, Edgbaston, Birmingham, United Kingdom; young anD grimmonD—Department of Meteorology, University of Reading, Reading, United KingdomCORRESPONDING AUTHOR: Lee Chapman, School of Geogra-phy, Earth and Environmental Sciences, University of Birmingham, Edgbaston, Birmingham B15 2TT, United KingdomE-mail: [email protected]
The abstract for this article can be found in this issue, following the table of contents.DOI:10.1175/BAMS-D-13-00193.1
In final form 17 October 2014©2015 American Meteorological Society
T here is a pressing need to monitor the urban climate and, as such, cities are becoming the focus of an increasing body of research since they are the
living and working locations for the majority of the world’s population (UN 2013). In situ measurements; remote sensing observations; and modeling of urban weather, climate, and atmospheric processes and associated phenomena are utilized for applications
such as assessing the resulting impacts on critical infrastructure and society [e.g., energy, transport, health, information communication technologies (ICT)], examining risk and implementing appropri-ate adaptation and mitigation techniques (e.g., blue/green infrastructure), exploring the future impacts of changing climates upon cities, and investigating the role cities play in global climate change.
However, there is a general paucity of measure-ments in urban areas because of the cost of standard monitoring equipment and its upkeep, as well as the need for national weather and climate monitoring stations to be located outside urban areas (WMO 2008). Nevertheless, as a result of technological and communication advancements, significant improve-ments in measurement and modeling techniques are now occurring, including a new generation of low-cost sensors of comparable quality to research-grade instrumentation. Such equipment is often designed to communicate via the Internet [i.e., the “Internet of Things” (IoT); Ashton 2009; Evans 2011] and transmit data in near-real-time ideal for use in high-density networks. As a result, an increasing number of urban meteorological networks (UMNs;
1545SEPTEMBER 2015AMERICAN METEOROLOGICAL SOCIETY |
High-resolution data from UMNs have many possible ap-plications for academic research or for other end users in
the private and public sectors. Moreover, the key to BUCLs' long-term sustainability will lie in attracting a wide range of investors and end users to require and utilize the avail-able data. Identifying potential end users and applications of meteorological data from Birmingham is therefore critical for BUCL and was the key aim of a 3-month scoping project called “Sustainable urban meteorological networks (SUMNs): Managing the legacy of the Birmingham Urban Climate Labo-ratory,” which was undertaken between July and September 2013. The project contacted over 250 potential end users of BUCL data: first, to understand their meteorological data needs via a simple survey and, second, to invite them to a daylong networking workshop that brought the wide range of prospective meteorological data end users together in order to discuss the applications, strengths, weaknesses, opportu-nities, and limitations of BUCL. The survey and subsequent workshop highlighted several key applications of BUCL.
1) Academic research: Numerous opportunities for academic research using the currently available data. For example,
i) investigating the urban heat island effect (e.g., Tomlinson et al. 2013; see “Preliminary BUCL results: Exploring the UHI” sidebar) and other urban atmospheric phenomenon (e.g., flash flooding, airflow, air pollution);
ii) using a test bed for assessing crowdsourced data—for example, measurements recorded by mobile phones (e.g., Overeem et al. 2013) and vehicles (e.g., Drobot et al. 2010; Anderson et al. 2012; Cassano 2013) and provided by citizens via web 2.0 platforms (e.g., Muller 2013; Illingworth et al. 2014) [A comprehensive review of crowdsourcing in the atmospheric sciences is available in Muller et al. (2015).];
iii) ground truthing remotely sensed data (e.g., Tomlinson et al. 2012);
iv) evaluating models, where the resolution of all the instrumentation is ideally suited to the 1-km grid used by many models [e.g., the Joint U.K. Land Environment Simulator (JULES; Best et al. 2011), the Weather Research and Forecasting (WRF) Model (Chen et al. 2011)], but the potential of bespoke IoT sensor networks such as the ASM offers considerable opportunities for smaller-scale studies [e.g., computational fluid dynamics (CFD); Ashie and Kono 2011];
v) developing risk assessment and management tools [e.g., the Birmingham Urban Climate Change with Neighbourhood Estimates of Environmental Risk(BUCCANEER) project (Bassett et al. 2011)] for estimating environmental risk;
vi) testing schemes and protocols [e.g., high-resolution networks provide the resolution necessary for evaluating schemes such as urban climate zones (UCZ) classification and the applicability of protocols for networks; e.g., Muller et al. 2013b], where such findings could be used for more efficient deployment of networks;
vii) assimilating data into nowcasting and forecasting models for improving predictions over shorter spatial scales (e.g., Ochoa-Rodriguez et al. 2013);
viii) researching societal and infrastructure (e.g., high-resolution data could be utilized for real-time applications in health, energy, and transportation sectors; Chapman et al. 2014); and
ix) creating further opportunities by adding additional instrumentation, such as rain gauges, air-quality instrumentation, 3D sonic anemometers, disdrometers, and/or other low-cost sensors for both testing and operational use.
2) Knowledge exchange and real-world applications: High concentrations of people combined with critical infrastructure and increased frequency of extreme weather predicted under a changing climate (Chapman et al. 2014) make it essential to link meteorological data with infrastructure. For example, in a smart city, UMNs can be linked to public transport systems to improve prediction of weather-related delays; linked to real-time traffic flow to provide live weather and traffic updates; reroute traffic because of localized flooding after heavy rainfall; provide early warning that assets such as telecommunication hubs may be flooded; provide data for a wide range of industries, such as environmental consultancies and local councils to inform weather warnings and weather-related maintenance such as winter gritting (e.g., Smart Streets project: www.smartstreetshub.com), infrastructure companies (e.g., the Highways Agency, Network Rail), emergency service providers, leisure and sporting industries for events, or the wider public (e.g., Helsinki Testbed; Koskinen et al. 2011).
3) Educational resource: The network data can also be used in schools: for example, BUCL data and resources are directly distributed to Birmingham-based schools, and form part of the IoT project Demonstrating the Internet of School Things—A National Collaborative Experience (DISTANCE), which encourages the use of technology and data sharing in schools (www.iotschool.org/).
4) Climate change: In the future it is hoped that long-term UMNs data such as BUCL can be used to provide high-spatiotemporal-resolution data for accessing the possible impacts of climate change in urban areas (e.g., Grimmond 2013) and the effectiveness of adaptation measures (e.g., green infrastructure).
POTENTIAL APPLICATIONS OF BUCL AND OTHER UMNs
1546 SEPTEMBER 2015|
Muller et al. 2013a) of differing size and scales are being implemented in and across cities (Muller et al. 2013b) as part of “smart city” (Falconer and Mitchell 2012) initiatives and scientific research projects [e.g., Oklahoma City Micronet (Basara et al. 2011), the Helsinki Testbed (Koskinen et al. 2011), the Metro-politan Environmental Temperature and Rainfall Observation System (METROS) in Tokyo, Japan (Takahashi et al. 2009)]. As this paper highlights, increasingly smart cities provide unprecedented new opportunities for the high-resolution monitoring of the urban climate, but climate data are also integral in making the city even smarter by controlling en-ergy demand and reducing disruption on transport networks.
The recently established Birmingham Urban Cli-mate Laboratory (BUCL) in the United Kingdom is an example of a high-density UMN that essentially provides an open-air laboratory for urban climate research. Birmingham, a typical major European city (population in excess of 1 million people; ONS 2012), can be considered representative of many inland midlatitude conurbations across the world. Prior to the implementation of BUCL, there were two weather stations within the city limits and two rural sites. Such a small number of sites is insufficient to resolve the heterogeneous urban environment and is a common issue worldwide.
BUCL innovatively combines extensive sampling with new, low-cost, wireless air temperature sensors. These inexpensive sensors have low application costs (besides periodic battery replacement) and are able to connect directly to existing Wi-Fi networks, thus making a contribution to smart city initiatives in the IoT generation (Young et al. 2014). As these types of
sensors can be installed on existing infrastructure and utilize increasingly common citywide municipal Wi-Fi networks, there is wide range of potential benefits (e.g., Chapman et al. 2014). In BUCL, the low-cost air temperature sensors are embedded within a test bed of automatic weather stations (AWS), providing a means to evaluate the performance of the sensors. Independently the AWS network provides a high-resolution test bed for numerous applications, includ-ing those that require long-term datasets to evaluate the impact of climate change in cities. BUCL provides high-spatiotemporal-resolution, near-real-time data that can be used to assess the spatiotemporal dynam-ics of the urban heat island (UHI) and, through links to end-user applications, provides societal, health, and infrastructure benefits. Although this was the original motivation for the project, as the network has developed it has become clear that perhaps the largest potential of the network is how can it be utilized as a test bed for a range of novel applications. As our cit-ies become smarter and sensing technology becomes more pervasive, there is a growing need to validate the vast amount of nonstandard (e.g., crowdsourced) data that are becoming increasingly available so that the technology can be deployed on an even greater scale (see “Potential applications of BUCL and other UMNs” sidebar for more details on applications).
This article presents an overview of BUCL (see Table 1 for a summary), the AWS test bed, low-cost IoT instrumentation and communication methods, test-ing and calibration procedures, and the technical and logistical issues connected to implementing a high-density network. These provide the context to sample data analyzed from 2013/14 that includes the July 2013 U.K. heatwave (see “Preliminary BUCL results:
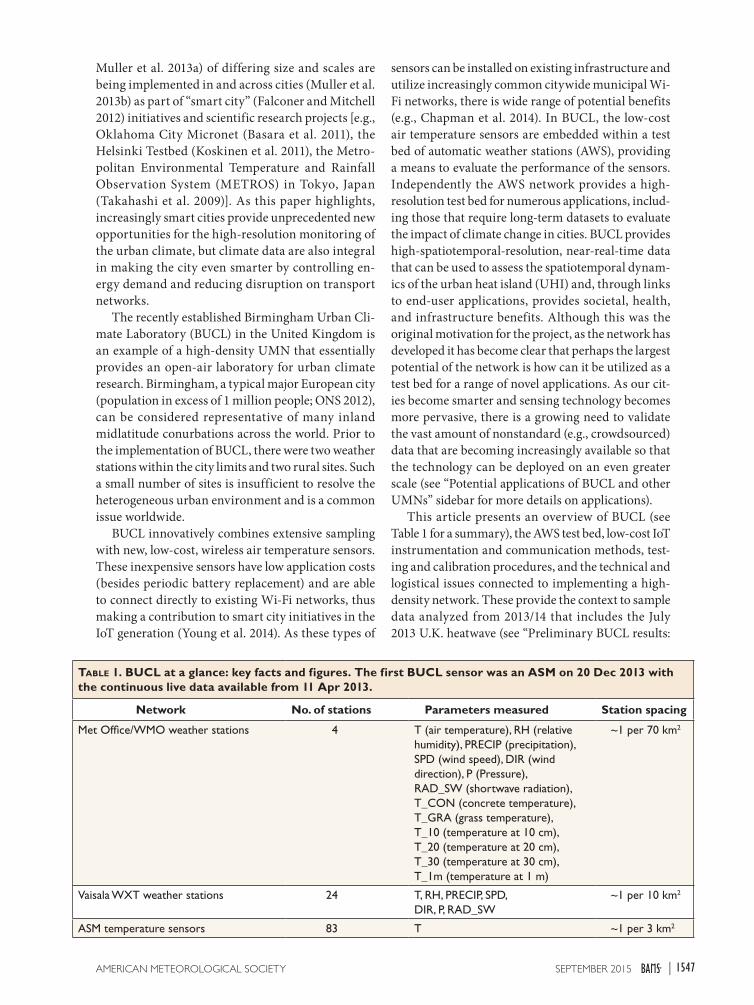
Table 1. BUCL at a glance: key facts and figures. The first BUCL sensor was an ASM on 20 Dec 2013 with the continuous live data available from 11 Apr 2013.
Network No. of stations Parameters measured Station spacing
Met Office/WMO weather stations 4 T (air temperature), RH (relative humidity), PRECIP (precipitation), SPD (wind speed), DIR (wind direction), P (Pressure), RAD_SW (shortwave radiation), T_CON (concrete temperature), T_GRA (grass temperature), T_10 (temperature at 10 cm), T_20 (temperature at 20 cm), T_30 (temperature at 30 cm), T_1m (temperature at 1 m)
~1 per 70 km2
Vaisala WXT weather stations 24 T, RH, PRECIP, SPD, DIR, P, RAD_SW
~1 per 10 km2
ASM temperature sensors 83 T ~1 per 3 km2
1547SEPTEMBER 2015AMERICAN METEOROLOGICAL SOCIETY |
PRELIMINARY BUCL RESULTS: EXPLORING THE UHI
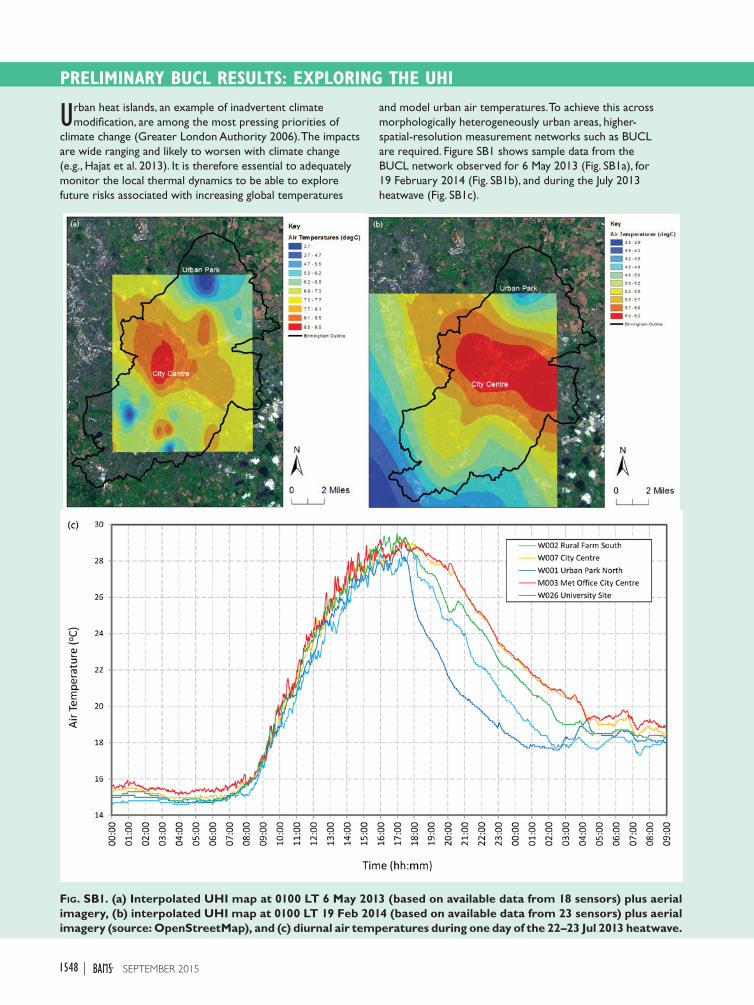
Urban heat islands, an example of inadvertent climate modification, are among the most pressing priorities of
climate change (Greater London Authority 2006). The impacts are wide ranging and likely to worsen with climate change (e.g., Hajat et al. 2013). It is therefore essential to adequately monitor the local thermal dynamics to be able to explore future risks associated with increasing global temperatures
and model urban air temperatures. To achieve this across morphologically heterogeneously urban areas, higher-spatial-resolution measurement networks such as BUCL are required. Figure SB1 shows sample data from the BUCL network observed for 6 May 2013 (Fig. SB1a), for 19 February 2014 (Fig. SB1b), and during the July 2013 heatwave (Fig. SB1c).
Fig. SB1. (a) Interpolated UHI map at 0100 LT 6 May 2013 (based on available data from 18 sensors) plus aerial imagery, (b) interpolated UHI map at 0100 LT 19 Feb 2014 (based on available data from 23 sensors) plus aerial imagery (source: OpenStreetMap), and (c) diurnal air temperatures during one day of the 22–23 Jul 2013 heatwave.
1548 SEPTEMBER 2015|
PRELIMINARY BUCL RESULTS: EXPLORING THE UHIEarlier UHI studies in Birmingham used sparse air tem-
perature measurements (e.g., Unwin 1980), modeling (e.g., Bassett et al. 2011), and satellite-derived surface tempera-tures (e.g., Tomlinson et al. 2012). Now, using BUCL, the size, structure, and evolution of the UHI across Birmingham are observable. These data provide the basis for under-standing the current thermal operating environment of
Exploring the UHI” sidebar). Potential applications for the network are explored and an open invitation is extended to others to use this high-density UMN.
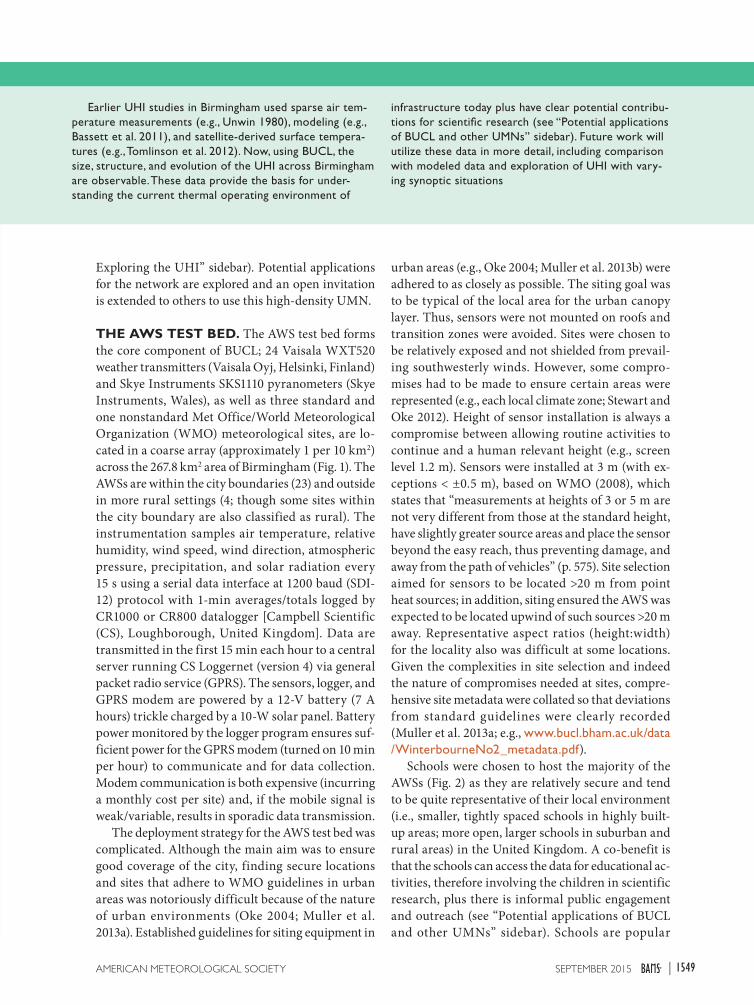
THE AWS TEST BED. The AWS test bed forms the core component of BUCL; 24 Vaisala WXT520 weather transmitters (Vaisala Oyj, Helsinki, Finland) and Skye Instruments SKS1110 pyranometers (Skye Instruments, Wales), as well as three standard and one nonstandard Met Office/World Meteorological Organization (WMO) meteorological sites, are lo-cated in a coarse array (approximately 1 per 10 km2) across the 267.8 km2 area of Birmingham (Fig. 1). The AWSs are within the city boundaries (23) and outside in more rural settings (4; though some sites within the city boundary are also classified as rural). The instrumentation samples air temperature, relative humidity, wind speed, wind direction, atmospheric pressure, precipitation, and solar radiation every 15 s using a serial data interface at 1200 baud (SDI-12) protocol with 1-min averages/totals logged by CR1000 or CR800 datalogger [Campbell Scientific (CS), Loughborough, United Kingdom]. Data are transmitted in the first 15 min each hour to a central server running CS Loggernet (version 4) via general packet radio service (GPRS). The sensors, logger, and GPRS modem are powered by a 12-V battery (7 A hours) trickle charged by a 10-W solar panel. Battery power monitored by the logger program ensures suf-ficient power for the GPRS modem (turned on 10 min per hour) to communicate and for data collection. Modem communication is both expensive (incurring a monthly cost per site) and, if the mobile signal is weak/variable, results in sporadic data transmission.
The deployment strategy for the AWS test bed was complicated. Although the main aim was to ensure good coverage of the city, finding secure locations and sites that adhere to WMO guidelines in urban areas was notoriously difficult because of the nature of urban environments (Oke 2004; Muller et al. 2013a). Established guidelines for siting equipment in
urban areas (e.g., Oke 2004; Muller et al. 2013b) were adhered to as closely as possible. The siting goal was to be typical of the local area for the urban canopy layer. Thus, sensors were not mounted on roofs and transition zones were avoided. Sites were chosen to be relatively exposed and not shielded from prevail-ing southwesterly winds. However, some compro-mises had to be made to ensure certain areas were represented (e.g., each local climate zone; Stewart and Oke 2012). Height of sensor installation is always a compromise between allowing routine activities to continue and a human relevant height (e.g., screen level 1.2 m). Sensors were installed at 3 m (with ex-ceptions < ±0.5 m), based on WMO (2008), which states that “measurements at heights of 3 or 5 m are not very different from those at the standard height, have slightly greater source areas and place the sensor beyond the easy reach, thus preventing damage, and away from the path of vehicles” (p. 575). Site selection aimed for sensors to be located >20 m from point heat sources; in addition, siting ensured the AWS was expected to be located upwind of such sources >20 m away. Representative aspect ratios (height:width) for the locality also was difficult at some locations. Given the complexities in site selection and indeed the nature of compromises needed at sites, compre-hensive site metadata were collated so that deviations from standard guidelines were clearly recorded (Muller et al. 2013a; e.g., www.bucl.bham.ac.uk/data /WinterbourneNo2_metadata.pdf).
Schools were chosen to host the majority of the AWSs (Fig. 2) as they are relatively secure and tend to be quite representative of their local environment (i.e., smaller, tightly spaced schools in highly built-up areas; more open, larger schools in suburban and rural areas) in the United Kingdom. A co-benefit is that the schools can access the data for educational ac-tivities, therefore involving the children in scientific research, plus there is informal public engagement and outreach (see “Potential applications of BUCL and other UMNs” sidebar). Schools are popular
infrastructure today plus have clear potential contribu-tions for scientific research (see “Potential applications of BUCL and other UMNs” sidebar). Future work will utilize these data in more detail, including comparison with modeled data and exploration of UHI with vary-ing synoptic situations
1549SEPTEMBER 2015AMERICAN METEOROLOGICAL SOCIETY |
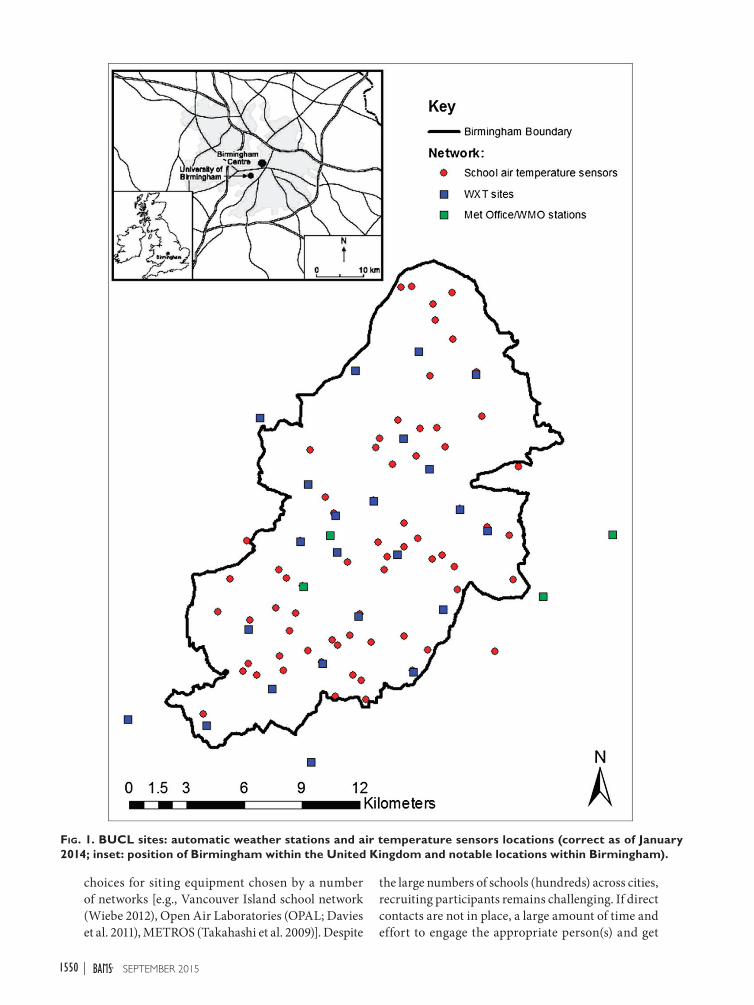
Fig. 1. BUCL sites: automatic weather stations and air temperature sensors locations (correct as of January 2014; inset: position of Birmingham within the United Kingdom and notable locations within Birmingham).
choices for siting equipment chosen by a number of networks [e.g., Vancouver Island school network (Wiebe 2012), Open Air Laboratories (OPAL; Davies et al. 2011), METROS (Takahashi et al. 2009)]. Despite
the large numbers of schools (hundreds) across cities, recruiting participants remains challenging. If direct contacts are not in place, a large amount of time and effort to engage the appropriate person(s) and get
1550 SEPTEMBER 2015|
necessary authorizations is required. Methods to recruit the schools involved in BUCL communica-tion over a period of 2½ years included blanket and directed e-mails, cold calls, mailouts, university school liaison teams, local authorities, local and na-tional environmental and educational groups and societies [e.g., Royal Geographical Society; Royal Meteorological Society; Science, Technology, En-gineering and Mathematics Network (STEMNET) United Kingdom], teacher groups, school information and communication technology (ICT) groups, and word of mouth. However, despite these efforts, fewer than 25% of Birmingham’s schools have engaged in the project.
Overall, the AWS test bed is the main component of BUCL, with the intent to provide long-term high-resolution, high-quality data for a variety of urban applications (see “Potential applications of BUCL and other UMNs” sidebar). A demonstration of the util-ity of this test bed is the evaluation of an embedded network of low-cost air temperature sensors.
A HIGH-DENSITY, LOW-COST TEMPERA-TURE SENSOR NETWORK. Over 80 low-cost, wireless Aginova Sentinel Micro (ASM) air tempera-ture sensors are located across Birmingham with an average spacing of approximately 3 km (Fig. 1). Except for the three sensors located in surrounding urban areas, they are all installed within the city boundary. The deployment strategy was based on a desire to have a sensor located as close as possible to the centroid of
each of the 109 middle-layer super-output area in Bir-mingham. These are the standard geographical areas (each containing an average of 10,000 people) used to aggregate national statistics in the United Kingdom. The advantage of using this approach is that other data (e.g., health, energy, and neighborhood statistics) are readily available at the same scale for analysis.
The ASM [~$150 (U.S. dollars)] has a weather proofed enclosure containing a wireless communications card [2.4-GHz Wi-Fi Institute of Electrical and Electronics Engineers (IEEE) 802.11b/g standard, data rates up to 11 Mbps] with inbuilt omnidirectional antenna mounted to a circuit board with a small amount of flash memory and the thermistor electronics, all pow-ered by an AA 3.6-V lithium thionyl chloride battery. The thermistor probe is mounted within a bespoke low-cost, nonaspirated radiation shield (Fig. 3). Unlike similarly designed but more expensive, higher-precision, and finer accuracy probes on the market, the ASM does not require an additional datalogger or communication interface to allow near-real-time data transmission. Initial testing, including calibration against traceable standards, demonstrated the potential of this lower-cost, low-power, yet comparable in quality sensor could be a fundamental part of IoT infrastruc-ture. A comprehensive overview and assessment of the ASM is provided in Young et al. (2014).
Because the ASM can use existing Wi-Fi networks, communication costs that may otherwise be prohibi-tive to extensive deployment are significantly reduced. The ASM uses standard encryption methods [Wi-Fi
Fig. 2. Photographs of WXT in typical school sites.
1551SEPTEMBER 2015AMERICAN METEOROLOGICAL SOCIETY |
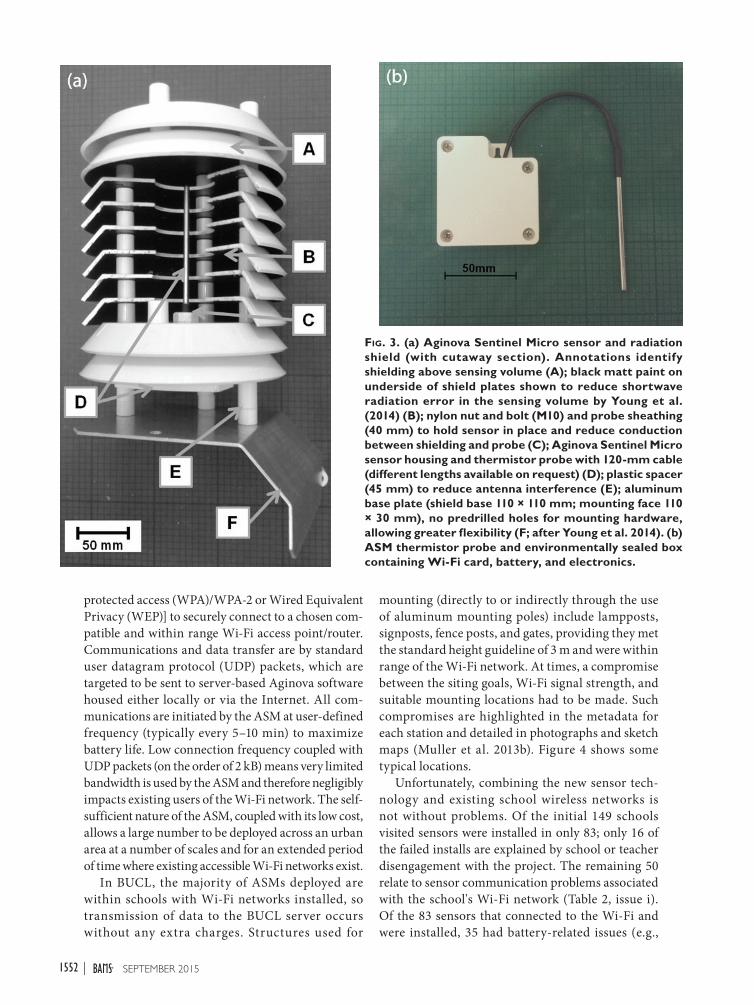
Fig. 3. (a) Aginova Sentinel Micro sensor and radiation shield (with cutaway section). Annotations identify shielding above sensing volume (A); black matt paint on underside of shield plates shown to reduce shortwave radiation error in the sensing volume by Young et al. (2014) (B); nylon nut and bolt (M10) and probe sheathing (40 mm) to hold sensor in place and reduce conduction between shielding and probe (C); Aginova Sentinel Micro sensor housing and thermistor probe with 120-mm cable (different lengths available on request) (D); plastic spacer (45 mm) to reduce antenna interference (E); aluminum base plate (shield base 110 × 110 mm; mounting face 110 × 30 mm), no predrilled holes for mounting hardware, allowing greater flexibility (F; after Young et al. 2014). (b) ASM thermistor probe and environmentally sealed box containing Wi-Fi card, battery, and electronics.
protected access (WPA)/WPA-2 or Wired Equivalent Privacy (WEP)] to securely connect to a chosen com-patible and within range Wi-Fi access point/router. Communications and data transfer are by standard user datagram protocol (UDP) packets, which are targeted to be sent to server-based Aginova software housed either locally or via the Internet. All com-munications are initiated by the ASM at user-defined frequency (typically every 5–10 min) to maximize battery life. Low connection frequency coupled with UDP packets (on the order of 2 kB) means very limited bandwidth is used by the ASM and therefore negligibly impacts existing users of the Wi-Fi network. The self-sufficient nature of the ASM, coupled with its low cost, allows a large number to be deployed across an urban area at a number of scales and for an extended period of time where existing accessible Wi-Fi networks exist.
In BUCL, the majority of ASMs deployed are within schools with Wi-Fi networks installed, so transmission of data to the BUCL server occurs without any extra charges. Structures used for
mounting (directly to or indirectly through the use of aluminum mounting poles) include lampposts, signposts, fence posts, and gates, providing they met the standard height guideline of 3 m and were within range of the Wi-Fi network. At times, a compromise between the siting goals, Wi-Fi signal strength, and suitable mounting locations had to be made. Such compromises are highlighted in the metadata for each station and detailed in photographs and sketch maps (Muller et al. 2013b). Figure 4 shows some typical locations.
Unfortunately, combining the new sensor tech-nology and existing school wireless networks is not without problems. Of the initial 149 schools visited sensors were installed in only 83; only 16 of the failed installs are explained by school or teacher disengagement with the project. The remaining 50 relate to sensor communication problems associated with the school's Wi-Fi network (Table 2, issue i). Of the 83 sensors that connected to the Wi-Fi and were installed, 35 had battery-related issues (e.g.,
1552 SEPTEMBER 2015|
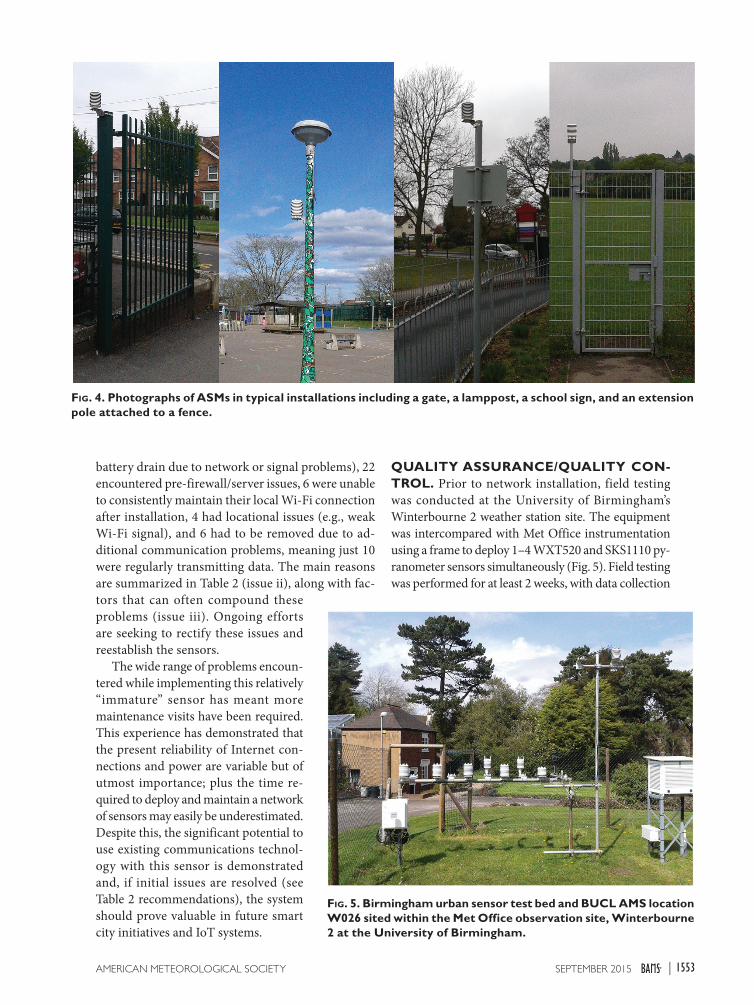
Fig. 4. Photographs of ASMs in typical installations including a gate, a lamppost, a school sign, and an extension pole attached to a fence.
battery drain due to network or signal problems), 22 encountered pre-firewall/server issues, 6 were unable to consistently maintain their local Wi-Fi connection after installation, 4 had locational issues (e.g., weak Wi-Fi signal), and 6 had to be removed due to ad-ditional communication problems, meaning just 10 were regularly transmitting data. The main reasons are summarized in Table 2 (issue ii), along with fac-tors that can often compound these problems (issue iii). Ongoing efforts are seeking to rectify these issues and reestablish the sensors.
The wide range of problems encoun-tered while implementing this relatively “immature” sensor has meant more maintenance visits have been required. This experience has demonstrated that the present reliability of Internet con-nections and power are variable but of utmost importance; plus the time re-quired to deploy and maintain a network of sensors may easily be underestimated. Despite this, the significant potential to use existing communications technol-ogy with this sensor is demonstrated and, if initial issues are resolved (see Table 2 recommendations), the system should prove valuable in future smart city initiatives and IoT systems.
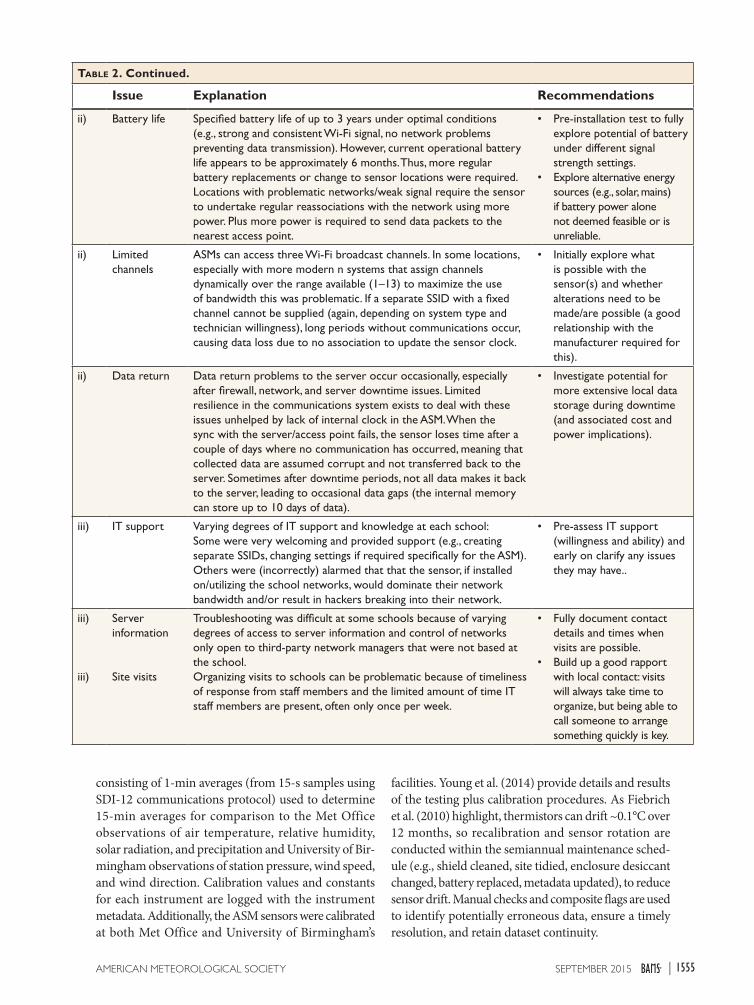
QUALITY ASSURANCE/QUALITY CON-TROL. Prior to network installation, field testing was conducted at the University of Birmingham’s Winterbourne 2 weather station site. The equipment was intercompared with Met Office instrumentation using a frame to deploy 1–4 WXT520 and SKS1110 py-ranometer sensors simultaneously (Fig. 5). Field testing was performed for at least 2 weeks, with data collection
Fig. 5. Birmingham urban sensor test bed and BUCL AMS location W026 sited within the Met Office observation site, Winterbourne 2 at the University of Birmingham.
1553SEPTEMBER 2015AMERICAN METEOROLOGICAL SOCIETY |
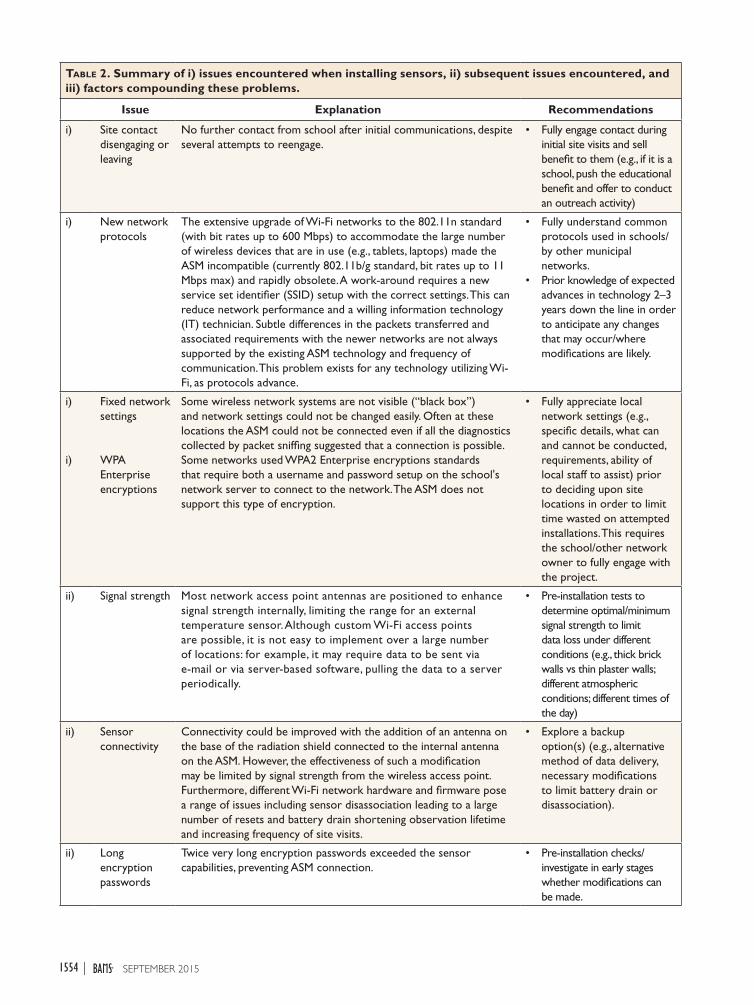
Table 2. Summary of i) issues encountered when installing sensors, ii) subsequent issues encountered, and iii) factors compounding these problems.
Issue Explanation Recommendations
i) Site contact disengaging or leaving
No further contact from school after initial communications, despite several attempts to reengage.
• Fully engage contact during initial site visits and sell benefit to them (e.g., if it is a school, push the educational benefit and offer to conduct an outreach activity)
i) New network protocols
The extensive upgrade of Wi-Fi networks to the 802.11n standard (with bit rates up to 600 Mbps) to accommodate the large number of wireless devices that are in use (e.g., tablets, laptops) made the ASM incompatible (currently 802.11b/g standard, bit rates up to 11 Mbps max) and rapidly obsolete. A work-around requires a new service set identifier (SSID) setup with the correct settings. This can reduce network performance and a willing information technology (IT) technician. Subtle differences in the packets transferred and associated requirements with the newer networks are not always supported by the existing ASM technology and frequency of communication. This problem exists for any technology utilizing Wi-Fi, as protocols advance.
• Fully understand common protocols used in schools/by other municipal networks.
• Prior knowledge of expected advances in technology 2–3 years down the line in order to anticipate any changes that may occur/where modifications are likely.
i)
i)
Fixed network settings
WPA Enterprise encryptions
Some wireless network systems are not visible (“black box”) and network settings could not be changed easily. Often at these locations the ASM could not be connected even if all the diagnostics collected by packet sniffing suggested that a connection is possible.Some networks used WPA2 Enterprise encryptions standards that require both a username and password setup on the school's network server to connect to the network. The ASM does not support this type of encryption.
• Fully appreciate local network settings (e.g., specific details, what can and cannot be conducted, requirements, ability of local staff to assist) prior to deciding upon site locations in order to limit time wasted on attempted installations. This requires the school/other network owner to fully engage with the project.
ii) Signal strength Most network access point antennas are positioned to enhance signal strength internally, limiting the range for an external temperature sensor. Although custom Wi-Fi access points are possible, it is not easy to implement over a large number of locations: for example, it may require data to be sent via e-mail or via server-based software, pulling the data to a server periodically.
• Pre-installation tests to determine optimal/minimum signal strength to limit data loss under different conditions (e.g., thick brick walls vs thin plaster walls; different atmospheric conditions; different times of the day)
ii) Sensor connectivity
Connectivity could be improved with the addition of an antenna on the base of the radiation shield connected to the internal antenna on the ASM. However, the effectiveness of such a modification may be limited by signal strength from the wireless access point. Furthermore, different Wi-Fi network hardware and firmware pose a range of issues including sensor disassociation leading to a large number of resets and battery drain shortening observation lifetime and increasing frequency of site visits.
• Explore a backup option(s) (e.g., alternative method of data delivery, necessary modifications to limit battery drain or disassociation).
ii) Long encryption passwords
Twice very long encryption passwords exceeded the sensor capabilities, preventing ASM connection.
• Pre-installation checks/investigate in early stages whether modifications can be made.
1554 SEPTEMBER 2015|
ii) Battery life Specified battery life of up to 3 years under optimal conditions (e.g., strong and consistent Wi-Fi signal, no network problems preventing data transmission). However, current operational battery life appears to be approximately 6 months. Thus, more regular battery replacements or change to sensor locations were required. Locations with problematic networks/weak signal require the sensor to undertake regular reassociations with the network using more power. Plus more power is required to send data packets to the nearest access point.
• Pre-installation test to fully explore potential of battery under different signal strength settings.
• Explore alternative energy sources (e.g., solar, mains) if battery power alone not deemed feasible or is unreliable.
ii) Limited channels
ASMs can access three Wi-Fi broadcast channels. In some locations, especially with more modern n systems that assign channels dynamically over the range available (1–13) to maximize the use of bandwidth this was problematic. If a separate SSID with a fixed channel cannot be supplied (again, depending on system type and technician willingness), long periods without communications occur, causing data loss due to no association to update the sensor clock.
• Initially explore what is possible with the sensor(s) and whether alterations need to be made/are possible (a good relationship with the manufacturer required for this).
ii) Data return Data return problems to the server occur occasionally, especially after firewall, network, and server downtime issues. Limited resilience in the communications system exists to deal with these issues unhelped by lack of internal clock in the ASM. When the sync with the server/access point fails, the sensor loses time after a couple of days where no communication has occurred, meaning that collected data are assumed corrupt and not transferred back to the server. Sometimes after downtime periods, not all data makes it back to the server, leading to occasional data gaps (the internal memory can store up to 10 days of data).
• Investigate potential for more extensive local data storage during downtime (and associated cost and power implications).
iii) IT support Varying degrees of IT support and knowledge at each school: Some were very welcoming and provided support (e.g., creating separate SSIDs, changing settings if required specifically for the ASM). Others were (incorrectly) alarmed that that the sensor, if installed on/utilizing the school networks, would dominate their network bandwidth and/or result in hackers breaking into their network.
• Pre-assess IT support (willingness and ability) and early on clarify any issues they may have..
iii)
iii)
Server information
Site visits
Troubleshooting was difficult at some schools because of varying degrees of access to server information and control of networks only open to third-party network managers that were not based at the school.Organizing visits to schools can be problematic because of timeliness of response from staff members and the limited amount of time IT staff members are present, often only once per week.
• Fully document contact details and times when visits are possible.
• Build up a good rapport with local contact: visits will always take time to organize, but being able to call someone to arrange something quickly is key.
Table 2. Continued.
Issue Explanation Recommendations
consisting of 1-min averages (from 15-s samples using SDI-12 communications protocol) used to determine 15-min averages for comparison to the Met Office observations of air temperature, relative humidity, solar radiation, and precipitation and University of Bir-mingham observations of station pressure, wind speed, and wind direction. Calibration values and constants for each instrument are logged with the instrument metadata. Additionally, the ASM sensors were calibrated at both Met Office and University of Birmingham’s
facilities. Young et al. (2014) provide details and results of the testing plus calibration procedures. As Fiebrich et al. (2010) highlight, thermistors can drift ~0.1°C over 12 months, so recalibration and sensor rotation are conducted within the semiannual maintenance sched-ule (e.g., shield cleaned, site tidied, enclosure desiccant changed, battery replaced, metadata updated), to reduce sensor drift. Manual checks and composite flags are used to identify potentially erroneous data, ensure a timely resolution, and retain dataset continuity.
1555SEPTEMBER 2015AMERICAN METEOROLOGICAL SOCIETY |
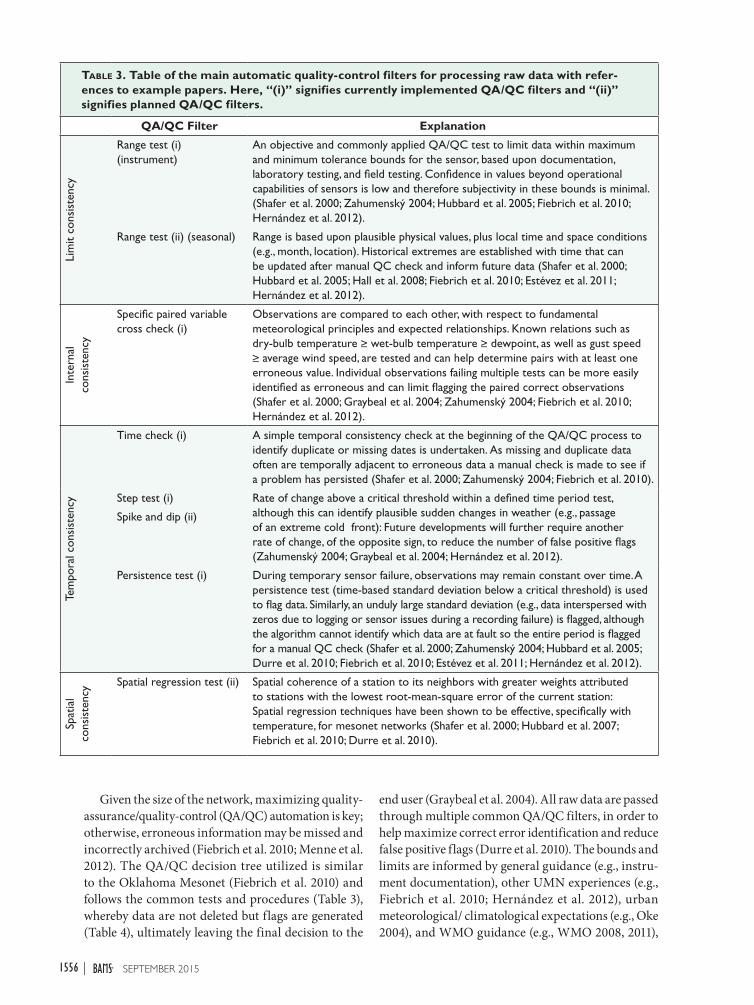
Table 3. Table of the main automatic quality-control filters for processing raw data with refer-ences to example papers. Here, “(i)” signifies currently implemented QA/QC filters and “(ii)” signifies planned QA/QC filters.
QA/QC Filter Explanation
Lim
it co
nsis
tenc
y
Range test (i) (instrument)
An objective and commonly applied QA/QC test to limit data within maximum and minimum tolerance bounds for the sensor, based upon documentation, laboratory testing, and field testing. Confidence in values beyond operational capabilities of sensors is low and therefore subjectivity in these bounds is minimal. (Shafer et al. 2000; Zahumenský 2004; Hubbard et al. 2005; Fiebrich et al. 2010; Hernández et al. 2012).
Range test (ii) (seasonal) Range is based upon plausible physical values, plus local time and space conditions (e.g., month, location). Historical extremes are established with time that can be updated after manual QC check and inform future data (Shafer et al. 2000; Hubbard et al. 2005; Hall et al. 2008; Fiebrich et al. 2010; Estévez et al. 2011; Hernández et al. 2012).
Inte
rnal
co
nsis
tenc
y
Specific paired variable cross check (i)
Observations are compared to each other, with respect to fundamental meteorological principles and expected relationships. Known relations such as dry-bulb temperature ≥ wet-bulb temperature ≥ dewpoint, as well as gust speed ≥ average wind speed, are tested and can help determine pairs with at least one erroneous value. Individual observations failing multiple tests can be more easily identified as erroneous and can limit flagging the paired correct observations (Shafer et al. 2000; Graybeal et al. 2004; Zahumenský 2004; Fiebrich et al. 2010; Hernández et al. 2012).
Tem
pora
l con
sist
ency
Time check (i) A simple temporal consistency check at the beginning of the QA/QC process to identify duplicate or missing dates is undertaken. As missing and duplicate data often are temporally adjacent to erroneous data a manual check is made to see if a problem has persisted (Shafer et al. 2000; Zahumenský 2004; Fiebrich et al. 2010).
Step test (i) Rate of change above a critical threshold within a defined time period test, although this can identify plausible sudden changes in weather (e.g., passage of an extreme cold front): Future developments will further require another rate of change, of the opposite sign, to reduce the number of false positive flags (Zahumenský 2004; Graybeal et al. 2004; Hernández et al. 2012).
Spike and dip (ii)
Persistence test (i) During temporary sensor failure, observations may remain constant over time. A persistence test (time-based standard deviation below a critical threshold) is used to flag data. Similarly, an unduly large standard deviation (e.g., data interspersed with zeros due to logging or sensor issues during a recording failure) is flagged, although the algorithm cannot identify which data are at fault so the entire period is flagged for a manual QC check (Shafer et al. 2000; Zahumenský 2004; Hubbard et al. 2005; Durre et al. 2010; Fiebrich et al. 2010; Estévez et al. 2011; Hernández et al. 2012).
Spat
ial
cons
iste
ncy Spatial regression test (ii) Spatial coherence of a station to its neighbors with greater weights attributed
to stations with the lowest root-mean-square error of the current station: Spatial regression techniques have been shown to be effective, specifically with temperature, for mesonet networks (Shafer et al. 2000; Hubbard et al. 2007; Fiebrich et al. 2010; Durre et al. 2010).
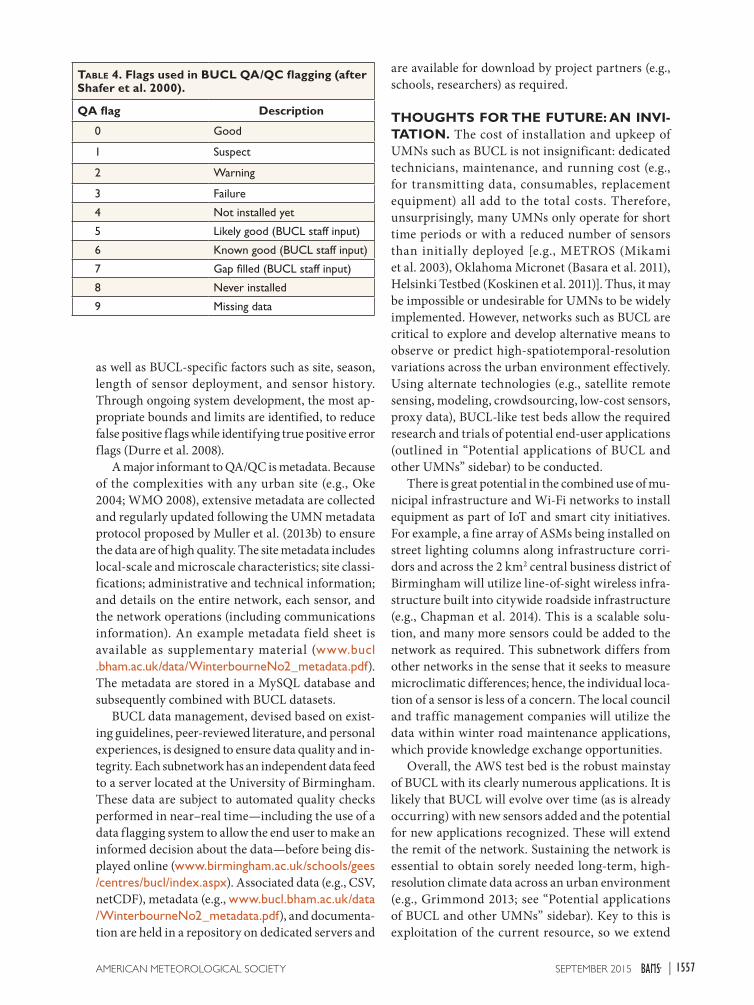
Given the size of the network, maximizing quality-assurance/quality-control (QA/QC) automation is key; otherwise, erroneous information may be missed and incorrectly archived (Fiebrich et al. 2010; Menne et al. 2012). The QA/QC decision tree utilized is similar to the Oklahoma Mesonet (Fiebrich et al. 2010) and follows the common tests and procedures (Table 3), whereby data are not deleted but flags are generated (Table 4), ultimately leaving the final decision to the
end user (Graybeal et al. 2004). All raw data are passed through multiple common QA/QC filters, in order to help maximize correct error identification and reduce false positive flags (Durre et al. 2010). The bounds and limits are informed by general guidance (e.g., instru-ment documentation), other UMN experiences (e.g., Fiebrich et al. 2010; Hernández et al. 2012), urban meteorological/ climatological expectations (e.g., Oke 2004), and WMO guidance (e.g., WMO 2008, 2011),
1556 SEPTEMBER 2015|
as well as BUCL-specific factors such as site, season, length of sensor deployment, and sensor history. Through ongoing system development, the most ap-propriate bounds and limits are identified, to reduce false positive flags while identifying true positive error flags (Durre et al. 2008).
A major informant to QA/QC is metadata. Because of the complexities with any urban site (e.g., Oke 2004; WMO 2008), extensive metadata are collected and regularly updated following the UMN metadata protocol proposed by Muller et al. (2013b) to ensure the data are of high quality. The site metadata includes local-scale and microscale characteristics; site classi-fications; administrative and technical information; and details on the entire network, each sensor, and the network operations (including communications information). An example metadata field sheet is available as supplementary material (www.bucl .bham.ac.uk/data/WinterbourneNo2_metadata.pdf). The metadata are stored in a MySQL database and subsequently combined with BUCL datasets.
BUCL data management, devised based on exist-ing guidelines, peer-reviewed literature, and personal experiences, is designed to ensure data quality and in-tegrity. Each subnetwork has an independent data feed to a server located at the University of Birmingham. These data are subject to automated quality checks performed in near–real time—including the use of a data flagging system to allow the end user to make an informed decision about the data—before being dis-played online (www.birmingham.ac.uk/schools/gees /centres/bucl/index.aspx). Associated data (e.g., CSV, netCDF), metadata (e.g., www.bucl.bham.ac.uk/data /WinterbourneNo2_metadata.pdf), and documenta-tion are held in a repository on dedicated servers and
are available for download by project partners (e.g., schools, researchers) as required.
THOUGHTS FOR THE FUTURE: AN INVI-TATION. The cost of installation and upkeep of UMNs such as BUCL is not insignificant: dedicated technicians, maintenance, and running cost (e.g., for transmitting data, consumables, replacement equipment) all add to the total costs. Therefore, unsurprisingly, many UMNs only operate for short time periods or with a reduced number of sensors than initially deployed [e.g., METROS (Mikami et al. 2003), Oklahoma Micronet (Basara et al. 2011), Helsinki Testbed (Koskinen et al. 2011)]. Thus, it may be impossible or undesirable for UMNs to be widely implemented. However, networks such as BUCL are critical to explore and develop alternative means to observe or predict high-spatiotemporal-resolution variations across the urban environment effectively. Using alternate technologies (e.g., satellite remote sensing, modeling, crowdsourcing, low-cost sensors, proxy data), BUCL-like test beds allow the required research and trials of potential end-user applications (outlined in “Potential applications of BUCL and other UMNs” sidebar) to be conducted.
There is great potential in the combined use of mu-nicipal infrastructure and Wi-Fi networks to install equipment as part of IoT and smart city initiatives. For example, a fine array of ASMs being installed on street lighting columns along infrastructure corri-dors and across the 2 km2 central business district of Birmingham will utilize line-of-sight wireless infra-structure built into citywide roadside infrastructure (e.g., Chapman et al. 2014). This is a scalable solu-tion, and many more sensors could be added to the network as required. This subnetwork differs from other networks in the sense that it seeks to measure microclimatic differences; hence, the individual loca-tion of a sensor is less of a concern. The local council and traffic management companies will utilize the data within winter road maintenance applications, which provide knowledge exchange opportunities.
Overall, the AWS test bed is the robust mainstay of BUCL with its clearly numerous applications. It is likely that BUCL will evolve over time (as is already occurring) with new sensors added and the potential for new applications recognized. These will extend the remit of the network. Sustaining the network is essential to obtain sorely needed long-term, high-resolution climate data across an urban environment (e.g., Grimmond 2013; see “Potential applications of BUCL and other UMNs” sidebar). Key to this is exploitation of the current resource, so we extend
Table 4. Flags used in BUCL QA/QC flagging (after Shafer et al. 2000).
QA flag Description
0 Good
1 Suspect
2 Warning
3 Failure
4 Not installed yet
5 Likely good (BUCL staff input)
6 Known good (BUCL staff input)
7 Gap filled (BUCL staff input)
8 Never installed
9 Missing data
1557SEPTEMBER 2015AMERICAN METEOROLOGICAL SOCIETY |
an invitation to researchers and end users to utilize BUCL for their projects. As demonstrated, UMNs are time consuming, challenging, and expensive to run. A current focus perhaps needs to be on further investi-gating, developing, and testing the technology using test beds before UMNs are more widely deployed in cites worldwide, to ensure the emerging techniques are smart and ultimately yield high-resolution data in any urban area at a low cost and effort.
In conclusion, given the complexities in deploying and maintaining UMNs beyond the demonstration phase, it perhaps highlights that a UMN is a luxury that the majority of cities cannot realistically afford. Hence, it is proposed that existing UMNs now have an important role to play as test beds for experimenta-tion with more sustainable techniques now becoming possible in our increasingly smart cities (e.g., IoT sensors, crowdsourced data). The use of UMNs in this way is unprecedented and would enable ground-breaking, quality-assured urban climate datasets to be extensively (and rapidly) produced for translation into cities worldwide.
ACKNOWLEDGMENTS. This work is funded by the U.K. Natural Environmental Research Council (Research Grants NE/I006915/1 and NE/I007032/1).
REFERENCESAnderson, A. R. S., M. Chapman, S. D. Drobot,
A. Tadesse, B. Lambi, G. Wiener, and P. Pisano, 2012: Quality of mobile air temperature and at-mospheric pressure observations from the 2010 Development Test Environment Experiment. J. Appl. Meteor. Climatol., 51, 691–701, doi:10.1175 /JAMC-D-11-0126.1.
Ashie, Y., and T. Kono, 2011: Urban-scale CFD analysis in support of a climate-sensitive design for the Tokyo Bay area. Int. J. Climatol., 31, 174–188, doi:10.1002 /joc.2226.
Ashton, K., 2009: That ‘Internet of Things’ thing: In the real world things matter more than ideas. RFID Journal. [Available online at www.rfidjournal.com /articles/view?4986.]
Basara, J. B., and Coauthors, 2011: The Oklahoma City Mi-cronet. Meteor. Appl., 18, 252–261, doi:10.1002/met.189.
Bassett, R., J. Thornes, X. Cai, and R. Rees, 2011: Bir-mingham Urban Climate Change with Neighbour-hood Estimates of Environmental Risk (BUCCA-NEER). 2011 Fall Meeting, San Francisco, CA, Amer. Geophys. Union, Abstract GC33B-1070.
Best, M. J., and Coauthors, 2011: The Joint UK Land En-vironment Simulator (JULES), model description—
Part 1: Energy and water fluxes. Geosci. Model Dev., 4, 677–699, doi:10.5194/gmd-4-677-2011.
Cassano, J. J., 2013: Weather bike: A bicycle-based weather station for observing local temperature variations. Bull. Amer. Meteor. Soc., 95, 205–209, doi:10.1175/BAMS-D-13-00044.1.
Chapman, L., D. T. Young, C. L. Muller, P. Rose, C. Lucas, and J. Walden, 2014: Winter road mainte-nance and the Internet of Things. Proc. 17th Standing Int. Road Weather Commission (SIRWEC) Conf., La Massana, Andorra, 005. [Available online at www .sirwec.org/Papers/andorra/5.pdf.]
Chen, F., and Coauthors, 2011: The integrated WRF/urban modelling system: Development, evaluation, and applications to urban environmental problems. Int. J. Climatol., 31, 273–288, doi:10.1002/joc.2158.
Davies, L., and Coauthors, 2011: Open Air Laboratories (OPAL): A community-driven research programme. Environ. Pollut., 159, 2203–2210, doi:10.1016/j .envpol.2011.02.053.
Drobot, S. D., M. Chapman, P. A. Pisano, and B. B. McKeever, 2010: Using vehicles as mobile weather platforms. Data and Mobility: Transforming Infor-mation into Intelligent Traffic and Transportation Services, J. Duh et al., Eds., Springer, 203–214.
Durre, I., M. J. Menne, and R. S. Vose, 2008: Strat-egies for evaluating quality assurance proce-dures. J. Appl. Meteor. Climatol., 47, 1785–1791, doi:10.1175/2007JAMC1706.1.
—, —, B. E. Gleason, T. G. Houston, and R. S. Vose, 2010: Comprehensive automated quality assurance of daily surface observations. J. Appl. Meteor. Climatol., 49, 1615–1633, doi:10.1175/2010JAMC2375.1.
Estévez, J., P. Gavilán, and J. V. Giráldez, 2011: Guide-lines on validation procedures for meteorological data from automatic weather stations. J. Hydrol., 402, 144–154, doi:10.1016/j.jhydrol.2011.02.031.
Evans, D., 2011: The Internet of things: How the next evolution of the Internet is changing everything. Cisco White Paper, 11 pp. [Available online at www.cisco.com/web/about/ac79/docs/innov/IoT _IBSG_0411FINAL.pdf.]
Falconer, G., and S. Mitchell, 2012: Smart City frame-work: A systematic process for enabling smart + connected communities. Cisco Point of View Paper, 11 pp. [Available online at www.cisco.com/web /about/ac79/docs/ps/motm/Smart-City-Framework .pdf.]
Fiebrich, C. A., C. R. Morgan, A. G. McCombs, P. K. Hall, and R. A. McPherson, 2010: Quality as-surance procedures for mesoscale meteorological data. J. Atmos. Oceanic Technol., 27, 1565–1582, doi:10.1175/2010JTECHA1433.1.
1558 SEPTEMBER 2015|
Graybeal, D. Y., T. DeGaetano, and K. L. Eggleston, 2004: Improved quality assurance for historical hourly temperature and humidity: Development and application to environmental analysis. J. Appl. Meteor., 43, 1722–1735, doi:10.1175/JAM2162.1.
Greater London Authority, 2006: London's urban heat island: A summary for decision makers. Mayor of London Rep., 26 pp. [Available online at http://static .london.gov.uk/mayor/environment/climate-change /docs/UHI_summary_report.pdf.]
Grimmond, C. S. B., 2013: Observing London: Weather data needed for London to thrive. London Climate Change Partnership Executive Summary, 5 pp. [Available online at http://climatelondon.org.uk /wp-content/uploads/2013/07/Observing-London -Executive-Summary.pdf.]
Hajat, S., S. Vardoulakis, C. Heaviside, and B. Eggen, 2013: Climate change effects on human health: Projections of temperature-related mortality for the UK during the 2020s, 2050s and 2080s. J. Epidemiol. Community Health, 68, 641–648, doi:10.1136/jech-2013-202449.
Hall, P. K. R., Jr., C. R. Morgan, A. D. Gartside, N. E. Bain, R. Jabrzemski, and C. A. Fiebrich, 2008: Use of climate data to further enhance quality assurance of Oklahoma Mesonet observations. 20th Conf. on Climate Variability and Change, New Orleans, LA, Amer. Meteor. Soc., P2.7. [Available online at https://ams.confex.com/ams/pdfpapers/130407.pdf.]
Hernández, R., M. Maruri, K. Otxoa de Alda, J. Egaña, and S. Gaztelumendi, 2012: Quality control pro-cedures at Euskalmet data center. Adv. Sci. Res., 8, 129–134, doi:10.5194/asr-8-129-2012.
Hubbard, K. G., S. Goddard, W. D. Sorensen, N. Wells, and T. T. Osugi, 2005: Performance of quality assur-ance procedures for an applied climate information system. J. Atmos. Oceanic Technol., 22, 105–112, doi:10.1175/JTECH-1657.1.
—, N. B. Guttman, J. You, and Z. Chen, 2007: An improved QC process for temperature in the daily cooperative weather observations. J. Atmos. Oceanic Technol., 24, 206–213, doi:10.1175/JTECH1963.1.
Illingworth, S. M., C. L. Muller, R. Graves, and L. Chap-man, 2014: UK Citizen Rainfall Network: A pilot study. Weather, 69, 203–207, doi:10.1002/wea.2244.
Koskinen, J. T., and Coauthors, 2011: The Helsinki Testbed: A mesoscale measurement, research, and SERVICE platform. Bull. Amer. Meteor. Soc., 92, 325–342, doi:10.1175/2010BAMS2878.1.
Menne, J. M., I. Durre, R. S. Vose, B. E. Gleason, and T. G. Houston, 2012: An overview of the Global Historical Climatology Network-Daily Database. J. Atmos. Oceanic Technol., 29, 897–910, doi:10.1175 /JTECH-D-11-00103.1.
Mikami, T., H. Ando, W. Morishima, T. Izumi, and T. Shioda, 2003: A new urban heat island monitoring system in Tokyo. Proc. Fifth Int. Conf. on Urban Climate, Lodz, Poland, International Association of Urban Climate, O.3.5. [Available online at http://nargeo.geo.uni.lodz.pl/~icuc5/text/O_3_5.pdf.]
Muller, C. L., 2013: Mapping snow depth across the West Midlands using social media-generated data. Weather, 68, 82, doi:10.1002/wea.2103.
—, L. Chapman, C. S. B. Grimmond, D. T. Y. Young, and X.-M. Cai, 2013a: Toward a standardized meta-data protocol for urban meteorological networks. Bull. Amer. Meteor. Soc., 94, 1161–1185, doi:10.1175/BAMS-D-12-00096.1.
—, —, —, —, and —, 2013b: Sensors and the city: A review of urban meteorological networks. Int. J. Climatol., 33, 1585–1600, doi:10.1002/joc.3678.
—, —, S. Johnston, C. Kidd, S. Illingworth, G. Foody, A. Overeem, and R. Graves, 2015: Crowd-sourcing for climate and atmospheric sciences: Current status and future potential. Int. J. Climatol., doi:10.1002/joc.4210, in press.
Ochoa-Rodriguez, S., M. A. Rico-Ramirez, S. A. Jewell, A. N. A. Schellart, L. Wang, C. Onof, and C. Maksimovic, 2013: Improving rainfall nowcast-ing and urban runoff forecasting through dynamic radar-raingauge rainfall adjustment. Proc. Seventh Int. Conf. on Sewer Processes and Networks, Shef-field, United Kingdom, International Water Associa-tion. [Available online at www.shef.ac.uk/polopoly _fs/1.336436!/file/Ochoa_presentation_session5.pdf.]
Oke, T. R., 2007: Siting and exposure of meteorological instruments at urban sites. Air Pollution Modeling and its Application XVII, C. Borrego and A.-L. Nor-man, Eds., Springer, 615–631.
ONS, 2012: Census shows increase in population of the West Midlands. Office of National Statistics News Release, 4 pp. [Available online at www.ons.gov.uk/ons/rel/mro/news-release/census-shows-increase-in-popu-lation-of-the-west-midlands/pdfwestmidnr0712.pdf.]
Overeem, A., J. C. R. Robinson, H. Leijnse, G. J. Steeneveld, B. K. P. Horn, and R. Uijlenhoet, 2013: Crowdsourcing urban air temperatures from smart-phone battery temperatures. Geophys. Res. Lett., 40, 4081–4085, doi:10.1002/grl.50786.
Shafer, M. A., C. A. Fiebrich, D. S. Arndt, S. E. Fred-rickson, and T. W. Hughes, 2000: Quality assurance procedures in the Oklahoma mesonetwork. J. Atmos. Oceanic Technol., 17, 474–494, doi:10.1175/1520 -0426(2000)017<0474:QAPITO>2.0.CO;2.
Stewart, I. D., and T. R. Oke, 2012: “Local climate zones” for urban temperature studies. Bull. Amer. Meteor. Soc., 93, 1879–1900, doi:10.1175/BAMS-D-11-00019.1.
1559SEPTEMBER 2015AMERICAN METEOROLOGICAL SOCIETY |
Takahashi, K., T. Mikami, and H. Takahashi, 2009: Inf luence of the urban heat island phenomenon in Tokyo in land and sea breezes. Proc. Seventh Int. Conf. on Urban Climate, Yokohama, Japan, International Association of Urban Climate, P1-14. [Available online at www.ide.titech.ac.jp/~icuc7 /extended_abstracts/pdf/384122-1-090518113435 -004.pdf.]
Tomlinson, C. J., L. Chapman, J. E. Thornes, and C. J. Baker, 2012: Derivation of Birmingham’s summer sur-face urban heat island from MODIS satellite images. Int. J. Climatol., 32, 214–224, doi:10.1002/joc.2261.
—, T. Prieto-Lopez, R. Bassett, L. Chapman, X.-M. Cai, J. E. Thornes, and C. J. Baker, 2013: Showcasing urban heat island work in Birmingham—Measur-ing, monitoring, modelling and more. Weather, 68, 44–49, doi:10.1002/wea.1998.
UN, cited 2013: World urbanization prospects. [Avail-able online at http://esa.un.org/unup/.]
Unwin, D. J., 1980: The synoptic climatology or Birmingham’s urban heat island, 1965-1974. Weather, 35, 43–50, doi:10.1002/j.1477-8696.1980 .tb03484.x.
Wiebe, E. C., 2012: The Vancouver Island school-based weather network. Eighth Int. Conf. on Urban Clima-tology, Dublin, Ireland, ICUC.
WMO, 2008: Guide to meteorological instruments and methods of observation. 7th ed. WMO Instruments and Observing Methods Rep. WMO-8, 681 pp. [Avail-able online at www.wmo.int/pages/prog/gcos/docu ments/gruanmanuals/CIMO/CIMO_Guide-7th_Edi tion-2008.pdf.]
—, 2011: Guide to climatological practices. WMO Instruments and Observing Methods Rep. WMO-100, 117 pp. [Available online at www.wmo.int /pages/prog/wcp/ccl /documents/WMO_100 _en.pdf.]
Young, D. T., L. Chapman, C. L. Muller, X.-M. Cai, and C. S. B. Grimmond, 2014: A low-cost wireless tem-perature sensor: Evaluation for use in environmental applications. J. Atmos. Oceanic Technol., 31, 938–944, doi:10.1175/JTECH-D-13-00217.1.
Zahumenský, I., 2004: Guidelines on quality control procedures for data from automatic weather stations. World Meteorological Organization CIMO/OPAG-SURFACE/ET ST&MT-1/Doc.6.1(2), 10 pp.
BEST SELLER! “ Here before you is the complete guide to writing a good scientific paper….
Prepare to absorb what may prove the most valuable advice you will receive as a scientist.” — from the Foreword by Prof. Kerry Emanuel, Massachusetts Institute of Technology
Eloquent Science: A Practical Guide to Becoming a Better Writer, Speaker, and Atmospheric Scientist DAVID M. SCHULTZ
A MUST- HAVE!
What started out as a communications workshop for undergrads in atmospheric science evolved into a book that would benefit scientists at any stage in their careers. Drawing on Schultz’s experience as a journal editor and prolific writer, the insights of his colleagues, and the best advice from hundreds of sources, this must-have reference includes: n Tips for writing and reviewing scientific papers and a peek into
the operations of the publishers of scientific journals n Guidance on creating and delivering effective scientific presentations n Experts’ advice on citing others’ work, critiquing scientific
papers, communicating with the media, and more LIST $45 MEMBER $30 © 2009, PAPERBACK, 440 PAGES, ISBN 13: 978-1-878220-91-2, AMS CODE: ESCI
O R D E R T O D A Y ! ONLINE AMS BOOKSTORE www.ametsoc.org/amsbookstore OR use the order form in this magazine
half-page horizontal -- 6.5” x 4.5625”: Final 1560 SEPTEMBER 2015|