Embed Size (px)
Citation preview
University Hospital Operating Room Turnover Time
Final Report
Submitted to:
Ms. Renee Prince, Nursing Services Director, University Hospital Operating Room
Mr. Austin Chrzanowski, Continuous Improvement Specialist, Continuous Improvement
Mr. Ian Perry, Continuous Improvement Specialist, Continuous Improvement
Dr. Mark Van Oyen, IOE 481 Professor, Industrial and Operations Engineering
Ms. Mary Duck, IOE 481 Liaison, Michigan Medicine
Submitted by:
IOE 481 Project Team 9
Danielle Kessler
Hyunji Choi
Vidisha Hemani
Arda Koyunsev
Date Submitted: December 10, 2019
2
Table of Contents
Executive Summary………………………………………………………………………… 5-7
Background …………………………………………………………………….……… 5
Methodology and Findings ……………………..……………………………………… 6
Recommendations……………………………………...……………………………… 7
Introduction …………………………………...………………………………………………... 8
Background and Key Issues ……………………………………………………………… 8-10
Goals and Objectives……………………………………………………….………………... 10
Project Scope ………………………………………………………………………………. 10-11
Deliverables and Design Tasks…………………………………………………………… 11-13
Construct current-state process…………………………………...…………………... 11
Perform benchmarking analysis…………………………………...…………………… 11
Construct future state turnover standards and procedures ……………………………..11
Perform Literature Search …………...……………………..…………...………… 11-13
Past IOE 481 Project…………...……………………..…………...…………… 11
Genji Genbutsu …………...……………………..…………...………………… 12
Operating Room Start Times and Turnover Times in a University Hospital.. 12-13
Improving Operating Room Turnover Time in a New York City Academic
Hospital via
Lean…………...……………………..…………...……………………..……… 13
Design Requirements, Constraints, and Engineering Standards …………...…………. 14-15
Design Requirements (Soft Constraints) in detail…………...………………………….14
Hard Constraints in detail…………...……………………..…………...……………… 14
Engineering standards…………...……………………..…………...…………………. 15
Data Collection and Analysis Methods…………...……………………..…………...…… 15-18
Data Collection Methods…………...……………………..…………...…………… 15-16
Interviews…………...……………………..…………...……………………….. 15
Historical Data…………...……………………..…………...…………………. 15
Observations…………...……………………..…………...…………………… 15
Time Studies…………...……………………..…………...…………………… 16
Data Analysis Methods…………...……………………..…………...……………… 16-18
Swim Lane Analysis……..…………...……………………..…………...…… 16-18
Findings and Conclusions…………...……………………..…………...…………………..18-25
Interviews…………...……………………..…………...……………………………. 18-19
Historical Data Analysis …………...……………………..…………...………….. 19-23
Calculating Turnover…………...……………………..…………...……………19
ASA Score …………...……………………..…………...………………….. 19-20
Time of Day …………...……………………..…………...………………. 20-21
Case to Follow Procedure Level…………...…………………..………….. 21-22
3
Observations …………...……………………..…………...………………………. 23-24
Time Studies …………...……………………..…………...………………………….. 24
Current State Flow Chart……………………..…………...……………………… 24-25
Alternatives Considered …………...……………………..…………...………………… 25-26
Criteria for Evaluation …………...……………………..…………...………………… 26
Decision matrix …………...……………………..…………...………………………… 26
Recommendations …………...……………………..…………...………………………... 26-27
Standard turnover time …………...……………………..…………...………………… 26
Standard “room ready” time .……………………..…………...…………………… 26-27
Clear communication of expectations …………...……………………..……………….27
Expected Impact…...………………..…………...………………………........................... 27-28
Impact of standardizing turnover time…...……………………..………...………..... 27
Impact of standardizing “room ready” time…...…………………….....………......... 27
Impact of clearly communicating expectations…...……………………..……..... 27-28
Recommendations for Future Work………………...………………………........................ 28
References …………...……………………..…………...………………………..................... 29
Appendix …………...……………………..…………...……………………….................. 30-37
Appendix A: Road to 30 - Room Turnover Operating Room Efficiency Poster………. 30
Appendix B: Requirements, Constraints, and Standards Matrix …………………… 31-32
Appendix C: OR Observation Form ………...……………………..…………………. 33
Appendix D: Swim Lane………...……………………..………………….……………. 34
Appendix E: Significant and Insignificant Factors …………………………………… 35
Appendix F: Current State Map …………………………………………………………36
Appendix G: Pugh Decision Matrix………...……………………..……………….....…37
4
List of Figures and Tables
Figure 1: Turnover times are too high and vary greatly by departments ……………………… 9
Figure 2: High level current turnover process from the Nursing Services Director’s perspective.9
Figure 3: Observation Form…………………………………………………………………… 16
Figure 4: Swim Lane Analysis ……………………………………………………………….. 17
Figure 5: ASA Score Box Plot ………………………………………………………………… 20
Figure 6: Time of Day Box Plot ……………………………………………………………… 21
Figure 7: Procedure Level Service Turnover Data Error Band Line Graph …………………. 22
Figure 8: Procedure Level Surgeon Turnover Data Error Band Line Graph ………………….. 23
Figure 9: UHOR Turnover Process Current State Map ……………………………………… 25
Table 1: Swim Lane Calculations ……………………………………………………………... 18
Table 2: Turnover Calculation Table ………………………………………………………… 19
Table 3: ASA Score Turnover Data …………………………………………………………. 20
Table 4: Time of Day Turnover Data………………………………………………………… 21
Table 5: Procedure Level Turnover Data for Same Service ………………………………… 22
Table 6: Procedure Level Turnover Data for Same Surgeon ………………………………… 23
Table 7: Time Studies Data ……………………………………………………………………. 24
5
Executive Summary
The University Hospital Operating Rooms (UHOR) at the University of Michigan perform
surgical operations in a variety of services such as plastics, orthopedics, and urology. Patient
turnover time is defined as the time from when a patient leaves the OR to when the following
patient enters. Currently, the perception is that process of turning over a room in the OR takes
too long. However, there is also not a standard for how long turnover should take. To address
this concern, the Nursing Services Director requested that the student team at the University of
Michigan develop a standard for turnover time and recommend improvements to the operating
room.
To accomplish this task, the student team conducted interviews, analyzed historical data,
performed on-site observations and time studies in the operating room, and conducted a literature
search to compare the process at the UHOR to other similar institutions. Based on the results of
this data collection, the team developed recommendations for the standard amount of time a
turnover should take as well as the changes the OR staff can make to their process to improve
turnover times. The team expects that the recommendations included in this report will result in
clarity about the turnover expectations in the OR.
Background
Although the hospital handles a variety of services and case types, the student team chose to
focus on neurosurgery, urology, and orthopedic services. This decision was made because these
services represent each of the three pods of the OR and due to their high volume and variety of
cases. Additionally, urology generally has lower turnover times while neurosurgery has higher
turnover times. Comparing the cause of the differences in turnover time is useful during the
observations. The Case Time Reporting Tableau Dashboard shows that urology has an average
turnover time of 40 minutes, neurosurgery has an average of 58 minutes, and orthopedics has an
average of 53 minutes. There are currently no set standards for how long the process should take,
but concerns among surgeons, hospital staff, and patients show that improvements can be made
to standardize the turnover process.
The current process of turning over a room goes as follows. When a patient exits the room, the
perioperative technician, or PT, comes in to clean the room and the scrub takes away the
instruments from the previous patient to decontaminate them. While the room is being cleaned,
the circulator brings the patient’s paperwork to the front desk and checks on the next patient. The
anesthesiologists get a page when the patient leaves and they clean their equipment and prepare
their lines for the upcoming patient. After the room is cleaned by the PT’s, the scrub opens and
counts the instruments for the next case. Anesthesia leaves to bring the patient into the OR after
room ready is called. Once the circulator, anesthesiologist, and scrub have completed their jobs,
the next patient may enter the operating room. While this is the expected process flow, it is not

6
standardized, resulting in highly variable turnover times. As a result of this issue, the goals and
objectives of this project were to develop a standard for turnover time and turnover process
based on the data collection and analysis that the team conducts.
Methodology and Findings
The team performed the following five tasks and arrived at their respective findings in order to
evaluate and improve the current turnover process.
● Conducted interviews with various stakeholders. The student team interviewed the pod
supervisors for each of the three pods as well as the perioperative technician supervisor in
order to understand the role of each person in the turnover process as well as gain insight
to perceived current problems in the process. Through these interviews, the team defined
clear roles of the circulator, scrub, and PT.
● Analyzed historical data. The student team analyzed historical data from July 2015 to
October 2019 regarding turnover times at the UHOR. Filters such as day of the week and
emergent or urgent cases were added. The data was used to calculate turnover time and
evaluate significant or insignificant factors to turnover time such as time of day, ASA
score, and procedure level. The time of day data analysis highlighted that range of
turnover decreases from 34 min - 48min to 32 min - 46 min. The ASA data analysis
showed that there was no correlation and that the median was 40 minutes across all
levels.
● Observed turnovers in the OR. The team observed a total of 13 turnovers at various times
of day in urology, neurosurgery, and orthopedics services. Through the observations the
team concluded that PT’s generally arrived quickly, the lack of cleanup prior to case
ending increased turnover significantly and most delays were due to external factors.
● Conducted time studies. The team conducted time studies during the 13 observations in
order to evaluate the length of turnover sub-processes such as cleaning the room, opening
up the next case, and getting the next patient. The general time it took PT’s to enter was
1:33 with orthopedics have the lowest average of 0:55. The PT’s took approximately 10
minutes, anesthesia and circulators didn’t have a large impact on turnover and scrubs
took the longest with an average of 25 minutes.
● Performed literature searches. The team found 5 pieces of literature that supported the
recommended turnover time and methods to increase turnover time. The articles helped
the team come to the recommendation that turnover time should be 37 minutes and that it
would be helpful to have a surgeon in the room during turnover time.
Recommendations
After reviewing the findings from the data collection and analysis, the team developed three
recommendations: (1) establish a set standard for turnover time for each department, (2) establish
a standard for “room ready” time and (3) clearly communicate expectations for all staff members
(nurses, PT’s, scrubs, etc).
7
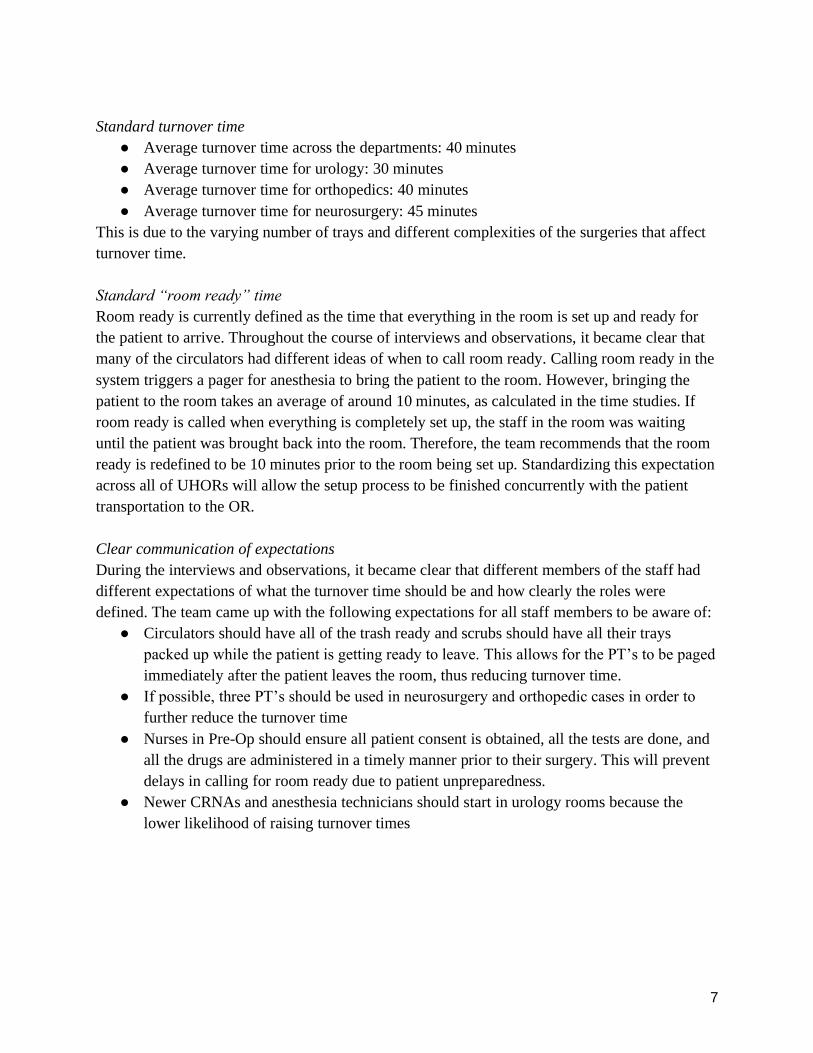
Standard turnover time
● Average turnover time across the departments: 40 minutes
● Average turnover time for urology: 30 minutes
● Average turnover time for orthopedics: 40 minutes
● Average turnover time for neurosurgery: 45 minutes
This is due to the varying number of trays and different complexities of the surgeries that affect
turnover time.
Standard “room ready” time
Room ready is currently defined as the time that everything in the room is set up and ready for
the patient to arrive. Throughout the course of interviews and observations, it became clear that
many of the circulators had different ideas of when to call room ready. Calling room ready in the
system triggers a pager for anesthesia to bring the patient to the room. However, bringing the
patient to the room takes an average of around 10 minutes, as calculated in the time studies. If
room ready is called when everything is completely set up, the staff in the room was waiting
until the patient was brought back into the room. Therefore, the team recommends that the room
ready is redefined to be 10 minutes prior to the room being set up. Standardizing this expectation
across all of UHORs will allow the setup process to be finished concurrently with the patient
transportation to the OR.
Clear communication of expectations
During the interviews and observations, it became clear that different members of the staff had
different expectations of what the turnover time should be and how clearly the roles were
defined. The team came up with the following expectations for all staff members to be aware of:
● Circulators should have all of the trash ready and scrubs should have all their trays
packed up while the patient is getting ready to leave. This allows for the PT’s to be paged
immediately after the patient leaves the room, thus reducing turnover time.
● If possible, three PT’s should be used in neurosurgery and orthopedic cases in order to
further reduce the turnover time
● Nurses in Pre-Op should ensure all patient consent is obtained, all the tests are done, and
all the drugs are administered in a timely manner prior to their surgery. This will prevent
delays in calling for room ready due to patient unpreparedness.
● Newer CRNAs and anesthesia technicians should start in urology rooms because the
lower likelihood of raising turnover times
8
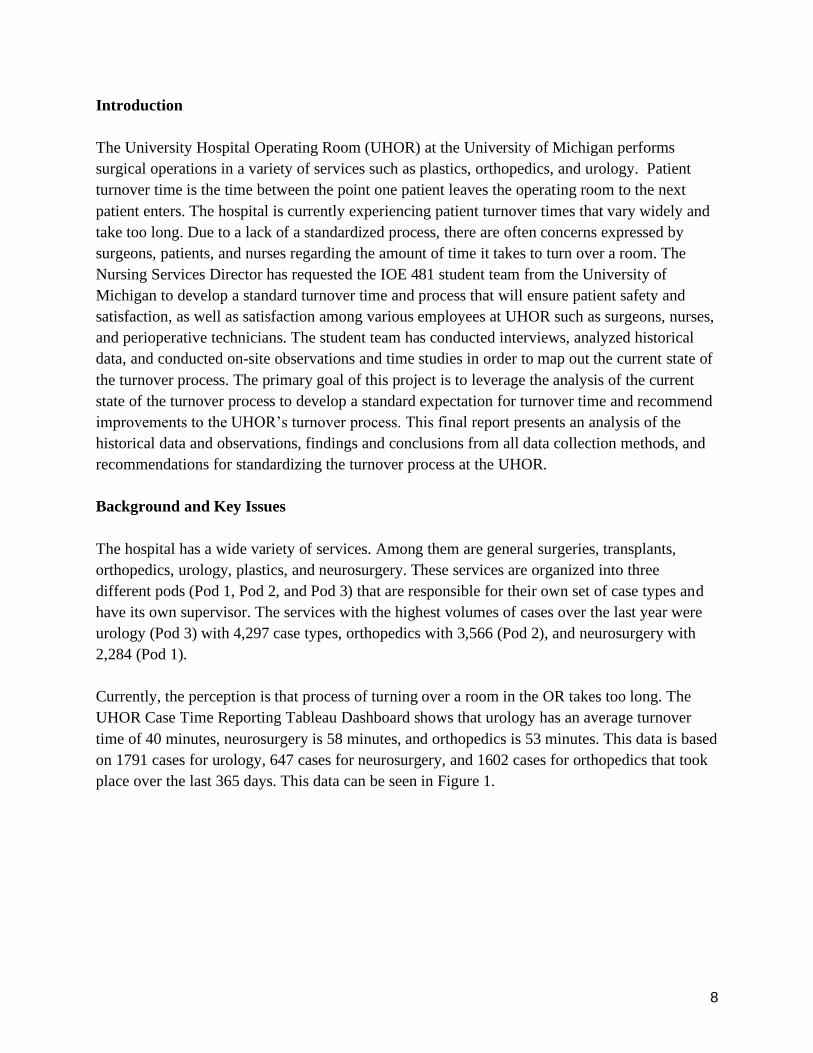
Introduction
The University Hospital Operating Room (UHOR) at the University of Michigan performs
surgical operations in a variety of services such as plastics, orthopedics, and urology. Patient
turnover time is the time between the point one patient leaves the operating room to the next
patient enters. The hospital is currently experiencing patient turnover times that vary widely and
take too long. Due to a lack of a standardized process, there are often concerns expressed by
surgeons, patients, and nurses regarding the amount of time it takes to turn over a room. The
Nursing Services Director has requested the IOE 481 student team from the University of
Michigan to develop a standard turnover time and process that will ensure patient safety and
satisfaction, as well as satisfaction among various employees at UHOR such as surgeons, nurses,
and perioperative technicians. The student team has conducted interviews, analyzed historical
data, and conducted on-site observations and time studies in order to map out the current state of
the turnover process. The primary goal of this project is to leverage the analysis of the current
state of the turnover process to develop a standard expectation for turnover time and recommend
improvements to the UHOR’s turnover process. This final report presents an analysis of the
historical data and observations, findings and conclusions from all data collection methods, and
recommendations for standardizing the turnover process at the UHOR.
Background and Key Issues
The hospital has a wide variety of services. Among them are general surgeries, transplants,
orthopedics, urology, plastics, and neurosurgery. These services are organized into three
different pods (Pod 1, Pod 2, and Pod 3) that are responsible for their own set of case types and
have its own supervisor. The services with the highest volumes of cases over the last year were
urology (Pod 3) with 4,297 case types, orthopedics with 3,566 (Pod 2), and neurosurgery with
2,284 (Pod 1).
Currently, the perception is that process of turning over a room in the OR takes too long. The
UHOR Case Time Reporting Tableau Dashboard shows that urology has an average turnover
time of 40 minutes, neurosurgery is 58 minutes, and orthopedics is 53 minutes. This data is based
on 1791 cases for urology, 647 cases for neurosurgery, and 1602 cases for orthopedics that took
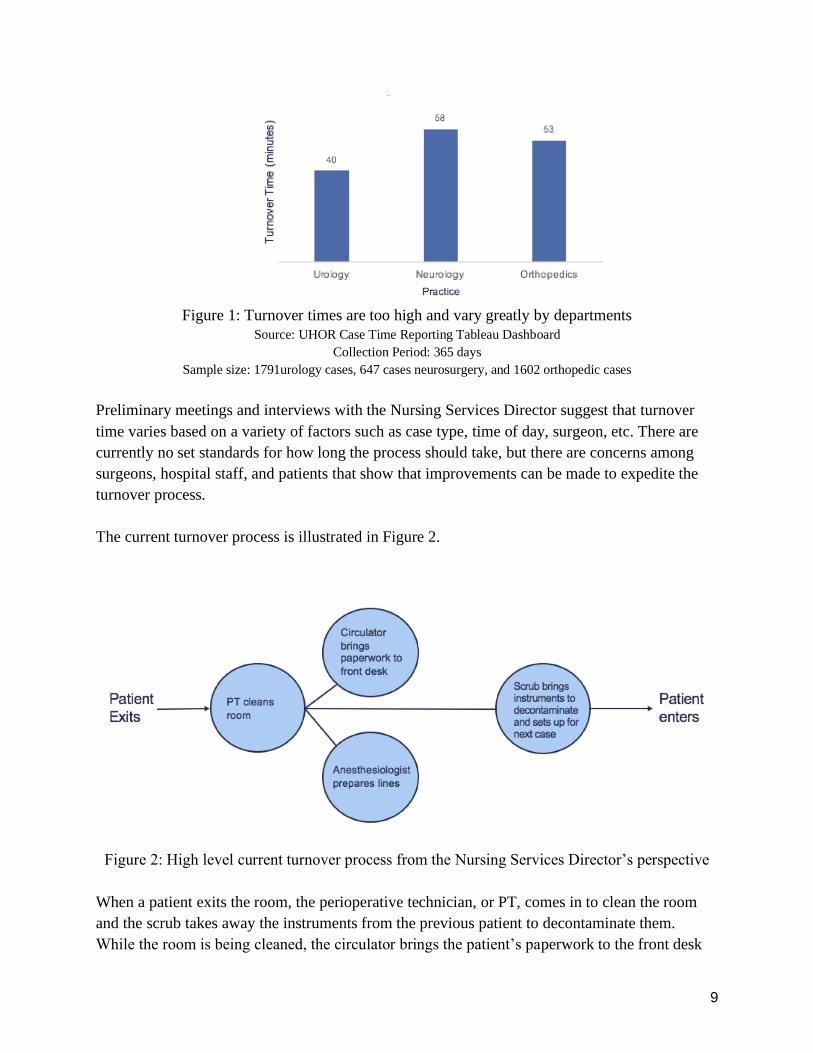
place over the last 365 days. This data can be seen in Figure 1.
9
Figure 1: Turnover times are too high and vary greatly by departments
Source: UHOR Case Time Reporting Tableau Dashboard Collection Period: 365 days
Sample size: 1791urology cases, 647 cases neurosurgery, and 1602 orthopedic cases
Preliminary meetings and interviews with the Nursing Services Director suggest that turnover
time varies based on a variety of factors such as case type, time of day, surgeon, etc. There are
currently no set standards for how long the process should take, but there are concerns among
surgeons, hospital staff, and patients that show that improvements can be made to expedite the
turnover process.
The current turnover process is illustrated in Figure 2.
Figure 2: High level current turnover process from the Nursing Services Director’s perspective
When a patient exits the room, the perioperative technician, or PT, comes in to clean the room
and the scrub takes away the instruments from the previous patient to decontaminate them.
While the room is being cleaned, the circulator brings the patient’s paperwork to the front desk
10
and checks on the next patient. The anesthesiologists get a page when the patient leaves and they
clean their equipment and prepare their lines for the upcoming patient. After the room is cleaned
by the PT’s, the scrub opens and counts the instruments for the next case. Anesthesia leaves to
bring the patient into the OR after room ready is called. Once the circulator, anesthesia, and
scrub have completed their jobs, the next patient may enter the operating room. Once the
circulator, anesthesiologist and scrub have completed their jobs, the next patient may enter the
operating room.
The perceived main issue with turnover time in the OR is that the hospital staff is physically
taking too long to turn over rooms, which can delay other services such as feeding the patients on
time and staying on schedule for the remainder of the day. However, a likely contributor to the
problem is that there is currently no set standard for how long this process should take.
Goals and Objectives
The primary goal of this project is to evaluate the current state and provide recommendations to
decrease the turnover time at the UHOR. The student team will achieve this goal by addressing
the following objectives:
● Establish baseline standards for the expected time turnover takes for specific case type by
evaluating the current state and comparing the hospital to similar institutions
● Develop a process that will allow the UHOR to achieve those standards
Having a standard for turnover time will create a goal turnover time for scrubs, circulators,
anesthesiologists, and preoperative technicians to reach. Once turnover time is standardized with
the implementation of the team’s recommendations, surgeons will be able to adhere to their daily
schedule better. This, in turn, may have a positive impact for patients because it could prevent
delays in the OR procedures and in other services, such as feeding.
Project Scope
This project took place in the OR of the hospital at the University of Michigan. There are three
pods of the OR which are for different service types. The team examined one service per pod,
specifically neurosurgery, orthopedics, and urology. The scope of this project covers all of the
processes that take place that impact turnover time and all tasks inside the OR room between
patients, such as cleaning the room, setting up the room for the next patient, and setting up the
anesthetics for the upcoming patient. The process starts when one patient exits the room to when
the next patient enters.
11
This project did not include any services outside of neurosurgery, orthopedics, and urology. It
also did not include any activities that occur in the operating room during a surgery or when the
patient is present in the room.
Deliverables and Design Tasks
The team documented the current state of the turnover process and performed a benchmarking
analysis. Using that insight, the team constructed a future state turnover standards and
procedures. The sections below provide an overview of each task and the deliverables.
Construct current-state process
The team constructed a current-state process flow chart through observational data. Observations
in the OR’s and interviews with pod supervisors, perioperative technician supervisor, and other
employees from neurosurgery, orthopedics and urology departments were conducted to gain an
understanding of the current process.
Perform benchmarking analysis
The team investigated turnover times at other large teaching institutions which is detailed in
literature search section. The team specifically looked at how the services and the roles that are
included in the turnover process differ from Michigan Medicine.
Construct future state turnover standards and procedures
Using the data from historical data, observations, time studies, interviews, and literature search
the team developed a recommendation for standard turnover time and the procedure to achieve
that turnover goal for each department in scope.
Perform Literature Search
The team used different sources of literature as a resource. A past IOE 481 project, a review of
the concept Genji Genbutsu, and similar projects done at comparable hospitals were used to
provide the student team with ideas for observation techniques and potential recommendations.
Past IOE 481 Project
The team reviewed the past IOE 481 project called “Utilizing Garbology to Analyze
Discrepancies between Planned, Documented, and Trashed Surgical Supplies in Hospital
Operating Rooms” conducted in Winter 2017. This analyzes the relevant observation methods
that a past team in 2017 used. The goal of the project was to study the discrepancies between
planned, documented, and trashed surgical supplies in the operating rooms. The team analyzed
the past team’s project by going through their observation methods and made conclusions about
potential observation methods to implement in the OR and be used for turnover time
calculations.
12
Genji Genbutsu
In the past IOE 481 project, the team stated that they observed in the OR to have a better
understanding of the process from the visual context. In the report, it is also argued that
witnessing the environment that a circulator nurse worked in helped the team understand the
roles of the key people working in the system. “The team saw the collection of wrappers and
witnessed the environment that a circulating nurse works in, taking note of points in the process
that could affect the accuracy of documentation. The team gained a greater understanding of the
process from the visual context of planned, documented, and trashed items in the hospital” [1]. In
LEAN manufacturing, this is called “Genji Genbutsu” which translates to “real location, real
thing” and is one of the key principles in the Toyota Production System. By observing the
system themselves with their own eyes, the observers are able to draw conclusions about the
system and potential problems without being affected by any bias or other opinion.
The team will adapt this approach for the OR observations because the literature search analysis
gave evidence that this approach indeed is very useful when optimizing a system. What makes
this approach especially relevant to the project is that so far during the preliminary observations
that the team has conducted and interviews with the PT team and nurses, the team has been
receiving different information. Circulators and scrubs have stated that the turnover process steps
are conducted simultaneously whereas the surgeons tend to think that the steps are performed
sequentially. These differences in opinion create a bias for the team. The main point of Genji
Genbutsu is that by asking people to explain a process, the observer starts focusing on looking
for those inputs that have been previously explained, thus creating a bias. This can make the
observer miss a lot of valuable insights about the process and the only way to overcome that is to
see the system independently; therefore, the team would benefit a lot from observing the
turnover process themselves to get a better insight.
Operating Room Start Times and Turnover Times in a University Hospital
The team found and analyzed an additional article titled “Operating Room Start Times and
Turnover Times in a University Hospital” by William J. Mazzei, MD. The paper discusses the
approach that was taken at the University of California, San Diego, Medical Center to decrease
the turnover times. The turnover time definition for both the conducted study and this project
align, thus the study was analyzed to draw useful conclusions to implement when trying to
decrease the turnover rate at the UHOR.
The study used p-value analysis stating that any p-value for “room ready” less than 0.05 would
be considered statistically significant. “Because each OR at University Hospital was dedicated to
an individual surgical service, data were grouped according to service for analysis, ... The
average times for each surgical service were compared with the average of all the services using
analysis of variance. A p-value less than 0.05 was considered statistically significant” [2].
The analyzed study used the results obtained from the p-value statistical analysis to create a
13
baseline for the turnover rate between 7 a.m and 5 p.m in the hospital OR. “At this institution,
the results obtained in this study were used as a baseline for launching a Total Quality
Management approach” [2]. Having the same goal in mind, the team may use statistical p-value
analysis in the future. The main conclusion from the paper was the ability to compare UHOR
with the other hospital’s turnover rates to create a baseline for the turnover rates.
Improving Operating Room Turnover Time in a New York City Academic Hospital via Lean
The team found and analyzed an article titled “ Improving Operating Room Turnover Time in a
New York City Academic Hospital via Lean” by Robert J. Cerfolio, MD, MBA, Dana Ferrari-
Light, DO, MPH, Christine Ren-Fielding, MD, George Fielding, MD, Nissa Perry, MA, Annette
Rabinovich, MHA, Mark Saraceni, MBA, Maureen Fitzpatrick, MSN, Sudheer Jain, MD, and H.
Leon Pachter, MD, FACS. The article discusses the use of lean and value stream mapping
increasing the turnover rates by 37 minutes on 3 operating rooms at an academic health center in
New York City. The turnover time definition for both the conducted study and the project that
the team worked on align, thus the study was analyzed to draw useful conclusions to implement
when trying to decrease the turnover rate at the UHOR.
The study made use of value stream mapping to better understand their process and to be able to
value what amount of time was considered value added or non-value added. They proceeded by
seeking improvements to be able to eliminate the non-value added time. “Each step of each
process was determined as “valued” or “and ''nonvalued “nonvalued” steps were eliminated.”[3].
The study also argues that there is even an opportunity to improve in value added steps and
explored streamlining the value added steps. “Importantly, the valued steps were further
reviewed and streamlined by removing unnecessary or duplicate movements” [3].
One of the ways that the study argues that contributed to the reduction of turnover time was
decreasing the tasks of the circulating nurse. The study argues that the circulating nurse is a key
character during the turnover and also has the most amount of ground to cover within the OR.
“Another change we made was to the circulating nurse task list. It was observed that many of the
tasks performed by the circulating nurse during turnover time required travel to other areas of the
operating room…” [3].
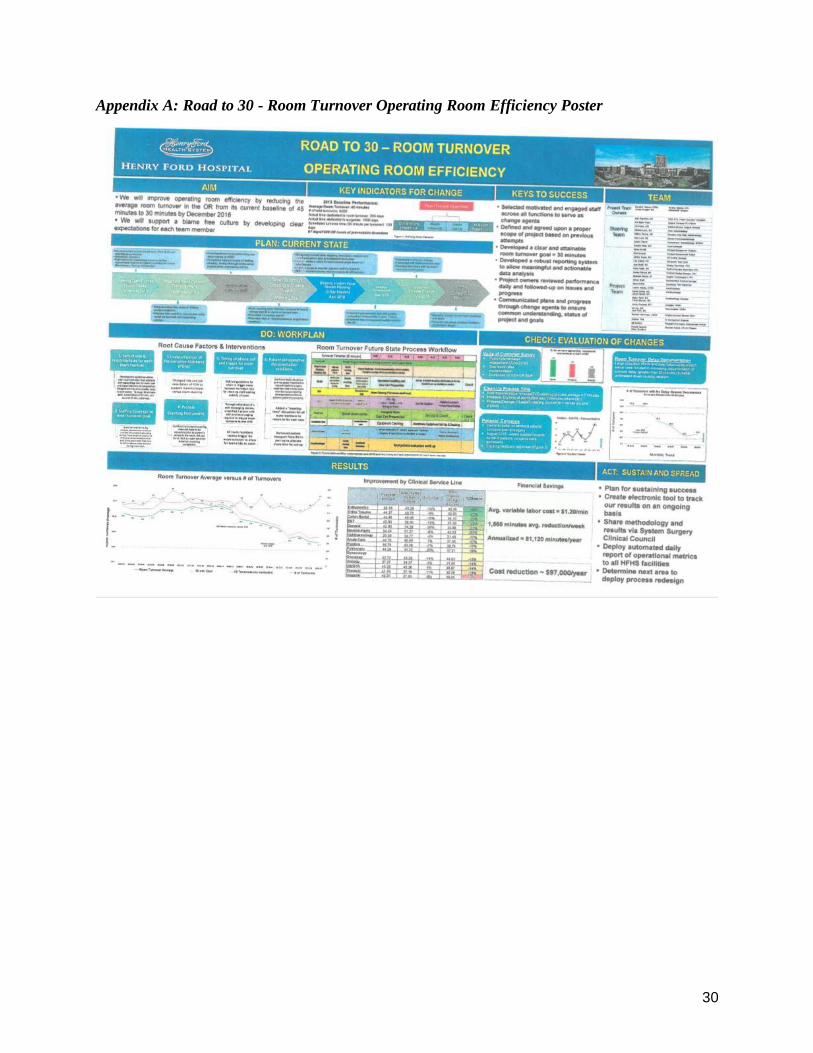
Road to 30 - Room Turnover Operating Room Efficiency
The team analyzed a project titled “Road to 30 - Room Turnover Operating Room Efficiency” at
the Henry Ford Hospital, that was provided by the coordinators. The article argues that the
primary keys to success “selected motivated and engaged staff across all functions to serve as
change agents” and “developed a clear and attainable room turnover goal = 30 mintues.” The
project poster fortified the teams aimed turnover rate as somewhere around 30+/- 5 minutes
range. See Appendix A for more information on the study.

14
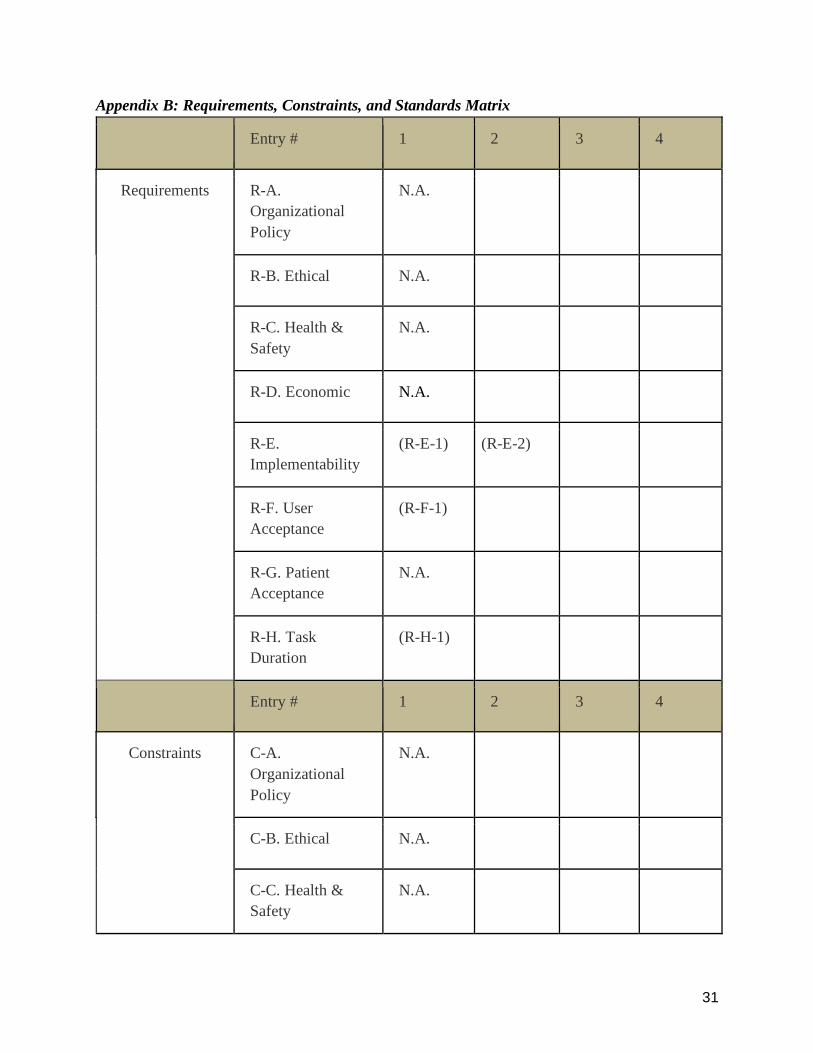
Design Requirements, Constraints, and Engineering Standards
The primary design task of this project is to set a standard for turnover time and develop
recommendations to improve turnover times. The following sections describe the design
requirements, constraints and engineering standards in regards to the development of the
deliverables. The outlined design requirements are guidelines that outline the qualities that are
wanted in the final design of a system. The hard constraints are metrics that must be met in order
in the construction of the design. Standards are the procedures and guidelines set by regulatory
bodies. The description of the requirements, constraints, and standards can also be found in a
constraints and standards matrix in Appendix B.
Design Requirements (Soft Constraints) in detail:
When developing a standard turnover time, the student team considered the following four
design requirements. These design requirements are soft constraints that are used in evaluating
the alternatives and recommendations presented.
● (R-E-1) Benchmark against other large teaching institutions with a similar model as
Michigan Medicine. This ensures that the model can be implemented.
● (R-E-2) Teams and processes that are involved in turnover process must be defined so
that alternate, unavailable resources are not factored in.
● (R-F-1) Clear roles and tasks for each staff member involved in turnover process that are
approved by the staff members. This ensures everyone is understands who performs what
processes.
● (R-H-1) Minimum non-value-added-time so that the staff’s time is used more efficiently.
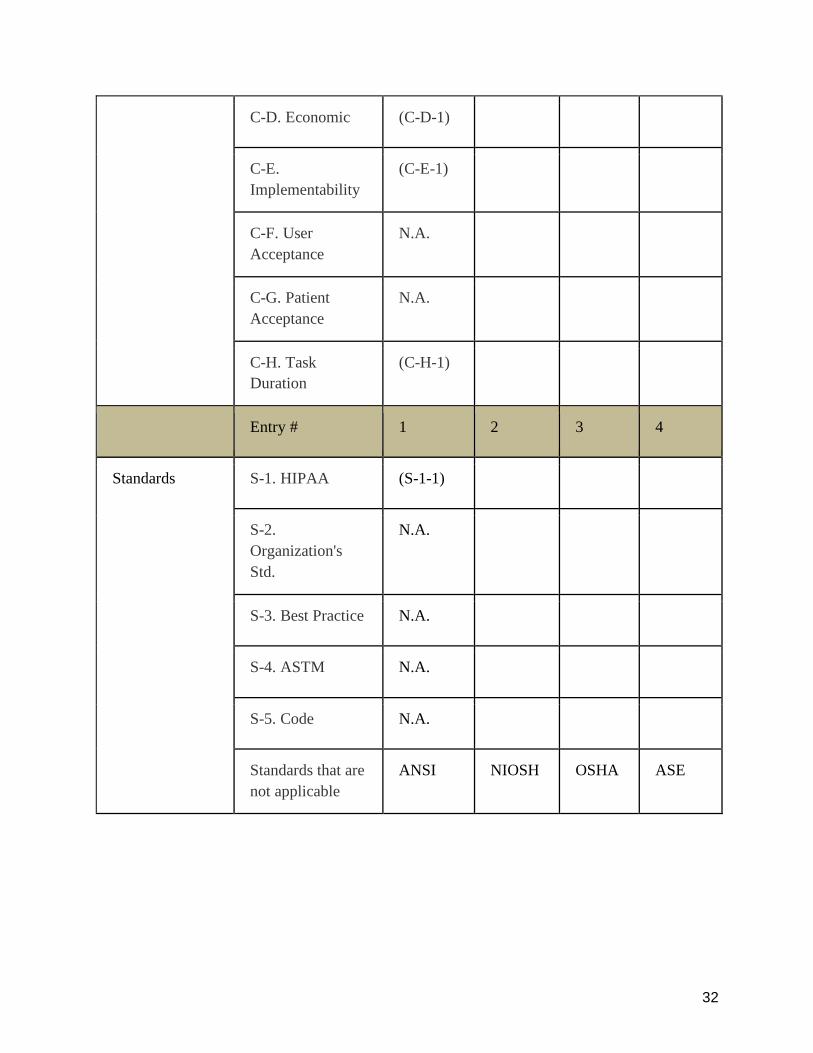
Hard Constraints in detail:
The hard constraints provided concrete guidelines for the team had to follow when considering a
design to standardize the turnover time. The team considered two different categories of
constraints: the limitations on data collection methods and the limitations surrounding the design.
Data Collection Constraints
● (C-E-1) Only two team members can observe at any given time due to OR space
constraints, which affects the number of factors and variables that can be recorded.
● (C-H-1) Data can be collected only for 5 cases in services for each department due to
time constraints, as the project must be completed by the end of the semester.
Design Constraints
● (C-D-1) The team must develop turnover standards and procedures using the current
number of staff for the nursing, anesthesia and perioperative technician departments.

15
Engineering standards:
The engineering standards set out by regulatory bodies that all hospitals and all projects within
hospitals must comply with.
● (S-1-1) The team must take into consideration HIPAA when conducting observations and
collecting data in order to not expose PHI.
Data Collection and Analysis Methods
The team used various methods such as historical data, surveys, time studies and current state
mapping in order to collect and analyze data. The following sections describe the team’s data
collection and analysis.
Data Collection Methods
In order to create a future state of the standardized turnover process, the team obtained relevant
historical data from July 2015 to October 2019. In the span of 3 weeks, observations in different
OR services were conducted simultaneously with time studies.
Interviews
The leaders of the key roles within the OR such as pod supervisors and PT supervisors were
interviewed. During the interviews, the team asked detailed questions aiming at understanding
each individual’s role from circulators to PT’s and investigated how these leaders perceived the
current turnover system. The team additionally inquired about ways to increase efficiency and
provide insight through these people’s perspective. This led the team to have an understanding of
the role of each individual in the OR.
Historical Data
The team analyzed the historical data starting from July 2015 until October 2019, that was
provided by the client. The provided data composed of key elements such as start and end times,
procedure types, procedure complexities, surgeon scheduling, etc.
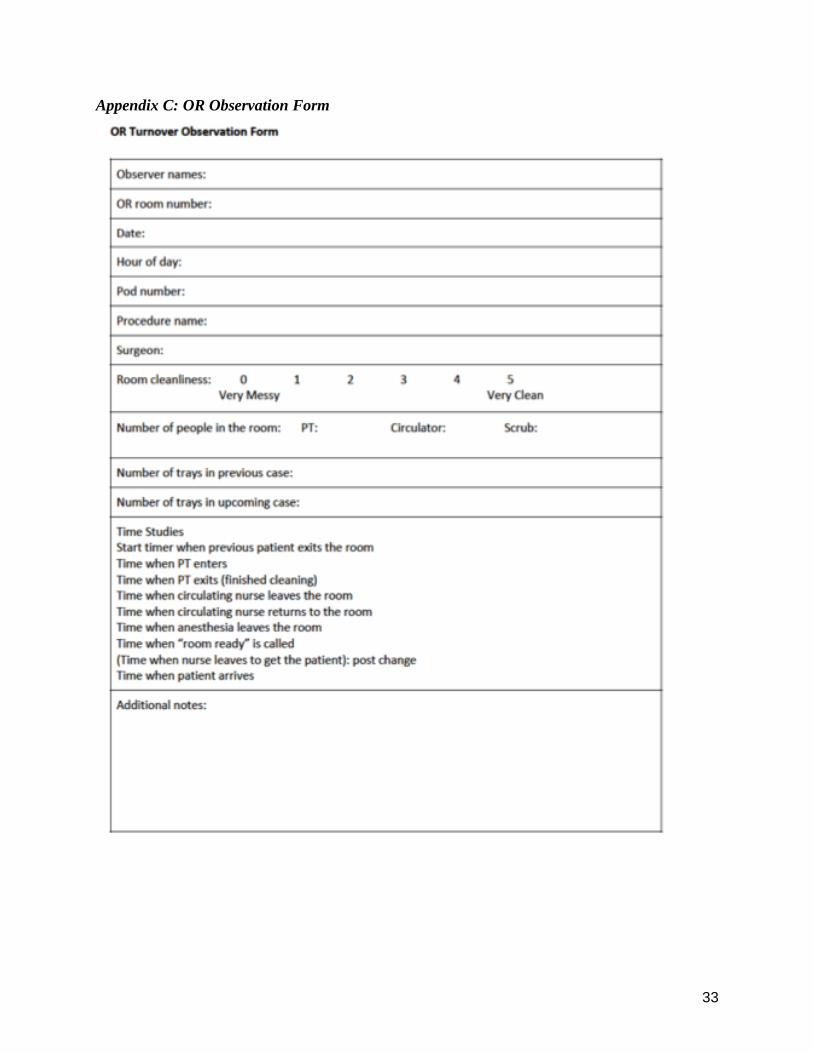
The team gained insights and conclusions from the historical data provided in order to develop a
new observation form (Figure 3). This form breaks down each step of the current turnover
process in order to gain additional insight into any potential bottlenecks or inefficiencies in the
process.
Observations
The team started preliminary observations on October 24 and conducted observations until
November 22 to get an unbiased, holistic perspective of the current state. The team used the
observation form (Figure 3, Appendix C) to record and understand the processes each staff
member in nursing, anesthesia and PT department goes through. Between these dates, a total of
16
13 observations were conducted. These observations consisted of two neurosurgery cases, seven
orthopedics cases, three urology cases within nine ORs and performed by 10 different surgeons.
The team conducted observations in different times of the day to better investigate the effect of
time of day on the turnover. Additional interviews were conducted during the time frames that
the team members went in the UHOR. These interviews mostly aimed at getting more insight on
aspects of the turnover that the staff believes cause extended turnover periods. They also asked
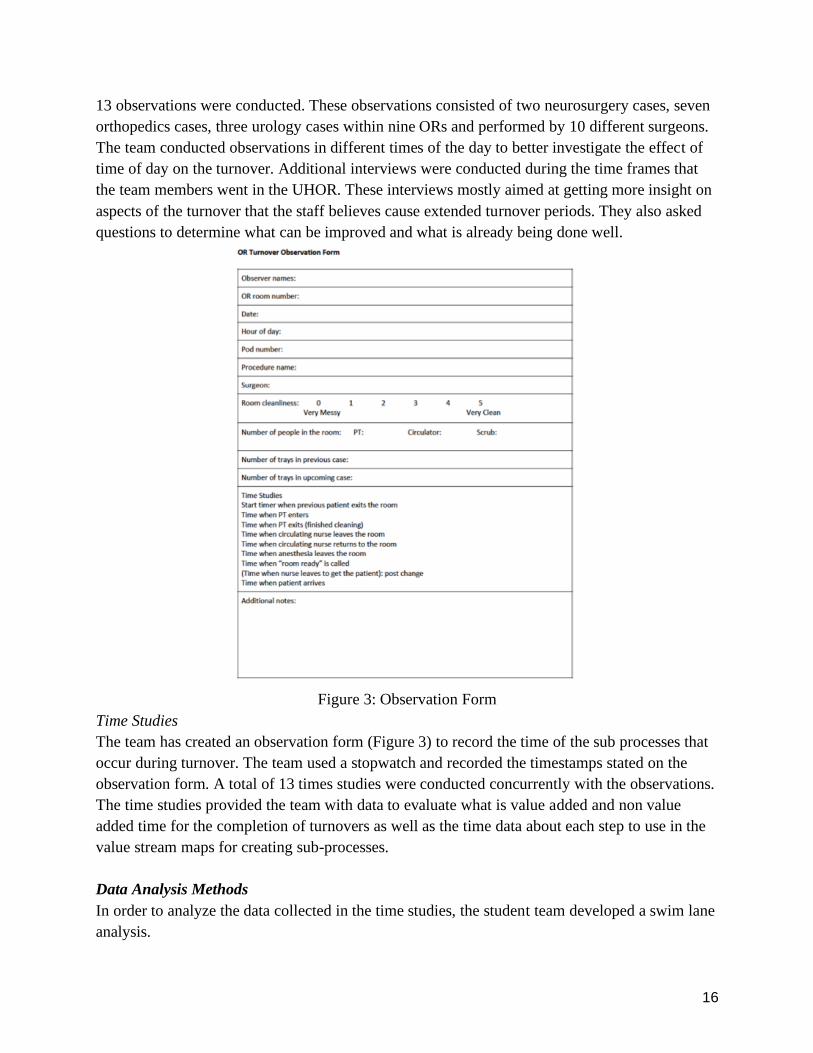
questions to determine what can be improved and what is already being done well.
Figure 3: Observation Form
Time Studies
The team has created an observation form (Figure 3) to record the time of the sub processes that
occur during turnover. The team used a stopwatch and recorded the timestamps stated on the
observation form. A total of 13 times studies were conducted concurrently with the observations.
The time studies provided the team with data to evaluate what is value added and non value
added time for the completion of turnovers as well as the time data about each step to use in the
value stream maps for creating sub-processes.
Data Analysis Methods
In order to analyze the data collected in the time studies, the student team developed a swim lane
analysis.
17
Swim Lane Analysis
The team classified the following processes in the turnover process as “Simultaneous Process”:
● PT cleaning
● Circulating nurse leaving for the front desk and coming back
● Anesthesia coming in and preparing the lines
● Scrub setting up for the next case and counting
In order to account for these processes, the team used a swim lane analysis (Figure 4, Appendix
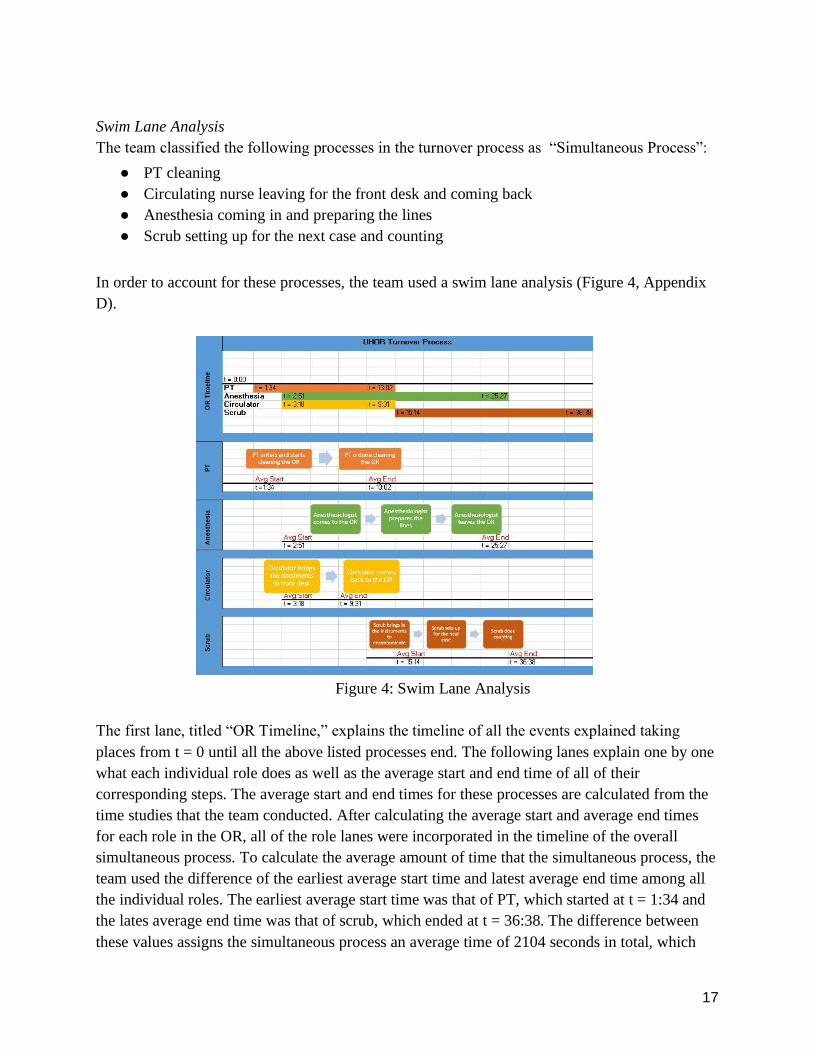
D).
Figure 4: Swim Lane Analysis
The first lane, titled “OR Timeline,” explains the timeline of all the events explained taking
places from t = 0 until all the above listed processes end. The following lanes explain one by one
what each individual role does as well as the average start and end time of all of their
corresponding steps. The average start and end times for these processes are calculated from the
time studies that the team conducted. After calculating the average start and average end times
for each role in the OR, all of the role lanes were incorporated in the timeline of the overall
simultaneous process. To calculate the average amount of time that the simultaneous process, the
team used the difference of the earliest average start time and latest average end time among all
the individual roles. The earliest average start time was that of PT, which started at t = 1:34 and
the lates average end time was that of scrub, which ended at t = 36:38. The difference between
these values assigns the simultaneous process an average time of 2104 seconds in total, which
18
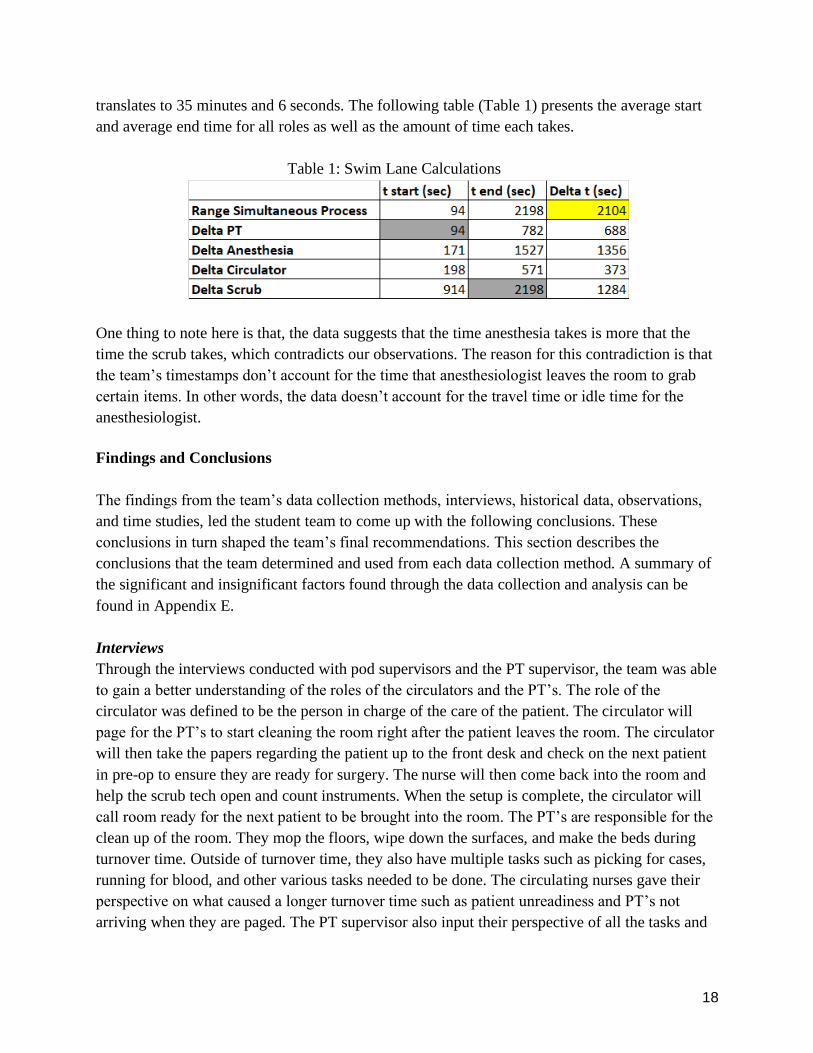
translates to 35 minutes and 6 seconds. The following table (Table 1) presents the average start
and average end time for all roles as well as the amount of time each takes.
Table 1: Swim Lane Calculations
One thing to note here is that, the data suggests that the time anesthesia takes is more that the
time the scrub takes, which contradicts our observations. The reason for this contradiction is that
the team’s timestamps don’t account for the time that anesthesiologist leaves the room to grab
certain items. In other words, the data doesn’t account for the travel time or idle time for the
anesthesiologist.
Findings and Conclusions
The findings from the team’s data collection methods, interviews, historical data, observations,
and time studies, led the student team to come up with the following conclusions. These
conclusions in turn shaped the team’s final recommendations. This section describes the
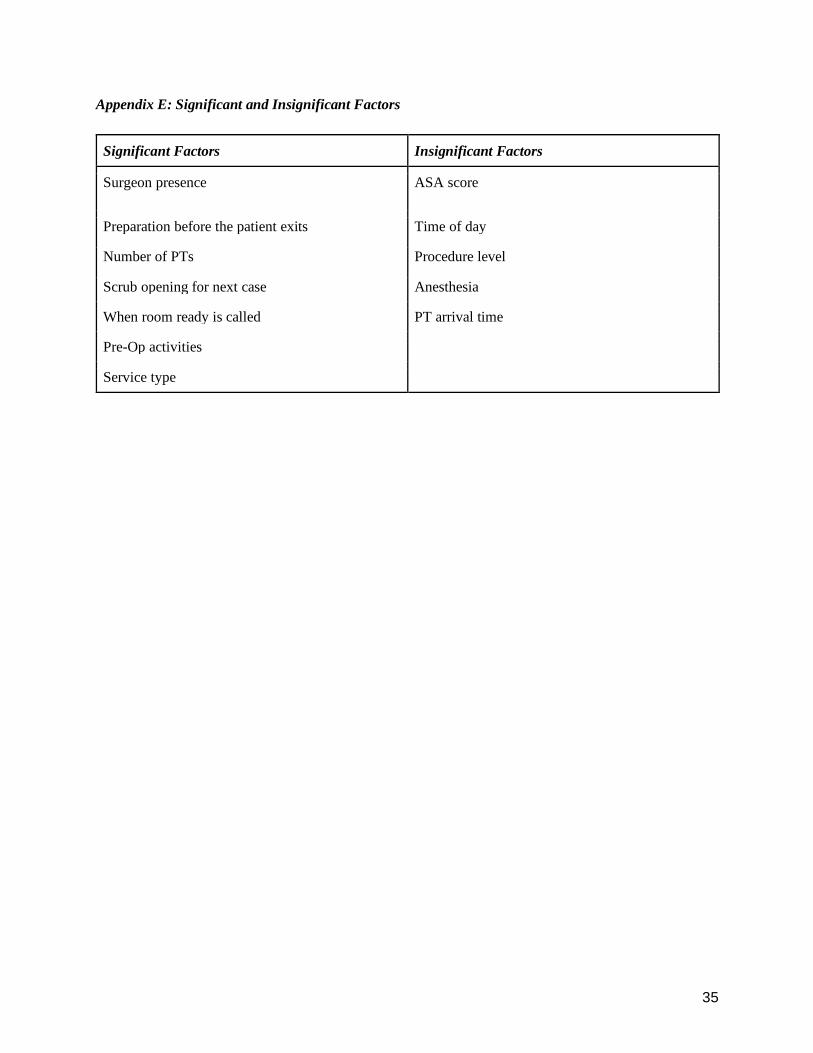
conclusions that the team determined and used from each data collection method. A summary of
the significant and insignificant factors found through the data collection and analysis can be
found in Appendix E.
Interviews
Through the interviews conducted with pod supervisors and the PT supervisor, the team was able
to gain a better understanding of the roles of the circulators and the PT’s. The role of the
circulator was defined to be the person in charge of the care of the patient. The circulator will
page for the PT’s to start cleaning the room right after the patient leaves the room. The circulator
will then take the papers regarding the patient up to the front desk and check on the next patient
in pre-op to ensure they are ready for surgery. The nurse will then come back into the room and
help the scrub tech open and count instruments. When the setup is complete, the circulator will
call room ready for the next patient to be brought into the room. The PT’s are responsible for the
clean up of the room. They mop the floors, wipe down the surfaces, and make the beds during
turnover time. Outside of turnover time, they also have multiple tasks such as picking for cases,
running for blood, and other various tasks needed to be done. The circulating nurses gave their
perspective on what caused a longer turnover time such as patient unreadiness and PT’s not
arriving when they are paged. The PT supervisor also input their perspective of all the tasks and
19
roles that the PT have to balance in addition to cleaning rooms during turnover which gave a
more holistic view of the job role.
Historical Data Analysis
Historical data from July 2015 until October 2019 was thoroughly analyzed and provided the
team with insight on what turnover times generally were, which factors affected turnover, and
the current state of turnover.
Calculating Turnover
The data was filtered for the past year, October 2018 - October 2019, based on day of week,
scheduled vs non scheduled surgery which excludes any emergency or last minute cases that may
affect turnover.
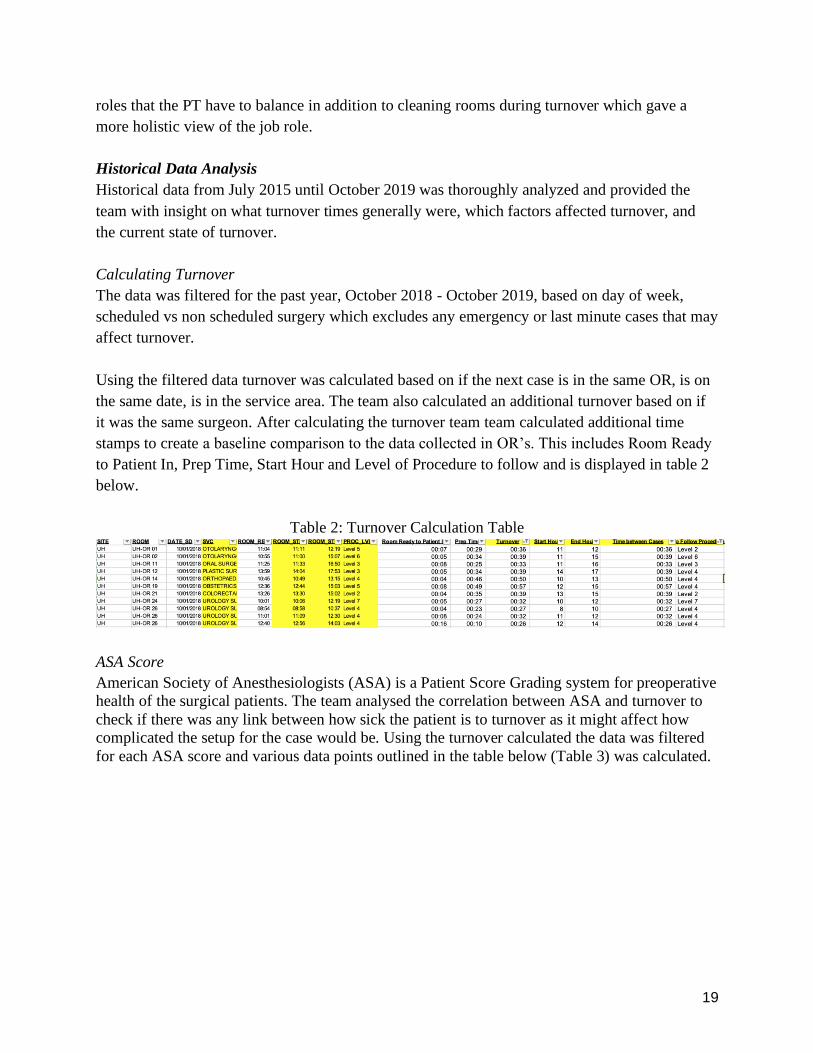
Using the filtered data turnover was calculated based on if the next case is in the same OR, is on
the same date, is in the service area. The team also calculated an additional turnover based on if
it was the same surgeon. After calculating the turnover team team calculated additional time
stamps to create a baseline comparison to the data collected in OR’s. This includes Room Ready
to Patient In, Prep Time, Start Hour and Level of Procedure to follow and is displayed in table 2
below.
Table 2: Turnover Calculation Table
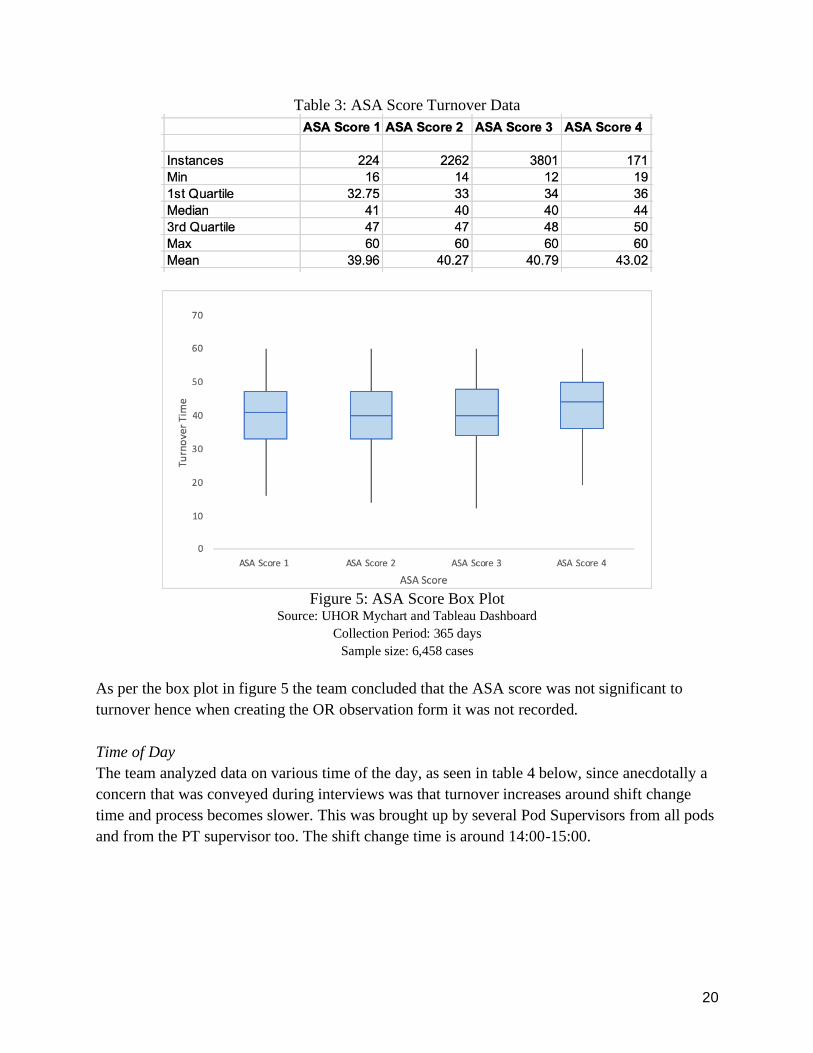
ASA Score
American Society of Anesthesiologists (ASA) is a Patient Score Grading system for preoperative
health of the surgical patients. The team analysed the correlation between ASA and turnover to
check if there was any link between how sick the patient is to turnover as it might affect how
complicated the setup for the case would be. Using the turnover calculated the data was filtered
for each ASA score and various data points outlined in the table below (Table 3) was calculated.
20
Table 3: ASA Score Turnover Data
Figure 5: ASA Score Box Plot
Source: UHOR Mychart and Tableau Dashboard
Collection Period: 365 days
Sample size: 6,458 cases
As per the box plot in figure 5 the team concluded that the ASA score was not significant to
turnover hence when creating the OR observation form it was not recorded.
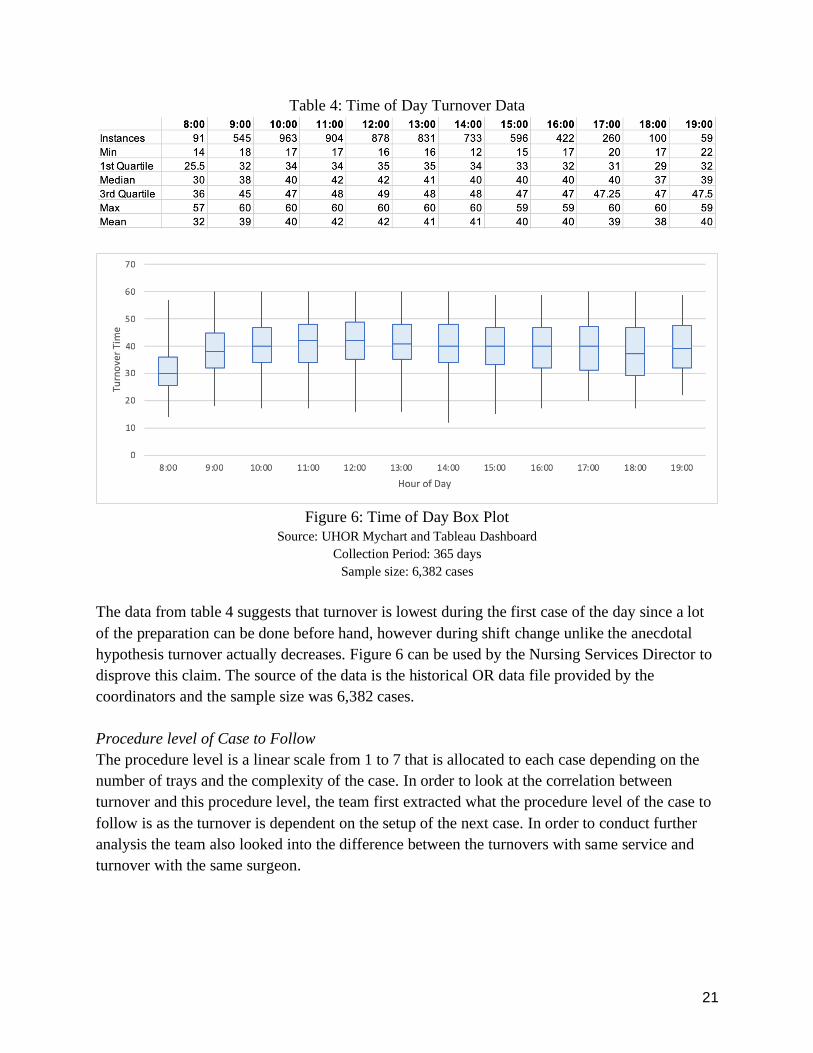
Time of Day
The team analyzed data on various time of the day, as seen in table 4 below, since anecdotally a
concern that was conveyed during interviews was that turnover increases around shift change
time and process becomes slower. This was brought up by several Pod Supervisors from all pods
and from the PT supervisor too. The shift change time is around 14:00-15:00.
21
Table 4: Time of Day Turnover Data
Figure 6: Time of Day Box Plot
Source: UHOR Mychart and Tableau Dashboard
Collection Period: 365 days
Sample size: 6,382 cases
The data from table 4 suggests that turnover is lowest during the first case of the day since a lot
of the preparation can be done before hand, however during shift change unlike the anecdotal
hypothesis turnover actually decreases. Figure 6 can be used by the Nursing Services Director to
disprove this claim. The source of the data is the historical OR data file provided by the
coordinators and the sample size was 6,382 cases.
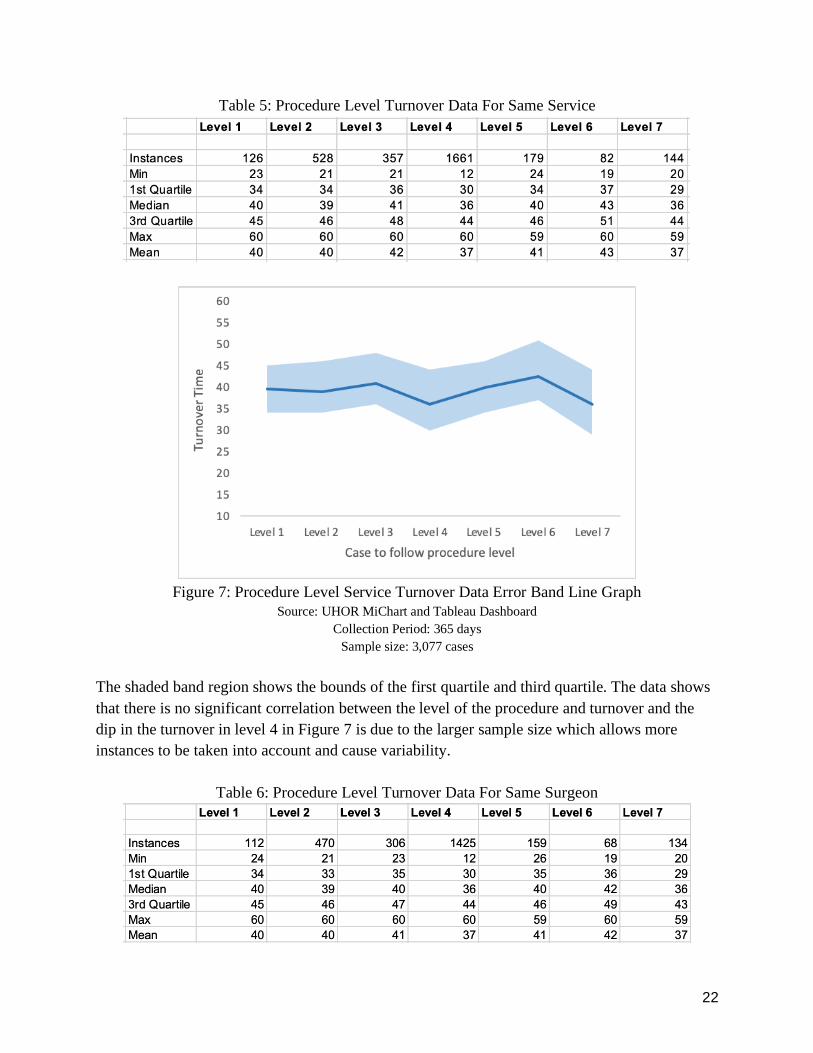
Procedure level of Case to Follow
The procedure level is a linear scale from 1 to 7 that is allocated to each case depending on the
number of trays and the complexity of the case. In order to look at the correlation between
turnover and this procedure level, the team first extracted what the procedure level of the case to
follow is as the turnover is dependent on the setup of the next case. In order to conduct further
analysis the team also looked into the difference between the turnovers with same service and
turnover with the same surgeon.
22
Table 5: Procedure Level Turnover Data For Same Service
Figure 7: Procedure Level Service Turnover Data Error Band Line Graph
Source: UHOR MiChart and Tableau Dashboard
Collection Period: 365 days
Sample size: 3,077 cases
The shaded band region shows the bounds of the first quartile and third quartile. The data shows
that there is no significant correlation between the level of the procedure and turnover and the
dip in the turnover in level 4 in Figure 7 is due to the larger sample size which allows more
instances to be taken into account and cause variability.
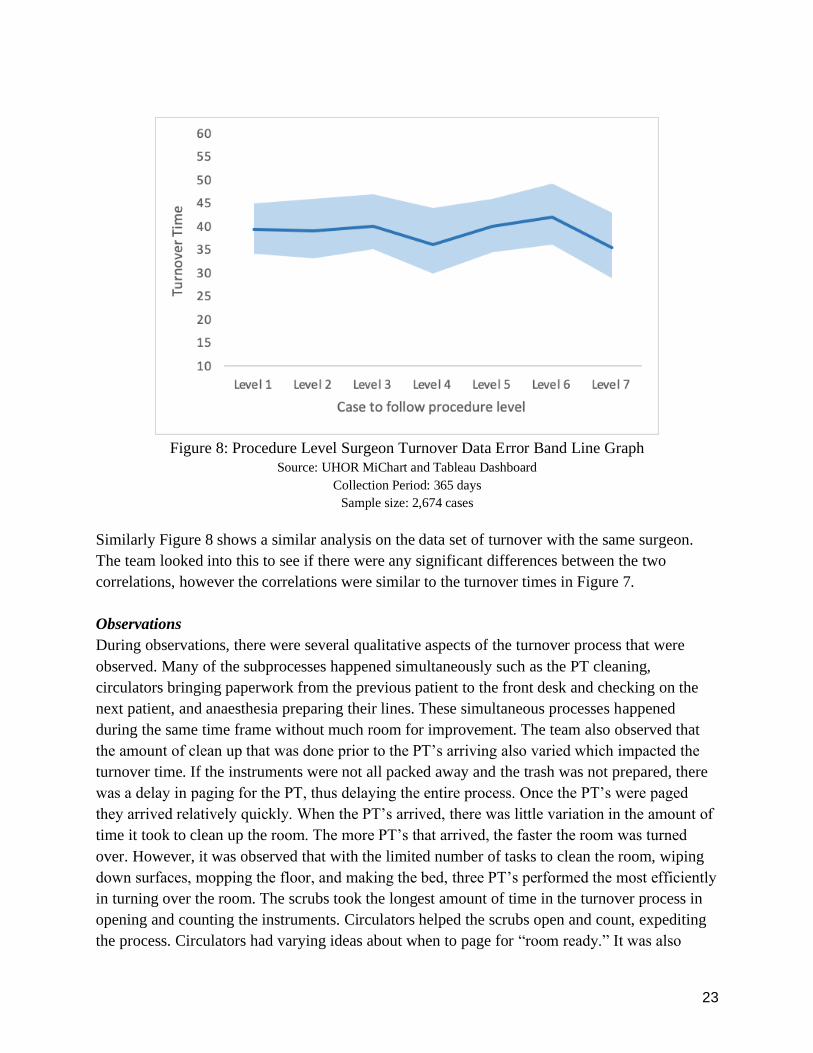
Table 6: Procedure Level Turnover Data For Same Surgeon
23
Figure 8: Procedure Level Surgeon Turnover Data Error Band Line Graph
Source: UHOR MiChart and Tableau Dashboard
Collection Period: 365 days
Sample size: 2,674 cases
Similarly Figure 8 shows a similar analysis on the data set of turnover with the same surgeon.
The team looked into this to see if there were any significant differences between the two
correlations, however the correlations were similar to the turnover times in Figure 7.
Observations
During observations, there were several qualitative aspects of the turnover process that were
observed. Many of the subprocesses happened simultaneously such as the PT cleaning,
circulators bringing paperwork from the previous patient to the front desk and checking on the
next patient, and anaesthesia preparing their lines. These simultaneous processes happened
during the same time frame without much room for improvement. The team also observed that
the amount of clean up that was done prior to the PT’s arriving also varied which impacted the
turnover time. If the instruments were not all packed away and the trash was not prepared, there
was a delay in paging for the PT, thus delaying the entire process. Once the PT’s were paged
they arrived relatively quickly. When the PT’s arrived, there was little variation in the amount of
time it took to clean up the room. The more PT’s that arrived, the faster the room was turned
over. However, it was observed that with the limited number of tasks to clean the room, wiping
down surfaces, mopping the floor, and making the bed, three PT’s performed the most efficiently
in turning over the room. The scrubs took the longest amount of time in the turnover process in
opening and counting the instruments. Circulators helped the scrubs open and count, expediting
the process. Circulators had varying ideas about when to page for “room ready.” It was also
24
observed that sometimes the turnover time was inevitably delayed due to various reasons such as
surgeon unavailability, patient unpreparedness, pre-op miscommunications, and PT shortages.
Time Studies
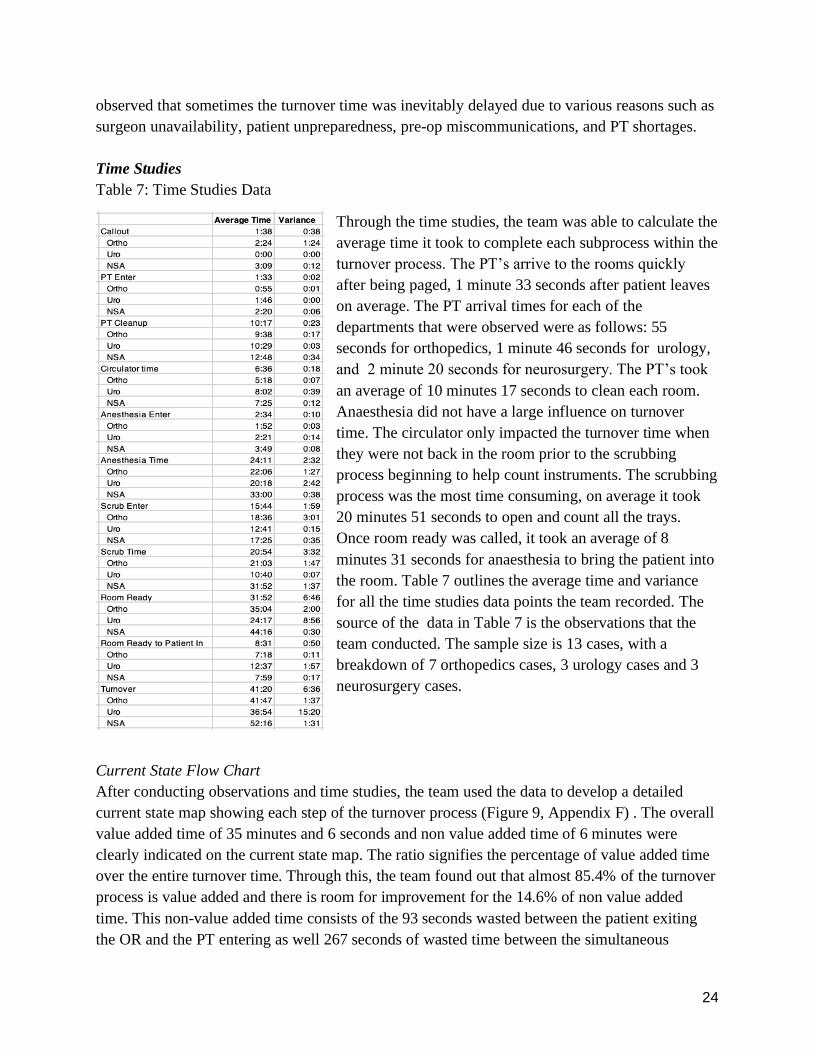
Table 7: Time Studies Data
Through the time studies, the team was able to calculate the
average time it took to complete each subprocess within the
turnover process. The PT’s arrive to the rooms quickly
after being paged, 1 minute 33 seconds after patient leaves
on average. The PT arrival times for each of the
departments that were observed were as follows: 55
seconds for orthopedics, 1 minute 46 seconds for urology,
and 2 minute 20 seconds for neurosurgery. The PT’s took
an average of 10 minutes 17 seconds to clean each room.
Anaesthesia did not have a large influence on turnover
time. The circulator only impacted the turnover time when
they were not back in the room prior to the scrubbing
process beginning to help count instruments. The scrubbing
process was the most time consuming, on average it took
20 minutes 51 seconds to open and count all the trays.
Once room ready was called, it took an average of 8
minutes 31 seconds for anaesthesia to bring the patient into
the room. Table 7 outlines the average time and variance
for all the time studies data points the team recorded. The
source of the data in Table 7 is the observations that the
team conducted. The sample size is 13 cases, with a
breakdown of 7 orthopedics cases, 3 urology cases and 3
neurosurgery cases.
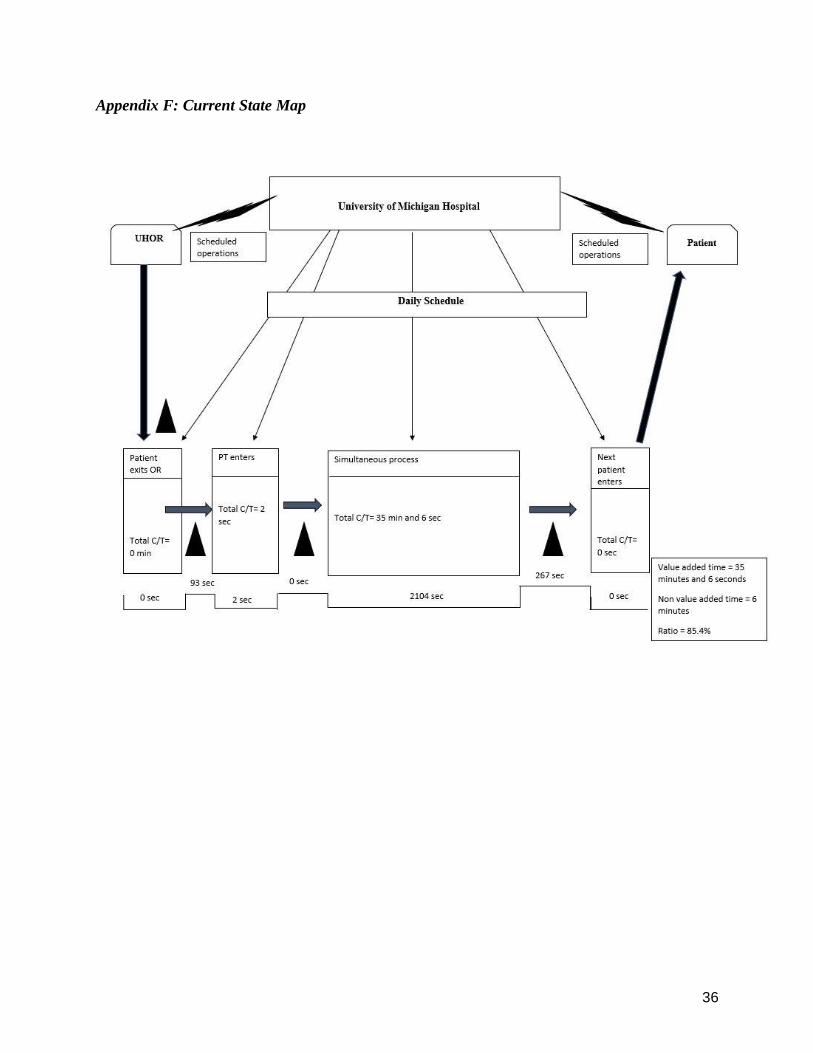
Current State Flow Chart
After conducting observations and time studies, the team used the data to develop a detailed
current state map showing each step of the turnover process (Figure 9, Appendix F) . The overall
value added time of 35 minutes and 6 seconds and non value added time of 6 minutes were
clearly indicated on the current state map. The ratio signifies the percentage of value added time
over the entire turnover time. Through this, the team found out that almost 85.4% of the turnover
process is value added and there is room for improvement for the 14.6% of non value added
time. This non-value added time consists of the 93 seconds wasted between the patient exiting
the OR and the PT entering as well 267 seconds of wasted time between the simultaneous
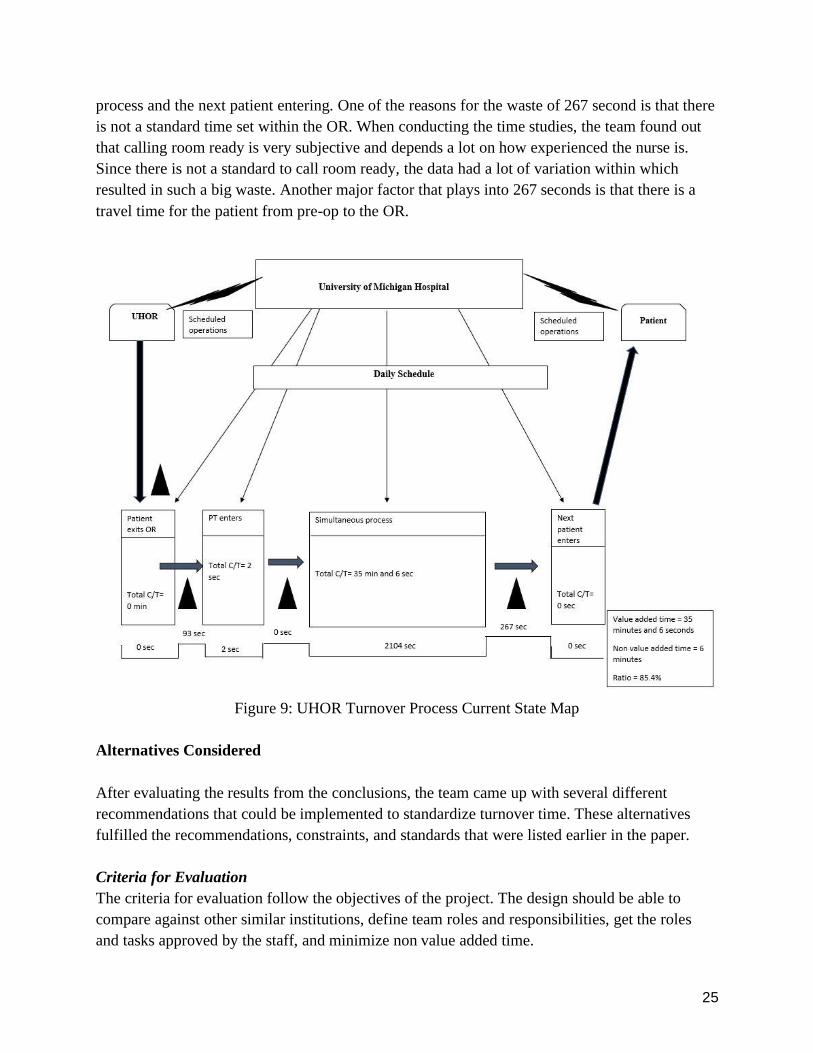
25
process and the next patient entering. One of the reasons for the waste of 267 second is that there
is not a standard time set within the OR. When conducting the time studies, the team found out
that calling room ready is very subjective and depends a lot on how experienced the nurse is.
Since there is not a standard to call room ready, the data had a lot of variation within which
resulted in such a big waste. Another major factor that plays into 267 seconds is that there is a
travel time for the patient from pre-op to the OR.
Figure 9: UHOR Turnover Process Current State Map
Alternatives Considered
After evaluating the results from the conclusions, the team came up with several different
recommendations that could be implemented to standardize turnover time. These alternatives
fulfilled the recommendations, constraints, and standards that were listed earlier in the paper.
Criteria for Evaluation
The criteria for evaluation follow the objectives of the project. The design should be able to
compare against other similar institutions, define team roles and responsibilities, get the roles
and tasks approved by the staff, and minimize non value added time.
26
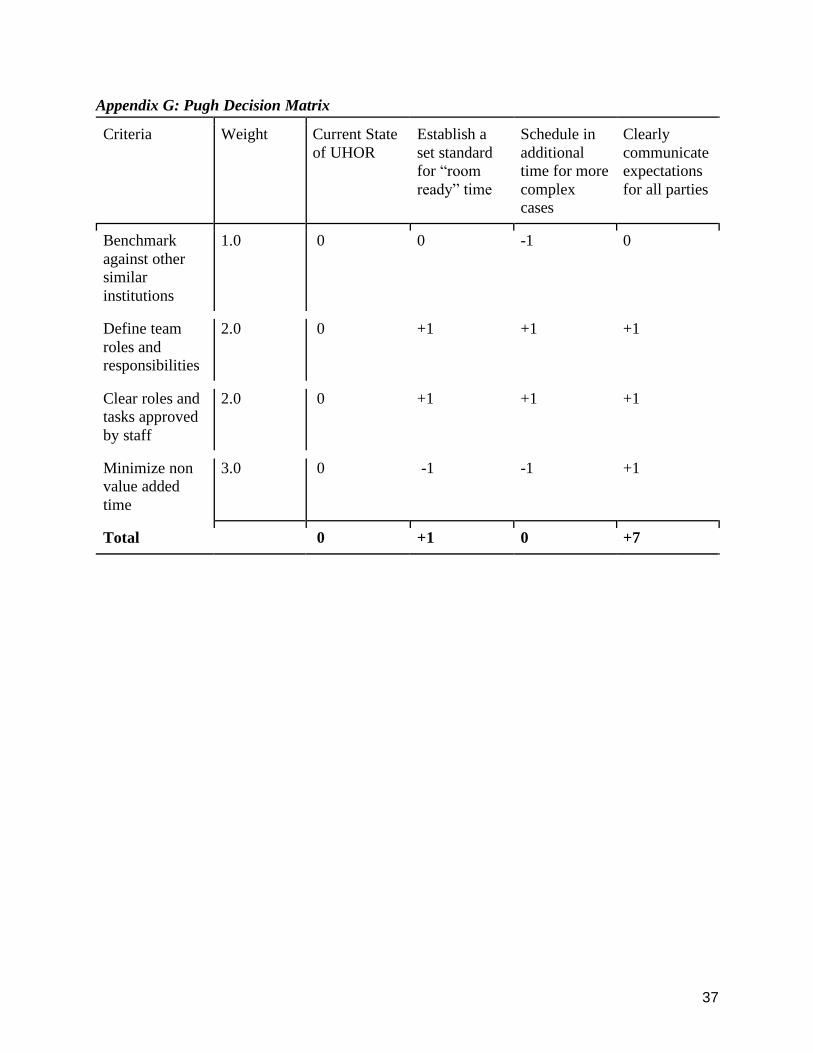
Decision matrix
The team used a Pugh decision matrix as seen in Appendix G to evaluate the design alternatives
the team came up with. The alternatives are compared by being scored against the design criteria
that is assigned a weight based on importance. As seen in the Pugh matrix, the clear
communication of roles and expectations performed significantly better than the other
alternatives. This is primarily due to the fact that the criteria of minimizing non value added time
was weighed the most. The clear communication of expectations would enable the circulators,
PT’s, surgeons, and anaesthesia to complete their tasks in a timely manner and cooperate in order
to achieve the expected time.
Recommendations
After reviewing the findings and conclusions from historical data, interviews, observations, time
studies, the team developed three recommendations: (1) establish a set standard for turnover
time, (2) establishing a standard for “room ready” time and (3) clearly communicate expectations
for all parties (nurses, PT’s, scrubs, etc)
Standard turnover time
From analysis of the literature search, historical data, and time studies it is recommended to set
an average turnover time across the departments to be 40 minutes. More specifically, it would be
recommended to have a different turnover times for each department. The turnover time should
be 30 minutes for urology, 40 minutes for orthopedics, and 45 minutes for neurosurgery. This is
due to the varying tray counts and complexities of the surgeries that affect turnover time.
Standard “room ready” time
Room ready is currently defined as the time that everything in the room is set up and ready for
the patient to arrive. Throughout the course of interviews and observations, it became clear that
many of the circulators had different ideas of when to call room ready. Calling room ready in the
system triggers a pager for anesthesia to bring the patient to the room. However, bringing the
patient to the room takes 8 - 10 minutes as found in the time studies. If room ready is called
when everything is completely set up, the staff in the room were standing and waiting until the
patient was brought back into the room. Therefore, the team recommends that the room ready is
redefined to be 10 minutes prior to the room being set up. Standardizing this expectation across
all of ORs will allow the setup process to be finished concurrently with the patient transportation
to the OR.
Clear communication of expectations
During the interviews and observations, it became clear that different members of the staff had
different expectations of what the turnover time should be and how clearly the roles were
27
defined. The team decided to establish a set turnover time as seen above and clearly
communicate all duty expectations to all members of the staff. The team recommends for the
circulators to have all of the trash ready to leave the room and for the scrubs should have all their
trays packed up while the patient is getting ready to leave or in the process of waking up in the
OR. This allows for the PT’s to be paged immediately after the patient leaves the room, thus
reducing turnover time. If possible, three PT’s should be used in neurosurgery and orthopedic
cases in order to further reduce the turnover time. The nurses in pre-op should ensure all patient
consent is obtained, all the tests are done, and all the drugs are administered in a timely manner
prior to their surgery. This will prevent delays in calling for room ready due to patient
unpreparedness. Newer CRNAs and anesthesia technicians should start in urology rooms
because the lower likelihood of raising turnover times.
Expected Impact
The recommendations about standardizing turnover time, room ready time, and expectations of
the staff are expected to create clarity in the OR about what a successful turnover looks like. This
clarity about how long a turnover should take, when room ready should be pressed, and what
each person’s role is will help reduce turnover time by providing clear expectations of the
process.
Impact of standardizing turnover time
There is currently no clear expectation that communicates to employees in the OR about what an
acceptable turnover time is. By setting a standard for how long a turnover should take for each
service, the hospital employees involved in the turnover process now have a goal to meet. The
impact of this recommendation is expected to be large, as scrubs, circulators, and PT’s can work
together to reach a clearly defined and attainable goal.
Impact of standardizing “room ready” time
Setting a standard for when the circulator should press room ready during the turnover process is
also expected to have a large impact on turnover time. There is currently varying practices as to
when the nurse presses room ready, which can create a delay in the daily schedule. If it is pressed
too early, the room will not be completely ready when the patient arrives. If it is pressed too late,
then time is wasted because the following patient could have been in the room earlier. Setting the
standard that room ready should be pressed 10 minutes before the room is completely set up for
the following patient will reduce wait time as well as premature entry of patients.
Impact of clearly communicating expectations
The team expects that clearly communicating to each member of the staff about their duties in
the turnover process will improve turnover time. Setting up a clear standard would allow the staff
28
to help each other and work together to achieve their goals rather than waiting in the room after
their roles and tasks are finished.
Recommendations for Future Work
Because the student team was limited in time and scope, there are several recommendations for
future work done on OR turnover times. It is recommended that a future team look deeper into
the simultaneous processes that were outlined in this project. Within the simultaneous process,
there are several opportunities to look into reducing non-value added time within the different
jobs roles: anesthesia, circulators, PT’s, and scrubs. Another recommendation is to look more
into each of the roles present inside and outside the OR. It would be useful to determine what
other responsibilities anesthesia, circulators, and PT’s have outside of the OR in order to gain a
more wholistic view of their work. In addition, it would be helpful to gather more insight into the
roles and processes within pre-op and post-anesthesia care unit (PACU) which sometimes cause
delays in turnover. Another area look into is regarding the recommendation that the team made
to prepare for turnover by having all of the trash ready to leave the room and all the trays packed
up while the previous patient is getting ready to leave the room. It would be helpful to look into
the feasibility of standardizing this process.

29
References
[1] Fountain, Andrew, Kellman, Kimberly, Pitawanakwat, Colin, Zebus, Kathryn, “Utilizing
Garbology to Analyze Discrepancies between Planned, Documented, and Trashed Surgical
Supplies in Hospital Operating Rooms”, IOE 481, pp. 5-6, 2017.
[2] Mazzei, William J, “Operating room start times and turnover times in a university hospital,”
Journal of Clinical Anesthesia, vol. 6, no. 5, pp. 405–408, 1994.
[3] Cerfolio, Robert J., et al. "Improving operating room turnover time in a New York City
Academic Hospital via Lean." The Annals of thoracic surgery 107.4 (2019): 1011-1016.
30
Appendix A: Road to 30 - Room Turnover Operating Room Efficiency Poster
31
Appendix B: Requirements, Constraints, and Standards Matrix
Entry # 1 2 3 4
Requirements R-A.
Organizational
Policy
N.A.
R-B. Ethical N.A.
R-C. Health &
Safety
N.A.
R-D. Economic N.A.
R-E.
Implementability
(R-E-1) (R-E-2)
R-F. User
Acceptance
(R-F-1)
R-G. Patient
Acceptance
N.A.
R-H. Task
Duration
(R-H-1)
Entry # 1 2 3 4
Constraints C-A.
Organizational
Policy
N.A.
C-B. Ethical N.A.
C-C. Health &
Safety
N.A.
32
C-D. Economic (C-D-1)
C-E.
Implementability
(C-E-1)
C-F. User
Acceptance
N.A.
C-G. Patient
Acceptance
N.A.
C-H. Task
Duration
(C-H-1)
Entry # 1 2 3 4
Standards S-1. HIPAA (S-1-1)
S-2.
Organization's
Std.
N.A.
S-3. Best Practice N.A.
S-4. ASTM N.A.
S-5. Code N.A.
Standards that are
not applicable
ANSI NIOSH OSHA ASE
33
Appendix C: OR Observation Form

34
Appendix D: Swim Lane
35
Appendix E: Significant and Insignificant Factors
Significant Factors Insignificant Factors
Surgeon presence ASA score
Preparation before the patient exits Time of day
Number of PTs Procedure level
Scrub opening for next case Anesthesia
When room ready is called PT arrival time
Pre-Op activities
Service type
36
Appendix F: Current State Map
37
Appendix G: Pugh Decision Matrix
Criteria Weight Current State
of UHOR
Establish a
set standard
for “room
ready” time
Schedule in
additional
time for more
complex
cases
Clearly
communicate
expectations
for all parties
Benchmark
against other
similar
institutions
1.0 0 0 -1 0
Define team
roles and
responsibilities
2.0 0 +1 +1 +1
Clear roles and
tasks approved
by staff
2.0 0 +1 +1 +1
Minimize non
value added
time
3.0 0 -1 -1 +1
Total 0 +1 0 +7