Embed Size (px)
Citation preview

UNIVERSITAT AUTÒNOMA DE BARCELONA
FACULTAT DE CIÈNCIES DEPARTAMENT DE QUÍMICA
COMBINATION OF ADVANCED OXIDATION
PROCESSES AND BIOLOGICAL TREATMENTS FOR
COMMERCIAL REACTIVE AZO DYES REMOVAL
JULIA GARCÍA MONTAÑO PhD THESIS 2007
SUPERVISED BY JOSÉ PERAL PÉREZ
AND FRANCESC TORRADES CARNÉ

COMBINATION OF ADVANCED OXIDATION PROCESSES AND BIOLOGICAL TREATMENTS FOR
COMMERCIAL REACTIVE AZO DYES REMOVAL
Memoria presentada por Julia García Montaño para optar al
grado de Doctora en Química
Universitat Autònoma de Barcelona
Bellaterra, Junio de 2007

José Peral Pérez, Profesor Titular de Universidad del Departament de Química de la
Universitat Autònoma de Barcelona,
y
Francesc Torrades Carné, Profesor Titular de Universidad del Departament
d’Enginyeria Química de la ETSEIA de Terrassa, Universitat Politècnica de Catalunya,
CERTIFICAMOS:
Que la presente tesis doctoral, con título “Combination of Advanced Oxidation
Processes and Biological Treatments for Commercial Reactive Azo Dyes Removal”, ha
sido realizada bajo nuestra dirección por Julia García Montaño en el Departament de
Química de la Universitat Autònoma de Barcelona para optar al grado de Doctora en
Química.
Bellaterra, Mayo de 2007
José Peral Pérez Francesc Torrades Carné

A todos los que quiero
Patientia et labor omnia vincit
San Agustín

Agradecimientos
Esta tesis doctoral se ha realizado gracias a la financiación de la Unión Europea
(proyecto EVK1-CT-2002-00122), el Ministerio de Ciencia y Tecnología (proyecto
PPQ2002-04060-C02-01), el Ministerio de Educación y Ciencia (proyecto CTQ2005-
02808) y las becas de movilidad otorgadas por el Ministerio de Educación y Ciencia
(Programa de Acceso y Mejora de Grandes Instalaciones Científicas Españolas,
proyecto GIC-05-17) y la Generalitat de Catalunya (Estades per a la recerca a fora de
Catalunya).
Quiero expresar mi gratitud al Dr. José Peral y al Dr. Francesc Torrades por los
consejos y el tiempo dedicado en la dirección de esta tesis. Asimismo, agradezco el
apoyo, la ayuda y la atención de todos los colegas del Grupo de Fotocatálisis y Química
Verde del Departament de Química de la Universitat Autònoma de Barcelona.
Particularmente al Dr. Xavier Domènech, al Dr. José Antonio Ayllón, a la Dra. María
Isabel Franch y a María José Farré. Mi especial agradecimiento al Dr. José Antonio
García Hortal del Departament d’Enginyeria Tèxtil i Paperera de la ETSEIA de
Terrassa, Universitat Politècnica de Catalunya, y al Dr. Manuel Ignacio Maldonado y
colaboradores del Grupo de Química Solar de la Plataforma Solar de Almería.
Sin olvidar a Dystar Hispania, a Ciba Specialty Chemicals y a la estación de
depuración de aguas residuales de Manresa.
Finalmente, gracias a todas aquellas personas que han estado a mi lado alentándome
y apoyándome durante todos estos años.
Julia.

Preface
Nowadays, the remediation of textile effluents containing persistent dyestuffs is still
far away to a satisfactory solution. Consequently, the increased public concern and the
tighter international regulations have challenged the environmental scientists
community to explore new lines to reduce environmental problems associated with such
a wastewaters.
Advanced Oxidation Processes (AOPs) are well known strong technologies for
waste treatment purposes. Though, from an applied point of view, they still require
further advancement and extent. A new promising application field is their integration
with biological treatments, while taking advantage of the individual potentialities of
each other. In this direction, the investigation developed through this doctoral
dissertation deals with the coupling of an AOP –fundamentally the photo-Fenton
process– and a conventional biological treatment to treat solutions polluted with
commercial reactive azo dyes.

COMBINATION OF AOPS AND BIOLOGICAL TREATMENTS FOR COMMERCIAL REACTIVE AZO DYES REMOVAL ii
The memory, presented as a compendium of publications, is divided in the
following chapters: Introduction, Goal and Scope of the Work, Materials and Methods,
Results and Discussion, Concluding Remarks and Annexes.
The Introduction chapter highlights those aspects more significant for the present
experimental work understanding. The main topics regarding reactive dyes and textile
effluents, the conventional biological treatments, the AOPs used in this work, as well as
the different likely AOPs-biological coupling strategies have been described. The
chapter concludes with a brief introduction to the Life Cycle Assessment (LCA) as a
tool for quantitative evaluation of the environmental repercussion of processes, such as
AOP based treatments.
The Goal and Scope of the Work outlines the main scope and aims of this thesis.
The Materials and Methods chapter has been included into the memory in order to
extend and detail the experimental section of publications, thus facilitating repeatability
and further research in this application field.
The Results and Discussion chapter comprises the following five interrelated
publications. The issue begins with an overview of the various studies –including
unpublished results– emphasising major results and accomplished goals.
Decolourisation and mineralisation of homo- and hetero-bireactive dyes
under Fenton and photo-Fenton conditions
Coloration Technology, 120 (2004) 188-194
Decolorization and mineralization of commercial reactive dyes under solar
light assisted photo-Fenton conditions
Solar Energy, 77 (2004) 573-581
Degradation of Procion Red H-E7B reactive dye by coupling a photo-
Fenton system with a sequencing batch reactor
Journal of Hazardous Materials, 134 (2006) 220-229
Combining photo-Fenton process with aerobic sequencing batch reactor
for commercial hetero-bireactive dye removal
Applied Catalysis B: Environmental, 67 (2006) 86-92

PREFACE iii
Environmental assessment of different photo-Fenton approaches for
commercial reactive dye removal
Journal of Hazardous Materials, 138 (2006) 218-225
Following Results and Discussion, the Concluding Remarks chapter lists the general
conclusions drawn from the present work.
Finally, the Annexes encompass several unpublished results as well as some useful
supporting information. The unpublished results include the below works submitted for
publication. The first of them has been developed during a research stay at the
Plataforma Solar de Almería (PSA, Spain).
Pilot plant scale reactive dyes degradation by solar photo-Fenton and
biological processes
The testing of several biological and chemical coupled treatments for
Cibacron Red FN-R azo dye removal

TABLE OF CONTENTS

Table of Contents
ABBREVIATIONS AND SYMBOLS .......................................................................................I
CHAPTER 1. INTRODUCTION 1
1.1. REACTIVE DYES ........................................................................................................ 3 1.1.1. Structure of reactive dyes ................................................................................ 4 1.1.2. Dyeing with reactive dyes ................................................................................ 5 1.1.3. Environmental concern of reactive dyes ....................................................... 8
1.2. TEXTILE WASTEWATERS......................................................................................... 9 1.2.1. Nature and environmental impact ................................................................... 9 1.2.2. Textile wastewater treatments ....................................................................... 10
1.3. BIOLOGICAL TREATMENTS................................................................................... 12 1.3.1. Fundamentals .................................................................................................. 12 1.3.2. Aerobic treatment............................................................................................ 14 1.3.3. Anaerobic treatment ....................................................................................... 16 1.3.4. Biological systems.......................................................................................... 18
1.3.4.1. Suspended growth systems.......................................................................... 18
1.3.4.2. Immobilised growth systems......................................................................... 19
1.4. ADVANCED OXIDATION PROCESSES (AOPs)..................................................... 20 1.4.1. Fenton and photo-Fenton processes............................................................ 22

COMBINATION OF AOPS AND BIOLOGICAL TREATMENTS FOR COMMERCIAL REACTIVE AZO DYES REMOVAL viii
1.4.1.1. Fundamental chemistry................................................................................. 22
1.4.1.2. Operational conditions .................................................................................. 30
1.4.1.3. Benefits and limitations ................................................................................. 32
1.4.1.4. Applications to wastewater treatment ........................................................... 33
1.4.2. Ozonation......................................................................................................... 34 1.4.2.1. Fundamental chemistry................................................................................. 34
1.4.2.2. Operational conditions .................................................................................. 35
1.4.2.3. Benefits and limitations ................................................................................. 36
1.4.2.4. Applications to wastewater treatment ........................................................... 37
1.5. COMBINATION OF AOPs AND BIOLOGICAL TREATMENTS .............................. 37 1.5.1. Fundamentals .................................................................................................. 37 1.5.2. Applications to wastewater treatment .......................................................... 40
1.6. ENVIRONMENTAL ASSESSMENT: LIFE CYCLE ASSESSMENT (LCA).............. 42 1.6.1. Fundamentals .................................................................................................. 42
1.6.1.1. Definition and extent ..................................................................................... 42
1.6.1.2. Methodology.................................................................................................. 44
1.6.1.3. Benefits and limitations ................................................................................. 47
1.6.2. Applications to AOP based treatments......................................................... 48 1.7. REFERENCES........................................................................................................... 50
CHAPTER 2. GOAL AND SCOPE OF THE WORK 65
CHAPTER 3. MATERIALS AND METHODS 69
3.1. PREPARATION OF SYNTHETIC DYE SOLUTIONS............................................... 71 3.2. REAGENTS ............................................................................................................... 73 3.3. CHEMICAL ASSAYS ................................................................................................ 74
3.3.1. Dissolved Organic Carbon (DOC).................................................................. 74 3.3.2. Chemical Oxygen Demand (COD) ................................................................. 74 3.3.3. Colour and aromatic content analysis by UV/Vis spectrophotometry ...... 75 3.3.4. Hydrogen peroxide analysis by iodometric titration ................................... 76 3.3.5. Dissolved iron analysis (Fe (II) and total iron) by colorimetry ................... 77 3.3.6. High Performance Liquid Chromatography (HPLC) .................................... 78 3.3.7. Liquid Chromatography-(Electrospray Ionisation)-Time-of-Flight Mass
Spectrometry (LC-(ESI)-TOF-MS)................................................................... 78 3.3.8. Ion Chromatography (IC) ................................................................................ 79 3.3.9. Ammonium analysis by Nessler reagent...................................................... 80 3.3.10. Methane analysis by Gas Chromatography (GC) ........................................ 80 3.3.11. Ozone flow analysis by iodometric titration................................................. 81 3.3.12. Total and Volatile Suspended Solids (TSS, VSS) ........................................ 81

TABLE OF CONTENTS ix
3.4. BIOLOGICAL ASSAYS............................................................................................. 82 3.4.1. Zahn-Wellens biodegradability test............................................................... 82 3.4.2. Biochemical Oxygen Demand for 5 days (BOD5)......................................... 84 3.4.3. Acute toxicity................................................................................................... 85 3.4.4. Short-term respirometry................................................................................. 87 3.4.5. Anaerobic digestion assay............................................................................. 89
3.5. ANAEROBIC SLUDGE ADSORPTION EXPERIMENT............................................ 91 3.6. REACTORS AND EXPERIMENTAL PROCEDURES .............................................. 92
3.6.1. Fenton and photo-Fenton reactors ............................................................... 92 3.6.1.1. Cylindrical batch reactors.............................................................................. 92
3.6.1.2. Compound Parabolic Collector (CPC) .......................................................... 94
3.6.2. Ozonation set-up ............................................................................................. 97 3.6.3. Biological Reactors......................................................................................... 98
3.6.3.1. Sequencing Batch reactor (SBR).................................................................. 98
3.6.3.2. Immobilised Biomass Reactor (IBR)........................................................... 100
3.7. PHOTO-FENTON IRRADIATION SOURCES......................................................... 102 3.7.1. Black light ...................................................................................................... 102 3.7.2. Solar radiation ............................................................................................... 103
3.8. ENVIRONMENTAL ASSESSMENT METHODOLOGY.......................................... 105 3.9. REFERENCES......................................................................................................... 107
CHAPTER 4. RESULTS AND DISCUSSION 111
4.1. OVERVIEW.............................................................................................................. 113 4.2. PUBLICATIONS ...................................................................................................... 125
4.2.1. Decolourisation and mineralisation of homo- and hetero-bireactive dyes under Fenton and photo-Fenton conditions
Coloration Technology, 120 (2004) 188-194
4.2.2. Decolorization and mineralization of commercial reactive dyes under solar light assisted photo-Fenton conditions
Solar Energy, 77 (2004) 573-581
4.2.3. Degradation of Procion Red H-E7B reactive dye by coupling a photo-Fenton system with a sequencing batch reactor Journal of Hazardous Materials, 134 (2006) 220-229
4.2.4. Combining photo-Fenton process with aerobic sequencing batch reactor for commercial hetero-bireactive dye removal Applied Catalysis B: Environmental, 67 (2006) 86-92
4.2.5. Environmental assessment of different photo-Fenton approaches for commercial reactive dye removal Journal of Hazardous Materials, 138 (2006) 218-225

COMBINATION OF AOPS AND BIOLOGICAL TREATMENTS FOR COMMERCIAL REACTIVE AZO DYES REMOVAL x
CHAPTER 5. CONCLUDING REMARKS 171
ANNEXES 175
ANNEXE 1. UNPUBLISHED RESULTS .............................................................................. 177 A.1.1. Pilot plant scale reactive dyes degradation by solar photo-Fenton and
biological processes ..................................................................................... 179 Submitted for publication
A.1.2. Pathways of solar photo-Fenton degradation of Procion Red H-E7B reactive azo dye at pilot plant scale ............................................................ 207
A.1.3. The testing of several biological and chemical coupled treatments for Cibacron Red FN-R azo dye removal........................................................... 229 Submitted for publication
ANNEXE 2. SUPPORTING INFORMATION........................................................................ 249 A.2.1. LC-(ESI)-TOF-MS spectra ............................................................................. 251 A.2.2. LCA characterisation tables......................................................................... 261

ABBREVIATIONS AND SYMBOLS

Abbreviations and Symbols
A; Abs Absorbance
Ao; Abso Absorbance at t = 0
Abs542.5 Absorbance at 542.5 nm wavelength
Abs543.5 Absorbance at 543.5 nm wavelength
AEP Aquatic Eutrophication Potential
α Level of significance
AOB Ammonium Oxidising Bacteria
AOP Advanced Oxidation Process
AOX Adsorbable Organic Halogens
AP Acidification Potential
ARD Abiotic Resource Depletion
BOD Biochemical Oxygen Demand
BOD5 Biochemical Oxygen Demand for 5 days
BOD7 Biochemical Oxygen Demand for 7 days
C Concentration
Co Concentration at t = 0
CI Colour Index
COD Chemical Oxygen Demand
CPC Compound Parabolic Collector

COMBINATION OF AOPS AND BIOLOGICAL TREATMENTS FOR COMMERCIAL REACTIVE AZO DYES REMOVAL IV
DM Dry Matter
DO Dissolved Oxygen
DOC Dissolved Organic Carbon
DOCo Dissolved Organic Carbon at t = 0
E East; Energy
Eº Standard potential
EC50 Median effective concentration
FATP Freshwater Aquatic Toxicity Potential
GC Gas Chromatography
GWP Global Warming Potential
hν Photon
HPLC High Performance Liquid Chromatography
HRT Hydraulic Retention Time
HTP Human Toxicity Potential
IBR Immobilised Biomass Reactor
IC Ion Chromatography
%INH Percentage of inhibition
ISO International Standards Organisation
k Reaction rate constant
Keq Equilibrium rate constant
λ Wavelength
λmax Maximum absorption wavelength
LCA Life Cycle Assessment
LC-(ESI)-TOF-MS Liquid Chromatography-(Electrospray Ionisation)-Time-of-Flight
Mass Spectrometry
MAEP Marine Aquatic Ecotoxicity Potential
MS Mass Spectrometry
m/z Mass to charge ratio
n Sample size
N North
NB Non Biodegradable
NDIR Non Dispersive Infrared Detector
NHE Normal Hydrogen Electrode
NOB Nitrite Oxidising Bacteria
OD Oxygen Demand
ODst Oxygen Demand of the standard solution
ODP Ozone Depletion Potential
OLR Organic Loading Rate
PB Partly Biodegradable

ABBREVIATIONS AND SYMBOLS V
POP Photochemical Oxidation Potential
PSA Plataforma Solar de Almería
ro Maximum gradient of the degradation curve
RB Ready Biodegradable
SBR Sequencing Batch Reactor
SETAC Society of Environmental Toxicology and Chemistry
SMA Specific Methanogenic Activity
sOUR Specific Oxygen Uptake Rate
SRT Sludge Retention Time
t Time
t30W Normalised illumination time
t80% t30W necessary to obtain around 80% mineralisation
T Temperature
TC Total Carbon
TEP Terrestrial Ecotoxicity Potential
TIC Total Inorganic Carbon
TOC Total Organic Carbon
TOCo Total Organic Carbon at t = 0
TSS Total Suspended Solids
U Enzymatic units
UV Ultraviolet
UV254 Aromatic compounds content
UVA Ultraviolet A
UV/Vis Ultraviolet/Visible
Vi Irradiated volume
VSBR SBR operational volume
VT Total volume
VFA Volatile Fatty Acids
VSS Volatile Suspended Solids
W West
w/v Weight to volume ratio
WWTP Wastewater Treatment Plant

CHAPTER 1. INTRODUCTION

Chapter 1
Introduction
1.1. REACTIVE DYES
Dyes are chemical compounds characterised by absorbing in the visible region of
the electromagnetic spectrum (400 to 700 nm). This is the reason why they appear to be
coloured. Their application over the different affined substrates (textile materials,
leather, paper, hair, etc.) is performed from a liquid in which they are completely or
partially soluble [1]. They are classified based on two criteria (both used by the Colour
Index [2], which lists all dyes and pigments commercially used for large scale coloration
purposes): according to their chemical structure or according to their method of
application over the substrate.
Attending to the second criteria, in the 1950s appeared the first reactive dyes [1, 3],
characterised by containing one or more groups capable of forming, in general, covalent
bonds between a carbon or phosphorus atom of the dye and an oxygen, nitrogen or
sulphur atom of a hydroxy, an amino or a mercapto group of the substrate, respectively.

COMBINATION OF AOPS AND BIOLOGICAL TREATMENTS FOR COMMERCIAL REACTIVE AZO DYES REMOVAL 4
Such covalent bonds are formed with the hydroxyl groups of cellulosic fibres, with the
amino, hydroxyl and mercapto groups of protein fibres and with the amino groups of
polyamides. However, the reactive dye term usually refers to a dye applicable to
cellulosic fibres, since reactive dyes have been essentially applied to cotton and rayon
fibres, in this order.
1.1.1. Structure of reactive dyes
The structural features of a reactive dye are schematically shown in Figure 1.1 [1].
Two parts are mainly distinguishable: the chromogen and the reactive group. The first
contains a chromophore group (lineal or cyclic systems with conjugated double bonds)
that confers the colour to the dye, and one or more water solubilising groups, generally
sulphonic groups. As chromophore, the most employed are the azo type, which suppose
approximately 80% of the total (in fact, the majority of synthetic dyes currently used in
the industry are azo derivatives), followed by the anthraquinonics, the phthalocyanines
and those that present metal-ligand coordination bonds in their structure.
W D Q XRG
RG: electrophilic reactive group Q: bridge link X: nucleofugic leaving group D: chromogen W: water solubilising group
Figure 1.1. Structural features of a reactive dye.
The reactive group, bonded to the chromogen by a bridge link (structures generally
containing the amino or imino groups), is the responsible of the interaction with the
fibre [1]. This part of the molecule conditions on the chemical behaviour of the dye. The

CHAPTER 1. INTRODUCTION 5
most habitual for cellulosic fibre dyeing are the mono or dichlorotriazine and the
vinylsulphone groups, though more recently reactive dyes that present fluorotriazine
reactive groups in their structure have also emerged (Figure 1.2). Reactive dyes may
contain only one reactive group (monoreactive dyes) or two or more of them (bi- o
multi-reactive dyes). Depending on whether these reactive groups are the same or
different, they can be distinguished as homo- or hetero-, respectively.
vinylsulphone monofluorotriazine
monochlorotriazine dichlorotriazine
N
N
N
Cl
HN-R
HNDye
N
N
N
Cl
Cl
HNDye
Dye SO2 CH2 CH2 SO3H
N
N
N
F
HN-R
HNDye
Figure 1.2. Some important reactive groups for cellulosic fibres [1, 3].
1.1.2. Dyeing with reactive dyes
The basic dyeing process of cellulosic fibres with reactive dyes takes place in three
stages [3, 4]: sorption, reaction and washing of unfixed dye. This operation can be
performed in batch, semicontinuous or continuous mode.

COMBINATION OF AOPS AND BIOLOGICAL TREATMENTS FOR COMMERCIAL REACTIVE AZO DYES REMOVAL 6
In a first step of sorption in neutral media, the dye diffuse from dyebath through the
fibres, and gets fixed by way of secondary-type bonds (electrostatic forces, Van der
Waals forces, hydrogen bonds and hydrophobic interactions). The addition of neutral
electrolytes during this process (generally NaCl or Na2SO4 in a 50-80 g·l-1 dosage [5])
makes easier the sorption since they neutralise the electronegative potential of the fibre
and suppresses the dye-fibre repulsion.
Once reached the sorption equilibrium, a chemical reaction (almost irreversible)
initialises by adding an alkali, usually Na2CO3 (pH between 8 and 12 [3]). In this way,
the reactive groups react with the ionised hydroxyl groups of cellulosic substrate (i.e.,
Cel-O-). The temperature of dyeing ranges from ambient up to the boiling point (or even
superior). Depending on the reactive group that accompanies the dye, two reaction
mechanisms may be possible [4]:
- Nucleophilic substitution mechanism: The reactive group is constituted by a ring
structure with heterocyclic nitrogens and halogens (halotriazines). The last are ousted by
the cellulosate anion giving place to the covalent bond (Equation 1.1):
Dye-X + Cel-O- → Dye-O-Cel + X- (1.1)
- Nucleophilic addition mechanism: The reactive group is formed by a double bond
capable to form covalent bonds with cellulose. Frequently, this double bond is obtained
from a previous elimination step under mild alkaline conditions. The vinylsulphone
reactive group is an important representative of this system (Equations 1.2-1.4):
Dye-SO2-CH2-CH2-SO3H ⎯⎯ →⎯ −HO Dye-SO2-CH=CH2 (1.2)
Dye-SO2-CH=CH2 + Cel-O- → Dye-SO2-CH--CH2-O-Cel (1.3)
Dye-SO2-CH--CH2-O-Cel Dye-SO⎯⎯ →⎯ +H2-CH2-CH2-O-Cel (1.4)

CHAPTER 1. INTRODUCTION 7
Since water is also a weak nucleophilic agent, an important part of the reactive dyes
undergo, in parallel, alkaline hydrolysis of the reactive group (Equations 1.5-1.7). It is a
competitive reaction (around 30 times slower than the dye-fibre one) where the reactive
group loses the capacity of forming the covalent bond with the fibre. Hence, for a
reactive dye to be useful, the fraction of hydrolysis should be minimal. However, the
degree of exhaustion (the amount of dye taken from the dyebath by the fibre) of reactive
dyes is rather low (60-90%), and at the end of the dyeing process the dye is found in
two forms: linked to the fibre or hydrolysed (10-40%) [5].
Dye-X + HO- → Dye-OH + X- (1.5)
Dye-SO2-CH=CH2 + HO- → Dye-SO2-CH--CH2-OH (1.6)
Dye-SO2-CH--CH2-OH Dye-SO⎯⎯ →⎯ +H2-CH2-CH2-OH (1.7)
In a third stage, unfixed dye fraction, alkali and electrolyte are eliminated by
washing, generating high coloured dye-containing effluents. Depending on the reactive
dye colour intensity or the process employed, their concentration in dyebaths ranges
among 10 and 10,000 mg·l-1. After the washing stage, the dye solution is diluted
between 20 and 40% [6].
It is worth to mention that the incorporation of two or more reactive groups into the
dye molecule (bi- o multi-reactive dyes) affords further opportunities for reaction with
the fibre with a stronger dye-fibre anchorage, thus reducing the contamination of the
wastewater discharged [3]. Figure 1.3 shows an example of the benefits of a hetero-
bireactive dye (Cibacron FN, CIBA, Ciba Specialty Chemicals) in comparison with a
monoreactive dye [7].

COMBINATION OF AOPS AND BIOLOGICAL TREATMENTS FOR COMMERCIAL REACTIVE AZO DYES REMOVAL 8
Monoreactive dye Bireactive dye
R1-Dye-R2 Dye-R
Dye-OH Dye-R-O-Cel
fixation
70%
hydrolysis
30% OH-Dye-R2 Cel-O-R1-Dye-R2
fixation
70%
hydrolysis
30%
fixation
70%
hydrolysis
30%
OH-Dye-R2-O-Cel OH-Dye-OH
Figure 1.3. Increased fixation through bireactivity. Example of Cibacron FN (CIBA).
1.1.3. Environmental concern of reactive dyes
Reactive dyes have been identified as the most problematic compounds in textile
dye effluents [8, 9]. They are characterised by their readily water solubility as well as
their high stability and persistence, essentially due to their complex structure and
synthetic origin. Since they are intentionally designed to resist degradation, they
consequently offer a large resistance against chemical and photolytic degradation.
Moreover, as many of textile dyes, reactive dyes are usually non biodegradable under
typical aerobic conditions found in conventional biological treatment systems [10].
Among them, the reactive azo dyes family is of special interest. Although they are
usually of non toxic nature, they may generate, under anaerobic conditions (e.g., in
anaerobic sediments and in intestinal environments), breakdown products as aromatic
amines considered to be potentially carcinogenic, mutagenic and toxic [11, 12].
The fact that cotton supposes one of the first textile fibre worldwide, with a yearly
production that go beyond the 25 millions of tons (2005 data, see Table 1.1) [13], gives
an idea of the large scale production of reactive dyes, their extensive application
(nowadays, reactive dyes make 20-30% of the total dyestuff market [14]), and the

CHAPTER 1. INTRODUCTION 9
environmental pollution associated with the wastewaters generated. Besides, the large
fraction of reactive dyes wasted because of their large hydrolysis degree in alkaline
dyebaths further enhances the potential environmental risk of their effluents.
Table 1.1. World production of textile fibres (million tons).
2003 2004 2005 04/05 ± %
Chemical fibres 31.8 33.8 34.1 + 0.8
Syntheticsa 29.5 31.3 31.5 + 0.5
Cellulosicsb 2.3 2.5 2.6 + 4.9
Cottonc 20.7 26.3 25.1 - 4.5
Woolc 1.2 1.2 1.2 + 0.4
Silk 0.1 0.1 0.1 0
Total 53.8 61.5 60.5 -1.5
a excl. PP fibres and tapes b excl. acetate filter tow
c seasonal
1.2. TEXTILE WASTEWATERS
1.2.1. Nature and environmental impact
Textile mills are major consumers of water –with an average water consumption of
160 kg per kg of finished product [15]– and consequently one of the largest groups of
industries causing intense water pollution. Generated wastewaters collect different
effluents coming from different manufacturing unitary operations: from raw material
preparation processes (i.e., desizing, scouring and bleaching), as well as from dyeing,
soaping, softening, etc. These complex operations, subjected to frequent changes as a
result of shifting consumers preferences, are the cause of the variable volume and the
wide diversity of chemical products found in these wastewaters. Though their
characteristics depend on the specific operations performed, they commonly present
suspended solids, high temperature, unstable pH, high Chemical Oxygen Demand
(COD), low Biochemical Oxygen Demand (BOD) and high colourisation.

COMBINATION OF AOPS AND BIOLOGICAL TREATMENTS FOR COMMERCIAL REACTIVE AZO DYES REMOVAL 10
As commented above, colour of textile effluents is caused by dyes employed in
dyeing processes. In this sense, it is interesting to remark that about 106 tons and more
than 10,000 different synthetic dyes and pigments are produced annually worldwide and
used in dyeing and printing industries [16]. Other major pollutant types identified are
biocides used in the growing or storage of the fibre (e.g., chlorinated aromatics),
finishing products (e.g., synthetic resins), surfactants (e.g., alkyl phenol ethoxylates),
starches, solvents, fats and greases, heavy metals (e.g., chromium), salts (e.g.,
carbonate, sulphate, chloride), nutrients (e.g., ammonium salts, urea, phosphate based
buffers), oxidising agents (e.g., peroxide, dichromate), reducing agents (e.g., sodium
sulphide), bleaching agents (e.g., hypochlorite, hydrogen peroxide) and Adsorbable
Organic Halogens (AOX) formed as a result of the use of bleaching chemicals
containing chloride [17].
Such wastewaters composition would cause serious impacts when encountering
natural areas. High contents of organic matter originate depletion of dissolved oxygen,
which has an adverse effect on the marine ecological system. Nitrogen and phosphorous
nutrients content causes an increase of biomass production in aquatic environments,
also leading to a depletion of dissolved oxygen (namely eutrophication). Regarding high
colourisation, not only aesthetic pollution occurs (e.g., the eye can detect concentrations
of 0.005 mg·l-1 of reactive dye in water [18]), but it also produces strong absorption of
the sunlight responsible for the photosynthetic activity of aquatic plants, seriously
threatening the whole ecosystem [19].
1.2.2. Textile wastewater treatments
In this frame, textile industry is confronted with the challenge of effective
wastewater remediation. In general, the current practice in textile mills is to discharge
the wastewater directly into the local environment or into the municipal sewer system.
In any case, to accomplish with current local legislations (which are becoming more
stringent) [20], textile mills are sometimes forced to have their own treatment plant
prior discharge. The specific processes carried out at the different textile mills require a
proper specific treatment, which must guarantee the wastewater decontamination. In

CHAPTER 1. INTRODUCTION 11
some cases, the combination of various basic treatments is needed to improve the
overall efficiency of the wastewater treatment systems.
A varied range of methods have been developed for textile wastewater treatment at
laboratory, pilot or full scale. The most widely used are coagulation-flocculation,
adsorption (commonly with activated carbon), foam flotation, membrane filtration
(ultrafiltration, nanofiltration or inverse osmosis), biological treatments (mainly
conventional aerobic activated sludge treatments), and chemical processes (e.g.,
electrochemical methods or Advanced Oxidation Processes (AOPs)) [14, 21-25].
Coagulation-flocculation, adsorption, foam flotation and membrane filtration are
common practices, but result in a phase transfer of pollutants, leading to another form of
waste (such as spent carbon or sludge) that would require additional treatment or
disposal (e.g., incineration). In view of that, destructive methods such as chemical or
biological processes are desirable.
Nowadays, biological processes are the preferred choice for wastewater treatment
(Section 1.3). They are relatively inexpensive, the running costs are low and the end
products of complete degradation are not toxic [23]. Among them, the aerobic activated
sludge processes are widely used as the main treatment for both textile and mixed
textile and domestic effluents [22] (Section 1.3.4.1). However, they have proven to be
markedly ineffective for handling wastewater containing synthetic textile dyes
(especially for reactive and other anionic water-soluble dyes) because of their large
stability. The process considerably reduces the COD, while it is almost ineffective in
removing colour. Very little biodegradation of dyes occurs and adsorption onto biomass
seems to be the main colour removal mechanism. Alternatively, anaerobic
biodegradation may be applied for azo and other water-soluble dyes decolourisation
(most types of dyes are partially degraded under anaerobic conditions, though less
readily than azo dyes) [8, 9, 14, 17, 23-25]. Additionally, it offers several potential
advantages such as a better removal of AOX and heavy metals [14]. Many studies have
shown, however, that they generally only achieve a partial COD removal, making
necessary an ensuing aerobic treatment to attain the complete degradation [10, 12, 14,
22, 23]. The effectiveness of such combined treatments have been extensively shown at
laboratory and pilot scale experiments [10, 12, 22, 23], with several further applications
at full scale [14, 17].

COMBINATION OF AOPS AND BIOLOGICAL TREATMENTS FOR COMMERCIAL REACTIVE AZO DYES REMOVAL 12
Chemical processes are destructive alternatives when biological treatments are not
capable to abate both colour and COD from textile wastewater. Among them, AOPs
have been proposed in the last years as powerful advanced technologies for the
treatment of biorecalcitrant organic compounds [26] (Section 1.4). With their
incorporation, the complete decontamination of textile wastewaters becomes feasible.
1.3. BIOLOGICAL TREATMENTS
1.3.1. Fundamentals
The first objective of biological treatment processes is to coagulate, remove the non
settleable colloidal solids and to eliminate or reduce the carbonaceous organic matter
present in the wastewater. Additionally, biological treatments can also be useful to
reduce the inorganic concentration or to transform or remove nutrients such as nitrogen
and phosphorous [27].
In synthesis, the process occurs when a group of microbial cells, by way of a series
of biochemical reactions, use carbon and energy for cell growth and maintenance. Two
of the most common carbon sources for the formation of microorganisms are the
organic matter and inorganic carbon. Depending on whether organisms obtain the
carbon from the organic or inorganic source, they are called heterotrophs (the most
important group) or autotrophs, respectively. On the other hand, the energy input may
be supplied by sunlight or by chemical oxidation-reduction reactions. Autotrophic
organisms may take the energy from one or the other source, meanwhile heterotrophs
mainly obtain the energy by way of fermentation or organic matter oxidation [27, 28].
The biological treatment can be classified into four categories: aerobic treatment or
treatment in the presence of oxygen; anaerobic treatment or treatment in the absence of
oxygen; anoxic treatment or treatment in the presence of nitrate or nitrite; and a
combination of the aerobic and either anoxic or anaerobic processes [27]. Conventional
aerobic and anaerobic processes will be more extensively developed in Sections 1.3.2
and 1.3.3, respectively. Accordingly, depending on their oxygen necessities,
microorganisms can be classified as aerobic, anaerobic or facultative. The last are those

CHAPTER 1. INTRODUCTION 13
capable to adapt to either the presence or the absence of free molecular oxygen. On the
other hand, biological processes can also be classified according to the microorganisms
location: they can be kept suspended in the media or fixed on solid supports. The two
different configurations are briefly described in Section 1.3.4.
These biotreatment units are usually composed of heterogeneous and interrelated
complex biological populations. Bacteria are the main and most important
microorganisms involved. Nevertheless, the metabolic activities of other minority
microorganisms such as fungi, algae, protozoa and rotifers are also present, some of
them with essential roles in bioremediation.
Several environmental conditions influence on the microorganisms selection,
survival and growth, and consequently on the biological process operation [29].
Therefore, it is essential to effectively control some parameters such as the mixing or
hydraulic regime, which determine the accessibility of the substrate to microorganisms;
the oxygen availability; the nutrients availability: inorganic elements like nitrogen,
phosphorous and trace elements such as sulphur, potassium, calcium and magnesium
are of vital importance for cell synthesis. Additionally, organic nutrients may also be
needed by some microorganisms; the pH of the medium: metabolic reactions occur
fastest at optimum pH, usually defined at 6-8; the organic substrate concentration,
which must be high enough to ensure biomass growth; and the temperature of the
medium: the maximum growth rates generally occur between 25 and 33 ºC, although
some organisms can grow above 33 ºC (this is the case, for example, of anaerobic
bacteria). Depending on the temperature at which they grow best, bacteria will be
grouped in three categories: cryophilic (-2-30 ºC, optimum range 12-18 ºC), mesophilic
(20-45 ºC, optimum range 25-40 ºC) or thermophilic (45-75 ºC, optimum range 55-65
ºC) [27].
Every microorganism constituting the biological community has its own growth
curve, which will depend on external factors like the above listed. As an example,
Figure 1.4 shows the four stages of a typical growth curve of a pure bacterial culture
operated in batch mode: the lag phase, the logarithmic growth phase, the stationary
phase and the death phase [27, 28].

COMBINATION OF AOPS AND BIOLOGICAL TREATMENTS FOR COMMERCIAL REACTIVE AZO DYES REMOVAL 14
Figure 1.4. Typical bacterial growth curve [27].
Such a culture starts by inoculating a rich nutrient medium with a small number of
cells. Afterwards, bacteria are acclimated to the new environmental conditions during
the lag phase. This first region is characterised by little bacterial reproduction. Then,
they logarithmically grow until reaching the stationary phase, where bacteria population
stabilises. The stabilisation may be due to limiting substrate, limiting nutrients
conditions, build up of toxic material or to equilibrium between new and old cells.
Finally, during the death phase, dead cells overcome the new cells production, giving a
logarithmic decrease.
1.3.2. Aerobic treatment
Aerobic treatment is usually the method of choice for biological wastewater
treatment since many organic compounds are aerobically oxidisable [29]. Mainly,
heterotrophic bacteria oxidise organic matter yielding carbon dioxide and water as final
mineralisation products. As pointed earlier, organic matter oxidation provides the
required energy (E) for cell synthesis. In absence of organic matter, the own cells are
endogenously employed (auto-oxidation) to obtain the energy for organisms
maintenance. The whole process can be described by the following simplified

CHAPTER 1. INTRODUCTION 15
biochemical reactions (Equations 1.8-1.10) [27], where CHON represents the organic
matter and C8H15O4N a model cell chemical composition [30]:
Oxidation
CHON + O2 CO2 + H2O + NH4+ + other final products + E (1.8) ⎯⎯⎯ →⎯bacteria
Cells production
CHON + E C8H15O4N (new cells) (1.9) ⎯⎯⎯ →⎯bacteria
Endogenous respiration (auto-oxidation)
C8H15O4N (cells) + 9 O2 → 8 CO2 + NH3 + 6 H2O + E (1.10)
Though the above described endogenous respiration yields relatively simple final
products (Equation 1.10), it is worth to note that some stable organic products may also
be expected.
Apart from carbonaceous organic matter biodegradation, some autotrophic bacteria
are capable to metabolise the inorganic compounds presents in the media. The most
important inorganic compound is ammonium, which can exert a high oxygen demand
by means of a two-steps biological nitrification process (Equations 1.11 and 1.12) [27].
From these reactions, autotrophic bacteria (i.e., Ammonium Oxidising Bacteria (AOB)
and Nitrite Oxidising Bacteria (NOB)) gain energy, which will be used together with
more NH4+ and inorganic carbon (CO2, HCO3
-) for building cell material.
2 NH4+ + 3 O2 2 NO2
- + 4 H+ + 2 H2O + E (1.11) ⎯⎯ →⎯AOB
2 NO2- + O2 2 NO3
- + E (1.12) ⎯⎯ →⎯NOB

COMBINATION OF AOPS AND BIOLOGICAL TREATMENTS FOR COMMERCIAL REACTIVE AZO DYES REMOVAL 16
Under suitable environmental and operational conditions, nitrification process can
take place jointly with the carbonaceous organic matter biodegradation. Nevertheless,
the growth rates of nitrifying bacteria are slower than the heterotrophic ones, being
nitrification the limiting step in the biological treatment.
The main disadvantage of the aerobic treatment is the associated sludge production.
It supposes a high contribution to environmental contamination and it is an important
part to be solved in aerobic treatment processes [31]. There are different technologies
for exceeding sludge management. A general scheme is composed of the following
steps: thickening, dewatering, stabilisation, and main treatment [32]. The sludge volume
is reduced by thickening and dewatering processes. Then, it is stabilised by unit
operations like lime-stabilisation, oxidation with chlorine, thermal treatment or
anaerobic digestion [27]. Finally, the solid residues are usually incinerated, deposited at
landfill or destined to land applications.
1.3.3. Anaerobic treatment
Anaerobic treatment mainly decomposes organic matter in absence of molecular
oxygen to methane and carbon dioxide, among others (biogas). Its main and oldest
application is the stabilisation of the concentrated sludge generated through aerobic
wastewater treatment [27], though they can also be applied in wastewater treatment with
heavy organic loads [29]. Unfortunately, anaerobic organisms are very sensitive to
certain chemicals and the field of application of anaerobic treatment is not as broad as
aerobic bioremediation. Nevertheless, the techniques and methods of anaerobic
treatment have rapidly progressed in the last years and wastes previously thought to be
not amenable to anaerobic treatment are now biotreatable [29].
The degradation proceeds as a complex chain process which requires the synergistic
action of different types of facultative and anaerobic organisms [33]. It can be
simplified in three separated stages: in a first stage, hydrolysing and fermenting bacteria
convert complex organic compounds to Volatile Fatty Acids (VFA), alcohols, carbon
dioxide, ammonium and hydrogen. The second group of hydrogen producing acetogenic
bacteria converts the products of the first group into hydrogen, carbon dioxide and

CHAPTER 1. INTRODUCTION 17
acetic acid. Finally, in a third stage, methane-forming (methanogenic) bacteria convert
hydrogen and carbon dioxide or acetate to methane. The biodegradation final products
are responsible for the characteristic odours emitted by anaerobic treatment units.
There are also other groups of heterotrophic and autotrophic bacteria that may use
the different inorganic ions present. Throughout sulphate reduction process, bacteria
reduce sulphate to sulphur ion.
Due to the slow metabolism of hydrogen producing acetogenic and methane-
forming bacteria, especially the responsible of propionic and acetic acids degradation,
methanogenesis is the rate-limiting stage of the whole process. This fact that translates
to longer degradation times than the required for the aerobic treatment units [27].
Additionally, as a difference to aerobic process, anaerobic biodegradation must be
performed in a completely closed reactor with controlled thermal isolation. Anaerobic
microorganisms are also more sensitive to temperature and pH than the aerobic ones.
The optimum temperature ranges between 30-38 ºC and between 49-57 ºC for
mesophilic and thermophilic conditions, respectively [27]. Regarding pH, it is worth to
note that whether generated VFA reach a high concentration, methane-forming
microorganisms may be inhibited by the own process metabolites, hampering the whole
multi-stage chain [29]. Therefore, it is essential to maintain the pH over 6.2 to ensure
the methanogenic organisms activity [27].
Anaerobic treatment has the advantage of a lower energy demand (expensive
aeration is omitted) and a lower sludge production compared with aerobic treatment
[34]. The resulting sludge is also quite well stabilised and usually suitable to be directly
deposited at landfill or applied to agricultural fields. Moreover, the resulting methane is
combustible and can be later exploited by conversion into thermal or mechanical energy
[27].

COMBINATION OF AOPS AND BIOLOGICAL TREATMENTS FOR COMMERCIAL REACTIVE AZO DYES REMOVAL 18
1.3.4. Biological systems
1.3.4.1. Suspended growth systems
Suspended growth systems keep the biomass in suspension in the wastewater under
treatment. The biomass grows as suspended flocs of microorganisms. Generally, some
sort of mixing is employed to ensure a continuous contact with as much substrate as
possible. Once the biodegradation is over, biomass flocs are removed by clarification.
This kind of systems principally consist of batch or continuous flow reactors.
Aerobic activated sludge processes (Arden and Lockett, 1914 [35]), operating in
continuous flow mode, are the most popular treatment for both industrial and domestic
wastewaters. They consist of the introduction of the wastewater in an aerated and mixed
tank containing a suspended growth culture. Once the biodegradation is carried out,
biomass is settled out in a separated clarifier tank. Then, a part of this biomass is
recycled back to the process and the left part periodically wasted.
On the other hand, the batch operation is the oldest and simplest type of suspended
growth systems. A commonly used version is the so called Sequencing Batch Reactor
(SBR), introduced by R.L. Irvine in 1971 [36], satisfactorily applied in the
biodegradation of both municipal and industrial wastewaters [37]. The SBR holds the
complete biological treatment in a single tank (without independent clarifier) following
a timed controlled sequence composed of five stages: filling, reaction, settling, draw and
idle. Wastewater enters the reactor during the filling phase. The reactions
(biodegradation) initiated during filling are completed during the reaction phase by
initiating the proper mixing and/or aeration strategy. This stage can take place under
forced aeration allowing aerobic activity, or without forced aeration allowing anoxic
and possible anaerobic reactions. Settling (separation of the biomass from treated
water), draw (withdrawal of the supernatant formed during the sedimentation) and idle
(time between draw and filling) complete the sequence. The exceeding sludge is wasted
during the idle stage.
In comparison with conventional activated sludge processes, the SBR technology
incorporates several advantages mainly because of its simplicity, flexibility of operation
(even providing the capability of influencing the microbial community) as well as cost

CHAPTER 1. INTRODUCTION 19
effectiveness [37-39]. They are specially suited for wastewater treatment applications
characterised by low or intermittent flow conditions [39].
1.3.4.2. Immobilised growth systems
Immobilised growth systems rely on the microorganisms attaching themselves on or
within an inert solid medium that fills the reactor in the form of supports. Once finished
the biodegradation, treated wastewater is drained while biomass remains fixed to the
solid.
The major types of immobilised growth bioreactors consist of fixed bed, fluidised
beds or rotating discs [27, 40]. In the fixed bed type reactor, the supports are located in a
fixed place and do not move with the liquid. Wastewater passes through them getting in
contact with adhered biomass. The supports can be large pieces like rocks, plastic
sheets, redwood slats, etc. On the other hand, in the fluidised bed reactor, the supports
are suspended by the upward flow of the wastewater. Small particles as sand, coal,
activated carbon, ion-exchange beads and metal oxides have been used in this
configuration [29]. Finally, the rotating discs configuration consists of a series of
gyratory plastic discs partially submerged on the wastewater to be treated. The discs are
colonised with microorganisms.
Numerous literature works have shown some advantages of immobilised over
suspended biomass reactors [41]. These are the larger microbial diversity and the larger
spectrum of biochemical activities; the increase of cells lifetime; the larger biomass
contained per volume of bioreactor (making possible smaller reactors than suspended
systems); the higher rates of degradation, with efficiencies independent of flow rates;
the facility of operation (no clarification is necessary); the prevention of biomass
washout; and the resistance to toxic loading (most of the biological activity takes place
on the surface, which buffers most of the microorganisms from the shock of the toxic
substances). Some of their disadvantages would be the mass transfer difficulty (mainly
O2) and the higher energy demand associated with aeration.

COMBINATION OF AOPS AND BIOLOGICAL TREATMENTS FOR COMMERCIAL REACTIVE AZO DYES REMOVAL 20
1.4. ADVANCED OXIDATION PROCESSES (AOPs)
The AOP term was firstly coined by Glaze et al. in 1987 [42], and include all those
chemical oxidations based on the in situ generation of highly reactive hydroxyl radicals
(HO·) as principal oxidants. Their standard potential (Eº = 2.80 V versus Normal
Hydrogen Electrode (NHE)) is shown along with the ones of some common oxidants in
Table 1.2 [26]. Following fluorine, hydroxyl radical is the most powerful known
oxidant.
Table 1.2. Standard potential of some relevant oxidants (T = 25 ºC).
Oxidant Eº
V vs NHE
Fluorine 3.03
Hydroxyl radical 2.80
Atomic oxygen 2.42
Ozone 2.07
Hydrogen peroxide 1.78
Perhydroxyl radical 1.70
Permanganate 1.68
Chlorine dioxide 1.57
Hypochlorous acid 1.49
Chlorine 1.36
As a difference to other conventional oxidant species, the hydroxyl radical is
capable to completely oxidise (i.e., mineralise) even the less reactive pollutants [43]. It
reacts non selectively with organic compounds, principally by means of electrophilic
addition to unsaturated bonds, addition to aromatic rings, abstraction of hydrogen, or by
electron transfer (Equations 1.13-1.16) [44, 45]. Mineralisation end products generally
are carbon dioxide, water and inorganic ions, without a large residues generation. The
rate constants of most reactions involved are usually in the order of 106-109 l·mol-1·s-1
[46].

CHAPTER 1. INTRODUCTION 21
HO· + RH → R· + H2O (1.13)
(1.14) HO· + C=C HO-C-C·→+ C=C HO-C-C·→
HO· + →
H OH
· further reactions (1.15)
HO· + RH → [RH]·+ + HO- (1.16)
AOPs usually operate at or near to ambient temperature and pressure [42]. They can
be classified according to the reaction phase (homogeneous or heterogeneous) or
depending on the method used to generate the hydroxyl radical species (chemical,
electrochemical, photochemical, sonochemical or radiolytic techniques). Among them,
the most extensively used include: heterogeneous photocatalysis with TiO2 (single or
with H2O2) [47-49], treatment with ozone (often combined with H2O2, and/or UV) [47,
50, 51], H2O2/UV systems [6, 26, 51], and Fenton type reactions such as Fenton [45, 47,
52-54], photo-Fenton [45, 51, 52], or electro-Fenton processes [45, 55]. Each of them
offers different ways for hydroxyl radicals production. In this sense, the versatility of
AOPs becomes evident. The wide variety of techniques available, together with the
little selectivity of hydroxyl radical attack, allows a better compliance with the
requirements of every pollutant treatment.
The main disadvantage of AOPs is the operational cost associated with their high
electrical energy input (particularly UV radiation generation) and expensive chemicals
demand (H2O2, O3, etc.) [56]. In fact, only wastewaters with relatively small
concentrations (COD ≤ 5 g·l-1) can be economically treated with these technologies
[43].
However, not all photochemical AOPs require irradiation of the same wavelength.
Whereas direct O3 or H2O2 photolysis requires photons of short wavelength (below ~
300 nm) [57], heterogeneous photocatalysis with TiO2 and photoassisted Fenton
processes may employ photons of wavelengths up to around 400 nm [49] and 550 nm
[58-60], respectively. Consequently, both AOPs could be effectively driven under solar

COMBINATION OF AOPS AND BIOLOGICAL TREATMENTS FOR COMMERCIAL REACTIVE AZO DYES REMOVAL 22
irradiation (wavelengths greater than 300 nm) [56, 61], reducing significantly the
economic burden in a more environmentally friendly process. This fact is especially
interesting for the large scale application of these processes.
Another important strategy that could lead to overcome such AOPs drawbacks is to
combine AOPs with biological treatments. Under mild conditions, they can be
implemented as a previous step (aimed to turn biorecalcitrant pollutants into
biocompatible new compounds) or as a post-treatment (to abate the pollutants left after
the biological treatment) [62]. An exhaustive analysis of this application is developed in
Section 1.5.
The present work is centred in Fenton, photo-Fenton and ozonation processes, all of
them operating in homogeneous reaction phase.
1.4.1. Fenton and photo-Fenton processes
1.4.1.1. Fundamental chemistry
Dark reactions
It is generally accepted the “classical” mechanism described in 1934 by Haber and
Weiss [63] where, in Fenton reaction (Equation 1.17), firstly reported by H.J.H. Fenton
in 1894 [64], hydroxyl radicals are generated by interaction of H2O2 with ferrous salts –
namely the Fenton reagent–. For simplification, H2O ligands on iron sphere
coordination will be omitted from hereon.
Fe (II) + H2O2 → Fe (III) + HO· + HO- k = 53-76 l·mol-1·s-1 (1.17)
Generated Fe (III) can be reduced by reaction with exceeding H2O2 to form again
ferrous ion and more radicals. This second process is called Fenton-like, it is slower
than Fenton reaction, and allows Fe (II) regeneration in an effective cyclic mechanism

CHAPTER 1. INTRODUCTION 23
(Equations 1.18 and 1.19) [65]. Whether iron is added in small amounts, it acts as a
catalyst while hydrogen peroxide is continuously consumed.
Fe (III) + H2O2 → HO2· + Fe (II) + H+ k = 1-2·10-2 l·mol-1·s-1 (1.18)
Fe (III) + HO2· → Fe (II) + O2 + H+ k = 0.33-2.1·106 l·mol-1·s-1 (1.19)
The rate-limiting step is the regeneration of Fe (II) (Equations 1.18 and 1.19).
Ferrous ion remains at trace levels, with approximately constant Fe (III) concentration
in aqueous solution.
Equations 1.20-1.22 show other important dark reactions involving ferrous ion and
hydrogen peroxide (in absence of other interfering ions and organic substances). The
below listed radical-radical reactions, as well as the auto-decomposition of H2O2 take
also part of the complex process (Equations 1.23-1.26).
Fe (II) + HO2· + H+ → Fe (III) + H2O2 k = 0.72-1.5·106 l·mol-1·s-1 (1.20)
Fe (II) + HO· → Fe (III) + HO- k = 2.6-5.8·108 l·mol-1·s-1 (1.21)
H2O2 + HO· → HO2· + H2O k = 1.7-4.5·107 l·mol-1·s-1 (1.22)
2 H2O2 → 2 H2O + O2 (1.23)
2 HO· → H2O2 k = 5-8·109 l·mol-1·s-1 (1.24)
2 HO2· → H2O2 + O2 k = 0.8-2.2·106 l·mol-1·s-1 (1.25)
HO2· + HO· → H2O + O2 k = 1.4·1010 l·mol-1·s-1 (1.26)
The rate constants are those reported by Sychev and Isaak [66]. It is important to
note that some of the reactions are believed to occur in multiple steps [45].

COMBINATION OF AOPS AND BIOLOGICAL TREATMENTS FOR COMMERCIAL REACTIVE AZO DYES REMOVAL 24
There are specially worth mentioning side reactions that result from Fe (III) and
hydroquinone structures (typical aromatic degradation by-products generated by HO· addition to aromatic rings (Equation 1.15)). As they build up in solution, they provide a
quicker alternative for ferrous ion generation by successive one-electron transfer steps
via the semiquinone radical [67, 68]. An example is shown in Equations 1.27 and 1.28:
Fe (III) + →
OH
OH
O·
OH
(1.27) + Fe (II) + H+
Fe (III) + →
O·
OH
O
O
(1.28) + Fe (II) + H+
The resulting quinone can rapidly react with HO2· radical to build up the cycle
(Equation 1.29) [69]:
O
Finally, it should be commented that, instead of ferrous ion, the Fenton process may
also be initiated by combining H2O2 with ferric ion (Fenton-like process). In this case,
since iron catalyst cycles between II an III oxidation states, the same mechanism takes
place regardless of which one is used to initiate the chain. However, Equations 1.18 and
→ 2 HO2· +
O
+ 2 O2
OH
OH
(1.29)

CHAPTER 1. INTRODUCTION 25
1.19 are clearly slower than Equation 1.17, and starting with Fe (III) salt often results in
a slower initial rate [45].
Photochemical reactions
The efficiency of thermal (dark) Fe (II) recycling can be enhanced by near-UV to
visible light assistance [52, 57, 61, 65]. Under irradiation, ferric ion complexes can be
photolysed by passing through a photoexcited transition state before charge transfer and
complex dissociation (ligand-to-metal charge transfer reaction).
Especially worthy of mention is the photolysis of ferric aquo-complexes (photo-
Fenton reaction, Equation 1.30), producing extra HO· and the recovery of Fe (II) which
will further react with more H2O2 molecules in Fenton reaction (Equation 1.17). The
most important species is [Fe (III) HO]2+ (Equation 1.31), due to a combination of its
high absorption coefficient (it is known to be the most photoactive species, delivering
HO· with a quantum yield of 0.085 at 350 nm wavelength [70]) and its high
concentration relative to other Fe (III) species under typical photo-Fenton pH conditions
(see operational conditions in Section 1.4.1.2) [61].
[Fe (III) (HO)x]-x+3 ⎯⎯ →⎯ υh Fe (II) + (x-1) HO- + HO· (1.30)
[Fe (III) HO]2+ ⎯⎯ →⎯ υh Fe (II) + HO· λ ≤ 410 nm (1.31)
Photoassisted process can also drive ligand-to-metal charge transfer in the
potentially photolabile complexes formed by Fe (III) and organic compounds (Equation
1.32) [60]. The ferric ion complexes formed with carboxylic acids (Equation 1.33) [59,
61] are of special importance since they frequently appear as intermediate products
through Fenton type processes [45, 55]. In this case, complexes under irradiation
directly produce CO2. Additionally, they often have higher quantum yields than ferric
aquo-complexes and can occur over the UV and into the visible range (up to ~ 550 nm)
[59]. It is therefore typical to observe (in photoassisted processes) an increase of the

COMBINATION OF AOPS AND BIOLOGICAL TREATMENTS FOR COMMERCIAL REACTIVE AZO DYES REMOVAL 26
oxidation rate coinciding with carboxylic acids intermediates apparition. In this sense, it
is well established that initially adding such type of organic compounds together with
Fenton reagent causes the improvement of oxidation reaction yields. An example is
ferrioxalate [59, 61, 71], a well known photoactive ferric polycarboxylate complex [72].
[Fe (III) L]2+ ⎯⎯ →⎯ υh Fe (II) + L· (L = organic ligand) (1.32)
[Fe (III) LCOO]2+ ⎯⎯ →⎯ υh Fe (II) + CO2 + L· (1.33)
In photoassisted process, as in darkness, the rate-limiting step of the catalytic
mechanism is the regeneration of ferrous ion.
The fate of organic free radicals
The above generated organic radicals, together with those generated in Equations
1.13-1.16, react prolonging the complex chain mechanism. Some representative
reactions are shown below. Equations 1.34-1.37 would take place depending on the
redox potential of the organic radical generated. The organic peroxide generated in
Equation 1.37 can further react with Fe (II) similarly to Fenton reaction (Equation 1.38)
[73].
R· + Fe (III) → R+ + Fe (II) (1.34)
R· + Fe (II) → R- + Fe (III) (1.35)
R· + R· → R-R (1.36)
R· + HO2· → RO2H (1.37)
Fe (II) + RO2H → Fe (III) + RO· + HO- (1.38)

CHAPTER 1. INTRODUCTION 27
Of special interest is the “Dorfman” mechanism (Equation 1.39) [74, 75]. The
reaction between the intermediate organic radicals and O2 forms HO2·, which would
lead to an increase in either Fe (II) (Equation 1.19) or H2O2 (Equation 1.20), depending
on the Fe (III) to Fe (II) ratio [45]. Other reactions between intermediate organic
radicals and molecular oxygen are shown in Section 1.4.1.2.
R· + O2 → RO2· ROH + HO2· (1.39) ⎯⎯ →⎯ OH2
Influence of inorganic ions
Organic compounds oxidation by Fenton and photo-Fenton processes would be
inhibited (in varying degrees and depending on their concentration) by inorganic species
such as phosphate, sulphate, chloride and carbonate ions [75-77]. These may be initially
present in wastewater or be formed as final products from original compounds
undergoing degradation. Due to the high oxidation potential of HO·, this can react with
such anions and be scavenged from aqueous solution leading to non reactive species.
Some representative reactions are shown in Equations 1.40-1.43.
HO· + HCO3- → H2O + CO3·- k = 8.5·106 l·mol-1·s-1 (1.40)
HO· + CO32- → HO- + CO3·- k = 3.9·108 l·mol-1·s-1 (1.41)
HO· + Cl- → [ClOH]·- k = 4.3·109 l·mol-1·s-1 (1.42)
HO· + HSO4- → H2O + SO4·- k = 3.5·105 l·mol-1·s-1 (1.43)
Apart from the scavenging phenomenon, inhibition from anions may also be due to
iron precipitation or to coordination to dissolved Fe (III) to form a less reactive
complex. Phosphate ion, for instance, has a double detrimental effect since it both
scavenges HO· and forms insoluble complexes with Fe (III) in acidic media [45].

COMBINATION OF AOPS AND BIOLOGICAL TREATMENTS FOR COMMERCIAL REACTIVE AZO DYES REMOVAL 28
Additional pathways for Fe (II)/H2O2 reactions
Alternative pathways for Fe (II)/H2O2 reactions that involve other potential oxidants
than free hydroxyl radicals have been reported in the literature. Thermal Fenton reaction
was suggested to give a “caged” HO· loosely bound to Fe (III) that was capable of
intramolecular oxidation of an organic ligand [78]. On the other hand, numerous studies
have proposed the formation of aquo- or organo-complexes of a high-valent oxoiron
moiety (ferryl, Fe=O, Fe (IV) or Fe (V)), responsible for the direct attack to organic
matter [79-81]. In this direction, and more recently, Bossmann et al. [44] published
evidence of an alternative oxidant in thermal and photoassissted systems (Fe (IV)
oxoiron moiety, written as “Fe4+aq”), which may be formed by an inner-sphere two-
electron transfer reaction taking place within a hydrated Fe (II) + H2O2 complex.
Shortly later, Pignatello et al. [60] suggested that the irradiated process may involve the
photolysis of a Fe (III) + H2O2 complex ([Fe (III) HOO]2+) to form high-valent iron
based oxidants. Such reactions have shown to absorb visible light photons up to 550 nm
[58]. Both HO· and ferryl compounds would coexist in the Fe (II)/H2O2 system, and one
of them would predominate depending on the operational conditions (substrate nature,
Fe (II)/H2O2 ratio, scavengers addition, etc.) [47]. However, proposed non hydroxyl
radical schemes are still rather controversial while the free HO· chain mechanism is
broadly accepted for Fe (II)/H2O2 reactions.
Fenton reactions kinetics
The kinetics of Fenton reactions can be quite complex because of the large number
of steps involved. The general rate equation for the reaction of a target organic
compound may be written as follows [45]:
∑+=−i
RHoxoxRHHO·HO·RH ·C·Ck·C·Ck
dtdC
ii (1.44)

CHAPTER 1. INTRODUCTION 29
where oxi represents additional oxidants other than HO· that may also be present, such
as ferryl, is their concentration, is the hydroxyl radical concentration and
is the target organic compound concentration.
ioxC HO·C RHC
Since hydroxyl radical is usually regarded as the sole or most important reactive
species, Equation 1.44 can be rewritten as:
RHHO·HO·RH ·C·Ck
dtdC
=− (1.45)
Considering that the concentration of reactive species must quickly reach a
stationary state regimen during the process, and provided that CHO· may be considered
constant, the rate law may be treated as being of pseudo-first order in terms of
consumption of the target organic compound:
RHappRH ·Ck
dtdC
=− (1.46)
Finally, by integrating, a plot of lnCRH versus time generates a straight line whose
slope corresponds to the apparent rate constant value (kapp) of the target organic
compound degradation (Equation 1.47):
·tklnClnC appRHRH 0−= (1.47)
being the initial concentration of the target organic compound. 0RHC

COMBINATION OF AOPS AND BIOLOGICAL TREATMENTS FOR COMMERCIAL REACTIVE AZO DYES REMOVAL 30
1.4.1.2. Operational conditions
The performance of such a complex reactive system is clearly pH dependent –
particularly in Fenton-like and photo-Fenton reactions– with the maximum catalytic
activity at pH = 2.8 [60, 65]. For higher pH values, low activity is detected because of
the decrease of free iron species due to ferric oxyhydroxides precipitation. On the other
hand, the decrease of activity for pH values below the optimum is understandable taking
into account (i) the inhibition of the complexation of Fe (III) with H2O2 in Equation
1.18 and (ii) the photoactivity of the Fe (II) species present in solution [61]. Table 1.3
gives the predominant iron species (including water ligands) at different pH ranges:
Table 1.3. Hydrated Fe (III) species in solution and the range of pH where they are
predominant [61].
Fe species pH
[Fe (III) (H2O)6]3+ 1-2
[Fe (III) (HO)(H2O)5]2+ 2-3
[Fe (III) (HO)2(H2O)4]+ 3-4
As commented above, it is evident that [Fe (III) (HO)(H2O)5]2+, the most photoactive
species, is the dominant between pH 2 and 3. The majority of ferric ion below this pH
will be [Fe (III) (H2O)6]3+, with a lower irradiation absorption effectiveness [61].
Another important factor influencing the efficiency of these processes is the initial
Fe (II) and H2O2 dosage. Although Fenton type reactions have been widely studied,
there is no agreement on the ratio of H2O2 to Fe (II) that leads to the best mineralisation
results. Different authors have reported different reactants ratios [53, 82, 83], and it
seems difficult to attain a universal criterion for all type of substrates when the reaction
pathways and even the oxidative species may differ in each case [44]. The optimum
treatment conditions will depend on the composition and concentration of the specific
water to be treated, as well as on the degree of degradation that is to be achieved. In any
case, it has to be taken into account the detrimental effect of large concentrations of
either H2O2 or Fe (II) since they can act themselves as radicals scavengers (Equations

CHAPTER 1. INTRODUCTION 31
1.21 and 1.22) [16, 65]. Undesirable competitive reactions such as Equations 1.23-1.26
could also be favoured by using inappropriate Fe (II)/H2O2 ratios.
As other AOPs, Fenton and photo-Fenton processes are generally carried out at
room temperature. However, temperature is a key parameter that has to be taken into
account. It is known that thermal Fenton process is accelerated with increasing
temperature [84], although too high values (above 40 ºC) may decompose hydrogen
peroxide (Equation 1.23) [85] precluding the extent of mineralisation. When
photoassisted reactions are controlling the process, no beneficial effect would be
observable.
Obviously, incident irradiation intensity is also another factor affecting the rate of
generation of free radicals at photoassisted processes, and hence the rates of degradation
of the pollutants.
Finally, it has been reported that incorporation of molecular oxygen into the
complex reaction mechanism of the Fenton and photo-Fenton systems leads to greater
mineralisation of target pollutants to CO2 [45, 86]. O2 consumption may be caused by
different processes. It reacts with intermediate organic radicals to generate oxygenated
intermediates (Equation 1.48) [61, 87], forming photolabile Fe (III) complexes and thus
promoting overall mineralisation.
R· + O2 → RO2· → non radical oxygenated products (1.48)
The intermediate organoperoxides formed serve to oxidise Fe (II) to Fe (III), which
is photoactive (Equation 1.49).
RO2· + Fe (II) → RO2- + Fe (III) (1.49)
Finally, it generates HO2· by means of the before described “Dorfman” mechanism
(Equation 1.39).

COMBINATION OF AOPS AND BIOLOGICAL TREATMENTS FOR COMMERCIAL REACTIVE AZO DYES REMOVAL 32
The direct oxidation of Fe (II) by O2 (auto-oxidation) is too slow to be important in
acidic solution [65].
1.4.1.3. Benefits and limitations
Among the different AOPs, the Fenton and, especially, the photo-Fenton processes
are considered the most promising for the remediation of highly contaminated
wastewaters [44].
They constitute an attractive oxidative system since do not require neither expensive
reagents nor sophisticated instrumentation for pollutants destruction [43]. Iron is the
fourth most abundant element on the earth, as well as non toxic and safe, whereas
hydrogen peroxide, compared with other bulk oxidants, is reasonably priced, easy to
handle and environmentally benign [45, 61]. At the same time, the Fenton reagent is
considered a “clean” reagent [57]. Once the treatment is over, dissolved iron can be
removed by precipitation just increasing the pH of the media [88]. Moreover, if the
employed catalyst amount is small enough (in the order of few mg·l-1), it could remain
dissolved without affecting the quality of the resulting water. Likewise, any residual
hydrogen peroxide readily decomposes to O2 and H2O (Equation 1.23), posing no
lasting environmental threat [45, 57].
Fenton type processes are capable to carry out a deep mineralisation of pollutants
with, in many cases, oxidation effectiveness clearly superior than other AOPs [45, 56].
Additionally, from an economic and environmental point of view, photoassisted Fenton
process may also surpass most of them. As discussed before, It makes use of photons
with wavelengths from the near-UV up to visible (~ 550 nm), with the possibility of be
driven under solar irradiation [56, 61]. Even so, the high operational costs derived from
chemical reagents consumption are the main handicap of this technology.
Other associated drawbacks are the instability of the reagent mixture, the necessity
of pH changes, the interference by some substances that complex iron ions and the
possible iron oxide sludge generation and subsequent disposal [45]. In this sense, recent
studies aim at the application of iron as a heterogeneous catalyst [89], providing an easy
separation and the possibility of working without pH adjustments.

CHAPTER 1. INTRODUCTION 33
Finally, it should be pointed out that it is possible to take advantage of the iron
precipitation capacity. Under determined experimental Fenton conditions, iron may not
act just as a catalyst but also as a coagulant agent. Thereby, the pollutant removal would
be due to a non oxidative process based on the Fe(OH)3 co-precipitation. Some large
scale plants that use a large excess of iron as well as hydrogen peroxide exploit such
property [22].
1.4.1.4. Applications to wastewater treatment
The degradation of organic pollutants present in wastewater by means of Fenton,
and more especially of photo-Fenton systems is a fast growing field of applied research.
Illustrative bench scale studies are the treatment of pesticides [57, 58, 65], chlorinated
phenolic compounds [82, 83, 90], agricultural effluents (wine-distilleries and black
olive plants) [91], paper pulp bleaching effluents [92, 93] and dye-containing textile
effluents [16, 19, 84, 94, 95]. Applications involving surfactants, photographic wastes
and landfill leachates, have also been described [45].
At large scale, Oliveros et al. [96] reported the successful treatment of an industrial
wastewater contaminated with xylidines (toxic intermediates of pharmaceutical and
dyes and pigments industries) on a 500 l pilot plant by the photoassisted reaction.
Moreover, solar pilot plants have been designed for a variety of solar driven photo-
Fenton applications [77, 88, 97-100].
Fe (II)/H2O2 systems have also been applied at full scale, most of them on textile
effluents treatments [14]. A special remark has to be made to the first commercial
wastewater treatment plant applying solar driven photo-Fenton, which has been
installed in Almería, Spain (Albaida Recursos Naturales y Medio Ambiente, S.A.),
where wastewater coming from pesticide plastic bottles recycling is treated by solar
driven photo-Fenton process [101].
Currently, an important field of investigation concerns the combination of either
Fenton and/or photo-Fenton reactions (as AOPs in general) with biological treatments.
Some important examples are listed in Section 1.5.2.

COMBINATION OF AOPS AND BIOLOGICAL TREATMENTS FOR COMMERCIAL REACTIVE AZO DYES REMOVAL 34
1.4.2. Ozonation
1.4.2.1. Fundamental chemistry
Ozone is a very powerful oxidising agent (Eº = 2.07 V versus NHE) (see Table 1.2),
generally produced in situ by a high-voltage electric discharge in the presence of air or
pure oxygen. It can react with organic contaminants present in wastewater by two
possible mechanisms [102, 103]: the direct reaction (important at low pH), where the
oxidising agent is the molecular ozone, in a slow and highly selective attack to the
organic matter (especially in the case of unsaturated organic compounds); and the
indirect reaction, initiated by the ozone decomposition in presence of species such as
HO-, HO2-, HCOO-, Fe (II) or humic substances [104]. In this manner, the indirect
mechanism can be significantly promoted in basic media, where hydroxide ions would
initiate ozone decomposition entailing the following free radical mechanism (Equations
1.50-1.57) [50, 105-107]:
O3 + HO- → HO2- + O2 k = 70 l·mol-1·s-1 (1.50)
O3 + HO2- → HO· + O2·-
+ O2 k = 2.8·106 l·mol-1·s-1 (1.51)
O3 + O2·- → O3·- + O2 k = 1.6·109 l·mol-1·s-1 (1.52)
pH ≤ 8 O3·- + H+ HO3· (1.53) k
k+ = 5·1010 l·mol-1·s-1
- = 3.3·102 s-1
HO3· → HO· + O2 k = 1.4·105 s-1 (1.54)
pH ≥ 8 O3·- O·- + O2 (1.55) k+ = 2.1·103 l·mol-1·s-1
k- = 3.3·109 s-1
O·- + H2O → HO· + HO- k = 108 s-1 (1.56)
HO· + O3 → HO2· + O2 k = 1·108-2·109 l·mol-1·s-1 (1.57)

CHAPTER 1. INTRODUCTION 35
Throughout this chain sequence, ozone gives rise to the formation of HO· radical –
among others– which quickly and indiscriminately reacts with most organic compounds
present in the reacting media [105]. Some of its main reaction mechanisms have been
described in preceding Sections.
Both the molecular and the free radical oxidation pathways can take part in the
organic compounds oxidation. One or the other mechanism would prevail depending on
the composition of the specific wastewater, the ozone dosage and, mainly, the pH of the
media [104]. Since the oxidative power of HO· is higher than the oxidative power of
molecular ozone (see Table 1.2), it should be remarked that ozonation is a more
efficient treatment when experimental conditions favour the free radical mechanism.
1.4.2.2. Operational conditions
To favour the free radical mechanism, the pH should be superior to a critical value,
near neutrality [102]. However, it should be taken into account the detrimental effect of
excessively high pH values because of the scavenging of HO· radicals by part of
carbonate and hydrogencarbonate ions (Equations 1.40 and 1.41). In fact, the
scavenging capacity of certain anions earlier described for Fenton type reactions
(Section 1.4.1.1) is extended to any process involving HO·, such as ozonation.
Reaction efficiency is a function of the applied ozone dose. To attain a thorough
oxidation, a high enough O3 to contaminant molar ratio (largest than 5:1) is necessary
[104].
As other AOPs, ozonation process usually operates at or near to room temperature.
Though, temperature variation may cause two simultaneous opposed effects [47]: when
it increases, the rate constants of the reactions consequently increase. On the contrary,
the solubility of ozone drops off thus reducing the amount of ozone available for
oxidation [108]. In this way, there is no clear beneficial or damaging effect associated
with this variable.

COMBINATION OF AOPS AND BIOLOGICAL TREATMENTS FOR COMMERCIAL REACTIVE AZO DYES REMOVAL 36
Finally, it is interesting to remark that ozonation efficiency may be effectively
enhanced by O3 combination with H2O2 [105], UV irradiation [109] or both, and even
with TiO2 photocatalyst [110, 111] or photo-Fenton reaction [111].
1.4.2.3. Benefits and limitations
The main advantage of ozonation treatment is that, in general, it leads to a quick and
efficient removal of all type of contaminants. Its strong oxidant potential is especially
noticeable in those cases where other classical treatments are inefficient. Additionally,
ozone is just transformed into O2 and H2O, and does not introduce new substances into
the aqueous media.
In contrast, ozone generation requires a large amount of chemical reagent and
electrical energy [56] and its lonely use would result uneconomical in industrial
wastewater applications. This limitation adds to the instability of ozone in water, which
needs to be continuously generated and always at site. The maximum concentrations of
ozone produced in air or pure oxygen are approximately 4 and 8%, respectively [112],
and depending on the water quality, the half-life of ozone is in the range of seconds to
hours [50].
Another important drawback of ozonation is the low solubility of ozone in aqueous
solution. As a consequence, the gas-liquid mass transfer is often the main limiting factor
of the oxidation process [113]. This problem may be technically handled, for instance,
by maximising the interfacial area of contact (i.e., reducing the bubble size by using
small pore size ozone diffusers), by means of an increase of the contact time between
the gas and the solution (large bubble columns), or by increasing the pressure [47, 114].
However, these aspects suppose additional investments to the already high capital costs
related to the equipment (ozonator, abatement system for residual ozone, construction
materials that can resist to its powerful oxidative capability, etc. [43]).
Both operational cost and gas-liquid mass transfer limitations should be overcome to
make profitable the use of ozonation in large scale operation.

CHAPTER 1. INTRODUCTION 37
1.4.2.4. Applications to wastewater treatment
Throughout the last 20 years, the literature is full with successful applications of
ozonation on a wide range of contaminant compounds in wastewater. It has been used
for treatment of effluents from various industries related to pulp and paper production
(bleaching and secondary effluents) [115], production and usage of pesticides [114, 116,
117], dye manufacture and textile dyeing [118, 119], wine-distillery [120] and olive mill
wastewaters [121], among others. It is remarkable that, in the frame of AOP-biological
treatment strategies (see Section 1.5), some of the works apply ozonation as a pre- or
post-treatment of biological treatment units [120, 121]. More examples of ozonation and
biological coupling systems are shown in Section 1.5.2.
Several case studies in which ozone is used in full scale units are also reported [14].
In most of them the ozonation is used to raise the final quality of the effluents (tertiary
treatment).
1.5. COMBINATION OF AOPs AND BIOLOGICAL TREATMENTS
1.5.1. Fundamentals
The decontamination potential of AOPs technologies becomes evident.
Nevertheless, due to the associated high investment and operational costs (electrical
energy and chemicals demand), it is obvious that their application should not replace,
whenever possible, the cost-effective and environmentally compatible biological
treatments. However, bioremediation do not always proceeds to complete degradation.
Numerous factors can affect the biodegradation process. It may depend on the
environmental conditions (see Section 1.3.1) and on the nature of the chemical
compounds to be degraded. Two main factors have been identified responsible for the
biorecalcitrant behaviour of some organic compounds [16]: the lack of enzymes able to
degrade the molecule (which will depend on the size, the nature, number and position of
functional groups, etc.) and its toxic properties against the bioculture (i.e., the capability
to disrupt the functions or produce the death of the microorganisms). In this sense,

COMBINATION OF AOPS AND BIOLOGICAL TREATMENTS FOR COMMERCIAL REACTIVE AZO DYES REMOVAL 38
organic compounds may be non biocompatible due to their toxic and/or non
biodegradable character.
Biological treatment units may require, in such cases, the support of an effective
complementary technique to synergistically improve the entire efficiency of the
treatment. In this frame, the current research points to remediation strategies that
integrate AOPs and biological treatments. As introduced in Section 1.4, AOPs can be
implemented as a pre- or post-treatment of the biological process. The extent of
biorecalcitrance of the different wastewaters and the organic compounds therein will
decide the processes application order. Regardless, the resulting effluent should achieve
the required legislation limits.
Figure 1.5 presents a possible strategic scheme to be followed in each case, derived
from the general strategy proposed by Sarria et al. [122]. Biodegradable and non toxic
wastewaters (Ready Biodegradable; RB) can be directly biotreated. Otherwise, when
handling completely biorefractory wastewaters (Non Biodegradable; NB), the AOP is
performed as a first step (avoiding complete mineralisation) to just enhance the
biodegradability and generate a new solution capable to be subsequently treated in the
biological plant. Facing the treatment of partly biocompatible wastewaters (Partly
Biodegradable; PB), there are two possible alternatives: it can be firstly submitted to
biological treatment (to eliminate the biodegradable fraction) and then leaded to the
AOP stage to abate the remaining refractory COD; or it can be chemically treated prior
the bioremediation (analogously to NB). Depending on the wastewaters characteristics,
one or the other option will be preferable. Finally, it is worth to note that some specific
breakdown products generated throughout the biological unit (even coming from
initially biotreatable wastewaters) may accumulate in the reaction and/or inhibit the
microorganisms, requiring further chemical oxidation (see Figure 1.5) [62].

CHAPTER 1. INTRODUCTION 39
WASTEWATER
AOPAOP
NO YES
PARTLY
YES
BIOLOGICALTREATMENTBIOLOGICALTREATMENT
(RB)
(PB)
(NB)
EFFLUENT
LEGISLATION REQUIREMENTS
ACHIEVED?
NO
BIODEGRADABLE?
Figure 1.5. Strategy for wastewater treatment processing.
Such chemical and biological combinations intend to take advantage of the
individual potentialities of each treatment, avoiding their above described drawbacks
[62]. The final goal would be to minimise the AOP in front of the biological stage,
while reducing at maximum its large chemicals and energy consumption. It should be
commented that, to harmonise them, sample pre-treatment like pH readjustments or the
removal of any bactericide residual reagent coming from the AOP should be tackled.
As deduced from Figure 1.5, a key aspect is the determination of the toxic or
biodegradable nature of the original wastewater and the intermediate solutions
generated. It directly influences the effectiveness of each treatment step and determines

COMBINATION OF AOPS AND BIOLOGICAL TREATMENTS FOR COMMERCIAL REACTIVE AZO DYES REMOVAL 40
when it would be optimal to switch processes. There is large number of tests used to
provide information about biocompatibility. In this sense it is worth to note that, since
many factors can influence the tests results, there is not a universal response and it is not
possible to define a truly reliable method; the choice of one or the other will depend on
the testing purpose [123].
Biodegradation tests are normally used to predict the biodegradation behaviour of a
test material in natural or technical environments. Standardised methods such as the
Zahn-Wellens assay [124] or the respirometric tests [125, 126] are commonly employed
for aerobic tests. The BOD5/COD ratio of a wastewater also constitutes a good index of
screening aerobic biodegradability. It is established that contaminants with a ratio
BOD5/COD ≥ 0.4 may be considered thoroughly biodegradable [53]. On the other hand,
anaerobic biodegradability may be determined by means of methods based on the
methanogenic activity measurement [127, 128], among others.
Regarding toxicity, the measurement of the inhibition activity of different
microorganisms such as luminescence bacteria (e.g., the Vibrio fischeri [129] or the
Photobacterium phosphoreum [130]), the crustaceans Daphnia magna [131], as well as
the aerobic activated sludge [132] or anaerobic complex biomass [133, 134] are
generally employed.
1.5.2. Applications to wastewater treatment
A wide range of studies have already stated the potential of these coupled systems to
treat different model compounds and real wastewaters coming from various origins.
Examples are olive mill wastewaters, paper pulp bleaching effluents, alkaline fruit
cannery effluents, textile wastewaters, waters containing pesticides, wine-distillery
effluents, chlorinated phenolic compounds solutions, wastewaters coming from
polyester resin production, and landfill leachates, among others.
The choice of the appropriate chemical and biological unit depends on the
characteristics of the wastewater and the goal of the treatment [62]. The biological
process may involve isolated or mixed microorganisms cultures acting under different

CHAPTER 1. INTRODUCTION 41
oxygen environments and located on fixed solid supports or suspended in the media.
Only biological processes involving mixed biomass communities are considered here.
Among the proposed coupling strategies, special attention has been given to combining
the AOP and aerobic biological processes, in this order. Typical sequences are
composed of O3-aerobic treatment [120, 121, 135, 136], Fenton type reactions-aerobic
treatment [122, 135, 137-146] and TiO2 photocatalysis-aerobic treatment [122, 138,
146, 147]. Also dealing with aerobic biological treatments, the inverse strategy such as
the aerobic process followed by Fenton type reactions [143, 148] or ozonation [121,
149] has been reported.
On the other hand, anaerobic digestion has been followed by Fenton reagent [150],
simple ozonation [150-152] or O3 combined with H2O2 [151]. Other studies integrating
the anaerobic biotreatment as a post-treatment of the electro-Fenton process have been
already conducted [153].
Finally, more complex chemical-biological systems have also been proposed. Some
examples are a treatment cycle that implies an anoxic-aerobic-O3 sequence [154], an
anaerobic-Fenton-ozonation treatment [150] or an anaerobic-aerobic-O3-anerobic multi-
stage treatment [136].
Such combined chemical-biological strategies have been mostly developed at
laboratory scale, though some of them have already been scaled-up to pilot plant
designs. Obviously, the last aim will be their implementation at full scale for real
wastewater applications. In this sense, it is important to remark the first industrial scale
application of an oxidative pre-treatment (photo-Fenton or ozone) coupled to an aerobic
immobilised biomass treatment installed in Almería, Spain (DMS-Deretil) for the
treatment of salted water polluted with α-methylphenylglycine [155].

COMBINATION OF AOPS AND BIOLOGICAL TREATMENTS FOR COMMERCIAL REACTIVE AZO DYES REMOVAL 42
1.6. ENVIRONMENTAL ASSESSMENT: LIFE CYCLE ASSESSMENT (LCA)
1.6.1. Fundamentals
1.6.1.1. Definition and extent
LCA is an environmental management tool used to assess the environmental
impacts of a product1 over the entire life cycle, “from cradle to grave”. The origins of
the LCA methodology can be traced to the late 1960s [156], though it is not until the
1990s when its development and standardisation takes off [157]. In 1993 the Society of
Environmental Toxicology and Chemistry (SETAC) published a ‘Code of Practice’
[158], which presents general principles and a framework for the conduct, review,
presentation and use of LCA studies. More recently, a series of international standards
for LCA put together by the International Standards Organisation (ISO) have emerged.
Azapagic [159] has reviewed aspects of the ISO standards, and compared them with the
SETAC methodology [160]. The study shows that both methodology frameworks are
similar with some differences for the interpretation phase, since ISO includes further
analysis and sensibility studies.
According to ISO 14040 [161], the LCA is defined as “A technique for assessing
the environmental aspects and potential impacts associated with a product by:
- compiling an inventory of relevant inputs and outputs of a product system,
- evaluating the potential environmental impacts associated with those inputs and
outputs,
- interpreting the results of the inventory analysis and impact assessment phases in
relation to the objectives of the study”.
In synthesis, the LCA technique exhaustively examines every stage of the whole
product life cycle, from the obtainment of raw materials, through its manufacture,
1 The term product is taken in its broadest sense, including physical goods as well as services.

CHAPTER 1. INTRODUCTION 43
distribution, use (and possible reuse, recycling) and final disposal. It collects the inputs
(resources) and the outputs (emissions) of each stage. These inputs and outputs are
aggregated over the life cycle, and then converted into the corresponding potential
impacts on the environment. The sum of such environmental impacts represents the
overall environmental effect of the life cycle of the product.
The main applications of LCA are the environmental assessment of a particular
product in order to detect the hot spots in their whole life cycle; the environmental
comparison of different products that perform the same function; and the environmental
design of new products [162]. In this way LCA can help, for instance, in marketing,
strategic planning, to identify opportunities to improve the environmental aspects of a
product along its life cycle, to take an industry decision, etc. [161].
The entire LCA methodology, briefly described in Section 1.6.1.2, is detailed in the
following ISO standard series:
- ISO 14040 (2006). Environmental Management –Life Cycle Assessment–
Principles and Framework [161].
- ISO 14044 (2006). Environmental Management –Life Cycle Assessment–
Requirements and Guidelines [163].
It is worth to mention that these two standards have recently replaced –with no
major changes in the context– the following ISO 14040, 14041, 14042 and 14043
series:
- ISO 14040 (1997). Environmental Management –Life Cycle Assessment–
Principles and Framework [164].
- ISO 14041 (1998). Environmental Management –Life Cycle Assessment– Goal
and Scope Definition and Inventory Analysis [165].
- ISO 14042 (2000). Environmental Management –Life Cycle Assessment– Life
Cycle Impact Assessment [166].
- ISO 14043 (2000). Environmental Management –Life Cycle Assessment– Life
Cycle Interpretation [167].

COMBINATION OF AOPS AND BIOLOGICAL TREATMENTS FOR COMMERCIAL REACTIVE AZO DYES REMOVAL 44
1.6.1.2. Methodology
The ISO standards establish four interrelated basic stages for LCA studies, namely
goal and scope, inventory analysis, impact assessment and interpretation [161, 163]
(Figure 1.6).
Goal and scope
Inventory analysis
Impact assessment
Interpretation
Goal and scope
Inventory analysis
Impact assessment
Interpretation
Figure 1.6. Stages in a LCA study.
Goal and scope
The goal and scope is the first stage of the LCA and probably the most important
since the elements defined here determine the working plan of the entire study.
In first place, the purpose of the study is unambiguously stated and justified in
relation to how the results have to be used (what will be made from obtained results and
who is the study destined to). Secondly, the scope of the study must be defined. It
implies, among other elements, defining the system, its boundaries (to separate all what
will not be analysed), the quality of the data used (technological, temporary and
geographic covering), the main hypothesis, as well as the limitations of the study. The
key concern in the scope stage is the establishment of the functional unit that is the unit
of product to which the environmental burdens must be referred to [168]. Its target is to
provide a reference for all the inputs and outputs considered, thus allowing the
assessment and comparison of their environmental impacts. It can be expressed in terms

CHAPTER 1. INTRODUCTION 45
of amount of product or be related to the amount of product needed to perform a given
function.
Inventory analysis
The inventory analysis of the LCA comprises the data collection and the calculation
procedures to quantify the inputs and outputs through the system boundaries. These
inputs and outputs are the energy and raw materials consumed, as well as the emissions
to air, water, soil, and solid waste produced. In order to make data available, several
databases with standardised format are being developed in various countries.
To make the analysis easier, the system is divided in several interconnected
subsystems. Usually, they are described by means of a flow diagram showing each
subsystem and its interrelations (Figure 1.7). All unitary operations must comply with
energy and mass conservation laws. Finally, obtained data are grouped in different
categories in an inventory table.
Subsystem 1
Subsystem 3
Subsystem 2
System
Emissons-Air-Water-Soil
ProductsEnergy
Rawmaterials
Subsystem 1Subsystem 1
Subsystem 3Subsystem 3
Subsystem 2Subsystem 2
System
Emissons-Air-Water-Soil
ProductsEnergy
Rawmaterials
Figure 1.7. Schematic flow diagram of a system [169].
Impact assessment
The impact assessment is the phase in which the set of results –mainly the inventory
table– derived from the inventory analysis is further processed in terms of potential

COMBINATION OF AOPS AND BIOLOGICAL TREATMENTS FOR COMMERCIAL REACTIVE AZO DYES REMOVAL 46
environmental impacts. It consists of four distinct steps: classification, characterisation,
normalisation and weighting.
The first step is the classification, where the inventoried data are grouped into
different impact categories according to the environmental effects they are expected to
produce (potential impacts). The categories that require consideration might be
internationally accepted and include representative problems such as resource depletion,
human health and ecological consequences (e.g., global warming, acidification,
eutrophication, photochemical oxidation, etc.).
Secondly, the characterisation step weights the different inputs and outputs
contributing to the same environmental impact category. An aggregated result is
obtained in a given unit of measure (characterised numeric values) generally by using
equivalency factors. These equivalency factors indicate how much a substance
contributes to an impact category compared with a reference substance. For instance, for
global warming impact category, CO2 and CH4 emissions would be all weighted in kg
CO2 units (the reference substance).
Normalisation is an optional step. It is carried out in order to normalise
characterisation data in relation to the actual magnitude of the impacts in some given
area in a reference period.
Finally, weighting is a subjective step based on value judgements, and it is not
scientific. These weighting factors may be established in a panel to directly investigate
the preferences of society for reduction of environmental impacts. It must be noted that,
according to ISO standards, weighting cannot be used in studies involving comparative
assertions disclosed to the public.
Interpretation
Final results are analysed in the interpretation phase according to the goals and
scope of the study, involving a review of all the LCA stages to check the consistency of
the assumptions and the quality of the data. They are discussed in terms of the critical
CHAPTER 1. INTRODUCTION 47
sources of impacts, providing transparent conclusions and recommendations to reduce
them.
1.6.1.3. Benefits and limitations
The LCA expands the debate on environmental concerns to a broad range of
environmental issues by using quantitative systematic methodology.
The essential characteristic and major strength of the LCA is its holistic nature,
bringing the environmental impacts into one consistent framework. All necessary inputs
and outputs in many stages and operations of the life cycle are considered to be within
the system boundaries. This includes not only direct inputs and outputs for production,
distribution, use and final disposal, but also indirect inputs and outputs (e.g., from the
initial production of the energy used) regardless of when or where they occur.
Unfortunately, according to Guinée et al. [162], the holistic nature of the LCA also
supposes its main limitation. In fact, a cradle-to-grave analysis of a product can be only
achieved at the expense of simplifying other aspects. The most important can be
summarised as follows:
- LCA focuses on the environmental aspects of products, and says nothing about
their economic, social and other characteristics.
- Essentially, LCA is based on linear modelling, i.e., for instance, doubling the
release of a pollutant to the environment is assumed to have a double impact.
- The environmental impacts are described as “potential impacts” [161] and not as
real impacts because they are not actually specified in time and space. The LCA can not
address localised impacts and is typically a steady-state rather than a dynamic approach.
In a context in which environmental effects depend on when, where and how they affect
the environment, the LCA tool currently does not provide a satisfactory framework to
predict actual effects in the environmental. Furthermore, the impacts are related to an –
often– arbitrarily defined functional unit.

COMBINATION OF AOPS AND BIOLOGICAL TREATMENTS FOR COMMERCIAL REACTIVE AZO DYES REMOVAL 48
- LCA intends to be science based, though it involves a number of subjective
technical assumptions, choices and hypothesis. To avoid arbitrariness, an important aim
is to make these decisions as transparent as possible. Presented information should be
clear and detailed.
- Data availability is another limitation. In spite of databases development, data are
frequently obsolete, incomparable, or of questionable quality.
In this frame, it should be remarked that LCA is one among other environmental
management techniques (i.e., Environmental impact assessment, Risk assessment, Cost-
benefit analysis, Corporate environmental performance, Material intensity per unit
service or Ecological footprint); each one characterised by its strengths and weaknesses.
Obviously, no single tool can provide all information itself. Hence, for overall
environmental management, a combination of complementary tools is needed for
decision-making.
1.6.2. Applications to AOP based treatments
Historically, LCA has been mainly applied to a broad range of products (e.g.,
energy, metals and minerals, polymers, paper, textile and leather, electronic,
manufacturing, agriculture, food, drinks, and also chemicals [170]). However, apart
from dealing with products, the LCA also offers potential as a tool for quantitative
evaluation of the environmental repercussion of processes [171].
In the context of the wastewater treatment technology, especially AOPs, the
increasing awareness on environmental protection encourages the application of
environmental management methods to better understand and reduce the impacts
associated with a particular technique. In view of this, every wastewater treatment
strategy must be developed paying special attention not only to its efficiency, but also to
its potential environmental impact. In this direction, the suitability of LCA as a tool for
the evaluation of chemical processes has been recently demonstrated [157, 172]. Its
application requires an inventory of the energy, reagents and auxiliary materials

CHAPTER 1. INTRODUCTION 49
consumed as well as the emissions and wastes generated, providing thereby a holistic
view of the environmental implications of the process.
There is extensive literature on the application of LCA to wastewater treatment
systems. However, most of the studies are focused on the performance of Wastewater
Treatment Plants (WWTP) dealing either with urban [31, 173, 174] or industrial
wastewaters (in a lower degree) [175]. As far as the AOPs application to wastewater
treatment is concerned, the number of published studies is still very scarce [176-179].

COMBINATION OF AOPS AND BIOLOGICAL TREATMENTS FOR COMMERCIAL REACTIVE AZO DYES REMOVAL 50
1.7. REFERENCES
[1] Zollinger H. (1991). Color chemistry. Syntheses, properties and applications of organic dyes and
pigments. VCH, 2nd Ed., New York, USA.
[2] Colour Index International (2002). Society of Dyes and Colourists and American Association of
Textile Chemists and Colorists, 4th Ed., www.colour-index.org.
[3] Waring D.R., Hallas G. (1994). The chemistry and application of dyes. Topics in applied chemistry.
Plenum Press, New York, USA.
[4] Cegarra J., Puente P., Valdeperas J. (1981). Fundamentos científicos y aplicados de la tintura de
materias textiles. Cátedra de Tintorería y Estampación de ETSIIT, Barcelona, Spain.
[5] López-Grimau V., Gutiérrez M.C. (2006). Decolourisation of simulated reactive dyebath effluents by
electrochemical oxidation assisted by UV light. Chemosphere, 62, 106-112.
[6] Neamtu M., Siminiceanu I., Yediler A., Kettrup A. (2002). Kinetics of decolorization and
mineralization of reactive azo dyes in aqueous solution by the UV/H2O2 oxidation. Dyes Pigments, 53,
93-99.
[7] Ciba Specialty Chemicals 124013 (1999).
[8] Carliell C.M., Barclay S.J., Naidoo N., Buckley C.A., Mulholland D.A., Senior E. (1994). Anaerobic
decolourisation of reactive dyes in conventional sewage treatment processes. Water S.A., 20, 341-345.
[9] Carliell C.M., Barclay S.J., Buckley C.A. (1996). Treatment of exhausted reactive dye bath effluent
using anaerobic digestion: laboratory and full scale trials. Water S.A., 22, 225-233.
[10] Brown D., Hamburger B. (1987). The degradation of dyestuffs –Part III– investigation of their
ultimate biodegradability. Chemosphere, 16, 1539-1553.
[11] Pinheiro H.M., Touraud E., Thomas O. (2004). Aromatic amines from azo dye reduction: status
review with emphasis on direct UV spectrophotometric detection in textile industry wastewaters. Dyes
Pigments, 61, 121-139.
[12] Frank P. van der Zee, Villaverde S. (2005). Combined anaerobic-aerobic treatment of azo-dyes. A
short review of bioreactor studies. Water Res., 39, 1425-1440.
[13] Chemical Fibers International (2006), 2, 72.
[14] Vandevivere P.C., Bianchi R., Verstraete W. (1998). Treatment and reuse of wastewater from the
textile wet-processing industry: review of emerging technologies. J. Chem. Technol. Biot., 72, 289-302.

CHAPTER 1. INTRODUCTION 51
[15] EPA (1996). Best management practices for pollution prevention in textile industry, manual.
625R96004, Washington DC, USA.
[16] Rodrígez M., Sarria V., Esplugas S., Pulgarin C. (2002). Photo-Fenton treatment of a biorecalcitrant
wastewater generated in textile activities: biodegradability of the photo-treated solution. J. Photoch.
Photobio. A. 151, 129-135.
[17] Delée W., O’Neil C., Hawkes F.R. Pinheiro H.M. (1998). Anaerobic treatment of textile effluents: a
review. J. Chem. Technol. Biot., 73, 323-335.
[18] O’Neill C., Hawkes F.R., Hawkes D.L., Lourenço N.D., Pinheiro H.M., Delée W. (1999). Colour in
textile effluents – sources, measurement, discharge consents and simulation: a review. J. Chem. Technol.
Biot., 74, 1009-1018.
[19] Kuo W.G. (1992). Decolorizing dye wastewater with Fenton´s reagent. Water Res., 26, 881-886.
[20] Reglamento del Dominio Público Hidráulico (2003). Real Decreto 606/2003.
[21] Robinson T., McMullan G., Marchant R., Nigam P. (2001). Remediation of dyes in textile effluent: a
critical review on current treatment technologies with a proposed alternative. Bioresource Technol., 77,
247-255.
[22] Mattioli D., Malpei F., Bortone G., Rozzi A. (2002). Water minimisation and reuse in textile
industry. In: Lens P., Pol L.H., Wilderer P., Asano T. (Eds.). Water recycling and resource recovery in
industry: analysis, technologies and implementation. IWA publishing, London, UK.
[23] Forgacs E., Cserháti T., Oros G. (2004). Removal of synthetic dyes from wastewaters: a review.
Environ. Int., 30, 953-971.
[24] Pearce C.I., Lloyd J.R., Guthrie J.T. (2003). The removal of colour from textile wastewater using
whole bacterial cells: a review. Dyes Pigments, 58, 179-196.
[25] Rai, H.S., Bhattacharyya M.S., Singh J., Bansal T.K., Vats P., Banerjee U.C. (2005). Removal of
dyes from the effluent of textile and dyestuff manufacturing industry. A review of emerging techniques
with reference to biological treatment. Crit. Rev. Env. Sci. Tec., 35, 219-238.
[26] Legrini O., Oliveros E., Braun A.M. (1993). Photochemical processes for water treatment. Chem.
Rev., 93, 671-698.
[27] Metcalf & Eddy (1985). Wastewater engineering. Treatment, disposal and reuse. Mc. Graw-Hill,
Inc., 2nd Ed., New York, USA.
[28] Manahan S.E. (2005). Environmental chemistry. CRC Press, 8th Ed., Boca Raton, USA.

COMBINATION OF AOPS AND BIOLOGICAL TREATMENTS FOR COMMERCIAL REACTIVE AZO DYES REMOVAL 52
[29] Stephenson R.L., Blackburn J.B. Jr. (1998). The industrial wastewater systems handbook. Lewis
publishers, New York, USA.
[30] Tchobanoglous G., Theisen H., Vigil S. (1993). Integrated solid waste management: Engineering
principles and management issues. Mc. Graw-Hill, New York, USA.
[31] Hospido A., Moreira M.T., Fernández-Couto M., Feijoo G. (2004). Environmental peroformance of
a municipal wastewater treatment plant. LCA case studies. Int. J. Life Cycle Ass., 10, 336-345.
[32] Suh Y.J., Rousseaux P. (2002). A LCA of alternative wastewater sludge treatment scenarios. Resour.
Conserv. Recy., 35, 191-200.
[33] Marchaim U. (1992). Biogas processes for sustainable development. FAO, Agricultural services
bulletin 95, Rome, Italy.
[34] O’Neill C., Hawkes F.R., Hawkes D.L., Esteves S., Willcox S.J. (2000). Anaerobic–aerobic
biotreatment of simulated textile effluent containing varied ratios of starch and azo dye. Water Res., 34,
2355-2361.
[35] Arden E., Lockett W.T. (1914). Experiments on the oxidation of sewage without the aid of filters. J.
Soc. Chem. Ind., 33, 523-539.
[36] Wilderer P.A., Irvine R.L., Goronszy M. C. (2001). Sequencing batch reactor technology. Scientific
and technical report No 10, IWA publishing, London, UK.
[37] Mace S., Mata-Alvarez J. (2002). Review of SBR Technology for Wastewater Treatment: An
Overview. Ind. Eng. Chem. Res., 41, 5539-5553.
[38] Irvine R.L., Ketchum L.H. Jr. (1989). Sequencing batch reactors for biological wastewater treatment.
CRC Crit. Rev. Environ. Control., 18, 255-294.
[39] EPA 1999. Wastewater technology fact sheet. Sequencing Batch Reactors. 832-F-99-073,
Washington DC, USA.
[40] Grady C.P.L., Daigger G.T., Lim H.C. (1999). Biological wastewater treatment. Marcel Dekker,
Inc., 2nd Ed., New York, USA.
[41] Sarria V., Pulgarin C. (2007). Biological Technology Optimisation. Technical Report of the CADOX
project: A Coupled Advanced Oxidation-Biological Process for Recycling of Industrial Wastewater
Containing Peristent Organic Contaminants. Reference: CADOX-T240-EPFL-01.
[42] Glaze W.H., Kang J.W., Chaplin D.H. (1987). The Chemistry of water treatment processes involving
ozone, hydrogen peroxide and ultraviolet radiation. Ozone-Sci. Eng., 9, 335-352.

CHAPTER 1. INTRODUCTION 53
[43] Andreozzi R., Caprio V., Insola A., Marotta R. (1999). Advanced oxidation proceses (AOP) for
water purification and recovery. Catal. Today, 53, 51-59.
[44] Bossmann S.H., Oliveros E., Göb S., Siegwart S., Dahlen E.P., Payawan L., Straub M., Wörner M.,
Braun A.M. (1998). New evidence against hydroxyl radicals as reactive intermediates in the thermal and
photochemically enhanced Fenton reactions. J. Phys. Chem. A, 102, 5542-5550.
[45] Pignatello J., Oliveros E., MacKay A. (2006). Advanced Oxidation processes for organic
contaminant destruction based on the Fenton reaction and related chemistry. Crit. Rev. Env. Sci. Tec., 36,
1-84.
[46] Hoigné J. (1997). Inter-calibration of OH radical sources and water quality parameters. Water Sci.
Technol. 35, 1-8.
[47] Gogate P.R. Pandit A.B. (2004). A review of imperative technologies for wastewater treatment I:
oxidation technologies at ambient conditions. Adv. Environ. Res., 8, 501-551.
[48] Ioannis K., Konstantinou, Triantafyllos A. Albanis. (2004). TiO2-assisted photocatalytic degradation
of azo dyes in aqueous solution: kinetic and mechanistic investigations: A review. Appl. Catal. B:
Environ., 49, 1-14.
[49] Herrmann J.M. (2005). Heterogeneous photocatalysis: state of the art and present applications. Top.
Catal., 34, 49-65.
[50] Urs von Gunten (2003). Ozonation of drinking water: Part I. Oxidation kinetics and product
formation. Water Res., 37, 1443-1467.
[51] Gogate P.R., Pandit A.B. (2004). A review of technologies for wastewater treatment II: hybrid
methods. Adv. Environ. Res., 8, 553-597.
[52] Kiwi J., Pulgarin C., Peringer P. (1994). Effect on Fenton and photo-Fenton reactions on the
degradation and biodegradability of 2 and 4-nitrophenols in water treatment. Appl. Catal. B: Environ., 3,
335-350.
[53] Chamarro E., Marco A., Esplugas S. (2001). Use of Fenton reagent to improve organic chemical
biodegradability. Water Res., 35, 1047-1051.
[54] Neyens E., Baeyens J. (2003). A review of classic Fenton’s peroxidation as an advanced oxidation
technique. J. Hazard. Mater., 98, 33-50.
[55] Brillas E., Mur E., Sauleda R., Sànchez L., Peral J., Domènech X., Casado J. (1998). Aniline
mineralization by AOP’s: anodic oxidation, photocatalysis, electro-Fenton and photoelectro-Fenton
processes. Appl. Catal. B: Environ., 16, 31-42.

COMBINATION OF AOPS AND BIOLOGICAL TREATMENTS FOR COMMERCIAL REACTIVE AZO DYES REMOVAL 54
[56] Bauer R., Fallman H. (1997). The photo-Fenton oxidation-a cheap and efficient wastewater treatment
method. Res. Chem. Intermediat., 23, 341-354.
[57] Huston P.L., Pignatello J. (1999). Degradation of selected pesticide active ingredients and
commercial formulations in water by the photo-assisted Fenton reaction. Water Res., 33, 1238-1246.
[58] Sun Y., Pignatello J. (1993). Photochemical reactions involved in the total mineralization of 2,4-D
by Fe3+/H2O2/UV. Environ. Sci. Technol., 27, 304-310.
[59] Hislop K.A., Bolton J.R. (1999). The photochemical generation of hydroxyl radical in the UV-
vis/ferrioxalate/H2O2 system. Environ. Sci. Technol., 33, 3119-3126.
[60] Pignatello J., Liu D., Huston P. (1999). Evidence for an additional oxidant in the photoassisted
Fenton reaction. Environ. Sci. Technol., 33, 1832-1839.
[61] Safarzadeh-Amiri A., Bolton J.R., Cater S.R. (1996). The use of iron in Advanced Oxidation
Processes. J. Adv. Oxid. Technol., 1, 18-26.
[62] Scott J.P., Ollis D.F. (1995). Integration of chemical and biological oxidation processes for water
treatment: review and recommendations. Environ. Prog., 14, 88-103.
[63] Haber F., Weiss J. (1934). The catalytic decomposition of hydrogen peroxide by iron salts. Proc.
Roy. Soc. A, 147, 332-351.
[64] Fenton H.J.H. (1894). Oxidation of tartaric acid in the presence of iron. J. Chem. Soc., 65, 899-910.
[65] Pignatello J. (1992). Dark and photoassisted Fe3+-catalyzed degradation of chlorophenoxy herbicides
by hydrogen peroxide. Environ. Sci. Technol., 26, 944-951.
[66] Sychev A.Y., Isaak V.G. (1995). Iron compounds and the mechanisms of the homogeneous catalysis
of the activation of O2 and H2O2 and of the oxidation of organic substrates. Russ. Chem. Rev., 64, 1105-
1129.
[67] Chen R., Pignatello J. (1997). Role of quinone intermediates as electron shuttles in Fenton and
photoassited Fenton oxidations of aromatic compounds. Environ. Sci. Technol., 31, 2399-2406.
[68] Chen R., Pignatello J. (1999). Structure-activity study of electron-shuttle catalysis by quinones in the
oxidation of aromatic compounds by the Fenton reaction. J. Adv. Oxid. Technol., 4, 447-453.
[69] Ma J., Song W., Chen C., Ma W., Zhao J., Tang Y. (2005). Fenton degradation of organic
compounds promoted by dyes under visible irradiation. Environ. Sci. Technol., 39, 5810-5815.

CHAPTER 1. INTRODUCTION 55
[70] Benkelberg H.J., Warneck P. (1995). Photodecomposition of iron (III) hydroxo- and sulfato-
complexes in aqueous solution: wavelength dependence of HO and SO4- quantum yields. J. Phys. Chem.,
99. 5214-5221.
[71] Safarzadeh-Amiri A., Bolton J.R., Cater S.R. (1997). Ferrioxalate-mediated solar degradation of
organic contaminants in water. Water Res., 31, 787-798.
[72] Hatchard C.G., Parker C.A., (1956). A sensitive chemical actinometer II. Potassium ferrioxalate as a
standard chemical actinometer. Proc. Roy. Soc. A, 235, 518-536.
[73] Huyser E.S., Hawkins G.W. (1983). Ferrous ion catalyzed oxidations of 2-propanol with
peroxyacetic acid. J. Org. Chem. 48, 1705-1708.
[74] Dorfman L.M., Taub I.A., Buehler R.E. (1962). Pulse radiolysis studies. I. Transient spectra and
reaction-rate constants in irradiated aqueous solutions of benzene. J. Chem. Phys., 36, 3051-3061.
[75] von Sonntag C., Dowideit P., Fang X., Mertens R., Pan X., Schuchmann M.N., Schuchmann H.P.
(1997). The fate of hydroxyl radical in aqueous solution. Water Sci. Technol. 35, 9-15.
[76] De Laat J., Truong Le G., Legube B (2004). A comparative study of the effects of chloride, sulfate
and nitrate ions on the rates of decomposition of H2O2 and organic compounds by Fe (II)/H2O2 and Fe
(III)/H2O2. Chemosphere, 55, 715-723.
[77] Kositzi M., Antoniadis A., Poulios I., Kiridis I., Malato S. (2004). Solar photocatalytic treatment of
simulated dyestuff effluents. Sol. Energy. 77, 591-600.
[78] Walling C., Amarnath K. (1982). Oxidation of mandelic acid by Fenton's reagent. J. Am. Chem. Soc.,
104, 1185-1189.
[79] Rahhal S., Richter H.W. (1988). Reduction of hydrogen peroxide by the ferrous iron chelate of
diethylenetriamine-N,N,N’,N’’,N’’-pentaacetate. J. Am. Chem. Soc., 110, 3126-3133.
[80] Arasasinghan R.D., Cornman C.R., Balch A.L. (1989). Detection of alkylperoxo and ferryl,
(FeIV=O)2+, intermediates during the reaction of tert-butyl Hydroperoxide with iron porphyrins in toluene
solution. J. Am. Chem. Soc., 111, 7800-7805.
[81] Rush J.D., Bielski B.H.J. (1994). Decay of ferrate (V) in neutral and acidic solutions. A premix pulse
radiolysis study. Inorg. Chem., 33, 5499-5502.
[82] Ruppert G., Bauer R., Heisler G. (1993). The photo-Fenton reaction-an effective photochemical
wastewater treatment process. J. Photoch. Photobio. A, 73, 75-78.
[83] Tang W.Z., Huang C.P. (1996). 2,4-Dichlorophenol oxidation kinetics by Fenton's reagent. Environ.
Technol., 17, 1371-1378.
COMBINATION OF AOPS AND BIOLOGICAL TREATMENTS FOR COMMERCIAL REACTIVE AZO DYES REMOVAL 56
[84] Pérez M., Torrades F., Domènech X., Peral J. (2002). Fenton and photo-Fenton oxidation of textile
effluents. Water Res., 36, 2703-2710.
[85] Nesheiwat F.K., Swanson A.G. (2000). Clean contaminated sites using Fenton’s reagent. Chem. Eng.
Prog., 96, 61-66.
[86] Utset B., Garcia J., Casado J., Domènech X., Peral J. (2000). Replacement of H2O2 by O2 in Fenton
and photo-Fenton reactions. Chemosphere, 41, 1187-1192.
[87] Kunai A., Hata S., Ito S., Sasaki, K. (1986). The role of oxygen in the hydroxylation reaction of
benzene with Fenton reagent. Oxygen-18 tracer sudy. J. Am. Chem. Soc., 108, 6012-6016.
[88] Malato S., Blanco J., Vidal A., Alarcón D., Maldonado M.I., Cáceres J., Gernjak W. (2003). Applied
studies in solar photocatalytic detoxification: an overview. Sol. Energy, 75, 329-336.
[89] Kiwi J., Denisov N., Gak Y., Ovanesyan N., Buffat P., Suvorova E., Gostev F., Titov A., Sarkisov
O., Albers P., Nadtochenko V. (2002). Catalytic Fe3+ clusters and complexes in Naftion active in photo-
Fenton processes. High-resolution electron microscopy and femtosecond studies. Langmuir, 18, 9054-
9066.
[90] Pera-Titus M., García-Molina V., Baños M.A., Jiménez J. Esplugas S. (2004). Degradation of
chlorophenols by means of advanced oxidation processes: a general overview. Appl. Catal. B: Environ.,
47, 219-256.
[91] De Heredia J.B., Torregrosa J., Domínguez J.R., Peres J.A. (2001). Kinetic model for phenolic
compound oxidation by Fenton’s reagent. Chemosphere, 45, 85-90.
[92] Pérez M., Torrades F., Garcia-Hortal J.A., Domènech X., Peral J. (2002). Removal of organic
contaminants in paper pulp treatment effluents by Fenton and photo-Fenton reactions. Appl. Catal. B:
Environ., 36, 63-74.
[93] Catalkaya E.Co., Kargi F. (2007). Color, TOC and AOX removals from pulp mill effluent by
advanced oxidation processes: A comparative study. J. Hazard. Mater., 139, 244-253.
[94] Ince N.H., Tezcanli G. (1999). Treatability of textile dye-bath effluents by advanced oxidation:
Preparation for reuse. Water Sci. Technol., 40, 183-190.
[95] Lopez Cisneros R., Gutarra Espinoza A., Litter M.I. (2002). Photodegradation of an azo dye of the
textile industry. Chemosphere, 48, 393-399.
[96] Oliveros E., Legrini O., Hohl M., Mueller T., Braun A.M. (1997). Large scale development of a
light-enhanced Fenton reaction by optimal experimental design. Water Sci. Technol., 35, 223-230.

CHAPTER 1. INTRODUCTION 57
[97] Gernjak W., Krutzler T., Glaser A., Malato S., Cáceres J., Bauer R., Fernández-Alba A.R. (2002).
Photo-Fenton treatment of water containing natural phenolic pollutants. Chemosphere, 50, 71-78.
[98] Arslan-Alaton I., Gurses F. (2004). Photo-Fenton and photo-Fenton-like oxidation of Procaine
Penicillin G formulation effluent. J. Photoch. Photobio. A, 165, 165-175.
[99] Amat A.M., Arques A., Miranda M. A., Segui S. (2004). Photo-Fenton reaction for the abatement of
commercial surfactants in a solar pilot plant. Sol. Energy. 77, 559-566.
[100] Maldonado M.I., Passarinho P.C., Oller I., Gernjak W., Fernández P., Blanco J., Malato S. (2007).
Photocatalytic degradation of EU priority substances: A comparison between TiO2 and Fenton plus
photo-Fenton in a solar pilot plant. J. Photoch. Photobio. A, 185, 354-363.
[101] Blanco J., Malato S., Maldonado M.I., Vincent M., Vincent J.P., Sánchez M., Myro E. (2004). The
Albaida Plant: first commercial step in solar detoxification. Global symposium on recycling waste
treatment and clean technology (REWAS’04), Madrid, Spain.
[102] Hoigné J., Bader H. (1976). The role of hydroxyl radical reactions in ozonation process in aqueous
solutions. Water Res., 10, 377-386.
[103] Hoigné J., Bader H. (1983). Rate constants of reactions of ozone with organic and inorganic
compounds in water-I. Non-dissociating organic compounds. Water Res., 17, 173-183.
[104] Domènech X., Jardim W.F., Litter M.I. (2001). Eliminación de contaminantes por Fotocatálisis
Heterogénea. In: Blesa M.A. (Ed.). Procesos Avanzados de Oxidación para la eliminación de
contaminantes. CYTED VII-G, La Plata, Argentina.
[105] Staehelin J., Hoigné J. (1982). Decomposition of ozone in water: rate of initiation by hydroxide
ions and hydrogen peroxide. Environ. Sci. Technol., 16, 676-681.
[106] Sehested K., Holcman J., Bjergbakke E., Hart E.J. (1984). Formation of ozone in the reaction of
hydroxyl with O3- and the decay of ozonide ion radical at pH 10-13. J. Phys. Chem., 88, 269-273.
[107] Elliot A.J., McCracken D.R., Ritchie D. (1989). Effect of temperature on atomic oxygen reactions
and equilibria: a pulse radiolysis study. Radiat. Phys. Chem., 33, 69-74.
[108] Beltran F.J., Garcia-Araya J.F., Acedo B. (1994). Advanced oxidation of atrazine in water. Part I:
ozonation. Water Res., 28, 2153-2164.
[109] Peyton G.R., Glace W.H. (1988). Destruction of pollutants in water with ozone in combination with
ultraviolet radiation. Environ. Sci. Technol., 22, 761-767.
[110] Sanchez L., Peral J., Domènech X. (1998). Aniline degradation by combined photocatalysis and
ozonation. Appl. Catal B: Environ., 19, 59-65.

COMBINATION OF AOPS AND BIOLOGICAL TREATMENTS FOR COMMERCIAL REACTIVE AZO DYES REMOVAL 58
[111] Piera E., Calpe J., Brillas E., Domènech X., Peral J. (2000). 2,4-Dichlorophenoxyacetic acid
degradation by catalyzed ozonation: TiO2/UVA/O3 and Fe(II)/UVA/O3 systems. Appl. Catal. B: Environ.,
27, 169-177.
[112] Nebel C. (1981). Ozone. In: Grayson M., Eckroth D. (Eds.). Kirk-Othmer encyclopedia of chemical
technology. John Wiley and Sons, 3rd Ed., New York, USA.
[113] Roche P., Volk C., Carbonnier F., Paillard H. (1994). Water oxidation by ozone or ozone/hydrogen
peroxide using the OZOTEST or PEROXOTEST methods. Ozone-Sci. Eng., 16, 135-155.
[114] Chiron S., Fernandez-Alba A., Rodriguez A., García-Calvo E. (2000). Pesticide chemical oxidation:
State-of-the-art. Water Res., 34, 366-377.
[115] Korhonen M.S., Metsarinne S.E., Tuhkanen T.A. (2000). Removal of ethylenediaminetetraacetic
acid (EDTA) from pulp mill effluents by ozonation. Ozone-Sci. Eng., 22, 279-286.
[116] Adams C.D., Randtke S.J. (1992). Ozonation byproducts of atrazine in synthetic and natural waters.
Environ. Sci. Technol., 26, 2218-2227.
[117] Benitez F.J., Acero J.L. Real F.J., García J. (2003). Kinetics of photodegradation of
pentachlorophenol. Chemosphere, 51, 651-662.
[118] Koyuncu I., Asfar H. (1996). Decomposition of dyes in textile wastewater with ozone. J. Environ.
Sci. Heal. A, 31, 1035-1041.
[119] Wu J., Wang T. (2001). Ozonation of aqueous azo dye in a semi-batch reactor. Water Res., 35,
1093-1099.
[120] Beltran F.J., Garcia-Araya J.F., Alvarez P.M. (1999). Wine-distillery wastewater degradation 1.
Oxidative treatment using ozone and its effect on the wastewater biodegradability. 2. Improvement of
aerobic biodegradation by means of an integrated (ozone)-biological treatment. J. Agr. Food Chem., 47,
3911-3924.
[121] Benitez F.J., Beltran-Heredia, J., Torregrosa J., Acero J.L. (1999). Treatment of olive mill
wastewaters by ozonation, aerobic digestion and the combination of both treatments. J. Chem. Technol.
Biot., 74, 639-646.
[122] Sarria V., Parra S., Adler N., Péringer P., Benitez N., Pulgarin C. (2002). Recent developments in
the coupling of photoassisted and aerobic biological processes for the treatment of biorecalcitrant
compounds. Catal. Today, 76, 301-315.
[123] Pagga U. (1997). Testing biodegradability with standardized methods. Chemosphere, 35, 2953-
2972.

CHAPTER 1. INTRODUCTION 59
[124] OECD (1992). Inherent biodegradability: modified Zahn-Wellens test. Test 302B, Paris, France.
[125] APHA-AWWA-WEF (1992). Standard Methods for the Examination of Water and Wastewater.
2710 B, 18th Ed., Washington DC, USA.
[126] OECD (1992). Manometric respirometry test. Test 301F, Paris, France.
[127] Field J., Alvarez R.S., Lettinga G. (1988). Ensayos anaerobios. Proc. of 4th Symposium on
wastewater anaerobic treatment, Valladolid, Spain.
[128] ISO (1999). Water quality. Evaluation of the ultimate anaerobic biodegradability of organic
compounds in digested sludge. Method by measurement of the biogas production. ISO 11734, Geneva,
Switzerland.
[129] ISO (1998). Determination of the inhibitory effect of water samples on the light emission of Vibrio
fischeri (Luminescent bacteria test). ISO 11348-3, Geneva, Switzerland.
[130] AFNOR (1991). Détermination de l’inhibition de la luminescence de Photobacterium
phosphoreum. T-90-320, Paris, France.
[131] OECD (1998). Daphnia sp., acute immobilisation test. Test 202 part I, Paris, France.
[132] ISO (1986). Water quality test for inhibition of O2 consumption by activated sludge. ISO 8192,
Geneva, Switzerland.
[133] Owen W.F., Stuckey D.C., Healy J.B., Young L.Y., McCarthy P.L. (1979). Bioassay for
monitoring biochemical methane potential and anaerobic toxicity. Water Res., 13, 485-492.
[134] Soto M., Mendez R., Lema J.M. (1993). Methanogenic and non-methanogenic activity tests:
theoretical basis and experimental set up. Water Res., 27, 1361-1376.
[135] Beltrán-Heredia J., Torregrosa J., García J., Domínguez J.R., Tierno J.C. (2001). Degradation of
olive mill wastewater by the combination of Fenton’s reagent and ozonation processes with an aerobic
biological treatment. Water Sci. Technol., 44, 103-108.
[136] Libra J.A., Sosath F. (2003). Combination of biological and chemical processes for the treatment of
textile wastewaters containing reactive dyes. J. Chem. Technol. Biot., 78, 1149-1156.
[137] Pulgarin C., Invernizzi M., Parra S., Sarria V., Polania R., Péringer P. (1999). Strategy for the
coupling of photochemical and biological flow reactors useful in mineralization of biorecalcitrant
industrial pollutants. Catal. Today, 54, 341-352.

COMBINATION OF AOPS AND BIOLOGICAL TREATMENTS FOR COMMERCIAL REACTIVE AZO DYES REMOVAL 60
[138] Parra S., Sarria V., Malato S., Péringer P., Pulgarin C. (2000). Photochemical versus coupled
photochemical-biological flow system for the treatment of two biorecalcitrant herbicides: metobromuron
and isoproturon. Appl. Catal. B: Environ., 27, 153-168.
[139] Lin S.H., Chang C.C. (2000). Treatment of landfill leachate by combined electro-Fenton oxidation
and sequencing batch reactor method. Water Res., 34, 4243-4249.
[140] Bertanza G., Collivignarelli C., Pedrazzani R. (2001). The role of chemical oxidation in combined
chemical-physical and biological processes: experiences of industrial wastewater treatment. Water Sci.
Technol., 44, 109-116.
[141] Sarria V., Kenfack S., Guillod O., Pulgarín C. (2003) An innovative coupled solar-biological
system at field pilot scale for the treatment of biorecalcitrant pollutants. J. Photoch. Photobio. A, 159, 89-
99.
[142] Al Momani F., Gonzalez O., Sans C., Esplugas S. (2004). Combining photo-Fenton process with
biological sequencing batch reactor for 2,4-dichlorophenol degradation. Water Sci. Technol., 49, 293-298.
[143] Fongsatitkul P., Elefsiniotis P., Yamasmit A., Yamasmit N. (2004). Use of sequencing batch
reactors and Fenton’s reagent to treat a wastewater from a textile industry. Biochem. Eng. J., 21, 213-220.
[144] Farré M.J., Domènech X., Peral J. (2006). Assessment of photo-Fenton and biological treatment
coupling for Diuron and Linuron removal from water. Water Res., 40, 2533-2540.
[145] Lapertot M., Ebrahimi S., Dazio, S., Rubinelli A., Pulgarin C. (2007). Photo-Fenton and biological
integrated process for degradation of a mixture of pesticides. J. Photoch. Photobio. A, 186, 34-40.
[146] Oller I., Malato S., Sánchez-Pérez J.A., Maldonado M.I., Gassó R., Blanco J. (2007). Detoxification
of wastewater containing five common pesticides by solar AOPs-Biological coupled system. Catal.
Today, in press.
[147] Parra S., Malato S., Pulgarin C. (2002). New integrated phtocatalytic-biological flow system using
supported TiO2 and fixed bacteria for the mineralization of isoproturon. Appl. Catal. B: Environ., 36, 131-
144.
[148] Hong, S.W. Choi, Y.S., Kwon, G., Park K.Y. (2005). Performance evaluation of physicochemical
processes for biologically pre-treated livestock wastewater. Water Sci. Technol., 52, 107-115.
[149] Heinzle E., Geiger F., Fahmy M., Kut O.M. (1992). Integrated ozonation biotreatment of pulp
bleaching effluents containing chlorinated phenolic compounds. Biotechnol. Progr., 8, 67-77.
[150] Fang H.H.P., Lau I.W.C., Wang P. (2005). Anaerobic treatment of Hong Kong leachate followed
by chemical oxidation. Water. Sci. Technol., 52, 41-49.

CHAPTER 1. INTRODUCTION 61
[151] Sigge G.O., Britz T.J., Fourie P.C., Barnardt C.A., Strydom R. (2001). Use of ozone and hydrogen
peroxide in the post-treatment of UASB treated alkaline fruit cannery effluent. Water Sci. Technol., 44,
69-74.
[152] Beltran-Heredia J., Garcia, J. (2005). Process integration: continuous anaerobic digestion-ozonation
treatment of olive mill wastewater. Ind. Eng. Chem. Res., 44, 8750-8755.
[153] Khoufi S., Aloui F., Sayadi S. (2006). Treatment of olive mill wastewater by combined process
electro-Fenton reaction and anaerobic digestion. Water Res., 40, 2007-2016.
[154] Krull R., Hempel D.C. (2001). Treatment of dyehouse liquors in a biological sequencing batch
reactor with recursive chemical oxidation. Water Sci. Technol., 44, 85-92.
[155] Oller I., Gernjak W., Ramos Siles C., Muñoz J.A., Maldonado M.I., Pérez-Estrada L.A., Malato S.
(2006). Industrial Scale Coupling of oxidative pre-treatment (solar photo-Fenton or ozone) and
immobilised biomass activated sludge biotreatment. 4th European Meeting on Solar Chemistry and
Photocatalysis: Environmental Applications (SPEA 4), Las Palmas de Gran Canarias, Spain.
[156] Miettinen P., Hamalainen R.P. (1997). How to benefit form decision analysis in environmental life
cycle assessment (LCA). Eur. J. Oper. Res., 102, 279-294.
[157] Burgess A.A., Brennan D.J. (2001). Application of life cycle assessment to chemical processes.
Chem. Eng. Sci., 56, 2589-2604.
[158] Consoli F., Allen D., Boustead I., de Oude N., Fava J., Franklin W., Quay B., Parrish R., Perriman
R., Postlethwaite D., Seguin J., Vigon B. (1993). Guidelines for life-cycle assessment: a code of practice.
SETAC, Brusseles, Belgium.
[159] Azapagic A. (1999). Life cycle assessment and its application to process selection, design and
optimisation. Chem. Eng. J., 73, 1-21.
[160] Fava J.A., Denison R., Jones B., Curran M.A. Vigon B., Selke S., Barnum J. (1991). A technical
framework for life cycle assessments. SETAC, Brusseles, Belgium.
[161] ISO (2006). Environmental Management –Life Cycle Assessment– Principles and Framework. ISO
14040, Geneva, Switzerland.
[162] Guinée J.B., Gorrée M., Heijungs R., Huppes G., Kleijn R., Koning A., van Oers L., Sleeswijk
A.W., Suh S., Udo de Haes H.A., Bruijn H., van Duin R., Huijbregts M.A.J. (2002). Handbook on Life
Cycle Assessment. Operational guide to the ISO Standards. Kluwer Academic Publishers, Dordrecht, The
Netherlands.
[163] ISO (2006). Environmental Management –Life Cycle Assessment– Requirements and Guidelines.
ISO 14044, Geneva, Switzerland.

COMBINATION OF AOPS AND BIOLOGICAL TREATMENTS FOR COMMERCIAL REACTIVE AZO DYES REMOVAL 62
[164] ISO (1997). Environmental management –Life Cycle Assessment– Principles and Framework. ISO
14040, Geneva, Switzerland.
[165] ISO (1998). Environmental Management –Life Cycle Assessment– Goal and Scope Definition and
Inventory Analysis. ISO 14041, Geneva, Switzerland.
[166] ISO (2000). Environmental Management –Life Cycle Assessment– Life Cycle Impact Assessment.
ISO 14042, Geneva, Switzerland.
[167] ISO (2000). Environmental Management –Life Cycle Assessment– Life Cycle Interpretation. ISO
14043, Geneva, Switzerland.
[168] Muñoz I., Rieradevall J., Domènech X. (2005). Definición de la unidad funcional e implicaciones
en el ACV. In: Clemente G., Sanjuán N., Vivancos J.L. (Eds.). Análisis de Ciclo de Vida: aspectos
metodológicos y casos prácticos. Ed. Universidad Politécnica de Valencia, Spain.
[169] Fullana P., Puig R. (1997). Análisis del ciclo de vida. Ed. Rubes, Barcelona, Spain.
[170] Azapagic A. (2002). Life-cycle assessment: a tool for identification of more sustainable products
and processes. In: Clark J., Macquarrie D. (Eds.). Handbook of green chemistry and technology.
Blackwell Sience, Oxford, UK.
[171] Lee J., O’Callaghan P., Allen D. (1995). Critical review of life cycle analysis and assessment
techniques & their application to commercial activities. Res. Conserv. Recy., 13, 37-56.
[172] Domènech X., Rieradevall J., Ayllon J.A., Peral J. (2002). How green is a chemical reaction:
application of LCA to Green Chemistry. Environ. Sci. Technol., 36, 5517-5520.
[173] Lundin M., Bengtsson M., Molander S. (2000). Life cycle assessment of wastewater systems:
influence of system boundaries and scale on calculated environmental loads. Environ. Sci. Technol., 34,
180-186.
[174] Vidal N., Poch M., Martí E., Rodríguez-Roda I. (2002). Evaluation of the environmental
implications to include structural changes in a wastewater treatment plant. J. Chem. Technol. Biot., 77,
1206-1211.
[175] Pillay S.D., Friedrich E., Buckley C.A. (2002). Life cycle assessment of an industrial water
recycling plant. Water Sci. Technol., 46, 55-62.
[176] Nijdam D., Blom J., Boere J.A. (1998). Environmental life cycle assessment (LCA) of two
advanced treatment techniques. Stud. Surf. Sci. Catal., 120, 763-775.
[177] Muñoz I., Rieradevall J., Torrades F., Peral J., Domènech X. (2005). Environmental assessment of
different solar driven advanced oxidation processes. Sol. Energy, 79, 369-375.

CHAPTER 1. INTRODUCTION 63
[178] Muñoz I., Rieradevall J., Torrades F., Peral J., Domènech X. (2006). Environmental assessment of
different advanced oxidation processes applied to a bleaching Kraft mill effluent. Chemosphere, 62, 9-16.
[179] Muñoz I., Peral J., Ayllon J.A., Malato S., Passarinho P., Domènech X. (2006). Life cycle
assessment of a coupled solar photocatalytic-biological process for wastewater treatment. Water Res., 40,
3533-3540.

CHAPTER 2. GOAL AND SCOPE OF THE WORK

Chapter 2
Goal and Scope of the Work
The purpose of the present work is mainly centred in the decolourisation and the
mineralisation of commercial reactive azo dye solutions by combining a photo-Fenton
Advanced Oxidation Process (AOP) with an aerobic biological treatment.
To better understand the complex chemical oxidative treatment, a preliminary
research will be focused on the study of the most significant parameters that govern the
system, i.e., initial Fenton reagent dosage, type of irradiation (darkness, artificial light
and solar radiation) and temperature. With this target, Fenton and photo-Fenton
processes will be applied at laboratory scale as unique treatments to carry out the
complete degradation of reactive dyes. Reaction efficiencies will be evaluated in terms
of decolourisation, aromatic compounds removal and mineralisation. Moreover, the
acute toxicity and biodegradability evolution of dye solutions will be monitored in order
to assess the viability of a sequential chemical-aerobic biological treatment.

COMBINATION OF AOPS AND BIOLOGICAL TREATMENTS FOR COMMERCIAL REACTIVE AZO DYES REMOVAL 68
In a second part, artificial light photo-Fenton process will be applied as a pre-
treatment of a secondary aerobic biological treatment. In an exercise of optimisation, the
study will aim at more efficient use of photo-Fenton conditions (i.e., minimum Fenton
reagent dose and irradiation time) to generate a new solution capable to be biologically
treated. Decolourisation, mineralisation, biodegradability and acute toxicity evolution
will be assessed to choose the most appropriate pre-treatment conditions. The success of
the chemical stage will be finally proven by feeding the generated solutions on a bench
scale aerobic Sequencing Batch Reactor (SBR).
The environmental damage and/or benefit of such combined artificial light photo-
Fenton-biological treatment will be evaluated and compared with single artificial light
and solar driven photo-Fenton processes. The Life Cycle Assessment (LCA) tool will be
applied to carry out the environmental impact evaluation. Likewise, an economic
analysis of the different photo-Fenton processes will be performed and considered
together with the environmental study to decide about the most suitable
environmental/cost option for reactive dye removal.
The following step will be the scaling-up of laboratory experiments to pilot plant. In
this way, the viability of the system will be checked in view of future real applications.
Photo-Fenton oxidation will be conducted using a Compound Parabolic Collector
(CPC) solar photoreactor and the biological treatment by means of an Immobilised
Biomass Reactor (IBR). If applicable, the optimum conditions of the processes will be
re-established. On the other hand, a mechanistic study of the degradation of a
representative reactive dye by means of solar photo-Fenton process at pilot plant will be
developed by means of chromatographic analyses of the different phototreated samples.
Finally, as an alternative to the chemical-aerobic biotreatment strategy, the
application of an anaerobic biodegradation process as a pre-treatment of an ensuing
aerobic treatment will be performed for a complete reactive dye and by-products
degradation. In a second part, an AOP will follow the anaerobic process, opening the
possibility of an anaerobic biological-chemical sequenced treatment for aerobically non
biodegradable reactive azo dyes destruction. Ozonation and photo-Fenton AOPs will
play this role.

CHAPTER 3. MATERIALS AND METHODS

Chapter 3
Materials and Methods
3.1. PREPARATION OF SYNTHETIC DYE SOLUTIONS
The reactive azo dyes used were Procion Red H-E7B (DyStar), Cibacron Red FN-R
(CIBA) and a standard trichromatic system composed of Cibacron Red FN-R (CIBA),
Cibacron Yellow FN-2R (CIBA), and Cibacron Navy FN-B (CIBA). The last was
chosen as a model mixture of dyes that is commonly used in textile industry. All of
them are commercial reactive azo dyes employed in cellulosic fibre dyeing. Their purity
degree was unknown and they were used as received without further purification. Table
3.1 summarises some of their physical-chemical properties.
Procion Red H-E7B is a homo-bireactive azo dye with two monochlorotriazine
reactive groups. Its chemical structure is shown in Figure 3.1. On the contrary, Cibacron
Red FN-R, Cibacron Yellow FN-2R and Cibacron Navy FN-B are hetero-bireactive azo
dyes of new generation whose chemical structure is not available. From such structures,
only the reactive groups –the vinylsulphone and fluorotriazine groups– are known.

COMBINATION OF AOPS AND BIOLOGICAL TREATMENTS FOR COMMERCIAL REACTIVE AZO DYES REMOVAL 72
Table 3.1. Physical-chemical properties of studied reactive azo dyes.
Reactive dye Colour Index Formula Molecular weight
g·mol-1pHa Solubility
g·l-1 (30 ºC)
Procion
Red H-E7B
CI Reactive
Red 141 C52H34O26S8Cl2N14 1597 9.0 150b
Cibacron
Red FN-R
CI Reactive
Red 238 C29H15O13S4ClFN7Na4 944.2 7.0-7.5 100
Cibacron
Yellow FN-2R
CI Reactive
Yellow 206 - - 7.0-7.5 100
Cibacron
Navy FN-B
CI Reactive
Blue 238 - - 5.0-5.5 100
a 20 g·l-1 dye solution, except 10 g·l-1 Procion Red H-E7B b solubility data at 20 ºC
N N
OH NH
N
N
N
NHN
OHNH
N
N
N
NH
Cl Cl
SO3HHO3S
SO3H
SO3HHO3S
SO3H
SO3HSO3H
N
Figure 3.1. Chemical structure of Procion Red H-E7B.
Typical dye concentrations in real dyeing wastewaters were prepared to perform the
experiments: solutions of 100 mg·l-1 of Procion Red H-E7B, 100 mg·l-1 of Cibacron Red
FN-R, and 150.5 mg·l-1 of the standard trichromatic system (43.0 mg·l-1 of Cibacron
Red FN-R, 43.0 mg·l-1 of Cibacron Yellow FN-2R, and 64.5 mg·l-1 of Cibacron Navy
FN-B) were used for single Fenton and photo-Fenton processes in Sections 4.2.1 and
4.2.2 (it is worth to note that commercial dye weights included impurities, such as NaCl
or Na2SO4). However, due to the requirements set by the detection limit of many
analytical techniques, it was necessary to employ higher reactive dye concentrations
when combining chemical oxidation with biological processes. Thereby, when coupling
the photo-Fenton process with a subsequent aerobic biological treatment (Sections

CHAPTER 3. MATERIALS AND METHODS 73
4.2.3-4.2.5, A.1.1 and A.1.2), 250 mg·l-1 concentrations of Procion Red H-E7B and
Cibacron Red FN-R were considered. For the same reason, 250, 1250 and 3135 mg·l-1
Cibacron Red FN-R concentrations were prepared for anaerobic biodegradation
experiments (Section A.1.3). To simplify the matrix, only the effluent coming from
dyeing process was considered. Moreover, no additives (i.e., electrolytes) were added to
dye solutions.
In order to simulate real dyeing conditions, dye solutions were hydrolysed by
adjusting the pH to 10.6 followed by heating to 80 ºC for 6 hours for Procion Red H-
E7B, and by heating to 60 ºC for 1 hour for Cibacron Red FN-R and the standard
trichromatic system (hydrolysis conditions supplied by the manufacturer). As
commented in Section 1.1.2, the reactive groups of reactive dyes would have been
deactivated as a result of the hydrolysis. In this way, it was expected to found a mixture
of both hydrolysed and non hydrolysed forms at the end of the process.
Hydrolysed dye solutions were finally stored at 4 ºC until operation.
3.2. REAGENTS
Iron sulphate (FeSO4·7H2O; 99.5% Merck or 98% Panreac) and hydrogen peroxide
(H2O2; 33% w/v or 30% w/v Panreac) were used as Fenton reagent. Ozone was
produced from Oxygen C-45 (99.995%, Carburos Metalicos). Reagent grade sulphuric
acid and sodium hydroxide (Panreac) were used for pH adjustments. Solvents employed
in chromatography were HPLC grade. All the other chemicals used throughout this
study, which appear in Sections 3.3 and 3.4, were of the highest commercially available
grade.
Ultra pure deionised water from a Millipore Milli-Q system (conductivity < 0.05
μS·cm-1, Total Organic Carbon (TOC) < 0.1 mg·l-1 C) was employed to perform all the
experiments except in the case of the photo-Fenton pilot plant experiments that water
was obtained from the Plataforma Solar de Almería (PSA, Spain) distillation plant
(conductivity < 10 μS·cm-1, SO42- = 0.5 mg·l-1, Cl- = 0.7-0.8 mg·l-1, TOC < 0.5 mg·l-1
C).

COMBINATION OF AOPS AND BIOLOGICAL TREATMENTS FOR COMMERCIAL REACTIVE AZO DYES REMOVAL 74
3.3. CHEMICAL ASSAYS
3.3.1. Dissolved Organic Carbon (DOC)
The DOC is the amount of carbon in the form of CO2 emitted when a dissolved
organic substance is completely oxidised. It corresponds to the fraction of TOC that
passes through a 0.45 μm pore filter [1].
Three different TOC-analyser models have been used along the present work:
Shimadzu 5000, Shimadzu TOC-VCSH and Shimadzu 5050A. They do not differentiate
between the carbon of different compounds, but distinguish between organic and
inorganic carbon. They measure the Total Carbon (TC, mg·l-1 C), the Total Inorganic
Carbon (TIC, mg·l-1 C), and provide the TOC –DOC– parameter by means of TC and
TIC difference.
TC measurement is based on the combustion of the aqueous sample on a platinum
catalyst at 680 ºC. Thereby, all carbon is converted into CO2 and transported by a
carrier gas to a Non Dispersive Infrared Detector (NDIR). For TIC measurement, the
sample is acidified with 25% (w/v) phosphoric acid. Then, carbonate and
hydrogencarbonate are liberated as CO2 and stripped from the solution by the carrier gas
to the NDIR.
A linear relationship between the detector signal and the carbon concentration
allows TC and TIC quantification with, respectively, potassium phthalate and sodium
carbonate and hydrogencarbonate standards. Prior analysis, samples were filtered
through 0.45 μm pore size (Scheleicher & Schuell, FP 30/0.45 CA-S) and quantified by
duplicated.
3.3.2. Chemical Oxygen Demand (COD)
The COD is the indirect measurement of the oxygen needed for the complete
oxidation of all the compounds present in solution –organic or inorganic–. It is an
indirect measurement because the oxidation is carried out by a strong oxidising agent, in

CHAPTER 3. MATERIALS AND METHODS 75
this case potassium dichromate. It is usually taken as an estimation of the organic matter
content in solution, in spite of the possible interference of non organic reduced species
contained in the sample (Cl-, Fe2+, NO2-, sulphurs, etc.). For this reason, DOC is a more
accurate parameter than COD for organic matter determination in water.
The analysis was assessed with Aqualytic® (0-150 and 0-1500 mg·l-1 O2 range,
Vario) or Spectroquant® (10-150 mg·l-1 O2 range, Merck) kits by the closed reflux
colorimetric method [2]. Such commercial COD kits contain suitable amounts of
K2Cr2O7, H2SO4, Ag2SO4 and HgSO4 reagents. In acidic media, the sample was
digested (COD reactor, HACH) with an excess of oxidant at 150 ºC for a period of 2
hours, giving place to the Cr3+ ion formation (visible yellow-orange to green colour
change) (Equation 3.1). Ag2SO4 was added as catalyst for the oxidation of certain
organic compounds and HgSO4 to avoid any possible chloride interference by insoluble
mercury chloride precipitation (HgCl2).
Cr2O72- + 14 H+ + 6 e- → 2 Cr3+ + 7 H2O (3.1)
A HACH spectrophotometer detected the colour changes at 420 nm wavelength,
directly providing COD data in terms of mg·l-1 O2. Analyses were done by triplicated to
check for repeatability and a potassium phthalate standard solution was analysed in
parallel as a control sample.
3.3.3. Colour and aromatic content analysis by UV/Vis spectrophotometry
The UV/Vis-absorption spectra of reactive dye solutions were recorded in the 200-
700 nm range by using a Shimadzu UV-1603 double beam spectrophotometer and 10
mm light path quartz cells.
Colour data were reported as the absorbance at the maximum absorption in the
visible region (λmax = 543.5 nm for Procion Red H-E7B, λmax = 542.5 nm for Cibacron
Red FN-R, and λmax = 553.0-587.5 nm for the standard trichromatic system) and were
taken as an estimation of reactive dyes presence in solution. On the other hand, the

COMBINATION OF AOPS AND BIOLOGICAL TREATMENTS FOR COMMERCIAL REACTIVE AZO DYES REMOVAL 76
absorbance at 254.0 nm wavelength (UV254) was taken as the reference parameter to
monitor the aromatic compounds content in solution [3].
Prior measurements, samples were filtered (0.45 μm pore size) and diluted if
necessary.
3.3.4. Hydrogen peroxide analysis by iodometric titration
Hydrogen peroxide concentration was determined by the iodide titration method [4].
An excess of iodide (10 ml of 1 mol·l-1 KI) was added to 10 ml of the test sample in
acidic solution (10 ml of 2 mol·l-1 H2SO4) with 2 ml of ammonium molibdate (50 g·l-1)
as catalyst. The solution was left around 5 minutes at room temperature and protected
from light in a closed bottle. Then, hydrogen peroxide reacted quantitatively with the
iodide to generate the triiodide anion I3- (I2 + I-, dark yellow) (Equation 3.2), which was
reduced again with sodium thiosulphate by titration (0.05 mol·l-1 Na2S2O3·5H2O,
previously standardised by potassium dichromate) (Equation 3.3). 1 g·l-1 starch was the
indicator of the titration since it forms a dark blue-grey complex with the triiodide ion.
At the end point, the reduction of triiodide ion turned transparent the solution.
H2O2 + 3 I- + 2 H+ → I3- + 2 H2O (3.2)
I3- + 2 S2O3
2- → 3 I- + S4O62- (3.3)
According to the above reactions stoichiometry, hydrogen peroxide concentration
( , mg·l22OHC -1) was calculated as shown in Equation 3.4:
·10002·V
·MW·CVC
sample
OHOSOSOH
22-232
-232
22= (3.4)

CHAPTER 3. MATERIALS AND METHODS 77
where is the volume of thiosulphate consumed by titration (ml), is the
thiosulphate concentration (mol·l
-232OSV -2
32OSC
-1), is the volume of the test sample (ml) and
is the hydrogen peroxide molecular weight. Each measurement was done by
triplicated.
sampleV
22OHMW
3.3.5. Dissolved iron analysis (Fe (II) and total iron) by colorimetry
Dissolved ferrous ion forms an orange-red chelate complex with three molecules of
1,10-phenantroline, which can be followed by colorimetry (Equation 3.5) [5]:
Fe2+ + 3 PhH+ [Fe (Ph)3]2+ + 3 H+ (3.5)
To quantify it, 4 ml of filtered test sample (0.22 μm pore size, Millipore Millex®
GN) were mixed with 1 ml of 1,10-phenantroline solution (0.1% w/v) and 1 ml of
buffer solution (250 g·l-1 ammonium acetate and 700 ml·l-1 acetic acid). Such buffered
conditions maintained the pH assay between 3.0 and 3.5, which ensured a rapid and
quantitative development of the colour. After 1 minute, the absorbance of the solution
was determined at λ = 510 nm by a Unicam-2 UV/Vis double beam Spectrometer and
10 mm light path quartz cells. To avoid possible interferences caused by the colour of
the solutions, absorbance was measured against a blank solution prepared in the same
way, but replacing the 1,10-phenantroline solution with deionised water.
For total dissolved iron measurement (Fe (II) and Fe (III)), a spatula tip of ascorbic
acid was added to the sample. In this way, Fe (III) was reduced to its ferrous form and
measured as described above.
Quantification was performed with a FeSO4·7H2O calibration curve, according to
Lambert-Beer law (Equation 3.6):

COMBINATION OF AOPS AND BIOLOGICAL TREATMENTS FOR COMMERCIAL REACTIVE AZO DYES REMOVAL 78
Abs = ε·b·C (3.6)
where Abs is the absorbance, ε is the molar extinction coefficient (l·mol-1·mm-1), b is
the light path of the cell (mm) and C is the concentration of the compound to be
measured (mol·l-1).
3.3.6. High Performance Liquid Chromatography (HPLC)
Procion Red H-E7B and Cibacron Red FN-R reactive dyes concentrations were
analysed using reverse-phase liquid chromatography (flow rate 0.5 ml·min-1, injection
volume 20 μl) with UV/Vis detector in a HPLC (Agilent, Series 1100) with C-18
column (Phenomenex LUNA 5 μm, 3 mm x 150 mm) at 543 nm wavelength. The
column temperature was 25 °C. The mobile phases were 5 mmol·l-1 ammonium acetate
(A) and methanol (B). A 15 minutes gradient elution was used from 0% to 100% B for
Procion Red H-E7B and from 0% to 50% B for Cibacron Red FN-R.
Prior analysis, samples were filtered through 0.22 μm pore size and diluted 1:1 with
methanol.
3.3.7. Liquid Chromatography-(Electrospray Ionisation)-Time-of-Flight Mass Spectrometry (LC-(ESI)-TOF-MS)
Procion Red H-E7B reactive dye by-products generated through photo-Fenton
process were identified using LC-(ESI)-TOF-MS with positive ionisation. Separation
was made using reverse-phase liquid chromatography (flow rate 0.5 ml·min-1, injection
volume 20 μl) in a HPLC (Agilent, Series 1100) equipped with a 150 mm x 4.6 mm C-
18 analytical column and 5 μm particle size (Zorbax Eclipse XDB-C-18). The column
temperature was 25 °C. The mobile phases were 0.1% (w/v) formic acid in water (A)
and acetonitrile (B). A linear gradient progressed from 5% B to 100% B in 30 minutes,
and it was maintained at 100% B for 5 minutes. The HPLC system was connected to an
Agilent MSD Time-of-Flight Mass Spectrometer (TOF-MS) with an Electrospray

CHAPTER 3. MATERIALS AND METHODS 79
Ionisation (ESI) interface. The accurate mass spectra were recorded from 50 to 1000
m/z (mass to charge ratio). The data recorded were processed with Applied
Biosystems/MDS-SCIEX Analyst QS software (Frankfurt, Germany) with application-
specific accurate mass additions provided by the Agilent MSD TOF software. The mass
axis was calibrated by using the mixture provided by the manufacturer in the 50-3200
m/z range. A second orthogonal sprayer was used with a reference solution as a
continuous calibration using the following reference masses: 121.0509 and 922.0098
m/z (resolution 9500 ± 500 @ 922.0098 m/z).
As a pre-treatment, 20 ml of collected samples were filtered through OASIS® HLB
(hydrophilic/lipophilic balance) 6 cc (200 mg) solid-phase extraction cartridges,
previously conditioned with 2 ml of methanol and 2 ml of water. Then, retained samples
were washed with 4 + 4 ml of deionised water and eluted later with 2 + 2 ml of
methanol. Finally, extractions were diluted 1:1 with deionised water.
3.3.8. Ion Chromatography (IC)
Ions and aliphatic carboxylic acids content in aqueous solution was determined by
IC. Ammonium ion was determined with a Dionex DX-120 ion chromatograph
equipped with a Dionex Ionpac CS12A 4 mm x 250 mm column. Elution was done in
isocratic mode with 10 mmol·l-1 H2SO4 mobile phase at 1.2 ml·min-1 flow rate. On the
other hand, sulphate, chloride, nitrite, nitrate and carboxylic acids concentrations (in
their anionic form) were measured with a Dionex DX-600 ion chromatograph using a
Dionex Ionpac AS11-HC 4 mm x 250 mm column. The elution gradient programme for
anions quantification was pre-run 5 minutes with 20 mmol·l-1 NaOH, followed by an
injection with 20 mmol·l-1 NaOH for 8 minutes and with 35 mmol·l-1 NaOH for 7
minutes. The flow rate was 1.5 ml·min-1. The gradient programme for carboxylate
anions analysis consisted of a 10-minutes pre-run with 1 mmol·l-1 NaOH, 10 minutes
with 15 mmol·l-1 NaOH, 10 minutes with 30 mmol·l-1 NaOH and 10 minutes with 60
mmol·l-1 NaOH. The flow rate was also 1.5 ml·min-1.
Samples were filtered through 0.22 μm pore size. Quantitative detection was
accomplished with calibrated curves of the following standards: K2SO4, NaNO3,

COMBINATION OF AOPS AND BIOLOGICAL TREATMENTS FOR COMMERCIAL REACTIVE AZO DYES REMOVAL 80
NaNO2, NH4Cl, and the corresponding sodium salt of formic, acetic, oxalic, pyruvic,
and maleic carboxylic acids.
3.3.9. Ammonium analysis by Nessler reagent
Ammonium ion was also spectrophotometrically determined by Nessler colorimetric
assay [6]. Nessler reagent (K2HgI4) was prepared from 5 g KI, 2.2 g HgCl2 and 4 g
NaOH in 100 ml of deionised water. To perform the analysis, 5 ml of filtered test
sample (0.45 μm pore size) were mixed with 2 ml of Nessler reagent. After 10 minutes,
the yellow complex formed (Equation 3.7) was measured at λ = 425 nm by a Shimadzu
UV-1603 double beam spectrophotometer and 10 mm light path quartz cells.
NH4+ + 2 [HgI4]2- + 4OH- → HgO·Hg(NH2)I + 7I- + 3H2O (3.7)
Dissolved Fe (II) may interfere in ammonium quantification. When applicable, it
was removed by precipitation with sodium hydroxide prior the measurement. The
calibration curves were constructed by means of standard NH4Cl solutions, following
Lambert-Beer law (Equation 3.6). Every measurement was duplicated.
3.3.10. Methane analysis by Gas Chromatography (GC)
The methane composition of biogas generated during anaerobic biodegradation
assays was determined by using a HP 5890 GC equipped with a thermal conductivity
detector and a Porapak Q, 3 m x 1/8” column (Supelco). The temperature of the injector
was 130 ºC. A gradient of oven temperature was programmed as follows. It was initially
maintained at 30 ºC for 3 minutes. Then, it was increased to 70 ºC at a 10 ºC·min-1 rate
and finally maintained at 70 ºC for 5 minutes. The temperature of the detector was 180
ºC.
Quantification was carried out by means of a methane gas calibration curve.

CHAPTER 3. MATERIALS AND METHODS 81
3.3.11. Ozone flow analysis by iodometric titration
The quantity of ozone contained in the gas feeding the ozonation reactor was
determined by iodometry [7]. The gas was bubbled during a contact time of 2 minutes
through a 100 ml solution of an excess of potassium iodide (0.120 mol·l-1 KI) buffered
with 0.041 mol·l-1 Na2HPO4 and 0.026 mol·l-1 NaH2PO4·2H2O. Analogously to H2O2
determination (Section 3.3.4), triiodide ion was formed by ozone reduction (Equation
3.8). Afterwards, the solution was acidified with 5 ml of 4.5 mol·l-1 H2SO4 and titrated
by standardised sodium thiosulphate (0.05 mol·l-1 Na2S2O3·5H2O) (see Equation 3.3).
The indicator of the titration was a 1 g·l-1 starch solution.
O3 + 2 H+ + 3 I- → I3- + O2 + H2O (3.8)
Ozone flow (O3, mg·min-1) was obtained stoichiometrically as shown in Equation
3.9:
c
OOSOS3 2·t
·MW·CVO 3-2
32-2
32= (3.9)
where is the volume of thiosulphate consumed by titration (ml), is the
thiosulphate concentration (mol·l
-232OSV -2
32OSC
-1), is the ozone molecular weight and t3OMW c is the
contact time (minutes). Each measurement was done by triplicated.
3.3.12. Total and Volatile Suspended Solids (TSS, VSS)
Biomass population involved in biological processes was determined
gravimetrically by means of TSS and VSS measurements [8, 9].
A well mixed sample volume was filtered through a pre-weighed glass-microfibre
filter (ALBET, FV-C). Afterwards, the residue retained on the filter was dried at 103-
105 ºC to a constant weight. The mass increase corresponded to the TSS, which

COMBINATION OF AOPS AND BIOLOGICAL TREATMENTS FOR COMMERCIAL REACTIVE AZO DYES REMOVAL 82
included all particles suspended in water that did not pass through the filter (Equation
3.10):
( )sampleV
·1000 BATSS −= (3.10)
where A is the weight of the filter plus the dried residue and B is the weight of the filter,
both in g units. The sample volume was in ml. TSS are given in g·l-1.
The residue from the previous test was then ignited at 550 ºC to constant weight for
15 minutes in a muffle furnace. The weight lost on combustion was the VSS (Equation
3.11), and included the non dissolved organic content of the sample:
( )sampleV
·1000 CAVSS −= (3.11)
where A is the weight of the filter plus the weight of residue before ignition and C is the
weight of the residue plus the filter after ignition, both in g units. The sample volume
was in ml. VSS are given in g·l-1.
The remained solid ash, of inorganic nature, corresponded to the Fixed Total Solids
(FTS, g·l-1).
3.4. BIOLOGICAL ASSAYS
3.4.1. Zahn-Wellens biodegradability test
Indicated to determine the inherent aerobic biodegradability of organic substances in
water, the Zahn-Wellens assay simulates conditions close to those of a municipal
Wastewater Treatment Plant (WWTP) [10].

CHAPTER 3. MATERIALS AND METHODS 83
To perform the test, non acclimated activated sludge coming from a WWTP
(Manresa, Spain) was aerated for a 24-hours period, washed repeatedly and centrifuged
subsequently. Activated sludge was then suspended (TSS = 0.2-0.3 g·l-1) together with 2
l of test sample at neutral pH (the ratio between the carbon content of test sample and
the dry-weight of inoculum should range from 1 to 4). Moreover, 2.5 ml of mineral
medium (a concentrated solution composed of 38.5 g·l-1 NH4Cl, 33.4 g·l-1
NaH2PO4·2H2O, 8.5 g·l-1 KH2PO4 and 21.75 g·l-1 K2HPO4) were also added to the
media per litter of sample.
The mixture was maintained for 28 days at 22 ± 3 ºC under aeration (Dissolved
Oxygen (DO) not lower than 3 mg·l-1 O2), agitation and dark conditions. A blank assay
just containing activated sludge and mineral medium, as well as a control experiment
fed with a fully biodegradable standard (i.e., ethylene glycol), were run in parallel.
DOC was analysed at regular intervals and pH was readjusted between 7.0 and 8.0 if
necessary. To discard loses by a possible sample adsorption onto the activated sludge,
DOC was measured three hours after the beginning of the test. This one was taken as
the initial value. The DOC reduction, expressed in percentage, corresponded to the %
biodegradation evolution of the sample (Equation 3.12):
·100DOCDOCDOCDOC1tionBiodegrada %
B0,0
B
⎥⎥⎦
⎤
⎢⎢⎣
⎡
−−
−= (3.12)
where DOC is the test sample value at time of sampling, DOCB is the blank experiment
value at time of sampling, DOC0 is the initial value of the test sample, and DOC0,B is the
initial value of the blank.
B
The criteria used to consider a sample biodegradable involves the removal of 70%
of the original DOC.

COMBINATION OF AOPS AND BIOLOGICAL TREATMENTS FOR COMMERCIAL REACTIVE AZO DYES REMOVAL 84
3.4.2. Biochemical Oxygen Demand for 5 days (BOD5)
Indicator of the auto-purifying capacity of a wastewater, the Biochemical Oxygen
Demand (BOD, mg·l-1 O2) is a measurement of the amount of organic matter potentially
biodegradable under aerobic conditions. It is one of the most widely employed
parameters for the characterisation of organic pollutants in water. Concretely, the BOD5
is based on the quantification of the oxygen consumed by a sample incubated with non
acclimated aerobic microorganisms at 20 ºC for a period of 5 days. It supposes, at
maximum, around 80% of the COD. Hence, to complete the biological oxidation at 20
ºC, a period of time between 21 and 28 days would be required.
The BOD5 measurement was performed by means of a mercury-free WTW 2000
OxyTop® thermostated at 20 ± 1 ºC, which allows the BOD determination among the 0-
4000 mg·l-1 O2 range without sample dilution. The assay principle is as follows: in a
closed bottle, during the oxidative degradation of organic matter, aerobic
microorganisms consume dissolved oxygen gas in water. By stirring, such consumed
oxygen is supplied from the bottle headspace to solution. Since the experiment is
conducted at constant volume, the depletion of oxygen gas at headspace leads to a
difference of pressure. Therefore, a manometer collects the data and express them
directly in mg·l-1 O2 units. To avoid interferences over the pressure lectures, carbon
dioxide produced is removed with a NaOH trap (Equation 3.13).
2 NaOH + CO2 → Na2CO3 + H2O (3.13)
The test sample volume differs depending on the expected BOD value. Table 3.2
shows the relation between BOD and volume. In each case, the BOD lecture should be
multiplied by a different factor.
As a pre-treatment, samples were adjusted to pH = 6.5-7.5 and saturated of oxygen
by aeration for 2 hours. Sample containing bottles were then inoculated by adding 2 ml
of the supernatant solution of a WWTP activated sludge, previously aerated for 24
hours. The required mineral medium was also supplied by adding 250 μl of buffer
solution (8.5 g·l-1 Na2HPO4·2H2O, 2.8 g·l-1 KH2PO4) and 50 μl of Mg2+, Ca2+, Fe3+ and

CHAPTER 3. MATERIALS AND METHODS 85
NH4+ concentrated solutions (22.5 g·l-1 MgSO4·7 H2O; 27.5 g·l-1 CaCl2; 0.25 g·l-1
FeCl3·6H2O and 2 g·l-1 NH4Cl) per 100 ml of test sample [11]. Finally, any possible
oxygen consumption due to nitrification was inhibited by adding 10 mg N-allylthiourea
per litter of test sample.
Table 3.2. Ranges and the correlated total volume of sample.
Sample volume ml
Measuring range mg·l-1 O2
Factor
432 0-40 1
365 0-80 2
250 0-200 5
164 0-400 10
97 0-800 20
43.5 0-2000 50
22.7 0-4000 100
The correct performance of each determination was verified with an organic
standard of know BOD5, composed of glucose and glutamic acid. Moreover, a blank
experiment just containing the inoculum and mineral medium was run in parallel. The
BOD5 of the test sample was corrected by subtracting the blank lecture. To check
repeatability, every assay was performed by triplicated.
3.4.3. Acute toxicity
The acute toxicity analysis determines what concentration of sample leads to the
inhibition of the development or to the mortality of a group of organisms exposed to the
toxicant for a short period of time, under controlled conditions [12].
At the present work, acute toxicity was assessed according to the Biotox® bacterial
bioluminescence assay procedure [13], by determination of the inhibitory effect that the
test sample has on the marine photobacteria Vibrio fischeri. It was quantified as the
median effective concentration (EC50 parameter), which is the concentration of sample

COMBINATION OF AOPS AND BIOLOGICAL TREATMENTS FOR COMMERCIAL REACTIVE AZO DYES REMOVAL 86
that causes 50% decrease of light emission in relation to a 2% (w/v) sodium chloride
control sample solution.
To perform every toxicity measurement, a graph is plotted by means of successive
dilutions of the original test sample (containing a constant bacteria population). It
displays the relationship between each concentration and their corresponding inhibition
percentage after 30 minutes of exposure at 15 ºC (calculated according to Equations
3.14 and 3.15):
·100KF·IT
IT100%INH0
30−= (3.14)
0
30
ICICKF = (3.15)
where %INH is the percentage of inhibition caused by the test sample, IT30 is the
luminescent intensity of the test sample after 30 minutes of exposure, IT0 is the initial
luminescent intensity of the test sample, KF is a correction factor, IC30 is the
luminescent intensity of the control sample after 30 minutes of exposure and IC0 is the
initial luminescent intensity of the control sample.
The EC50 parameter was determined in DOC units (mg·l-1 C) by %INH = 50
interpolation, and using a standard lineal regression analysis (whether the range of pair
values could not be linearised, EC50 could be determined using a double logarithmic
system). When the DOC of the sample was lower than the EC50, it was assumed to be
non toxic and toxicity values were given as EC50 > 100%.
It is remarkable that toxicity determinations may be distorted due to the partial
absorption of emitted bioluminescence by coloured samples. In the present case, for
every obtained intensity value, a correction factor corresponding to the intensity lost due
to absorption (not to inhibition) previously calculated for every test sample
concentration was applied.
As a pre-treatment, according to Biotox® test procedure, the pH of the sample
(filtered through 0.45 μm membrane) was adjusted to 7.0 ± 0.2 and solid NaCl was

CHAPTER 3. MATERIALS AND METHODS 87
added to adjust salinity to 2% (w/v). Phenol and glucose solutions were used as standard
toxic and non toxic samples to check the technique suitability. Every plot for EC50
determination was replicated twice.
3.4.4. Short-term respirometry
Short-term respirometric measurement provides information about the ready
biodegradability of a sample in contact with non acclimated aerobic biomass. It is based
on the measurement of the biological oxygen consumption rate –namely Oxygen
Uptake Rate (OUR, g·l-1·min-1 O2)– under controlled conditions [14].
The experimental set-up was composed of a closed and thermostatic liquid-static-
static (LSS) respirometer (T = 25 ± 1 ºC) of 250 ml of capacity, connected to a DO-
meter (Model 407510, EXTECH), an air diffuser and a mechanical stirrer (Figure 3.2).
In this type of reactor, the oxygen measurement was performed in the liquid phase by
keeping under static conditions both liquid and gas phases. Non acclimated activated
sludge coming from a municipal WWTP (Manresa, Spain) was used as inoculum. It was
aerated for a 24-hours period and subsequently diluted to 3-4 g·l-1 VSS concentration
with deionised water. 10 mg N-allylthiourea per litter of sample was added for
nitrification inhibition. The detailed operational strategy was as follows:
(i) A 250 ml initial solution just containing the aerobic biomass in water was aerated
until a DO value around 6 mg·l-1 O2. Afterwards, the air supply was removed and the
oxygen depletion (until a final DO value not lower than 2 mg·l-1 O2) was continuously
monitored by means of the oxygen-meter. From DO evolution with time, the specific
Oxygen Uptake Rate (sOUR, g O2·g-1 VSS·min-1) corresponding to the endogenous
respiration of biomass was calculated (i.e., the oxygen consumption resulting from the
respiration activity of an inoculum without any addition of a biodegradable carbon
source (see Section 1.3.2)).
(ii) Biomass was settled for 1 hour. Then, 125 ml of solution were replaced by the
same volume of a completely biodegradable standard solution of acetic acid, previously
adjusted to neutral pH. Such standard solution was prepared to provide the same COD

COMBINATION OF AOPS AND BIOLOGICAL TREATMENTS FOR COMMERCIAL REACTIVE AZO DYES REMOVAL 88
than the sample to be tested. Analogously to step (i), and after the aeration of the
solution, the oxygen consumption with time was monitored and finally quantified as
sOUR parameter. The obtained value was corrected by subtracting the endogenous
sOUR contribution. Finally, aeration and oxygen depletion processes were repeated as
many times as necessary to obtain the same initial endogenous sOUR profile, providing
evidence of fully acetic acid biodegradation.
(iii) The sOUR of the test sample was determined analogously to step (ii) procedure.
(iv) Biomass was fed again with a second acetic acid standard addition to check a
possible respiration inhibition caused by the sample. In absence of biomass inhibition,
the sOUR of both standard solutions should coincide.
Figure 3.2. Respirometrer set-up. 1-air diffuser; 2-DO probe; 3-magnetic bar; 4- DO-meter.

CHAPTER 3. MATERIALS AND METHODS 89
When assessing the respirometric response of aerobic biomass against a complex
sample (composed of several organic compounds with different biodegradation
easiness), different sOUR profiles may be observed. Therefore, to better quantify the
overall behaviour of the test sample, a global parameter named accumulated Oxygen
Demand (OD, g O2·g-1 VSS) was determined at the present work. It was calculated as
the sum of the different sOUR observed multiplied by their corresponding duration
times. The overall contact time with biomass was set to 30 or 120 minutes, depending
on the biomass response.
Finally, the ready biodegradability of the test sample was given as the quotient
between its accumulated OD and the acetic acid standard value (ODst).
3.4.5. Anaerobic digestion assay
The anaerobic digestion assay provides information about the potential of a
substrate to be biodegraded in a free-oxygen atmosphere. As a result of the reductive
process, the complete substrate biodegradation would lead to the generation of biogas
that may be followed manometrically at constant volume.
At the present work, anaerobic biodegradation was conducted in batch mode and
under static conditions in closed thermostated aluminium bottles of 600 ml of capacity.
The test sample volume was 500 ml and the headspace was 100 ml. The anaerobic seed
sludge was a methanogenic culture obtained from a mesophilic municipal anaerobic
digester (WWTP in Manresa, Spain) containing an initial TSS and VSS content of 30
and 12 g·l-1, respectively. All bottles were seeded with the same volume of original
sludge to finally obtain an initial 1.5 g·l-1 VSS and 3.8 g·l-1 TSS concentration.
0.2 g of yeast extract and 2 ml of the following essential nutrients and trace
elements solutions were added per litter of sample [15]: 100 mg·l-1 Na2S·9H2O solution;
a macronutrients solution composed of 170 g·l-1 NH4Cl, 37 g·l-1 KH2PO4, 8 g·l-1
CaCl2·2H2O and 9 g·l-1 MgSO4·4H2O; a micronutrients solution composed of 2000 mg·l-1
FeCl3·4H2O, 2000 mg·l-1 CoCl2·6H2O, 500 mg·l-1 MnCl2·4H2O, 30 mg·l-1 CuCl2·2H2O,
50 mg·l-1 ZnCl2, 50 mg·l-1 H3BO3, 90 mg·l-1 (NH4)6Mo7O24·4H2O, 100 mg·l-1

COMBINATION OF AOPS AND BIOLOGICAL TREATMENTS FOR COMMERCIAL REACTIVE AZO DYES REMOVAL 90
Na2SeO3·5H2O, 50 mg·l-1 NiCl2·6H2O, 1000 mg·l-1 EDTA, 1ml·l-1 HCl 36% and 500
mg·l-1 resazurin. Additionally, 1g of NaHCO3 per g of COD was added to the solution
in order to maintain the pH and reduce the negative effects to methanogenesis due to the
possible acidification caused by Volatile Fatty Acids (VFA) generation through the
process. The pH was adjusted to 7.0 ± 0.2.
Before incubation, nitrogen gas was bubbled into the bottles to ensure anoxic
conditions during biodegradation process. Temperature was maintained under
mesophilic conditions at 37 ± 1 ºC. A VFA standard solution composed of acetic,
propionic and butyric acids (73:21:4 weight proportion, total COD = 4500 mg·l-1 O2
[15]), as well as a control experiment just containing anaerobic biomass, nutrients and
trace elements were run in parallel. Each batch experiment was extended to 50 days.
The methanogenic activity of the anaerobic sludge was ensured by the assessment of
the Specific Methanogenic Activity (SMA, gCODCH4·g-1VSS·day-1) of the VFA
standard solution [15]. On the other hand, the parameters employed to evaluate the
biodegradation of the test samples were the accumulated biogas production within the
50 days of assay (1 atm, 37 ºC), the maximum methane generation slope per unit of
weight of biomass (gCODCH4·g-1VSS·day-1) (determined in the same way than SMA,
see below), the degree of decolourisation (calculated as the absorbance at maximum
wavelength in the visible region), the DOC reduction and the acute toxicity of the
resultant solution (EC50) after the 50 days of digestion.
Biogas production was measured at regular intervals from bottles headspace by
means of a digital manometer (SMC Pressure Switch 10 bars) connected to the bottles
by a valve. Biogas was sampled through an outlet located at the valve that could be
opened or closed with a regulator key. The % methane composition was determined by
GC (Section 3.3.10). Finally, the SMA was calculated as shown in Equation 3.16:
sample
14
CF·VSS·V·dayCH mlSMA
−
= (3.16)

CHAPTER 3. MATERIALS AND METHODS 91
where ml CH4·day-1 is the methane production rate calculated from the maximum
biogas generation slope (the obtained value was corrected by subtracting the ml
CH4·day-1 blank contribution), VSS are the initial 1.5 g·l-1 VSS concentration, sample
volume are the 0.5 l of liquid volume and CF is a correction factor that allows the
conversion between the methane volume and the COD. At 37 ºC and 1 atm conditions,
the CF factor is 398 ml CH4·g-1 COD [15].
When testing the EC50 parameter, solutions were previously gassed with nitrogen to
strip out any possible remaining H2S gas generated through digestion. Every assay was
performed at least twice.
3.5. ANAEROBIC SLUDGE ADSORPTION EXPERIMENT
Reactive dye adsorption onto anaerobic sludge experiments were conducted in 100
ml closed thermostated flasks at 37 ± 1 ºC. As in anaerobic digestion assay (Section
3.4.5), anaerobic sludge from the mesophilic municipal anaerobic digester (WWTP in
Manresa, Spain) was used. Each flask contained 30 ml of reactive dye solution with 85,
250, 425, 850, 1275, 1700, 2550 and 3000 mg·l-1 concentrations, as well as anaerobic
sludge at 1.5 g·l-1 VSS and 3.8 g·l-1 TSS constant values. Neither nutrients nor trace
elements were added into the media. All samples were adjusted to pH = 7.0 ± 0.2. To
ensure equilibrium conditions, the contact time was set at 24 hours. A control flask with
anaerobic biomass suspended in deionised water was conducted in parallel. Hand
shaking was occasionally conducted. Every concentration was performed by duplicated.
DOC and colour data (the maximum absorbance in the visible region at pH = 7.0)
were used as dye adsorption indicators. The initial values were taken just after the
preparation of the mixture and the final values 24 hours later. To perform each analysis,
a well mixed volume was sampled, and the supernatant centrifuged subsequently. Both
initial and final values were compared with those obtained from the control sample in
order to evaluate the adsorption phenomenon.

COMBINATION OF AOPS AND BIOLOGICAL TREATMENTS FOR COMMERCIAL REACTIVE AZO DYES REMOVAL 92
3.6. REACTORS AND EXPERIMENTAL PROCEDURES
3.6.1. Fenton and photo-Fenton reactors
3.6.1.1. Cylindrical batch reactors
Fenton type processes performed at laboratory scale were conducted in batch mode
in two different thermostatic cylindrical Pyrex cells. Initial experiments described in
Sections 4.2.1 and 4.2.2 were carried out in a 130 ml cell with 28.27 cm2 of surface. The
solution volume was 100 ml. On the contrary, the rest of the bench scale experiments
were conducted in a 300 ml cell with 78.54 cm2 of surface. In this case, the solution
volume was 250 ml (Sections 4.2.3 to 4.2.5) or 200 ml (Section A.1.3).
The reaction mixture inside the cells, consisting of the sample solution and the
required amount of Fenton reagent, was continuously stirred with a magnetic bar.
Moreover, reactors were surrounded by a water jacket that allowed the control of the
reactor temperature within ± 1 ºC. A diagram of these reactors is shown in Figure 3.3.
Figure 3.3. Cylindrical batch reactor. 1-front view; 2-side view; 3-upper view.

CHAPTER 3. MATERIALS AND METHODS 93
Fenton processes were carried out in darkness. In contrast, photo-Fenton processes
were performed under either artificial or solar irradiation (see irradiation sources details
in Section 3.7). A 6 W Philips black light fluorescent lamp, placed over the cells, was
used in artificial light photo-Fenton experiments. The distance between the lamp and the
solution was 17.0 cm for the 130 ml and 7.5 cm for the 300 ml cell. The intensity of the
incident light, measured by a UV light meter (Lutron UVA-365, band pass: 320-390
nm), was 0.13 and 0.60 mW·cm-2, respectively. On the other hand, solar driven photo-
Fenton experiments were performed outdoors during sunny days of July at the
Universitat Autònoma de Barcelona (UAB) (latitude 41º 30’ N, longitude 2º 6’ E).
Since solar experiments were not termically controlled, temperature reached around 40
ºC at the end of the process.
To perform the experiments, the solutions were adjusted to pH = 2.8-3.0. Next, the
necessary amount of iron salt was added. After its complete homogenisation, a unique
pulse of the required hydrogen peroxide was added to begin the process. In artificial
light photo-Fenton reaction, hydrogen peroxide addition was accomplished with the
black light stabilised and experiments were carried out under continuous irradiation.
Neither pH adjustments nor Fenton reagent additions were done after the beginning of
the processes.
Samples were collected at regular time intervals and analysed as soon as possible.
Analyses performed included DOC, COD, colour, UV254, H2O2 concentration, NH4+
concentration, sOUR, BOD5 and EC50. Previous to sOUR, BOD5 and EC50 biological
assays, and due to the bactericide character of hydrogen peroxide, its removal from
aqueous solution was necessary. Thereby, hydrogen peroxide was removed with
Catalase enzyme (2350 U per mg: 1 U destroys 1 μmol·min-1 of H2O2 at pH = 7.0 and T
= 25 ºC, Sigma) or with an excess of sodium sulphite (any remaining SO32- was
removed by bubbling O2) [16]. On the other hand, for COD measurement, since Cr2O72-
could oxidise any reduced specie present in solution, H2O2 concentration (quantified by
iodometric titration, Section 3.3.4) was corrected from COD values by difference [17].
However, iron interference was discarded since Fe (II) concentration was very low
throughout the process. Even considering all the iron in its reduced form, the COD
contribution of a 20 mg·l-1 Fe (II) initial dosage (the higher one employed) would not be
higher than 3 mg·l-1 O2.

COMBINATION OF AOPS AND BIOLOGICAL TREATMENTS FOR COMMERCIAL REACTIVE AZO DYES REMOVAL 94
When applying photo-Fenton process as a pre-treatment of an ensuing biological
treatment, any residual hydrogen peroxide was also quenched with an excess of sodium
sulphite.
3.6.1.2. Compound Parabolic Collector (CPC)
All photo-Fenton experiments carried at pilot plant scale were performed under
sunlight at the PSA (latitude 37º 05’ N, longitude 2º 21’ W). The pilot plant (Figure 3.4)
operated in batch mode and was composed by three CPCs modules in series, one tank
and one recirculation pump. The collectors (1.03 m2 each, 3.09 m2 of total irradiated
surface) faced south on a fixed platform tilted 37º (local latitude) in relation to the
horizontal plane and consisted of eight parallel horizontal borosilicate glass-transparent
tubes (inner diameter 29.2 mm, outer diameter 32.0 mm, length 1.37 m).
CPC
Tank
Pump
CPC
Tank
Pump
20 l·min-1
CPCs (Vi = 22 l) 3 x 1.03 m2
Tank
Pump
Figure 3.4. Diagram of the solar photo-Fenton pilot plant.
Under tubular conditions, water flowed steadily through the tubes at 20 l·min-1 from
one CPC module to another and finally into the tank, from where the pump recirculated

CHAPTER 3. MATERIALS AND METHODS 95
it back to the CPCs. The total volume (VT) was 35 l and it was separated in two parts:
22 l of total irradiated volume (Vi) and 13 l of dead reactor volume (tank + connecting
tubes) that was not illuminated. More details about CPC photoreactor properties were
described by Blanco et al. [18].
The reflective surface of the CPCs was formed by two connected parabolic
aluminium mirrors, which redirected the radiation toward each tube attaining a low
concentration factor (concentration factor = 1) (Figure 3.5). The radiation acceptance
angle was 90º. In this way, all direct and diffuse incident radiation (global radiation, see
Section 3.7.2) was collected. Reflected radiation was distributed around the perimeter of
the tubular photoreactor, providing excellent performance in photochemical and
photocatalytic applications [19].
Incident radiation
Glass tube Reflecting surface
Figure 3.5. Solar ray reflection in a CPC-type solar collector.
Experiments were carried out as follows: with collectors covered, once solutions
were adjusted to pH = 2.8-3.0, the necessary amount of iron salt was added to the tank.
After its complete homogenisation, a unique pulse of required hydrogen peroxide was
added to solution. After 5 minutes of Fenton reaction (dark process), the light protection
was removed and samples were collected at regular time intervals. Neither pH

COMBINATION OF AOPS AND BIOLOGICAL TREATMENTS FOR COMMERCIAL REACTIVE AZO DYES REMOVAL 96
adjustments nor Fenton reagent additions were done after the beginning of the
processes.
During experiments, solar ultraviolet radiation (300-400 nm) reaching the solar pilot
plant was measured by a global UV radiometer (Kipp & Zonen, model CUV3), tilted
37º (the same angle as for the photoreactor), which provided data in terms of incident
W·m-2.
Sample analyses included reactive dye concentration by HPLC, DOC, COD, BOD5,
H2O2 and iron concentrations (total and Fe (II) forms), as well as NH4+, NO3
-, SO42-, Cl-
and carboxylic acid concentrations. Analogously to the laboratory scale experiments
procedure, it was necessary the removal of the remaining H2O2 prior the BOD5 analysis
and the H2O2 correction from COD measurement.
When applying photo-Fenton process as a pre-treatment of a secondary biological
treatment, phototreated solutions were fed after complete H2O2 consumption.
The intensity of solar irradiance was never constant and could not be controlled due
to multiple environmental influences (i.e., time of day or atmospheric conditions).
Therefore, to better compare and evaluate the different parameters involved in different
degradation processes, it was necessary to make use of a methodology that provided
data in terms of incident radiation conditions throughout each experiment. In this way,
using the solar ultraviolet radiation measurement at each experimental time,
experiments could be compared using a corrected illumination time t30W (Equation 3.17)
[20]:
(3.17) 1nnnT
in1n30W,n30W, ttΔt;
VV
30UVΔttt −− −=⋅+=
where tn is the experimental time for each sample, UV is the average solar ultraviolet
radiation measured during Δtn and t30W is the “normalised illumination time”. In this
case, time refers to a constant solar UV power of 30 W·m-2 (typical solar UV power on
a perfect sunny day around noon) [21]. In that way, degradation could be evaluated as a
function of time taking into account environmental conditions. It should be noted that
CHAPTER 3. MATERIALS AND METHODS 97
the t30W normalised value only takes sense once illumination has begun (t30W = 0).
Consequently, negative time values were used to represent the dark Fenton process.
In those experiments, carried out in June and July months, UV intensity ranged
between 14 and 37 W·m-2. Moreover, since the system was outdoors and non isolated,
temperature in the reactor was in the range of 25-48 ºC.
3.6.2. Ozonation set-up
The ozonation experimental set-up consisted of a 300 ml thermostatic cylindrical
Pyrex batch reactor with a working volume of 200 ml, provided with magnetic stirring
and an external water jacket (Figure 3.6). By adjusting the water input through the water
inlet and outlet, temperature was fixed at 23 ± 1 ºC. Ozone was obtained from an Erwin
Sander 301.7 generator fed with a pure oxygen stream flowing at 1 bar. An ozone flow
rate of 1.75 g·h-1 O3 was employed to ensure saturation of the system, as determined by
iodometric titration (Section 3.3.11). It was bubbled through the test sample solution by
means of a metallic diffuser. Non reacted ozone was measured by means of an Erwin
Sander Quantozone-1 ozone-meter, giving the measurement directly in mg·m-3, and
finally destroyed with a KI trap.
Ozonation was done at different initial pH conditions: 3.0, 7.0, 10.0 and 10.5. No
further pH adjustments were done after the beginning of the process. Samples were
periodically taken through an outlet that could be opened or closed with a regulator key
(Figure 3.6). DOC and acute toxicity (EC50) data were collected. When testing the EC50
parameter, solutions were previously gassed with nitrogen to strip out the remaining
dissolved O3 gas.

COMBINATION OF AOPS AND BIOLOGICAL TREATMENTS FOR COMMERCIAL REACTIVE AZO DYES REMOVAL 98
Figure 3.6. Ozonation set-up. 1-oxygen cylinder; 2-ozonator; 3-diffuser; 4-sample tube; 5-
magnetic bar; 6-regulator key; 7- syringe; 8-ozone exit; 9-ozone-meter.
3.6.3. Biological reactors
3.6.3.1. Sequencing Batch Reactor (SBR)
Aerobic biological treatment performed at laboratory scale was carried out in a SBR
of 2 l –operational liquid volume (VSBR) of 1.5 l–, equipped with an air diffuser and
mechanical agitation. The temperature was maintained under room conditions, between
20 and 23 ºC, and DO concentration was not lower than 3 mg·l-1 O2. Fresh biomass was
used for each experiment. Suspensions of 0.6-1.0 g·l-1 VSS were prepared by diluting
activated sludge collected from a municipal WWTP (Manresa, Spain).

CHAPTER 3. MATERIALS AND METHODS 99
The system operated in batch mode. Once a Hydraulic Retention Time (HRT; i.e.,
the average time that the effluent remains in the bioreactor, expressed in days) was
fixed, according to Equation 3.18, the corresponding volume of sample was daily
replaced (Vreplaced, ml·day-1) by the same volume of fresh influent solution:
HRTVV SBR
replaced = (3.18)
As described in Section 1.3.4.1, this process was divided under five defined stages:
filling, reaction, settling, draw and idle. The whole sequence is illustrated in Figure 3.7.
During the filling stage, the SBR tank was filled with the influent sample to be treated.
Afterwards, aeration and agitation were switched on to begin the reaction period. Once
over, both mixing and airflow were stopped to let the biomass to settle down. After 1
hour, the corresponding volume of sample (Equation 3.18) was withdrawn from the
supernatant during the draw step, without disturbing the settled sludge. The SBR tank
waited idle until a new fresh sample batch was added (equal to the volume decanted),
and aeration-agitation was turned on again.
The whole HRT was completed when the total VSBR had been replaced.
Figure 3.7. SBR operation steps.

COMBINATION OF AOPS AND BIOLOGICAL TREATMENTS FOR COMMERCIAL REACTIVE AZO DYES REMOVAL 100
All biodegradation experiments were carried out in two stages: preliminary run
(blank run) and operation. The first one consisted of a 10-day HRT cycle where the
SBR tank was fed with a fully biodegradable municipal wastewater obtained from a
WWTP (Manresa, Spain). This wastewater was characterised by an average DOC of 50
mg·l-1 C and a COD of 210 mg·l-1 O2. During this first run, aerobic biomass activity was
checked, cells got adapted to experimental laboratory conditions (i.e., temperature,
oxygen flow and manipulation) and the lower residual DOC that could be achieved by
the SBR system (corresponding to metabolites released by biomass) was established.
Once the blank run was completed, the SBR was fed with the test sample solution to
begin the operation stage at the required HRT (i.e., 10, 4, 2 or 1 days). The pH of this
had been previously adjusted to 6.5-7.5, and suitable amounts of the following solutions
were added together to the tank: 2 ml of 101 g·l-1 MgSO4·H2O, 27.7 g·l-1 CaCl2, 38.2 g·l-1
NH4Cl (at pH = 7.0) and 6 ml of 207 g·l-1 NaH2PO4·H2O per litter of influent sample
[22]. Once over, the HRT cycle was repeated as many times as necessary to allow cells
acclimation and/or to obtain repetitive results.
Influent and effluent samples DOC content, as well as the VSS were daily analysed.
pH readjustment between 6.5 and 7.5 was done if necessary. A full biodegradation of
the sample was assumed when attaining final DOC values close to those obtained in the
previous run.
Finally, it is worth to note that, apart from the HRT, the Sludge Retention Time
parameter (SRT; i.e., the average time that the sludge remains in the bioreactor) is
usually controlled by sludge purging. However, due to the small scale of the SBR and
the low DOC concentration used in this work, little sludge production was eliminated
when withdrawing the supernatant. Consequently, sludge waste and SRT control were
not found to be necessary throughout experimentation.
3.6.3.2. Immobilised Biomass Reactor (IBR)
The biological pilot plant (in the PSA) operated in batch mode and was composed
by two independent modules: an IBR and a conditioner tank of 50 l (Figure 3.8). The
IBR unit, which consisted of a 35 l column containing plastic fixed supports

CHAPTER 3. MATERIALS AND METHODS 101
(polypropylene, 15 mm of nominal diameter, Pall®-Ring), was seeded by aerobic
activated sludge coming from a municipal WWTP (Almería, Spain). After inoculation,
activated sludge was progressively fixed on polypropylene supports until TSS values in
solution were near zero.
The sample volume to be treated was 45 l. It was continuously recirculated between
the conditioner tank and the IBR unit at 0.5 l·min-1 ascendant flow rate. This flow rate
maintained a suitable contact between the immobilised biomass and the test sample
solution. A blower provided oxygen saturation conditions. Since the system was
outdoors, temperature was in the range of 16-40 ºC.
The biological treatment strategy was as follows: once IBR colonisation was carried
out, in order to guarantee bacteria viability and to permit a better growing and fixing on
the polypropylene supports, a 45-l batch of an easily biodegradable substrate was
initially added to the tank. Glucose was chosen for this role. Besides, this first batch let
to establish the lower residual DOC that could be achieved by the IBR system (biomass
metabolites). After its complete biodegradation, the conditioner tank was completely
emptied and sequentially filled with 45-l batches of the different solutions to be treated.
The pH of these had been previously neutralised to 6.5-7.5. Additionally, suitable
proportions of the following solutions were supplied to the conditioner tank in order to
maintain the required C:N:P (100:20:5) and C:Fe:S (100:2:2) ratios: 43.8 g·l-1 KH2PO4,
27.5 g·l-1 CaCl2, 22.5 g·l-1 MgSO4.7H2O, 50 g·l-1 FeSO4.7H2O, 48 g·l-1 NaHCO3 and
38.5 g·l-1 NH4Cl. The KH2PO4, FeSO4.7H2O and NH4Cl volumes to be added depended
on the DOC present in solution. Nevertheless, the addition of CaCl2 and MgSO4.7H2O
was always fixed in 1 ml per litter of test sample and the addition of NaHCO3 in 2 ml
per litter of test sample.
The degree of mineralisation was followed by DOC measurement at regular time
intervals (one or two times per day) until constant DOC values achievement. A Full
biodegradation of the sample was assumed when attaining a final DOC close to the
obtained in the previous glucose batch. Other periodical determinations carried out were
the carboxylic acids concentration and NH4+, NO2
- and NO3- ions concentration to detect
parallel nitrification and denitrification processes. Moreover, TSS were determined in

COMBINATION OF AOPS AND BIOLOGICAL TREATMENTS FOR COMMERCIAL REACTIVE AZO DYES REMOVAL 102
order to ensure a correct sludge fixation on the plastic supports (TSS ~ 0 g·l-1). pH
readjustment between 6.5 and 7.5 was done if necessary.
Figure 3.8. Scheme of the biological pilot plant.
3.7. PHOTO-FENTON IRRADIATION SOURCES
3.7.1. Black light
As commented above, artificial light photo-Fenton experiments performed at
laboratory scale were conducted by a Philips fluorescent black light of 6 W. The
emission spectrum provided by the Philips supplier is shown in Figure 3.9 (arbitrary
units). As seen, irradiation is concentrated in the near-UV and visible zone of the
spectrum (300-400 nm) with a maximum intensity corresponding to 348 nm
wavelength.
According to the emission spectrum, this source of light is especially suited for
artificial light photo-Fenton experiments since it narrowly adjusts to the absorption
requirements of the process (mainly from the UV up to 410 nm wavelength). Moreover,
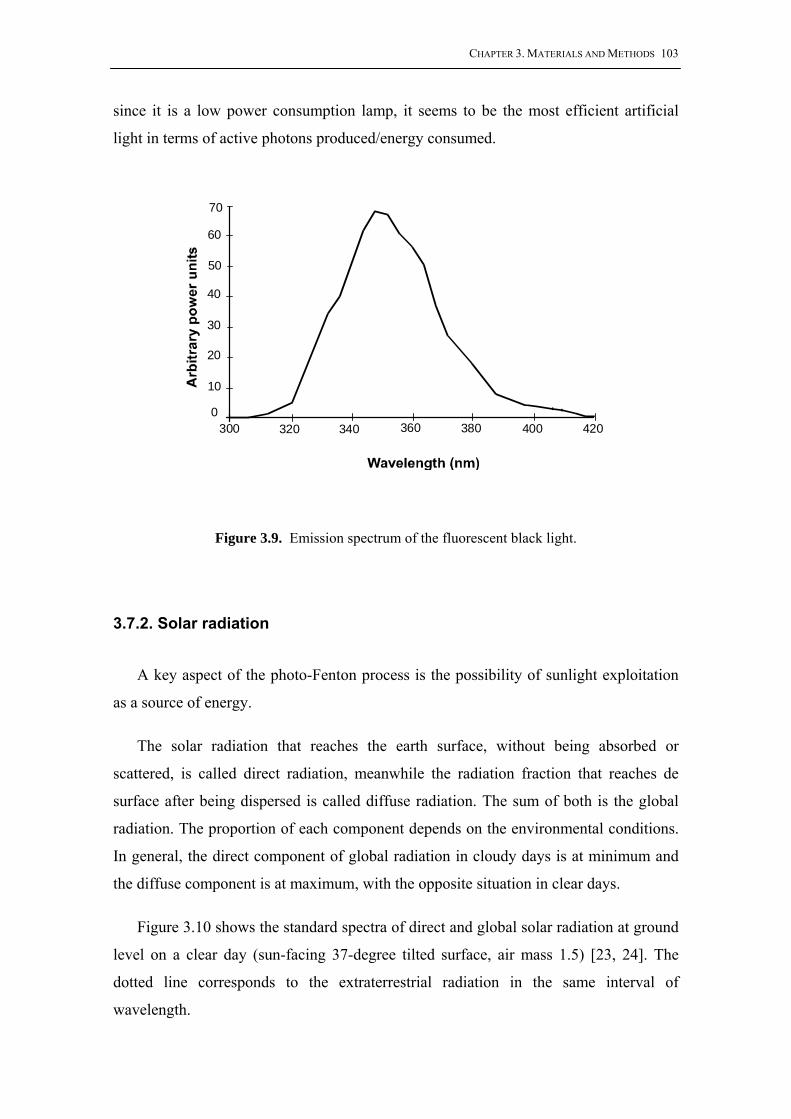
CHAPTER 3. MATERIALS AND METHODS 103
since it is a low power consumption lamp, it seems to be the most efficient artificial
light in terms of active photons produced/energy consumed.
70
60
50
40
30
20
10
0300 320 340 360 380 400 420
Figure 3.9. Emission spectrum of the fluorescent black light.
3.7.2. Solar radiation
A key aspect of the photo-Fenton process is the possibility of sunlight exploitation
as a source of energy.
The solar radiation that reaches the earth surface, without being absorbed or
scattered, is called direct radiation, meanwhile the radiation fraction that reaches de
surface after being dispersed is called diffuse radiation. The sum of both is the global
radiation. The proportion of each component depends on the environmental conditions.
In general, the direct component of global radiation in cloudy days is at minimum and
the diffuse component is at maximum, with the opposite situation in clear days.
Figure 3.10 shows the standard spectra of direct and global solar radiation at ground
level on a clear day (sun-facing 37-degree tilted surface, air mass 1.5) [23, 24]. The
dotted line corresponds to the extraterrestrial radiation in the same interval of
wavelength.

COMBINATION OF AOPS AND BIOLOGICAL TREATMENTS FOR COMMERCIAL REACTIVE AZO DYES REMOVAL 104
0.6 1.2 1.8 2.4 3.0 3.6 4.20
500
1000
1500
2000
0
500
1000
1500
2000ExtraterrestrialDirectGlobal
Irrad
ianc
epe
rwav
elen
gth,
W·m
-2·μ
m-1
Wavelength (μm)
Figure 3.10. Solar radiation spectrum from 0.2 μm to 4.5 μm.
The UV radiation is a very small part of the whole solar spectrum reaching the earth
surface. Measurements carried out have demonstrated that it just represents between 3.5
and 8% of the total [25], although this relation can change for a determined location
between cloudy and clear days. Figure 3.11 shows the spectra of the global and direct
radiation of the UV range of the above standard solar spectrum reaching the surface
[26]. Between 300 and 400 nm, the direct UV radiation reaches 22 W·m-2 meanwhile
the global UV radiation reaches 46 W·m-2. These two values give an idea of the cheap
and abundant energy coming from the sun that is available to assist photo-Fenton
reaction. Obviously, UV radiation values vary depending on location, date, time of day,
season and atmospheric conditions, making necessary to know these data for every
particular location in real time.
Apart from the UV radiation, and as it has been discussed in Section 1.4.1.1,
photoassisted process makes also use of part of the visible solar spectrum (up to λ ~ 550
nm). Hence, it is clearly seen that solar radiation spectrum fulfil the photo-Fenton
wavelength requirements.

CHAPTER 3. MATERIALS AND METHODS 105
UVDIRECTUVDIRECT
UVGLOBAL
UVGLOBAL
8.4·1019 photons·m-2·s-1
3.6·1019 photons·m-2·s-1
Wavelength (μm)
Phot
onic
flow
, 1020
phot
ons·
m-2
·s-1
·μm
-1
20
15
10
5
0
20
15
10
5
00.30 0.32 0.34 0.36 0.38 0.40
Figure 3.11. Standard UV spectrum on the earth surface.
3.8. ENVIRONMENTAL ASSESSMENT METHODOLOGY
The environmental impact of different bench scale photo-Fenton based treatments
was evaluated by means of the Life Cycle Assessment (LCA) tool. As described in
Section 1.6.1.2, the study was undertaken in four basic stages according to ISO 14040
standard [27]: goal and scope, inventory analysis, impact assessment, and interpretation.
Among the four consecutive steps included in the impact assessment stage (i.e.,
classification, characterisation, normalisation and weighting), only the classification and
characterisation were taken into account.
The sources and quality of data handled were taken from SigmaPro 6 software,
mainly from Ecoinvent database version 1.1 (June 2004) [28, 29]. To carry out the
environmental impact assessment, inventoried data were allocated to the following
potential impact categories included in the CML 2000 method [30]:
- Abiotic Resource Depletion (ARD), which are the natural resources (including
energy resources) that are regarded as non renewable in a short term.

COMBINATION OF AOPS AND BIOLOGICAL TREATMENTS FOR COMMERCIAL REACTIVE AZO DYES REMOVAL 106
- Global Warming Potential (GWP), which refers to the impact of human emissions
on the radiative forcing of the atmosphere.
- Ozone Depletion Potential (ODP) that refers to the thinning of the stratospheric
ozone layer as a result of anthropogenic emissions.
- Human Toxicity Potential (HTP) that covers the impacts on human health of toxic
substances present in the environment.
- Freshwater Aquatic Toxicity Potential (FATP), which refers to the impacts of toxic
substances on freshwater aquatic ecosystem.
- Marine Aquatic Ecotoxicity Potential (MAEP) that refers to the impacts of toxic
substances on marine aquatic ecosystem.
- Terrestrial Ecotoxicity Potential (TEP) that refers to the impacts of toxic
substances on terrestrial ecosystem.
- Photochemical Oxidation Potential (POP) that refers to the formation of
photooxidants such as ozone by the action of sunlight on certain primary air pollutants.
- Acidification Potential (AP), which contains a wide variety of impacts on soil,
groundwater, surface waters, biological organisms, ecosystems and materials due to
acidifying pollutants like SO2 and NOx.
- Aquatic Eutrophication Potential (AEP) that covers all potential impacts of
excessively high levels of macronutrients in the aquatic ecosystems, the most important
of which are nitrogen and phosphorous.

CHAPTER 3. MATERIALS AND METHODS 107
3.9. REFERENCES
[1] APHA-AWWA-WEF (1992). Standard Methods for the Examination of Water and Wastewater. 5310
A, 5310 B, 18th Ed., Washington DC, USA.
[2] APHA-AWWA-WEF (1992). Standard Methods for the Examination of Water and Wastewater. 5220
D, 18th Ed., Washington DC, USA.
[3] Ravikumar J.X., Gurol M.D. (1994). Chemical oxidation of chlorinated organics by hydrogen
peroxide in the presence of sand. Environ. Sci. Technol., 28, 394-400.
[4] Kormann C., Bahnemann D.W., Hoffmann M.R. (1988). Photocatalytic production of H2O2 and
organic peroxides in aqueous suspensions of TiO2, ZnO and desert salt. Environ. Sci. Technol., 22, 798-
806.
[5] APHA-AWWA-WEF (1992). Standard Methods for the Examination of Water and Wastewater.
3500-Fe D, 18th Ed., Washington DC, USA.
[6] APHA-AWWA-WEF (1992). Standard Methods for the Examination of Water and Wastewater.
4500-NH3 C, 18th Ed., Washington DC, USA.
[7] Beyer M., Walter W. (1987). Manual de Química Orgánica. Ed. Reverté S.A., Barcelona, Spain.
[8] APHA-AWWA-WEF (1992). Standard Methods for the Examination of Water and Wastewater. 2540
D, 18th Ed., Washington DC, USA.
[9] APHA-AWWA-WEF (1992). Standard Methods for the Examination of Water and Wastewater. 2540
E, 18th Ed., Washington DC, USA.
[10] OECD (1992). Inherent biodegradability: modified Zahn-Wellens test. Test 302B, Paris, France.
[11] PNE (1978). Métodos de análisis del agua. Determinación de la demanda bioquímica de oxígeno
(DBO). Método de dilución y siembra. PNE 77-003, Madrid, Spain.
[12] Cooney J.D. (1995). Freshwater tests. In: Rand G. (Ed.). Fundamentals in aquatic toxicology. Taylor
and Francis, 2nd Ed., Washington DC, USA.
[13] ISO (1998). Determination of the inhibitory effect of water samples on the light emission of Vibrio
fischeri (Luminescent bacteria test). ISO 11348-3, Geneva, Switzerland.
[14] APHA-AWWA-WEF (1992). Standard Methods for the Examination of Water and Wastewater.
2710 B, 18th Ed., Washington DC, USA.

COMBINATION OF AOPS AND BIOLOGICAL TREATMENTS FOR COMMERCIAL REACTIVE AZO DYES REMOVAL 108
[15] Field J., Alvarez R.S., Lettinga G. (1988). Ensayos anaerobios. Proc. of 4th Symposium on
wastewater anaerobic treatment, Valladolid, Spain.
[16] Adams C.D., Scanlan P.A., Secrist N.D. (1994). Oxidation and biodegradability enhancement of 1,4-
dioxane using hydrogen peroxide and ozone. Environ. Sci. Technol., 28, 1812-1818.
[17] Yun Whan Kang, Min-Jung Cho, Kyung-Yup Hwang (1999). Correction of hydrogen peroxide
interference on standard chemical oxygen demand test. Water Res., 33, 1247-1251.
[18] Blanco J., Malato S., Fernández P., Vidal A., Morales A., Trincado P., Oliveira J.C., Minero C.,
Musci M., Casalle C., Brunote M., Tratzky S., Dischinger N., Funken K.-H., Sattler C., Vincent M.,
Collares-Pereira M., Mendes J.F., Rangel C.M. (2000). Compound parabolic concentrator technology
development to commercial solar detoxification applications. Sol. Energy, 67, 317-330.
[19] Ajona J.I., Vidal A. (2000). The use of CPC collectors for detoxification of contaminated water:
design, construction and preliminary results. Sol. Energy, 68, 109-120.
[20] Malato S., Cáceres J., Fernández-Alba A.R., Piedra L., Hernando M.D., Agüera A., Vial J. (2003).
Photocatalytic treatment of diuron by solar photocatalysis: evaluation of main intermediates and toxicity.
Environ. Sci. Technol., 37, 2516-2524.
[21] Malato S., Blanco J., Vidal A., Alarcón D., Maldonado M.I., Cáceres J., Gernjak W. (2003). Applied
studies in solar photocatalytic detoxification: an overview. Sol. Energy, 75, 329-336.
[22] Contreras S. (2003). Degradation and biodegradability enhancement of nitrobenzene and 2,4-
dichlorophenol by means of Advanced Oxidation Processes based on ozone. PhD thesis, Universidad de
Barcelona, Spain.
[23] ASTM (1987). Standard tables for terrestrial direct normal solar spectral irradiance for air mass
1.5. Designation: E891-87.
[24] Hulstrom R., Bird R., Riordan C. (1985). Spectral solar irradiance data sets for selected terrestrial
conditions. Solar Cells, 15, 365-391.
[25] Riordan C.J., Hulstrom R.L., Myers D.R. (1990). Influences of atmospheric conditions and air mass
on the ratio of ultraviolet to total solar radiation. Solar Energy Research Institute (SERI)/TP-215-3895.
[26] ASTM (1987). Standard tables for terrestrial solar spectral irradiance at air mass 1.5 for a 37º
tilted surface. Designation: E892-87.
[27] ISO (2006). Environmental management –Life Cycle Assessment– Principles and Framework. ISO
14040, Geneva, Switzerland.

CHAPTER 3. MATERIALS AND METHODS 109
[28] Frischknecht R., Althaus H.J., Doka G., Dones R.S., Hischier R., Jungbluth N., Nemecek T.,
Rebitzer G., Spielmann M. (2003). Code of Practice. Final report ecoinvent 2000 No 2, Swiss Centre for
Life Cycle Inventories, Duebendorf, Switzerland.
[29] Frischknecht R., Althaus H.J., Doka G., Dones R.S., Heck T., Hellweg S., Hischier R., Jungbluth N.,
Nemecek T., Rebitzer G., Spielmann M. (2004). Overview and Methodology. Final report ecoivent 2000
No 1, Swiss Centre for Life Cycle Inventories, Duebendorf, Switzerland.
[30] Guinée J.B., Gorrée M., Heijungs R., Huppes G., Kleijn R., Udo de Haes H.A., Van der Voet E.,
Wrisberg M.N. (2002). Life Cycle Assessment. An operational guide to ISO standards. Centre of
Environmental Science, Leiden University (CML), The Netherlands.

CHAPTER 4. RESULTS AND DISCUSSION

Chapter 4
Results and Discussion
4.1. OVERVIEW
The release of textile effluents containing reactive dyes into the environment is a
dramatic source of aesthetic pollution and perturbations in aquatic life. Due to their
stability and non biodegradable nature under aerobic conditions, reactive dyes are not
easily amenable to conventional wastewater treatment methods. Consequently, to
accomplish with current legislations, the application of specific treatment is required
[1].
In this frame, Advanced Oxidation Processes (AOPs) have emerged as powerful
remediation treatments to destroy refractory pollutants in water [2]. They may be
applied as exclusive processes or combined with biological treatments in an attempt to
reduce their large chemicals and energy consumption [3]. Among available AOPs, the
Fenton and, particularly, the photo-Fenton processes are of especial interest since they
achieve high reaction yields with a lower operational cost [4]. Additionally, the

COMBINATION OF AOPS AND BIOLOGICAL TREATMENTS FOR COMMERCIAL REACTIVE AZO DYES REMOVAL 114
photoassisted reaction presents the possibility of be driven under solar irradiation,
offering further economic and environmental advantages [5].
At the present work, both Fenton and photo-Fenton processes were initially applied
at bench scale to entirely decolourise and mineralise three different reactive azo dye
hydrolysed solutions composed of 100 mg·l-1 of Procion Red H-E7B, 100 mg·l-1 of
Cibacron Red FN-R and 150.5 mg·l-1 of a standard trichromatic system (43.0 mg·l-1 of
Cibacron Red FN-R, 43.0 mg·l-1 of Cibacron Yellow FN-2R and 64.5 mg·l-1 of
Cibacron Navy FN-B), respectively. The main parameters that govern the system, i.e.,
initial ferrous ion and hydrogen peroxide dosages, type of irradiation –artificial UVA
light and solar radiation– and temperature were studied. The temperature effect is of
especial interest in view of future real applications since it is unusually high in dyeing
effluents considered here. Reaction efficiencies were evaluated in terms of %
decolourisation, aromatic compounds removal (UV254 removal) and mineralisation
(Dissolved Organic Carbon (DOC) removal). Finally, the possibility of an integrated
photo-Fenton-aerobic biological treatment was investigated.
The following two publications, corresponding to Sections 4.2.1 and 4.2.2,
encompass this first issue:
Decolourisation and mineralisation of homo- and hetero-bireactive dyes
under Fenton and photo-Fenton conditions
Coloration Technology, 120 (2004) 188-194
Decolorization and mineralization of commercial reactive dyes under solar
light assisted photo-Fenton conditions
Solar Energy, 77 (2004) 573-581
Both papers evidence that the studied Fenton based processes efficiently
accomplished a full decolourisation and a substantial mineralisation of hydrolysed dye
solutions. Regarding Fenton reagent concentrations, the best results for colour, UV254
and DOC removal were obtained with 10 mg·l-1 Fe (II)/100 mg·l-1 H2O2 for Procion Red
H-E7B, 10 mg·l-1 Fe (II)/250 mg·l-1 H2O2 for Cibacron Red FN-R and 10 mg·l-1 Fe
(II)/250 mg·l-1 H2O2 for the standard trichromatic system.

CHAPTER 4. RESULTS AND DISCUSSION 115
Under these conditions, more than 97% decolourisation was quickly attained in all
solutions, both in darkness and under irradiation. However, results show that the best
UV254 and DOC removal degree was obtained in the presence of light; dark Fenton
reaction was not able to go beyond 33% DOC and 59% UV254 removal even at
prolonged reaction times. Particularly good results were obtained when using solar light
assisted photo-Fenton treatment: aromatics and DOC removal percentages were 81 and
100% for Procion Red H-E7B, 73 and 99% for Cibacron Red FN-R and 86 and 81% for
the standard trichromatic system. It is remarkable that the degradation rates of solar
photo-Fenton were also superior to dark and artificially irradiated processes, in this
order. This higher efficiency of sunlight is attributable to the higher number of photons
supplied by the sun, which also involves a visible fraction of the spectrum profitable for
the photoassisted process [6, 7].
Concerning the temperature effect, values higher than room conditions manifested
notable differences in colour removal, UV254 and mineralisation at the initial stages of
dark and photoassisted processes. Thought, changes in temperature did not seem to
provide any substantial advantage at long reaction times when Fe (II) concentration is
low, Fenton reaction is minimal and Fenton-like or photo-Fenton reactions are
controlling the process.
When assessing the possibility of an integrated photo-Fenton-aerobic biological
treatment, only Procion Red H-E7B and Cibacron Red FN-R reactive dyes were
considered (the standard trichromatic system was not further investigated from hereon).
Their initial concentration was increased from 100 up to 250 mg·l-1 due to the
requirements set by the detection limit of biological analyses. The first measure was to
confirm that, as usual for textile dyes, they were not amenable to aerobic biotreatment.
With this aim, Biotox® technique (acute toxicity), BOD5/COD index (BOD5:
Biochemical Oxygen Demand for 5 days; COD: Chemical Oxygen Demand) and Zahn-
Wellens biological assays were employed. As expected, both dye solutions were
initially found to be non toxic, but also non biodegradable, impeding a single
conventional aerobic biological treatment. Therefore, in agreement with the strategy for
combined wastewater treatments proposed in Section 1.5.1, the photo-Fenton process
could be performed as a pre-treatment (avoiding complete mineralisation) to just

COMBINATION OF AOPS AND BIOLOGICAL TREATMENTS FOR COMMERCIAL REACTIVE AZO DYES REMOVAL 116
enhance the biodegradability and generate a new solution capable to be treated in a
secondary biological plant.
Initial 10 mg·l-1 Fe (II) and 125 mg·l-1 H2O2 Fenton reagent concentrations were
arbitrarily chosen. Acute toxicity and BOD5/COD ratio were periodically determined
through photo-Fenton process in order to evaluate the biocompatibility of phototreated
solutions. It should be noted that, instead of Zahn-Wellens assay, BOD5/COD index was
chosen since it provides a quicker screening of biodegradability. Obtained results were
satisfactory; BOD5/COD ratio underwent an effective increase during reaction,
meanwhile non toxic oxidation products were detected. In view of this, the sequenced
photo-Fenton-biological strategy was therefore possible. It is remarkable that these
experiments were carried out by using the artificial irradiation source. Thus, attending to
the data above reported, similar and even more favourable results were predictable
when using solar radiation.
Taking such toxicity and biodegradability results as starting point, the coupling of
artificial light photo-Fenton process and aerobic biological treatment for Procion Red
H-E7B and Cibacron Red FN-R degradation was carried out (Sections 4.2.3 and 4.2.4,
respectively). This work includes the two publications below. It is noticeable that no
earlier studies regarding photo-Fenton pre-treatment of an ensuing aerobic biological
process for the decontamination of real or simulated textile effluents containing reactive
dyes have been found in the literature.
Degradation of Procion Red H-E7B reactive dye by coupling a photo-
Fenton system with a sequencing batch reactor
Journal of Hazardous Materials, 134 (2006) 220-229
Combining photo-Fenton process with aerobic sequencing batch reactor
for commercial hetero-bireactive dye removal
Applied Catalysis B: Environmental, 67 (2006) 86-92
In a first part, several experiments were carried out by modifying Fe (II)/H2O2 ratio
and irradiation time in an attempt to establish the softest photo-Fenton conditions to
make Procion Red H-E7B and Cibacron Red FN-R biocompatible. The selection of

CHAPTER 4. RESULTS AND DISCUSSION 117
such Fenton reagent combinations was based on the preceding optimisation reported in
Section 4.2.1.
The most efficient Fenton reagent concentrations to achieve the maximum
degradation levels at short irradiation times were found to be 10 mg·l-1 Fe (II)/250 mg·l-1
H2O2 for Procion Red H-E7B and 20 mg·l-1 Fe (II)/500 mg·l-1 H2O2 for Cibacron Red
FN-R, with 82 and 84% mineralisation, respectively. However, since just a partial
degradation was desired, such combinations were not taken into account for chemical
and biological coupling applications. By stating them as the top doses limit, smaller Fe
(II) and H2O2 amounts were considered.
The efficiency of the pre-treatment process was estimated by means of the
biodegradability evolution of the phototreated solutions, determined by the BOD5/COD
ratio and respirometric measurements. The DOC evolution through the photo-Fenton
process was monitored in order to determine the degree of mineralisation during the
pre-treatment. Colour and acute toxicity of dyes degradation intermediates were also
determined along the oxidation.
In agreement with preliminary results obtained in publications 4.2.1 and 4.2.2, all
assessed solutions manifested a biodegradability increase with time, with no toxic
degradation products detection. This enhancement was accompanied by the solutions
decolourisation, suggesting the complete disappearance of the original dye molecules.
Nevertheless, their biocompatibility degree was not always high enough and only few
presumable biocompatible solutions were finally amenable to biological treatment. This
process was carried out in an aerobic Sequencing Batch Reactor (SBR) working under
different Hydraulic Retention Times (HRT). The DOC parameter was used as indicator
of the biodegradation success.
Among the different Procion Red H-E7B tested solutions, the best results were
obtained with 10 mg·l-1 Fe (II)/125 mg·l-1 H2O2 concentrations applied for an irradiation
time of 60 minutes. On the other hand, a Fenton reagent concentration of 20 mg·l-1 Fe
(II)/250 mg·l-1 H2O2 applied for 90 minutes made Cibacron Red FN-R solution
biocompatible. Under these pre-treatment conditions, the coupled aerobic SBR system,
working under steady conditions at 1 day HRT mode, successfully removed both
reactive dyes metabolites from aqueous solution.

COMBINATION OF AOPS AND BIOLOGICAL TREATMENTS FOR COMMERCIAL REACTIVE AZO DYES REMOVAL 118
Section 4.2.5 corresponds to the publication below, which analyses the preceding
combined artificial light photo-Fenton-biological oxidation system from an
environmental and economic point of view. Obtained results where thereby compared
with single artificial light and solar driven photo-Fenton processes, aiming to identify
the most suitable approach in such a context. For this target, experimental results
corresponding to Cibacron Red FN-R reactive dye degradation (Section 4.2.4) were
taken as a model.
Environmental assessment of different photo-Fenton approaches for
commercial reactive dye removal
Journal of Hazardous Materials, 138 (2006) 218-225
The environmental impact evaluation was carried out by means of the Life Cycle
Assessment (LCA) tool. As far as LCA application to AOPs is concerned, this is the
first published work dealing with an integrated AOP-biological system. The study
focused on the electricity consumption, including extraction of resources, transport and
energy conversion; the chemicals consumption, including extraction of resources,
production of the corresponding chemicals and the different transport steps; and the air
and water emissions generated through the different processes involved. The
construction and the end-of-life of the systems were not taken into account. The
environmental damage derived from each treatment was quantified according to the
environmental categories listed in Section 3.8. LCA characterisation values (data not
shown in publication 4.2.5) are given in Section A.2.2.
The economic study was performed considering the same inputs than in LCA, only
taking into account the chemical and energy costs associated with operation. All other
running costs and capital investments were excluded.
Obtained results were as follows. Single artificial light photo-Fenton process was
found to be the wastewater treatment with a major global impact on the environment,
mainly due to H2O2 requirements and UVA light irradiation, in this order. However,
when the artificial light photo-Fenton process was applied as a pre-treatment of a
biological treatment, H2O2 and electricity consumption were significantly reduced
achieving around 45% decrease for most environmental impact categories. The heaviest

CHAPTER 4. RESULTS AND DISCUSSION 119
burden linked to biological treatment was attributed to exceeding sludge management,
which was assumed to be composed of thickening, dewatering and stabilisation
independent unit operations. Solid sludge residue was finally deposited at landfill. On
the other hand, as expected, solar driven photo-Fenton process reduced the
environmental impact between 10 and 50% due to the avoidance of electricity input.
When comparing both solar driven photo-Fenton and artificial light photo-Fenton-
biological processes, no clear differences could be drawn for all environmental impact
categories. Differentiation can be made from the economic assessment. Obviously, the
artificial light photo-Fenton process was the most expensive treatment. When carrying
out the treatment under solar irradiation or coupled to an ensuing biological process, the
estimated relative cost decreased 13 and 44%, respectively, being the combined system
the cheaper option. A reduction of H2O2 –the most expensive burden– and electricity
consumption in favour of the biological treatment was found to be the major cause of
such a decrease.
In view of this, considering both environmental and economic data to decide about
the aptness of the studied wastewater treatments, the best environmental/cost option
seemed to be the coupling of artificial light photo-Fenton process and biological
treatment. Taking these results as a basis, it is predictable that a solar driven photo-
Fenton-aerobic biological coupling system would further reduce the economic and
environmental burdens. Additionally, as concluded in publications 4.2.1 and 4.2.2, solar
light gives more efficient dyes degradation than artificial light, making the combined
process involving sunlight very appealing from the point of view of real applications.
The following step was the scaling-up of the laboratory scale photo-Fenton-
biotreatment experiments to pilot plant. In this way, the feasibility of the system was
checked in view of future full scale implementations. Publications in Sections 4.2.3 and
4.2.4 were taken as starting point. Section A.1.1, corresponding to the following
manuscript submitted for publication, encloses the study.
Pilot plant scale reactive dyes degradation by solar photo-Fenton and
biological processes
COMBINATION OF AOPS AND BIOLOGICAL TREATMENTS FOR COMMERCIAL REACTIVE AZO DYES REMOVAL 120
In line with LCA and economic assessment final conclusions, the photo-Fenton
process was driven under solar radiation by using a Compound Parabolic Collector
(CPC) photoreactor. The biological pilot plant consisted of an Immobilised Biomass
Reactor (IBR).
Firstly, photo-Fenton was applied as a stand-alone process for entire Procion Red H-
E7B and Cibacron Red FN-R degradation. The 10 mg·l-1 Fe (II)/250 mg·l-1 H2O2 Fenton
reagent dosage for Procion Red H-E7B and the 20 mg·l-1 Fe (II)/500 mg·l-1 H2O2 for
Cibacron Red FN-R were considered. Results demonstrated the reproducibility of the
laboratory system with 82% DOC removal for Procion Red H-E7B and 86% for
Cibacron Red FN-R (see obtained results in publications 4.2.3 and 4.2.4). Nevertheless,
in comparison with the artificial light process at laboratory, the beneficial use of
sunlight with the CPC photoreactor increased the degradation rates allowing the
reduction of Fe (II) concentration from 10 to 2 mg·l-1 (Procion Red H-E7B) and from 20
to 5 mg·l-1 (Cibacron Red FN-R) without efficacy loses.
Under such low Fe (II) concentrations, the biodegradability evolution of Procion
Red H-E7B and Cibacron Red FN-R phototreated solutions, determined as BOD5/COD
ratio, was monitored. Analogously to the laboratory scale experiments procedure, some
presumably biocompatible phototreated solutions were submitted to the IBR pilot plant.
All of them were exempted of original dye and corresponded to colourless samples.
Among the tested pre-treatment conditions, the best ones for a subsequent
biodegradation were found to be 2 mg·l-1 Fe (II)/65 mg·l-1 H2O2 for Procion Red H-E7B
and 5 mg·l-1 Fe (II)/225 mg·l-1 H2O2 for Cibacron Red FN-R, reducing the required
bench scale Fenton reagent requirements (see publications 4.2.3 and 4.2.4). Both
phototreated dye solutions were successfully biodegraded in 1-2 days.
The knowledge of the reaction pathways and the kinetics of formation and
degradation of by-products generated along photo-Fenton is a key aspect from a
practical point of view, especially in cases where it precedes a biological treatment; the
success of the combined treatment depends on the nature of intermediates feeding the
bioreactor. In this direction, a mechanistic study of the degradation of Procion Red H-
E7B reactive dye by means of the solar photo-Fenton process at pilot plant scale
complements the above work. Cibacron Red FN-R was not considered here since its
molecular structure was not disclosed by the manufacturer. Again, it is noteworthy that

CHAPTER 4. RESULTS AND DISCUSSION 121
no studies about reactive azo dyes degradation mechanism by means of photo-Fenton
process are found in the literature.
250 mg·l-1 of H2O2 and the lowest 2 mg·l-1 Fe (II) concentration were applied to
provide appropriate degradation rates that ensure the detection of as many intermediate
species as possible. The study was developed by means of different chromatographic
analyses of the different phototreated samples; carboxylic acids generation, ammonium,
sulphate, nitrate and chloride ions release were determined by Ion Chromatography
(IC), and organic by-products identification was developed by means of Liquid
Chromatography-(Electrospray Ionisation)-Time-of-Flight Mass Spectrometry (LC-
(ESI)-TOF-MS) analysis. Identified intermediates and degradation pathways are
detailed in Section A.1.2, entitled:
Pathways of solar photo-Fenton degradation of Procion Red H-E7B
reactive azo dye at pilot plant scale
The proposed photo-Fenton degradation mechanism proceeds via a series of
consecutive steps. Firstly, hydroxyl radical would preferably attack an electron-rich site,
i.e., the –N=N– azo groups (the chromophore centre of dye molecules) or the carbon
near the secondary amino groups. Consequently, the degradation of azo groups would
give place to the quick solutions decolourisation, whereas the attack to the amino
groups would lead to the rupture between benzene or naphthalene rings and the triazine
moiety. Afterwards, mono- or poly-hydroxylations of benzene and naphthalene
structures would be produced. A subsequent ring cleavage (loss of absorbance at 254
nm) would generate aliphatic carboxylic acids (maleic, oxalic, acetic and formic) to
finally yield CO2 and water. At the same time, triazine structures would be slowly
degraded to the recalcitrant cyanuric acid, which cannot be mineralised until the end of
the photo-Fenton process [8, 9]. This compound would justify the residual DOC
observed at the end of the oxidation, even under the most favourable conditions (see
Sections 4.2.3, 4.2.4 and A.1.1 results). It has to be noted that, in agreement with this, a
remaining DOC should have also been observed at the end of reaction in publications
4.2.1 and 4.2.2. The reason of this lack of DOC is of analytical nature. Finally,
heteroatoms initially present in the molecule (except those contained in the triazine ring)
would be gradually released into aqueous solution as sulphate, chloride, ammonium and
COMBINATION OF AOPS AND BIOLOGICAL TREATMENTS FOR COMMERCIAL REACTIVE AZO DYES REMOVAL 122
nitrate anions throughout oxidation. Nitrogen constituting the azo groups could also
generate N2 gas from their direct attack by HO·.
The last issue of the present doctoral dissertation consists of the development of
several biological and chemical coupled treatments as alternatives to the photo-Fenton-
aerobic biological coupling strategy. This time, Cibacron Red FN-R was chosen as a
representative reactive azo dye to carry out the experimentation. The following
manuscript submitted for publication includes this study (Section A.1.3):
The testing of several biological and chemical coupled treatments for
Cibacron Red FN-R azo dye removal
A possible sequenced anaerobic-aerobic biotreatment was initially investigated. Azo
bonds may be anaerobically reduced basically leading to the corresponding aromatic
amines, compounds that are recalcitrant and toxic under reducing atmosphere but
theoretically susceptible to further aerobic biodegradation [10].
Three different hydrolysed Cibacron Red FN-R solutions (250, 1250 and 3135 mg·l-1)
were submitted to anaerobic digestion. Biogas production, % decolourisation and DOC
reduction after digestion were monitored in order to evaluate the success of the
anaerobic stage. As a result, complete decolourisation occurred for all concentrations
with 92-97% effectiveness. Nevertheless, no DOC removal neither biogas production
was observed from dye metabolites, indicating that no methanogenesis occurred. In
addition, according to Biotox® and Zahn-Wellens assays, anaerobically generated
colourless solutions (presumably containing the aromatic amines derived from azo bond
cleavage) were found to be more toxic than the original dye solution and aerobically
non biodegradable, impeding the biological two-stage treatment to complete
degradation.
Thus, in order to mineralise Cibacron FN-R metabolites, the application of an AOP
as a post-treatment of the anaerobic digestion was performed. The 250 mg·l-1 Cibacron
Red FN-R solution was chosen for these experiments. Besides the artificial light photo-
Fenton process, ozonation was considered due to its known efficient removal of many
types of contaminants. Photo-Fenton was applied under different chosen Fenton reagent

CHAPTER 4. RESULTS AND DISCUSSION 123
concentrations (including the 20 mg·l-1 Fe (II)/500 mg·l-1 H2O2), whereas ozonation was
performed under different initial pH conditions. The best results were obtained by
means of ozonation at pH = 10.5, achieving 83% mineralisation. In contrast, the photo-
Fenton reaction was not efficient enough to completely oxidise the effluent. Just 59% of
DOC removal of the anaerobically treated solution was attained under the highest tested
dosage (100 mg·l-1 Fe (II)/2500 mg·l-1 H2O2), mostly attributable to a non oxidative
process based on iron coagulation.
These results open the possibility of an anaerobic-chemical sequenced treatment for
aerobically non biodegradable azo dyes removal, being of special interest for real textile
wastewater applications.

COMBINATION OF AOPS AND BIOLOGICAL TREATMENTS FOR COMMERCIAL REACTIVE AZO DYES REMOVAL 124
References
[1] López-Grimau V., Gutiérrez M.C. (2006). Decolourisation of simulated reactive dyebath effluents by
electrochemical oxidation assisted by UV light. Chemosphere, 62, 106-112.
[2] Andreozzi R., Caprio V., Insola A., Marotta R. (1999). Advanced oxidation proceses (AOP) for water
purification and recovery. Catal. Today, 53, 51-59.
[3] Scott J.P., Ollis D.F. (1995). Integration of chemical and biological oxidation processes for water
treatment: review and recommendations. Environ. Prog., 14, 88-103.
[4] Bauer R., Fallman H. (1997). The photo-Fenton oxidation-a cheap and efficient wastewater treatment
method. Res. Chem. Intermediat., 23, 341-354.
[5] Safarzadeh-Amiri A., Bolton J.R., Cater S.R. (1996). The use of iron in Advanced Oxidation
Processes. J. Adv. Oxid. Technol., 1, 18-26.
[6] Bauer R., Waldner G., Fallmann H., Hager S., Klare M., Krutzler T., Malato S., Maletzky P. (1999).
The photo-Fenton reaction and the TiO2/UV process for waste water treatment–novel developments.
Catal. Today, 53, 131-144.
[7] Pignatello J., Liu D., Huston P. (1999). Evidence for an additional oxidant in the photoassisted Fenton
reaction. Environ. Sci. Technol., 33, 1832-1839.
[8] Huston P.L., Pignatello J. (1999). Degradation of selected pesticide active ingredients and commercial
formulations in water by the photo-assisted Fenton reaction. Water Res., 33, 1238-1246.
[9] Pérez M.H., Peñuela G., Maldonado M.I., Malato O., Fernández-Ibáñez P., Oller I., Gernjak W.,
Malato S. (2006). Degradation of pesticides in water using solar advanced oxidation processes. Appl.
Catal. B: Environ., 64, 272-281.
[10] Carliell C.M., Barclay S.J., Buckley C.A. (1996). Treatment of exhausted reactive dyebath effluent
using anaerobic digestion: Laboratory and full-scale trials. Water S.A., 22, 225-233.

CHAPTER 4. RESULTS AND DISCUSSION 125
4.2. PUBLICATIONS
4.2.1. Decolourisation and mineralisation of homo- and hetero-bireactive dyes under
Fenton and photo-Fenton conditions. Coloration Technology, 120 (2004) 188-194.
Torrades F., García-Montaño J., García-Hortal J.A., Núñez Ll., Domènech X., Peral J.
4.2.2. Decolorization and mineralization of commercial reactive dyes under solar light assisted photo-Fenton conditions. Solar Energy, 77 (2004) 573-581.
Torrades F., García-Montaño J., García-Hortal J.A., Domènech X., Peral J.
4.2.3. Degradation of Procion Red H-E7B reactive dye by coupling a photo-Fenton system with a sequencing batch reactor. Journal of Hazardous Materials, 134 (2006) 220-229.
García-Montaño J., Torrades F., García-Hortal J.A., Domènech X., Peral J.
4.2.4. Combining photo-Fenton process with aerobic sequencing batch reactor for commercial hetero-bireactive dye removal. Applied Catalysis B: Environmental, 67 (2006) 86-92.
García-Montaño J., Torrades F., García-Hortal J.A., Domènech X., Peral J.
4.2.5. Environmental assessment of different photo-Fenton approaches for commercial reactive dye removal. Journal of Hazardous Materials, 138 (2006) 218-225.
García-Montaño J., Ruiz N., Muñoz I., Domènech X., García-Hortal J.A., Torrades F., Peral J.

188 © Color. Technol., 120 (2004) Web ref: 20040408
ColorationTechnology
Society of Dyers and Colourists
Decolorisation and mineralisation of homo-and hetero-bireactive dyes under Fenton andphoto-Fenton conditionsFrancesc Torrades,a,* Julia García-Montaño,b José Antonio García-Hortal,c Lluís Núñez,c Xavier Domènechb and José Peralb
a Departament d’Enginyeria Química, ETSEI de Terrassa, Universitat Politècnica deCatalunya, C/Colom 11, E-08222 Terrassa, SpainEmail: [email protected]
b Departament de Química, Edifici Cn, Universitat Autònoma de Barcelona, E-08193Bellaterra (Cerdanyola del Vallès), Spain
c Departament d’Enginyeria Tèxtil i Paperera, E.T.S.E.I. de Terrassa, UniversitatPolitècnica de Catalunya, C/Colom 11, E-08222 Terrassa, Spain
Received: 10 February 2004; Accepted: 7 May 2004
The degradation of two commercial reactive dyes, CI Reactive Red 141 (homo-bireactive) and CIReactive Red 238 (hetero-bireactive), using Fenton’s reagent in the dark and under either artificial orsolar irradiation, has been investigated. The main parameters that govern the complex reactivesystem, i.e. type of irradiation, temperature and initial concentrations of iron(II) and hydrogen peroxide,have been studied at pH 3. Temperature and the use of light have beneficial effects on the removal ofcolour, aromatic compounds, total organic carbon, acute toxicity, given as changes in EC50 values(against the marine photobacteria Vibrio fischeri) and changes in the biodegradability. The advancedoxidation processes used in this study have proven to be highly effective for the treatment of suchtypes of reactive dyes and several advantages concerning the technique application arise from thestudy. The possibility of a combined advanced oxidation process–biological treatment is proposed.
IntroductionThe textile industry produces large quantities of wastewaterthat is highly coloured and contains large concentrations oforganic matter [1]. This type of dyehouse effluent can causemajor aesthetic and environmental problems [2–4]. Themajor problem of colour in such effluent is produced by theresidual dyes present after the dyeing process. Treatmenttechnologies such as biological, physical and chemicalprocesses have been used for colour removal. However,biological treatment technologies are insufficient for thedecolorisation of textile wastewater [5], and the colourremains due to the non-biodegradable nature of thechromophoric groups, such as azo or nitro, bonded to thearomatic rings of the dyes. On the other hand, physicaltreatment technologies, such as coagulation/flocculation,activated carbon adsorption and membrane processes, canresult in successful removal of colour from effluent but thereis a disadvantage as these methods also lead to another formof waste (i.e. solid waste such as spent carbon or sludge).
Therefore, in the last decade, attention has focused ontreatment technologies that lead to the completedestruction of the dye molecules. Among these treatments,advanced oxidation processes (AOPs) have been used forpollutant abatement due to the high oxidative power (2.8 Vvs NHE) of the hydroxyl radical, the main reactive speciesgenerated by such processes. The most widely known AOPsinclude heterogeneous photocatalytic oxidation [6–11],treatment with ozone in basic or neutral media [oftencombined with hydrogen peroxide, ultraviolet (UV) light
or both] [12–14], hydrogen peroxide/UV systems [2,15–18],and Fenton [4,9,19–22] and photo-Fenton reactions[9,20,23–25].
The major disadvantage of AOPs is their high electricalenergy input and chemical requirements rendering themenergy intensive and hence expensive treatment altern-atives, thus hindering their adoption in full scale applications[26]. The production of photons with artificial light sourcesin particular requires an important energy input.Fortunately, the photo-Fenton reaction can be driven withlow energy photons in the visible part of the spectrum. Thus,photo-Fenton processes are a potentially low cost AOP thatcan be run under solar irradiation [25].
In the generally accepted mechanism of reaction withFenton’s reagent, hydroxyl radicals (•OH) are produced byinteraction of hydrogen peroxide with ferrous salts (Eqn 1).
Fe H O Fe OH OH l mol s2+2 2
3++ → + + =− − −• k 76 5 1 1. (1)
Iron(III) can then react with hydrogen peroxide in the so-called Fenton-like reaction (Eqns 2–4):
Fe H O FeOOH H 2+2 2
2+ ++ + = × −� Keq 3 1 10 3. (2)
Fe OOH HO Fe 10 s2+2
2+− → + = × − −• k 2 7 3 1. (3)
Fe HO Fe O H 10 l mol s3+2
2+2+ → + + < ×+ − −• k 2 3 1 1 (4)
20040408_j2204.pmd 7/27/2004, 12:09 PM188

© Color. Technol., 120 (2004) 189Web ref: 20040408
in order to regenerate iron(II) and, thus, supporting theFenton process [15].
The rate of degradation of the organic pollutants by theFenton reaction could increase if an irradiation source ispresent. The positive effect of irradiation on the degradationrate is due to the photoreduction of iron(III) to iron(II) ions,a step that produces new hydroxyl radicals and regeneratesiron(II) ions that can further react with more hydrogenperoxide molecules. The photoreduction of iron(III) followsEqn 5 [15]:
FeOH Fe OH2+ 2++ → +hν • (5)
with Fe(OH)2+ being the dominant iron(III) species in solutionat pH 2–3. On the other hand, it has been proven that theirradiation of iron(III) and hydrogen peroxide enhances thereaction rate of oxidant production, through the involvementof high valence iron intermediates responsible for the directattack on organic matter [27,28]. Absorption of visible lightby the complex formed between iron(III) and hydrogenperoxide seems to be the cause of formation of such highvalence iron-based oxidants.
As organic molecules, dyes can be the target of hydroxylradical attack and thus, the previously described Fentonand photo-Fenton reactions can be eventually effectivetechniques for the removal of such contaminants fromwater. In this sense, the purpose of the present study is thedegradation of two commercial hydrolysed reactivedyestuffs, i.e. one bis-aminochlorotriazine bifunctional (CIReactive Red 141) and one vinylsulphone fluorotriazineheterobifunctional (CI Reactive Red 238), by using Fentonand photo-Fenton reactions. In order to achieve this, themain parameters that govern the complex reactive system,i.e. type of irradiation, temperature, initial iron(II) andhydrogen peroxide concentrations, have been studied. Theanalytical techniques used involved colour removal,aromatic compound removal (UV254) and total organiccarbon (TOC).
Moreover, an additional goal of the paper was to obtaina non-toxic and biodegradable effluent, in order to assessthe possibility of a combined AOP–biological treatment.Consequently, chemical oxygen demand (COD), five daybiochemical oxygen demand (BOD5) and acute toxicity(EC50) was studied.
similar manner. However, the heating was kept to 60 °C for1 h to simulate bath-dyeing conditions.
Analytical grade hydrogen peroxide (33% w/v) andFeSO4•7H2O were purchased from Panreac and were usedas received. For the pH adjustment solutions, concentratedreagent grade sulphuric acid and sodium hydroxidesolutions, obtained from Panreac, were used. Solutions wereprepared with deionised water obtained from a MilliporeMilli-Q system.
ExperimentalReagentsTwo commercially available reactive dyestuffs, CIReactive Red 141 (C52H34O26S8Cl2N14) and CI Reactive Red238 (C29H15ClFN7O13S4Na4) were supplied by Ciba.
The preparation of the dye solutions was as follows. CIReactive Red 141 (0.1000 g) was dissolved in 1 l of distilledwater to make a dye solution typical of reactive dyebatheffluent (100 mg/l). The solution was adjusted to pH 10.6using sodium hydroxide (6 mol/l), followed by heating to80 °C in a reflux system, where it was kept for 6 h tosimulate batch-dyeing conditions. The hydrolysed dyesolution was then cooled to the test temperature, adjustedto pH 3 with sulphuric acid (6 mol/l) and stored at 4 °C. CIReactive Red 238 solution (100 mg/l) was prepared in a
Sample analysisChemical analysisThe absorption spectra of the dye solution were recordedby using a Shimadzu UV-1603 double beam spectro-photometer. The absorbance of the solution at the absorptionmaximum (λmax) of the dye in the visible region (CI ReactiveRed 141, λmax 543.5 nm; CI Reactive Red 238, λmax 542.5nm), and the UV254 absorbance (aromatic content), weremeasured by using 10 mm light path cells.
Total organic carbon (TOC) of initial and irradiatedsamples was determined with a Shimadzu 5000 TOCanalyser.
All COD values were determined by the close refluxcolorimetric method [29] with a HACH DR-700 apparatus.The residual H2O2 was determined by the potassium iodidetitration method [30].
Biodegradability measurementsThe measurement of BOD5 values was performed by meansof a mercury-free WTW 2000 Oxytop unit thermostattedat 20 °C. Here, due to the toxic character of hydrogenperoxide, its removal with SO3
2– was found to be necessarybefore the BOD5 analysis, since the microorganisms usedin this technique cannot endure the presence of the oxidant.
The Zahn–Wellens test was carried out under conditionsclose to those of a municipal wastewater treatment plantusing activated sludge [31]. The activated sludge from themunicipal wastewater treatment plant of Manresa (CataloniaCommunity, Spain) was aerated for a 24 h period andcentrifuged subsequently. The centrifuged sludge was thensuspended at 0.2–0.3 g/l for the Zahn–Wellens test.
Toxicity analysisThe toxicity was assessed using the Biotox technique.According to the sample preparation prior to the Biotoxtest, the pH of the solutions was adjusted to 7 and solidsodium chloride was added in order to adjust the salinityto 2%. Residual hydrogen peroxide was removed from thesolution with Catalase (2350 U per mg; Sigma), accordingto the following specifications: 1 U destroys 1 µmol min–1
of hydrogen peroxide at pH 7 and temperature 25 °C. Feion (mainly Fe3+)was precipitated out prior to assay byincreasing the pH.
The test is based on the determination of the acutetoxicity that the sample has on the marine photobacteriaVibrio fischeri. The toxicity is quantified as the relativedecrease of the photobacteria light emission with respectto a sample control that only contained the dilutionmedium, i.e. sodium chloride, 2% w/v. The analysisgenerates the EC50 parameter (the concentration of toxicantthat causes a 50% decrease of the light emission), which
20040408_j2204.pmd 7/27/2004, 12:09 PM189

190 © Color. Technol., 120 (2004) Web ref: 20040408
is determined by interpolation from a series of dilutions ofthe original toxicant sample that have been in contact withthe photobacteria during 30 min. A graph is plotted withthe x-axis containing TOC% (compared to the total TOCcontent of the initial sample) and the y-axis displays thelight emission of the marine photobacteria that reduces tohalf the photobacteria light activity. EC50 values wereexpressed as a percentage of TOC of the original toxicantsample and they are inversely correlated to the toxicity (themore toxic, the lower the EC50 value). When the TOC ofthe original toxicant samples were lower than the EC50,these values were given as > 100%.
Reactors and light sourcesAlmost all experiments were conducted in a thermostaticcylindrical Pyrex cell of 130 ml capacity. The reactionmixture inside the cell, consisting of 100 ml of dye sample(100 mg/l) and the precise amount of Fenton’s reagent, wascontinuously stirred with a magnetic bar and thetemperature fixed at the required level (25, 40 or 60 °C at± 1 °C). In order to maintain standard conditions, the Fentonreactions were carried out in darkness [19].
When experiments with CI Reactive Red 141 wereperformed using solar light, the temperature rose from 33to 42 °C at the end of the 2 h. In the case of CI ReactiveRed 238, the temperature rose from 30 to 40 °C. Theyearly averaged solar energy between 300–400 nm hittingthe earth’s surface in the south of Spain is ca. 3–4 × 10⁻³
W cm–2 [32].A 6 W Philips black-light fluorescent lamp was used in
the photo-Fenton experiments with artificial light. Theintensity of the incident light inside the photoreactor,measured employing a uranyl actinometer, was 1.38 × 10⁻⁹
Einstein s–1 for the fluorescent lamp. Based on this number,the reactor geometry and the lamp emission spectrum it wasestimated that a total power of luminous energy enteringthe reactor was 1.3 × 10⁻⁴ W cm–2.
Table 1 Environmental characterisation of the hydrolysed dye samples
Dye Dye conc. (mg/l) λmax (nm) TOC (mg/l) COD (mg/l) BOD5 BOD5/COD EC50 (mg/l)
CI Reactive Red 141 100 543.5,289.0 17.68 50 5 0.10 > 17.68a
CI Reactive Red 238 100 542.5,286.5 29.24 110 2 0.02 > 29.24 a
a EC50 > 100%
Results and DiscussionAnalysis of the hydrolysed dye samples
UV–visible spectraThe absorption spectra of the CI Reactive Red 141 solution(100 mg/l) before AOP treatment at pH 3 is characterisedby two main bands, one in the visible region (λmax 543.5nm) and the other in the UV region (λmax 289.0 nm) (Table1). As indicated by Silverstein et al., the visible band at543.5 nm is due to the long conjugated π-system of aromaticrings connected by two azo groups [33]. The UV band at289 nm is due to two adjacent rings.
In the absorption spectra of CI Reactive Red 238, thereare also two main bands, one in the visible region (λmax 542.5nm) and one in the UV region (λmax 286.5 nm) (Table 1).
Biodegradability measurementsPrior to treatment it was concluded, by means of a Zahn–Wellens test (data not shown), that both dyes were of non-biodegradable nature. It was also found that a BOD5/CODratio value of 0.10 and 0.02 was obtained for CI ReactiveRed 141 and CI Reactive Red 238, respectively (Table 1).
Toxicity analysisAs the calculated EC50 value was greater than 100% for bothdyes (> 17.68 and 29.94 ppm for CI Reactive Red 141 andCI Reactive Red 238, respectively), it can be concluded thatneither dye showed any evidence of toxicity (Table 1).
Fenton and photo-Fenton reactions of the hydrolysed dyesReaction in the darkIn order to achieve the best degree of decolorisation andmineralisation of the dye, optimal concentrations ofhydrogen peroxide and iron(II) were required. Formineralisation, a good level of hydrogen peroxide is thoughtto be ca. 1–2 times the stoichiometric requirements [23](1 g COD = 0.03125 mol oxygen = 0.0625 mol hydrogenperoxide). The COD values for the hydrolysed dyes, beforetreatment, are shown in Table 1.
However, for the purposes of decolorisation, the removalof colour is associated with the break of the conjugatedunsaturated bonds in molecules. Consequently, hydrogenperoxide may be used in smaller quantities than thosecalculated from a COD value [19], and the optimal concen-tration in the dye/hydrogen peroxide/iron(II) system willdepend on the degree of degradation that is to be achieved.A good degree of degradation would be associated with theattainment of a decoloured, low organic loaded, biodegrad-able and non-toxic effluent.
For a 10 mg/l (0.18 mM) sample of iron (II), a range ofconcentrations of hydrogen peroxide were tested: 50, 100,150, 250, 500 and 1000 mg/l (1.47, 2.94, 4.41, 7.35, 14.7and 29.4 mM, respectively). For CI Reactive Red 141, thebest results for colour, UV254 and TOC removal wereobtained at a peroxide concentration of 100 mg/l (2.94 mM)(Figure 1). For CI Reactive Red 238, the best results wereobtained at a peroxide concentration of 250 mg/l (7.35 mM)for colour, UV254 and TOC removal (Figure 2).
The treatment time had a significant effect on degrad-ation process, as can be seen in both Figures 1 and 2. Theresults shown in Figure 3, show the effect of varying thetreatment time at specific hydrogen peroxide concentrationswith a plot of A/A0 or TOC/TOC0 vs time. A/A0 is the normal-ised absorbance and is the quotient between the absorbance
20040408_j2204.pmd 7/27/2004, 12:09 PM190

© Color. Technol., 120 (2004) 191Web ref: 20040408
80
100
95
90
85
3020105 25150H2O2 conc., mM
Col
our
rem
oval
, %
t = 5 mint = 10 mint = 15 min
(a)
0
60
50
30
10
40
20
3020105 25150H2O2 conc., mM
UV
254
rem
oval
, %
t = 30 mint = 60 mint = 90 min
(b)
0
30
25
15
5
20
10
3020105 25150H2O2 conc., mM
TOC
rem
oval
, %
t = 30 mint = 60 mint = 90 min
(c)
50
60
100
90
80
70
3020105 25150H2O2 conc., mM
Col
our
rem
oval
, %
(a)
t = 5 mint = 10 mint = 15 mint = 30 min
0
50
30
10
40
20
3020105 25150H2O2 conc., mM
UV
254
rem
oval
, %
t = 30 mint = 60 mint = 90 min
(b)
0
30
25
15
5
20
10
3020105 25150H2O2 conc., mM
TOC
rem
oval
, %
t = 30 mint = 60 mint = 90 min
(c)Figure 1 Plots showing (a) colour, (b) UV254 and (c) TOCremoval for CI Reactive Red 141 for different concentrations ofhydrogen peroxide; [Fe2+]0 = 10 mg/l (0.18 mM), pH = 3 and T =25 °C
Figure 2 Plots showing (a) colour, (b) UV254 and (c) TOCremoval for CI Reactive Red 238 for different concentrations ofhydrogen peroxide; [Fe2+]0 = 10 mg/l (0.18 mM), pH = 3 and T =25 °C
at time t (A) and at t = 0 (A0). For CI Reactive Red 141, at ahydrogen peroxide concentration of 100 mg/l, more than98% colour removal was obtained after 15 min, along withmore than 50% UV254 and 28% TOC removal after 90 mintreatment (Figure 3). The decrease of these parameters isinitially fast, although it slows down for long treatment times.For CI Reactive Red 238, at a hydrogen peroxideconcentration of 250 mg/l, more than 97% colour removalwas obtained after 15 min treatment, along with more than41% UV254 and 24% TOC removal after 90 min treatment.
For hydrogen peroxide concentrations below 100 mg/lfor CI Reactive Red 141 and 250 mg/l for CI Reactive Red238, insufficient oxidant is available to destroy the dye, as
can be seen from the initial COD value. On the other hand,a further increase in oxidant concentration slows down thedecolorisation and degradation processes, because hydrogenperoxide in excess acts as a hydroxyl-radical scavenger asshown by the following kinetic equation (Eqn 6) [34].
• •OH H O H O HO
10 l mol s
2 2 2 2+ → +
= − × − −k ( . . )1 2 4 5 7 1 1 (6)
The effect of temperature on the Fenton reaction (in thedark) was also tested. It is important to remark that incomparison to most industrial wastewater, the temperature
20040408_j2204.pmd 7/27/2004, 12:09 PM191

192 © Color. Technol., 120 (2004) Web ref: 20040408
0
1.2
1.0
0.6
0.2
0.8
0.4
0
1.2
1.0
0.6
0.2
0.8
0.4
1206030 900Time, min
A/A
0
TOC
/TO
C0
A/A0 (543.5 nm)A/A0 (254 nm)TOC/TOC0
(a)
0
1.0
0.6
0.2
0.8
0.4
0
1.0
0.6
0.2
0.8
0.4
1206030 900Time, min
A/A
0
TOC
/TO
C0
A/A0 (542.5 nm)A/A0 (254 nm)TOC/TOC0
(b)
Figure 3 Colour, UV254 and TOC removal of (a) CI Reactive Red 141 (H2O2 conc., 100 mg/l) and (b) CI Reactive Red 238 (H2O2 conc.,250 mg/l) at various treatment times; [Fe2+]0 = 10 mg/l (0.18 mM), pH = 3 and T = 25 °C
of effluent from dyeing and finishing mills is unusuallyhigh. During the dyeing process, rinse water temperaturehigher than 40 °C is normally encountered [35].Consequently, the effect of different temperatures (25, 40and 60 °C) on the degree of degradation of the dye wastested. In all cases for CI Reactive Red 141 and CI ReactiveRed 238, raising the temperature gave good results inrelation to degradation of the dyes in terms of colour (datanot shown), UV254 (Figure 4) and TOC (Figure 5). Theseresults agree with the known fact that the Fenton reactionis accelerated with increasing temperatures [20,21]. It hasto be said that the differences in colour removal, UV254 andTOC removal rate are obtained in the first 15 min ofreaction. For longer reaction times, when the rate decreaseschanges in temperature seem to have no effect (Figures 4and 5). This is the time region where iron(II) concentrationis close to zero, the Fenton reaction is minimal, and themuch slower Fenton-like reaction is controlling the process.
Reaction under irradiationAs mentioned before, when using Fenton’s reagent in thepresence of an irradiation source (photo-Fenton process) therate of degradation of the organic pollutants could increase.In this sense, the effects of artificial (UVA) light and solarlight on TOC and UV254 removal was also investigated (seeFigures 4 and 5). The results show that the best UV254 andTOC removal rates were always obtained in the presenceof light.
Although attempts to monitor colour removal were alsocarried out, the disappearance was too fast in presence oflight. Light can play two different roles that will lead to animprovement of the reaction yields. Firstly, it drives thephoto-Fenton reaction, producing extra hydroxyl radicalsand the recovery of iron(II) needed in the Fenton reaction.The photo-Fenton reaction may involve direct photolysis offerric iron (Eqn 5) or photolysis of iron(III)–peroxycomplexes, or any of their potential intermediates [28].
Secondly, it can drive ligand-to-metal charge transfer inthe potentially photolabile complexes formed by iron(III)and the organic compounds, a process that has been wellproven for the complexes formed between iron(III) and thecarboxylic acid moiety [36]. Large quantities of carboxylicacid are expected to be formed as degradationintermediates of the original organic substrate.
Additionally, solar light has the largest fraction ofphotons with the energy needed to drive the photoreactionsinvolved in the present reactive system and, consequently,solar light gives the best results in UV254 and TOC removal(as shown in Figures 4 and 5). This opens up the possibilityof extended low cost applications. For CI Reactive Red 141,a 98% TOC removal is obtained after 15 min treatmentand more than 80% UV254 after 60 min, when using solarlight as the light source. For CI Reactive Red 238 the resultswere more than 98% TOC removal after 45 min along withmore than 70% UV254 after 60 min. Results of theoptimised treatment systems, at a treatment time of 90min, in terms of the parameters UV254 removal and TOCremoval are summarised in Table 2.
It has to be pointed out that the remaining absorption at254 nm seen in Figure 4 was due to the residual hydrogenperoxide present in the effluent and the presence of severalcomplexes of iron that absorb photons of this wavelength.In this study, residual hydrogen peroxide concentrations(determined by the potassium iodide titration method [30])of 5–20 mg/l were found at the end of all the experiments.Hydrogen peroxide analysis also showed a correlationbetween the peroxide consumption and TOC/colour/CODabatement rate. For example, in an experiment withhydrogen peroxide (125 mg/l) and CI Reactive Red 141 (250mg/l), initial reaction rates of reagent removal were 3.4(peroxide) and 2.7 mg/l/min (dye). In an experiment withequivalent concentrations of hydrogen peroxide and CIReactive Red 238, initial reaction rates were 0.96(peroxide) and 0.62 mg/l/min (dye). Clearly, a faster TOC/colour/COD removal reaction involves a faster hydrogenperoxide consumption.
The fast colour removal of the dye and the decrease ofTOC and aromatic compounds is compatible with adegradation mechanism that begins with azo-bond cleavageand is followed by the hydroxylation of the aromatic ring,as indicated by several authors [37,38]. This mechanismleads to the production of sulphonated aromatic amines,carboxylic acids, quinones, carbon dioxide and otherminority compounds.
The chemical observations described above arevalidated by the concomitant increase of biodegradability.As can be seen in Figure 6, a BOD5/COD ratio of 0.31 and0.21, respectively, is obtained for CI Reactive Red 141 (after
20040408_j2204.pmd 7/27/2004, 12:09 PM192

© Color. Technol., 120 (2004) 193Web ref: 20040408
0
0.2
1.2
1.0
0.8
0.6
0.4
1206030 900Time, min
A/A
0
(a)Fenton 25 oCFenton 40 oCFenton 60 oCphoto-Fenton 25 oCphoto-Fenton 40 oCphoto-Fenton 60 oCFenton assisted solar-light
0
0.2
1.2
1.0
0.8
0.6
0.4
1206030 900Time, min
A/A
0
(b)Fenton 25 oCFenton 40 oCphoto-Fenton 25 oCphoto-Fenton 40 oCFenton assisted solar-light
0
0.2
1
0.8
0.6
0.4
1208040 6020 1000Time, min
TOC
/TO
C0
(a)
0
0.2
1.2
1.0
0.8
0.6
0.4
1208040 6020 1000Time, min
TOC
/TO
C0
(b)
Figure 4 UV254 removal of (a) CI Reactive Red 141 (H2O2 conc., 100 mg/l) and (b) CI Reactive Red 238 (H2O2 conc., 250 mg/l) fordifferent Fenton and photo-Fenton conditions; [Fe2+]0 = 10 mg/l (0.18 mM) and pH = 3
Figure 5 TOC removal of (a) CI Reactive Red 141 (H2O2 conc., 100 mg/l) and (b) CI Reactive Red 238 (H2O2 conc., 250 mg/l) fordifferent Fenton and photo-Fenton conditions; for key see Figure 4; [Fe2+]0 = 10 mg/l (0.18 mM) and pH = 3
Table 2 UV254 and TOC removal for the hydrolysed dye samples under optimised process conditionsa
CI Reactive Red 141 CI Reactive Red 238
Treatment UV254 removal (%) TOC removal (%) UV254 removal (%) TOC removal (%)
Fenton, 25 ºC 51.8 28.0 41.8 24.0Fenton, 40 ºC 49.6 28.7 45.1 25.0Photo-Fenton, 25 ºC 66.9 100.0 71.7 74.0Photo-Fenton, 40 ºC 79.1 79.1 72.8 85.0Fenton assisted solar-light 80.6 100.0b 73.1 98.6c
a Treatment time = 90 minb Treatment time = 20 minc Treatment time = 47 min
120 min) and CI Reactive Red 238 (after 180 min) of photo-Fenton treatment (artificial light).
It has to be pointed out that, in order to havereproducible BOD5 results, the experiments were carriedout with larger initial dye concentrations (250 mg/l) andthus, much longer reaction times are expected to achievethe same levels of degradation in the dyes. Also, asindicated in the Experimental section, due to the toxiccharacter of hydrogen peroxide, its removal with SO3
2– was
found to be necessary before the BOD5 analysis. Moreover,the COD values were corrected taking in account theresidual hydrogen peroxide present.
On the other hand, the most important conclusion withrespect to toxicity that can be drawn is that intermediateswith higher toxicity than the initial dyes did not developduring the photo-Fenton treatment process, because the EC50
was greater than 100% after the various treatment times(5, 15, 60 and 120 min).
20040408_j2204.pmd 7/27/2004, 12:09 PM193

194 © Color. Technol., 120 (2004) Web ref: 20040408
Figure 6 Variation of BOD5/COD with treatment time for CIReactive Red 141 (250 mg/l) and CI Reactive Red 238 (250 mg/l)(H2O2 conc., 125 mg/l); [Fe2+]0 = 10 mg/l (0.18 mM), pH = 3 andartificial light
Consequently, the positive effect of the Photo-Fentontreatment on the biodegradability of both dyes clearlyindicates that coupling the photo-Fenton process withbiological treatment might be a beneficial treatmentapproach.
References 1. P Grau, Water Sci. Technol., 24 (1991) 97. 2. D Georgiou, P Melidis, A Aivasidis and K Gimouhopoulos,
Dyes Pigm., 52 (2002) 69. 3. C O’Neill, F R Hawkes, D L Hawkes, N D Lourenço, H M
Pinheiro and W Delée, J. Chem. Technol. Biotechnol., 74(1999) 1009.
4. W G Kuo, Water Res., 26 (1992) 881. 5. A Uygur and E Kök, J.S.D.C., 115 (1999) 350. 6. M R Hoffman, S T Martin, W Choi and D W Bahnemann,
Chem. Rev., 95 (1995) 69. 7. D F Ollis, in Photochemical Conversion and Storage of Solar
Energy, Eds E Pelizzetti and M Schiavello (Dordrecht: KluwerAcademic Publishers, 1991).
8. H Lachheb, E Puzenat, A Houas, M Ksibi, E Elaloui, CGuillard and J M Herrmann, Appl. Catal., B, 39 (2002) 75.
9. I A Balcioglu, I Arslan and M Sacan, Environ. Technol., 22(2001) 813.
10. C M So, M Y Cheng, J C Yu and P K Wong, Chemosphere,46 (6) (2002) 905.
11. C Lizama, M C Yeber, J Freer, J Baeza and H D Mansilla, WaterSci. Technol., 44 (2001) 197.
12. L Sánchez, J Peral and X Domènech, Appl. Catal., B, 19(1998) 59.
13. I Arslan and I A Balcioglu, J. Chem. Technol. Biotechnol., 76(2001) 53.
14. I Arslan, I A Balcioglu and D W Bahnemann, Water Res., 36(2002) 1143.
15. J Pignatello, Environ. Sci. Technol., 26 (1992) 944.16. M Neamtu, I Simiceanu, A Yediler and A Kettrup, Dyes
Pigm., 53 (2002) 93.17. A M El-Dein, J A Libra and U Wiesmann, Water Sci. Technol.,
44 (2001) 295.18. H-Y Shu, C-R Huang and M-C Chang, Chemosphere, 29 (12)
(1994) 2597.19. E G Solozhenko, N M Soboleva and V V Goncharuk, Water
Res., 29 (1995) 2206.20. M Pérez, F Torrades, X Domènech and J Peral, Water Res.,
36 (2002) 2703.21. M Pérez, F Torrades, J A Garcia-Hortal, X Domènech and J
Peral, Appl. Catal., B, 36 (2001) 63.22. E Chamarro, A Marco and S Esplugas, Water Res., 35 (2001)
1047.23. N H Ince and G Tezcanli, Water Sci. Technol., 40 (1999) 183.24. J Kiwi, C Pulgarin and P Peringer, Appl. Catal., B, 3 (1994)
335.25. A Safarzadeh-Amiri, J R Bolton and S R Cater, J. Adv. Oxid.
Technol., 1 (1996) 18.26. R Bauer and H Fallman, Res. Chem. Intermed., 23 (1997) 341.27. S H Bossmann, E Oliveros, S Göb, S Siegwart, E P Dahlen,
L Payawan, M Straub, M Wörner and A M Braun, J. Phys.Chem., 102 (1998) 5542.
28. J Pignatello, D Liu and P Huston, Environ. Sci. Technol., 33(1999) 1832.
29. APHA-AWWA-WPCF: Standard Methods for the Examinationof Water and Wastewater, ASTM D1252-00, 17th Edn(Washington: ASTM, 1985).
30. C Kormann, D W Bahnemann and M R Hoffmann, Environ.Sci. Technol., 22 (5) (1988) 798.
31. Test No. 302B, OECD Guidelines for Testing of Chemicals,Vol. 2 (Paris: OECS, 1996).
32. S Malato, personal communication (2003).33. R M C Silverstein, G C Bassler and T C Morrill,
Spectrophotometric Identification of Organic Compounds(New York: Wiley, 1991).
34. C H Walling, Acc. Chem. Res., 8 (1975) 125.35. S H Lin and C F Peng, Water Res., 28 (1994) 277.36. K A Hislop and J R Bolton, Environ. Sci. Technol., 33 (18)
(1999) 3119.37. E Guivarch, S Trevin, C Lahitte and M A Oturan, Environ.
Chem. Lett., 1 (2003) 38.38. J M Joseph, H Destaillats, H-M Hung and M R Hoffmann, J.
Phys. Chem. A, 104 (2000) 301.
ConclusionsThis study has shown that, once the optimum operatingconditions are established, the Fenton and photo-Fentonprocesses may be suitable methods for the completedecolorisation and mineralisation of effluent generatedduring the textile dyeing and finishing processes. In theFenton treatment, the optimal dose of hydrogen peroxideused to degrade CI Reactive Red 141 and CI Reactive Red238, were 100 and 250 mg/l, respectively. The introductionof artificial and solar light enhanced the Fenton processsignificantly. Particularly good results were obtained whenusing solar-light assisted Fenton treatment, opening up thepossibility of low cost applications. Also, the resultsobtained show that the degradation of the homo-bireactivedye (CI Reactive Red 141) was easier than the hetero-bireactive dye (CI Reactive Red 238).
Moreover, the increase in the biodegradability ratio(expressed as the BOD5/COD ratio) and the fact that no toxicoxidation products were detected during the photo-Fentontreatment have proven that chemical preoxidation allowsthe discharge of pretreated dyehouse effluent to sewagetreatment facilities, as well as the direct disposal of thetreated effluent into natural water bodies, provided that notoxic chemical contribution from other process stages ofthe textile manufacturing plant or dyehouse is expected.
AcknowledgementsThe authors wish to thank Eduardo Puigvehí (Ciba) for thesupply of dyes used in the present work, and also theSpanish government (Ministerio de Ciencia y Tecnología)for financial support (Project PPQ2002-04060-C02-01).
0
0.1
0.4
0.3
0.2
20010050 1500Time, min
?BO
D5/
CO
DCI Reactive Red 141CI Reactive Red 238
20040408_j2204.pmd 7/27/2004, 12:09 PM194

Solar Energy 77 (2004) 573–581
www.elsevier.com/locate/solener
Decolorization and mineralization of commercial reactivedyes under solar light assisted photo-Fenton conditions
Francesc Torrades a, Julia Garc�ıa-Monta~no b, Jos�e Antonio Garc�ıa-Hortal c,Xavier Dom�enech b, Jos�e Peral b,*
a Departament d’Enginyeria Qu�ımica, E.T.S.E.I. de Terrassa, Universitat Polit�ecnica de Catalunya, C/Colom 11,
E-08222 Terrassa, Barcelona, Spainc Departament d’Enginyeria T�extil i Paperera, E.T.S.E.I. de Terrassa, Universitat Polit�ecnica de Catalunya, C/Colom 11,
E-08222 Terrassa, Barcelona, Spainb Departament de Qu�ımica, Edifici Cn, Universitat Aut�onoma de Barcelona, E-08193 Bellaterra, Cerdanyola del Vall�es, Spain
Received 2 December 2003; received in revised form 10 February 2004; accepted 31 March 2004
Available online 17 June 2004
Communicated by: Associate Editor Sixto Malato-Rodr�ıguez
Abstract
The degradation of different commercial reactive dyes: a monoreactive dye (Procion Red H-E7B), an hetero-bire-
active dye (Red Cibacron FN-R) and a Standard Trichromatic System, by using solar light assisted Fenton and photo-
Fenton reaction is investigated. The reaction efficiencies have been compared with the ones obtained for the same
system in the dark or under the assistance of an artificial light source. The use of solar light is clearly beneficial for the
removal of color, aromatic compounds (UV254), total organic carbon (TOC), and the increase of the BOD5/COD ratio.
The possibility of a combined advanced oxidation process (AOP)/biological treatment based on the use of sunlight is
suggested.
� 2004 Elsevier Ltd. All rights reserved.
Keywords: Reactive dyes; Decolorization; Advanced oxidation processes; Solar light; Fenton and photo-Fenton reactions
1. Introduction
Highly colored wastewaters are commonly discarded
by the textile industry worldwide (Grau, 1991). The use
of large amounts of dyestuffs during the dyeing stages of
the textile manufacturing processes is the cause of such
pollution (Georgiou et al., 2002; O’Neill et al., 1999).
Apart from the aesthetic problems created when colored
effluents reach the natural water currents dyes strongly
absorb sunlight, thus impeding the photosynthetic
* Corresponding author. Tel.: +34-93-581-2772; fax: +34-93-
581-2920.
E-mail address: [email protected] (J. Peral).
0038-092X/$ - see front matter � 2004 Elsevier Ltd. All rights reserv
doi:10.1016/j.solener.2004.05.004
activity of aquatic plants and seriously threatening the
whole ecosystem (Kuo, 1992).
Most of the dyes disposed are of non-biodegradable
nature and direct biological treatment of the colored
effluents is not effective (Uygur and K€ok, 1999). Con-sequently, physical or chemical treatments have to be
used to completely degrade the dye, or to produce a
partial degradation solution amenable to a secondary
biological treatment. On the other hand, methods such
as coagulation/flocculation, activated carbon adsorption
and reverse osmosis can only transfer the contaminants
from one phase to another leaving the problem essen-
tially unsolved. Therefore, much attention has been paid
to the development of water treatment techniques that
lead to the complete destruction of the dye molecules.
Due to the high oxidative power of the OH radical (2.8
ed.

574 F. Torrades et al. / Solar Energy 77 (2004) 573–581
V versus NHE), several treatments based on the gener-
ation of such species, and catalogued under the desig-
nation of advanced oxidation processes (AOPs), have
been used for general organic pollutant abatement. The
most frequently used AOPs include: heterogeneous
photocatalytic oxidation (Hoffman et al., 1995; Ollis,
1991; P�erez et al., 1997; Balcioglu et al., 2001; So et al.,2002; Lizama et al., 2001), treatment with ozone (often
combined with H2O2, UVA or both) (S�anchez et al.,1998; Arslan and Balcioglu, 2001; Arslan et al., 2002),
H2O2/UV systems (Georgiou et al., 2002; Neamtu et al.,
2002; El-Dein et al., 2001; Shu et al., 1994), Fenton
(Pignatello, 1992; Kuo, 1992; Balcioglu et al., 2001;
Solozhenko et al., 1995; P�erez et al., 2002; P�erez et al.,2001; Chamarro et al., 2001) and photo-Fenton reac-
tions (Balcioglu et al., 2001; P�erez et al., 2002; Ince andTezcanli, 1999; Kiwi et al., 1994; Safarzadeh-Amiri
et al., 1996).
Although generally effective a common drawback
among AOPs is the requirement of large amounts of
energy and/or chemicals to be spent (Bauer and Fall-
mann, 1997). Of particular importance is the fact that
many of these techniques require consumption of high
energy photons generated by artificial light, being the
economical cost too high for practical applications.
However, photo-Fenton reaction can be driven with low
energy photons in the visible part of the spectrum. Thus,
photo-Fenton processes are a potential low cost AOP
that can be run under solar irradiation (Safarzadeh-
Amiri et al., 1996).
In the generally accepted mechanism of Fenton
reaction, hydroxyl radicals (OH�) are produced by
interaction of H2O2 with ferrous salts:
FeðIIÞ þH2O2 ! FeðIIIÞ þOH� þOH�
ðrate constantÞ ¼ 76:5 lmol�1 s�1 ð1Þ
The rate of degradation of organic pollutants by Fenton
reaction can be increased if an irradiation source is
present. The positive effect of irradiation on the degra-
dation rate is due to the photoreduction of Fe(III) to
Fe(II) ions, a step that produces new OH� radicals and
regenerates Fe(II) ions that can further react with more
H2O2 molecules. The photoreduction of Fe(III) follows
the equation:
FeOH2þ þ hm! Fe2þ þOH� ð2Þ
Fe(OH)2þ being the dominant Fe(III) species in solution
at pH 2–3. On the other hand, it has been proven that
the irradiation of Fe(III) +H2O2 mixtures, enhances the
reaction rate of oxidant production, through the
involvement of high valence Fe intermediates responsi-
ble for the direct attack to the organic matter (Bossmann
et al., 1998; Pignatello et al., 1999). Absorption of visible
light by the complex formed between Fe(III) and H2O2
seems to be the cause of formation of such high valence
Fe-based oxidants.
As organic molecules, dyes can be the target of the
OH� attack and thus, the above described Fenton and
photo-Fenton reactions can be effective techniques for
the removal of such contaminants from water. In this
sense, the purpose of the present work is to characterize
the simultaneous use of solar light and the Fenton and
photo-Fenton reactions for the decolorization and
mineralization of three reactive dyes: a common red dye
with a monochlorotriazine reactive group (Procion red
H-E7B), a last generation red dye of hetero-bireactive
nature with fluorotriazine and vinylsulfone as reactive
groups (Red Cibacron FN-R), and a Standard Tri-
chromatic System. Especial emphasis has been placed in
monitoring the evolution of the biodegradability of the
dyes solutions during the reaction, in order to assess the
possibility of a sequential AOP/biological treatment.
2. Experimental
The commercially available reactive dyestuffs, Pro-
cion Red H-E7B (CI Reactive Red 141), Cibacron Red
FN-R and the components of the Standard Trichro-
matic System were supplied by CIBA. The preparation
of dye solutions before applying Fenton and photo-
Fenton processes was as follows: (a) 0.1000 g of as
received Procion Red H-E7B were dissolved in 1 l of
distilled water to make a dye solution typical of reactive
dye-bath rinse effluents (100 mg l�1). The solution was
adjusted to pH¼ 10.6 by using 6 M NaOH, followed by
heating to 80 �C in a reflux system, where it was kept for6 h to simulate bath-dyeing conditions. The hydrolyzed
dye solution was then cooled to the test temperature,
adjusted to pH¼ 3 with 6 M H2SO4 and stored at 4 �C.(b) The same procedure was used for the preparation of
Cibacron Red FN-R solutions (100 mg l�1). However, to
better simulate bath-dyeing conditions the heating was
kept at 60 �C for 1 h. (c) 43 mg l�1 of Cibacron YellowFN-2R, 43 mg l�1 of Cibacron Red FN-R, and 64.5
mg l�1 of Cibacron Navy FN-B were the concentrations
of three components used in the Standard Trichromatic
System (150.5 mg l�1 of total dye). In this case the
hydrolysis was carried out at 60 �C during 1 h.Analytical grade hydrogen peroxide 33% (m/V) and
FeSO4 Æ 7H2O were purchased from Panreac and were
used as received. Reagent grade H2SO4 and NaOH from
Panreac were used for pH adjustments. Solutions were
prepared with deionized water obtained from a Milli-
pore Milli-Q system.
The Vis/UV-absorption spectra of the dye solutions
were recorded by using a Shimadzu UV-1603 double
beam spectrophotometer. The absorbance of the solu-
tions at the absorption maximum of the dyes in the
visible zone (kmax ¼ 543:5 nm for Procion red H-E7B,

t (min)0 20 40 60 80 100 120
Abs.
0.0
0.4
0.8
1.2
1.6
2.0
DarkBlack lightSunlight
Fig. 1. Evolution of absorption at 254 nm with reaction time of
Procion Red solutions (100 mg l�1) for the three experimental
conditions studied. [Fe(II)]0¼ 10 mg l�1; [H2O2]0¼ 100 mg l�1;pH¼ 3; T ¼ 40 �C.
F. Torrades et al. / Solar Energy 77 (2004) 573–581 575
kmax ¼ 542:5 nm for Cibacron FN-R, and kmax ¼ 553–587.5 for the Standard Trichromatic System), and the
UV254 absorbance (aromatic content) were measured by
using 10 mm light path cells. Total organic carbon
(TOC) of initial and irradiated samples was determined
with a Shimadzu 5000 TOC analyzer. All COD values
were determined by the close reflux colorimetric method
(APHA–AWWA–WPCF, 1985) with a HACH DR-700
apparatus. Biological oxygen demand (BOD5) was per-
formed by means of a Hg free WTW 2000 Oxytop unit
thermostated at 20 �C. Sludge from a conventional
biological wastewater treatment plant was used to pre-
pare the high bacterial concentrations (0.2–0.3 g/l) re-
quired in the Zahn–Wellens tests (ECD, 1996).
Experiments were conducted in cylindrical Pyrex cell
of 130 cm3 capacity. The reaction mixture inside the cell,
consisting of 100 ml of dye sample (100 mg/l) and the
precise amount of Fenton reagent, was continuously
stirred with a magnetic bar. Solar light experiments were
performed during sunny days of July at Universitat
Aut�onoma de Barcelona (45 m above sea level, 41�300N,2�60E). The temperature of the reactor during thoseexperiments rose from approximately 30 to 40 �C at theend of the 2 h. A 6 W Philips black-light fluorescent
lamp was used in the artificial light photo-Fenton
experiments, and the intensity of the incident light inside
the photoreactor, measured employing a uranyl acti-
nometer, was 1.38· 10�9 Einstein s�1.
t (min)0 20 40 60 80 100 120
TOC
(ppm
)
0
2
4
6
8
10
12
14
16
18
DarkBlack lightSunlight
Fig. 2. TOC time course of Procion Red solutions (100 mg l�1)
for the three experimental conditions studied. [Fe(II)]0¼ 10mg l�1; [H2O2]0¼ 100 mg l�1; pH¼ 3; T ¼ 40 �C.
3. Results
The degradation of the three dye solutions studied in
this work was characterized by following two different
experimental parameters: (a) absorption of the solution
at 254 nm in an attempt to envisage the evolution of the
aromatic moieties of the dyes; and (b) total organic
carbon (TOC) in order to detect the possibility of
complete organic matter removal. Also, evolution of the
Vis/UV-absorption spectra with time was recorded for
those experiments carried out with sunlight irradiation,
being this an appropriate way of characterize the dye
color evolutions during the reaction.
3.1. Procion Red
Fig. 1 shows the evolution of the absorbance at 254
nm of a 100 mg l�1 Procion Red solution for three dif-
ferent experimental situations: (a) Fenton reaction in
absence of light; (b) Fenton and photo-Fenton reactions
supported by irradiation with an artificial light source;
and (c) Fenton and photo-Fenton reactions under solar
light irradiation. The concentration of the Fenton re-
agent (10 mg l�1 Fe(II) + 100 mg l�1 H2O2) were chosen
taking into account a previous and detailed study of
Fenton reaction optimization during the degradation of
Procion Red and Cibacron dyes (Torrades et al., in
press). In the three cases there is a noticeable decrease of
the absorbance, specially during the first 5–10 min of the
reactions. Nevertheless, there is also a clear effect
attributable to the presence of light. Indeed, only minor
changes of solution Vis/UV-absorption is observed after
the first 10 min of Fenton reaction in the dark, and at
the end of the reaction time it seems to be stabilized
around 0.96 absorption units, while the use of either
artificial light or sunlight produces a further absorbance
decrease down to an approximated constant value of
0.35 absorption units. Although at 120 min of reaction
both absorbances merge, the decrease is clearly faster
when using sunlight.
Fig. 2 shows the TOC evolution during the experi-
ments of Procion Red degradation shown in Fig. 1. A

576 F. Torrades et al. / Solar Energy 77 (2004) 573–581
fast TOC decrease occurs in the first minutes of reaction,
and a clear positive effect attributable to the presence of
light takes place. Thus, the TOC of the solution
remaining in the dark stabilizes at approximately
12.8± 0.5 mg l�1, while artificial light stabilizes the TOC
at approximately 3.6 ± 0.5 mg l�1. It is noteworthy that
almost complete removal of TOC is achieved in a
maximum of 20 min when using sunlight, an interesting
aspect if solar light is to be used in practical applications
for the support of such reactive systems. It has to be
pointed out that the dye molecule has a triazine moiety
(see Section 1), and it is well known (Pelizzetti et al.,
1992; Huston and Pignatello, 1999) that the minerali-
zation of such structure by HO� attack is difficult and
slow. Thus even in the most favourable cases a
remaining TOC should have been expected in solution at
the end of the reaction. The reason of the absence of
TOC is of analytical nature. The initial TOC of the dye
solutions were around 18 ppm, and the limit of detection
of the TOC analyzer (low sensibility mode) was 1 ppm.
On the other hand the dye molecule has 52 carbons
(empirical formula C52H34O26S8Cl2N14), and even if all
the organic carbon derived from the triazine moiety re-
mains in solution at the end of the reaction, the corre-
sponding TOC content would have been difficult to
detect (around 1 ppm).
The evolution of the absorption spectra of Procion
Red with time of reaction under solar light irradiation is
shown in Fig. 3. As can be seen the large band of
adsorption in the visible region, responsible of the col-
ored character of the dye, completely disappears in less
than 15 min. In fact, the visual analysis of the reaction
indicated that the solution was colorless after the first 5
min of reaction. A remaining absorption in the UV re-
Fig. 3. Transient spectra of Procion Red solutions (100 mg l�1)
for the reaction carried out under solar light irradiation. The
numbers indicate the reaction time (minutes) when the spectra
were recorded. [Fe(II)]0¼ 10 mg l�1; [H2O2]0¼ 100 mg l�1;
pH¼ 3; T ¼ 40 �C.
gion is indicative of the presence of some chemical that
has a slow decay in the presence of light. The use of
sunlight and Fenton reagents is, thus, an effective way of
eliminating color in waters polluted with Procion Red
dye.
3.2. Cibacron Red
As in the case of Procion Red the time course of
absorbance at 254 nm of 100 mg l�1 Cibacron Red
solutions were registered in the dark, under black light
irradiation, and in the presence of sunlight. Fig. 4 shows
the corresponding data. Again, as in the case of Procion
Red, Cibacron Red absorbance in the dark during the
first 20 min of reaction rapidly decreases and it remains
stabilized at approximately 0.55 absorption units. The
presence of light produces a further absorbance de-
crease, that is faster when sunlight is used as photon
source. In both cases, artificial and natural light, the
absorption stabilizes around 0.6 absorption units. It is
also noteworthy the initial increase of absorbance ob-
served when the reaction takes place in presence of light,
specially in the case of solar light irradiation. As it will
be discussed later this effect could be assigned to the
absorbance of Fe(II) and H2O2 added in solution.
Fig. 5 shows data of TOC degradation in three
experimental conditions used for Cibacron Red degra-
dation. Again, the best scenario is attained when com-
bining the Fenton reagents and sunlight, with almost
complete TOC removal taking place in less than 50 min
(see discussion above about the possible existence of non
detected triazine mineralization products in solution).
The assistance with black light can also lead the reactive
system to a TOC level close to zero but in a much longer
time (>100 min). The dark Fenton reaction alone is not
t (min)0 20 40 60 80 100 120
Abs.
0
1
2
3
DarkBlack lightSunlight
Fig. 4. Evolution of absorption at 254 nm with reaction time
for Cibacron Red solutions (100 mg l�1) for the three experi-
mental conditions studied. [Fe(II)]0¼ 10 mg l�1; [H2O2]0¼ 250mg l�1; pH¼ 3; T ¼ 40 �C.

t (min)0 20 40 60 80 100 120
Abs.
0
1
2
3
SunlightDarkBlack light
Fig. 7. Evolution of absorption at 254 nm with reaction time of
the Standard Trichromatic System solutions (150 mg l�1) for the
three experimental conditions studied. [Fe(II)]0¼ 10 mg l�1;[H2O2]0¼ 250 mg l�1; pH¼ 3; T ¼ 40 �C.
t (min)0 20 40 60 80 100 120
TOC
(ppm
)
0
5
10
15
20
25
30
DarkBlack lightSunlight
Fig. 5. TOC time course of Cibacron Red solutions (100
mg l�1) for the three experimental conditions studied.
[Fe(II)]0¼ 10 mg l�1; [H2O2]0¼ 250 mg l�1; pH¼ 3; T ¼ 40 �C.
F. Torrades et al. / Solar Energy 77 (2004) 573–581 577
powerful in terms of TOC removal and only 25% of the
solution organic content is mineralized after 110 min,
when the reaction seems to have finished.
The evolution of absorption spectra of Cibacron Red
with time of reaction when using solar light is shown in
Fig. 6. Like in the case of Procion Red the large
absorbance band in the visible region is completely re-
moved at the end of the reaction. However, in this case
the band decrease is slower, and after 15 min the dye
solution still has a noticeable color. The strong
absorption of the dye in the UV region also decreases
and a residual absorption remains for long reaction
times. The shape of the absorption bands in this region
resemble the ones observed in the case of long reaction
times of Procion Red degradation.
Fig. 6. Transient spectra of Cibacron Red solutions (100
mg l�1) for the reaction carried out under solar light irradiation.
The numbers indicate the reaction time (minutes) when the
spectra were recorded. [Fe(II)]0¼ 10 mg l�1; [H2O2]0¼ 250mg l�1; pH¼ 3; T ¼ 40 �C.
3.3. Standard Trichromatic System
The Standard Trichromatic System was chosen as
model mixture of dyes that is widely used in the textile
industry. Similar results were obtained if compared to
the reactions with Procion Red and Cibacron Red
solutions. The evolution of the absorbance at 254 nm
with time is shown in Fig. 7. Again the simultaneous use
of Fenton reagents and sunlight is an effective way of
decreasing absorbance. In this case the system based on
artificial light gives similar reaction rates, and very close
levels of final absorbance are obtained with artificial and
natural light. The dark reaction is the less efficient one,
with a fast absorbance decrease in the first 20 min and a
very slow decrease for longer reaction times. With this
t (min)0 20 40 60 80 100 120 140
TOC
(ppm
)
0
10
20
30
40
50
60
Black lightSunlightDark
Fig. 8. TOC time course of Standard Trichromatic System
solutions (150 mg l�1) for the three experimental conditions
studied. [Fe(II)]0¼ 10 mg l�1; [H2O2]0¼ 250 mg l�1; pH¼ 3;T ¼ 40 �C.

578 F. Torrades et al. / Solar Energy 77 (2004) 573–581
dye mixture an initial absorbance increase is detected in
the three experimental situations, the three of them
being of similar magnitude.
The time course of TOC follows the same efficiency
order: sunlight reaction>black light reaction>dark
reaction (see Fig. 8). The TOC removal at the end of the
dark reaction is discrete (35–40%), and it is noteworthy
that, in this case, the solar light assisted reaction is not
powerful enough as to completely remove TOC. A
residual TOC content of approximately 9 ± 0.5 mg l�1
remains in solution after 120 min of reaction.
Finally, the evolution with time of the absorption
spectra of the Standard Trichromatic System is shown in
Fig. 9. In this case the absorption band that occupies the
Fig. 9. Transient spectra of Standard Trichromatic System
solutions (150 mg l�1) for the reaction carried out under solar
light irradiation. The numbers indicate the reaction time
(minutes) when the spectra were recorded. [Fe(II)]0¼ 10 mg l�1;[H2O2]0¼ 250 mg l�1; pH¼ 3; T ¼ 40 �C.
time / m0 20 40 60 80 10
BOD
/CO
D
0.0
0.1
0.2
0.3
0.4
Fig. 10. Time course of the BOD5/COD ratio and COD of 250 mg l�1
irradiation. [Fe(II)]0¼ 10 mg l�1; [H2O2]0¼ 125 mg l�1; pH¼ 3; T ¼ 2
visible region from 400 to almost 700 nm also disap-
pears, although taking more than 15 min for that (color
disappearance). The absorption in the UV region de-
creases to a final shape and intensity that resembles
those of Procion Red and Cibacron Red. The fact that
the residual absorbance in the UV region, where both
H2O2 and Fe aqueous species absorb, are similar for the
three dye systems studied here indicates that the residual
absorbance at 254 nm is caused by the presence of
remaining concentrations of Fenton reagents.
3.4. Biodegradability assays
One interesting alternative that is gaining importance
among the potential techniques for non-biodegradable
or toxic wastewater treatment is the combination of an
AOP with a subsequent biological step. In this way the
use of the AOP, the expensive part of the global pro-
cedure, is reduced to the attainment of a non-toxic and/
or biodegradable solution, being the rest of the organic
matter removed in the biological step. Since the dyes
chosen in this study are of non-biodegradable nature
(Zahn–Wellens tests were carried out to confirm this
point) the above mentioned combination of treatments
could be used to degrade them in aqueous solution. The
key question concerning the combined use of an AOP
and a biological treatment is to probe that the dye
biodegradability and, particularly, the BOD5/COD ratio
increases during the AOP, approaching the value 0.4
that is considered the quantitative index for organic
matter complete biodegradability (Scott and Ollis,
1995). Thus, BOD5 and COD analysis of the treated
Procion Red and Cibacron Red solutions were carried
out in order to characterize the evolution of the BOD5/
COD ratio. The experiments were carried out by using
the artificial light source, although attending to the data
in0 120 140 160 180
CO
D /
mgl
-1 O
2
0
40
80
120
160
200BOD/COD Procion RedBOD/COD Cibacron RedCOD Procion RedCOD Cibacron
of Procion Red and Cibacron Red solutions under artificial light
5 �C.

F. Torrades et al. / Solar Energy 77 (2004) 573–581 579
reported so far, similar or even more favourable situa-
tions are expected when using solar light. It is also
noteworthy that, in order to have reproducible BOD5results the experiments were carried out with a larger
initial dye concentration (250 mg l�1) and thus, much
longer reaction times are expected for the achievement
of the same levels of TOC removal shown in Figs. 2 and
5. As can be seen in Fig. 10 the BOD5/COD ratio in-
creases with the reaction time, attaining values above 0.3
in the case of Procion Red and 0.2 in the case of Ciba-
cron Red. Although these values are not above 0.4 they
indicate an effective increase of biodegradability and,
consequently, a possible coupling of solar assisted pho-
to-Fenton Reaction with biological treatment.
4. Discussion
The consideration of the experimental data presented
in the above section indicates a series of features ex-
pected for a Fenton based reaction. In this way, the
absorbance at 254 nm of the three dye solutions always
suffers a fast initial decrease, even in the dark, followed
by a much slower disappearance. This can be explained
with the large value of the Fenton reaction rate constant
(Eq. (1), k ¼ 76:5 lmol�1 s�1). Under the experimentalconditions described here the initial 10 mg l�1 of Fe(II)
added to the solution would take only few seconds to
completely oxidize to Fe(III) generating the corre-
sponding stoichiometric amount of hydroxyl radicals. Is
this initial amount of oxidant the one that causes the fast
attack to the dye molecules causing a fast decoloration,
as seen in Figs. 3, 6 and 9, along with a fast loss of the
aromatic character of the dye. As indicated by several
authors (Guivarch et al., 2003; Joseph et al., 2000) the
attack of the hydroxyl radical to this family of dye
molecules begins with the azo bond cleavage (loss of
color) and it is followed by the hydroxylation of the
aromatic ring (loss of absorbance at 254 nm). This
mechanism leads to the production of sulfonated aro-
matic amines, carboxylic acids, quinones, CO2, and
other minority intermediates. On the other hand, this
initial high reactivity is not enough to produce impor-
tant changes of TOC since the complete mineralization
of all carbons present in a dye molecule is a more
complex process that needs the participation of larger
amounts of oxidants and more time of reaction.
Once the initial Fe(II) has been consumed the process
is controlled by the capability of the photo-Fenton
reaction to regenerate it (Eq. (2)). Thus, a cycle where
Fe(II) is consumed and regenerated is established, being
the rate of the process controlled by the slower photo-
Fenton reaction. That is the reason of the slower de-
crease of absorbance at 254 nm observed for the three
dyes after the first minutes of reaction. In the dark
reaction the photo-Fenton process takes not place, and
the only way to recover Fe(II) is the so-called Fenton
like reaction (Pignatello, 1992):
Fe3þ þH2O2 $ FeOOH2þ þHþ
Keq ðequilibrium constantÞ ¼ 3:1 10�3 lmol�1 s�1
ð3Þ
Fe–OOH2þ ! HO�
2 þ Fe2þ k ¼ 2:7 10�3 s�1 ð4Þ
Fe3þ þHO�
2 ! Fe2þ þO2 þHþ
k < 2 103 lmol�1 s�1 ð5Þ
This is also a slow process that has only practical
importance when large amounts of H2O2 are present in
solution. This is not the present case where the con-
centration of H2O2 chosen is adjusted to the stoichi-
ometric value needed for complete dye mineralization
(e.g., COD of the Procion Red solution before reaction
is approx. 50 mg l�1). In consequence, the absorbance at
254 nm shows a very slow change with dark reaction
time, and TOC is almost constant for long reaction
times in the three dye solutions.
The presence of light is essential to maintain, through
the photo-Fenton reaction, a continuous removal of the
dye color and aromatic character. At this point it is
important to differentiate between the results obtained
with the artificial light source and the solar light. In al-
most all the experiments described above solar light gave
more efficient degradation of the dyes than the artificial
light. The wavelengths needed for the photo-Fenton
reaction range from the UV up to 400 nm. The black
light used was chosen because it gives a single emission
band centred at 350 nm and having photons in the 300–
400 nm range. It is a low power consumption lamp (6
W) that produces an output of photons that entirely
matches the absorption requirements of the photo-
Fenton reaction, and it seemed to be the most efficient
light source in terms of active photons produced/energy
consumed. As already mentioned in the experimental
section the number of photons arriving to the reactor
with such a lamp was 1.38· 10�9 Einstein s�1, and asimple calculation based on this number, the reactor
geometry, and the lamp emission spectrum permitted to
estimate a total power of luminous energy entering the
reactor of 1.3· 10�4 W cm�2. This is one order of mag-nitude below of the yearly averaged solar energy be-
tween 300 and 400 nm arriving to the earth surface in the
south of Spain (around 3–4 · 10�3 W cm�2, Malato,2003). Thus, the higher efficiency observed with the use
of sunlight is basically due to the higher number of
photons supplied by the sun. More powerful artificial
light sources could have been tested but at the price of
an increasing energy consumption. The good results
obtained with sunlight along with the low economic cost
and the lower environmental impact associated to the

580 F. Torrades et al. / Solar Energy 77 (2004) 573–581
use of this renewable energy source make the technique
very appealing from the point of view of a real appli-
cation.
Another aspect that has to be discussed is the
remaining absorbance at 254 nm observed for the three
dyes even when solar light is used. This can be explained
by considering that H2O2 and several aqueous com-
plexes of Fe absorb photons of this wavelength. It is
obvious that the 10 mg l�1 of Fe(II) initially added to the
solutions are still present at the end of the reactions,
most probably in the form of Fe(III). On the other hand,
the presence of residual amounts of H2O2 was proven by
simple titration with standard KI solutions, basically for
the correction of the COD values obtained. H2O2 con-
centrations from 5 to 20 mg l�1 were found at the end of
all the experiments. Also, due to the toxic character of
H2O2 its removal with SO2�3 was found to be necessary
before the BOD5 analysis, since the microorganisms
used in this technique cannot endure the presence of the
oxidant. As pointed out in the previous section simi-
larities exist between the residual absorption spectra
observed in Figs. 3, 6 and 9, similarities that are also a
probe of the similarities of the chemical species
remaining in solution at the end of the three dyes deg-
radation. Since complete TOC removal is observed in
several of the experiments, these remaining species are
not of organic nature, a fact that indicates that residual
H2O2 and Fe species are the responsible for the observed
absorption. Finally, another experimental observation
that would be in agreement with the absorptive char-
acter of the Fenton reagents is the increase of absor-
bance at 254 nm that takes place at the beginning of
several of the experiments (see Figs. 1, 4 and 7), when
the addition of H2O2 and Fe(II) has just taken place,
although this could also be due to organic complexes
with iron, intermediates that have increased extinction
coefficients, etc.
It is important to remark that, due to the unspecific
character of the absorption at 254 nm as a reaction
quantification parameter, care has been taken and only
qualitative considerations have been made from such
data.
5. Conclusions
The solar light assisted Fenton and photo-Fenton
reactions have shown to efficiently decolorize and min-
eralize aqueous solution of three dyes commonly used in
the textile dyeing and finishing industry: Procion Red,
Cibacron FN-R, and a Standard Trichromatic System.
The data has been compared with the degradations
carried out in the dark and under an artificial light
source, the use of sunlight always giving the best results.
The solar photons help to accelerate the loss of the
aromatic character of the dyes, as seen by following the
change of absorbance at 254 nm. In parallel, there is a
mineralization process, and TOC removal of Procion
Red and Cibacron Red below the detection limit of the
analytical technique take place in 20 and 45 min,
respectively. The loss of color is also fast: Procion Red is
decolorized in less than 15 min, while for the Standard
Trichromatic System the process takes no more than 30
min. The ratio BOD5/COD increases with time indicat-
ing that a partial treatment of the dye solutions increases
their biodegradability and the possibility of a combined
treatment based on a previous solar assisted chemical
oxidation and a subsequent biological degradation. In
any case, the use of the solar energy to drive this type of
reactive systems in advantageous, specially if compared
to the use of an artificial light source.
Acknowledgements
The authors want to thank the Spanish Government
(Ministerio de Ciencia y Tecnolog�ıa) for the financialsupport (Project PPQ2002-04060-C02-01).
References
APHA–AWWA–WPCF, 1985. Standard Methods for the
Examination of Water and Wastewater. ASTM D1252-00,
17 ed. Washington, DC.
Arslan, I., Balcioglu, I.A., 2001. Advanced oxidation of raw
and biotreated textile industry wastewater with O3, H2O2/
UV-C and their sequential application. J. Chem. Technol.
Biotechnol. 76, 53–60.
Arslan, I., Balcioglu, I.A., Bahnemann, D.W., 2002. Advanced
oxidation of a reactive dyebath effluent: comparison of O3,
H2O2/UV-C and TiO2/UV-A processes. Water Res. 36,
1143–1154.
Balcioglu, I.A., Arslan, I., Sacan, M., 2001. Homogeneous and
heterogeneous advanced oxidation of two commercial
reactive dyes. Environ. Technol. 22, 813–822.
Bossmann, S.H., Oliveros, E., G€ob, S., Siegwart, S., Dahlen,
E.P., Payawan, L., Straub, M., W€orner, M., Braun, A.M.,
1998. New evidence against hydroxyl radicals as reactive
intermediates in the thermal and photochemically enhanced
Fenton reactions. J. Phys. Chem. 102, 5542–5550.
Bauer, R., Fallmann, H., 1997. The photo-Fenton oxidation––a
cheap and efficient wastewater treatment method. Res.
Chem. Intermed. 23, 341–354.
Chamarro, E., Marco, A., Esplugas, S., 2001. Use of the
Fenton reagent to improve organic chemical biodegradabil-
ity. Water Res. 35, 1047–1051.
ECD Guidelines for Testing of Chemicals, 1996, vol. 2, Test
302B.
El-Dein, A.M., Libra, J.A., Wiesmann, U., 2001. Kinetics of
decolorization and mineralization of the azo dye Reactive
Black 5 by hydrogen peroxide and UV light. Water Sci.
Technol. 44, 295–301.

F. Torrades et al. / Solar Energy 77 (2004) 573–581 581
Georgiou, D., Melidis, P., Aivasidis, A., Gimouhopoulos, K.,
2002. Degradation of azo-reactive dyes by ultraviolet
radiation in the presence of hydrogen peroxide. Dyes
Pigments 52, 69–78.
Grau, P., 1991. Textile industry wastewater treatment. Water
Sci. Technol. 24, 97–103.
Guivarch, E., Trevin, S., Lahitte, C., Oturan, M.A., 2003.
Degradation of azodyes in water by electro-Fenton process.
Environ. Chem. Lett. 1, 38–44.
Hoffman, M.R., Martin, S.T., Choi, W., Bahnemann, D.W.,
1995. Environmental applications of semiconductor photo-
catalysis. Chem. Rev. 95, 69–96.
Huston, P.L., Pignatello, J.J., 1999. Degradation of selected
pesticide active ingredients and commercial formulations in
water by the photo-assisted Fenton reaction. Water Res. 33,
1238–1246.
Ince, N.H., Tezcanli, G., 1999. Treatability of textile dye-bath
effluents by advanced oxidation: preparation for reuse.
Water Sci. Technol. 40, 183–190.
Joseph, J.M., Destaillats, H., Hung Hui-Ming, Hoff-
mann, M.R., 2000. The sonochemical degradation of
azobenzene and related azo dyes: rate enhancements
via Fenton’s reactions. J. Phys. Chem. A 104,301–
307.
Kiwi, J., Pulgarin, C., Peringer, P., 1994. Effect of Fenton and
photo-Fenton reactions on the degradation and biodegrad-
ability of 2 and 4-nitrophenols in water treatment. Appl.
Catal. B: Environ. 3, 335–350.
Kuo, W.G., 1992. Decolorizing dye wastewater with Fenton’s
reagent. Water Res. 26, 881–886.
Lizama, C., Yeber, M.C., Freer, J., Baeza, J., Mansilla, H.D.,
2001. Reactive dyes decolouration by TiO2 photo-assisted
catalysis. Water Sci. Technol. 44, 197–203.
Malato, S., 2003. Plataforma Solar de Almer�ıa, Personal
communication.
Neamtu, M., Simiceanu, I., Yediler, A., Kettrup, A., 2002.
Kinetics of decolorization and mineralization of reactive azo
dyes in aqueous solution by the UV/H2O2 oxidation. Dyes
Pigments 53, 93–99.
Ollis, D.F., 1991. Solar-assisted photocatalysis for water
purification: issues, data, questions. Photochem. Convers.
Storage Sol. Energy, Proc. Int. Conf., 8th.
O’Neill, C., Hawkes Freda, R., Hawkes Dennis, L., Lourenc�oNidia, D., Pinheiro Helena, M., Del�ee, W., 1999. Colour intextile effluents––sources, measurement, discharge consents
and simulation: a review. J. Chem. Technol. Biotechnol. 74,
1009–1018.
Pelizzetti, E., Carlin, V., Minero, C., Pramauro, E., Vincenti,
M., 1992. Degradation pathways of atrazine under solar
light and in the presence of titanium oxide colloidal
particles. Sci. Total Environ. 161, 123–124.
P�erez, M., Torrades, F., Garcia-Hortal, J.A., Dom�enech, X.,
Peral, J., 1997. Removal of organic contaminants in paper
pulp treatment effluents by TiO2 photocatalyzed oxidation.
J. Photochem. Photobiol. A: Chem. 109, 281–286.
P�erez, M., Torrades, F., Garcia-Hortal, J.A., Dom�enech, X.,
Peral, J., 2001. Removal of organic contaminants in paper
pulp treatment effluents under Fenton and photo-Fenton
conditions. Appl. Catal. B: Environ. 36, 63–74.
P�erez, M., Torrades, F., Dom�enech, X., Peral, J., 2002. Fenton
and photo-Fenton oxidation of textile effluents. Water Res.
36, 2703–2710.
Pignatello, J., 1992. Dark and photoassisted Fe3þ catalyzed
degradation of chlorophenoxy herbicides by hydrogen
peroxide. Environ. Sci. Technol. 26, 944–951.
Pignatello, J., Liu, D., Huston, P., 1999. Evidence for an
additional oxidant in the photoassisted Fenton reaction.
Environ. Sci. Technol. 33, 1832–1839.
Safarzadeh-Amiri, A., Bolton, J.R., Cater, S.R., 1996. The use
of iron in advanced oxidation processes. J. Adv. Oxid.
Technol. 1, 18–26.
S�anchez, L., Peral, J., Dom�enech, X., 1998. Aniline degradation
by combined photocatalysis and ozonation. Appl. Catal. B:
Environ. 19, 59–65.
Scott, J.P., Ollis, D.F., 1995. Environ. Progr. 14, 88–103.
Shu, H.Y., Huang, C.R., Chang, M.C., 1994. Decolorization of
mono-azo dyes in wastewater by advanced oxidation
processes: a case of study of Acid Red 1 and Acid Yellow
23. Chemosphere 29, 2597–2607.
So, C.M., Cheng, M.Y., Yu, J.C., Wong, P.K., 2002. Degra-
dation of azo dye Procion Red MX-5B by photocatalytic
oxidation. Chemosphere 46, 905–912.
Solozhenko, E.G., Soboleva, N.M., Goncharuk, V.V., 1995.
Decolourization of azodye solutions by Fenton’s oxidation.
Water Res. 29, 2206–2210.
Torrades, F., Garc�ıa-Monta~no, J., Garc�ıa-Hortal, J.A., N�u~nez,
L., Dom�enech, X., Peral, J., in press. Decolourization and
mineralization of monoreactive and hetero-bireactive dyes
under Fenton and photo-Fenton conditions. Coloration
Technology, accepted for publication.
Uygur, A, K€ok, E., 1999. Decolorisation treatments of azo dyewaste waters including dichlorotriazinyl reactive groups by
using advanced oxidation method. J. Soc. Dyers Colour
115, 350–354.

Journal of Hazardous Materials B134 (2006) 220–229
Degradation of Procion Red H-E7B reactive dye by couplinga photo-Fenton system with a sequencing batch reactor
Julia Garcıa-Montano a, Francesc Torrades b, Jose A. Garcıa-Hortal c,Xavier Domenech a, Jose Peral a,∗
a Departament de Quımica, Edifici Cn, Universitat Autonoma de Barcelona, E-08193 Bellaterra, Barcelona, Spainb Departament d’Enginyeria Quımica, ETSEI de Terrassa (UPC), C/Colom, 11, E-08222 Terrassa, Barcelona, Spain
c Departament d’Enginyeria Textil i Paperera, ETSEI de Terrassa (UPC), C/Colom, 11, E-08222 Terrassa, Barcelona, Spain
Received 12 September 2005; received in revised form 27 October 2005; accepted 1 November 2005Available online 15 December 2005
Abstract
A bench-scale study combining photo-Fenton reaction with an aerobic sequencing batch reactor (SBR) to degrade a commercial homo-bireactivedye (Procion Red H-E7B, 250 mg l−1) was investigated. The photo-Fenton process was applied as a pre-treatment, avoiding complete mineralisation,jwHaB©
K
1
iaadseurmr
dtc
0d
ust to obtain a bio-compatible water able to be treated by means of the SBR in a second step. In this sense, different Fenton reagent concentrationsere assessed by following dye solution biodegradability enhancement (BOD5/COD), as well as the toxicity (EC50), DOC, colour (Abs543.5) and2O2 evolution with photo-Fenton irradiation time. Obtained pre-treated solutions were biologically oxidized in a SBR containing non-acclimated
ctivated sludge. Different hydraulic retention time (HRT) in the bioreactor were tested to attain the maximum organic load removal efficiency.est results were obtained with 60 min of 10 mg l−1 Fe(II) and 125 mg l−1 H2O2 photo-Fenton pre-treatment and 1 day HRT in SBR.2005 Elsevier B.V. All rights reserved.
eywords: Textile reactive dye; Advanced oxidation processes; Photo-Fenton reaction; Biodegradability enhancement; Sequencing batch reactor; Organic removal
. Introduction
The textile industry daily consumes large quantities of watern dyeing and finishing processes. Generated effluents are char-cterized by a high content of suspended solids and heavy met-ls, high temperature, unstable pH, elevated chemical oxygenemand and the presence of chlorinated organic compounds,urfactants and colour [1]. The substantial amount of dyes,specially reactive dyes, used in the dyeing stage of textile man-facturing supposes an increasing environmental threat due to itsefractory nature. Therefore, it is necessary to find an effectiveethod of wastewater treatment, both in terms of limited water
ecourses management and the need for nature preservation.At present, several methods have been developed to treat
ye wastewater. Physicochemical treatments such as coagula-ion/flocculation, flotation, membrane processes or activatedarbon adsorption are common practices [2–5], but they are
∗ Corresponding author. Tel.: +34 93 581 2772; fax: +34 93 581 2920.E-mail address: [email protected] (J. Peral).
quite inefficient and result in a phase transfer of pollutants,leaving the problem unsolved. On the other hand, single bio-logical treatments, the most economical and environmentallyfriendly ones, are not a suitable alternative when working withtoxic and/or non biodegradable wastewaters [6]. In fact, mostof disposed dyes are of non-biodegradable nature and standardbiological treatment of their coloured effluents is not effective[7].
Therefore, destructive treatment methods for the remedia-tion of recalcitrant or hazardous pollutants are currently underinvestigation. In this direction, Advanced Oxidation Processes(AOPs), based on the generation of highly reactive hydroxyl rad-icals (HO•, E = 2.8 V versus NHE) as primary oxidant, appear asthe emerging alternatives for the organic pollutants abatement[8]. Among them, the Fenton and photo-Fenton type reactionsare very promising since they achieve high reaction yields witha low treatment cost [9]. Fenton and photo-Fenton methods havebeen successfully applied to treat reactive dyes [10,11] as wellas textile effluents [12,13].
In the accepted mechanism of Fenton reaction [14], hydroxylradicals (HO•) are generated by interaction of H2O2 with ferrous
304-3894/$ – see front matter © 2005 Elsevier B.V. All rights reserved.oi:10.1016/j.jhazmat.2005.11.013

J. Garcıa-Montano et al. / Journal of Hazardous Materials B134 (2006) 220–229 221
salts [reaction (1)]:
Fe(II) + H2O2 → Fe(III) + HO• + HO−
k = 76.5 l mol−1 s−1 (1)
Then, Fe(III) can be reduced by reaction with exceeding H2O2to form again ferrous ion and more radicals. This second processis called Fenton-like, is slower than Fenton reaction and allowsFe(II) regeneration giving place to a catalytic mechanism [reac-tions (2)–(4)]:
Fe(III) + H2O2 � FeOOH2+ + H+ Keq = 3.1 × 10⁻³ (2)
FeOOH2+ → HO•2 + Fe(II) k = 2.7 × 10⁻³ s−1 (3)
Fe(III) + HO•2 → Fe(II) + O2 + H+
k < 2 × 10³ l mol−1 s−1 (4)
Degradation of the organic pollutants in the Fenton reactioncan increase in presence of an irradiation source (photo-Fentonreaction). In this case, the regeneration of Fe(II), with productionof new HO• radicals, follows a photoreduction process [reac-tions (5) and (6)]:
Fe(III) + H2O → FeOH2+ + H+ (5)
F
psNdmsp
sefieo
r
design, mainly because of its simplicity, flexibility of opera-tion, as well as cost effectiveness [23,24]. In this sense, SBRis considered an attractive alternative to conventional biolog-ical wastewater treatment systems, but with a unique tankfor reaction and sedimentation stages. Therefore, in a con-trolled time sequence, usually SBR-type bioreactors operateunder five defined phases: filling, aeration-reaction, activatedsludge settling, draw and idle. With respect to applications,SBRs have been successfully employed in the biodegradationof both municipal and industrial wastewaters [25], as well asfor the degradation of textile wastewaters in combined systems[18].
Accordingly, it is clear from the above discussion that SBRis an appropriate alternative in the combined AOP-biologicaltreatment of the wastewaters studied here. In the present work,a representative reactive dyestuff employed in cellulosic fibredyeing (Procion Red H-E7B) is taken as a model compound. Thepaper aims at more efficient use of chemical oxidants to carryout the photo-Fenton pre-treatment. In this sense, an importantindicator of the pre-treatment effectiveness will be the increaseof the biodegradability under minimum Fenton reagent doses.Subsequently, different photo-treated dye solutions will be fed tothe SBR to evaluate the best photo-Fenton conditions. Moreover,the hydraulic retention time needed to obtain maximum organicload removal in the bioreactor is studied.
2
2
ECwcimcbt8af
ture o
eOH2+ hυ−→Fe(II) + HO• λ = 410 nm (6)
Since the reaction requires radiations up to 410 nm [15],hoto-Fenton reaction offers the possibility to be driven underolar irradiation, becoming a cost-effective process [16,17].evertheless, Fenton and photo-Fenton methods have somerawbacks: necessity of pH changes, sludge generation and,ainly, high operational costs due to the chemical reagents con-
umption. In this sense, chemical oxidation alone can often berohibitive for wastewater treatment.
Recently, several studies have proposed the combination ofingle AOP and biological treatments to avoid the drawbacks ofach other [18–22]. With this aim, the AOP is performed as arst step to just enhance the biodegradability and generate a newffluent able to be treated in a biological plant, while reducingperational costs.
The biological treatment is carried out in a sequencing batcheactor (SBR). There are large facilities incorporating the SBR
Fig. 1. Chemical struc
. Experimental
.1. Synthetic dye solution
A commercial homo-bireactive azodye, Procion Red H-7B (C.I. Reactive Red 141, empirical formula C52H34O26S8l2N14), composed of two monochlorotriazine reactive groups,as supplied by DyStar and used as received without any purifi-
ation. The chemical structure of the dye is shown in Fig. 1. Thenitial concentration of Procion Red H-E7B for all the experi-
ents was 250 mg l−1, a value that is among typical dye con-entrations in real textile wastewaters [26]. In order to simulateatch-dyeing conditions, the dye was hydrolysed, by adjustinghe pH of synthetic solutions to 10.6, followed by heating to0 ◦C for 6 h. Finally, the hydrolysed dye solutions were storedt 4 ◦C after pH adjustment between 2.8 and 3.0, being readyor AOP operation.
f Procion Red H-E7B.

222 J. Garcıa-Montano et al. / Journal of Hazardous Materials B134 (2006) 220–229
2.2. Photo-Fenton oxidation reagent
The hydroxyl radical, HO•, was generated in situ by theaddition of the following reagents in aqueous media: hydro-gen peroxide, H2O2, Panreac, 33% (w/v) and ferrous sulphate,FeSO4·7H2O, Merck, 99.5%.
2.3. Photo-chemical reactor
Photo-Fenton oxidation was carried out using a cylindricalPyrex thermostatic cell of 300 ml of capacity (T = 23 ± 1 ◦C),equipped with a magnetic stirrer to provide good mixing withthe defined Fenton reagent inside the reactor. The dye solutionvolume was 250 ml. A 6 W Philips black light fluorescent lamp,which basically emits at 350 nm, was used as artificial lightsource. The intensity of the incident light, measured employ-ing an uranyl actinometer, was 1.38 × 10⁻⁹ Einstein s−1.
2.4. SBR biomass
The bioreactor was seeded with activated sludge coming fromthe recirculation stage of a municipal Wastewater TreatmentPlant, WWTP, in Manresa (Catalonia, Spain). The biomass pop-ulation of the collected activated sludge, usually expressed asvolatile suspended solids (VSS, g l−1) [27], fluctuated within therange 2.85–4.94 g l−1. Then, to perform every experiment withaso
2
bdT2gw
htowAdtvaar
capNs
2.6. Chemical assays
The UV/vis-absorption spectra were recorded by using aShimatzu UV-1603 double beam spectrophotometer in the200–700 nm range. The maximum absorption in the visibleregion (λmax = 543.5 nm) was taken as an estimation of the dyepresence in solution. DOC was determined with a ShimadzuTOC-VCSH analyser with a solution of potassium phthalate asstandard of calibration. Chemical oxygen demand (COD, mg l−1
O2) was assessed by the closed reflux colorimetric method witha HACH DR/2000 spectrophotometer [28]. H2O2 consump-tion was tested by the potassium iodide titration method [29].Accordingly, correction was made in the COD measurementfor residual H2O2 [30]. Determination of total suspended solids(TSS, g l−1) and volatile suspended solids (VSS, g l−1) wascarried out gravimetrically following Standard Methods recom-mendations [28].
2.7. Biological assays
Residual hydrogen peroxide was removed from the solutionwith Catalase (2350 U mg−1; Sigma), according to the follow-ing specifications: 1 U destroys 1 �mol min−1 of hydrogen per-oxide at pH 7 and temperature 25 ◦C. Fe ion (mainly Fe(III)) wasprecipitated before the assays by increasing the pH. The toxic-ity was assessed using the Biotox® technique. According to thesoa
tTto(twotaocolas
(fdtp
tAp[
pproximately the same initial cells concentration, the SBR waseeded by diluting the original activated sludge to a VSS valuef 1 g l−1.
.5. SBR set-up and operation conditions
The biological treatment system was composed of a 2 l aero-ic bench-scale sequencing batch reactor, equipped with an airiffuser and agitation. The operating liquid volume was 1.5 l.emperature was maintained under room conditions, between1 and 23 ◦C, while keeping the concentration of dissolved oxy-en (DO, mg l−1 O2) not lower than 3 mg l−1 O2. Fresh biomassas used for the performance of each run.The SBR operation strategy was as follows: once the
ydraulic retention time was fixed, the bioreactor was fed withhe required sample volume during the filling stage. At the endf the aeration-reaction period, the agitation and the airflowere switched off to allow to settle the activated sludge for 1 h.fterwards, the corresponding volume of treated solution wasecanted from the supernatant during the draw step, accordingo the defined HRT. Finally, the reactor was fed with the sameolume of fresh solution and the aeration-agitation turned ongain. This process was repeated cycle by cycle as many timess necessary to allow cells acclimation and/or to obtain repetitiveesults.
Daily analyses carried out were VSS, DO, dissolved organicarbon (DOC, mg l−1 C) (influent and effluent samples content)nd pH adjustment between 6.5 and 7.5 if necessary. Suitableroportions of essential biological nutrients (MgSO4, CaCl2,H4Cl and NaH2PO4 buffer at pH 7) were also added to the
olution [28].
ample preparation procedure prior to the Biotox® test, the pHf the solutions was adjusted to 7 and solid sodium chloride wasdded in order to adjust salinity to 2%.
The test is based on the determination of the acute toxicityhat the sample has on the marine photobacteria Vibrio fischeri.he toxicity is quantified as the relative decrease of the pho-
obacteria light emission with respect to a sample control thatnly contains the dilution medium, i.e. sodium chloride, 2%w/v). The analysis generates the EC50 parameter (the concen-ration of toxicant that causes a 50% decrease of light emission),hich is determined by interpolation from a series of dilutionsf the original toxicant sample that have been in contact withhe photobacteria during 30 min. A graph is plotted with the x-xis containing % DOC (compared to the total DOC contentf the initial sample) and the y-axis displays the inhibition per-ent. EC50 values were expressed as percentage of DOC of theriginal sample. When the DOC of the original samples wereower than the EC50, these values were given as >100%. Phenolnd glucose solutions were used as standard toxic and non toxicamples to check the technique suitability.
The measurement of biochemical oxygen demand for 5 daysBOD5, mg l−1 O2) was performed by means of a mercury-ree WTW 2000 Oxytop thermostated at 20 ◦C. When BOD5etermination took place during the photo-treatment stage, dueo the toxic character of hydrogen peroxide, its removal with therecise amount of SO3
2− [31] was found to be necessary.The Zahn–Wellens test was carried out under conditions close
o those of a conventional municipal wastewater treatment plant.ctivated sludge coming from the Manresa WWTP was used torepare the 0.2 g l−1 of TSS required in the test specifications32].

J. Garcıa-Montano et al. / Journal of Hazardous Materials B134 (2006) 220–229 223
The experimental set-up to perform the short-term respirom-etry test was composed of a closed and thermostatic 250 mlrespirometer (T = 25 ± 1 ◦C), connected to a dissolved oxygen-meter (Model 407510, EXTECH), an air diffuser and amechanical stirrer. Results were determined as specific oxy-gen uptake rate (OUR, g O2 g−1 VSS min−1) of the sample,while biodegradability was estimated by comparing the oxygendemand (OD, g O2 g−1 VSS) within the first 2 h of reaction withthe oxygen demand of an acetic acid solution (ODst, g O2 g−1
VSS), a completely biodegradable standard with the same CODthan the sample.
3. Results and discussion
3.1. Untreated wastewater characteristics
The parameters employed to characterize the wastewaterwere the DOC, colour (Abs543.5), acute toxicity (EC50) andBOD5/COD index and OD/ODst as biodegradability indicators.Their values in the original dye solution are shown in Table 1.The absorption spectrum of the dye has a large band centred at543.5 nm, responsible of the red colour of the solution.
As seen in Table 1, it is noticeable the low biodegradability ofthe synthetic textile wastewater, expressed as a BOD5 to CODratio. This relation shows that only a 10% of the chemicallyoAtthcaoatPsttbtps(d
TCs
DEBCBO
Fig. 2. Zahn–Wellens assay. DOC evolution of hydrolysed Procion Red H-E7Bsolutions (250 and 125 mg l−1) and the biodegradable standard ethylene glycol(126 mg l−1).
As a complementary assay, respirometric measurementswhere made to provide more information about biomass activ-ity during the reactive dye biodegradation. In agreement withBOD5/COD and Zahn–Wellens biodegradability tests, short-term respirometry test declares the non biodegradability ofuntreated wastewater (Table 1, OD/ODst index).
Finally, results from the acute toxicity assessment of thedyestuff by means of Biotox® assay show that EC50 was greaterthan 100% or >44.96 mg l−1 C (Table 1). This means that theconcentration present in solution did not cause the 50% inhibi-tion of the bacteria. It should be noted that toxicity assays couldbe distorted due to disturbances in luminescence measurementscaused by intensive coloured dye solutions. In this case, it wasnecessary to take into account the lost of light due to absorptionjust applying a correction factor previously determined for everysample dilution.
Based on the above results, we conclude that Procion RedH-E7B is a non toxic but non biodegradable reactive dye. No aer-obic biological treatment would be effective enough to removethe pollutant. Therefore, it could be a suitable compound to carryout the photo-Fenton reaction and biological treatment couplingstrategy.
3.2. Photo-Fenton reaction as a pre-treatment process andbiodegradability enhancement
dassc
EbotFH
xidable fraction is able to be biologically oxidised as well.part from the BOD5 to COD estimation, the Zahn–Wellens
est was carried out to investigate the potential of a biologicalreatment as a single process to remove the reactive dye. As itas been mentioned before, the experiment takes place underonditions close to those of a conventional WWTP, using non-cclimated activated sludge as inoculum. Two concentrationsf dye (125 and 250 mg l−1) were tested in order to discover ifny toxicity effect was present. Obtained results clearly revealhat the biodegradability associated to both concentrations ofrocion Red H-E7B is almost negligible (Fig. 2). The activatedludge has not removed any DOC within the 28 days of con-act, with no sign of adaptation. This behaviour contrasts withhe experiment performed with ethylene glycol, a completelyiodegradable standard, which achieved an 85% of biodegrada-ion under the same conditions in just 4 days. Once the 28 dayseriod was completed, ethylene glycol was added to the dyeolutions to discard a possible inhibition caused by the sampledata not shown). Again, the standard was consumed in few days,emonstrating that the biomass was still active or not inhibited.
able 1hemical characterisation of 250 mg l−1 hydrolysed Procion Red H-E7B in the
ynthetic textile effluent
OC (mg l−1 C) 44.96 ± 1.55a
C50 (mg l−1 C) >44.96b
OD5 (mg l−1 O2) 12 ± 2a
OD (mg l−1 O2) 115 ± 2a
OD5/COD 0.10 ± 0.02a
D/ODst 0.04
a n = 3, α = 0.05.b EC50 > 100%.
The photo-Fenton process was applied in order to improve theye solution biodegradability, avoiding complete mineralisation,s a previous step of an ensuing biological treatment. In thisense, preliminary experiments were firstly carried out to finduitable ferrous salt and hydrogen peroxide doses needed to bio-ompatibilize the synthetic wastewater with a second SBR stage.
An extended study about optimisation of Procion Red H-7B reactive dye oxidation with photo-Fenton reaction haseen previously reported elsewhere by our group [33]. Basedn those findings, few Fenton reagents doses were tested inhe present work (a serial of three experiments): 5 mg l−1
e(II) and 125 mg l−1 H2O2, 10 mg l−1 Fe(II) and 125 mg l−1
2O2, 10 mg l−1 Fe(II) and 250 mg l−1 H2O2. Fig. 3 shows

224 J. Garcıa-Montano et al. / Journal of Hazardous Materials B134 (2006) 220–229
Fig. 3. Evolution of BOD5/COD ratio vs. irradiation time at different Fen-ton reagent doses for hydrolysed Procion Red H-E7B, 250 mg l−1, pH 3 andT = 23 ◦C.
the biodegradability evolution of every assessed condition,expressed as BOD5 to COD index. Contaminants with a ratioof BOD5/COD ≥ 0.4 are generally accepted as biodegradable,while those with ratios situated among 0.2 and 0.3 units resultpartially biodegradable. Apart from biodegradability enhance-ment, residual H2O2 is also a key parameter to decide the suitableirradiation time when photo-Fenton reaction is employed as aprevious step, before the biological treatment. It should be mini-mum and, due to its associated bactericide potential, eliminatedprior feeding the bioreactor [34]. Fig. 4 shows its evolution.Finally, the concentration of DOC was also monitored during thecourse of photo-Fenton oxidation, and is represented in Fig. 5.
As the reaction proceeded, for every tested condition, solu-tions suffered a biodegradability increase achieving BOD5 toCOD ratios around 0.4. However, necessary irradiation time dif-fer for each initial pair of Fenton reagent concentrations. Thehighest one, 10 mg l−1 Fe(II) and 250 mg l−1 H2O2, was ableto reach the 0.58 units within 60 min of reaction. Nevertheless,it could be notice that an unnecessary mineralisation had takenplace with this too high H2O2 dose (65% DOC removal, Fig. 5).On the other hand, the experiments with the lower concentration
Ff
Fig. 5. Evolution of DOC vs. irradiation time at different Fenton reagent dosesfor hydrolysed Procion Red H-E7B, 250 mg l−1, pH 3 and T = 23 ◦C.
(125 mg l−1) required longer irradiation times as a compensa-tion but, in both cases, high enough BOD5/COD values wereobtained along with lower mineralisation and, in the case of10 mg l−1 of iron(II), with smaller remaining hydrogen perox-ide levels (Figs. 4 and 5). According to the above argument,we conclude that 10 mg l−1 Fe(II) and 250 mg l−1 H2O2 wouldbe the optimum concentration to complete mineralise the stud-ied dye, but not for a partial degradation desired when usingphoto-Fenton as a pre-treatment. In fact, theoretical stoichiomet-ric hydrogen peroxide required to complete oxidize the dye is245 mg l−1 (1 g COD = 0.0312 mol oxygen = 0.0625 mol hydro-gen peroxide). Consequently, this concentration is too high to beconsidered for AOP and biological coupling applications. In con-trast, smaller Fenton reagent doses (5 mg l−1 Fe(II), 125 mg l−1
H2O2 and 10 mg l−1 Fe(II), 125 mg l−1 H2O2) seem to be appro-priate to just enhance biodegradability to high enough levels.On the other hand, longer irradiation times will not be a draw-back since the final goal of photo-Fenton reaction applicationis the use of solar light. Sunlight can give better results whencompared with the performance of some artificial sources and,as discussed in the Section 1, with the possibility of low costapplications. In fact, the beneficial use of solar light has beenalready proved by our group for the removal of colour, aro-matic compounds (Abs254) and dissolved organic carbon ofdifferent commercial reactive dyes, such as Procion Red H-E7B[
cesmaoCidaefi
ig. 4. Evolution of H2O2 vs. irradiation time at different Fenton reagent dosesor hydrolysed Procion Red H-E7B, 250 mg l−1, pH 3 and T = 23 ◦C.
35].Furthermore, when treating textile dyestuffs with biologi-
al processes, it has been reported that a narrow relationshipxists between colour and non biodegradability [36]. In fact,ingle conventional biological treatment plants are not suitableethods for decolourising textile wastewaters. Based on this
ffirmation, it seemed possible to obtain bio-treatable solutionsnce the colour had disappeared. If we compare the BOD5 toOD index evolution (Fig. 3) with absorbance data (Fig. 6), it
s noticeable that biodegradability improves as solution colourisappears. Finally, it should be pointed out that this biodegrad-bility enhancement was also exhibited in short-term respirom-try measurements. For instance, consumed oxygen within therst 2 h of respirometry increased for all pre-treated solutions

J. Garcıa-Montano et al. / Journal of Hazardous Materials B134 (2006) 220–229 225
Fig. 6. Evolution of colour vs. irradiation time at different Fenton reagent dosesfor hydrolysed Procion Red H-E7B, 250 mg l−1, pH 3 and T = 23 ◦C.
tested, even taking into account that COD decreases during thepre-treatment.
It may be possible that, while initial reactive dye wasdegraded, some other compounds with more inhibitor effectthan the parent compound were formed. In this sense, apartfrom biodegradability measurements, acute toxicity after 30, 60and 120 min of irradiation with the 5 mg l−1 Fe(II), 125 mg l−1
H2O2 and 10 mg l−1 Fe(II), 125 mg l−1 H2O2 photo-Fenton con-ditions was assessed. As happened with the untreated solution(Table 1), EC50 values were larger than the DOC content atevery measurement time (EC50 > 100%). There was no evidenceof toxic by-products development during the photo-Fenton pro-cess. Therefore, the coupling of photo-Fenton with a biologicaltreatment was presumably not conditioned by the possible toxicnature of reactive dye intermediates generated in the first step.
3.3. Aerobic SBR
Since the irradiated solution was in the acid pH range(2.8–3.0), it was neutralised with sodium hydroxide prior feed-ing into the SBR. Moreover, any residual hydrogen peroxidewas quenched with an excess of sodium sulphite to avoid furtherreactions and to prevent its bactericide effect inside the biore-actor [31]. The remaining sulphite was removed by bubblingO2. Taking into account such precautions, photo-treated Pro-
cion Red H-E7B samples could be introduced into the biologicalsystem.
3.3.1. Preliminary runIn order to guarantee the cells viability and to estimate the
lower residual DOC that could be achieved within the SBRsystem, this was initially fed with a completely biodegradablewastewater and a 10 day HRT cycle was carried out. This blankrun was performed before every cycle of SBR experimentswith municipal wastewater coming from the WWTP, a watercharacterised by an average DOC of 50 mg l−1 C and COD of210 mg l−1 O2.
During this preliminary run, almost complete DOC removalwas observed in every experiment, with a constant residualvalue of 11.87 ± 1.54 mg l−1 C corresponding to the metabolitesreleased by the biomass. In addition, along this period, cells wereadapted to the experimental laboratory conditions such as tem-perature, oxygen flow and manipulation, and the VSS contentstabilised along every preliminary run around 0.85 g l−1.
3.3.2. Effect of different photo-Fenton pre-treatments andHRT
After the preliminary run, a set of four different hydraulicretention times (10, 4, 2 and 1 days) were tested. The durationof the HRT may determine the grade of organic load removalachieved, expressed as DOC in this study. For the same experi-mtw2
omospaHowr3c
TS nditio
P(
T, da
666
33
.05.
able 2ummary of experimental results for the 10 mg l−1 Fe(II), 125 mg l−1 H2O2 co
re-treatmentmin)
Initial DOCa
(mg l−1 C)BOD5/CODb EC50
(mg l−1 C)HR
0 25.60 ± 0.47 0.35 ± 0.05 >25.60c 100 28.39 ± 0.01 0.35 ± 0.05 >28.39c 20 27.79 ± 0.81 0.35 ± 0.05 >27.79c 1
0 38.65 ± 0.33 0.29 ± 0.02 >38.65c 20 37.58 ± 0.47 0.29 ± 0.02 >37.57c 4
a Replicate data have been determined with a minimum of 5 values and α = 0b n = 3, α = 0.05.c EC50 > 100%.
ental conditions, at least three cycles were carried out in ordero obtain reproducible results. The HRT = 10 days experimentas run only twice because the residual DOC stabilized withincycles.The pretended goal was, after determining BOD5/COD ratios
f the pre-treated samples and choosing different HRT, to attainaximum DOC removal with residual DOC values close to those
btained in each previous blank run (biomass metabolites). Aummary of the characteristics of the influent sample and theerformance of the SBR is presented in Tables 2 and 3. Initially,n irradiation time of 60 min for a 10 mg l−1 Fe(II), 125 mg l−1
2O2 photo-Fenton process was chosen to generate the feedf the bioreactor. The resulting solution was slightly yellow,ithout trace of red colour and with a 0.35 ± 0.05 BOD5/COD
atio (Table 2). The mineralisation during the pre-treatment was9%, with a small remaining H2O2 of 16.5 mg l−1. The DOContent of the SBR influent was 26.90 ± 0.55 mg l−1 C.
ns in photo-Fenton process and SBR coupling system
ys Cycles OLR(mg l−1 day−1 C)
Residual DOCa
(mg l−1 C)SBR % DOCremoval
2 2.560 12.82 ± 0.63 49.15 14.20 14.51 ± 0.36 48.9
15 27.79 13.23 ± 0.36 52.4
3 19.32 25.71 ± 1.37 33.43 9.395 23.99 ± 0.75 36.2

226 J. Garcıa-Montano et al. / Journal of Hazardous Materials B134 (2006) 220–229
Table 3Summary of experimental results for the 5 mg l−1 Fe(II), 125 mg l−1 H2O2 conditions in photo-Fenton process and SBR coupling system
Pre-treatment(min)
Initial DOCa
(mg l−1 C)BOD5/CODb EC50
(mg l−1 C)HRT (days) Cycles OLR
(mg l−1 day−1 C)Residual DOCa
(mg l−1 C)SBR % DOCremoval
60 38.17 ± 1.01 0.25 ± 0.03 >38.17c 2 8 19.08 24.81 ± 0.86 35.060 38.12 ± 0.84 0.25 ± 0.03 >38.12c 4 3 9.53 24.13 ± 0.56 37.2
a Replicate data have been determined with a minimum of 5 values and α = 0.05.b n = 3, α = 0.05.c EC50 > 100%.
At the beginning, an HRT = 10 days was fixed to insure a reac-tion period long enough to determine the maximum biodegrada-tion percentage. As a result, a 49.1% DOC removal was obtainedalong the whole biological run, with no need of acclimationperiod (percent of reduction calculated from influent DOC).The attained residual DOC, 12.82 ± 0.63 mg l−1 C, coincidedwith the remaining content previously determined in the blankrun. It should to be remarked that this residual DOC value set-tles the lowest threshold of DOC removal. However, obtainedresults showed that it may be possible to reduce the HRT with-out renouncing to attain maximum biodegradation. A low andstable residual DOC is reached after 2 days in the first SBRcycle. Cycle time duration corresponding to 2 and 1 day wereconsequently tested. From Table 2 it is noticeable that whenHRT decreases, it increases the steady-state organic loading rate(OLR, mg l−1 day−1 C). Moreover, it should be pointed out that,for the three studied experiments, initial VSS level decreaseduntil a stabilized value, just when % DOC removal became sta-ble (see Fig. 7).
As predicted, organic load removals for HTR = 2 and 1 dayshow similar efficiencies than for HRT = 10 days, but makingnecessary an acclimation period of 2 and 4 days, respectively.Nevertheless, since minimum SBR cycle time duration is to beaccomplish, 1 day cycle was chosen as the suitable HRT fora 60 min, 10 mg l−1 Fe(II), 125 mg l−1 H2O2 photo-Fenton pre-treatment. Afterwards, SBR process was continued for 15 cyclestOf
FF
ues, while VSS remained stable around 0.41 g l−1. The DOCremoval rate was 14.85 mg l−1 day−1 C. In those steady-stateconditions, daily BOD5 to VSS ratio was 0.04 mg O2 mg−1 VSS.Finally, once the 15 days of operation were over, a blank run (byadding biodegradable municipal wastewater as influent to theadapted biomass) was performed to ensure that the remainingbiomass was able to reduce DOC to a residual value around12 mg l−1 C.
The next step of the study was to try to reduce the pre-treatment irradiation time of photo-Fenton process, by main-taining the same Fenton reagent dose, in order to evaluate thepre-treatment duration effect. In this sense, it should be pointedout that pre-treatment times beyond 60 min were not consid-ered since this was enough to obtain an effluent that can becompletely degraded in the biological reactor. With this aim,some new SBR runs were performed with a pre-treatment irra-diation time of 30 min (Table 2). This time reduction involvesan increase in organic carbon load to an average concentrationof 37.91 ± 0.42 mg l−1 C, a remaining H2O2 of 47.6 mg l−1 anda 0.29 ± 0.02 BOD5/COD ratio (Table 2). As a difference withthe 60 min one, this influent was characterised by a visible slightbrown colour. A 2 day HRT was fixed as starting point. As it canbe seen in the table, an increase of the remaining DOC takes placewhen comparing with the 60 min experiment under the sameconditions. The obtained residual DOC was 25.71 ± 1.37 mg l−1
C −1
pe
Fp
o check that SBR worked under steady conditions (Fig. 7).n average, residual DOC was 13.23 ± 0.36 mg l−1 C after the
ourth cycle, with no more than 4.74% fluctuation in DOC val-
ig. 7. VSS evolution and final DOC concentration for the 60 min, 10 mg l−1
e(II) 125 mg l−1 H2O2 photo-Fenton pre-treatment and 1 day HRT SBR cycle.
, far away from the 14.51 mg l C value. In any case, gooderformance of the SBR was observed since operating param-ters were properly maintained throughout each run. The VSS
ig. 8. Initial and final DOC for the 60 min, 5 mg l−1 Fe(II), 125 mg l−1 H2O2
hoto-Fenton conditions and SBR coupling system. HRT = 2 and 4 days.

J. Garcıa-Montano et al. / Journal of Hazardous Materials B134 (2006) 220–229 227
Fig. 9. % DOC removal in photo-Fenton pre-treatment and SBR coupling system as a function of pre-treatment irradiation time and HRT: (a) 10 mg l−1 Fe(II),125 mg l−1 H2O2; (b) 5 mg l−1 Fe(II), 125 mg l−1 H2O2.
arrived to a steady-state while final DOC fluctuated slightly fromcycle to cycle. In an attempt to ascertain if there was any chanceto improve the situation, an increase of the bioreactor cycle timefrom 2 to 4 days was probed. However, in spite of extendingthe reaction period, the bioreactor response showed a similarbehaviour. Moreover, data reveal that a 1 day HRT in the SBRwould give the same remaining DOC. Therefore, biodegrad-ability of 30 min pre-treated reactive dye was not high enough,while hydraulic retention time did not seem to influence theremoval percentage values. In conclusion, sample irradiation for60 min under 10 mg l−1 Fe(II), 125 mg l−1 H2O2 photo-Fentonpre-treatment conditions proves to be necessary to generate aneffluent able to be completely biodegraded in the SBR.
Finally, a pair of SBR runs coupled to the 5 mg l−1
Fe(II), 125 mg l−1 H2O2 photo-Fenton process were assessed(Table 3). To establish time-comparable conditions to the onespresented above, the irradiation pre-treatment time chosenwas 60 min. At that point, Procion Red H-E7B intermediateswere characterized by a 0.25 ± 0.03 BOD5/COD index, slightbrown colour, 64.6 mg l−1 of non-reacted H2O2 and a substrateconcentration of 38.15 ± 0.64 mg l−1 C. As previously stated,HRT of tested bio-treatment cycles were, initially, 2 days andextended later to 4 days to discard any HRT limitation in theDOC percent reduction (Fig. 8). Table 3 clearly reveals that,although DOC removal of both tested runs was not high, it wasneither affected by the HRT. In fact, Fig. 8 exhibits that, as hap-pptr
tufiVttt
bFw
not close to 0.4, it seems reasonable that longer irradiation times(more than the 1 h tested) would eventually produce a biodegrad-able solution, an interesting possibility taking into account thepotential use of sunlight in the photo-Fenton reaction.
In summary, studied AOP and SBR coupling show higherdegradation efficiencies when working under the 10 mg l−1
Fe(II), 125 mg l−1 H2O2 photo-Fenton pre-treatment conditions.This DOC removal efficiency was affected by the irradiationtime, being significantly higher in the case of 60 min. Fig. 9compares the DOC removal of all the studied runs, taking intoaccount the percentage of mineralisation reached by the cou-pling of both stages. Under most favourable conditions a 71%removal with respect to the initial DOC in coloured dye solutionwas obtained. This percentage dropped around 45% in the othercombined treatments. Finally, it is remarkable that the resid-ual DOC values oscillated around 12 mg l−1 C, setting a lowerthreshold for DOC removal.
With regard to the hydraulic retention time effect, no remark-able differences in DOC removal were found between differentassessed cycle times. For instance, the 60 min of 10 mg l−1
Fe(II), 125 mg l−1 H2O2 photo-Fenton pre-treatment, the mosteffective one, allowed to reduce HRT from 10 to 1 day withoutlost of biodegradability (Fig. 9). This fact let us to conclude thatSBR efficiency is not time dependent over 1 day HRT. Neverthe-less, the SBR behaviour when reducing the hydraulic retentiontime below 24 h has not been studied, being not possible to dis-c
4
bcpbtih
pHB
ened with the 30 min, 10 mg l−1 Fe(II) and 125 mg l−1 H2O2re-treatment, 24 h SBR cycle would be time enough to reachhe same final DOC content. Residual values for 2 and 4 daysuns were 24.81 ± 0.86 and 24.13 ± 0.56 mg l−1 C, respectively.
With regard to VSS evolution, it should be pointed out thathe bioreactor did not manage to work under stable operationntil the fourth cycle of the 2 days HRT experiment. During therst cycles bacteria experimented a slight adaptation until stableSS and reproducible final DOC values were achieved. Due to
his behaviour, and proceeding in a different way with respect tohe other SBR experiments, biomass was reused from one runo the other to avoid such acclimation period.
It is noteworthy that this set of experiments showed a similariodegradation percent than the 30 min of irradiation, 10 mg l−1
e(II), 125 mg l−1 H2O2 photo-Fenton pre-treatment. Althoughith Fe(II) concentration of 5 mg l−1, the ratio BOD5/COD is
ard an HRT effect below this cycle time duration.
. Conclusions
Results have demonstrated that photo-Fenton reaction cane successfully used as a pre-treatment process to bio-ompatibilize Procion Red H-E7B reactive dye solutions. Withartial oxidation run under mild conditions, dye solutionecame decolourised and more biodegradable, as well as nonoxic. Photo-treated solutions were subsequently biodegradedn an aerobic sequencing batch reactor working under differentydraulic retention times.
Best pre-treatment results were obtained with 60 min ofhoto-Fenton irradiation time and 10 mg l−1 Fe(II), 125 mg l−1
2O2 of initial reagents concentrations. At these conditions,OD5/COD index went from 0.10 up to 0.35 units just with

228 J. Garcıa-Montano et al. / Journal of Hazardous Materials B134 (2006) 220–229
39% mineralisation and 16.5 mg l−1 of residual H2O2. On theother hand, data comparison for every tested HRT in SBR showsthat the biological process efficiency appeared to be independentof the changes carried out in the cycle time duration. Therefore,1 day (the minimum one tested) was chosen as the suitable HRTfor SBR operation. Low residual DOC values obtained wereclose to those previously obtained in a blank run, assuming com-plete biodegradability. In addition, a good performance of thebioreactor was observed since operating parameters (VSS andresidual DOC content) were properly maintained within eachexperiment.
On the other hand, when trying to reduce the 10 mg l−1 Fe(II)and 125 mg l−1 H2O2 photo-Fenton process duration from 60to 30 min, it was not possible to attain enough biodegradationpercentage levels, showing that photo-treated water was notbiodegradable enough to feed the SBR. The same behaviour wasobserved in the 60 min, 5 mg l−1 Fe(II) and 125 mg l−1 exper-iment. In any case, results exhibit that DOC removal was notconditioned by the studied HRT.
In summary, the use of photo-Fenton type reactions as a pre-treatment allows the SBR system to remove Procion Red H-E7Breactive dye from aqueous solution, fact which improves thelow success of aerobic biological removal of dye colour. More-over, it should be pointed out that, taking the studied artificiallight photo-Fenton process as starting point, more favourablerps
A
0E
R
[10] M. Neamtu, A. Yediler, I. Siminiceanu, A. Kettrup, Oxidation of com-mercial reactive azo dye aqueous solutions by the photo-Fenton andFenton-like processes, J. Photochem. Photobiol. A: Chem. 161 (2003)87–93.
[11] K. Swaminathan, S. Sandhya, A. Carmalin Sophia, K. Pachhade, Y.V.Subrahmanyam, Decolorization and degradation of H-acid and otherdyes using ferrous-hydrogen peroxide system, Chemosphere 50 (2003)619–625.
[12] M. Perez, F. Torrades, X. Domenech, J. Peral, Fenton and photo-Fentonoxidation of textile effluents, Water Res. 36 (2002) 2703–2710.
[13] M. Rodrıgez, V. Sarria, S. Esplugas, C. Pulgarin, Photo-Fenton treatmentof a biorecalcitrant wastewater generated in textile activities: biodegrad-ability of the photo-treated solution, J. Photochem. Photobiol. A: Chem.151 (2002) 129–135.
[14] F. Haber, J. Weiss, The catalytic decomposition of hydrogen peroxideby iron salts, Proc. R. Soc. Series A 147 (1934) 332–351.
[15] P.L. Huston, J. Pignatello, Degradation of selected pesticide active ingre-dients and commercial formulations in water by the photo-assistedFenton reaction, Water Res. 33 (1999) 1238–1246.
[16] M. Perez, F. Torrades, X. Domenech, J. Peral, Removal of organic com-pounds in paper pulp treatment effluents under Fenton and photo-Fentonconditions, Appl. Catal. B: Environ. 36 (2002) 63–74.
[17] A. Safarzadeh-Amiri, J.R. Bolton, S.R. Cater, The use of iron inadvanced oxidation processes, J. Adv. Oxid. Technol. 1 (1996) 18–26.
[18] P. Fongsatitkul, P. Elefsiniotis, A. Yamasmit, N. Yamasmit, Use ofsequencing batch reactors and Fenton’s reagent to treat a wastewaterfrom a textile industry, Biochem. Eng. J. 21 (2004) 213–220.
[19] S. Parra, V. Sarria, S. Malato, P. Peringer, C. Pulgarin, Photochemicalversus coupled photochemical–biological flow system for the treatmentof two biorecalcitrant herbicides: metobromuron and isoproturon, Appl.Catal. B: Environ. 27 (2000) 153–168.
[
[
[
[
[
[
[
[
[
[
[
[
[
esults are expected when using solar light, both in terms ofhoto-Fenton pre-treatment effectiveness as well as energy con-umption.
cknowledgements
The authors wish to thank to CICYT (project PPQ2002-4060-C02-01) and European Commission (CADOX project,VK1-CT-2002-00122) for financial support.
eferences
[1] N.H. Inze, M.I. Stefan, J.R. Bolton, UV/H2O2 degradation and toxicityreduction of textile azo dyes: Remazol Black-B, a case study, J. Adv.Oxid. Technol. 2 (3) (1997) 442–448.
[2] B.T. Tan, T.T. Teng, A.K. Omar, Removal of dyes and industrial dyewastes by magnesium chloride, Water Res. 34 (2000) 3153–3160.
[3] S.H. Lin, C.C. Lo, Treatment of textile wastewater by Foam flotation,Environ. Technol. 17 (8) (1996) 841–849.
[4] L. Tan, R.G. Sudan, Removing colour from a groundwater source, J.Am. Water Works Assoc. 84 (1992) 79–87.
[5] S.H. Lin, Adsorption of disperse dye by powdered activated carbon, J.Chem. Technol. Biotechnol. 57 (1993) 387–391.
[6] A. Uygur, E. Kok, Decolorisation treatments of azo dye waste watersincluding dichlorotriazinyl reactive groups by using advanced oxidationmethod, JSDC 115 (11) (1999) 350–354.
[7] D. Brown, B. Hamburger, The degradation of dyestuffs. Part III. Inves-tigation of their ultimate biodegradability, Chemosphere 16 (1987)1539–1553.
[8] R. Andreozzi, V. Caprio, A. Insola, R. Marotta, Advanced oxidationprocesses (AOP) for water purification and recovery, Catal. Today 53(1999) 51–59.
[9] R. Bauer, H. Fallman, The photo-Fenton oxidation—a cheap and effi-cient wastewater treatment method, Res. Chem. Intermed. 23 (1997)341–354.
20] C. Pulgarin, M. Invernizzi, S. Parra, V. Sarria, R. Polania, P. Peringer,Strategy for the coupling of photochemical and biological flow reactorsuseful in mineralization of biorecalcitrant industrial pollutants, Catal.Today 54 (1999) 341–352.
21] V. Sarria, S. Parra, N. Adler, P. Peringer, N. Benitez, C. Pulgarin, Recentdevelopments in the coupling of photoassisted and aerobic biologicalprocesses for the treatment of biorecalcitrant compounds, Catal. Today76 (2002) 301–315.
22] F. Al Momani, O. Gonzalez, C. Sans, S. Esplugas, Combiningphoto-Fenton process with biological sequencing batch reactor for2,4-dichlorophenol degradation, Water Sci. Technol. 49 (4) (2004) 293–298.
23] R.L. Irvine, L.H. Ketchum Jr., Sequencing batch reactors for biologi-cal wastewater treatment, CRC Crit. Rev. Environ. Control. 18 (1989)255–294.
24] P.A. Wilderer, R.L. Irvine, M.C. Gorzonsky (Eds.), Sequencing BatchReactor Technology, International Water Association, London, 1999.
25] S. Mace, J. Mata-Alvarez, Review of SBR technology for wastewatertreatment: an overview, Ind. Eng. Chem. Res. 41 (2002) 5539–5553.
26] M. Neamtu, I. Siminiceanu, A. Yediler, A. Kettrup, Kinetics of decol-orization and mineralization of reactive azo dyes in aqueous solution bythe UV/H2O2 oxidation, Dyes Pigments 53 (2002) 93–99.
27] W.W. Eckenfelder, J.L. Musterman, Activated Sludge Treatment ofIndustrial Wastewater, Technomic Publishing Co., Lancaster, Pennsyl-vania, USA, 1995.
28] APHA-AWWA-WPCF, Standard Methods for the Examination of Waterand Wastewater, ASTM D1252-00, 17th ed, Washington, DC, 1989.
29] C. Kormann, D.W. Bahnemann, M.R. Hoffmann, Photocatalytic produc-tion of H2O2 and organic peroxides in aqueous suspensions of TiO2,ZnO and desert salt, Environ. Sci. Technol. 22 (5) (1988) 798–806.
30] Y.W. Kang, M.-J. Cho, K.-Y. Hwang, Correction of hydrogen peroxideinterference on standard chemical oxygen demand test, Water Res. 33(5) (1999) 1247–1251.
31] C.D. Adams, P.A. Scanlan, N.D. Secrist, Oxidation and biodegradabil-ity enhancement of 1,4-dioxane using hydrogen peroxide and ozone,Environ. Sci. Technol. 28 (1994) 1812–1818.
32] ECD Guidelines for Testing of Chemicals, vol. 2, Test 302B, 1996.

J. Garcıa-Montano et al. / Journal of Hazardous Materials B134 (2006) 220–229 229
[33] F. Torrades, J. Garcıa-Montano, J.A. Garcıa-Hortal, Ll. Nunez, X.Domenech, J. Peral, Decolorisation and mineralisation of homo- andhetero-bireactive dyes under Fenton and photo-Fenton conditions, Color.Technol. 120 (2004) 188–194.
[34] J.P. Scott, D.F. Ollis, Integration of chemical and biological oxidationprocesses for water treatment: review and recommendations, Environ.Progress. 14 (1995) 88–103.
[35] F. Torrades, J. Garcıa-Montano, J.A. Garcıa-Hortal, X. Domenech, J.Peral, Decolorization and mineralization of commercial reactive dyesunder solar light assissted photo-Fenton conditions, Sol. Energy 77(2004) 573–581.
[36] H. Chun, W. Yizhong, Decolorization and biodegradability of photocat-alytic treated azo dyes and wool textile wastewater, Chemosphere 39(12) (1999) 2107–2115.

Combining photo-Fenton process with aerobic sequencing batch
reactor for commercial hetero-bireactive dye removal
Julia Garcıa-Montano a, Francesc Torrades b, Jose A. Garcıa-Hortal c,Xavier Domenech a, Jose Peral a,*
a Departament de Quımica, Edifici Cn, Universitat Autonoma de Barcelona, E-08193 Bellaterra, Barcelona, Spainb Departament d’Enginyeria Quımica, ETSEI de Terrassa (UPC), C/Colom 11, E-08222 Terrassa, Barcelona, Spain
c Departament d’Enginyeria Textil i Paperera, ETSEI de Terrassa (UPC), C/Colom 11, E-08222 Terrassa, Barcelona, Spain
Received 30 January 2006; received in revised form 7 April 2006; accepted 16 April 2006
Available online 24 May 2006
Abstract
A synthetic textile effluent containing an hetero-bireactive dye (Cibacron Red FN-R, 250 mg l�1) was treated by coupling photo-Fenton process
with an aerobic sequencing batch reactor (SBR). The study is focused on the selection of suitable mild photo-Fenton conditions (Fe(II)/H2O2
reagents and irradiation time) that performs as a pre-treatment of a secondary biological treatment. Decolourisation (Abs542.5), biodegradability
enhancement (determined by BOD5/COD index and respirometric methods) and dye degradation intermediates toxicity (Biotox1 technique) were
the parameters employed to verify the chemical stage effectiveness. From different assessed photo-Fenton conditions, a Fenton reagent
concentration of 20 mg l�1 Fe(II) and 250 mg l�1 H2O2, applied for an irradiation time of 90 min, was found to be an effective process to
bio-compatibilize the studied wastewater. The SBR, working under steady conditions in a 24-h-cycle mode, made available an 80% DOC removal
in the combined oxidation system.
# 2006 Elsevier B.V. All rights reserved.
Keywords: Reactive azodye; Photo-Fenton’s oxidation; Biodegradability enhancement; Aerobic sequencing batch reactor; Coupled oxidation system
www.elsevier.com/locate/apcatb
Applied Catalysis B: Environmental 67 (2006) 86–92
1. Introduction
Wastewater produced in the natural fibre dyeing plant is
characterised, in general, by its high colouration. The high
consumption of reactive dyes, mainly in the cotton industry,
originates environmental and aesthetic problems due to their
low fixing degree to the fibre. Therefore, an important
percentage of the dye (10–40%) remains unfixed in its
hydrolysed form in the washing liquors [1]. Like many textile
dyestuffs, reactive dyes are not removed under the aerobic
conditions of standard biological treatment [2]. Additionally,
under anaerobic conditions, they are readily reduced to
potentially hazardous aromatics [3]. Consequently, to accom-
plish with current regulations, the application of specific
treatments is required.
Advanced oxidation processes (AOPs) are powerful
remediation technologies, which generate highly reactive
* Corresponding author. Tel.: +34 93 581 2772; fax: +34 93 581 2920.
E-mail address: [email protected] (J. Peral).
0926-3373/$ – see front matter # 2006 Elsevier B.V. All rights reserved.
doi:10.1016/j.apcatb.2006.04.007
hydroxyl radicals (HO�, E = 2.8 V versus NHE), able to
mineralise almost all toxic and non-biologically degradable
compounds [4]. These destructive treatments suppose an
alternative to conventional physical and chemical treatment
techniques, effective for colour removal but consisting only in a
phase transfer of pollutants that requires additional treatment or
disposal [5–8].
Fenton and photo-Fenton reactions are AOPs where oxidant
species are generated from hydrogen peroxide and Fe(II)/
Fe(III) as a catalytic couple. In Fenton reaction [9], ferrous salts
react with hydrogen peroxide to generate the hydroxyl radicals
as follows (reaction (1)):
FeðIIÞ þ H2O2! FeðIIIÞ þ HO� þ HO� k¼ 76:5lmol�1 s�1
(1)
The rate of contaminants degradation can be considerably
increased via photochemical reaction in the photo-Fenton
process [10]. The effect of UV is the direct HO� formation and
regeneration of Fe(II) from the photolysis of the FeOH2+
complex in solution (reaction (2)). The reduction of Fe(III)

J. Garcıa-Montano et al. / Applied Catalysis B: Environmental 67 (2006) 86–92 87
back to Fe(II) is needed for the catalytic progress of the Fenton
reaction:
FeOH2þ�!hnFeðIIÞ þ HO� l � 410 nm (2)
Although Fenton and photo-Fenton type reactions offer
successful pollutant removal with relatively low operational
costs [11] and with the possibility of efficient sun radiation
exploitation [12], expenses associated to reagents and energy
consumption are their main disadvantage (shared by all AOPs).
In order to overcome the economical drawback, and consider-
ing that biological treatment is the most desirable wastewater
treatment in terms of environmental impact, a two-stage
chemical/biological process is being currently proposed by
many researchers when working with toxic and/or non-
biodegradable waters [13–16]. Complete mineralisation would
be avoided in the chemical process, being the goal the
generation of a new biocompatible effluent.
Therefore, the photo-Fenton reaction was employed in the
current work as a pre-treatment for further aerobic treatment of
a representative reactive dye: hydrolysed Cibacron Red FN-R
hetero-bireactive azodye. Few different Fe(II)/H2O2 doses
were tested. The biodegradability evolution of the dye solution
with time, estimated by means of BOD5/COD index and
respirometric tests, was assessed in order to judge the
efficiency and the most appropriate conditions of the chemical
stage. The mineralisation degree and the dye intermediates
toxicity (EC50 parameter) were also evaluated. Photo-treated
solutions were subsequently submitted to an aerobic sequen-
cing batch reactor (SBR), an efficient alternative to conven-
tional biological systems for a wide variety of model pollutants
and real wastewaters biodegradation [17–19]. The effective-
ness of the coupling process in dyestuff degradation was
investigated.
2. Experimental
2.1. Hydrolysed dye solutions
A commercial hetero-bireactive azodye, Cibacron Red
FN-R (CI Reactive Red 238, empirical formula C29H15
ClFN7O13S4Na4, 944.2 g mol�1) was supplied by CIBA and
used as received without further purification. The chemical
structure was confidential and not available. The initial
Cibacron Red FN-R concentration for all the experiments
was 250 mg l�1. In order to simulate batch-dyeing conditions,
the dye was hydrolysed by adjusting the pH of synthetic
solutions to 10.6, followed by heating to 60 8C for 1 h. Finally,
pH of the hydrolysed dye solutions was adjusted between 2.8
and 3.0 (the optimum pH for photo-Fenton process) and stored
at 4 8C until AOP operation.
2.2. Chemicals
All chemicals used throughout this study were of the highest
commercially available grade. Analytical grade hydrogen
peroxide (33% (w/v), Panreac) and FeSO4�7H2O (99.5%,
Merck) were used as received to generate hydroxyl radical
(HO�) in aqueous solution. For the pH adjustment, concentrated
reagent grade sulphuric acid and sodium hydroxide solutions
(Panreac) were used. All solutions were prepared with
deionised water obtained from a Millipore Milli-Q system.
2.3. SBR inoculum
The aerobic SBR was seeded with activated sludge coming
from a municipal wastewater treatment plant (WWTP) in
Manresa (Catalonia, Spain). Biomass concentration in biolo-
gical suspensions was determined as volatile suspended solids
(VSS, g l�1) [20]. For all performed experiments, the bioreactor
was seeded with approximately the same initial cell population
by diluting the original activated sludge to a VSS value of
0.6 g l�1.
2.4. Photo-chemical reactor
Photo-Fenton oxidation was conducted in a thermostated
(T = 23 � 1 8C) well-stirred cylindrical Pyrex cell of 300 ml
of capacity. The dye solution volume was 250 ml. A 6 W
Philips black light fluorescent lamp, which basically emits at
350 nm, was used as artificial light source. The intensity of the
incident light, measured employing an uranyl actinometer,
was 1.38 � 10�9 einstein s�1.
2.5. Aerobic SBR experimental conditions
The biological treatment system was composed of a 2 l
aerobic bench-scale sequencing batch reactor, equipped with an
air diffuser and agitation. The operating liquid volume was
1.5 l. The fill-and-draw SBR procedure is described elsewhere
[16]. Temperature remained stable and close to room
conditions, between 21 and 23 8C. The concentration of
dissolved oxygen (DO, mg l�1 O2) was kept above
3 mg l�1 O2. Daily analyses of VSS, DO and dissolved organic
carbon (DOC, mg l�1 C) (influent and effluent samples content)
were carried out, and pH adjustment between 6.5 and 7.5 was
done if necessary. Suitable proportions of nutrients (MgSO4,
CaCl2, NH4Cl and NaH2PO4 buffer at pH 7) were also added to
the solution [20].
2.6. Chemical assays
UV/vis-absorption spectra were recorded by using a
Shimatzu UV-1603 double beam spectrophotometer in the
200–700 nm range. All colour data are reported as absorbance
at the maximum absorption in the visible region
(lmax = 542.5 nm). DOC was determined with a Shimadzu
TOC-VCSH analyser. Chemical oxygen demand (COD,
mg l�1 O2) was assessed by the closed reflux colorimetric
method with a HACH DR/2000 spectrophotometer [20]. H2O2
consumption was tested by the potassium iodide titration
method [21]. Accordingly, correction was made in the COD
measurement for residual H2O2 [22]. Determination of total
suspended solids (TSS, g l�1) and volatile suspended solids

J. Garcıa-Montano et al. / Applied Catalysis B: Environmental 67 (2006) 86–9288
Table 1
Chemical characterisation of 250 mg l�1 hydrolysed Cibacron Red FN-R in the
synthetic textile effluent
DOC (mg l�1 C) 79.46 � 1.34a
EC50 (mg l�1 C) >79.46b
BOD5 (mg l�1 O2) 5 � 5a
COD (mg l�1 O2) 199 � 10a
BOD5/COD 0.02 � 0.02a
OD/ODst 0.04
a n = 3; a = 0.05.b EC50 > 100%.
(VSS, g l�1) was carried out gravimetrically following
Standard Methods procedure [20].
2.7. Biological assays
Acute toxicity was assessed using the Biotox1 bacterial
bioluminiscence assay, by determination of the inhibitory effect
that the sample has on the marine photobacteria Vibrio fischeri.
To perform the measurement, residual hydrogen peroxide was
removed from the media with Catalase (2350 U mg�1, Sigma)
according to the following specifications: 1 U destroys
1 mmol min�1 of hydrogen peroxide at pH 7 and temperature
25 8C. The toxicity effect was quantified as the EC50 parameter
(the concentration of toxicant that causes a 50% decrease of
light emission after 30 min of exposure at 15 8C), expressed as
percentage of DOC of the original sample. Phenol and glucose
solutions were used as standard toxic and non-toxic samples to
check the technique suitability. Colour correction was applied
in coloured solutions toxicity determinations.
The measurement of biochemical oxygen demand for 5 days
(BOD5, mg l�1 O2) was performed by means of a mercury-free
WTW 2000 Oxytop thermostated at 20 8C. When BOD5
determination took place during the photo-treatment stage, due
to the harmful character of hydrogen peroxide, its removal with
an excess of SO32� [23] was found to be necessary. Any
remaining sulphite was removed by bubbling O2.
The Zahn–Wellens test was carried out under conditions
close to those of a conventional municipal wastewater
treatment plant. Non-acclimated activated sludge coming from
the Manresa WWTP was used to prepare the 0.3 g l�1 of TSS
required in the test specifications [24].
The experimental set up used to perform the short-term
respirometry test was composed of a closed and thermostatic
250 ml respirometer (T = 25 � 1 8C), connected to a dissolved
oxygen-meter (Model 407510, EXTECH), an air diffuser and a
mechanical stirrer. Suspensions of 3–4 g l�1 VSS were used as
inoculum. Results were determined as specific oxygen uptake
rate (sOUR, g O2 g�1 VSS min�1) of the sample, while ready
biodegradability was estimated as the quotient between the
accumulated oxygen demand within the first 30 min of contact
with biomass (OD, g O2 g�1 VSS, calculated by multiplying
the sOUR by the considered time) and the oxygen demand of an
acetic acid solution (ODst, g O2 g�1 VSS), a completely
biodegradable standard with the same COD than the sample.
N-Allylthiourea was added for nitrification inhibition.
3. Results and discussion
3.1. Hydrolysed dye solution characterisation
Results of the characterization of the 250 mg l�1 hydrolysed
Cibacron Red FN-R solution are shown in Table 1. Cibacron
Red FN-R is a non-toxic reactive azodye since there was no
bacterial inhibition response at the studied DOC sample
concentration: EC50 parameter >100% (>79.46 mg l�1 C). On
the other hand, the dye is of non-biodegradable nature. Both
BOD5/COD and OD/ODst index manifest its nearly null
biodegradability, with 0.02 and 0.04 values, respectively
(Table 1). Moreover, as a complementary long-term biode-
gradability study, two concentrations (125 and 250 mg l�1
Cibacron Red FN-R) were assessed with the Zahn–Wellens test
to investigate the potential of a single aerobic biological
treatment to remove the reactive dye (data not shown).
Obtained results exhibited that bacteria were not able to remove
any DOC within the 28 days of contact, with no sign of
adaptation capacity.
The data of all the biological experiments evidence that no
traditional activated sludge system would be effective enough
to remove Cibacron Red FN-R from aqueous solution.
Subsequently, photo-Fenton reaction coupled to a biological
process appears to be a suitable strategy for successful dyestuff
treatment.
3.2. Photo-Fenton pre-treatment: biocompatibility
assessment
Several experiments were carried out by modifying the
Fe(II)/H2O2 ratio in an attempt to establish suitable conditions
to bio-compatibilize Cibacron Red FN-R reactive dye
solutions. The efficiency of the pre-treatment process was
estimated by means of the biodegradability evolution of the
photo-treated synthetic wastewater, estimated by BOD5/COD
and OD/ODst biodegradability indicators. The DOC evolution
through the photo-Fenton process was also monitored in order
to determine the degree of mineralisation during the pre-
treatment. Finally, colour (Abs542.5), acute toxicity (EC50), as
well as hydrogen peroxide concentration were determined
along the oxidation.
From preliminary experiments, 20 mg l�1 Fe(II) and
500 mg l�1 H2O2 was found to be the most efficient Fenton
reagent combination to degrade the hetero-bireactive dye under
study, achieving the maximum decolourisation and mineralisa-
tion levels at short irradiation time (Fig. 1). However, since just a
partial degradation was desired when using photo-Fenton as a
pre-treatment, such combination was not considered for
chemical and biological coupling applications. By considering
it as the top dose limit, the following Fe(II) and H2O2
concentrations were tested to establish minimum suitable
biological pre-treatment conditions: 10 mg l�1 Fe(II) combined
with 125, 250 and 500 mg l�1 H2O2, and 20 mg l�1 Fe(II)
combined with 250 mg l�1 H2O2. BOD5/COD and DOC
progression with time are shown in Figs. 2 and 3, respectively.

J. Garcıa-Montano et al. / Applied Catalysis B: Environmental 67 (2006) 86–92 89
Fig. 1. Decolourisation and mineralisation of 250 mg l�1 hydrolysed Cibacron
Red FN-R under 20 mg l�1 Fe(II), 500 mg l�1 H2O2 photo-Fenton conditions
(pH 3 and T = 23 8C).Fig. 3. DOC evolution vs. irradiation time at different Fenton reagent doses for
hydrolysed Cibacron Red FN-R, 250 mg l�1 (pH 3 and T = 23 8C).
It can be observed that all photo-Fenton Fe(II)/H2O2 doses
involve an increase of biodegradability during the course of the
oxidation. Nevertheless, only wastewaters with a BOD5/COD
ratio �0.3–0.4 are generally accepted as biodegradable. Based
on such requirement, the 10 mg l�1 Fe(II)/125 mg l�1 H2O2
process was discarded as a pre-treatment since it was not able to
achieve biocompatible BOD5/COD ratios. On the other hand, as
it can be seen from Figs. 2 and 3, the 10 mg l�1 Fe(II)/
500 mg l�1 H2O2 Fenton dose gives worst biodegradability and
mineralisation degrees than the 10 mg l�1 Fe(II)/250 mg l�1
H2O2 one. A large hydrogen peroxide excess with respect to the
Fe(II) catalyst probably promoted both the auto-decomposition
of H2O2 and the competitive scavenging of HO� by H2O2,
according to reactions (3) and (4) [25]. In this sense, the
10 mg l�1 Fe(II)/500 mg l�1 H2O2 combination was not taken
into account for the coupling system.
2H2O2 ! 2H2O þ O2 (3)
H2O2þHO� ! HO2� þ H2O (4)
Fig. 2. BOD5/COD evolution vs. irradiation time at different Fenton reagent
doses for hydrolysed Cibacron Red FN-R, 250 mg l�1 (pH 3 and T = 23 8C).
Therefore, the 10 mg l�1 Fe(II)/250 mg l�1 H2O2 and
20 mg l�1 Fe(II)/250 mg l�1 H2O2 experiments, with suitable
BOD5/COD and mineralisation levels, were chosen to generate
the fed of the bioreactor. The following irradiation times that
render biocompatible intermediate solutions were tested:
150 min for the lower and 60 and 90 min for the higher
Fenton dose. BOD5/COD index, %DOC removal as well as
remaining H2O2 values at chosen photo-Fenton conditions are
compared in Table 2. All obtained solutions correspond to
colourless samples. As an example, Fig. 4 compares the
untreated dyestuff spectrum with the corresponding after the
90 min, 20 mg l�1 Fe(II) and 250 mg l�1 H2O2 photo-Fenton
process. The other two oxidising conditions generate similar
absorbance profiles, with the absence of the large visible band
characteristic of azodyes. On the other hand, the UV band
remaining below 350 nm would correspond to colourless
organic by-products. This phenomenon indicates that the parent
compound Cibacron Red FN-R reactive dye had been
completely removed during the chemical stage, before feeding
Fig. 4. Absorption spectrum of untreated and photo-treated 250 mg l�1 hydro-
lysed Cibacron Red FN-R, photo-Fenton conditions: 20 mg l�1 Fe(II),
250 mg l�1 H2O2, irradiation time = 90 min (pH 3 and T = 23 8C).

J. Garcıa-Montano et al. / Applied Catalysis B: Environmental 67 (2006) 86–9290
Table 2
BOD5/COD, OD/ODst index, H2O2 concentration and %DOC removal at different chosen Fenton reagent doses and irradiation times
Fenton reagent (mg l�1) Irradiation time (min) Residual H2O2 (mg l�1) %DOC removal BOD5/CODa OD/ODst
10 Fe(II), 250 H2O2 150 98.6 32.6 0.29 � 0.02 0.21
20 Fe(II), 250 H2O2 60 76.5 35.6 0.32 � 0.03 0.34
20 Fe(II), 250 H2O2 90 21.2 49.6 0.36 � 0.05 0.52
a n = 3; a = 0.05.
into the bioreactor. In this sense, it should be pointed out that
the observed decolourisation and the biodegradability enhance-
ment may involve the same chemical steps, in agreement with
the bio-refractory nature associated to coloured samples.
The biodegradability enhancement was also exhibited in
short-term respirometry assays. Respirometric measurements
where made to provide more information about the ready
biomass activity in front of the generated intermediates. For all
pre-treated solutions tested, the OD/ODst index experimented a
significant increase within the first 30 min of contact with
biomass (with respect to the initial 0.04 value), with a data trend
in agreement with that corresponding to the BOD5/COD index
(Table 2). These results evidence that more readily biodegrad-
able intermediates were generated after the parent compound
chemical oxidation. After the photo-treated sample consump-
tion, the same biomass was fed again with acetic acid to discard
a possible inhibition of respiration caused by the sample.
Results were compared with data obtained from a first acetic
acid measurement performed before the photo-treated dye
addition. As the oxygen demand and the sOUR of the standard
were properly reproduced, it can be assumed that no toxic
compounds were formed during the photo-Fenton process.
Fig. 5 shows an example of respirometry corresponding to the
accumulated oxygen demand evolution with time of 90 min,
20 mg l�1 Fe(II) and 250 mg l�1 H2O2 photo-Fenton pre-
treatment with respect to the demand of an acetic acid solution
with the same COD than the sample (measured before and after
biomass contact with the treated dye addition). From the figure,
Fig. 5. Comparison of accumulated oxygen demand evolution of the photo-
treated dyestuff after 90 min, 20 mg l�1 Fe(II), 250 mg l�1 H2O2 photo-Fenton
process and the biodegradable acetic acid standard (first and second addition)
(VSS = 3.92 g l�1, pH 7 and T = 25 8C).
it can be clearly seen that microorganisms showed a fast O2
uptake when feeding with photo-treated dye (even larger than
the uptake of the acetic acid solutions), achieving the
endogenous oxygen uptake rate once finished the ready
biodegradation.
Finally, the acute toxicity of the chosen bioreactor influent
was also determined with Biotox1 bioluminiscence assay. As
happened with the untreated solution (Table 1), the EC50
parameter was larger than the DOC content for all tested times
(EC50 > 100%), indicating that the discoloured effluent was
non-toxic and would not inhibit the bacterial activity of the
further biological treatment. These results corroborate respiro-
metric tests conclusions.
3.3. Aerobic sequencing batch reactor
All experiments in SBR were carried out in two stages: start-
up and operation. During the start-up period (one 10-day
hydraulic retention time (HRT) cycle) the influent was a
completely biodegradable municipal wastewater obtained from
the WWTP, with no photo-treated dye added. The purpose of
this preliminary step (so-called blank run) was to ensure the
biomass viability and to establish, as a reference, the lower
residual DOC that could be achieved by the SBR system. The
steady DOC obtained, attributed to the metabolites released by
the biomass, remained stable at 10.09 � 0.39 mg l�1 C and
settles the lowest boundary of DOC removal.
The operation period was performed once the blank cycle
was completed. Different biodegradation runs were assessed by
feeding the bioreactor with the presumably biocompatible
selected photo-treated solutions. The pH of these had been
previously readjusted from 2.8 to 3.0, to neutral, and they were
treated with the required amount of SO32� to remove the
hydrogen peroxide remaining from photo-Fenton reaction.
The experimental results for each coupled chemical and
SBR process are summarised in Table 3. Initially, an HRT of 2
days was defined. The cycle was repeated as many times as
necessary to allow cells acclimation and/or to obtain repetitive
results. Data from Table 3 clearly exhibits a DOC removal
improvement in SBR when increasing the Fenton catalyst from
10 to 20 mg l�1 Fe(II). DOC removal for 150 min, 10 mg l�1
Fe(II)/250 mg l�1 H2O2 pre-treatment was 46.6%, with a
residual value of 28.62 � 1.02 mg l�1 C, far away from the
10.09 � 0.39 mg l�1 C established as the limit in the blank run.
On the other hand, when working under the 20 mg l�1 Fe(II)/
250 mg l�1 H2O2 oxidising conditions, the percentage of
mineralisation in SBR achieved 58.1% and 59.7% after 60 and
90 min of irradiation, respectively. Therefore, the level of

J. Garcıa-Montano et al. / Applied Catalysis B: Environmental 67 (2006) 86–92 91
Table 3
Summary of experimental results for different assessed photo-Fenton conditions and SBR processes
Photo-Fenton SBR
Fe(II)/H2O2
(mg l�1)
Irradiation
time (min)
Influent DOCa
(mg l�1 C)
Influent
BOD5/CODb
HRT
(days)
Cycles Residual DOCa
(mg l�1 C)
%DOC
removal
10/250 150 53.57 � 1.36 0.29 � 0.02 2 10 28.62 � 1.02 46.6
20/250 60 51.17 � 0.82 0.32 � 0.03 2 7 21.43 � 0.49 58.1
90 38.15 � 1.49 0.36 � 0.05 2 8 15.38 � 0.79 59.7
41.92 � 0.81 1 15 16.62 � 0.62 60.4
a Replicate data have been determined with a minimum of eight values and a = 0.05.b n = 3; a = 0.05.
Fig. 6. %DOC removal in photo-Fenton pre-treatment and SBR coupling
system as a function of photo-Fenton conditions (HRT in SBR = 2 days).
biodegradation increased more than 10 units when doubling the
ferrous salt dose. Although data practically show identical
percentage of DOC removal in the bioreactor for both
experiments, an irradiation period of 90 min seems to be
necessary to precede the biological stage since the DOC
concentration of the final effluent (15.38 � 0.79 mg l�1 C) was
lower than the attained when 60 min pre-treatment had just
taken place (21.43 � 0.49 mg l�1 C). The residual DOC
content was just around 5 mg l�1 C above the previously
defined in the blank run. Thus, it could be assumed that the
applied treatment has successfully removed the reactive dye
from aqueous solution. A longer chemical pre-treatment was
not considered since it would suppose to overcome the 50%
mineralisation during photo-Fenton process, while the final aim
of the present work was to minimise the chemical step in front
of the biological one.
In an attempt to improve the percentage of DOC
mineralisation in the bioreactor, the same set of experiments
was developed by extending the hydraulic retention time to 4
days. Results revealed that the DOC elimination was not
limited by the cycle time duration, since the %DOC removal
was exactly the same (data not shown) than the obtained in the
short cycle. Consequently, it can be concluded that overall SBR
efficiency depends on the nature of the intermediates associated
to each pre-treatment.
The dissimilarities between different assessed photo-Fenton
and SBR coupled runs are better reflected in Fig. 6. This
compares the DOC removal taking into account the percentage
of mineralisation reached by both oxidation stages. The
hydraulic retention time in the bioreactor was 2 days. It is
noticeable that 90 min, 20 mg l�1 Fe(II) and 250 mg l�1 H2O2
were the most favourable pre-treatment conditions for the
combined strategy proposed, with an 80% global DOC removal
achieved. As discussed before, it should be remarked that the
degree of organic matter removal was limited by the remaining
DOC in the effluent corresponding to the biomass metabolites.
On the other hand, it can be stated that 150 min, 10 mg l�1
Fe(II)/250 mg l�1 H2O2 and 60 min, 20 mg l�1 Fe(II)/
250 mg l�1 H2O2 photo-Fenton conditions were not able to
generate enough biocompatible dye by-products, giving place
to 64% and 73% DOC removal efficiencies, respectively.
Once established the best photo-Fenton pre-treatment
conditions, since maximum SBR removal rate is to be
accomplish, the next step of the study was to reduce the
hydraulic retention time in the bioreactor. In this direction, a
new SBR run was performed in a 24-h-cycle mode after 90 min,
20 mg l�1 Fe(II) and 250 mg l�1 H2O2 photo-Fenton reaction
(Table 3). In addition, the biological process was continued for
15 cycles to check that SBR was working under steady
conditions. Results were as follows. With respect to the %DOC
removal and final DOC concentration, once achieved the
steady state, SBR behaved in the same way than with 2 and
4 days operation times, with 60.4% elimination and
16.62 � 0.62 mg l�1 C residual DOC value. The steady state
organic inlet rate was 41.92 mg l�1 day�1 C; the DOC removal
rate was 25.37 mg l�1 day�1 C, and the volatile suspended
solids stabilised at 0.56 � 0.03 g l�1 after the third cycle. Fig. 7
shows the input, output and removed DOC within the 15 cycles.
Such stable operational parameters evidence the good
performance of the sequencing batch reactor.
Photo-Fenton pre-treatment allows traditional activated
sludge to remove Cibacron Red FN-R reactive dye, originally
bio-recalcitrant under aerobic media. On the other hand, as it
has been discussed in Section 1, reactive dyes are potentially
reduced under anaerobic conditions. In this direction,
preliminary anaerobic degradation tests of Cibacron Red
FN-R solutions have been conducted in an attempt to determine
its biodegradability degree in absence of oxygen (data not

J. Garcıa-Montano et al. / Applied Catalysis B: Environmental 67 (2006) 86–9292
Fig. 7. Influent, removed and residual DOC for the 90 min, 20 mg l�1 Fe(II),
250 mg l�1 H2O2 photo-Fenton pre-treatment and 24-h SBR cycle (stabilised
VSS = 0.56 � 0.03 g l�1).
shown). Complete decolourisation occurred but with no
mineralisation, since no DOC removal neither biogas produc-
tion was observed. In addition, generated colourless solutions
were toxic and aerobically not biodegradable.
In this frame, further experiments will be performed
applying the photo-Fenton reaction as a post-treatment of
Cibacron Red FN-R anaerobic degradation.
4. Conclusions
Photo-Fenton process is an effective pre-treatment for the
degradation of Cibacron Red FN-R hetero-bireactive dye in an
aerobic sequencing batch reactor. With an efficient use of
chemical oxidants, dye was degraded into non-toxic and
biodegradable colourless species, able to be treated in the
biological plant.
Biodegradation efficiency due to different chemical oxida-
tion degree was determined. Best pre-treatment conditions
correspond to a Fenton reagent concentration of 20 mg l�1
Fe(II)/250 mg l�1 H2O2 and an irradiation time of 90 min.
BOD5/COD and OD/ODst biodegradability indicators went up
from 0.02 and 0.04 to 0.36 and 0.52 values, respectively, while
complete decolourisation and 49.6% mineralisation were
obtained. Other assessed Fe(II)/H2O2 combinations and
photo-Fenton irradiation times were not able to bio-compati-
bilize the synthetic effluent.
Hydraulic retention times of 4, 2 and 1 days were assessed in
the bioreactor, giving the same biodegradation yields. To
achieve maximum daily DOC removal, 1-day cycle time
duration was established as the minimum SBR mode operation.
A stable 80% DOC removal was achieved for the combined
system, with a residual DOC content of 16.62 � 0.62, near to
the 10.09 � 0.39 mg l�1 C limit marked by the presence of
biomass metabolites. Moreover, a stabilised biomass popula-
tion (VSS = 0.56 � 0.03 g l�1) and a DOC removal rate of
25.37 mg l�1 day�1 C manifested that SBR was working under
steady conditions.
Acknowledgements
This work was supported by CICYT (project PPQ2002-
04060-C02-01) and European Commission (CADOX project,
EVK1-CT-2002-00122).
References
[1] V. Lopez-Grimau, M.C. Gutierrez, Chemosphere 62 (1) (2006) 106–112.
[2] D. Brown, B. Hamburger, Chemosphere 16 (1987) 1539–1553.
[3] C. O’Neill, F.R. Hawkes, S.R.R. Esteves, D.L. Hawkes, S.J. Wilcox, J.
Chem. Technol. Biotechnol. 74 (1999) 993–999.
[4] R. Andreozzi, V. Caprio, A. Insola, R. Marotta, Catal. Today 53 (1999) 51–
59.
[5] B.T. Tan, T.T. Teng, A.K. Omar, Water Res. 34 (2000) 3153–3160.
[6] S.H. Lin, C.C. Lo, Environ. Technol. 17 (8) (1996) 841–849.
[7] L. Tan, R.G. Sudan, J. Am. Water Works Assoc. 84 (1992) 79–87.
[8] S.H. Lin, J. Chem. Technol. Biotechnol. 57 (1993) 387–391.
[9] F. Haber, J. Weiss, Proc. R. Soc. Series A 147 (1934) 332–351.
[10] J. Pignatello, Environ. Sci. Technol. 26 (1992) 944–951.
[11] R. Bauer, H. Fallman, Res. Chem. Intermed. 23 (1997) 341–354.
[12] A. Safarzadeh-Amiri, J.R. Bolton, S.R. Cater, J. Adv. Oxid. Technol. 1
(1996) 18–26.
[13] J.P. Scott, D.F. Ollis, Environ. Prog. 14 (1995) 88–103.
[14] S. Parra, S. Malato, C. Pulgarın, Appl. Catal. B: Environ. 36 (2002) 131–
144.
[15] J. Beltran-Heredia, J. Torregrosa, J. Garcıa, J.R. Domınguez, J.C. Tierno,
Water Sci. Technol. 44 (5) (2001) 103–108.
[16] J. Garcıa-Montano, F. Torrades, J.A. Garcıa-Hortal, X. Domenech, J.
Peral, J. Hazard. Mater. 134 (2006) 220–229.
[17] S.S. Mangat, P. Elefsiniotis, Water Res. 33 (3) (1999) 861–867.
[18] M.C. Tomei, M.C. Annesini, S. Bussoletti, Water Res. 38 (2004) 375–
384.
[19] S. Mace, J. Mata-Alvarez, Ind. Eng. Chem. Res. 41 (2002) 5539–
5553.
[20] APHA–AWWA–WPCF, Standard Methods for the Examination of Water
and Wastewater, ASTM D1252-00, 17th ed., APHA–AWWA–WPCF,
Washington, DC, 1989.
[21] C. Kormann, D.W. Bahnemann, M.R. Hoffmann, Environ. Sci. Technol.
22 (5) (1988) 798–806.
[22] Y.W. Kang, M.-J. Cho, K.-Y. Hwang, Water Res. 33 (5) (1999) 1247–1251.
[23] C.D. Adams, P.A. Scanlan, N.D. Secrist, Environ. Sci. Technol. 28 (1994)
1812–1818.
[24] OECD Guidelines for Testing of Chemicals, Test 302B, vol. 2, 1996.
[25] M. Rodrıgez, V. Sarria, S. Esplugas, C. Pulgarin, J. Photochem. Photobiol.
A: Chem. 151 (2002) 129–135.

A
FpeteHh©
K
1
ptotov[h(sottw
0d
Journal of Hazardous Materials A138 (2006) 218–225
Environmental assessment of different photo-Fentonapproaches for commercial reactive dye removal
Julia Garcıa-Montano a, Nilbia Ruiz a, Ivan Munoz a, Xavier Domenech a,Jose A. Garcıa-Hortal b, Francesc Torrades c, Jose Peral a,∗
a Departament de Quımica, Edifici Cn, Universitat Autonoma de Barcelona, E-08193 Bellaterra, Barcelona, Spainb Departament d’Enginyeria Textil i Paperera, ETSEIA de Terrassa (UPC), C/Colom 11, E-08222 Terrassa, Barcelona, Spain
c Departament d’Enginyeria Quımica, ETSEIA de Terrassa (UPC), C/Colom 11, E-08222 Terrassa, Barcelona, Spain
Received 20 April 2006; received in revised form 18 May 2006; accepted 19 May 2006Available online 26 May 2006
bstract
An environmental study using life cycle assessment (LCA) has been applied to three bench-scale wastewater treatments for Cibacron RedN-R hetero-bireactive dye removal: artificial light photo-Fenton process, solar driven photo-Fenton process and artificial light photo-Fentonrocess coupled to a biological treatment. The study is focused on electricity and chemicals consumption, transports and atmosphere and watermissions generated by the different processes involved. Results show that the artificial light photo-Fenton process is the worst treatment inerms of environmental impact. On the other hand, both solar driven and coupled to biological photo-Fenton processes reduce significantly the
nvironmental damage, although none can be identified as the best in all impact categories. The major environmental impact is attributed to the2O2 consumption and to the electrical energy consumption to run the UVA lamp. An economic analysis of the different photo-Fenton processesas also been performed and the results are discussed together with those obtained from the environmental assessment.2006 Elsevier B.V. All rights reserved.
l treat
iaep4l
dtamte
eywords: Textile reactive dye; Photo-Fenton’s oxidation; Sunlight; Biologica
. Introduction
Reactive dyes have been identified as the most environmentalroblematic compounds in textile dye effluents [1]. Therefore, inhe last decade, attention has been focused on the developmentf new treatment technologies that leads to complete destruc-ion of the dye molecules. Among these treatments, advancedxidation processes (AOPs) are a powerful alternative to con-entional treatment methods for wastewater decontamination2]. These treatments are based on the in situ generation ofighly reactive hydroxyl radicals as a primary oxidant speciesHO•). These radicals are high oxidant species (E = 2.8 V ver-us NHE) that are able to mineralise almost all recalcitrantrganic compounds under mild experimental conditions. Among
he considered AOPs, the Fenton and photo-Fenton type reac-ions are very promising since they achieve high reaction yieldsith a low treatment cost [3]. In Fenton reaction, hydroxyl rad-∗ Corresponding author. Tel.: +34 93 581 2772; fax: +34 93 581 2920.E-mail address: [email protected] (J. Peral).
ift
dps
304-3894/$ – see front matter © 2006 Elsevier B.V. All rights reserved.oi:10.1016/j.jhazmat.2006.05.061
ment; Life cycle assessment; Economic study
cals are generated by interaction of H2O2 with ferrous salt inqueous media. The rate of contaminant degradation is consid-rably increased via photochemical reaction in the photo-Fentonrocess. Moreover, since the reaction requires radiations up to10 nm [4], photo-Fenton reaction offers the possibility of sun-ight exploitation.
On the other hand, AOPs are currently being object of theevelopment for new application areas. When working withoxic or non-biodegradable wastewaters, AOPs are employeds a pre-treatment of standard biological treatments. Completeineralisation is avoided in the chemical process, being the goal
he generation of a new biocompatible effluent [5,6]. In any case,very strategy must be developed paying special attention tots potential environmental impact. In this way, environmentalactors must be taken into account for the most suitable waterreatment technique selection.
In this paper, a representative commercial hetero-bireactiveye, 250 mg/l Cibacron Red FN-R, is taken as a model com-ound for the environmental impact assessment of different lab-cale wastewater treatments. The photo-Fenton reaction, under

azar
bttstp
1tLmyat(aim
ctt
2
2
(biwdttfsi
2
(c2aebftwi(
2
b
aa(pwr2aciNs
2
CtspwDccb2c
2
lF(tb
FF2wedlo(pp(t2Ai
J. Garcıa-Montano et al. / Journal of H
oth artificial and solar irradiation, is applied as a single processo degrade the pollutant. In another scenario, just partially photo-reated dye solution was subsequently submitted to an aerobicequencing batch reactor (SBR), that is an efficient alternativeo conventional biological systems for a wide variety of modelollutants and real wastewaters biodegradation [7].
The life cycle assessment (LCA) tool, according to ISO4.040 Standard [8], is applied to carry out the environmen-al impact evaluation. Four distinguishable phases constitute theCA sequence: (1) goal and scope, in which the purpose, scope,ain hypothesis and data quality are defined, (2) inventory anal-
sis, in which data are collected in order to quantify the inputsnd outputs of the system, (3) impact assessment, where poten-ial environmental impacts are identified and characterised, and4) interpretation, in which the results of the inventory analysisnd impact assessment are discussed in the light of the goals setn the beginning of the study, identifying the areas for environ-
ental improvement of the system under study.Finally, an economic study based on adding the costs of all
hemicals and energy consumption through the life cycle ofhe different treatments has also been considered and discussedogether with the environmental assessment.
. Materials and methods
.1. Synthetic dye solution
A commercial hetero-bireactive azodye, Cibacron Red FN-RC.I. Reactive Red 238, C29H15ClFN7O13S4Na4) was suppliedy CIBA and used as received without further purification. Thenitial Cibacron Red FN-R concentration for all the experimentsas 250 mg/l. In order to simulate batch-dyeing conditions, theye was hydrolysed by adjusting the pH of synthetic solutionso 10.6, followed by heating to 60 ◦C for 1 h. Finally, pH ofhe hydrolysed dye solutions was adjusted between 2.8 and 3.0or AOP operation. The dissolved organic carbon (DOC) of theynthetic effluent was 79.46 ± 1.34 mg/l C and the BOD5/CODndex was 0.02 ± 0.02 (n = 3, α = 0.05).
.1.1. Photo-Fenton oxidationPhoto-Fenton oxidation was conducted in a thermostated
T = 23 ± 1 ◦C) well-stirred cylindrical Pyrex cell of 300 ml ofapacity (78.54 cm2 surface). The dye solution volume was50 ml. Analytical grade hydrogen peroxide (33% w/v, Panreac)nd FeSO4·7H2O (99.5%, Merck) were used as received to gen-rate hydroxyl radical (HO•) in aqueous solution. A 6 W Philipslack light fluorescent lamp, situated over the reactor, was usedor artificial light photo-Fenton experiments. The intensity ofhe incident UVA light, measured employing a luminometer,as 0.6 mw/cm2. Solar light experiments were performed dur-
ng sunny days of July at Universitat Autonoma de Barcelona45 m a.s.l., 41◦30′N, 2◦6′E).
.2. Biological treatment
The biological treatment system was composed of a 2 l aero-ic bench-scale sequencing batch reactor (SBR), equipped with
fcbS
dous Materials A138 (2006) 218–225 219
n air diffuser and agitation. The activated sludge, coming frommunicipal wastewater treatment plant (WWTP) in Manresa
Catalonia, Spain), was initially around 0.6 g/l of volatile sus-ended solids (VSS) concentration. The operating liquid volumeas 1.2 l and the hydraulic retention time was 24 h. Temperature
emained stable and close to room conditions, between 21 and3 ◦C. The concentration of dissolved oxygen (DO) was keptbove 3 mg/l O2. Daily analyses of VSS, DO and DOC werearried out, and pH adjustment between 6.5 and 7.5 was donef necessary. Suitable proportions of nutrients (MgSO4, CaCl2,H4Cl and NaH2PO4 buffer at pH 7) were also added to the
olution [9].
.3. Analysis
DOC was determined with a Shimadzu TOC-VCSH analyser.hemical oxygen demand (COD, mg/l O2) was assessed by
he closed reflux colorimetric method with a HACH DR/2000pectrophotometer [9]. H2O2 consumption was tested by theotassium iodide titration method [10]. Accordingly, correctionas made in the COD measurement for residual H2O2 [11].etermination of total suspended solids (TSS, g/l) and VSS was
arried out gravimetrically [9]. The measurement of biochemi-al oxygen demand for 5 days (BOD5, mg/l O2) was performedy means of a mercury-free WTW 2000 Oxytop thermostated at0 ◦C. Ammonium ion concentration was determined by Nesslerolorimetric assay [9].
.4. Life cycle assessment methodology
The environmental impact assessment is focused on the fol-owing small-scale wastewater treatments: artificial light photo-enton process (scenario 1), solar driven photo-Fenton processscenario 2) and artificial light photo-Fenton process coupledo a biological treatment (scenario 3). The DOC parameter haseen used as indicator of pollutant removal.
A preliminary optimisation study to degrade Cibacron RedN-R reactive dye was carried out by testing the followingenton reagent dose: 10 mg/l Fe (II) combined with 125,50 and 500 mg/l of H2O2, and 20 mg/l Fe (II) combinedith 250 and 500 mg/l H2O2 concentrations [12]. The best
xperimental conditions that give rise to a more efficient dyeegradation were 20 mg/l Fe (II) and 500 mg/l H2O2, whichead to a maximum mineralisation level (around 80–90%f the initial DOC) after relatively short irradiation timesFig. 1). These conditions were used for single photo-Fentonrocesses (scenarios 1 and 2). On the other hand, when thehoto-Fenton oxidation was just applied as a pre-treatmentscenario 3), the H2O2 dose was reduced in order to softenhe chemical consumption. In this way, 20 mg/l Fe (II) and50 mg/l H2O2 were enough to bio-compatibilize the effluent.fter an irradiation time of 90 min, with just 49.6% mineral-
sation and 21 mg/l remaining H2O2, BOD5/COD ratio went
rom 0.02 ± 0.02 up to 0.36 ± 0.05 (n = 3, α = 0.05) (Fig. 2),lose to 0.4, which is the characteristic value for completelyiodegradable wastewaters [13]. Afterwards, the aerobicBR treatment was performed until achieving 80% global
220 J. Garcıa-Montano et al. / Journal of Hazardous Materials A138 (2006) 218–225
FtH
Ds
rrsa1ut
Laicodga
FR2
F
sTmaisece
2
(
ig. 1. DOC/DOCo evolution vs. time for 250 mg/l Cibacron Red FN-R degrada-ion with artificial and solar light photo-Fenton reaction: 20 mg/l Fe (II), 500 mg/l
2O2, pH 3 and T = 23 ◦C.
OC removal (accumulated in the chemical plus biologicaltages).
The functional unit (the unit of service to which the envi-onmental burdens must be referred) has been defined as “theemoval of 80% DOC from 1.2 l of 250 mg/l Cibacron Red FN-Rynthetic effluent”. To achieve this % DOC elimination, singlertificial light and solar driven photo-Fenton processes required50 and 50 min of treatment periods, respectively (Fig. 1). Resid-al hydrogen peroxide concentrations of 19 mg/l were found athe end of both experiments.
The flow diagrams and boundaries considered to perform theCA are shown in Figs. 3 and 4. The inputs and outputs includedre: (i) the electricity consumption by the different processesnvolved, including extraction of resources, transport and energyonversion, (ii) the chemicals consumption, including extractionf resources, production of the corresponding chemicals and the
ifferent transport steps, and (iii) the air and water emissionsenerated through the considered scenarios. The constructionnd the end-of-life of each system have not been considered.ig. 2. DOC/DOCo and BOD5/COD evolution vs. time for 250 mg/l Cibacroned FN-R degradation with artificial light photo-Fenton reaction: 20 mg/l Fe(II),50 mg/l H2O2, pH 3 and T = 23 ◦C.
(
(
(
(
TS
D
EHIQAHT
ig. 3. Simplified flow diagram and system boundaries for scenarios 1 and 2.
The main environmental burdens associated to the definedystems and referred to the functional unit have been inventoried.he sources and quality of the data handled in this assessment,ostly obtained from Ecoinvent database version 1.1 [14,15],
re detailed in Table 1.The main hypothesis assumed in thenventory phase of the LCA are the following: as a general con-ideration, those inputs, outputs or processes common to all thevaluated scenarios have been excluded, i.e., auxiliary reagentsonsumption for pH adjustments or residual iron sludge recov-ry for disposal.
.4.1. Photo-Fenton process
1) The energy used to run the black light has been assumed tobe electricity delivered from the European grid. In order toconsider operational conditions similar to those employed ina full-scale photochemical reactor, 100% efficiency has beenconsidered. This implies to assume that all the UV-photonsemitted by the lamp reach the solution. In the laboratoryset-up, this efficiency has been calculated to be only around0.8% (0.6 mW/cm2 UVA light measured by the luminometermultiplied by the 78.54 cm2 photo-reactor surface).
2) H2O2 and FeSO4 are assumed to be produced in Spain anddelivered from the supplier to the site by 16 t-trucks over a50 km distance.
3) It is assumed that residual H2O2 is totally decomposed aftereach photo-Fenton process.
4) CO2 emissions have been estimated from DOC mineralisedby chemical oxidation.
5) Residual DOC, COD and ammonium ion content have beenconsidered for final effluent impact assessment.
able 1ummary of data used in the inventory phase of the LCA
ataset
lectricity, low voltage, production UCTE, at grid/UCTE S [28]ydrogen peroxide, 50% in H2O, at plant/RER S [29]
ron sulphate, at plant/RER S [28]uicklime, milled, packed, at plant/CH S [30]crylonitrile, at plant/RER S [31]eat diesel B250 [25]ransport, lorry 16 t/CH S [32]

J. Garcıa-Montano et al. / Journal of Hazardous Materials A138 (2006) 218–225 221
and sy
2
(
(
(
(
(
(
(
Fig. 4. Simplified flow diagram
.4.2. Biological treatment
1) It is considered that the bench-scale sequencing batch reac-tor behaved as a real conventional biological treatment pro-cess. A municipal WWTP with a 0.76 VSS/TSS ratio ischosen as a model for the estimation, assuming an excesssludge production of 0.55 mg VSS per mg COD consumed[16].
2) External electricity consumption for mechanical aerationequipment has been considered. In this way, the figure 1.5 kgO2/kWh [17] has been taken into account. The consumedoxygen, required for nitrification and organic matter oxida-tion processes, has been determined from removed COD inthe bioreactor (34 mg per functional unit) minus the CODfraction assimilated by biomass for cells grown, quantifiedas 1.42 mg COD per mg VSS of sludge production [16].
3) The CO2 emissions have been determined from oxygenrequirements, considering that O2 is mainly employed tooxidise organic substrate.
4) It is considered a subsequent sludge treatment system com-posed of several independent unit processes [18]: thicken-ing, dewatering and stabilisation processes. By means ofthis treatment, a dewatered sludge with 31% final dry mat-ter content (DM) is obtained. About 50 kWh of electricityand 4 kg of polymers are considered to be consumed at thethickening and 40 kWh and 5 kg of polymer at dewateringper ton of DM of sludge. On the other hand, 200 kg lime perton of DM of sludge is needed for stabilisation while 5 kWhof electricity is consumed for pumping and mixing it [18].
5) It is assumed that solid residues from exceeding sludgemanagement are finally deposited at landfill. The main envi-ronmental emissions from landfill (leachate and landfillgas) are calculated according to the ORWARE (OrganicWaste Research) theoretical model [19,20]. By means of thismodel, the air/water/land distribution of different elementspresent at landfill is obtained, considering a period of 100years for biochemical stabilisation after anaerobic sludgedigestion. An input to the model is the sludge composition:
C8H15O4N (typical municipal WWTP sludge, [21]), whichis anaerobically degraded according to reaction (1) [21].C8H15O4N + 3H2O → 4.5CH4 + 3.5CO2 + NH3 (1)as
stem boundaries for scenario 3.
The model considers that leachate generated at landfill istreated biologically and that recovered biogas (99% bothCO2 and CH4, [22]) is totally burned in a torch. It is assumeda 50% of capture efficiency for biogas [23] and 90% forleachate [24]. Fugitive biogas and leachate reach atmo-sphere and aquatic media, respectively. Considered removalyields for captured leachate in subsequent biological treat-ment are 90% for both COD and BOD7 [22] and 80%for N–NH4
+ [23]. Atmosphere emissions and the manage-ment of sludge generated at leachate treatment have beenexcluded from the inventory.
With respect to the energy requirements, 1.8 l diesel con-sumption per ton of fresh sludge is considered for machineryoperation at landfill [22]. The energy consumption (electric-ity) for leachate treatment has been quantified as a functionof the BOD7 and NH4
+ eliminated, following the ORWAREmethodology. The electricity consumption for biogas pump-ing is considered to be 0.013 kWh/m3. It has been deter-mined indirectly from BUWAL 250 database [25], whichgives 1.35 kWh/t of residue that produces 200 m3 of biogas(from which 53% of biogas is captured). Inventory data forinorganic compounds and energy requirements at landfillresulting from calculations are shown in Table 2.
6) All reagents used have been supposed to be produced inSpain and delivered by 16 t-trucks. The assumed distancefor lime and polymer employed in biological sludge disposalprocesses was 50 km. The average distance for the sludgetransport between the municipal WWTP and the landfill sitehas also been considered to be 50 km.
7) Residual DOC, COD, ammonium and nitrate ions con-tent in the treated effluent have been considered for finaleffluent impact assessment. Nitrate concentration has beenestimated considering that all disappeared NH4
+ (5.4 mg perfunctional unit, minus the N fraction assimilated by biomassfor cells grown quantified according to a C8H15O4N VSSsludge composition) was completely oxidised to NO3
−through aerobic biodegradation.
In Table 3 data concerning energy, chemicals consumption,nd generated emissions per functional unit for every consideredcenario are summarized.

222 J. Garcıa-Montano et al. / Journal of Hazar
Table 2Inventory for WWTP sludge (31% DM) deposited at landfill per functional unit
InputsTransport
Truck 16 t (t km) 4.97 × 10⁻⁶
EnergyDiesel (l) 1.72 × 10⁻⁷
Electricity (kWh) 4.35 × 10⁻⁹
Outputsa
Atmosphere emissionsCH4 (mg) 2.27CO2 (mg) 25.4NH3 (mg) 0.01NOx (mg) 0.09
Water emissionsCOD (mg) 0.05NH4
+ (mg) 0.45NO3
− (mg) 1.90
i
cia(tapi(
TEu
I
O
i
2
duioa
3
fahImetscgatHtofi
a Outputs related chemicals and energy consumed are not included here, butn corresponding life cycle inventory dataset.
The impact assessment for each wastewater treatment wasarried out considering the following potential environmentalmpacts categories included in the CML 2000 method [26]:biotic resource depletion (ARD), global warming potentialGWP), ozone depletion potential (ODP), human toxicity poten-ial (HTP), freshwater aquatic toxicity potential (FATP), marinequatic ecotoxicity potential (MAEP), terrestrial ecotoxicity
otential (TEP), photochemical oxidation potential (POP), acid-fication potential (AP) and aquatic eutrophication potentialAEP).able 3nergy usage, chemicals consumption and generated emissions per functionalnit for considered scenarios (excluding landfill inventory)
Scenario 1 Scenario 2 Scenario 3
nputsGrid electricity (kWh) 6.28 × 10⁻⁴ 3.84 × 10⁻⁴
H2O2 50% (mg) 1200 1200 600Truck 16 t (t km) 5.94 × 10⁻⁵ 5.94 × 10⁻⁵ 2.97 × 10⁻⁵
FeSO4 (g) 0.065 0.065 0.065Truck 16 t (t km) 3.25 × 10⁻⁶ 3.25 × 10⁻⁶ 3.25 × 10⁻⁶
CaO (mg) 4.92Truck 16 t (t km) 2.46 × 10⁻⁷
Acrylonitrile (mg) 0.22Truck 16 t (t km) 1.11 × 10⁻⁸
utputsa
Atmosphere emissionsCO2 (mg) 287.5 280.9 170.5
Water emissionsCOD (mg) 46 42 36DOC (mg) 16.93 18.74 19.94NH4
+ (mg) 7.16 4.79 1.76NO3
− (mg) 12.50
a Outputs related chemicals and energy consumed are not included here, butn corresponding life cycle inventory dataset.
IcUwaGsslb
TC
C
AGOHFMTPAA
Adtep
dous Materials A138 (2006) 218–225
.5. Economic study
An economic study has been performed for the three reactiveye treatments on the basis of the previously defined functionalnit. The same boundaries than in the LCA are considered, tak-ng into account chemical and energy costs employed duringperation phases. All other running costs and capital investmentsre excluded.
. Results and discussion
Table 4 shows the characterised values obtained for the dif-erent environmental impacts and the considered scenarios. Rel-tive scores are represented graphically in Fig. 5, in which theighest environmental impact is set to 100% for each category.n view of this, scenario 1 is the wastewater treatment with aajor global impact on the environment, with highest scores for
very considered impact indicator (Table 4). However, whenhe photo-Fenton process is applied as a pre-treatment of aecondary biological treatment (scenario 3), impacts decreaseonsiderably achieving around 45% reduction for most cate-ories (Fig. 5). Fig. 6 exhibits, for single (a) and combined (b)rtificial light photo-Fenton processes, the relative contributionso the impact categories of the different stages of the life cycle:
2O2 and iron sulphate production and consumption, associatedransports, biological treatment and sludge management (with-ut WWTP emissions), grid electricity production and use, andnally emissions from chemical and biological oxidation steps.n both cases, the major impact contribution is attributed to H2O2onsumption, followed by the electricity requirements of theVA lamp. It is worth to note that, for both scenarios, air andater emissions have an important effect on AEP due to NH4
+
nd NO3− ions content; also it is significant the contribution to
WP due to the CO2 emitted during chemical and biological
tages. Finally, the reagents transport effect and iron salt con-umption are not considered important since together representess than 5% in all categories. From manifested similarities ofoth scenarios contributions profiles, it could be stated that theable 4haracterisation of the different environmental impacts for considered scenarios
ategory Unit Scenario 1 Scenario2 Scenario 3
RD kg Sb 8.1 × 10⁻⁶ 5.6 × 10⁻⁶ 4.4 × 10⁻⁶
WP kg CO2 1.3 × 10⁻³ 9.7 × 10⁻⁴ 8.2 × 10⁻⁴
DP kg CFC 11 7.9 × 10⁻¹¹ 6.5 × 10⁻¹¹ 4.2 × 10⁻¹¹
TP kg 1,4-Da 2.4 × 10⁻³ 2.2 × 10⁻³ 1.2 × 10⁻³
ATP kg 1,4-Da 1.7 × 10⁻⁴ 1.5 × 10⁻⁴ 8.8 × 10⁻⁵
AEP kg 1,4-Da 4.9 × 10⁻¹ 2.6 × 10⁻¹ 2.7 × 10⁻¹
EP kg 1,4-Da 1.1 × 10⁻⁵ 4.7 × 10⁻⁶ 6.3 × 10⁻⁶
OP kg C2H4 1.8 × 10⁻⁷ 1.0 × 10⁻⁷ 1.2 × 10⁻⁷
P kg SO2 4.3 × 10⁻⁶ 2.4 × 10⁻⁶ 2.5 × 10⁻⁶
EP kg PO43− 3.7 × 10⁻⁶ 2.8 × 10⁻⁶ 2.8 × 10⁻⁶
RD, abiotic resource depletion; GWP, global warming potential; ODP, ozoneepletion potential; HTP, human toxicity potential; FATP, freshwater aquaticoxicity potential; MAEP, marine aquatic ecotoxicity potential; TEP, terrestrialcotoxicity potential; POP, photochemical oxidation potential; AP, acidificationotential; AEP, aquatic eutrophication potential.a 1,4-Dichlorobenzene.

J. Garcıa-Montano et al. / Journal of Hazardous Materials A138 (2006) 218–225 223
t envi
cioccarf
Fs
iie
Fig. 5. Characterisation values of the differen
hemical stage in the combined treatment supposes the mainmpact, since the biological treatment and subsequent processesnly slightly contribute (12–17%) to the GWP, POP and AEPategories. Therefore, it becomes evident that the lower H2O2
oncentration and the shorter irradiation time employed in thertificial light photo-Fenton pre-treatment are the main factorsesponsible of the impact scores reduction presented in Table 4or scenario 3.ig. 6. Relative contributions to the respective impact categories of the differenttages of the life cycle for scenarios 1 (a) and 3 (b).
acnttttS
FircoPeeoaecf
apsaTFobaoffa
ronmental impacts for considered scenarios.
The characterised values for the different environmentalmpact categories are also reduced when no artificial UVA lights employed (scenario 2) (Table 4). Since there is no use oflectricity from the grid, environmental impacts are directlyssociated with the production of hydrogen peroxide, whoseontribution supposes more than 93% for most categories (dataot shown). It should be noted that, apart from the impact reduc-ion attainment, solar light gives more efficient dye degradationhan artificial light (Fig. 1). This higher efficiency observed withhe use of sunlight is basically due to the higher number of pho-ons between 300 and 400 nm arriving to the earth surface inpain [27] (estimated around 3–4 mW/cm2).
When comparing scenario 2 with the artificial light photo-enton process coupled to the biological treatment (scenario 3),
t is difficult to distinguish which treatment would be more envi-onmentally friendly since data notably vary depending on theategory considered (Fig. 5). Solar driven photo-Fenton processffers better results than the coupled system for MAEP, TEP,OP, AP and AEP. This behaviour can be attributed to the majorlectricity contribution to these impact categories (Fig. 6). How-ver, since electricity does not suppose a large burden for the restf indicators (as H2O2 does), solar driven photo-Fenton impactsre not further reduced and the coupled system becomes morenvironmentally benign. In any case, obtained results allow con-luding that both, scenarios 2 and 3, are more environmentallyriendly alternatives than artificial light photo-Fenton process.
The considered wastewater treatments have also beenssessed from an economic point of view. Employed unitaryrices and cost per functional unit of the different inputs arehown in Tables 5 and 6, respectively. Fig. 7 displays the over-ll costs as a percentage of the most expensive treatment. Fromable 6 and Fig. 7, it can be stated that the artificial light photo-enton process is the most expensive treatment. When carryingut the treatment under solar irradiation or coupled to an ensuingiological process, the estimated relative cost decreased in a 13nd 44%, respectively, being the combined system the cheaper
ption. A reduction of H2O2 dosage and electricity consumptionor UVA irradiation (which contribute in an 81% and 14% costor scenario 1, respectively) in favour of the biological treatmentre the major cause since biological and sludge management
224 J. Garcıa-Montano et al. / Journal of Hazar
Table 5Unitary costs considered for economic study
Product Price (D ) Source
Electricity (kWh) 0.07 [33]H2O2 50% (kg) 0.22 Hera-Segasa S.L. Barcelona, SpainFeSO4 (kg) 0.25 Albaida Recursos Naturales y Medio
Ambiente S.L. Almerıa, SpainLandfill (kg) 0.07 [34]CaO (kg) 0.09 DSM-Deretil, Almerıa, SpainPolymer (kg) 2.69 DSM-Deretil, Almerıa, Spain;
Hera-Segasa S.L. Barcelona, Spain
Table 6Economic cost per functional unit of the different inputs for considered scenarios
Cost (D )
Scenario 1 Scenario 2 Scenario 3
Electricity 4.4 × 10⁻⁵ 2.7 × 10⁻⁵
H2O2 50% 2.6 × 10⁻⁴ 2.6 × 10⁻⁴ 1.3 × 10⁻⁴
FeSO4 1.6 × 10⁻⁵ 1.6 × 10⁻⁵ 1.6 × 10⁻⁵
Landfill 6.8 × 10⁻⁶
CaO 4.4 × 10⁻⁷
Polymer 5.9 × 10⁻⁷
Total 3.2 × 10⁻⁴ 2.8 × 10⁻⁴ 1.8 × 10⁻⁴
F
pc
dtctFmi
4
rfFl
mwamaeatt
latcct1wcejtlpaip
itrd
A
f
R
Fenton system with a sequencing batch reactor, J. Hazard. Mater, in press.
ig. 7. Relative economic cost per functional unit for considered scenarios.
rocesses just suppose a 4.5% of the global combined treatmentost (Fig. 7).
In view of this, considering both environmental and economicata to decide about the suitability of the studied wastewaterreatments, the best environmental/cost option seems to be theoupling of artificial light photo-Fenton process and biologicalreatment (scenario 3). On the other hand, artificial light photo-enton treatment appears as the worst option in both assessmentsainly due to the high hydrogen peroxide and energy demand,
n this order.
. Conclusions
A LCA study has been performed to determine the envi-
onmental suitability of three small-scale wastewater treatmentsor Cibacron FN-R reactive dye removal: artificial light photo-enton process, solar driven photo-Fenton process and artificialight photo-Fenton process coupled to a biological treatment.
dous Materials A138 (2006) 218–225
The artificial light photo-Fenton process is the most environ-entally harmful treatment, mainly due to H2O2 consumptionhich presents the higher environmental impact and scores for
lmost all the categories considered. The electricity require-ents for UVA light irradiation appear in a second place. Finally,
s in the other considered scenarios, air and water emissions gen-rated during dye oxidation have an important effect on AEPnd GWP indicators while iron salt consumption and chemicalsransport to the treatment plant barely contribute in a represen-ative way.
When artificial light photo-Fenton reaction is applied as a bio-ogical pre-treatment, H2O2 dose and electricity consumptionre significantly reduced giving place to around 45% diminu-ion for most environmental impact categories. However, bothontinue to be the highest burdens of the combined process. Inontrast, the biological stage becomes environmentally advan-ageous since it just contributes with small quantities (among2–17%) in GWP, POP and AEP indicators. When comparing itith the solar driven photo-Fenton process, no clear preferences
an be drawn from all impacts categories. Although using solarnergy as a source of photons avoids electricity consumption, itust gives better environmental benefits than the combined sys-em in five categories from the 10 evaluated since it maintains aarge H2O2 consumption. On the other hand, from the economicoint of view, the coupled process appears to be better achieving44% cost diminution with respect to the most expensive one,
n front of the 13% reduction attained with the solar assistedrocess.
As a final remark, and taking these results as starting point, its predictable that a solar driven photo-Fenton process coupledo a biological treatment would be the best economic and envi-onmental option to remove Cibacron FN-R hetero-bireactiveye from textile effluent.
cknowledgement
The authors wish to thank to MEC (project CTQ 2005-02808)or financial support.
eferences
[1] C.M. Carliell, S.J. Barclay, C.A. Buckley, Treatment of exhausted reactivedye bath effluent using anaerobic digestion: laboratory and full scale trials,Water S.A. 22 (1996) 225–233.
[2] R. Andreozzi, V. Caprio, A. Insola, R. Marotta, Advanced oxidation pro-cesses (AOP) for water purification and recovery, Catal. Today 53 (1999)51–59.
[3] R. Bauer, H. Fallman, The photo-Fenton oxidation–a cheap and efficientwastewater treatment method, Res. Chem. Intermediat. 23 (1997) 341–354.
[4] P.L. Huston, J. Pignatello, Degradation of selected pesticide active ingre-dients and commercial formulations in water by the photo-assisted Fentonreaction, Water Res. 33 (1999) 1238–1246.
[5] J. Garcıa-Montano, F. Torrades, J.A. Garcıa-Hortal, X. Domenech, J. Peral,Degradation of Procion Red H-E7B reactive dye by coupling a photo-
[6] V. Sarria, S. Parra, N. Adler, P. Peringer, N. Benitez, C. Pulgarin, Recentdevelopments in the coupling of photoassisted and aerobic biological pro-cesses for the treatment of biorecalcitrant compounds, Catal. Today 76(2002) 301–315.

azar
[
[
[
[
[
[
[
[
[
[
[
[
[
[
[
[
[
[[
[
[
[
[
[
J. Garcıa-Montano et al. / Journal of H
[7] S. Mace, J. Mata-Alvarez, Review of SBR technology for wastewater treat-ment: an overview, Ind. Eng. Chem. Res. 41 (2002) 5539–5553.
[8] ISO 14040, Environmental management – Life Cycle Assessment – Prin-ciples and Framework, Switzerland, 1997.
[9] APHA-AWWA-WPCF, Standard Methods for the Examination of Waterand Wastewater, ASTM D1252-00, 17th ed., APHA-AWWA-WPCF, Wash-ington, DC, 1989.
10] C. Kormann, D.W. Bahnemann, M.R. Hoffmann, Photocatalytic productionof H2O2 and organic peroxides in aqueous suspensions of TiO2, ZnO anddesert salt, Environ. Sci. Technol. 22 (5) (1988) 798–806.
11] Y.W. Kang, M.-J. Cho, K.-Y. Hwang, Correction of hydrogen peroxideinterference on standard chemical oxygen demand test, Water Res. 33 (5)(1999) 1247–1251.
12] J. Garcıa-Montano, F. Torrades, J.A. Garcıa-Hortal, X. Domenech, J. Peral,Combining photo-Fenton process with aerobic sequencing batch reactorfor commercial hetero-bireactive dye removal, Appl. Catal. B-Environ, inpress.
13] E. Chamarro, A. Marco, S. Esplugas, Use of Fenton reagent to improveorganic chemical biodegradability, Water Res. 35 (2001) 1047–1051.
14] R. Frischknecht, H.J. Althaus, G. Doka, R.S. Dones, R. Hischier, N. Jung-bluth, T. Nemecek, G. Rebitzer, M. Spielmann, Code of Practice, Finalreport ecoinvent 2000 No. 2, Swiss Centre for Life Cycle Inventories,Duebendorf, Switzerland, 2003.
15] R. Frischknecht, H.J. Althaus, G. Doka, R. Dones, T. Heck, S. Hellweg, R.Hischier, N. Jungbluth, T. Nemecek, G. Rebitzer, M. Spielmann, Overviewand Methodology, Final Report Ecoivent 2000 No. 1, Swiss Centre for LifeCycle Inventories, Duebendorf, Switzerland, 2004.
16] C. Jimenez-Gonzalez, R.M. Overcash, A. Curzons, Waste treatmentmodules—a partial life cycle inventory, J. Chem. Technol. Biot. 70 (2001)707–716.
17] Metcalf & Eddy, Wastewater engineering: treatment, disposal and reuse,McGraw-Hill, Singapore, 1991.
18] Y. Suh, P. Rousseaux, A LCA of alternative wastewater sludge treatmentscenarios, Resour. Conserv. Recy. 35 (3) (2002) 191–200.
19] K. Mingarini, Systems Analysis of Organic waste with Emphasis on Mod-elling of the Incineration and the Landfilling Process, Licentiate Thesis,Department of Environmental Technology and Work Science, KTH, Stock-holm, 1996.
20] M. Dalemo, The ORWARE simulation model. Anaerobic Digestion andSewage plant Sub-models, Licentiate Thesis, AFR-Report 152, SwedishInstitute of Agricultural Engineering, Swedish University of AgriculturalSciences (SLU), Swedish Environmental Protection Agency, Uppsala,1997.
[
dous Materials A138 (2006) 218–225 225
21] G. Tchobanoglous, H. Theisen, S. Vigil, Integrated Solid Waste Man-agement: Engineering Principles and Management Issues, McGraw-Hill,Singapore, 1993.
22] X. Domenech, J. Rieradevall, P. Fullana, Application of life cycle assess-ment to landfilling, Int. J. Life Cycle Assessment 2 (3) (1997) 141–144.
23] P. Nielsen, M. Hauschild, Product specific emissions from municipal solidwaste landfills. Part I: landfill model, Int. J. Life Cycle Assessment 3 (3)(1998) 158–168.
24] J. Bez, G. Goldhan, M. Heyde, Waste treatment in product specific life cycleinventories. An approach of material-related modelling. Part II: sanitaryLandfill, Int. J. Life Cycle Assessment 3 (2) (1998) 100–105.
25] K. Habersatter, Okoinventare fur Verpackungen, Bundesamt Fur Umwelt,Wald, Und Landschaft (BUWAL), Schriftenreihe Umwelt 250, Bern, 1996.
26] J.B. Guinee, M. Gorree, R. Heijungs, G. Huppes, R. Kleijn, H.A. Udode Haes, E. Van der Voet, M.N. Wrisberg, Life Cycle Assessment. AnOperational Guide to ISO Standards, vols. 1–3, Centre of EnvironmentalScience, Leiden University (CML), The Netherlands, 2002.
27] S. Malato, Plataforma Solar de Almerıa, Personal communication, 2003.28] R. Dones, C. Bauer, B. Burger, M. Faist, R. Frischknecht, T. Heck. N.
Jungbluth, A. Roder, Sachbilanzen von Energiesystemen: Grundlagen furden okologischen Vergleich von Energiesystemen und den Einbezug vonEnergiesystemen in Okobilanzen fur die Schweiz, Final report ecoinvent2000 No 6, Swiss Centre for Lyfe Cycle Invenrories, Paul Scherrer InstitutVilligen, Switzerland, 2003.
29] H.J. Althaus, M. Chudacoff, R. Hischier, N. Jungbluth, A. Primas, M.Osses, Life Cycle Inventories of Chemicals, Final Report Ecoinvent 2000No. 8, Swiss Centre for Life Cycle Inventories, Duebendorf, Switzerland,2003.
30] D. Kellenberger, H.J. Althaus, N. Jungbluth, T. Kunniger, Life Cycle Inven-tories of Building Products, Final Report Ecoinvent 2000 No. 7, SwissCentre for Life Cycle Inventories, Duebendorf, Switzerland, 2003.
31] R. Hischier, Life Cycle Inventories of Packaging and Graphical Paper, FinalReport Ecoinvent 2000 No. 11, Dubendorf, Swiss Centre for Life CycleInventories, Switzerland, 2004.
32] M. Spielmann, T. Kagi, O. Tietje, Life Cycle Inventories of Transport Ser-vices, Final Report Ecoinvent 2000 No. 14, Swiss Centre for Life CycleInventories, Duebendorf, Switzerland, 2003.
33] J. Roca, Engineering and management of renewable energies, Master’s
degree (Sessions 41, 42), Institut Catala de Tecnologia, 2001.34] W. Jenseit, H. Stahl, V. Wollny, R. Wittlinger, Recovery Options forPlastic Parts from End-of-Life Vehicles: an Eco-Efficiency Assess-ment, prepared by Oko-Institut e.V. for APME, Darmstadt, Deutschland,2003.

CHAPTER 5. CONCLUDING REMARKS

Chapter 5
Concluding Remarks
The main conclusions drawn from the various studies of the present thesis can be
summarised as follows:
1. Fenton and photo-Fenton Advanced Oxidation Processes (AOPs) accomplish,
under optimum reagents concentrations, a full decolourisation and a substantial
mineralisation of the studied reactive azo dye solutions.
2. The degradation efficiency of both artificial and solar driven photo-Fenton
processes is superior to the dark process due to the positive effect of the irradiation
source. Particularly good results are obtained when using solar radiation.
3. Temperatures above than room temperature notably accelerate the initial stages of
Fenton and photo-Fenton processes though do not provide any considerable
advantage at long reaction times.

COMBINATION OF AOPS AND BIOLOGICAL TREATMENTS FOR COMMERCIAL REACTIVE AZO DYES REMOVAL 174
4. Photo-Fenton process can be effectively used as a pre-treatment of an aerobic
biological treatment. With a partial oxidation run under proper mild conditions,
dye solutions become decolourised, biodegradable as well as non toxic.
5. The combined photo-Fenton-aerobic biological treatment completely decolourises
and mineralises the studied reactive dyes solutions.
6. The artificial light photo-Fenton-aerobic biological process is a better economic
and environmental option than single artificial light or solar driven photo-Fenton
processes. The major economic/environmental burden is mainly attributed to
hydrogen peroxide requirements, followed by the electrical energy consumption to
run the UVA lamp.
7. The solar driven photo-Fenton-aerobic biological system would be the best option
in terms of photo-Fenton pre-treatment effectiveness, environmental impact and
operational cost.
8. Focusing on future full scale implementations, either single photo-Fenton or
photo-Fenton-aerobic biotreatment may be successfully scaled-up from laboratory
to pilot plant.
9. The photo-Fenton degradation sequence appears to begin with the hydroxyl
radical attack to azo groups, giving place to the solutions decolourisation. The
following aromatics degradation generates either short chain carboxylic acids –
finally yielding CO2 and water– or the recalcitrant triazine moiety. An important
part of the heteroatoms initially present in the molecule gradually appear as
innocuous final products of inorganic nature.
10. The sequenced anaerobic-aerobic biological treatment is not a plausible
technology for the complete decolourisation and mineralisation of the reactive dye
under study. Conversely, AOPs can be efficiently performed as a post-treatment of
an anaerobic biological treatment, supposing an attractive alternative to the
chemical-aerobic biotreatment strategy.

ANNEXES

Annexe 1
Unpublished Results

ANNEXE 1. UNPUBLISHED RESULTS 179
A.1.1. Pilot plant scale reactive dyes degradation by solar photo-Fenton and biological processes
Julia García-Montañoa,*, Leonidas Pérez-Estradab, Isabel Ollerb, Manuel I. Maldonadob,
Francesc Torradesc, José Perala
aDepartament de Química, Edifici Cn, Universitat Autònoma de Barcelona, 08193 Bellaterra
(Barcelona), Spain
bPlataforma Solar de Almería-CIEMAT. Carretera Senés km4, 04200 Tabernas (Almería),
Spain
cDepartament d’Enginyeria Química. ETSEIA de Terrassa (UPC), C/Colom, 11, 08222
Terrassa (Barcelona), Spain
Submitted for publication
*Corresponding author
J. García-Montaño: [email protected]

180 COMBINATION OF AOPS AND BIOLOGICAL TREATMENTS FOR COMMERCIAL REACTIVE AZO DYES REMOVAL
Abstract
Solar photo-Fenton reaction as a stand-alone process and as a pre-treatment of an
aerobic biological treatment for Procion Red H-E7B and Cibacron Red FN-R reactive
dyes degradation has been carried out at pilot plant scale. Photo-Fenton oxidation was
conducted using a Compound Parabolic Collector (CPC) solar photoreactor and the
biological treatment by means of an Immobilised Biomass Reactor (IBR). Artificial
light photo-Fenton experiments carried out at laboratory scale have been taken as
starting point. When applying photo-Fenton reaction as a single process, 10 mg·l-1 Fe
(II) and 250 mg·l-1 H2O2 for 250 mg·l-1 Procion Red H-E7B treatment and 20 mg·l-1 Fe
(II) and 500 mg·l-1 H2O2 for 250 mg·l-1 Cibacron Red FN-R treatment closely
reproduced prior laboratory mineralisation results, with 82 and 86% Dissolved Organic
Carbon (DOC) removal, respectively. Nevertheless, the use of sunlight with the CPC
photoreactor increased the degradation rates allowing the reduction of Fe (II)
concentration from 10 to 2 mg·l-1 (Procion Red H-E7B) and from 20 to 5 mg·l-1
(Cibacron Red FN-R) without efficacy loses. Carboxylic acids, SO42-, NH4
+ and NO3-
generation were monitored along dyes solution mineralisation. Finally, in the combined
photo-Fenton-biological system, reagents doses of 5 mg·l-1 Fe (II) and 225 mg·l-1 H2O2
for Cibacron Red FN-R and 2 mg·l-1 Fe (II) and 65 mg·l-1 H2O2 for Procion Red H-E7B
were enough to generate biodegradable solutions to feed the IBR, even improving bench
scale results.
Keywords: Immobilised Biomass Reactor; Photo-Fenton; Pilot plant; Reactive dyes;
Sunlight

ANNEXE 1. UNPUBLISHED RESULTS 181
1. Introduction
Textile industry consumes large volumes of water in dyeing and finishing
operations. In textile dyebaths, the degree of fixation of dyes is never complete resulting
in dye-containing effluents [1]. The release of such coloured wastewaters to the
environment is a dramatic source of aesthetic pollution, eutrophication and
perturbations in aquatic life. Due to their chemical stability, most manufactured dyes are
not amenable to common chemical or biological treatments. The increased public
concern and the stringent international environmental standards (ISO 14001, November
2004) have prompted the need to develop novel treatment methods for converting
organic contaminants, such as dyestuffs, to harmless final products.
Advanced Oxidation Processes (AOPs) are powerful technologies for the
remediation of wastewaters containing recalcitrant organic pollutants [2]. Although
AOPs include different reacting systems, their mechanisms are basically characterised
by the in situ generation of highly reactive and non selective hydroxyl radicals (HO·, Eº
= 2.8 V versus NHE), able to oxidise and mineralise almost all organic compounds to
CO2, H2O and inorganic ions. Among available AOPs, the Fenton and photo-Fenton
processes are of special interest because they offer high reaction yields with a low
treatment cost [3]. In dark Fenton reaction (Equation 1, H2O ligands on iron sphere
coordination are omitted in the successive), hydroxyl radicals are generated by
interaction of H2O2 with ferrous salts. Generated Fe (III) can be reduced by reaction
with exceeding H2O2 to form again ferrous ion in a catalytic mechanism (Equations 2
and 3) [4].
Fe (II) + H2O2 → Fe (III) + HO· + HO- (1)
Fe (III) + H2O2 → HO2· + Fe (II) + H+ (2)
Fe (III) + HO2· → Fe (II) + O2 + H+ (3)

182 COMBINATION OF AOPS AND BIOLOGICAL TREATMENTS FOR COMMERCIAL REACTIVE AZO DYES REMOVAL
Radiation can play different roles that lead to an improvement of the reaction yields.
It drives photo-Fenton reaction by means of ferric aquo-complexes photolysis,
producing extra HO· and the recovery of Fe (II) needed in Fenton reaction (Equation 4,
being [Fe (III) HO]2+ the dominant ferric species in solution at pH = 2-3) [5]. The
irradiated process may also involve photolysis of a Fe (III)-H O complex to form high-
valent iron intermediates, which can directly oxidize organic matter [6]. Moreover, it
can drive ligand-to-metal charge transfer in the potentially photolabile complexes
formed by Fe (III) and organic compounds (Equation 5), a process that has been well
proven for the complexes formed between Fe (III) and the carboxylic acid moiety [7].
2 2
In
photo-Fenton system, as in the dark process, iron acts as a catalyst and the rate-limiting
step is the regeneration of ferrous ion.
[Fe (III) HO]2+ ⎯⎯ →⎯ υh Fe (II) + HO· (4)
[Fe (III) L]2+ ⎯⎯ →⎯ υh Fe (II) + L· (L = organic ligand) (5)
Since photoassisted processes may require radiations from UV up to visible (~ 550
nm) [7, 8], they present the possibility of be driven under solar irradiation offering
additional economic and environmental advantages. Another important improvement
for the reduction of economic and environmental impacts is the performance of the
AOP as a pre-treatment of a conventional biological treatment, a suitable approach for
the removal of non biodegradable compounds in water. Lower amounts of chemicals
and energy are supplied to achieve an intermediate solution fully biodegradable [9-11].
The bench scale artificial light assisted photo-Fenton process alone and as a pre-
treatment of an aerobic biological process for the degradation of two textile reactive
dyes (Procion Red H-E7B, a homo-bireactive dye with two monochlorotriazine groups,
and Cibacron Red FN-R, a hetero-bireactive dye with vinylsulphone and fluorotriazine
reactive groups) has been previously reported by our group [10, 12, 13]. Taking into
consideration such experiments, the scaling-up from laboratory to pilot plant is
performed in this work. Photo-Fenton experiments are conducted at the Plataforma
Solar de Almería (PSA, Spain) in a Compound Parabolic Collector (CPC) photoreactor

ANNEXE 1. UNPUBLISHED RESULTS 183
under solar irradiation. Initially, single photo-Fenton process with different Fe (II)
concentrations is applied in order to mineralise reactive dye solutions. Dissolved
Organic Carbon (DOC), H2O2 and Fe evolution, original dye disappearance, carboxylic
acids generation and inorganic ions release are studied as a function of irradiation time.
Additionally, biodegradability enhancement as a function of H2O2 consumed is screened
to assess the possibility of a combined chemical-aerobic biological process. In a second
part, solar photo-Fenton precedes an aerobic biological treatment which is carried out in
an Immobilised Biomass Reactor (IBR). The minimum H2O2 dosages needed to
generate completely biodegradable phototreated solutions are quantified. Finally, the
viability of the photo-Fenton process (single or coupled to biotreatment) to treat the
above reactive dyes when extending laboratory experiments to a pilot plant is discussed.
2. Experimental
2.1. Synthetic dye solutions
Commercial Procion Red H-E7B (CI Reactive Red 141, C52H34O26S8Cl2N14,
DyStar) and Cibacron Red FN-R (CI Reactive Red 238, C29H19O13S4ClFN7, CIBA)
reactive dyes were used as received to prepare synthetic dye solutions. Their purity
degree was unknown. The molecular formula of Procion Red H-E7B is shown in Figure
1. Cibacron Red FN-R chemical structure was not disclosed by the supplier. Initial
concentrations of commercial dyes were 250 mg·l-1. In order to convert them into the
form normally found in industrial effluents, solutions were hydrolysed by adjusting the
pH to 10.6 followed by heating to 80 ºC for 6 hours and 60 ºC for 1 hour for Procion
Red H-E7B and Cibacron Red FN-R, respectively. Their initial features were as
follows: DOC: 39 ± 1 and 69 ± 2 mg·l-1 C (n = 3, α = 0.05); Chemical Oxygen Demand
(COD): 108 and 200 mg·l-1 O2; BOD5/COD ratio: 0.10 and 0.02.

184 COMBINATION OF AOPS AND BIOLOGICAL TREATMENTS FOR COMMERCIAL REACTIVE AZO DYES REMOVAL
2.2. Chemicals
All chemicals used throughout this study were of the highest commercially available
grade. Iron sulphate (FeSO4·7H2O, Panreac) and hydrogen peroxide (H2O2 30% w/v,
Panreac) were used as received. Sulphuric acid and sodium hydroxide solutions were
used for pH adjustments. Water in the pilot plant was obtained from the PSA distillation
plant (conductivity < 10 μS·cm-1, SO42- = 0.5 mg·l-1, Cl- = 0.7-0.8 mg·l-1, Total Organic
Carbon (TOC) < 0.5 mg·l-1 C). Ultra pure deionised water from a Milli-Q (Millipore
Co) system was employed to prepare all the reagent solutions.
N N
OH NH
N
N
N
NHN
OHNH
N
N
N
NH
Cl Cl
SO3HHO3S
SO3H
SO3HHO3S
SO3H
SO3HSO3H
N
Figure 1. Chemical structure of Procion Red H-E7B.
2.3. Sample analysis
DOC was determined with a TOC Shimadzu 5050A analyser provided with an ASI-
5000A Shimadzu Auto-sampler. COD was assessed by the closed reflux colorimetric
method [14] with a Spectroquant® kit (10-150 mg·l-1 O2 range, Merck). The
measurement of Biochemical Oxygen Demand for 5 days (BOD5) was performed by
means of a mercury-free WTW 2000 Oxytop thermostated at 20 ºC. Reactive dyes were
analysed using reverse-phase liquid chromatography (flow rate 0.5 ml·min-1) with
UV/Vis detector in a HPLC (Agilent, Series 1100) with C-18 column (Phenomenex
LUNA 5 μm, 3 mm x 150 mm) at 543 nm wavelength. The mobile phases were 5
mmol·l-1 ammonium acetate (A) and methanol (B). A 15 minutes gradient elution was
used from 0% to 100% B for Procion Red H-E7B and from 0% to 50% B for Cibacron
Red FN-R. Ammonium was determined with a Dionex DX-120 ion chromatograph

ANNEXE 1. UNPUBLISHED RESULTS 185
equipped with a Dionex Ionpac CS12A 4 x 250 mm column. Isocratic elution was done
with 10 mmol·l-1 H2SO4 at 1.2 ml·min-1 flow rate. Anion and carboxylic acids
concentrations (in their anionic form) were measured with a Dionex DX-600 ion
chromatograph using a Dionex Ionpac AS11-HC 4 x 250 mm column. The elution
gradient programme for anions was pre-run 5 minutes with 20 mmol·l-1 NaOH,
followed by an injection with 20 mmol·l-1 NaOH for 8 minutes and with 35 mmol·l-1
NaOH for 7 minutes. The flow rate was 1.5 ml·min-1. The gradient programme for
carboxylate anions analysis consisted of a 10-minutes pre-run with 1 mmol·l-1 NaOH,
10 minutes with 15 mmol·l-1 NaOH, 10 minutes with 30 mmol·l-1 NaOH, and 10
minutes with 60 mmol·l-1 NaOH. The flow rate was also 1.5 ml·min-1. Iron
determination was done by colorimetry (Unicam-2, UV/Vis Spectrometer CV2) with
1,10-phenantroline [14]. H2O2 consumption was quantified by the potassium iodide
titration method [15]. Determination of Total Suspended Solids (TSS) was carried out
gravimetrically, following Standard Methods [14].
2.4. Photo-Fenton experimental set-up
All photo-Fenton experiments were carried out under sunlight in a pilot plant at the
PSA (latitude 37º 05’ N, longitude 2º 21’ W). The pilot plant (Figure 2) operated in
batch mode and was composed by three CPCs (concentration factor = 1), one tank and
one recirculation pump.
The collectors (1.03 m2 each) faced south on a fixed platform tilted 37º (local
latitude), and consisted of eight parallel horizontal borosilicate glass-transparent tubes.
Two parabolic aluminium mirrors redirected the radiation toward each tube. Water
flowed directly at 20 l·min-1 from one CPC module to another and finally into the tank,
from where the pump recirculated it back to the CPCs. The total volume (VT) was 35 l
and was separated in two parts: 22 l of total irradiated volume (Vi) and 13 l of dead
reactor volume (tank + connecting tubes) that was not illuminated. More details about
CPC reactor are described elsewhere [16].

186 COMBINATION OF AOPS AND BIOLOGICAL TREATMENTS FOR COMMERCIAL REACTIVE AZO DYES REMOVAL
CPC
Tank
Pump
CPC
Tank
Pump
20 l·min-1
CPCs (Vi = 22 l) 3 x 1.03 m2
Tank
Pump
Figure 2. Scheme of the solar photo-Fenton pilot plant.
Experiments were performed as follows: with collectors covered, after pH
adjustment around 2.8-3.0, the necessary amount of iron salt and hydrogen peroxide
was added to the tank. After 5 minutes of homogenisation (dark Fenton reaction), the
cover was removed and samples were collected at regular time intervals. Solar
ultraviolet radiation (300-400 nm) was measured by a global UV radiometer (Kipp &
Zonen, model CUV 3), tilted 37º as CPCs, which provided data in terms of incident
W·m-2. This gives an idea of the energy reaching any surface in the same position with
regard to the sun. In that way, incident radiation could be evaluated as a function of time
taking into account cloudiness and other environmental conditions. Thus, experiments
could be compared using a corrected illumination time t30W (Equation 6) [17],
(6) 1nnnT
in1n30W,n30W, ttΔt;
VV
30UVΔttt −− −=⋅+=
were tn is the experimental time for each sample, UV is the average solar ultraviolet
radiation measured during Δtn, and t30W is the “normalised illumination time”. In this
case, time refers to a constant solar UV power of 30 W·m-2 (typical solar UV power on
a perfect sunny day around noon). During the present work experimentation, UV

ANNEXE 1. UNPUBLISHED RESULTS 187
intensity ranged between 14 and 37 W·m-2. Since the system was outdoors, temperature
in the reactor was in the range of 25-48 ºC.
2.5. IBR set-up and operation conditions
The biological pilot plant operated in batch mode and was composed by two
independent modules, an IBR and a conditioner tank (50 l). The IBR unit, which
consisted of a 35 l column containing plastic supports (polypropylene, 15 mm of
nominal diameter, Pall®-Ring), was colonised by activated sludge from a municipal
wastewater treatment plant (Almería, Spain). The operational liquid volume was 45 l.
Recirculation was maintained between the conditioner tank and the IBR at 0.5 l·min-1
flow rate. The system was not thermally controlled and temperature was in the range of
16-40 ºC. A blower provided oxygen saturation conditions.
The biological treatment strategy was as follows: once IBR inoculation was carried
out, in order to guarantee bacteria viability and to permit better growing and fixing on
the supports, a 45-l batch of glucose (an easily biodegradable substrate) was added to
the tank. After complete biodegradation, the tank was completely emptied and
sequentially filled with 45-l batches of different phototreated solutions coming from the
photo-Fenton stage. H2O2 had been completely consumed before the addition of
solutions (proven by iodometric titration) and the pH of these had been previously
readjusted from 2.8-3.0 to neutral. The mineralisation of the pre-treated effluent was
followed by DOC measurement at regular time intervals (one or two times per day).
Other periodical determinations carried out were the evolution of carboxylic acids
initially present, NH4+, NO2
- and NO3- ions in order to detect parallel nitrification and
denitrification reactions, and TSS to ensure a correct sludge fixation on polypropylene
supports (TSS in solution near zero). pH readjustment between 6.5 and 7.5 was done if
necessary. Suitable proportions of mineral medium were also supplied to solution in
order to maintain the required C:N:P (100:20:5) and C:Fe:S (100:2:2) ratios.

188 COMBINATION OF AOPS AND BIOLOGICAL TREATMENTS FOR COMMERCIAL REACTIVE AZO DYES REMOVAL
3. Results and discussion
3.1. Preliminary bench scale degradation of reactive dyes
The application of photo-Fenton reaction as a single process and as a pre-treatment
of an aerobic biological treatment for Procion Red H-E7B and Cibacron Red FN-R
degradation was previously developed at laboratory scale [10, 12, 13]. Photo-Fenton
oxidation was conducted at 23 ºC with a 6 W black light (6 W·m-2 UVA intensity,
measured by a luminometer) situated over a 250 ml photoreactor. Biodegradation was
carried out under room conditions in a 1.5 l Sequencing Batch Reactor (SBR). The best
results obtained for a 250 mg·l-1 initial reactive dye dosage were as follows: when
applying photo-Fenton as a stand-alone process, 10 mg·l-1 Fe (II), 250 mg·l-1 H2O2 for
Procion Red H-E7B, and 20 mg·l-1 Fe (II), 500 mg·l-1 H2O2 for Cibacron Red FN-R
were found to be the most efficient Fenton reagent combinations to achieve the
maximum degradation levels at short irradiation times: 82 and 84% DOC removal after
100 and 150 minutes of black light irradiation, respectively. These optimal H2O2
experimental values closely match the stoichiometrically required to completely oxidize
the dyes (1 g COD = 0.0312 mol O2 = 0.0625 mol H2O2). On the other hand, in the
combined chemical-biological oxidation system, 10 mg·l-1 Fe (II), 125 mg·l-1 H2O2
photo-Fenton conditions for 60 minutes (39% mineralisation) and 20 mg·l-1 Fe (II), 250
mg·l-1 H2O2 for 90 minutes (50% mineralisation) were necessary to make the homo- and
hetero-bireactive dyes biocompatible, respectively. Under these pre-treatment
conditions, the coupled SBR system fully removed both reactive dyes metabolites from
aqueous solution
3.2. Photo-Fenton degradation at pilot plant scale
In order to scale-up bench scale experiments, the same photo-Fenton conditions (10
mg·l-1 Fe (II), 250 mg·l-1 H2O2 and 20 mg·l-1 Fe (II), 500 mg·l-1 H2O2) were initially
applied for Procion Red H-E7B and Cibacron Red FN-R degradation at pilot plant.
DOC and H2O2 evolution as t30W function is shown in Figures 3 and 4. As observed
when working at laboratory scale, a fast mineralisation took place until the achievement

ANNEXE 1. UNPUBLISHED RESULTS 189
of a constant residual DOC of recalcitrant nature. The % DOC removal was 82% for
Procion Red H-E7B (residual DOC ~ 7 mg·l-1 C) and 86% for Cibacron Red FN-R
(residual DOC ~ 9 mg·l-1 C), providing evidence of the reproducibility of the laboratory
system. However, it is noteworthy that the solar photo-Fenton process at the pilot plant
needs shorter times for dye degradation than the artificial light process at laboratory.
Maximum mineralisation levels for homo- and hetero-bireactive dyes were attained at
t30W = 13 and 22 minutes, respectively.
t30W, min
-10 0 10 20 30 40 50 60
DO
C, m
g·l-1
C
0
10
20
30
40
50
2 mg·l-1 Fe(II); 250 mg·l-1 H2O2
5 mg·l-1 Fe(II); 250 mg·l-1 H2O2
10 mg·l-1 Fe(II); 250 mg·l-1 H2O2
(a) illumination
t30W, min
-10 0 10 20 30 40 50 60
H2O
2, m
g·l-1
0
50
100
150
200
250
300
2 mg·l-1 Fe(II); 250 mg·l-1 H2O2
5 mg·l-1 Fe(II); 250 mg·l-1 H2O2
10 mg·l-1 Fe(II); 250 mg·l-1 H2O2
(b)
Figure 3. DOC (a) and H2O2 (b) evolution versus t30W at different initial Fe (II) concentrations
for 250 mg·l-1 hydrolysed Procion Red H-E7B degradation; H2O2 = 250 mg·l-1, pH = 2.8.

190 COMBINATION OF AOPS AND BIOLOGICAL TREATMENTS FOR COMMERCIAL REACTIVE AZO DYES REMOVAL
t30W, min
-10 0 10 20 30 40 50 60 70 80
DO
C, m
g·l-1
C
0
10
20
30
40
50
60
70
80
90
5 mg·l-1 Fe(II)10 mg·l-1 Fe(II)20 mg·l-1 Fe(II)
t30W, min
-10 0 10 20 30 40 50 60 70 80
H2O
2, m
g·l-1
0
100
200
300
400
500
600
5 mg·l-1 Fe(II)10 mg·l-1 Fe(II)20 mg·l-1 Fe(II)
(a) illumination
(b)
Figure 4. DOC (a) and H2O2 (b) evolution versus t30W at different initial Fe (II) concentrations
for 250 mg·l-1 hydrolysed Cibacron Red FN-R degradation; H2O2 = 500 mg·l-1, pH = 2.8.
3.2.1. Effect of Fe (II) dose
With the base of the photo-Fenton conditions applied at the laboratory, initial Fe (II)
concentration effect was evaluated while maintaining H2O2 concentration. The intention
was to determine the lowest amount of iron necessary to effectively carry out the photo-
Fenton process in the solar photoreactor. Therefore, 2 and 5 mg·l-1 catalyst
concentrations were evaluated and compared with 10 mg·l-1 Fe (II) for Procion Red H-

ANNEXE 1. UNPUBLISHED RESULTS 191
E7B (Figure 3), and 5 and 10 mg·l-1 to 20 mg·l-1 Fe (II) for Cibacron Red FN-R (Figure
4). DOC and H2O2 parameters were monitored versus t30W. Overall reaction rate
constants could not be calculated since the mineralisation rate did not follow simple
kinetic models. This complex behaviour is due to the fact that DOC is the sum of
different product concentrations along several simultaneous reactions. Therefore, the
t30W necessary to obtain around 80% mineralisation (defined as t80%) and the maximum
gradient of the degradation curve (formally the slope of the tangent at the inflexion
point, r0) were chosen to compare the experiments (Table 1). As it can be observed, the
higher initial iron concentrations caused the faster mineralisation, although all tested Fe
(II) dosages leaded to the same final degradation level.
Table 1. Comparison of t80% and r0 parameters related to reactive dye degradation for different
Fe (II) concentrations. 250 mg·l-1 hydrolysed Procion Red H-E7B, 250 mg·l-1 H2O2; 250 mg·l-1
hydrolysed Cibacron Red FN-R, 500 mg·l-1 H2O2; pH = 2.8.
Fe (II) 2 mg·l-1 5 mg·l-1 10 mg·l-1 20 mg·l-1
t80%
min
r0
mg·l-1·min-1 C
t80%
min
r0
mg·l-1·min-1 C
t80%
min r0
mg·l-1·min-1 C t80%
min
r0
mg·l-1·min-1 C
Procion
Red H-E7B 55 0.49 21 3.88 13 4.20 - -
Cibacron
Red FN-R - - 56 0.68 19 2.51 11 5.15
Besides, the H2O2 concentration presented the same decreasing profile than DOC
(Figures 3 and 4), revealing that both parameters dropped off together and maintained
the same correlation regardless of initial Fe (II) concentration. Hence, it can be
concluded that 2 mg·l-1 and 5 mg·l-1 were large enough catalyst doses to degrade,
without losing photo-Fenton efficacy, Procion Red H-E7B and Cibacron Red FN-R,
respectively. These results are interesting since a low iron concentration would avoid
the separation step –based on Fe(OH)3 precipitation– at the end of the oxidation
process. Finally, the catalyst evolution (in its total and ferrous form) in relation to t30W is
represented in Figure 5. The fast decrease of Fe (II) concentration in relation to the total

192 COMBINATION OF AOPS AND BIOLOGICAL TREATMENTS FOR COMMERCIAL REACTIVE AZO DYES REMOVAL
iron evidences that, as it has been commented on the introduction section, the rate-
limiting step of the catalytic process is the regeneration of ferrous ion from its oxidised
form.
t30W, min
-10 0 10 20 30 40 50 60 70 80
Fe, m
g·l-1
0
1
2
3
4
5
6
7
Cibacron Red FN-R; Fe (II)Cibacron Red FN-R; Fetot
Procion Red H-E7B; Fe (II)Procion Red H-E7B; Fetot
illumination
Figure 5. Fe (II) and total iron evolution versus t30W. 250 mg·l-1 hydrolysed Procion Red H-
E7B, 2 mg·l-1 Fe (II), 250 mg·l-1 H2O2; 250 mg·l-1 hydrolysed Cibacron Red FN-R, 5 mg·l-1 Fe
(II), 500 mg·l-1 H2O2; pH = 2.8.
The original dye degradation was monitored by HPLC and UV/Vis detector.
Procion Red H-E7B dye completely disappeared before illumination (t30W = 0 minutes)
for all Fe (II) concentrations tested, while just the 5 mg·l-1 Fe (II) one allowed to detect
Cibacron Red FN-R further than dark Fenton process. The fast dye depletion was
accompanied by the solutions decolourisation. Concentration decrease in relation to t30W
when applying the lowest Fe (II) concentrations is shown in Figure 6. When comparing
reactive dye degradation with mineralisation (Figures 3(a) and 4(a)), it is noticeable that
complete dye disappearance takes place before mineralisation begin (no kinetic analysis
was possible due to the fast parent compound degradation). This behaviour appears to
suggest a sequenced oxidation mechanism in which HO· (of electrophilic nature)
preferably attacks the chromophore centre of the dye molecule (an electron-rich site)
[18], giving place to the solution bleaching. Afterwards, mono- or poly-hydroxylations

ANNEXE 1. UNPUBLISHED RESULTS 193
of the aromatic rings would be produced [19, 20]. Heteroatoms initially present in the
molecule would be released as anions at their highest oxidation degree. Finally, a
subsequent ring cleavage would generate aliphatic carboxylic acids to finally produce
CO2 and water [21, 22].
t30W, min
-6 -4 -2 0 2 4 6 8 10 12
C/C
0
0.0
0.2
0.4
0.6
0.8
1.0
1.2
Procion Red H-E7BCibacron Red FN-R
illumination
Figure 6. Relative concentration evolution versus t30W. 250 mg·l-1 hydrolysed Procion Red H-
E7B, 2 mg·l-1 Fe (II), 250 mg·l-1 H2O2; 250 mg·l-1 hydrolysed Cibacron Red FN-R, 5 mg·l-1 Fe
(II), 500 mg·l-1 H2O2; pH = 2.8.
3.2.2. Carboxylic acids and inorganic compounds generation
2 mg·l-1 Fe (II) and 250 mg·l-1 H2O2 for Procion Red H-E7B, and 5 mg·l-1 Fe (II)
and 500 mg·l-1 H2O2 for Cibacron Red FN-R photo-Fenton conditions were applied in
order to determine carboxylic acid intermediates and inorganic compounds. These low
Fe (II) concentrations were employed to provide appropriate degradation rates (not too
high) that ensure the detection of as many intermediate species as possible. As a result,
formic (C1), acetic (C2), oxalic (C2) and maleic (C4) acids appeared at measurable
concentrations during both dyes photooxidation. Pyruvic acid (C3) was also detected
during Cibacron Red FN-R phototreatment (Figure 7).

194 COMBINATION OF AOPS AND BIOLOGICAL TREATMENTS FOR COMMERCIAL REACTIVE AZO DYES REMOVAL
t30W, min
-10 0 10 20 30 40 50 60 70 80 90
Car
boxy
lic a
cids
, mg·
l-1
0
2
4
6
8
10
12
14
2.0
2.2
2.4
2.6
2.8
3.0
3.2
pH
formicaceticoxalicmaleicpH
t30W, min
-20 0 20 40 60 80 100 120
Car
boxy
lic a
cids
, mg·
l-1
0
5
10
15
20
25
30
35
pH
2.0
2.2
2.4
2.6
2.8
3.0
formicaceticoxalicpyruvicmaleicpH
illumination
(b)
(a)
Figure 7. Carboxylic acids concentration versus t30W. (a) 250 mg·l-1 hydrolysed Procion Red H-
E7B, 2 mg·l-1 Fe (II), 250 mg·l-1 H2O2 (b) 250 mg·l-1 hydrolysed Cibacron Red FN-R, 5 mg·l-1
Fe (II), 500 mg·l-1 H2O2.
A significant pH diminution was also observed coinciding with such acids
generation. Although they were present in solution from the early stages of the photo-
Fenton process, their global concentration reached a maximum around t30W = 30 minutes
for Procion Red H-E7B and between t30W = 13 and 40 minutes for Cibacron Red FN-R,
indicating that they were produced via progressive oxidation of higher molecular weight
species. It should be pointed out that, at maximum concentration, the detected

ANNEXE 1. UNPUBLISHED RESULTS 195
carboxylic acids stood for 24% of the total DOC present in solution. Afterwards, their
concentration decreased in agreement with the DOC removal until achieve low values
or completely disappear (pH stabilisation). 1.1 mg·l-1 of oxalic acid and 1.5 mg·l-1 of
acetic acid were found for Cibacron Red FN-R and Procion Red H-E7B, respectively,
being the 3 and 9% of the remaining recalcitrant DOC observed at the end of each
photo-Fenton process (Figures 3(a) and 4(a)).
As referred to in the introduction, another important mechanism for the conversion
of Fe (III) to Fe (II) is the photoexcitation of the complexes formed between Fe (III) and
organic matter, especially carboxylic acids (Equation 7). These photochemical
reactions, often with larger quantum yields than the excitation of Fe (III) aquo-
complexes [7], would lead to a faster mineralisation than the direct oxidation by HO·. In
agreement with this, it is noticeable that the apparition of the carboxylic acid
intermediates, which becomes significant at t30W = 15-20 minutes of irradiation time
(Figure 7), results in an increased DOC destruction rate (Figures 3(a) and 4(a)).
[Fe (III) LCOO]2+ ⎯⎯ →⎯ υh Fe (II) +CO2 + L· (7)
Besides DOC elimination, dyes mineralisation implies the appearance of inorganic
ions. According to the oxidation reactions proposed (Equations 8 and 9), SO42- and NO3
-
anions were expected to appear in the media. In order to establish the mass balance of
the different elements, and taking into account that the purity of the commercial dyes
was unknown, all the initial DOC content of the samples was attributed to dye
molecules. The difference between the sample weight and the DOC was attributed to
inorganic impurities (such as NaCl or Na2SO4).
Procion Red H-E7B
C52 H34 O26 S8 Cl2 N14 + 76.5 O2 → 52 CO2 + 14 NO3- + 8 SO4
2- + 2 Cl- + 32 H+ + H2O (8)
Cibacron Red FN-R
C29H19O13 S4 Cl F N7 + 41.5 O2 → 29 CO2 + 7 NO3- + 4 SO4
2- + Cl- + F- + 17H+ + H2O (9)

196 COMBINATION OF AOPS AND BIOLOGICAL TREATMENTS FOR COMMERCIAL REACTIVE AZO DYES REMOVAL
The kinetics of appearance of the inorganic anion SO42- are presented in Figure
8(a). Sulphate was gradually released into the solution, in parallel to DOC removal, up
to a recovery of 92% for Procion Red H-E7B and 95% for Cibacron Red FN-R. During
the mineralisation process, the -SO3H group (see Procion Red H-E7B structure, Figure
1) may be directly substituted by HO· resulting in the release of SO42- [23]. The
vinylsulphone reactive group of Cibacron Red FN-R (chemical structure not disclosed)
would also lead to the sulphate anion formation.
Small nitrate and ammonium concentrations were detected in solution. It is well
known that ammonium oxidation by HO· is not a favourable process in acid media,
taking place slowly [24]. Figure 8(b) shows the total nitrogen concentration
corresponding to both NH4+ and NO3
- ions generated through dye mineralisation. As
can be seen, the complete balance of N was not obtained, attaining just 1.1 mg·l-1 N for
Procion Red H-E7B (9% recovery) and 4.2 mg·l-1 N for Cibacron Red FN-R (22%
recovery). This incomplete nitrogen mass balance has already been observed in
photocatalytic processes by other authors [22, 25, 26]. Such results seem to be
indicative of the presence of other N-containing products different than the expected.
For instance, taking into account the existence of triazine rings in the initial structure of
the studied dyes, which cannot be mineralised until the end by photo-Fenton process
[25], it is predictable the presence of triazine derivates in the solution (i.e., ammeline
(5N), ammelide (4N) and cyanuric acid (3N)). Only the two N linked to the triazine ring
would be mineralised (the other three N atoms would remain in the triazine ring). The
presence of these species could also justify the residual DOC observed at the end of the
photo-Fenton process (Figures 3(a) and 4(a)). For example, in the case of Procion Red
H-E7B, the two triazine rings would constitute around 65% of the total final DOC.
Other studies have reported that nitrogen atoms constituting the azo group would lead to
N2 gas generation as a result of the HO· attack [20, 21]. More work on degradation
product analysis and identification is needed to reveal the complex fate of nitrogen.

ANNEXE 1. UNPUBLISHED RESULTS 197
t30W, min
-10 0 10 20 30 40 50 60 70 80
SO42-
, mg·
l-1
0
10
20
30
40
50
60
70
80
90
95% SO4
2- max
(a) illumination
92% SO4
2- max
Procion Red H-E7BCibacron Red FN-R
t30W, min
-10 0 10 20 30 40 50 60 70 80
N, m
g·l-1
0
1
2
3
4
5
Procion Red H-E7B; N-NH4+
Procion Red H-E7B; N-NO3-
Procion Red H-E7B; NTOT
Cibacron Red FN-R; N-NH4+
Cibacron Red FN-R; N-NO3-
Cibacron Red FN-R; NTOT
(b) 22% Nmax
9% Nmax
Figure 8. Sulphate ion (a) and inorganic nitrogen (b) release versus t30W. 250 mg·l-1 hydrolysed
Procion Red H-E7B, 2 mg·l-1 Fe (II), 250 mg·l-1 H2O2; 250 mg·l-1 hydrolysed Cibacron Red FN-
R, 5 mg·l-1 Fe (II), 500 mg·l-1 H2O2; pH = 2.8.
3.2.3. Biodegradability enhancement
The biodegradability evolution of Procion Red H-E7B and Cibacron Red FN-R
phototreated solutions, expressed as BOD5/COD ratio, was determined in order to
evaluate photo-Fenton suitability as a previous step of an aerobic biological treatment. 2
mg·l-1 Fe (II) for the homo- and 5 mg·l-1 Fe (II) for the hetero-bireactive dye were

198 COMBINATION OF AOPS AND BIOLOGICAL TREATMENTS FOR COMMERCIAL REACTIVE AZO DYES REMOVAL
employed to carry out the oxidation. As pointed out above, the lowest iron
concentration was used to avoid the need for Fe separation at the end of the chemical
oxidation, before the biological process. Hydrogen peroxide was gradually added to
determine the minimum concentration able to generate a biocompatible effluent. Each
new H2O2 pulse was added after complete H2O2 consumption. BOD5/COD ratio versus
H2O2 added is represented in Figure 9. It is seen that solutions become amenable to
biodegradation while increasing the H2O2 consumption, easily attaining the BOD5/COD
= 0.4 value characteristic of thoroughly biodegradable wastewaters [27].
H2O2 consumed, mg·l-10 50 100 150 200 250 300
BOD
5/CO
D
0.0
0.2
0.4
0.6
0.8
Cibacron Red FN-RProcion Red H-E7B
(a)
(b) (d)
(c) (e)
(f)
Figure 9. BOD5/COD evolution versus H2O2 consumption for 250 mg·l-1 hydrolysed Procion
Red H-E7B (2 mg·l-1 Fe (II)) and 250 mg·l-1 hydrolysed Cibacron Red FN-R (5 mg·l-1 Fe (II));
pH = 2.8.
3.3. Immobilised Biomass Reactor
Cibacron Red FN-R and Procion Red H-E7B phototreated solutions were submitted
to the IBR pilot plant. As it has been described in the experimental section, a first batch
of glucose (DOC around 80 mg·l-1 C) was added to the conditioner tank to ensure the
biomass viability. This also let to establish the lower residual DOC that could be
achieved by the IBR system (~ 20 mg·l-1 C, biomass metabolites). Afterwards, the

ANNEXE 1. UNPUBLISHED RESULTS 199
phototreated samples were added following a pre-designed sequence. For Cibacron Red
FN-R solutions (5 mg·l-1 Fe (II)): (a) 250 mg·l-1 H2O2 (DOC = 24 mg·l-1 C); (b) 225
mg·l-1 H2O2 (DOC = 34 mg·l-1 C); (c) 200 mg·l-1 H2O2 (DOC = 42 mg·l-1 C). For
Procion Red H-E7B solutions (2 mg·l-1 Fe (II)): (d) 80 mg·l-1 H2O2 (DOC = 29 mg·l-1
C); (e) 65 mg·l-1 H2O2 (DOC = 33 mg·l-1 C); (f) 50 mg·l-1 H2O2 (DOC = 39 mg·l-1 C).
The strategy was to start the treatment with the more biodegradable samples (larger
H2O2 concentration used) changing later to the ones with a lower BOD5/COD ratio,
trying to find out the minimum H2O2 dose to successfully perform the chemical-
biological treatment with a minimum mineralisation degree in the chemical stage.
Proceeding in this way, bacteria would be able to get used to the phototreated
wastewater. Full biodegradation was assumed when attaining residual DOC values close
to those obtained in the previous glucose batch (~20 mg·l-1 C).
time, days
0 5 10 15 20 25
DO
C, m
g·l-1
C
10
20
30
40
50
60
70
80
90
(e) (f) (d)
Procion Red H-E7B
(c) (a) (b)
Cibacron Red FN-R Glucose
Figure 10. IBR operation after photo-Fenton pre-treatment: 250 mg·l-1 hydrolysed Cibacron
Red FN-R, 5 mg·l-1 Fe (II), (a) 250 mg·l-1 H2O2 (b) 225 mg·l-1 H2O2 (c) 200 mg·l-1 H2O2; 250
mg·l-1 hydrolysed Procion Red H-E7B, 2 mg·l-1 Fe (II), (d) 80 mg·l-1 H2O2 (e) 65 mg·l-1 H2O2 (f)
50 mg·l-1 H2O2.
From Figure 10, it is clear that Cibacron Red FN-R solution was completely
biodegraded in 1-2 days when adding 250 (a) and 225 mg·l-1 H2O2 (b) in the photo-

200 COMBINATION OF AOPS AND BIOLOGICAL TREATMENTS FOR COMMERCIAL REACTIVE AZO DYES REMOVAL
Fenton stage. However, the IBR was not able to degrade the hetero-bireactive dye by-
products generated when using only 200 mg·l-1 H2O2 (c). The same behaviour was
observed for Procion Red H-E7B. The effluents resulting from 80 (d) and 65 mg·l-1
H2O2 (e) treatments were fully biodegraded while the 50 mg·l-1 H2O2 one (f) was not
enough biocompatible to feed the biological pilot plant. HPLC analysis revealed that
original dyes were not present in solution after the considered phototreatments. This fact
attributes the non biodegradability of (c) and (f) solutions to the presence of dyestuff
by-products of biorecalcitrant nature. Finally, it is remarkable that the obtained
biocompatible effluents ((a), (b), (d) and (e)) presented the maximum aliphatic
carboxylic acids concentration (of biodegradable nature). The differences between the
assessed photo-Fenton conditions are reflected in Figure 11. This compares the
percentage of mineralisation reached by each stage of the coupling. The residual DOC
values oscillated around 20 mg·l-1 C, settling a lower threshold for DOC removal.
% D
OC
rem
oval
0
20
40
60
80
100photo-FentonIBR
Cibacron Red FN-R Procion Red H-E7B
73% 73%
60% 67%
50% 46% 52%
41% 27%
30%
20%
4%
(a) (b) (c) (d) (e) (f)
Figure 11. % DOC removal in photo-Fenton pre-treatment and IBR coupling system as a
function of photo-Fenton conditions: 50 mg·l-1 hydrolysed Cibacron Red FN-R, 5 mg·l-1 Fe (II),
(a) 250 mg·l-1 H2O2 (b) 225 mg·l-1 H2O2 (c) 200 mg·l-1 H2O2; 250 mg·l-1 hydrolysed Procion Red
H-E7B, 2 mg·l-1 Fe (II), (d) 80 mg·l-1 H2O2 (e) 65 mg·l-1 H2O2 (f) 50 mg·l-1 H2O2.

ANNEXE 1. UNPUBLISHED RESULTS 201
Nitrification and denitrification reactions were followed by NH4+, NO2
- and NO3-
ion concentration measurements. A complete nitrification was achieved at the end of
each batch biodegradation, indicating that the IBR system was working properly.
Moreover, aliphatic carboxylic acids initially present in the pre-treated effluent were
completely removed from the solutions.
Concluding, as happens when working under laboratory conditions, the photo-
Fenton reaction can be successfully used as a pre-treatment to biocompatibilise the
studied reactive dye solutions. Among the tested pre-treatment conditions, the best ones
for a subsequent biodegradation at pilot plant are 5 mg·l-1 Fe (II), 225 mg·l-1 H2O2 for
Cibacron Red FN-R and 2 mg·l-1 Fe (II), 65 mg·l-1 H2O2 for Procion Red H-E7B.
BOD5/COD values around 0.4 were achieved (Figure 9), with 52 and 20%
mineralisation levels, respectively.
3.4. Main differences between laboratory and pilot plant
There are some fundamental differences between the photo-Fenton experiments
carried out in the laboratory and in the pilot plant. First of all, the source of irradiation
and the temperature were significantly different. A 6 W black light was used in the
laboratory (6 W·m-2 UVA), while the pilot plant reactor was irradiated by the complete
sunlight spectrum. Taking the 30 W·m-2 value as an estimation of the 300-400 nm
energy arriving to the earth surface around noon, the luminous energy entering the
photoreactor from the artificial black light was 5 times below. Additionally, it should be
noted that the PSA radiometer measured only the 300-400 nm bandwidth of the solar
spectrum, while photo-Fenton reaction also makes use of part of the visible spectrum
[8]. This fact favours the pilot plant results and complicates the comparison with
laboratory experiments. The high levels of temperature reached during solar photo-
Fenton experimentation (from 25 up to 48 ºC) also increased dyes removal rates due to
the beneficial effect of temperature on Fenton reaction [28].
The photoreactor configuration also differed from one system to another, leading to
different efficiencies with regard to radiation. At laboratory, with the artificial light over
the batch reactor, all dye volume was under irradiation, but the depth and the aromatic

202 COMBINATION OF AOPS AND BIOLOGICAL TREATMENTS FOR COMMERCIAL REACTIVE AZO DYES REMOVAL
content of solutions caused a strong absorption and impeded the radiation penetration
towards the bottom of the system. On the contrary, CPC tubes geometry allowed all the
illuminated volume to receive the radiation (they illuminate the complete perimeter of
the tubular receiver, rather than just the front of it), increasing the optical and quantum
efficiency of photo-Fenton process [16].
As observed before, the mineralisation degree was narrowly reproduced when
scaling-up from laboratory to pilot plant the 10 mg·l-1 Fe (II), 250 mg·l-1 H2O2 photo-
Fenton conditions for Procion Red H-E7B and the 20 mg·l-1 Fe (II), 500 mg·l-1 H2O2 for
Cibacron Red FN-R. The reduction of irradiation times (from 100 and 150 minutes of
black light irradiation to t30W = 13 and 22 minutes, respectively) was a direct
consequence of the above explained factors. This fast reaction rate allowed the photo-
Fenton pilot system to reduce the catalyst concentration from 10 to 2 mg·l-1 for Procion
Red H-E7B and from 20 to 5 mg·l-1 for Cibacron Red FN-R without loosing
mineralisation efficacy (see Figures 3 and 4).
In the combined chemical-biological treatment, similar photo-Fenton pre-treatment
conditions than laboratory were necessary to completely biocompatibilise Cibacron Red
FN-R solution at pilot plant. The best dosages obtained were 250 mg·l-1 H2O2 at
laboratory and 225 mg·l-1 H2O2 at pilot plant, leading to 50 and 52% partial
mineralisation, respectively. However, for Procion Red H-E7B dye degradation, photo-
Fenton oxidation at pilot plant improved laboratory results reducing the H2O2
requirements from 125 to 65 mg·l-1 and the mineralisation degree from 39 to 20%.
4. Conclusions
The pilot plant performance of solar photo-Fenton process for Procion Red H-E7B
and Cibacron Red FN-R reactive dyes mineralisation closely reproduced previous
laboratory artificial light results. 82 and 86% mineralisation was accomplished by
adding 10 mg·l-1 Fe (II) and 250 mg·l-1 H2O2 to 250 mg·l-1 Procion Red H-E7B solutions
and 20 mg·l-1 Fe (II) and 500 mg·l-1 H2O2 to 250 mg·l-1 Cibacron Red FN-R solutions,
respectively.
The irradiation time was reduced in relation to the artificial light process from 100
and 150 minutes (black light irradiation) to 13 and 22 minutes (normalised t30W values),
ANNEXE 1. UNPUBLISHED RESULTS 203
basically due to the higher amount of UV photons supplied by the sun, the involvement
of the visible fraction of sunlight spectrum, and the solar photoreactor configuration,
which collects and redirects to the solution all the radiation reaching the aperture area of
the CPCs. The fast reaction rates allowed the pilot system to reduce the iron
concentration from 10 to 2 mg·l-1 for Procion Red H-E7B and from 20 to 5 mg·l-1 for
Cibacron Red FN-R without loosing photo-Fenton efficacy.
Formic, acetic, oxalic and maleic acids appeared during both dyes photooxidation.
Pyruvic acid intermediate was also detected for Cibacron Red FN-R dye. Sulphur was
stoichiometrically released into the solution as sulphate ion, with 92-95% recovery. The
nitrogen mass balance was not completed as only 9-22% of total N was detected as
inorganic nitrogen (NH4+ and NO3
-) at the end of the treatment. These results are
indicative of the generation of other N-containing products, such as N2 gas and the
recalcitrant triazine ring.
Finally, solar photo-Fenton process at pilot plant can be successfully used as a
biological pre-treatment. With just 5 mg·l-1 Fe (II) and 225 mg·l-1 H2O2 (Cibacron Red
FN-R) and 2 mg·l-1 Fe (II) and 65 mg·l-1 H2O2 (Procion Red H-E7B) reagent doses, dye
solutions became enough biocompatible to be fully biodegraded in the IBR pilot plant.
In comparison with bench scale experiments, the performance of the combined
chemical-biological treatment appears to be superior.
Acknowledgements
The authors wish to thank to the Ministerio de Educación y Ciencia (project CTQ
2005-02808) for financial support and the “Programa de Acceso y Mejora de Grandes
Instalaciones Científicas Españolas” (project GIC-05-17).
References
[1] C. O’Neill, F.R. Hawkes, D.L. Hawkes, N.D. Lourenço, H.M. Pinheiro, W. Delée, J. Chem. Technol.
Biotechnol. 74 (11) (1999) 1009-1018.

204 COMBINATION OF AOPS AND BIOLOGICAL TREATMENTS FOR COMMERCIAL REACTIVE AZO DYES REMOVAL
[2] R. Andreozzi, V. Caprio, A. Insola, R. Marotta, Catal. Today 53 (1999) 5-59.
[3] R. Bauer, H. Fallman, Res. Chem. Intermed. 23 (1997) 34-354.
[4] J. Pignatello, Environ. Sci. Technol. 26 (1992) 944-951.
[5] A. Safarzadeh-Amiri, J.R. Bolton, S.R. Cater, J. Adv. Oxid. Technol. 1 (1996) 18-26.
[6] J. Pignatello, D. Liu, P. Huston, Environ. Sci. Technol. 33 (1999) 1832-1839.
[7] K.A. Hislop, J.R. Bolton, Environ. Sci. Technol. 33 (1999) 3119-3126.
[8] R. Bauer, G. Waldner, H. Fallmann, S. Hager, M. Klare, T. Krutzler, S. Malato, P. Maletzky, Catal.
Today. 53 (1999) 131-144.
[9] M.J. Farré, X. Domènech, J. Peral, Water Res. 40 (2006) 2533-2540.
[10] J. García-Montaño, F. Torrades, J.A. García-Hortal, X. Domènech, J. Peral, Appl. Catal. B: Environ.
67 (2006) 86-92.
[11] V. Sarria, S. Kenfack, O. Guillod, C. Pulgarín, J. Photochem. Photobio. A 159 (2003) 89-99.
[12] J. García-Montaño, F. Torrades, J.A. García-Hortal, X. Domènech, J. Peral, J. Hazard. Mater. 134
(2006) 220-229.
[13] F. Torrades, J. García-Montaño, J.A. García-Hortal, Ll. Núñez, X. Domènech, J. Peral, Color.
Technol. 120 (2004) 188-194.
[14] APHA-AWWA-WEF, Standard Methods for the Examination of Water and Wastewater, 18th Ed.,
Washington, DC, 1992.
[15] C. Kormann, D.W. Bahnemann, M.R. Hoffmann, Environ. Sci. Technol. 22 (5) (1988) 798-806.
[16] J. Blanco, S. Malato, P. Fernández, A. Vidal, A. Morales, P. Trincado, J.C. Oliveira, C. Minero, M.
Musci, C. Casalle, M. Brunote, S. Tratzky, N. Dischinger, K.-H. Funken, C. Sattler, M. Vincent, M.
Collares-Pereira, J.F. Mendes, C.M. Rangel, Sol. Energy. 67 (2000) 317-330.
[17] S. Malato, J. Cáceres, A.R. Fernández-Alba, L. Piedra, M.D. Hernando, A. Agüera, J. Vial, Environ.
Sci. Technol. 37 (2003) 2516-2524.
[18] C. Galindo, P. Jacques, A. Kalt, J. Photoch. Photobio. A. 130 (2000) 35-47.
[19] E. Guivarch, S. Trevin, C. Lahitte, M.A. Oturan, Environ. Chem. Lett. 1 (2003) 38-44.
[20] C. Hu, Yu J.C., Z. Hao, P.K. Wong, Appl. Catal. B: Environ. 42 (2003) 47-55.

ANNEXE 1. UNPUBLISHED RESULTS 205
[21] M. Karkmaz, E. Puzenat, C. Guillard, J.M. Herrmann, Appl. Catal. B: Environ. 51 (2004) 183-194.
[22] M. Stylidi, D.I. Kondarides, X.E. Verykios, Appl. Catal. B: Environ. 40 (2003) 271-286.
[23] H. Lachheb, E. Puzenat, A. Houas, M. Ksibi, E. Elaloui, C. Guillard, J.M. Herrmann, Appl. Catal. B:
Environ. 39 (2002) 75-90.
[24] A. Bravo, J. García, X. Domènech, J. Peral, J. Chem. Res. S (1993) 376-377.
[25] M.H. Pérez, G. Peñuela, M.I. Maldonado, O. Malato, P. Fernández-Ibáñez, I. Oller, W. Gernjak, S.
Malato, Appl. Catal. B: Environ. 64 (2006) 272-281.
[26] M. Lapertot, C. Pulgarín, P. Fernández-Ibáñez, M.I. Maldonado, L. Pérez-Estrada, I. Oller, W.
Gernjak, S. Malato, Water Res. 40 (2006) 1086-1094.
[27] E. Chamarro, A. Marco, S. Esplugas, Water Res. 35 (2001) 1047-1051.
[28] M. Pérez, F. Torrades, X. Domènech, J. Peral, Water Res. 36 (2002) 2703-2710.

ANNEXE 1. UNPUBLISHED RESULTS 207
A.1.2. Pathways of solar photo-Fenton degradation of Procion Red H-E7B reactive azo dye at pilot plant scale
Generated intermediates and reaction pathways of Procion Red H-E7B reactive azo
dye degradation by means of photo-Fenton Advanced Oxidation Process (AOP) have
been investigated. The study complements the work previously reported in Section
A.1.1, entitled: Pilot plant scale reactive dyes degradation by solar photo-Fenton
and biological processes.
Analogously, photo-Fenton experiments were carried out under sunlight at pilot
plant scale in a 35 l Compound Parabolic Collector (CPC) (set-up and experimental
conditions detailed in Section 3.6.1.2) at the Plataforma Solar de Almería (PSA, Spain).
Solar irradiation began after 5 minutes of dark Fenton reaction. Ultraviolet radiation
(300-400 nm) reaching the solar pilot plant was measured by a global UV radiometer
(Kipp & Zonen, model CUV3). Experiments were thereby evaluated by using the
normalised illumination time t30W, which takes into account cloudiness and other
environmental conditions (t30W calculation method in Section 3.6.1.2). Throughout
them, UV intensity ranged between 19 and 37 W·m-2. Since the system was outdoors
and non isolated, temperature in the reactor rose from 26 to 44 ºC.
Applied photo-Fenton conditions were 2 mg·l-1 of Fe (II) and 250 mg·l-1 of H2O2.
These provided appropriate degradation rates that ensure the detection of as many
breakdown products as possible. In order to convert Procion Red H-E7B reactive dye
into the form normally found in industrial textile effluents, 250 mg·l-1 solutions
(Dissolved Organic Carbon (DOC) = 40 ± 1 mg·l-1 C; n = 3, α = 0.05) were hydrolysed
by adjusting the pH to 10.6 followed by heating to 80 ºC for 6 hours.
DOC was determined with a TOC Shimadzu 5050A analyser (Section 3.3.1).
Chloride ion was determined by Ion Chromatography (IC) (Section 3.3.8). The original
dye degradation was monitored by High Performance Liquid Chromatography (HPLC)
and UV/Vis detector (Section 3.3.6). Organic by-products identification was developed
by means of Liquid Chromatography-(Electrospray Ionisation)-Time-of-Flight Mass
Spectrometry (LC-(ESI)-TOF-MS) analysis of the different phototreated samples
(experimental conditions and samples pre-treatment in Section 3.3.7). Among other

208 COMBINATION OF AOPS AND BIOLOGICAL TREATMENTS FOR COMMERCIAL REACTIVE AZO DYES REMOVAL
chromatographic techniques, Liquid Chromatography-Mass Spectrometry (LC-MS) has
become the preferred analytical instrument for analysing relatively polar and non
volatile organic molecules without derivation. Furthermore, Time-of-Flight analysis
Mass Spectrometry (TOF-MS) with Electrospray Ionisation (ESI) has gained popularity
due to its sensibility, theoretically unlimited mass range, high mass resolution and
capability for highly accurate mass determination [1].
Finally, in order to elucidate such a complex degradation mechanism, previously
reported data (Section A.1.1) regarding carboxylic acids, SO42-, NH4
+ and NO3-
generation through photodegradation have also been considered and discussed together
with LC-(ESI)-TOF-MS results.
A.1.2.1. Degradation products of Procion Red H-E7B
The mineralisation profile of Procion Red H-E7B dye (Figure A.1.1)
photodegradation is shown in Figure A.1.2. Its complete oxidation stoichiometry would
be as follows (Equation A.1.1):
C52 H34 O26 S8 Cl2 N14 + 76.5 O2 → 52 CO2 + 14 NO3- + 8 SO4
2- + 2 Cl- + 32 H+ + H2O (A.1.1)
N N
OH NH
N
N
N
NHN
OHNH
N
N
N
NH
Cl Cl
SO3HHO3S
SO3H
SO3HHO3S
SO3H
SO3HSO3H
N
Figure A.1.1. Chemical structure of Procion Red H-E7B.

ANNEXE 1. UNPUBLISHED RESULTS 209
After t30W ~ 15 minutes of irradiation, it is noticeable a fast mineralisation until the
achievement of a constant residual DOC of recalcitrant nature. These results imply that
some kind of organic compounds were still present even with prolonged
photodegradation.
t30W, min
-10 0 10 20 30 40 50 60
DO
C, m
g·l-1
C
0
10
20
30
40
50
illumination
Figure A.1.2. DOC evolution versus t30W for 250 mg·l-1 hydrolysed Procion Red H-E7B;
photo-Fenton conditions: 2 mg·l-1 Fe (II), 250 mg·l-1 H2O2, pH = 2.8.
On the other hand, analogously to Procion Red H-E7B degradation observed in
Section A.1.1 (Figure 6), all treated samples were exempted of original dye since it
quickly disappeared before illumination (t30W = 0 minutes) (data not shown). This fast
parent compound disappearance was accompanied by the solution bleaching. By
comparing both DOC and dye concentration data, it is worth to note that complete dye
and colour depletion took place before the beginning of mineralisation (disappearance
of DOC).
Degradation samples corresponding to t30W = 0, 6, 13 and 19 minutes were chosen to
investigate generated Procion Red H-E7B by-products. As commented above, they were
analysed by means of LC-(ESI)-TOF-MS technique. Oxidation led to the formation of a
high number of degradation products. Among them, a total of 18 different aromatic

210 COMBINATION OF AOPS AND BIOLOGICAL TREATMENTS FOR COMMERCIAL REACTIVE AZO DYES REMOVAL
compounds were identified. As an example, Figure A.1.3 shows the LC-(ESI)-TOF-MS
full-scan chromatogram of the main identified compounds after t30W = 6 minutes of
solar photo-Fenton treatment. The tentative molecular structures of all of them are
drawn in Figure A.1.4.
Identification was based on accurate mass measurements that enabled empirical
formulas to be calculated with an elemental composition calculator tool, generating a
list of best-match hits. The proposal of the best chemical structure was based on prior
knowledge of the molecule pattern and the oxidative treatment. Additional information
was subtracted from the characteristic isotopic distribution of certain molecules mass
spectra containing chlorine (Cl35 and Cl37) atoms. Table A.1.1 shows data related to the
experimental and calculated masses of the protonated ions (mass to charge ratio; m/z),
the error between them, the retention time, and the proposed empirical formula
corresponding to the identified compounds. In all cases, the resulting accurate masses
were found at an error less than 1.9 mDa or 3.4 ppm.
2 4 6 8 10 12 14 16 18 20 22 24 26 28 30Time, min
0.0
2.0e6
4.0e6
6.0e6
8.0e6
1.0e7
1.2e7
1.4e7
1.6e7
1.8e7
2.0e7
2.2e7
2.4e7
2.6e7
2.8e7
Inte
nsity
, cps
19.06
4.74
13.04
3.77 16.08
3.0e7
C11
C4
C13C122.50
C5
C1022.91C8C9
16.80
C618.02
C7
C1 C3’
14.59C2’ 18.84
16.9816.82
Figure A.1.3. Typical LC-(ESI)-TOF-MS full-scan chromatogram of main identified
compounds after t30W = 6 minutes of solar photo-Fenton treatment.

ANNEXE 1. UNPUBLISHED RESULTS 211
C1, C1’, C1’’
N
N
NN
N
N
HN NH
Cl Cl
NH2NH
OHHO
SO3H OH
HO
OH
C2, C2’, C2’’
N
N
NN
N
N
HN NH
Cl HO
NH2NH
OHHO
SO3H OH
OH
HO
C3, C3’
N
N
NN
N
N
HN NH
Cl Cl
NH2NH
SO3H
O
O
OH
OH
C4
N
N
NN
N
N
HN NH
H2N
Cl Cl
NH2
C5
N
N
NN
N
N
HN NH
H2N
Cl HO
NH2
Figure A.1.4. Degradation products of Procion Red H-E7B.

212 COMBINATION OF AOPS AND BIOLOGICAL TREATMENTS FOR COMMERCIAL REACTIVE AZO DYES REMOVAL
C6
N
N
NN
N
N
HN NH
H2N
Cl Cl
OH
C7
N
N
NN
N
N
HN NH
H2N
Cl Cl
NH2
OH
C8
N
N
NN
N
N
HN NH
H2N
Cl Cl
NH2O
O
C9
N
N
NN
N
N
HN NH
H2N
Cl HO
NH2O
O
C10
N
N
N
HO NH
Cl
NH2
C11
N N
N
Cl
NH2H2N
C12
N N
N
OH
NH2H2N
C13
N N
N
Cl
OHH2N
Figure A.1.4 (cont.). Degradation products of Procion Red H-E7B.

ANNEXE 1. UNPUBLISHED RESULTS 213
Table A.1.1. Accurate mass measurements obtained from the LC-(ESI)-TOF-MS spectra of
Procion Red H-E7B degradation products (see spectra in Section A.2.1).
Compound Formula Retention
time min
Detected m/z
Calculated m/z
Error mDa
Error ppm
C1
C1’
C1’’
C22H17Cl2N10O8S+
16.98
18.60
19.34
651.0322
651.0312
651.0308
651.0323
-0.1
-1.1
-1.5
-0.2
-1.7
-2.3
C2
C2’
C2’’
C22H18ClN10O9S+
14.28
14.59
14.82
633.0676
633.0642
633.0664
633.0661
1.4
1.9
0.2
2.2
-3.2
-0.3
C3
C3’C21H15Cl2N10O7S+ 16.77
18.84
621.0231
621.0220 621.0217
1.4
0.2
2.2
0.4
C4 C12H11Cl2N10+ 19.06 365.0551 365.0539 1.1 3.1
C5 C12H12ClN10O+ 13.04 347.0880 347.0878 0.1 0.4
C6 C12H10Cl2N9O+ 16.82 366.0382 366.0379 0.2 0.6
C7 C12H11Cl2N10O+ 18.02 381.0491 381.0488 0.2 0.6
C8 C12H9Cl2N10O2+ 22.91 395.0280 395.0281 -0.2 -0.4
C9 C12H10ClN10O3+ 16.80 377.0619 377.0620 -0.1 -0.4
C10 C9H9ClN5O+ 16.08 238.0489 238.0490 -0.1 -0.5
C11 C3H5ClN5+ 4.74 146.0233 146.0227 0.5 3.4
C12 C3H6N5O+ 2.50 128.0571 128.0566 0.4 3.2
C13 C3H4ClN4O+ 3.77 147.0073 147.0068 0.3 1.9
Among the 18 identified by-products, C1, C1’ and C1’’, C2, C2’ and C2’’, and C3 and
C3’ shared the same accurate mass, and consequently the same empirical formula.
Nevertheless, their different retention times evidence their different molecular
structures, probably by the distinct location of the –OH groups in aromatic rings (they
may be indistinctly linked to either the benzene or naphthalene ring). Additionally,
possible different isomers just varying the location of lactone in C3 and C3’ naphthalene
structure, as well as the remaining sulphonic and/or chlorine substituent groups in C1,
C1’, C1’’, C2, C2’, C2’’, C3, C3’ and C9 by-products must also be taken into consideration.
With the information handled here, it is not possible to exactly know their
molecular structures and the differences between them. In this sense, it should be noted
that just one structure among the several possible isomers has been drawn in Figure

214 COMBINATION OF AOPS AND BIOLOGICAL TREATMENTS FOR COMMERCIAL REACTIVE AZO DYES REMOVAL
A.1.4. To reveal the exact structures, more work on degradation products analysis and
identification –e.g., comparison with commercial standards (if available), Nuclear
Magnetic Resonance (NMR) and/or further tandem Mass Spectrometry (MS/MS)
detection– is necessary.
A.1.2.2. Procion Red H-E7B by-products evolution over time
Identified Procion Red H-E7B reactive dyes intermediates appear neither in all
collected samples nor with the same profile. Figures A.1.5-A.1.8 monitor the transient
kinetics of each compound in relation to t30W irradiation time.
t30W, min
-10 -5 0 5 10 15 20 25 30
Are
a, c
ount
s
0.0
2.0e+5
4.0e+5
6.0e+5
8.0e+5
1.0e+6
1.2e+6
C1C1'C1''C2C2'C2''
illumination
Figure A.1.5. Evolution over time of C1, C1’, C1’’, C2, C2’ and C2’’ Procion Red H-E7B
degradation products.

ANNEXE 1. UNPUBLISHED RESULTS 215
t30W, min
-10 -5 0 5 10 15 20 25 30
Are
a, c
ount
s
0.0
5.0e+6
1.0e+7
1.5e+7
2.0e+7
2.5e+7
3.0e+7
C3C3'C4C5C6
Figure A.1.6. Evolution over time of C3, C3’, C4, C5 and C6 Procion Red H-E7B degradation
products.
t30W, min
-10 -5 0 5 10 15 20 25 30
Are
a, c
onun
ts
0.0
5.0e+5
1.0e+6
1.5e+6
2.0e+6
2.5e+6
3.0e+6
3.5e+6C7C8C9C10C12C13
illumination
illumination
Figure A.1.7. Evolution over time of C7, C8, C9, C10, C12 and C13 Procion Red H-E7B
degradation products.

216 COMBINATION OF AOPS AND BIOLOGICAL TREATMENTS FOR COMMERCIAL REACTIVE AZO DYES REMOVAL
t30W, min
-10 -5 0 5 10 15 20 25 30
Are
a, c
ount
s
0.0
2.0e+7
4.0e+7
6.0e+7
8.0e+7
1.0e+8
1.2e+8
1.4e+8
1.6e+8
illumination
C11
Figure A.1.8. Evolution over time of C11 Procion Red H-E7B degradation product.
Figures A.1.5 and A.1.6 show the early appearance of the largest C1, C1’, C1’’, C2,
C2’, C2’’, C3 and C3’ compounds, with a maximum abundance among t30W = 0 and 6
minutes. Smaller C4, C5 and C6 compounds presented a similar chronological
distribution, with maxima located at t30W ~ 0 minutes (Figure A.1.6). C7, C8, C9 and C10
compounds were detected later, displacing their maximum abundance at t30W between 6
and 13 minutes (Figure A.1.7).
It is worth to note that once attained their maximum value, all the above compound
signals decreased until complete disappearance. This decrease occurred simultaneously
with the appearance and increase of the last and smallest C11, C12 and C13 compounds
(Figures A.1.7 and A.1.8), whose presence continuously increased along the analysed
time. C11 is plotted in a separate graph due to its large signal.
The order of appearance of these by-products is a key issue to elucidate Procion Red
H-E7B photodegradation mechanism.

ANNEXE 1. UNPUBLISHED RESULTS 217
A.1.2.3. Photodegradation pathways
Hydroxyl radicals, the main and best-known oxidant species involved in photo-
Fenton process, are strong electrophilic oxidants. Consequently, Procion Red H-E7B
reactive azo dye degradation may be initiated by the attack of HO· upon an electron-rich
site; i.e., near the azo nitrogen atoms or near the amino groups [2].
In view of this, the fast full decolourisation of the dye solution appears to suggest a
sequenced oxidation mechanism in which hydroxyl radical preferably attacks the
chromophore centre of dye molecules (i.e., the azo groups, -N=N-) cleaving them in
three parts: the two lateral substituted naphthalene rings and the central body. The non
detection of reactive dye intermediates containing the original azo groups also points to
this direction.
Azo groups may be mainly attacked at two positions [3, 4]. The first would be at C-
N single bond between the azo group and naphthalene ring, generating N2 gas
according to Equations A.1.2 and A.1.3 [5]. This mechanism represents the
environmentally more appealing pathway for the elimination of nitrogen from N-
containing pollutants [5-7].
R1-N=N-R2 + HO· → R1-N=N· + R2-OH (A.1.2)
R1-N=N· → R1· + N≡N (A.1.3)
The second possibility of HO· reaction would be at the chromophore double bond,
resulting in the formation of primary aromatic amines. By further degradation, the
amino group would be finally released as NH4+ into aqueous solution.
The secondary amino group placed between naphthalene or benzene and the triazine
rings would be subsequently attacked. The rupture between N and naphthalene or
benzene rings is easier than that between N and triazine [8]. In this way, the amino
groups degradation by HO· would generate a primary amine linked to the triazine ring.
A simplified scheme of this reaction would be as follows (Equation A.1.4):

218 COMBINATION OF AOPS AND BIOLOGICAL TREATMENTS FOR COMMERCIAL REACTIVE AZO DYES REMOVAL
HO· + OHR1
N
N
N
Cl
HN-R2
H2N
N
N
N
Cl
HN-R2
HNR1(A.1.4)
The initial apparition of C1, C1’, C1’’, C2, C2’, C2’’, C3, C3’, C4 and C5 compounds
indicates that both above described decomposition pathways (azo and amino groups
attack by HO·) were initially involved. However, the molecular structures of some of
these compounds show that additional HO· degradation mechanisms had also taken
place. C3 and C3’ by-products would have been originated from further C1, C1’ and C1’’
compounds degradation via a series of complex reactions that can not be described in
detail. On the other hand, from C1, C1’, C1’’, C2, C2’, C2’’, C3 and C3’ structures, the
addition of HO· to one of the carbon atoms bearing the sulphonic groups and the release
of sulphate anion can be envisaged (Equations A.1.5 and A.1.6) [6].
R-SO3- + HO· → R-OH + SO3·- (A.1.5)
SO3·- + HO- → SO42- + H· (A.1.6)
The identification of such structures, jointly with the degradation mechanism
proposed in Equations A.1.5 and A.1.6, is consistent with the kinetics of inorganic SO42-
appearance with irradiation time (Figure A.1.9). As reported in Section A.1.1,
desulphuration gradually occurred being possible to detect up to 92% of the
theoretically expected sulphur (Equation A.1.1).

ANNEXE 1. UNPUBLISHED RESULTS 219
t30W, min
-10 0 10 20 30 40 50 60 70
SO42-
, mg·
l-1
0
10
20
30
40
50
60
illumination
Figure A.1.9. Sulphate ion concentration versus t30W for 250 mg·l-1 hydrolysed Procion Red H-
E7B; photo-Fenton conditions: 2 mg·l-1 Fe (II), 250 mg·l-1 H2O2, pH = 2.8.
Apart from sulphonic acid groups substitution by HO·, part of the chlorine
substituent groups were analogously replaced along photodegradation (it should be
noted that chlorine atoms linked to the triazine groups of Procion Red H-E7B
corresponded to the non hydrolysed fraction of the original dye, which is always present
in spite of the hydrolysis process carried out prior photodegradation). Figure A.1.10
depicts the Cl- formation over reaction time. The maximum attained value corresponds
to 45% of the total (before hydrolysis) (Equation A.1.1), whereas the left fraction would
have been released during hydrolysis process or would remain still linked to triazine
moiety. In agreement with this, the stable nature of chlorine atoms bonded to triazine
rings had already been observed by other authors [3].
According to the above conclusions, hydroxyl groups linked to the triazine rings of
identified intermediates may be derived from either hydrolysis or oxidation processes.

220 COMBINATION OF AOPS AND BIOLOGICAL TREATMENTS FOR COMMERCIAL REACTIVE AZO DYES REMOVAL
t30W, min
-10 0 10 20 30 40 50 60
Cl- , m
g·l-1
0.0
0.5
1.0
1.5
2.0
2.5
3.0
illumination
Figure A.1.10. Chloride ion concentration versus t30W for 250 mg·l-1 hydrolysed Procion Red
H-E7B; photo-Fenton conditions: 2 mg·l-1 Fe (II), 250 mg·l-1 H2O2, pH = 2.8.
On the other hand, C1, C1’, C1’’, C2, C2’, C2’’, C3, C3’ and C7 by-products evidence the
direct addition of HO· to unsaturated bonds of naphthalene and/or benzene structures,
giving place to the formation of mono- or poly-hydroxylated derivatives. A further
oxidation would conduct to degradation intermediates containing quinone-like
structures, like C8 and C9. These compounds are of special interest in Fenton processes
chemistry since they may take part in the complex mechanism of Fe (II) regeneration
(see Section 1.4.1.1).
As it is stated in the literature, the following degradation step of benzenic and
naphtalenic skeletons would be the ring opening to form short chain carboxylic acids [5,
9, 10]. In conformity with this, Figure A.1.11 displays the transient concentration of
formic, acetic, oxalic and maleic acids.
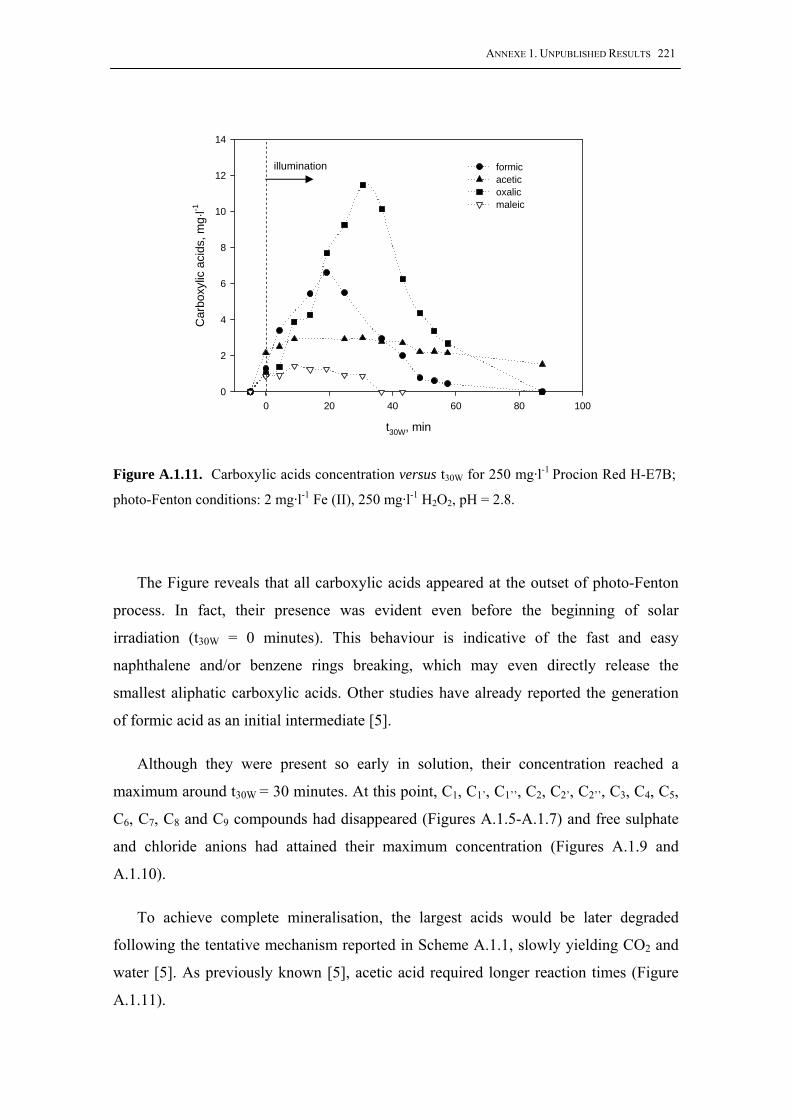
ANNEXE 1. UNPUBLISHED RESULTS 221
t30W, min
0 20 40 60 80 100
Car
boxy
lic a
cids
, mg·
l-1
0
2
4
6
8
10
12
14
illumination formicaceticoxalicmaleic
Figure A.1.11. Carboxylic acids concentration versus t30W for 250 mg·l-1 Procion Red H-E7B;
photo-Fenton conditions: 2 mg·l-1 Fe (II), 250 mg·l-1 H2O2, pH = 2.8.
The Figure reveals that all carboxylic acids appeared at the outset of photo-Fenton
process. In fact, their presence was evident even before the beginning of solar
irradiation (t30W = 0 minutes). This behaviour is indicative of the fast and easy
naphthalene and/or benzene rings breaking, which may even directly release the
smallest aliphatic carboxylic acids. Other studies have already reported the generation
of formic acid as an initial intermediate [5].
Although they were present so early in solution, their concentration reached a
maximum around t30W = 30 minutes. At this point, C1, C1’, C1’’, C2, C2’, C2’’, C3, C4, C5,
C6, C7, C8 and C9 compounds had disappeared (Figures A.1.5-A.1.7) and free sulphate
and chloride anions had attained their maximum concentration (Figures A.1.9 and
A.1.10).
To achieve complete mineralisation, the largest acids would be later degraded
following the tentative mechanism reported in Scheme A.1.1, slowly yielding CO2 and
water [5]. As previously known [5], acetic acid required longer reaction times (Figure
A.1.11).

222 COMBINATION OF AOPS AND BIOLOGICAL TREATMENTS FOR COMMERCIAL REACTIVE AZO DYES REMOVAL
HOOC-CH=CH-COOH
CH3-COOH
Maleic acid
Oxalic acidAcetic acid
H-COOH Formic acid
CO2
HOOC-COOH
Scheme A.1.1. Mechanism of carboxylic acids degradation.
The fate of Procion Red H-E7B triazine groups was quite different. The amino
groups degradation mechanism illustrated in Equation A.1.4 would gradually transform
large intermediates to smaller structures, like C10, C11, C12 and C13.
As commented in Section A.1.2.2, the C11, C12 and C13 by-products continuously
increased their concentration throughout reaction. This profile points to their
accumulation and permanence in the final phototreated solution, a fact that would be in
accordance with other studies about the difficulty of mineralisation of the triazine
moiety by photo-Fenton and other AOPs treatments [3, 4, 7, 11-14]. In those previous
studies, cyanuric acid (Figure A.1.12) is described as the final degradation product,
thought it has not been detected in the analysis carried out within the present work.
N N
N
OH
OHHO
Figure A.1.12. Chemical structure of cyanuric acid.

ANNEXE 1. UNPUBLISHED RESULTS 223
The degradation of C11, C12 and C13 by-products to cyanuric acid would involve the
hydroxylation of the carbon atoms holding both chlorine and primary amino group. It is
worth to note that, analogously to Cl- release, the substitution of primary amino groups
linked to triazine rings by HO· is a particularly slow process [13]. Additionally, it
would be directly transformed into NO3- rather than NH4
+ [3]. Among the identified
intermediates, C13 and the larger C6 could undergo such amino group degradation
mechanism.
Finally, Figure A.1.13 shows the total nitrogen concentration corresponding to NH4+
and NO3- ions arising from Procion Red H-E7B mineralisation. As reported in Section
A.1.1, the complete balance of N was not obtained, scarcely attaining 9% of the
expected stoichiometric quantity (Equation A.1.1).
t30W, min
-10 0 10 20 30 40 50 60
N, m
g·l-1
0.0
0.5
1.0
1.5
2.0
2.5
3.0
N-NH4+
N-NO3-
NTOT
illumination
Figure A.1.13. Inorganic nitrogen release versus t30W for 250 mg·l-1 Procion Red H-E7B;
photo-Fenton conditions: 2 mg·l-1 Fe (II), 250 mg·l-1 H2O2, pH = 2.8.
Summarising the earlier discussions, the detected ammonium may be generated
from either azo bonds or amino groups degradation. On the other hand, the quantified
nitrate concentration would correspond to both the direct transformation of amino
groups into NO3- and the oxidation of NH4
+. Nonetheless, it should be remarked that

224 COMBINATION OF AOPS AND BIOLOGICAL TREATMENTS FOR COMMERCIAL REACTIVE AZO DYES REMOVAL
ammonium intermediate oxidation is not a favourable process in acid media, taking
place slowly [15]. The presence of triazine derivatives in final solution (e.g., C11, C12,
C13, which may even contain 5 nitrogen atoms in their structure), in addition with N2
gas generation as a result of azo group attack by HO·, would justify the incomplete
nitrogen mass balance. On the other hand, the long-living triazine species would also
give explanation for the remaining DOC observed at the end of photo-Fenton process
(Figure A.1.2).
The knowledge of the reaction pathways is a key issue from a practical point of
view, especially in cases where the chemical treatment precedes a biological process; a
relationship between generated by-products and biocompatibility may be established.
As reported in Section A.1.1, 2 mg·l-1 Fe (II) and 65 mg·l-1 H2O2 concentrations
generated biodegradable Procion Red H-E7B solutions with 20% DOC removal. This
mineralisation percentage corresponded to t30W = 19 minutes (see Figure A.1.2), just
when C11, C12, C13 and carboxylic acids intermediates were gaining importance and the
large compounds had nearly completely disappeared (see Figures A.1.5-A.1.8 and
A.1.11). Such results evidence the higher biodegradability degree of the smallest
triazine-like species with regard to their precursors. In fact, cyanuric acid –their last
degradation product– is reported to be biodegradable and non toxic [16]. On the other
hand, short chain carboxylic acids are well known to be of biodegradable nature.
Overall, the whole Procion Red H-E7B solar photo-Fenton degradation process can
be described by a series of consecutive steps, schematically depicted in Scheme A.1.2.
In order to complete the degradation pathways, which are composed of a multiple and
complex set of simultaneous reactions (none of them exclusive), further
experimentation making use of complementary analytical tools is necessary.

ANNEXE 1. UNPUBLISHED RESULTS 225
N N
OH NH
N
N
N
NHN
OHNH
N
N
N
NH
Cl Cl
SO3HHO3S
SO3H
SO3HHO3S
SO3H
SO3HSO3H
N
N N
N
OH
OHHO
N
N
NN
N
N
HN NH
H2N
X X
NH2
Z
N N
N
X
NH2H2N
Y
Y
Z
OH NH
N
N
N
NH
OHNH
N
N
N
NH
X X
YY YY
ZZ
Z
OH
Y Y
OH
Z
HO OH
Z
Carboxylicacids
CO2, H2O
Scheme A.1.2. Proposed reaction pathways for Procion Red H-E7B degradation; X: Cl or OH,
Y: SO3H or OH, Z: possible mono- or poly-hydroxylations of naphthalene or benzene rings.

226 COMBINATION OF AOPS AND BIOLOGICAL TREATMENTS FOR COMMERCIAL REACTIVE AZO DYES REMOVAL
A.1.2.4. References
[1] Pérez-Estrada L., Malato S., Gernjak W., Agüera A., Thurman E.M., Ferrer I., Fernández-Alba A.R.
(2005). Photo-Fenton degradation of Diclofenac: main intermediates and degradation pathway. Environ.
Sci. Technol., 39, 8300-8306.
[2] Galindo C., Jacques P., Kalt A. (2000). Photodegradation of the aminoazobenzene acid orange 52 by
three advanced oxidation processes: UV/H2O2, UV/TiO2 and VIS/TiO2. Comparative mechanistic and
kinetic investigations. J. Photoch. Photobio. A, 130, 35-47.
[3] Hu C., Yu J.C., Hao Z., Wong P.K. (2003). Photocatalytic degradation of triazine-containing azo dyes
in aqueous TiO2 suspensions. Appl. Catal. B: Environ., 42, 47-55.
[4] Hu C., Yizhong W., Hongxiao T. (2001). Influence of adsorption on the photodegradation of various
dyes using surface-bond-conjugated TiO2/SiO2 photocatalyst. Appl. Catal. B: Environ., 35, 95-105.
[5] Karkmaz M., Puzenat E., Guillard C., J.M. Herrmann (2004). Photocatalytic degradation of the
alimentary azo dye amaranth. Mineralization of the azo group to nitrogen. Appl. Catal. B: Environ., 51,
183-194.
[6] Lachheb H., Puzenat E., Houas A., Ksibi M., Elaloui E., Guillard C., Herrmann J.M. (2002).
Photocatalytic degradation of various types of dyes (Alizarin S, Crocein Orange G, Methyl Red, Congo
Red, Methylene blue) in water by UV-irradiated titania. Appl. Catal. B: Environ., 39, 75-90.
[7] Calza P., Pelizzeti E., Minero C. (2005). The fate of organic nitrogen in photocatalysis: an overview.
J. Appl. Electrochem., 35, 665-673.
[8] Bui T.H., Guillard C., Perol N., Herrmann J.M. (2004). Influence of the presence of a triazinic ring on
the fate of nitrogen from amino groups of dyes during their photocatalytic degradation. 3rd European
Meeting on Solar Chemistry and Photocatalysis: Environmental applications (SPEA3), Barcelona, Spain.
[9] Brillas E., Mur E., Sauleda R., Sanchez L., Peral J., Domènech X., Casado J. (1998). Aniline
mineralization by AOP’s: anodic oxidation, photocatalysis, electro-Fenton and photo-electroFenton
processes. Appl. Catal. B: Environ., 16, 31-42.
[10] Stylidi M., Kondarides D.I., Verykios X.E. (2003). Pathways of solar light-induced photocatalytic
degradation of azo dyes in aqueous TiO2 suspensions. Appl. Catal. B: Environ., 40, 271-286.
[11] Pelizzeti E., Carlin V., Minero C., Pramauro E., Vincenti M. (1992). Degradation pathways of
atrazine under solar light and in the presence of titanium oxide colloidal particles. Sci. Total. Environ.,
161, 123-124.

ANNEXE 1. UNPUBLISHED RESULTS 227
[12] Huston P.L., Pignatello J. (1999). Degradation of selected pesticide active ingredients and
commercial formulations in water by the photo-assisted Fenton reaction. Water Res., 33, 1238-1246.
[13] Pérez M.H., Peñuela G., Maldonado M.I., Malato O., Fernández-Ibáñez P., Oller I., Gernjak W.,
Malato S. (2006). Degradation of pesticides in water using solar advanced oxidation processes. Appl.
Catal. B: Environ., 64, 272-281.
[14] Zhang F., Yediler A., Liang X. (2007). Decomposition pahtways and reaction intermediate formation
of the purified, hydrolyzed azo reactive dye C.I. Reactive Red 120 during ozonation. Chemosphere, 67,
712-717.
[15] Bravo A., García J., Domènech X., Peral J. (1993). Some aspects of the photocatalytic oxidation of
ammonium ion by titanium dioxide. J. Chem. Research, 376-377.
[16] Lapertot M., Pulgarín C., Fernández-Ibáñez P., Maldonado M.I., Pérez-Estrada L., Oller I., Gernjak
W., Malato S. (2006). Enhancing biodegradability of priority substances (pesticides) by solar photo-
Fenton. Water Res., 40, 1086-1094.

ANNEXE 1. UNPUBLISHED RESULTS 229
A.1.3. The testing of several biological and chemical coupled treatments for Cibacron Red FN-R azo dye removal
Julia García-Montañoa, Xavier Domènecha, José A. García-Hortalb, José Perala,
Francesc Torrades c*
aDepartament de Química, Edifici Cn, Universitat Autònoma de Barcelona, E-08193 Bellaterra
(Barcelona), Spain
bDepartament d’Enginyeria Tèxtil i Paperera. ETSEIA de Terrassa (UPC), C/Colom, 11, E-
08222 Terrassa (Barcelona), Spain
cDepartament d’Enginyeria Química. ETSEIA de Terrassa (UPC), C/Colom, 11, E-08222
Terrassa (Barcelona), Spain
Submitted for publication
*Corresponding author
F. Torrades: [email protected]

230 COMBINATION OF AOPS AND BIOLOGICAL TREATMENTS FOR COMMERCIAL REACTIVE AZO DYES REMOVAL
Abstract
Several biological and chemical coupled treatments for Cibacron Red FN-R reactive
azo dye degradation have been evaluated. Initially, a two-stage anaerobic-aerobic
biotreatment has been assessed for different dye concentrations (250, 1250 and 3135
mg·l-1). 92-97% decolourisation was attained during anaerobic digestion operating in
batch mode. However, no Dissolved Organic Carbon (DOC) removal neither biogas
production was observed from dye metabolites, indicating that no methanogenesis
occurred. Additionally, according to Biotox® and Zahn-Wellens assays, anaerobically
generated colourless solutions (presumably containing the resulting aromatic amines
from azo bond cleavage) were found to be more toxic than the initial dye as well as
aerobically non biodegradable, impeding the anaerobic-aerobic biological treatment. In
a second part, the application of Advanced Oxidation Processes (AOPs) like photo-
Fenton or ozonation as chemical post-treatments of the anaerobic process has been
considered for the complete dye by-products mineralisation. The best results were
obtained by means of ozonation at pH = 10.5, achieving 83% mineralisation and giving
place to a final harmless effluent. In contrast, the tested photo-Fenton conditions were
not efficient enough to complete oxidation.
Keywords: Aerobic biodegradation; Anaerobic digestion; AOPs post-treatment;
Colour removal; DOC removal; Reactive azo dye

ANNEXE 1. UNPUBLISHED RESULTS 231
1. Introduction
Azo dyes are the class of dyes most widely used industrially, constituting 60-70% of
all dyestuffs produced [1]. During the dyeing process, the degree of fixation of dyes is
never complete resulting in dye-containing effluents [2]. Not only aesthetic problems
occur, but also biotoxicity and the possible mutagenic and carcinogenic effects of azo
dyes have been reported [3]. Their degradation by conventional wastewater treatment
technologies is difficult due to their complex structure and synthetic nature; they are
non biodegradable by standard aerobic activated sludge methods, and systems based on
physical and chemical methods are quite inefficient and require further treatment or
disposal of the pollutant. Therefore, the development of effective and economic
methods for textile wastewater treatment should deserve particular attention. Not only
colour removal but also organic degradation of dyes and their metabolites must be the
pursued goals.
Among the emerging technologies for wastewater decontamination, Advanced
Oxidation Processes (AOPs) are capable to mineralise almost all toxic and non
biodegradable organic compounds [4]. These processes are principally based on the in
situ generation of highly reactive hydroxyl radicals (HO·, Eº = 2.8 V vs NHE). The
most widely studied AOPs include: heterogeneous photocatalytic oxidation with TiO2
[5, 6], treatment with ozone (often combined with H2O2 and/or UV) [7, 8], UV/H2O2
systems [9], and Fenton and photo-Fenton type reactions [10-12], which generate HO· by interaction of H2O2 with ferrous salt in aqueous media. Nevertheless, the operational
costs associated are a common problem of all AOPs and they often are too expensive to
be applied as exclusive treatment. In this sense, several earlier studies focus on the
combination of an AOP with conventional aerobic biological treatment in an attempt to
avoid the drawbacks of each of them. A minimum oxidation is performed as a pre-
treatment to just increase the biodegradability and generate a new effluent more
amenable to biodegradation [13-15].
On the other hand, since azo dyes are potentially reduced under anaerobic
conditions, and biological processes are the preferred choice for wastewater treatment,
biotreatments based on anaerobic-aerobic sequences are currently under investigation

232 COMBINATION OF AOPS AND BIOLOGICAL TREATMENTS FOR COMMERCIAL REACTIVE AZO DYES REMOVAL
[1, 16-18]. Azo bonds (R1-N=N-R2) can be anaerobically reduced basically leading to
the corresponding aromatic amines (dye solution decolourisation), compounds that are
recalcitrant and toxic under reducing atmosphere but theoretically susceptible to further
aerobic biodegradation [19].
In a previous work, the coupling of photo-Fenton reaction and an aerobic biological
process for the degradation of a representative reactive azo dye employed for cellulosic
fibres dyeing (250 mg·l-1 hydrolysed Cibacron Red FN-R, DOC = 79.5 mg·l-1 C) was
carried out [15]. At the studied concentration, the dye was neither aerobically
biodegradable nor toxic (EC50 > 79.5 mg·l-1 C) as seen by Zahn-Wellens and Biotox®
assays, respectively. With the application of photo-Fenton catalytic process as a
biological pre-treatment, a complete decolourisation and 80% mineralisation was
accomplished in the combined oxidation system.
In this paper, several biological and chemical coupled treatments for Cibacron Red
FN-R azo dye removal were evaluated as alternatives to the chemical-biological
(aerobic) strategy. In a first part, the possibility of Cibacron Red FN-R anaerobic
digestion coupled to an ensuing aerobic degradation was tested. Anaerobic assays were
carried out in batch mode. Biogas production, % decolourisation, DOC reduction and
toxicity evolution after digestion were monitored in order to evaluate the success of the
anaerobic stage. The Zahn-Wellens test was carried out for the aerobic biodegradability
assessment of the resulting anaerobic effluent. In a second part, the application of an
AOP as a chemical post-treatment of the anaerobic process has also been considered to
complete reactive azo dye and by-products mineralisation. Ozonation and photo-Fenton
processes have been chosen to play this role.
2. Materials and methods
2.1. Synthetic dye solution
A commercial azo dye, Cibacron Red FN-R bireactive vinylsulphone fluorotriazine
dye (CI Reactive Red 238, empirical formula C29H15O13S4ClFN7Na4, 944.2 g·mol-1) was
purchased from CIBA and used as received without further purification (80% purity

ANNEXE 1. UNPUBLISHED RESULTS 233
approx.). Its chemical structure was not disclosed by the manufacturer. The different
Cibacron Red FN-R concentrations were prepared by diluting an initial concentrated
stock solution of 4180 mg·l-1 (DOC = 1213 mg·l-1 C; Chemical Oxygen Demand (COD)
= 3433 mg·l-1 O2). The initial solution of Cibacron Red FN-R was hydrolysed to convert
it to the form in which it is normally found in industrial effluents. The hydrolysis was
done by adjusting the pH to 10.6, followed by heating to 60 ºC for 1 hour. Finally, the
pH of the hydrolysed stock solution was adjusted to 7.0 ± 0.2 before storage at 4 ºC.
2.2. Anaerobic biodegradation set-up and operation conditions
The anaerobic experiments were conducted in batch mode and under static
conditions in 600 ml thermostated aluminium bottles. The test sample volume was 500
ml and the headspace 100 ml. Anaerobic seed sludge was a methanogenic culture
obtained from a mesophilic municipal anaerobic digester (Manresa, Spain), containing
an initial Total Suspended Solids (TSS) and a Volatile Suspended Solids (VSS) content
of 30 and 12 g·l-1, respectively. All bottles were seeded with the same volume of
original sludge to finally obtain an initial 1.5 g·l-1 VSS and 3.8 g·l-1 TSS concentration.
0.2 g of yeast extract and 2 ml of the following solutions were added per litter of
sample [20]: 100 mg·l-1 Na2S·9H2O solution; a macronutrients solution composed of
170 g·l-1 NH4Cl, 37 g·l-1 KH2PO4, 8 g·l-1 CaCl2·2H2O and 9 g·l-1 MgSO4·4H2O; a
micronutrients solution composed of 2000 mg·l-1 FeCl3·4H2O, 2000 mg·l-1 CoCl2·6H2O,
500 mg·l-1 MnCl2·4H2O, 30 mg·l-1 CuCl2·2H2O, 50 mg·l-1 ZnCl2, 50 mg·l-1 H3BO3, 90
mg·l-1 (NH4)6Mo7O24·4H2O, 100 mg·l-1 Na2SeO3·5H2O, 50 mg·l-1 NiCl2·6H2O, 1000
mg·l-1 EDTA, 1ml·l-1 HCl 36% and 500 mg·l-1 resazurin. Additionally, 1g of NaHCO3
per g COD was added to solution in order to maintain the pH and reduce the negative
effects to methanogenesis due to the possible acidification caused by Volatile Fatty
Acids (VFA) production. Before incubation, nitrogen gas was bubbled into the bottles
to ensure anaerobic conditions during the biodegradation process. Temperature was
maintained under mesophilic conditions at 37 ± 1 ºC.
Biogas production was measured at regular intervals from bottles headspace by
means of a digital manometer (SMC Pressure Switch 10 bars) connected to the bottles

234 COMBINATION OF AOPS AND BIOLOGICAL TREATMENTS FOR COMMERCIAL REACTIVE AZO DYES REMOVAL
by a valve. Biogas was sampled through an outlet located at the valve that could be
opened or closed with a regulator key. The % methane composition was determined
using a HP 5890 gas chromatograph equipped with a thermal conductivity detector and
a Porapak Q, 3 m x 1/8” column (Supelco). The temperature of the injector was 130 ºC.
The oven temperature was initially maintained at 30 ºC for 3 minutes. Then, it was
increased to 70 ºC at a 10 ºC·min-1 rate and finally maintained at 70 ºC for 5 minutes.
The temperature of the detector was 180 ºC.
To analyse dye solutions, samples were centrifuged and the supernatant was filtered
through 0.45 μm pore size. Prior toxicity testing, sample was gassed with nitrogen to
strip out any possible remaining H2S. Every assay was performed at least twice.
2.3. Adsorption assay
Adsorption experiments were conducted in 100 ml closed thermostated flasks at 37
± 1 ºC containing 1.5 g·l-1 VSS and 3.8 g·l-1 TSS of anaerobic sludge and 30 ml of dye
solutions with 85, 250, 425, 850, 1275, 1700, 2550 and 3000 mg·l-1 concentrations.
Neither nutrients nor trace elements were added into the media. The contact time was
set at 24 hours and pH = 7.0 ± 0.2. One flask with biomass suspended in deionised
water was used as control. Hand shaking was occasionally conducted. Every
concentration was performed by duplicated.
2.4. Photo-Fenton and ozonation set-up
Photo-Fenton and ozonation processes were conducted in a thermostated (T = 23 ± 1
ºC) well stirred cylindrical Pyrex cell of 300 ml of capacity. The solution volume was
200 ml. In photo-Fenton process, analytical grade hydrogen peroxide (33% w/v,
Panreac) and FeSO4·7H2O (99.5%, Merck) were used as received to generate hydroxyl
radical (HO·) in aqueous solution. A 6 W Philips black light fluorescent lamp was used
as artificial light source. The intensity of the incident UVA light, measured employing a
luminometer, was 0.6 mW·cm-2. Ozone was generated by an Erwin Sander 301.7 model

ANNEXE 1. UNPUBLISHED RESULTS 235
equipment fed with a pure oxygen stream. To ensure saturation of the system the input
in the solution was 1.75 g·h-1 O3 as determined by iodometric titration [21]. Unreacted
ozone was measured by means of an Erwin Sander Quantozone-1 ozone-meter and
finally destroyed with a KI trap. Prior toxicity testing, solutions were gassed with
nitrogen to strip out the remaining dissolved O3 gas.
2.5. Chemical analysis
UV/Vis-absorption spectra were recorded by using a Shimatzu UV-1603 double
beam spectrophotometer in the 200-700 nm range. All colour data were reported as the
absorbance at the maximum absorption in the visible region (λmax = 542.5 nm), and were
taken as an estimation of the dye presence in solution. Samples were diluted prior to
measurements if necessary. DOC was determined with a Shimadzu TOC-VCSH analyser.
COD was assessed by the closed reflux colorimetric method [22] with a HACH
DR/2000 spectrophotometer. Determination of TSS and VSS was carried out following
Standard Methods [22].
2.6. Biological assays
Non acclimated activated sludge coming from a wastewater treatment plant
(Manresa, Spain) was used to perform the Zahn-Wellens test [23]. Acute toxicity was
assessed using the Biotox® bacterial bioluminescence assay [24], by determination of
the inhibitory effect that the sample has on the marine photobacteria Vibrio fischeri. The
toxicity effect was quantified as the EC50 parameter (the concentration of toxicant that
causes 50% decrease of light emission after 30 minutes of exposure) and was expressed
in DOC units (mg·l-1 C). When the DOC of the sample was lower than the EC50, it was
assumed to be non toxic and toxicity values were given as EC50 > 100%. Phenol and
glucose solutions were used as standard toxic and non toxic samples to check the
technique suitability. Colour correction was applied in toxicity determinations of
coloured solutions.

236 COMBINATION OF AOPS AND BIOLOGICAL TREATMENTS FOR COMMERCIAL REACTIVE AZO DYES REMOVAL
3. Results and discussion
3.1. Adsorption study
Since biological dye removal from wastewaters may involve both adsorption and
biodegradation by bacteria [17], an adsorption test was conducted in order to investigate
the potential of Cibacron Red FN-R adsorption onto the anaerobic sludge. DOC and
colour (Abs542.5) parameters were used as indicators. After 24 hours of contact time,
neither significant DOC nor colour reduction was observed for any concentration tested,
discarding a possible biosorption mechanism for colour and organic removal during
anaerobic digestion. The repulsive electrostatic interaction between Cibacron Red FN-R
reactive azo dye (of anionic nature) and the negative charges of anaerobic sludge might
be responsible for the of lack of biosorption observed [25].
3.2. Cibacron Red FN-R anaerobic digestion
The methanogenic activity of the anaerobic sludge was firstly ensured by the
assessment of the Specific Methanogenic Activity (SMA) of a VFA standard solution
composed of acetic, propionic and butyric acids (73:21:4 weight proportion, total COD
= 4500 mg·l-1 O2) [20]. From the maximum biogas generation slope (60-70% in CH4), a
SMA value of 0.084 gCODCH4·g-1VSS·day-1 was obtained (Figure 1) (typical SMA
values of anaerobic biomass from a municipal anaerobic digester range between 0.02
and 0.2 gCODCH4·g-1VSS·day-1 [20]). Afterwards, once guaranteed the methanogenic
potential of biomass, Cibacron Red FN-R was submitted to anaerobic digestion. Three
different concentrations were tested in order to assess the anaerobic sludge response to
azo dye dosage: 250, 1250 and 3135 mg·l-1 (bottles 1, 2 and 3). High dye concentrations
were employed to allow better biogas determination sensitivity. On the other hand, to
obtain information about Cibacron Red FN-R anaerobic degradation in presence of an
auxiliary substrate –which may be required for generation of reducing equivalents
consumed during azo bond cleavage [1]–, 2500 mg·l-1 of yeast extract was added to
another 1250 mg·l-1 dye solution (bottle 4). As a basis for comparison, a control bottle
just containing anaerobic biomass with the corresponding nutrients and trace elements

ANNEXE 1. UNPUBLISHED RESULTS 237
(control I), and another also containing 2500 mg·l-1 yeast extract (control II) were run in
parallel. Each batch experiment was extended to 50 days.
time, days
0 10 20 30 40 50 60
accu
mul
ated
bio
gas,
ml
0
200
400
600
800VFA standardControl I1250 mg·l-1 dyeControl II1250 mg·l-1 dye and2500 mg·l-1 yeast extract
Figure 1. Accumulated biogas production (1 atm, 37 ºC) of the VFA standard and 1250 mg·l-1
Cibacron Red FN-R solution in presence and absence of 2500 mg·l-1 yeast extract.
The parameters employed to evaluate the biodegradation efficiency were the
maximum methane generation slope per unit of weight of biomass (gCODCH4·g-1
VSS·day-1, determined in the same way than SMA [20]), the accumulated biogas
production within the 50 days of assay (1 atm, 37 ºC), as well as the % decolourisation
(Abs542.5 determination) and DOC reduction after the 50 days of experiment (Table 1).
From Table 1, it is noteworthy that nearly complete decolourisation had taken place
after digestion of all substrate types (even when no additional yeast extract was present).
The visible band at 542.5 nm, characteristic of azo bonds and responsible for the red
colour of the solution [26], disappeared within the anaerobic treatment with 92-97%
effectiveness. However, DOC data evidence that no methanogenesis from dye by-
products had taken place during the anaerobic stage. When comparing the control
experiments with the dye containing experiments (the DOC content of control I is due
to biodegradable organic nutrients supplied to all the bottles (see section 2.2)), none of

238 COMBINATION OF AOPS AND BIOLOGICAL TREATMENTS FOR COMMERCIAL REACTIVE AZO DYES REMOVAL
the dye concentrations showed higher DOC removal that the attained by the control
experiments. DOC reduction was almost the same for the 250 mg·l-1 Cibacron Red FN-
R solution and control I experiment, and even lower for higher dye dosages (Table 1),
evidencing a possible toxic/inhibitory effect to anaerobic biomass. The DOC removal of
1250 mg·l-1 dye plus 2500 mg·l-1 yeast extract sample was also lower than control II
experiment.
Table 1. Summary of experimental results for different Cibacron Red FN-R and control
solutions after 50 days of anaerobic digestion.
Bottle Substrate type %
decolourisation (Abs542.5)
DOC mg·l-1 C
gCODCH4·g-1
VSS·day-1
Accumulated biogas ratio
Initial Residual Removed
Control I - - 105a 29 76 0.005 1
1 250 mg·l-1 dye 92 176 96 80 0.004 0.89
2 1250 mg·l-1 dye 96 467 416 51 0.005 0.49
3 3135 mg·l-1 dye 97 1013 979 34 0.005 0.38
Control II 2500 mg·l-1 yeast
extract - 1107 43 1064 0.042 1
4
2500 mg·l-1
yeast extract
1250 mg·l-1 dye
93 1471 609 862 0.038 0.65
a DOC corresponding to organic nutrients supplied to all the bottles
Biogas measurements show similar results. Regarding the maximum methane
generation slope, it is noteworthy that none of the dye samples provided larger values
than the corresponding to control I and II activities, which showed 0.005 and 0.042
gCODCH4·g-1VSS·day-1 values, respectively. On the other hand, when comparing the
accumulated biogas production of dye solutions with the accumulated control bottles
values for a period of 50 days (data expressed as accumulated biogas ratio in Table 1),
they were never higher than control (ratio values lower than unity) and they decreased
when dye concentration was increased. From these results, a possible toxic/inhibitory
effect of solutions on anaerobic biomass is also deducible. As an example, Figure 1

ANNEXE 1. UNPUBLISHED RESULTS 239
shows the accumulated biogas evolution during both 1250 mg·l-1 Cibacron Red FN-R
solutions degradation and their corresponding control bottles. At first, it is noticeable a
lag phase with no biogas production in which the inocullum is adapted to both
wastewater and operational conditions. Subsequently, anaerobic degradation begins
with a continuous 60-70% methane generation at the maximum biogas generation slope
(from where gCODCH4·g-1 VSS·day-1 data were calculated). Finally, compared with
control experiments, total biogas and methane production of dye containing bottles
dropped off. This phenomenon is markedly observed with the 1250 mg·l-1 dye plus 2500
mg·l-1 yeast extract sample.
Some conclusions can be extracted from the above results. In absence of a dye
biosorption mechanism (section 3.1), and in agreement with the bibliography previously
reported, Cibacron Red FN-R reactive azo dye decolourisation would be attributable to
the reductive cleavage of azo bonds (dye chromophore) giving place to the resultant
biorecalcitrant aromatic amines. Their biorecalcitrant nature would induce the negligible
dye DOC removal and the lack of methanogenesis observed. In this frame, Biotox®
bioluminescence assay was performed to the 250 mg·l-1 anaerobically degraded solution
to assess the acute toxicity of Cibacron Red FN-R metabolites. The EC50 parameter was
found to be 43.8 mg·l-1 C (degraded control I bottle presented no toxicity), manifesting a
significant toxicity increase in relation to the actual dye (with EC50 > 79.5 mg·l-1 C).
These results would match with the suggested toxic/inhibitory effect to anaerobic
biomass and, consequently, with the harmful amines generation hypothesis. Therefore,
since the final aim when treating dye containing wastewaters is not only decolourisation
but also by-products degradation, it is clear from the above results that resulting textile
effluents from anaerobic digestion require further post-treatment.
3.3. Aerobic biodegradation post-treatment
250, 1250 and 3135 mg·l-1 Cibacron Red FN-R metabolites were submitted to Zahn-
Wellens assay to investigate the potential of standard aerobic biodegradation as a post-
treatment of the anaerobic process. The 1250 mg·l-1 dye plus 2500 mg·l-1 yeast extract
biodegraded solution (bottle 4) was not considered since the goal was to determine only
the azo dye by-products mineralisation. Figure 2 exhibits that aerobic biomass did not

240 COMBINATION OF AOPS AND BIOLOGICAL TREATMENTS FOR COMMERCIAL REACTIVE AZO DYES REMOVAL
remove substantial DOC within the 28 days of contact (being the biodegradation lower
than 9% in all case), with no sign of cells adaptation. On the contrary, the experiment
performed with ethylene glycol, a completely biodegradable standard, achieved 94%
biodegradation under the same conditions in just 3 days. The obtained results let us to
conclude that Cibacron Red FN-R metabolites after anaerobic digestion (aromatic
amines) are of non biodegradable nature and no further chemical transformation should
be expected after aerobic treatment. In agreement with this, Figure 3 illustrates the
similarity between the absorption spectra of the anaerobic and the anaerobic-aerobically
degraded 250 mg·l-1 Cibacron Red FN-R azo dye solution in comparison with the
untreated one. Moreover, the EC50 parameter was maintained at 41.9 mg·l-1 C after the
aerobic process providing indirect evidence of no aromatic amines removal. The
resistance of some aromatic amines from anaerobic cleavage of azo dyes regarding their
aerobic treatment has already been reported [16].
time, days
0 5 10 15 20 25 30 35
% b
iode
grad
atio
n
0
20
40
60
80
100
120
140
250 mg·l-1 Ethylene glycol250 mg·l-1 Cibacron Red FN-R metabolites1250 mg·l-1 Cibacron Red FN-R metabolites3135 mg·l-1 Cibacron Red FN-R metabolites
Ethylene glycol pulse
Figure 2. Zahn-Wellens assay; % biodegradability evolution of 250, 1250 and 3135 mg·l-1
Cibacron Red FN-R anaerobically treated solutions and the 250 mg·l-1 standard ethylene glycol.
Once the 28 days period was completed, a pulse of ethylene glycol was added to the
250 mg·l-1dye metabolites solution in order to detect a possible aerobic biomass
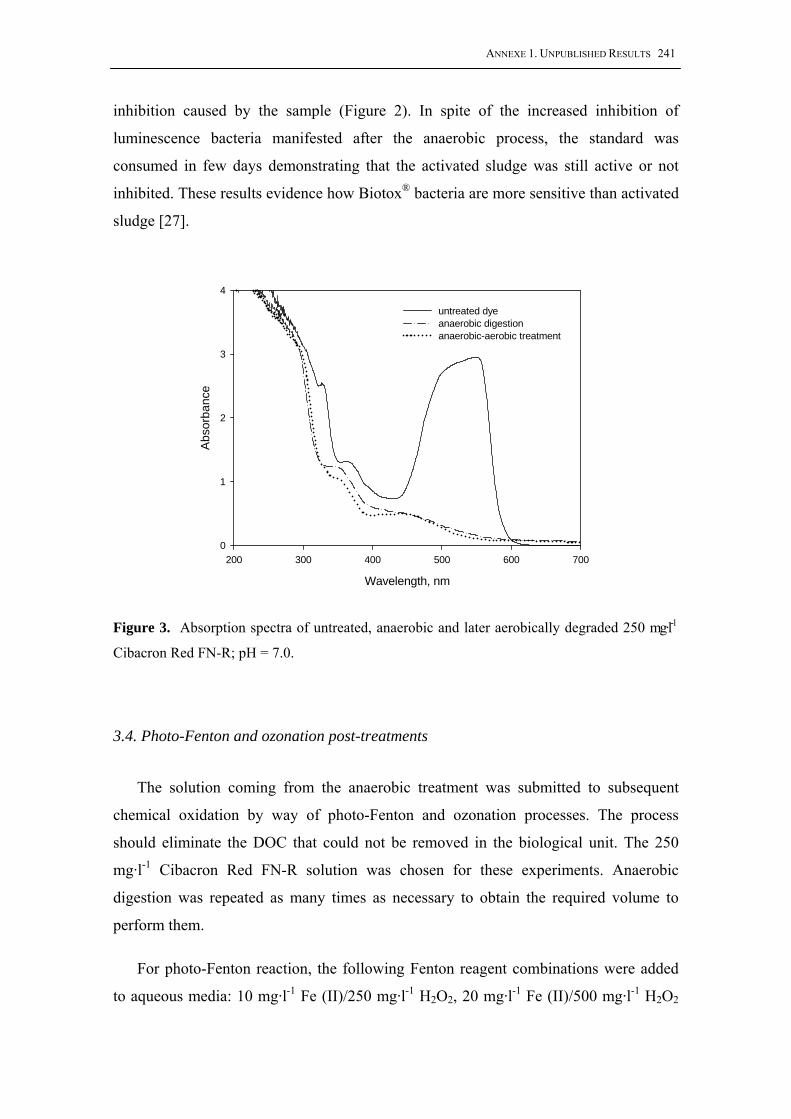
ANNEXE 1. UNPUBLISHED RESULTS 241
inhibition caused by the sample (Figure 2). In spite of the increased inhibition of
luminescence bacteria manifested after the anaerobic process, the standard was
consumed in few days demonstrating that the activated sludge was still active or not
inhibited. These results evidence how Biotox® bacteria are more sensitive than activated
sludge [27].
Wavelength, nm
200 300 400 500 600 700
Abs
orba
nce
0
1
2
3
4
untreated dyeanaerobic digestionanaerobic-aerobic treatment
Figure 3. Absorption spectra of untreated, anaerobic and later aerobically degraded 250 mg·l-1
Cibacron Red FN-R; pH = 7.0.
3.4. Photo-Fenton and ozonation post-treatments
The solution coming from the anaerobic treatment was submitted to subsequent
chemical oxidation by way of photo-Fenton and ozonation processes. The process
should eliminate the DOC that could not be removed in the biological unit. The 250
mg·l-1 Cibacron Red FN-R solution was chosen for these experiments. Anaerobic
digestion was repeated as many times as necessary to obtain the required volume to
perform them.
For photo-Fenton reaction, the following Fenton reagent combinations were added
to aqueous media: 10 mg·l-1 Fe (II)/250 mg·l-1 H2O2, 20 mg·l-1 Fe (II)/500 mg·l-1 H2O2

242 COMBINATION OF AOPS AND BIOLOGICAL TREATMENTS FOR COMMERCIAL REACTIVE AZO DYES REMOVAL
and 100 mg·l-1 Fe (II)/2500 mg·l-1 H2O2. The pH of the solutions was previously
adjusted to 2.8-3.0. The evolution of DOC removal percentage versus time is shown in
Figure 4. Results indicate that % DOC removal increased while increasing both Fe (II)
and H2O2, although none tested dosages were efficient enough to remove dye
metabolites in a reasonable treatment time. In addition, when varying the Fe (II) dosage
from 10 to 100 mg·l-1, an increasing DOC removal is first seen (the maximum attained
value was 59% with the higher Fenton reagent dosage) followed by a plateau in which
no significant DOC evolution was observed. This phenomenon is attributable to a DOC
removal process by coagulation since it was accompanied with the appearance of a
slight turbidity. The phosphate ion added as a macronutrient during anaerobic stage,
which forms insoluble complexes with Fe (III), may be the main cause of iron
precipitation. Coagulation was favoured by the high salinity content of the anaerobic
effluent. It should be also pointed out that, apart from the photo-Fenton catalyst
precipitation, the high salinity content of anaerobic effluent would also cause a HO·
scavenging effect reducing the effectiveness of oxidation. Therefore, to effectively
apply the photo-Fenton process, the complex matrix of the resulting anaerobic solution
makes necessary a pre-treatment (i.e., phosphate ion removal) or higher Fenton reagent
requirements.
time, min
0 20 40 60 80 100 120 140
DO
C/D
OC
o
0,0
0,2
0,4
0,6
0,8
1,0
1,2
10 mg·l-1 Fe(II), 250 mg·l-1 H2O2
20 mg·l-1 Fe(II), 500 mg·l-1 H2O2
100 mg·l-1 Fe(II), 2500 mg·l-1 H2O2
Figure 4. DOC/DOCo evolution versus irradiation time at different Fenton reagent doses for
250 mg·l-1 anaerobically treated Cibacron Red FN-R; pH = 3.0 and T = 23 ºC.

ANNEXE 1. UNPUBLISHED RESULTS 243
Different pH conditions were tested for dye metabolites degradation with ozone: pH
= 3.0, 7.0, 10.0 and 10.5 (Figure 5). In each case, the final pH were 2.6, 3.1, 5.1 and 9.8,
respectively. The best results were attained at alkaline pH, especially at 10.5, which
gave a substantial 83% mineralisation in 150 minutes. Both neutral and acid conditions
presented the same low 48% degradability. Obtained results are attributable to a
different oxidation mechanism depending on pH conditions [28]: for acid or neutral
values, the oxidising agent is the molecular ozone in a direct and highly selective attack
to aromatic compounds. At alkaline pH, a reaction between ozone and the hydroxide ion
gives rise to the formation of the HO· radical, which reacts non selectively with most
organic compounds. According to this behaviour, only with an initial 10.5 value the pH
remains alkaline through the whole experiment, favouring the free radical mechanism.
Therefore, not just aromatic but aliphatic compounds generated at the final stage of the
process are degraded. Finally, acute toxicity of the resulting solution was determined
and EC50 was found to be higher than DOC concentration present in solution (EC50 >
100%). Therefore, in addition to Cibacron Red FN-R intermediates degradation, ozone
AOP has been capable of transforming such compounds into harmless end products.
time, min
0 50 100 150 200 250 300 350
DO
C/D
OC
0
0.0
0.2
0.4
0.6
0.8
1.0
1.2
pH = 3.0pH = 7.0pH = 10.0pH = 10.5
Figure 5. DOC/DOCo evolution versus time for 250 mg·l-1 anaerobically treated Cibacron Red
FN-R degradation with ozone at different pH conditions. T = 23 ºC.

244 COMBINATION OF AOPS AND BIOLOGICAL TREATMENTS FOR COMMERCIAL REACTIVE AZO DYES REMOVAL
4. Conclusions
The sequenced anaerobic-aerobic biological treatment was not a plausible
alternative for Cibacron Red FN-R reactive azo dye and its metabolites removal. Three
different dye concentrations were tested: 250, 1250 and 3135 mg·l-1. A complete
decolourisation took place during the anaerobic stage for all concentrations with 92-
97% effectiveness. However, the resistance of dye metabolites (presumably hazardous
aromatic amines resulting from reductive cleavage of azo bonds), in addition with the
lack of biogas production, evidenced that no methanogenesis occurred under reducing
conditions. A possible toxic/inhibitory effect of solutions to anaerobic biomass while
increasing dye concentration was observed. Moreover, according to Biotox® and Zahn-
Wellens assays, the obtained anaerobic colourless solutions were found to be more toxic
than the original dye solution and aerobically non biodegradable (being the %
biodegradation lower than 9 in all case), impeding the biological two-stage treatment to
complete degradation.
When applying photo-Fenton and ozonation processes as anaerobic digestion
chemical post-treatments, the best results were obtained by means of ozonation at pH =
10.5, achieving 83% mineralisation and giving place to a final harmless effluent. In
contrast, the photo-Fenton catalytic process was not efficient enough to completely
oxidise the effluent. Just 59% of DOC removal of the anaerobically treated solution was
attained under 100 mg·l-1 Fe (II)/2500 mg·l-1 H2O2 photo-Fenton conditions, mostly
attributable to a non oxidative process based on iron coagulation.
In summary, complete Cibacron Red FN-R decolourisation was attained when
applying anaerobic digestion though further non biological processes are required for
effective by-products elimination. The % mineralisation achieved by coupling both
processes was similar than the obtained in the previously reported photo-Fenton-aerobic
biological treatment, which was 80% [15]. These results open the possibility of an
anaerobic-chemical sequenced treatment for aerobically non biodegradable azo dyes
removal, being of special interest for real textile wastewater applications.

ANNEXE 1. UNPUBLISHED RESULTS 245
Acknowledgements
The authors wish to thank Teresa Vicent (Departament d’Enginyeria Química,
Universitat Autònoma de Barcelona) for technical assistance and also to the Ministerio
de Educación y Ciencia (project CTQ 2005-02808) for financial support.
References
[1] O’Neill C, Hawkes FR, Hawkes DL, Esteves S, Willcox SJ. Anaerobic-aerobic biotreatment of
simulated textile effluent containing varied ratios of starch and azo dye. Water Res 2000; 34 (8): 2355-
2361.
[2] O’Neill C, Hawkes FR, Hawkes DL, Lourenço ND, Pinheiro HM, Delée W. Colour in textile
effluents-sources, measurement, discharge consents and simulation: a review. J Chem Technol Biot 1999;
74(11): 1009-1018.
[3] Chang J, Chou C, Lin Y, Lin P, Ho J, Hu TL. Kinetic characteristics of bacterial azo-dye
decolorization by Pseudomonas luteola. Water Res 2001; 35: 2841-2850.
[4] Andreozzi R, Caprio V, Insola A, Marotta R. Advanced oxidation processes (AOP) for water
purification and recovery. Catal Today 1999; 53: 51-59.
[5] Herrmann JM. Heterogeneous photocatalysis: state of the art and present applications. Top Catal
2005; 34(1-4): 49-65.
[6] Konstantinou IK, Albanis TA. TiO -assisted photocatalytic degradation of azo dyes in aqueous
solution: kinetic and mechanistic investigations: A review2
. Appl Catal B-Environ 2004; 49: 1-14.
[7] Urs von Gunten. Ozonisation of drinking water: Part I. Oxidation kinetics and product formation.
Water Res 2003; 37: 1443-1467.
[8] Gogate PR, Pandit AB. A review of imperative technologies for wastewater treatment II: hybrid
methods. Adv Environ Res 2004; 8: 553-597.
[9] Legrini O, Oliveros E, Braun AM. Photochemical processes for water treatment. Chem Rev 1993; 93:
671-698.
[10] Pérez M, Torrades F, Domènech X, Peral J. Fenton and photo-Fenton oxidation of textile effluents.
Water Res 2002; 36: 2703-2710.

246 COMBINATION OF AOPS AND BIOLOGICAL TREATMENTS FOR COMMERCIAL REACTIVE AZO DYES REMOVAL
[11] Pignatello J, Oliveros E, MacKay A. Advanced Oxidation processes for organic contaminant
destruction based on the Fenton reaction and related chemistry. Crit Rev Env Sci Tec 2006; 36: 1-84.
[12] Kiwi J, Pulgarin C, Peringer P. Effect of Fenton and photo-Fenton reactions on the degradation and
biodegradability of 2 and 4-nitrophenols in water treatment. Appl Cat B-Environ 1994; 3: 335-350.
[13] Sarria V, Kenfack S, Guillod O, Pulgarín C. An innovative coupled solar-biological system at field
pilot scale for the treatment of biorecalcitrant pollutants. J Photoch Photobio A 2003; 159: 89-99.
[14] Farré MJ, Domènech X, Peral J. Assessment of photo-Fenton and biological treatment coupling for
Diuron and Linuron removal from water. Water Res 2006; 40: 2533-2540.
[15] García-Montaño J, Torrades F, García-Hortal JA, Domènech X, Peral J. Combining photo-Fenton
process with aerobic sequencing batch reactor for commercial hetero-bireactive dye removal. Appl Catal
B-Environ 2006; 67: 86-92.
[16] Frank P van der Zee, Villaverde S. Combined anaerobic-aerobic treatment of azo dyes-A short
review of bioreactor studies. Water Res 2005; 39: 1425-1440.
[17] Soon-An Ong, Toorisaka E, Hirata M, Hano T. Treatment of azo dye Orange II in aerobic and
anaerobic-SBR systems. Process Biochem 2005; 40: 2907-2914.
[18] Shaw CB, Carliell CM, Weatley AD. Anaerobic/aerobic treatment of coloured textile effluents using
sequencing batch reactors. Water Res 2002; 36: 1993-2001.
[19] Carliell CM, Barclay SJ, Buckley CA. Treatment of exhausted reactive dyebath effluent using
anaerobic digestion: Laboratory and full-scale trials. Water S.A 1996; 22: 225-233.
[20] Field J, Alvarez RS, Lettinga G. Ensayos anaerobios. Proc. of 4th Symp. on Wastewater Anaerobic
Treatment. Valladolid, Spain; 1988. p. 52.
[21] Beyer M, Walter W. Manual de Química Orgánica. Ed. Reverté S.A. Barcelona, Spain; 1987.
[22] APHA-AWWA-WEF. Standard Methods for the Examination of Water and Wastewater. 18th ed.
Washington, DC; 1992.
[23] ECD Guidelines for Testing of Chemicals. Test 302B. Vol 2. Paris, France; 1996.
[24] ISO 11348-3. Determination of the Inhibitory Effect of Water Samples on The Light Emission of
Vibrio fischeri (Luminescent bacteria test); 1998.
[25] Wang Y, Mu Y, Zhao Q-B, Yu H-Q. Isotherms, kinetics and thermodynamics of dye biosorption by
anaerobic sludge. Sep Purif Technol 2006; 50: 1-7.

ANNEXE 1. UNPUBLISHED RESULTS 247
[26] Silverstein RMC, Bassler GC, Morril TC. Spectrophotometric Identification of organic compounds.
New York: Wiley; 1991.
[27] Farré M, Barceló D. Toxicity testing of wastewater and sewage sludge by biosensors, bioassays and
chemical assays. Trends Anal Chem 2003; 22(5): 299-310.
[28] Hoigné J, Bader H. The role of hydroxyl radical reactions in ozonation process in aqueous solutions.
Water Res 1976; 10: 377-386.

Annexe 2
Supporting Information

ANNEXE 2. SUPPORTING INFORMATION 251
A.2.1. LC-(ESI)-TOF-MS spectra
The following Figures show the LC-(ESI)-TOF-MS spectra of Procion Red H-E7B
degradation products after t30W = 6 minutes of solar photo-Fenton treatment:
632 634 636 638 640 642 644 646 648 650 652 654 656 658 660 662 664 666 668 670
m/z, amu2000.0
6000.0
1.0e4
1.4e4
1.8e4
2.2e4
2.6e4
3.0e4
3.4e4
3.8e4
4.2e4
Inte
nsity
, cou
nts
651.0322
653.0295
652.0358
654.0320
N
N
NN
N
N
HN NH
Cl Cl
NH2NH
OHHO
SO3H OH
HO
OH
Figure A.2.1. MS spectrum of C1.

COMBINATION OF AOPS AND BIOLOGICAL TREATMENTS FOR COMMERCIAL REACTIVE AZO DYES REMOVAL 252
632 634 636 638 640 642 644 646 648 650 652 654 656 658 660 662 664 666 668 670
500.00
1500.00
Figure A.2.2. MS spectrum of C1’.
Figure A.2.3. MS spectrum of C1’’.
2500.00
3500.00
0.00
0.00
6500.00
7500.00
8500.00
9500.00
1.05e4
1.15e4
1.25e4
1.34e4
Inte
nsity
, cou
nts
651.0312
653.0297
652.0330
654.0286
m/z, amu
ClCl
450
550
N
N
NN
N
N
HN NH
NH2NH
OHOHHO
SO3H
HO
OH
632 634 636 638 640 642 644 646 648 650 652 654 656 658 660 662 664 666 668 670
200
600
1000
1400
1800
2200
2600
3000
3400
3800
4200
4600
5000
5400
5800
6195
Inte
nsity
, cou
nts
651.0308
653.0299
m/z, amu
N
N
NN
N
N
HN NH
Cl Cl
NH2NH
OHHO
SO3H OH
HO
OH

ANNEXE 2. SUPPORTING INFORMATION 253
622 624 626 628 630 632 634 636 638 640 642 644 646 648 650 652 654 656 658 660
200
600
1000
1400
1800
2200
2600
3000
3400
3800
4200
4600
5000
5400
5800
Inte
nsity
, cou
nts
633.0676
635.0638
634.0712
N
N
NN
N
N
HN NH
Cl HO
NH2NH
OHHO
SO3H OH
OH
HO
m/z, amu
Figure A.2.4. MS spectrum of C2.
620 622 624 626 628 630 632 634 636 638 640 642 644 646 648 650 652 654 656 658 660
200
600
1000
1400
1800
2200
2600
3000
3400
3800
4200
4600
5000
5400
5800
6200
6600
Inte
nsity
, cou
nts
633.0642
635.0627
634.0677
m/z, amu
N
N
NN
N
N
HN NH
Cl HO
NH2NH
OHHO
SO3H OH
OH
HO
Figure A.2.5. MS spectrum of C2’.

COMBINATION OF AOPS AND BIOLOGICAL TREATMENTS FOR COMMERCIAL REACTIVE AZO DYES REMOVAL 254
622 624 626 628 630 632 634 636 638 640 642 644 646 648 650 652 654 656 658 660
200
600
1000
1400
1800
2200
2600
3000
3400
3800
4200
4600
5000
Inte
nsity
, cou
nts
633.0664
635.0636
m/z, amu
N
N
NN
N
N
HN NH
Cl HO
NH2NH
OHHO
SO3H OH
OH
HO
Figure A.2.6. MS spectrum of C2’’.
600 602 604 606 608 610 612 614 616 618 620 622 624 626 628 630 632 634 636 638 640
200
600
1000
1400
1800
2200
2600
3000
3400
3800
4200
Inte
nsity
, cou
nts
621.0231
623.0194
m/z, amu
N
N
NN
N
N
HN NH
Cl Cl
NH2NH
SO3H
O
O
OH
OH
Figure A.2.7. MS spectrum of C3.

ANNEXE 2. SUPPORTING INFORMATION 255
600 602 604 606 608 610 612 614 616 618 620 622 624 626 628 630 632 634 636 638 640
200
600
1000
1400
1800
2200
2600
3000
3400
3800
Inte
nsity
, cou
nts
621.0220
623.0182
m/z, amu
N
N
NN
N
N
HN NH
Cl Cl
NH2NH
SO3H
O
O
OH
OH
Figure A.2.8. MS spectrum of C3’.
350 352 354 356 358 360 362 364 366 368 370 372 374 376 378 380 382 384 386 388 390
5.00e4
1.50e5
2.50e5
3.50e5
4.50e5
5.50e5
6.50e5
7.50e5
8.50e5
9.50e5
1.05e6
Inte
nsity
, cou
nts
365.0551
367.0518
366.0565
369.0488
m/z, amu
N
N
NN
N
N
HN NH
H2N
Cl Cl
NH2
Figure A.2.9. MS spectrum of C4.

COMBINATION OF AOPS AND BIOLOGICAL TREATMENTS FOR COMMERCIAL REACTIVE AZO DYES REMOVAL 256
330 332 334 336 338 340 342 344 346 348 350 352 354 356 358 360 362 364 366 368 370
1.0e4
3.0e4
5.0e4
7.0e4
9.0e4
1.1e5
1.3e5
1.5e5
1.7e5
1.9e5
2.1e5
2.3e5
2.5e5
2.7e5
Inte
nsity
, cou
nts
347.0880
349.0856
348.0901
m/z, amu
N
N
NN
N
N
HN NH
H2N
Cl HO
NH2
Figure A.2.10. MS spectrum of C5.
356 357 358 359 360 361 362 363 364 365 366 367 368 369 370 371 372 373 374 375
1000.0
3000.0
5000.0
7000.0
9000.0
1.1e4
1.3e4
1.5e4
1.7e4
1.9e4
2.1e4
2.3e4
Inte
nsity
, cou
nts
366.0382
368.0350
367.0393369.0371
m/z, amu
N
N
NN
N
N
HN NH
H2N
Cl Cl
OH
Figure A.2.11. MS spectrum of C6.

ANNEXE 2. SUPPORTING INFORMATION 257
362 364 366 368 370 372 374 376 378 380 382 384 386 388 390 392 394 396 398 400
5000.00
1.50e4
2.50e4
3.50e4
4.50e4
5.50e4
6.50e4
7.50e4
8.50e4
9.50e4
Inte
nsity
, cou
nts
381.0491
383.0462
382.0512
384.0482
m/z, amu
N
N
NN
N
N
HN NH
H2N
Cl Cl
NH2
OH
Figure A.2.12. MS spectrum of C7.
382 384 386 388 390 392 394 396 398 400 402 404 406 408 410 412 414 416 418 420
1000.0
3000.0
5000.0
7000.0
9000.0
1.1e4
1.3e4
1.5e4
1.7e4
1.9e4
2.1e4
2.3e4
2.5e4
2.6e4
Inte
nsity
, cou
nts
395.0280
397.0254
m/z, amu
N
N
NN
N
N
HN NH
H2N
Cl Cl
NH2O
O
Figure A.2.13. MS spectrum of C8.

COMBINATION OF AOPS AND BIOLOGICAL TREATMENTS FOR COMMERCIAL REACTIVE AZO DYES REMOVAL 258
370 371 372 373 374 375 376 377 378 379 380 381 382 383 384 385 386 387 388 389 390
500.0
1500.0
2500.0
3500.0
4500.0
5500.0
6500.0
7500.0
8500.0
9500.0
1.1e4
1.2e4
1.3e4
1.4e4
1.5e4
1.6e4In
tens
ity, c
ount
s377.0619
379.0563
378.0407
m/z, amu
N
N
NN
N
N
HN NH
H2N
Cl HO
NH2O
O
Figure A.2.14. MS spectrum of C9.
222 224 226 228 230 232 234 236 238 240 242 244 246 248 250 252 254 256 258 2605000.0
1.5e4
2.5e4
3.5e4
4.5e4
5.5e4
6.5e4
7.5e4
8.5e4
9.5e4
1.1e5
1.2e5
1.3e5
1.4e5
1.5e5
1.6e5
1.7e5
1.8e5
1.9e5
Inte
nsity
, cou
nts
238.0489
240.0461
239.0511
m/z, amu
N
N
N
HO NH
Cl
NH2
Figure A.2.15. MS spectrum of C10.

ANNEXE 2. SUPPORTING INFORMATION 259
126 128 130 132 134 136 138 140 142 144 146 148 150 152 154 156 158 160 162 164
5.0e4
1.5e5
2.5e5
3.5e5
4.5e5
5.5e5
6.5e5
7.5e5
8.5e5
9.5e5
1.1e6
1.2e6
1.3e6
1.4e6
1.5e6
Inte
nsity
, cou
nts
146.0233
148.0201
m/z, amu
N N
N
Cl
NH2H2N
Figure A.2.16. MS spectrum of C11.
112 114 116 118 120 122 124 126 128 130 132 134 136 138 140 142 144 146 148 150
1000.0
3000.0
5000.0
7000.0
9000.0
1.1e4
1.3e4
1.5e4
1.7e4
1.9e4
2.1e4
2.3e4
2.5e4
2.7e4
2.9e4
3.1e4
3.3e4
Inte
nsity
, cou
nts
128.0571
m/z, amu
N N
N
OH
NH2H2N
Figure A.2.17. MS spectrum of C12.

COMBINATION OF AOPS AND BIOLOGICAL TREATMENTS FOR COMMERCIAL REACTIVE AZO DYES REMOVAL 260
144.0 144.5 145.0 145.5 146.0 146.5 147.0 147.5 148.0 148.5 149.0 149.5 150.0
500.0
1500.0
2500.0
3500.0
4500.0
5500.0
6500.0
7500.0
8500.0
9500.0
1.1e4
1.2e4
1.3e4
1.4e4
Inte
nsity
, cou
nts
147.0073
149.0027
N N
N
Cl
OHH2N
m/z, amu
Figure A.2.18. MS spectrum of C13.

ANNEXE 2. SUPPORTING INFORMATION 261
A.2.2. LCA characterisation tables
The following Tables show, for each wastewater treatment, the characterisation
results disaggregated by sub-systems:
Table A.2.1. Characterisation results for artificial light photo-Fenton process.
Category Unit Hydrogen
peroxide 50% Iron
sulphate Grid
electricity Transports Emissions
ARD kg Sb 5.4·10-6 6.6·10-8 2.4·10-6 1.4·10-7 0
GPW kg CO2 6.6·10-4 9.2·10-6 3.4·10-4 2.0·10-5 2.9·10-4
ODP kg CFC 11 6.1·10-11 4.2·10-13 1.4·10-11 3.2·10-12 0
HTP kg 1,4-Da 2.2·10-3 1.5·10-5 1.7·10-4 1.1·10-5 0
FATP kg 1,4-Da 1.4·10-4 2.3·10-6 2.2·10-5 1.3·10-6 0
MAEP kg 1,4-Da 2.6·10-1 7.0·10-3 2.2·10-1 2.5·10-3 0
TEP kg 1,4-Da 4.6·10-6 6.3·10-8 6.4·10-6 3.9·10-8 0
POP kg C2H4 9.9·10-8 2.2·10-9 7.5·10-8 4.0·10-9 0
AP kg SO2 2.2·10-6 5.3·10-8 1.9·10-6 1.2·10-7 0
AEP kg PO43- 2.2·10-7 3.5·10-9 9.4·10-8 2.5·10-8 3.4·10-6
a 1,4- Dichlorobenzene
Table A.2.2. Characterisation results for solar driven photo-Fenton process.
Category Unit Hydrogen
peroxide 50% Iron
sulphate Transports Emissions
ARD kg Sb 5.4·10-6 6.6·10-8 1.4·10-7 0
GPW kg CO2 6.6·10-4 9.2·10-6 2.0·10-5 2.8·10-4
ODP kg CFC 11 6.1·10-11 4.2·10-13 3.2·10-12 0
HTP kg 1,4-Da 2.2·10-3 1.5·10-5 1.1·10-5 0
FATP kg 1,4-Da 1.4·10-4 2.3·10-6 1.3·10-6 0
MAEP kg 1,4-Da 2.6·10-1 7.0·10-3 2.5·10-3 0
TEP kg 1,4-Da 4.6·10-6 6.3·10-8 3.9·10-8 0
POP kg C2H4 9.9·10-8 2.2·10-9 4.0·10-9 0
AP kg SO2 2.2·10-6 5.3·10-8 1.2·10-7 0
AEP kg PO43- 2.2·10-7 3.5·10-9 2.5·10-8 2.5·10-6
a 1,4- Dichlorobenzene

COMBINATION OF AOPS AND BIOLOGICAL TREATMENTS FOR COMMERCIAL REACTIVE AZO DYES REMOVAL 262
Table A.2.3. Characterisation results for artificial light photo-Fenton process coupled to a
biological treatment.
Category Unit Hydrogen peroxide
50%
Iron sulphate
Grid electricity
Transports Emissions Biological treatment
ARD kg Sb 2.7·10-6 6.6·10-8 1.5·10-6 7.4·10-8 0 6.3·10-8
GPW kg CO2 3.3·10-4 9.2·10-6 2.0·10-4 1.0·10-5 1.7·10-4 9.9·10-5
ODP kg CFC 11 3.1·10-11 4.2·10-13 8.4·10-12 1.7·10-12 0 1.2·10-12
HTP kg 1,4-Da 1.1·10-3 1.5·10-5 9.9·10-5 5.8·10-6 0 3.4·10-6
FATP kg 1,4-Da 7.2·10-5 2.3·10-6 1.3·10-5 7.0·10-7 0 4.1·10-7
MAEP kg 1,4-Da 1.3·10-1 7.0·10-3 1.3·10-5 1.3·10-3 0 2.9·10-3
TEP kg 1,4-Da 2.3·10-6 6.3·10-8 3.8·10-6 2.0·10-8 0 8.0·10-8
POP kg C2H4 5.0·10-8 2.2·10-9 4.5·10-8 2.1·10-9 0 1.9·10-8
AP kg SO2 1.1·10-6 5.3·10-8 1.1·10-6 6.2·10-8 0 1.2·10-7
AEP kg PO43- 1.1·10-7 3.5·10-9 5.7·10-8 1.3·10-8 2.2·10-6 3.8·10-7
a 1,4- Dichlorobenzene