Embed Size (px)
Citation preview
Electrical measurement of magnetic-field-impeded polarity switching of aferromagnetic vortex core
Manu Sushruth,1 Jasper P. Fried,1 Abdelmadjid Anane,2 Stephane Xavier,3
Cyrile Deranlot,2 Mikhail Kostylev,1 Vincent Cros,2 and Peter J. Metaxas1, ∗
1School of Physics, M013, University of Western Australia, 35 Stirling Hwy, Crawley WA 6009, Australia.2Unite Mixte de Physique, CNRS, Thales, Univ. Paris-Sud,
Universite Paris-Saclay, 91767, Palaiseau, France.3Thales Research and Technology, 1 Avenue A. Fresnel, Palaiseau, France
(Dated: September 17, 2021)
Vortex core polarity switching in NiFe disks has been evidenced using an all-electrical rectificationscheme. Both simulation and experiments yield a consistent loss of the rectified signal when drivingthe core at high powers near its gyrotropic resonant frequency. The frequency range over which theloss occurs grows and shifts with increasing signal power, consistent with non-linear core dynamicsand periodic switching of the core polarity induced by the core attaining its critical velocity. Wedemonstrate that core polarity switching can be impeded by displacing the core towards the disk’sedge where an increased core stiffness reduces the maximum attainable core velocity.
Ferromagnetic vortices are curled magnetization con-figurations with out of plane magnetized cores1–3. Theyarise naturally4 at zero external magnetic field in thin fer-romagnetic discs with negligible intrinsic anisotropy anddiameters ∼ 0.1−1 µm. An example of a magnetic topo-logical defect or soliton, ferromagnetic vortices have beenthe subject of much applications-driven research typicallyfocused on data storage5, logic6 and radiofrequency nano-devices7,8.
Spintronic7,8 and magnonic9,10 applications often ex-ploit the vortex core’s gyrotropic resonance which in-volves a confinement-influenced gyration of the corearound its equilibrium position. The gyrotropic modecan be driven by spin transfer torques or in-plane orientedr.f. magnetic fields. At low excitation powers, this reso-nance entails a steady-state gyration of the vortex coreat a well defined frequency11, fG. However, excitationat higher powers can generate more complex, but fun-damentally appealing, non-linearities such as resonancepeak fold-over12–14 and core polarity switching15–17. Thelatter occurs when the core reaches a material-dependentcritical velocity15, vcrit. Core switching (as well as coreexpulsion18) open up attractive routes for controlling corepolarity, critical for data storage17, field sensing19 andelectronic oscillator tuning8,20.
Core polarity switching driven by dynamic phenom-ena has been probed predominantly using high reso-lution magnetic imaging techniques capable of resolv-ing the nano-scale core’s magnetization orientation5,21,22.Magnetic resonance force microscopy has also beenemployed16 and more recently, switching was detectedusing bench-top magneto-optics23. It has been evidencedmagnetoresistively in double vortex nano-pillars24 andusing a magnetic tunnel junction fabricated above thecentral portion of a magnetic disk25, a measurement ge-ometry which enabled real-time probing of the magneti-zation in the central part of the disk.
A large number of measurements of steady state vor-tex gyration (as well as anti-vortex dynamics26) have
however exploited simpler device geometries where lat-erally injected currents are used to drive and probethe gyrotropic resonance9,27–29. In these measurements,current-driven gyrotropic motion of the core leads to os-cillations in the device resistance (via anisotropic magne-toresistance, AMR) which can mix with the input r.f. cur-rent to generate a measurable, rectified d.c. voltage.
In this paper we show that this rectified signal is lostor strongly reduced when core polarity switching oc-curs, offering a simple, all-electrical method to probecore switching in single disks. Using this technique, wedemonstrate how static applied fields can be used tocontrol the range of frequencies over which core switch-ing occurs by moving the core into a region of strongerconfinement where the core is impeded from reachingvcrit. We observe signatures of peak fold-over and reso-nance downshifting when increasing the excitation power,demonstrating the use of this simple detection scheme toprobe regimes of highly non linear magnetization dynam-ics, which otherwise remain complex to study.
We first simulate core gyration in a 30 nm thick, 192nm wide NiFe-like disk using MuMax330 with satura-tion magnetization MS = 800 kA/m, exchange stiffnessAex = 13 pJ/m, nil intrinsic anisotropy and gyromag-netic ratio γ = 1.7595 × 10¹¹ rad.(T.s)−1. The cell sizewas 3 × 3 × 3.75 nm3 (64 × 64 × 8 cells). We initial-ize the system with a vortex-like state, optionally ap-ply an in-plane static magnetic field, HIP , to displacethe core and then let the magnetization configuration re-lax. We then apply a sinusoidal in-plane excitation field,Hrf = hrf sin(2πft), at frequencies, f , in the neighbor-hood of fG. In the second part of the paper we willpresent measurements of core dynamics in wider diskswhere the 30 nm thick NiFe layer is covered by a non-magnetic capping layer of thickness ≈ 40 nm). Currents,Irf = I0 sin(2πft), flowing through the disk will generatean in-plane field in the lower NiFe layer which will be thedominant driver of the gyrotropic mode. We approxi-mate this field by Hrf in the simulation which enables us
arX
iv:1
605.
0182
6v1
[co
nd-m
at.m
es-h
all]
6 M
ay 2
016

2
to replicate many of the observed experimental features.The r.f. field is transverse to the r.f. current flow (consis-tent with an Oersted field), the latter being parallel toHIP [Figs. 1(a,b)].
FIG. 1. Dynamic resistance change and voltage due to coreoscillations for p = +1 and HIP = 0 (a) and µ0HIP = +5 mT(b). f = 1.05 GHz and hrf = 0.5 mT. Images show snapshotsof the core positions with the solid dashed lines being referencepositions of the left and right displaced cores for HIP = 0.Solid light blue lines show the rectified (averaged) d.c. voltage.(c) Resultant voltage peaks for µ0HIP = +5 mT (p = +1) andµ0HIP = +5 mT (for p = ±1) and µ0hrf = 0.5 mT obtainedby averaging the time dependent ∆V over 50 oscillations ofthe core gyration period, commencing at t = 100 ns so as touse steady state dynamics. (d) Core displacement versus fand hrf . The solid black line shows the fG obtained for a sincpulse excitation. (e) Time averaged rectified signal (3 µs ofaveraging) versus frequency for µ0HIP = 5 mT and hrf = 6mT. (f) Core position versus time for a vortex undergoingcore polarity switching. Switching events are identified froma reduced displacement. (g) Cumulative time average of therectified voltage.
AMR depends on the angle between the axes alongwhich the current flow and magnetization are aligned.During a single orbit of the core, the resistance will in-crease twice since left- and right-displaced cores both in-crease the disk resistance, R [Fig. 1(a)]. For symmetricelectrode placement on a circular disk the change in R,∆R, is given by31,32 ∆R ∝ x2 − y2 where (x, y) is thetime dependent core position measured with respect tothe disk’s center. As such, a core oscillating around the
center of the disk at a frequency f generates a resistanceoscillation at 2f . However, there is no rectified voltagesince the dynamic ∆V ∝ ∆RIrf is symmetric aroundzero [light blue line in Fig. 1(a)]. Although the 2f sig-nal can be directly probed33, a finite rectified voltage canbe achieved by laterally displacing the equilibrium coreposition using a static in-plane field31,32. The changesin resistance for left and right displaced cores are thenunequal [Fig. 1(b)], the resulting ∆R having a compo-nent changing at f which can mix with Irf (also at f)and generate a finite, rectified time averaged ∆V on res-onance [Figs. 1(b,c)]. Changing the core polarity changesthe direction of core gyration and thus the sign of the rec-tified voltage, generating a core-polarity-dependent volt-age peak for |HIP| > 0 at fG [Fig. 1(c)].
A higher hrf generates much larger maximum core dis-placements during the oscillation [Fig. 1(d)]. There isalso a down shifting of the center of the resonance peaklinked to fold-over. We expect core switching15 to occurwhen the core reaches vcrit = 333 m/s (= 2πγ1.33
√Aex;
uncert. 10.8 %). Thus, assuming a circular orbit, we ex-pect the maximum core displacement for which steadygyration can be driven to be 333/2πf . Indeed, the coredisplacement data for which switching did and did notoccur are shown respectively as open and closed symbolsin Fig. 1(d) with the 333/2πf line shown in Fig. 1(e)consistently separating the two sets of points.
Since the sign of the rectified signal depends on thecore polarity, a periodic switching of the polarity wouldgenerate a null averaged ∆V . Indeed, this is seen insimulation where a strongly reduced signal near reso-nance is observed [Fig. 1(e)]. Note that polarity switch-ing events are not perfectly regular [Fig. 1(f)]. In-deed, as seen previously34, we found a dependence ofthe switching traces on small changes in the initial con-ditions of the simulation, consistent with chaotic dy-namics. Irregular switching events were also previouslyevidenced in experiment25. To accurately describe thetime-averaged behavior of the turbulent ∆V , we mustlook at its cumulative average over long time scales:
Vc.a.(t) =∑t′=t
t′=0 V (t′) [Fig. 1(g)]. Indeed, after ≈ 1 µs ofturbulent dynamics, Vc.a → 0 with the values in Fig. 1(e)corresponding to35 Vc.a. at t = 3 µs. Notably, the signalis either strongly reduced or equal to zero where core po-larity switching occurs. Thus, even irregular switchingwill lead to a quasi-null averaged rectified voltage at longenough time scales.
We now use rectification to evidence core switchingin 2 µm wide //NiFe(30 nm)/Au(10 nm)/Ti(≈ 30 nm)disks [Fig. 2(a)]. They were fabricated from a continuous//NiFe(30nm)/Au(10 nm) layer via Argon ion milling us-ing a Ti disk as a milling mask (defined via electron beamlithography and lift-off). Auger spectroscopy revealedthat approximately 30 nm of Ti remained after etching,leading to the tri-layer structure referenced above. Lat-eral contacts (//Au/Ti) were defined using electron beamlithography and lift-off. The device was wire bonded toa sample mount which could rotate between the poles of
3
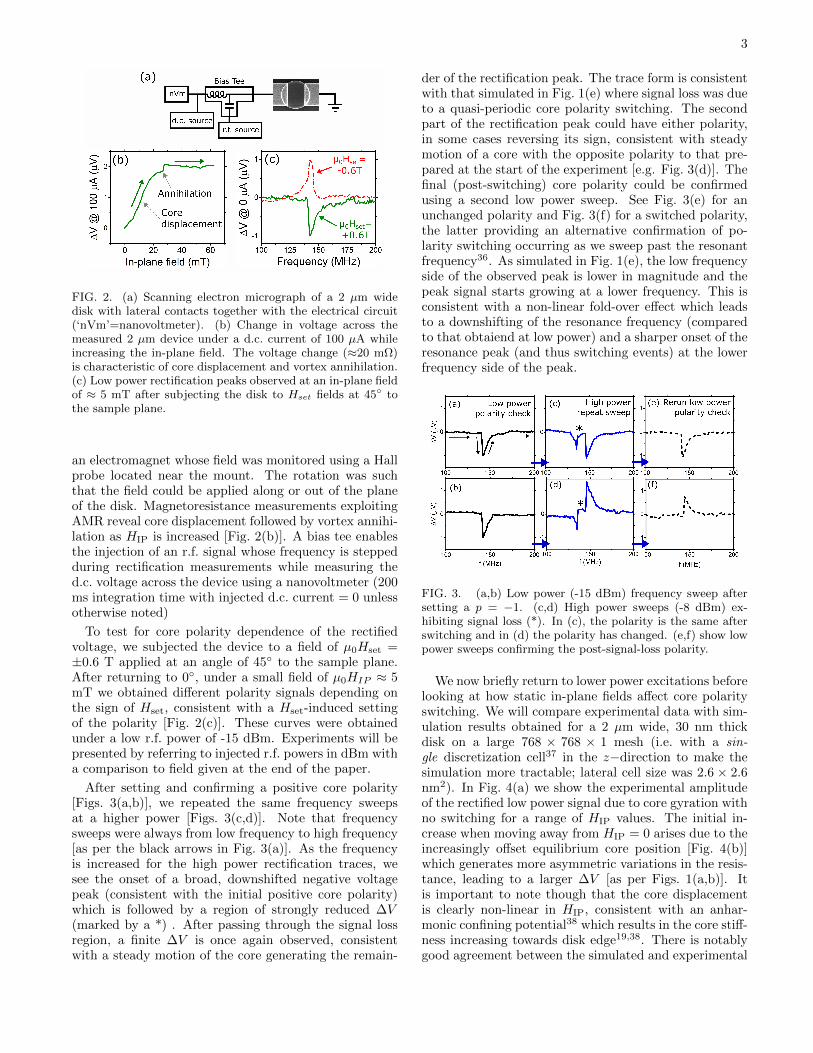
FIG. 2. (a) Scanning electron micrograph of a 2 µm widedisk with lateral contacts together with the electrical circuit(‘nVm’=nanovoltmeter). (b) Change in voltage across themeasured 2 µm device under a d.c. current of 100 µA whileincreasing the in-plane field. The voltage change (≈20 mΩ)is characteristic of core displacement and vortex annihilation.(c) Low power rectification peaks observed at an in-plane fieldof ≈ 5 mT after subjecting the disk to Hset fields at 45 tothe sample plane.
an electromagnet whose field was monitored using a Hallprobe located near the mount. The rotation was suchthat the field could be applied along or out of the planeof the disk. Magnetoresistance measurements exploitingAMR reveal core displacement followed by vortex annihi-lation as HIP is increased [Fig. 2(b)]. A bias tee enablesthe injection of an r.f. signal whose frequency is steppedduring rectification measurements while measuring thed.c. voltage across the device using a nanovoltmeter (200ms integration time with injected d.c. current = 0 unlessotherwise noted)
To test for core polarity dependence of the rectifiedvoltage, we subjected the device to a field of µ0Hset =±0.6 T applied at an angle of 45 to the sample plane.After returning to 0, under a small field of µ0HIP ≈ 5mT we obtained different polarity signals depending onthe sign of Hset, consistent with a Hset-induced settingof the polarity [Fig. 2(c)]. These curves were obtainedunder a low r.f. power of -15 dBm. Experiments will bepresented by referring to injected r.f. powers in dBm witha comparison to field given at the end of the paper.
After setting and confirming a positive core polarity[Figs. 3(a,b)], we repeated the same frequency sweepsat a higher power [Figs. 3(c,d)]. Note that frequencysweeps were always from low frequency to high frequency[as per the black arrows in Fig. 3(a)]. As the frequencyis increased for the high power rectification traces, wesee the onset of a broad, downshifted negative voltagepeak (consistent with the initial positive core polarity)which is followed by a region of strongly reduced ∆V(marked by a *) . After passing through the signal lossregion, a finite ∆V is once again observed, consistentwith a steady motion of the core generating the remain-
der of the rectification peak. The trace form is consistentwith that simulated in Fig. 1(e) where signal loss was dueto a quasi-periodic core polarity switching. The secondpart of the rectification peak could have either polarity,in some cases reversing its sign, consistent with steadymotion of a core with the opposite polarity to that pre-pared at the start of the experiment [e.g. Fig. 3(d)]. Thefinal (post-switching) core polarity could be confirmedusing a second low power sweep. See Fig. 3(e) for anunchanged polarity and Fig. 3(f) for a switched polarity,the latter providing an alternative confirmation of po-larity switching occurring as we sweep past the resonantfrequency36. As simulated in Fig. 1(e), the low frequencyside of the observed peak is lower in magnitude and thepeak signal starts growing at a lower frequency. This isconsistent with a non-linear fold-over effect which leadsto a downshifting of the resonance frequency (comparedto that obtaiend at low power) and a sharper onset of theresonance peak (and thus switching events) at the lowerfrequency side of the peak.
FIG. 3. (a,b) Low power (-15 dBm) frequency sweep aftersetting a p = −1. (c,d) High power sweeps (-8 dBm) ex-hibiting signal loss (*). In (c), the polarity is the same afterswitching and in (d) the polarity has changed. (e,f) show lowpower sweeps confirming the post-signal-loss polarity.
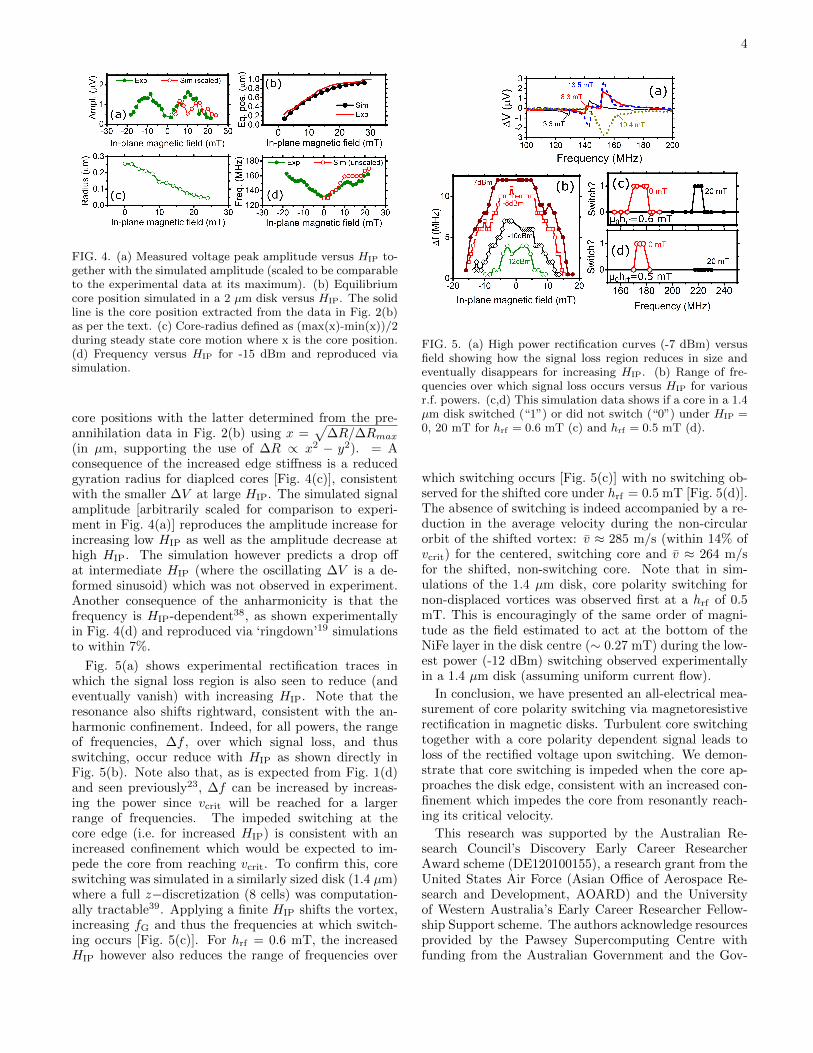
We now briefly return to lower power excitations beforelooking at how static in-plane fields affect core polarityswitching. We will compare experimental data with sim-ulation results obtained for a 2 µm wide, 30 nm thickdisk on a large 768 × 768 × 1 mesh (i.e. with a sin-gle discretization cell37 in the z−direction to make thesimulation more tractable; lateral cell size was 2.6 × 2.6nm2). In Fig. 4(a) we show the experimental amplitudeof the rectified low power signal due to core gyration withno switching for a range of HIP values. The initial in-crease when moving away from HIP = 0 arises due to theincreasingly offset equilibrium core position [Fig. 4(b)]which generates more asymmetric variations in the resis-tance, leading to a larger ∆V [as per Figs. 1(a,b)]. Itis important to note though that the core displacementis clearly non-linear in HIP, consistent with an anhar-monic confining potential38 which results in the core stiff-ness increasing towards disk edge19,38. There is notablygood agreement between the simulated and experimental
4
FIG. 4. (a) Measured voltage peak amplitude versus HIP to-gether with the simulated amplitude (scaled to be comparableto the experimental data at its maximum). (b) Equilibriumcore position simulated in a 2 µm disk versus HIP. The solidline is the core position extracted from the data in Fig. 2(b)as per the text. (c) Core-radius defined as (max(x)-min(x))/2during steady state core motion where x is the core position.(d) Frequency versus HIP for -15 dBm and reproduced viasimulation.
core positions with the latter determined from the pre-annihilation data in Fig. 2(b) using x =
√∆R/∆Rmax
(in µm, supporting the use of ∆R ∝ x2 − y2). = Aconsequence of the increased edge stiffness is a reducedgyration radius for diaplced cores [Fig. 4(c)], consistentwith the smaller ∆V at large HIP. The simulated signalamplitude [arbitrarily scaled for comparison to experi-ment in Fig. 4(a)] reproduces the amplitude increase forincreasing low HIP as well as the amplitude decrease athigh HIP. The simulation however predicts a drop offat intermediate HIP (where the oscillating ∆V is a de-formed sinusoid) which was not observed in experiment.Another consequence of the anharmonicity is that thefrequency is HIP-dependent38, as shown experimentallyin Fig. 4(d) and reproduced via ‘ringdown’19 simulationsto within 7%.
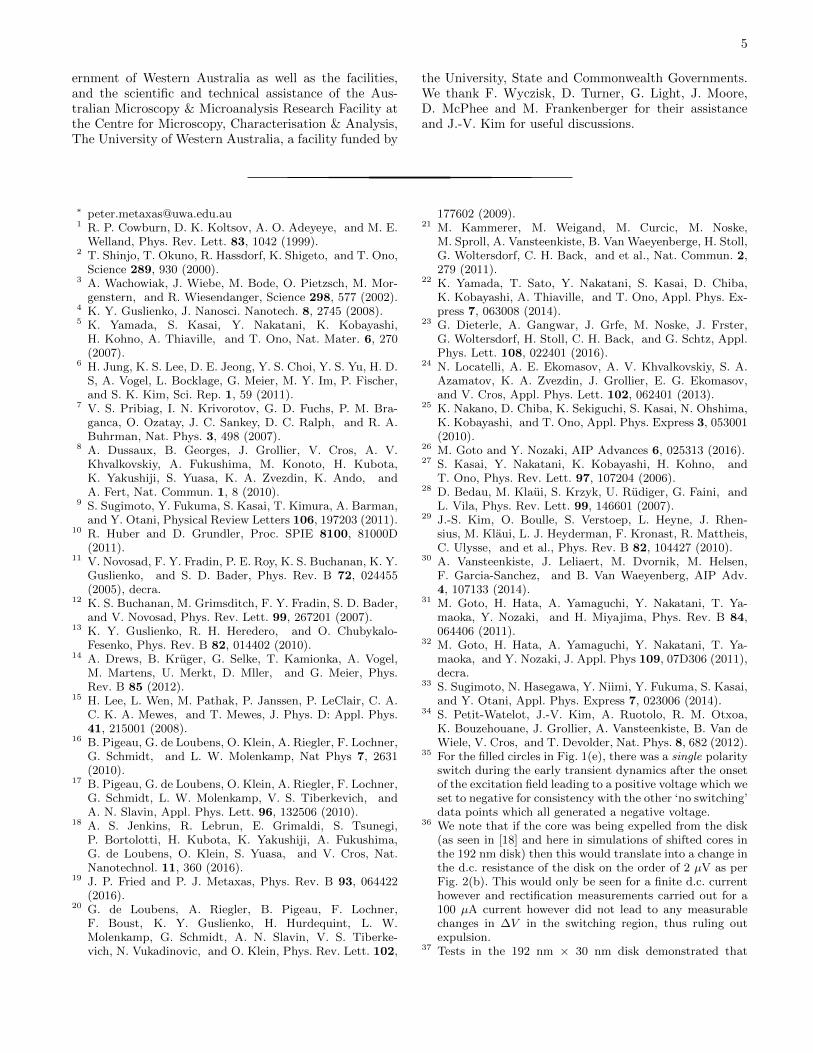
Fig. 5(a) shows experimental rectification traces inwhich the signal loss region is also seen to reduce (andeventually vanish) with increasing HIP. Note that theresonance also shifts rightward, consistent with the an-harmonic confinement. Indeed, for all powers, the rangeof frequencies, ∆f , over which signal loss, and thusswitching, occur reduce with HIP as shown directly inFig. 5(b). Note also that, as is expected from Fig. 1(d)and seen previously23, ∆f can be increased by increas-ing the power since vcrit will be reached for a largerrange of frequencies. The impeded switching at thecore edge (i.e. for increased HIP) is consistent with anincreased confinement which would be expected to im-pede the core from reaching vcrit. To confirm this, coreswitching was simulated in a similarly sized disk (1.4 µm)where a full z−discretization (8 cells) was computation-ally tractable39. Applying a finite HIP shifts the vortex,increasing fG and thus the frequencies at which switch-ing occurs [Fig. 5(c)]. For hrf = 0.6 mT, the increasedHIP however also reduces the range of frequencies over
FIG. 5. (a) High power rectification curves (-7 dBm) versusfield showing how the signal loss region reduces in size andeventually disappears for increasing HIP. (b) Range of fre-quencies over which signal loss occurs versus HIP for variousr.f. powers. (c,d) This simulation data shows if a core in a 1.4µm disk switched (“1”) or did not switch (“0”) under HIP =0, 20 mT for hrf = 0.6 mT (c) and hrf = 0.5 mT (d).
which switching occurs [Fig. 5(c)] with no switching ob-served for the shifted core under hrf = 0.5 mT [Fig. 5(d)].The absence of switching is indeed accompanied by a re-duction in the average velocity during the non-circularorbit of the shifted vortex: v ≈ 285 m/s (within 14% ofvcrit) for the centered, switching core and v ≈ 264 m/sfor the shifted, non-switching core. Note that in sim-ulations of the 1.4 µm disk, core polarity switching fornon-displaced vortices was observed first at a hrf of 0.5mT. This is encouragingly of the same order of magni-tude as the field estimated to act at the bottom of theNiFe layer in the disk centre (∼ 0.27 mT) during the low-est power (-12 dBm) switching observed experimentallyin a 1.4 µm disk (assuming uniform current flow).
In conclusion, we have presented an all-electrical mea-surement of core polarity switching via magnetoresistiverectification in magnetic disks. Turbulent core switchingtogether with a core polarity dependent signal leads toloss of the rectified voltage upon switching. We demon-strate that core switching is impeded when the core ap-proaches the disk edge, consistent with an increased con-finement which impedes the core from resonantly reach-ing its critical velocity.
This research was supported by the Australian Re-search Council’s Discovery Early Career ResearcherAward scheme (DE120100155), a research grant from theUnited States Air Force (Asian Office of Aerospace Re-search and Development, AOARD) and the Universityof Western Australia’s Early Career Researcher Fellow-ship Support scheme. The authors acknowledge resourcesprovided by the Pawsey Supercomputing Centre withfunding from the Australian Government and the Gov-
5
ernment of Western Australia as well as the facilities,and the scientific and technical assistance of the Aus-tralian Microscopy & Microanalysis Research Facility atthe Centre for Microscopy, Characterisation & Analysis,The University of Western Australia, a facility funded by
the University, State and Commonwealth Governments.We thank F. Wyczisk, D. Turner, G. Light, J. Moore,D. McPhee and M. Frankenberger for their assistanceand J.-V. Kim for useful discussions.
∗ [email protected] R. P. Cowburn, D. K. Koltsov, A. O. Adeyeye, and M. E.
Welland, Phys. Rev. Lett. 83, 1042 (1999).2 T. Shinjo, T. Okuno, R. Hassdorf, K. Shigeto, and T. Ono,
Science 289, 930 (2000).3 A. Wachowiak, J. Wiebe, M. Bode, O. Pietzsch, M. Mor-
genstern, and R. Wiesendanger, Science 298, 577 (2002).4 K. Y. Guslienko, J. Nanosci. Nanotech. 8, 2745 (2008).5 K. Yamada, S. Kasai, Y. Nakatani, K. Kobayashi,
H. Kohno, A. Thiaville, and T. Ono, Nat. Mater. 6, 270(2007).
6 H. Jung, K. S. Lee, D. E. Jeong, Y. S. Choi, Y. S. Yu, H. D.S, A. Vogel, L. Bocklage, G. Meier, M. Y. Im, P. Fischer,and S. K. Kim, Sci. Rep. 1, 59 (2011).
7 V. S. Pribiag, I. N. Krivorotov, G. D. Fuchs, P. M. Bra-ganca, O. Ozatay, J. C. Sankey, D. C. Ralph, and R. A.Buhrman, Nat. Phys. 3, 498 (2007).
8 A. Dussaux, B. Georges, J. Grollier, V. Cros, A. V.Khvalkovskiy, A. Fukushima, M. Konoto, H. Kubota,K. Yakushiji, S. Yuasa, K. A. Zvezdin, K. Ando, andA. Fert, Nat. Commun. 1, 8 (2010).
9 S. Sugimoto, Y. Fukuma, S. Kasai, T. Kimura, A. Barman,and Y. Otani, Physical Review Letters 106, 197203 (2011).
10 R. Huber and D. Grundler, Proc. SPIE 8100, 81000D(2011).
11 V. Novosad, F. Y. Fradin, P. E. Roy, K. S. Buchanan, K. Y.Guslienko, and S. D. Bader, Phys. Rev. B 72, 024455(2005), decra.
12 K. S. Buchanan, M. Grimsditch, F. Y. Fradin, S. D. Bader,and V. Novosad, Phys. Rev. Lett. 99, 267201 (2007).
13 K. Y. Guslienko, R. H. Heredero, and O. Chubykalo-Fesenko, Phys. Rev. B 82, 014402 (2010).
14 A. Drews, B. Kruger, G. Selke, T. Kamionka, A. Vogel,M. Martens, U. Merkt, D. Mller, and G. Meier, Phys.Rev. B 85 (2012).
15 H. Lee, L. Wen, M. Pathak, P. Janssen, P. LeClair, C. A.C. K. A. Mewes, and T. Mewes, J. Phys. D: Appl. Phys.41, 215001 (2008).
16 B. Pigeau, G. de Loubens, O. Klein, A. Riegler, F. Lochner,G. Schmidt, and L. W. Molenkamp, Nat Phys 7, 2631(2010).
17 B. Pigeau, G. de Loubens, O. Klein, A. Riegler, F. Lochner,G. Schmidt, L. W. Molenkamp, V. S. Tiberkevich, andA. N. Slavin, Appl. Phys. Lett. 96, 132506 (2010).
18 A. S. Jenkins, R. Lebrun, E. Grimaldi, S. Tsunegi,P. Bortolotti, H. Kubota, K. Yakushiji, A. Fukushima,G. de Loubens, O. Klein, S. Yuasa, and V. Cros, Nat.Nanotechnol. 11, 360 (2016).
19 J. P. Fried and P. J. Metaxas, Phys. Rev. B 93, 064422(2016).
20 G. de Loubens, A. Riegler, B. Pigeau, F. Lochner,F. Boust, K. Y. Guslienko, H. Hurdequint, L. W.Molenkamp, G. Schmidt, A. N. Slavin, V. S. Tiberke-vich, N. Vukadinovic, and O. Klein, Phys. Rev. Lett. 102,
177602 (2009).21 M. Kammerer, M. Weigand, M. Curcic, M. Noske,
M. Sproll, A. Vansteenkiste, B. Van Waeyenberge, H. Stoll,G. Woltersdorf, C. H. Back, and et al., Nat. Commun. 2,279 (2011).
22 K. Yamada, T. Sato, Y. Nakatani, S. Kasai, D. Chiba,K. Kobayashi, A. Thiaville, and T. Ono, Appl. Phys. Ex-press 7, 063008 (2014).
23 G. Dieterle, A. Gangwar, J. Grfe, M. Noske, J. Frster,G. Woltersdorf, H. Stoll, C. H. Back, and G. Schtz, Appl.Phys. Lett. 108, 022401 (2016).
24 N. Locatelli, A. E. Ekomasov, A. V. Khvalkovskiy, S. A.Azamatov, K. A. Zvezdin, J. Grollier, E. G. Ekomasov,and V. Cros, Appl. Phys. Lett. 102, 062401 (2013).
25 K. Nakano, D. Chiba, K. Sekiguchi, S. Kasai, N. Ohshima,K. Kobayashi, and T. Ono, Appl. Phys. Express 3, 053001(2010).
26 M. Goto and Y. Nozaki, AIP Advances 6, 025313 (2016).27 S. Kasai, Y. Nakatani, K. Kobayashi, H. Kohno, and
T. Ono, Phys. Rev. Lett. 97, 107204 (2006).28 D. Bedau, M. Klaui, S. Krzyk, U. Rudiger, G. Faini, and
L. Vila, Phys. Rev. Lett. 99, 146601 (2007).29 J.-S. Kim, O. Boulle, S. Verstoep, L. Heyne, J. Rhen-
sius, M. Klaui, L. J. Heyderman, F. Kronast, R. Mattheis,C. Ulysse, and et al., Phys. Rev. B 82, 104427 (2010).
30 A. Vansteenkiste, J. Leliaert, M. Dvornik, M. Helsen,F. Garcia-Sanchez, and B. Van Waeyenberg, AIP Adv.4, 107133 (2014).
31 M. Goto, H. Hata, A. Yamaguchi, Y. Nakatani, T. Ya-maoka, Y. Nozaki, and H. Miyajima, Phys. Rev. B 84,064406 (2011).
32 M. Goto, H. Hata, A. Yamaguchi, Y. Nakatani, T. Ya-maoka, and Y. Nozaki, J. Appl. Phys 109, 07D306 (2011),decra.
33 S. Sugimoto, N. Hasegawa, Y. Niimi, Y. Fukuma, S. Kasai,and Y. Otani, Appl. Phys. Express 7, 023006 (2014).
34 S. Petit-Watelot, J.-V. Kim, A. Ruotolo, R. M. Otxoa,K. Bouzehouane, J. Grollier, A. Vansteenkiste, B. Van deWiele, V. Cros, and T. Devolder, Nat. Phys. 8, 682 (2012).
35 For the filled circles in Fig. 1(e), there was a single polarityswitch during the early transient dynamics after the onsetof the excitation field leading to a positive voltage which weset to negative for consistency with the other ‘no switching’data points which all generated a negative voltage.
36 We note that if the core was being expelled from the disk(as seen in [18] and here in simulations of shifted cores inthe 192 nm disk) then this would translate into a change inthe d.c. resistance of the disk on the order of 2 µV as perFig. 2(b). This would only be seen for a finite d.c. currenthowever and rectification measurements carried out for a100 µA current however did not lead to any measurablechanges in ∆V in the switching region, thus ruling outexpulsion.
37 Tests in the 192 nm × 30 nm disk demonstrated that

6
while switching was observed when using 8 cells in thez−direction, it was no longer seen under the same con-ditions for a single cell. Thus we look only at low powerexcitation (hrf = 0.2 mT) for the 2 µm disk.
38 O. V. Sukhostavets, B. Pigeau, S. Sangiao, G. de Loubens,V. V. Naletov, O. Klein, K. Mitsuzuka, S. Andrieu,F. Montaigne, and K. Y. Guslienko, Phys. Rev. Lett. 111,247601 (2013).
39 Due to a reduced number of lateral cells (512 × 512)..


![arXiv:1905.09967v1 [physics.app-ph] 23 May 2019 · 1Thales Research and Technology, 1, Avenue Augustin Fresnel, 91767 Palaiseau, France 2IEMN, University of Lille, CNRS UMR8520, Avenue](https://img.dokumen.tips/doc/110x75/5fd50db1317c52792d6c01ca/arxiv190509967v1-23-may-2019-1thales-research-and-technology-1-avenue-augustin.jpg)


![arXiv:1403.1687v1 [cs.CV] 7 Mar 2014L. Sifre CMAP Ecole Polytechnique Route de Saclay, 91128 Palaiseau France E-mail: laurent.sifre@gmail.com S. Mallat Departement d’informatique´](https://img.dokumen.tips/doc/110x75/60c6f335837eff278730628b/arxiv14031687v1-cscv-7-mar-2014-l-sifre-cmap-ecole-polytechnique-route-de.jpg)