Embed Size (px)
Citation preview
- : m
United StatesDepartment nfAgriculture
Forest S~yvlce
New Orleans,Louislana
Research Paperso-21 9Novembt:r, 1985
SUMMARY
A prediction system is presented whereby stand and stock tables are calcu-lated for young natural longleaf pine stands of varying initial density. Tablescan be output for stand conditions of 10 to 20 years of age, 300 to 1,500 initialtrees per acre (at age lo), and 70 to 80 feet in site index (index age 50). Thesystem also allows one to translate from density expressed as trees per acre atan age between 10 and 20 years to basal area at age 20 and thereby gain entryto another stand volume prediction and projection system for thinned natural
- longleaf pine that is operable for stand ages of 20 years and older.

Predicting Stand and Stock Tables from a Spacing Study inNaturally Regenerated Longleaf Pine
Robert M. Farrar, Jr.
INTRODUCTION
Stand volume and volume growth prediction sys-tems for natural, even-aged stands of southern pinesusually use basal area as the stand density variable,and predictions usually are not feasible before about20 years of age. Basal area is a very practical densitymeasure for stands about this age or older but notvery informative or useful if stands are younger, espe-cially if many of the trees are less than 4-l/2 feet tall.Since intensive management calls for volume andgrowth information at these younger ages, methodsare needed to translate from one density measure atan early age (such as trees per acre) to basal area ata later age. The following paper outlines a systemdeveloped to do this for young stands of natural long-leaf pine (Pinus palustris Mill.) by predicting standand stock tables.
METHODS
Study Area
The data were gathered from a natural stand spac-ing study initiated in the winter of 1967-68 on theEscambia Experimental Forest in south Alabama.The study area was a 40-acre stand of dense, even-aged young longleaf pines, resulting principally fromseed-tree regeneration in 1957 and 1958. Seed-treeswere removed in 1961. In 1963, stand density rangedfrom about 3,000 to 8,000 trees per acre and averagedabout 6,000. In 1967, when the study was installed,the stand was 9 to 10 years old from seed. Tree sizesthen ranged from grass-stage seedlings to trees about3 inches in d.b.h. and 20 feet tall. Dominant andcodominant trees averaged 6 to 10 feet in height. Thesoil of the area is Alaga loamy sand, which is commonon ridges and upper slopes in the rolling middle GulfCoastal Plain. At about age 20, the site index (Farrar1973) estimated on study plots ranged from 71 to 86feet at 50 years and averaged 79 feet.
Treatments
Five tree-frequency densities were replicated threetimes on l/&acre permanent plots with l/a-chain iso-lation strips in a completely randomized design.Residual densities of exactly 300,600,900,1,200, and1,500 trees per acre were initially established by man-ually cutting the trees that appeared poorest in vigor.No record was kept of the numbers of trees removed.All hardwoods with d.b.h. 2 1 inch were killed duringthe summer of 1968, and the study area was prescrip-tion burned in the winters of 1973-74, 1975-76, and1977-78. No subsequent thinnings have been made.
Inventory
All trees on the l&acre net plot were positively andpermanently identified. Their d.b.h. was measured tothe nearest one-tenth inch on all trees taller thanbreast height, and a systematic sample was made oftotal heights and heights to the live crown base bymeasuring these heights on every sixth tree in eachl-inch d.b.h. class (including the zero class) to thenearest foot. At least 2 trees were measured per d.b.h.class, if available, and at least 10 were measured perplot. Inventories were repeated at 2-year intervalsand occurred in the dormant season. In the winter of1973-74, at about stand age 15 years, all dominantand codominant sample trees were bored at 4 feet todetermine age (age = ring count + 7 years). At leastfive trees were aged per plot. The mean age deter-mined in this fashion agreed closely with the histori-cal records of reproduction on the area. The last in-ventory reported on herein was made in the winter of1977-78.
Analysis
Rather than analyze the stand characteristics andvolume production data to simply detect any signifi-cant discrete differences among treatments, it wasdecided to employ techniques used to generate pre-
Farrar is a Principal Mensurationist at Forestry Sciences Laboratory, Monticello, AR, Southern Forest Experiment Station, Forest Service-USDA, in cooperation with the Department of Forestry and the Arkansas Agricultural Experiment Station, University of Arkansas atMonticello.
1
dieted stand and stock tables for unthinned pine plan-tations in relation to stand age, site index, and den-sity. This would allow predictions for a range of standconditions (bounded by the limits of the data) ratherthan simple treatment means. This approach necessi-tated the development of the following six groups ofprediction system components by site index and age atthe stand level and/or at the d.b.h. class level.
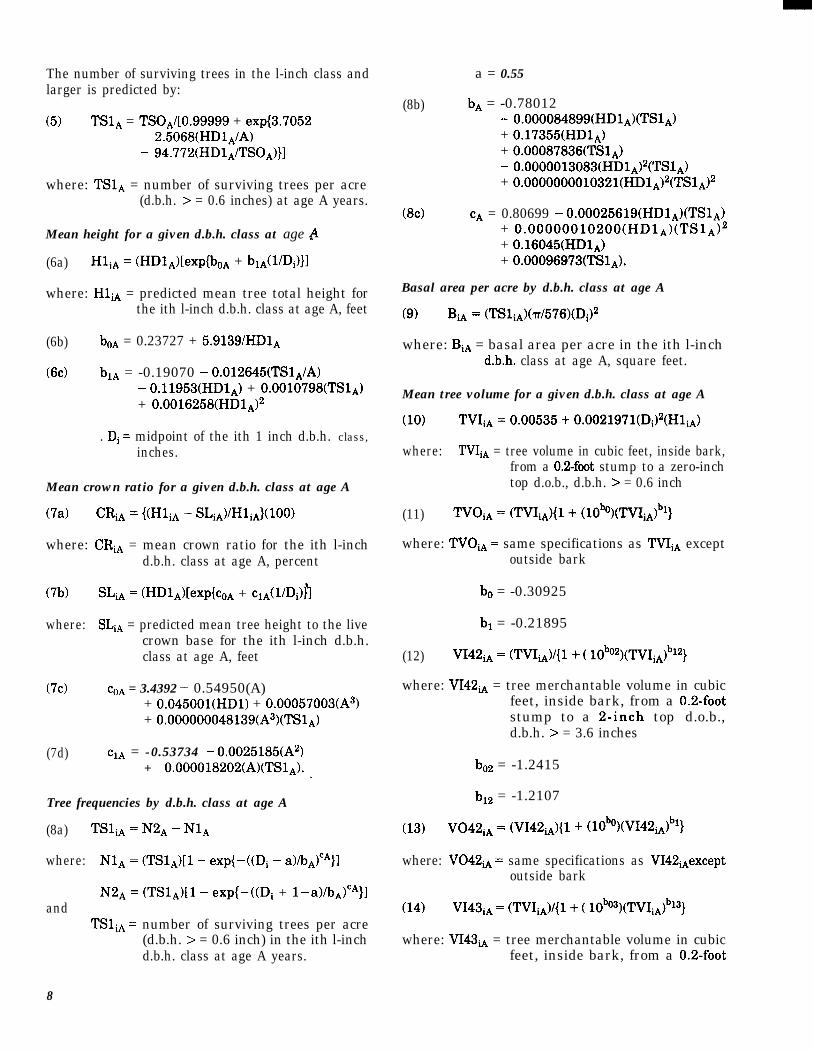
1. A stand-leuel predictor (eq. 3a) 1 for mean domi-nant height (dominant and codominant trees) thatuses a published site-index function to widen its util-ity. The published site-index function chosen (Farrar1973) was the one for natural longleaf from USDAMiscellaneous Publication 50 (U.S. Forest Service19761, hereafter called MP50, because the trends ofdominant height observed in the study followed thisMP50 function better than other available site-indexfunctions. A given MP50 site-index value at index age50 for a stand is translated to MP50 site index atindex age 20 (eq. 1). This latter value is used with thedominant height function (eq. 3d) developed fromstudy data to extend the dominant height estimatesfrom age 20 down to age 10 (eq. 3a). The MP50 func-tion could not be used alone because it does not allowpredictions below about age 15, and the study func-tion could not be used alone because its limited database does not allow it to be a generally suitable site-index function.
2. A stand-level function that predicts the survivalof all trees (eq. 4) and one that predicts the number ofsurviving trees 1 inch d.b.h. and larger from age 10into the future by 1 -year increments up to age 20 (eq.5). For other species, a predictor for trees 1 inch d.b.h.and larger would be the only one needed. But, sincelongleaf has a grass-stage and trees can remain inthis stage for many years, the first predictor is alsonecessary here. These functions are similar to a modelpresented by Hamilton (1974).
3. A mean total height predictor for each 1 -inchd.b.h. class (eq. 6a). This function essentially predictsa proportion for each d.b.h. class that modifies standmean dominant height. This function is similar to themodel presented by Clutter and Belcher (1978).
4. A mean crown ratio predictor for each 1 -inchd. b. h. class (eq. 7a). The underlying model is identicalin form to the one in eq. 6a, but employs stem length(or height to the live crown base) as the dependentvariable.
5. A function that predicts the number of trees ineach 1 -inch d.b.h. class (eq. 8a). This predictor utilizesthe Weibull cumlative density function and estimatesof the “b” and “I?’ parameters that are predicted by thestand variables age, dominant height, and trees peracre (eq. 8b, 8~). The “a” parameter was fixed at 0.55
‘Numbers and letters refer to equations presented in Appendix A.
because it is possible for any natural longleaf standaged 10 through 20 years to have a tree in the firstl-inch d.b.h. class. The “b” and “c” parameter predic-tors were developed using the fitted values of “b” and“c” from a maximum-likelihood program developedfor this purpose at the Southern Forest ExperimentStation (Bailey 1974).
6. A set of tree volume-defining functions (Farrar1981) for natural longleaf pines (eq. 10-15).
All functions were fitted using ordinary leastsquares multiple linear regression.
RESULTS AND DISCUSSION
All of the above groups and component parts arepresented in Appendix A, along with certain relativestatistics for each critical component in Appendix B.
Also, the components have been inserted into aBASIC computer program (Appendix C) that allowsgeneration of stand and stock tables for stands havingthe specifications and limits shown in table 1.
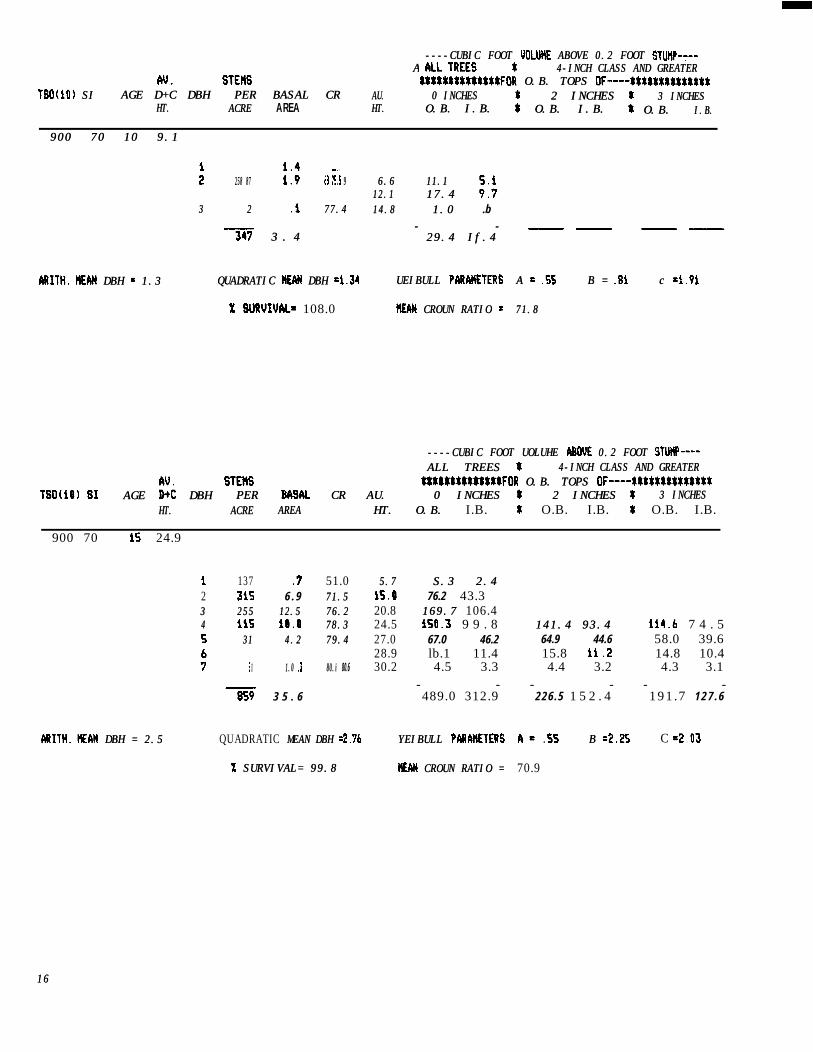
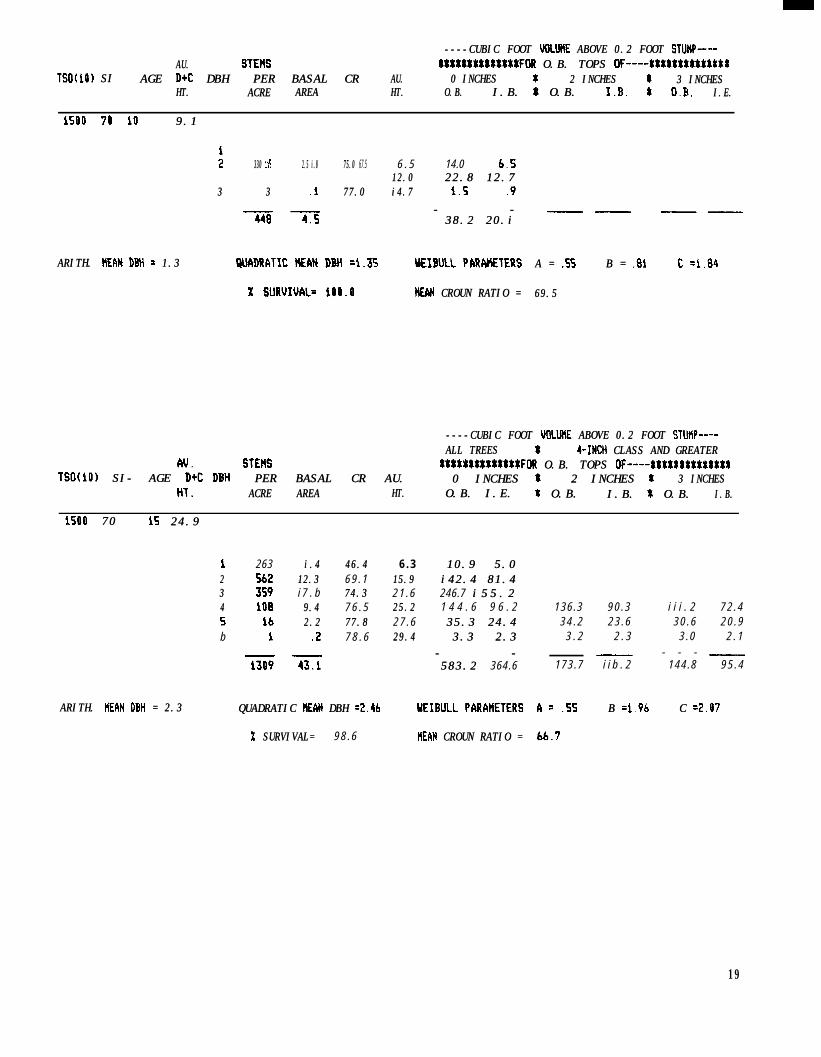
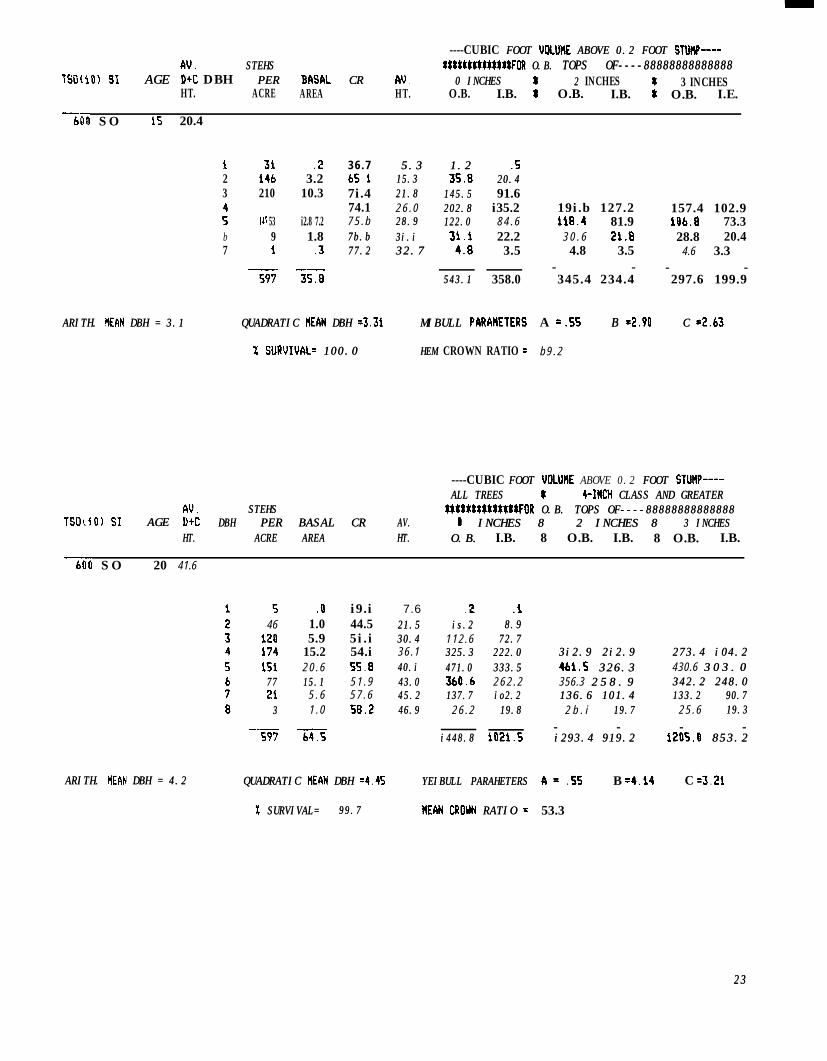
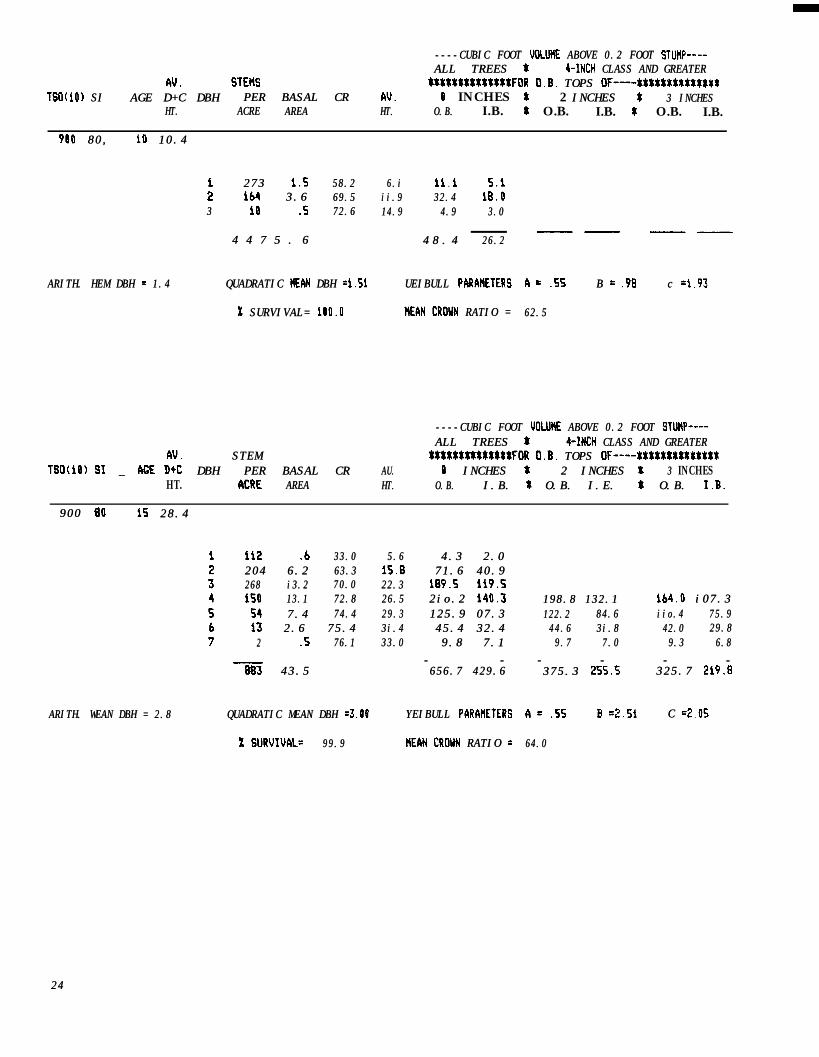
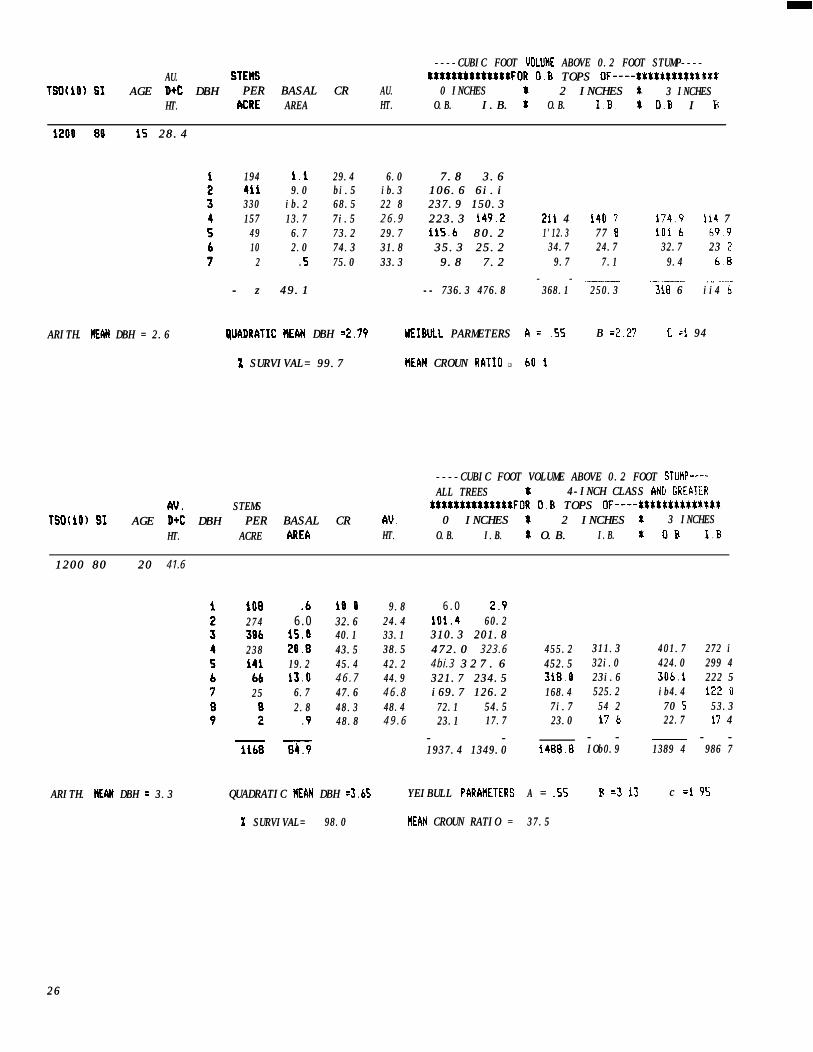
Appendix D shows example output from this pro-gram, stand and stock tables for ages 10, 15, 20; siteindex 70 and 80; and 300,600,900, 1,200, and 1,500initial trees per acre (all trees, at age 10). By modify-ing a few program lines, the program can predict ta-bles for other combinations of stand initial and finalage, site index, and initial density within the abovelimits on minimum and maximum values given intable 1.
Several trends are evident upon inspection of theseAppendices. Survival of all trees (TSO) is inverselyrelated to initial density and is very good for the lo-year period studied. The poorest survival was 88 per-cent at age 20 for 1,500 initial trees per acre at age 10and site index 70. Similarly, the poorest survival onsite index 80 was 95 percent for otherwise similarconditions. These trends probably hold through age20, but beyond that one would expect survival to be-come relatively poorer for site index 80 as competitionbecomes more intense on these better sites (Dell andothers, 1979).
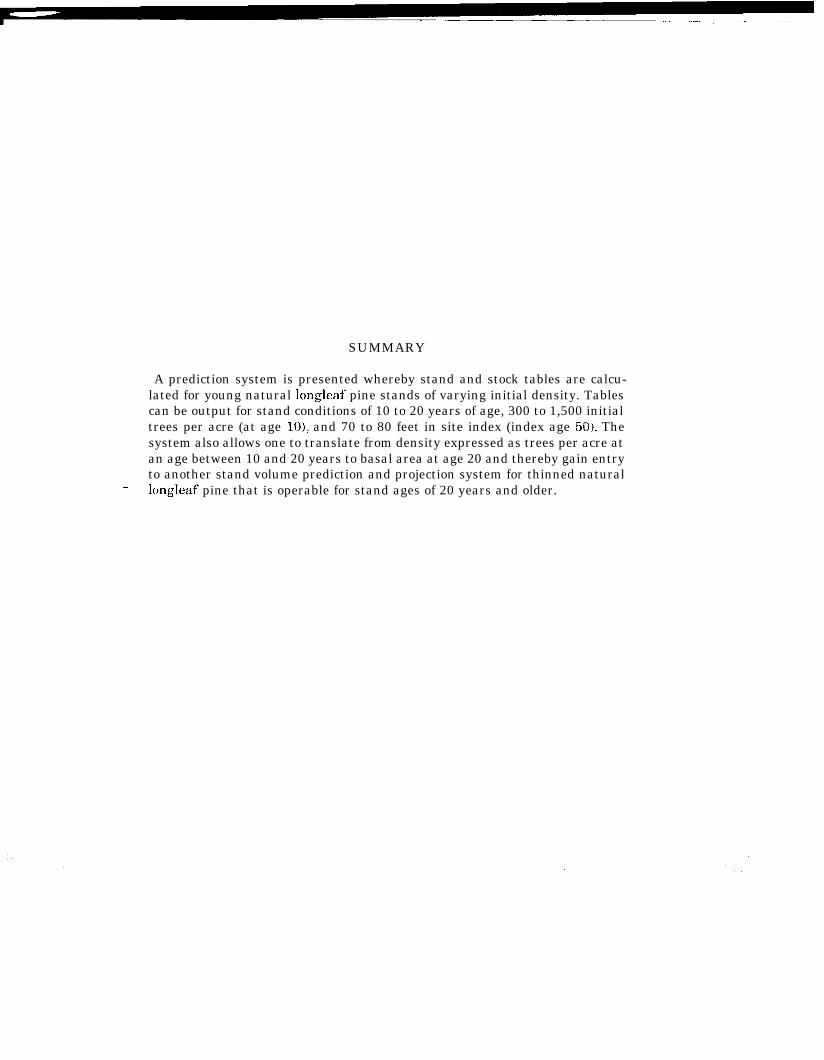
The modal d.b.h. class advances with age and theadvance is most rapid for the lowest initial stand den-
Table l.-Specifications and limits of stand and stock tables
Stand Minimum Maximumvariable value value
Age (years)Site index (feet)
(MP50, indexage = 50)
Initial number oftrees per acreat 10age
10 20
66 85
300 1,500
2
sity. This effect is shown in figure 1 for initial densi-ties of 300 and 1,500 trees on site index 70. Increasingsite index accelerates the advance.
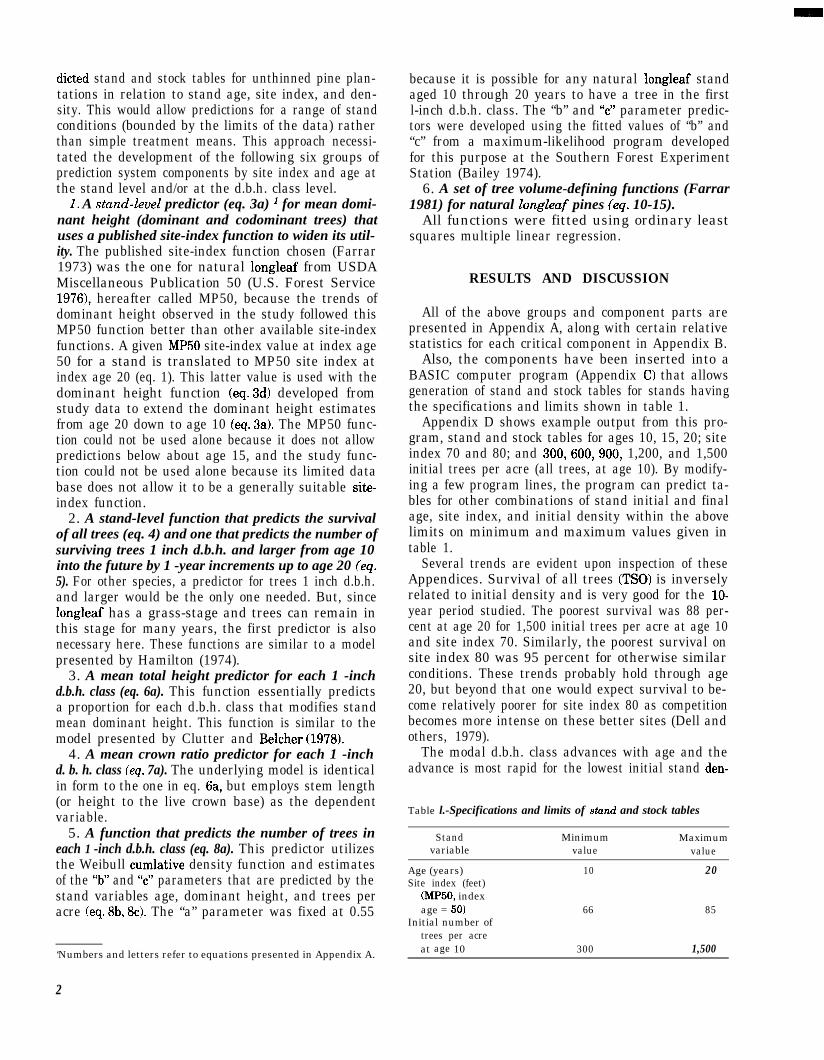
The number of trees per acre 1 inch d.b.h. andlarger (TSl) is directly related to initbl density, in-creases with age, and approaches and asymptote ordeclines slightly due to mortality in the higher densi-ties (fig. 2). Increasing site index tends to increase thenumber of such trees at any age for any initial den-sity.
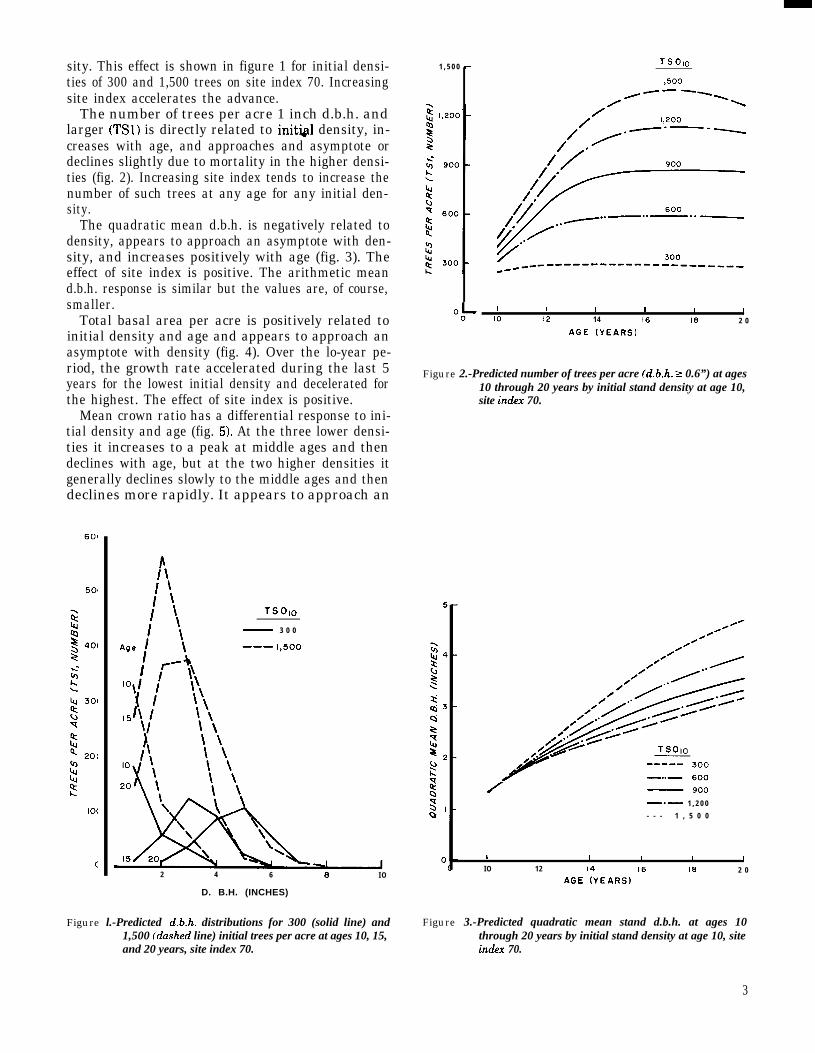
The quadratic mean d.b.h. is negatively related todensity, appears to approach an asymptote with den-sity, and increases positively with age (fig. 3). Theeffect of site index is positive. The arithmetic meand.b.h. response is similar but the values are, of course,smaller.
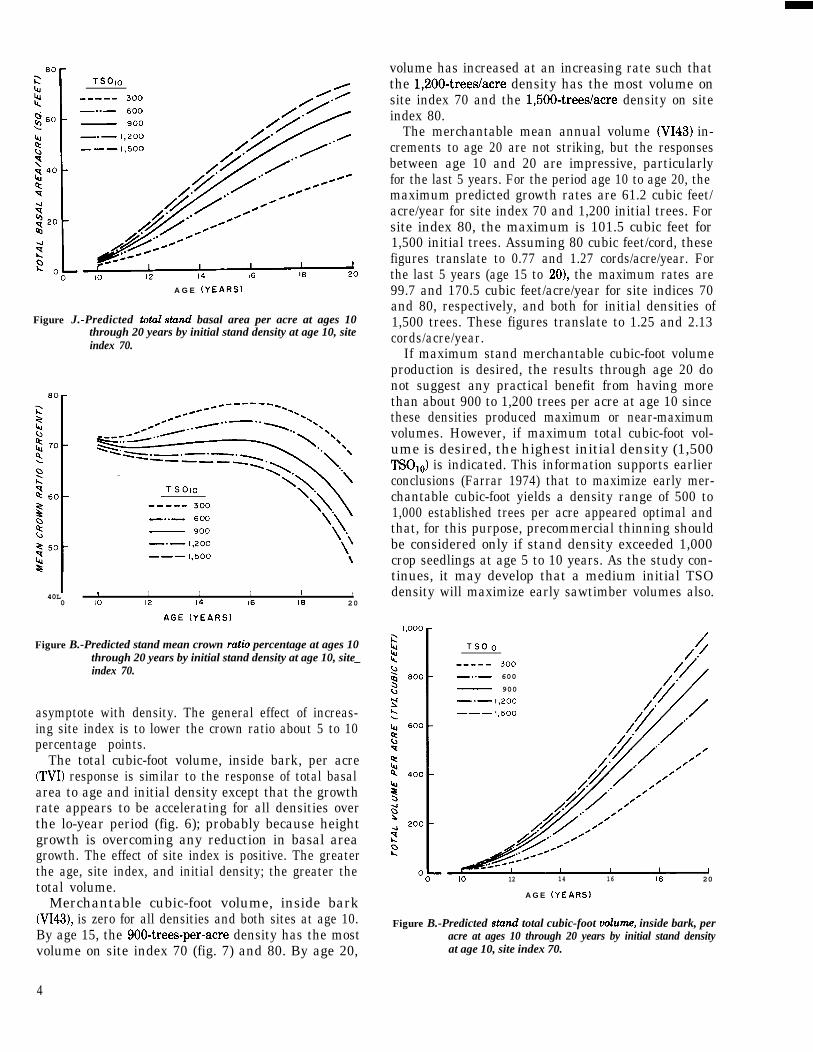
Total basal area per acre is positively related toinitial density and age and appears to approach anasymptote with density (fig. 4). Over the lo-year pe-riod, the growth rate accelerated during the last 5years for the lowest initial density and decelerated forthe highest. The effect of site index is positive.
Mean crown ratio has a differential response to ini-tial density and age (fig. 5). At the three lower densi-ties it increases to a peak at middle ages and thendeclines with age, but at the two higher densities itgenerally declines slowly to the middle ages and thendeclines more rapidly. It appears to approach an
rSI \
i ’I ’ TSOIO
! \ - 3 0 0
2 4 6 0 I O
D. B.H. (INCHES)
Figure l.-Predicted d.6.h. distributions for 300 (solid line) and Figure 3.-Predicted quadratic mean stand d.b.h. at ages 101,500 (dashed line) initial trees per acre at ages 10, 15, through 20 years by initial stand density at age 10, siteand 20 years, site index 70. ino!ex 70.
1 , 5 0 0 c TSOIO
“oL ’ 1 I I IIO 1
12 14 I6 19 2 0
AGE (YEARS)
Figure 2.-Predicted number of trees per acre (d.6.h. E 0.6”) at ages10 through 20 years by initial stand density at age 10,site index 70.
/ - 900
-*- 1 , 2 0 0
- - - 1 , 5 0 0
I I I I I JIO 12 I4 I6 I8 2 0
AGE (YEARS)
3
TSOIO_---- 300
-..- 600
-.- 1,200
----1,500
A G E (YEARS)
Figure J.-Predicted total stand basal area per acre at ages 10through 20 years by initial stand density at age 10, siteindex 70.
40L ' I I I I I0 IO 12 14 16 16 20
AGE (YEARS)
Figure B.-Predicted stand mean crown ratio percentage at ages 10through 20 years by initial stand density at age 10, site_index 70.
asymptote with density. The general effect of increas-ing site index is to lower the crown ratio about 5 to 10percentage points.
The total cubic-foot volume, inside bark, per acre(TV11 response is similar to the response of total basalarea to age and initial density except that the growthrate appears to be accelerating for all densities overthe lo-year period (fig. 6); probably because heightgrowth is overcoming any reduction in basal areagrowth. The effect of site index is positive. The greaterthe age, site index, and initial density; the greater thetotal volume.
Merchantable cubic-foot volume, inside bark(VI43), is zero for all densities and both sites at age 10.By age 15, the 900-trees-per-acre density has the mostvolume on site index 70 (fig. 7) and 80. By age 20,
volume has increased at an increasing rate such thatthe 1,200-trees/acre density has the most volume onsite index 70 and the 1,500-trees/acre density on siteindex 80.
The merchantable mean annual volume (VI43) in-crements to age 20 are not striking, but the responsesbetween age 10 and 20 are impressive, particularlyfor the last 5 years. For the period age 10 to age 20, themaximum predicted growth rates are 61.2 cubic feet/acre/year for site index 70 and 1,200 initial trees. Forsite index 80, the maximum is 101.5 cubic feet for1,500 initial trees. Assuming 80 cubic feet/cord, thesefigures translate to 0.77 and 1.27 cords/acre/year. Forthe last 5 years (age 15 to 201, the maximum rates are99.7 and 170.5 cubic feet/acre/year for site indices 70and 80, respectively, and both for initial densities of1,500 trees. These figures translate to 1.25 and 2.13cords/acre/year.
If maximum stand merchantable cubic-foot volumeproduction is desired, the results through age 20 donot suggest any practical benefit from having morethan about 900 to 1,200 trees per acre at age 10 sincethese densities produced maximum or near-maximumvolumes. However, if maximum total cubic-foot vol-ume is desired, the highest initial density (1,500TSOio) is indicated. This information supports earlierconclusions (Farrar 1974) that to maximize early mer-chantable cubic-foot yields a density range of 500 to1,000 established trees per acre appeared optimal andthat, for this purpose, precommercial thinning shouldbe considered only if stand density exceeded 1,000crop seedlings at age 5 to 10 years. As the study con-tinues, it may develop that a medium initial TSOdensity will maximize early sawtimber volumes also.
TSOIO____- JO0
-..- 600
- 900
-*-I,200
---,,500
0 IO 12 14 16 16 20
A G E (YEARS)
Figure B.-Predicted stand total cubic-foot volume, inside bark, peracre at ages 10 through 20 years by initial stand densityat age 10, site index 70.
4
,-
>-
,-
)-
I-
,-
II
0A G E ( Y E A R S )
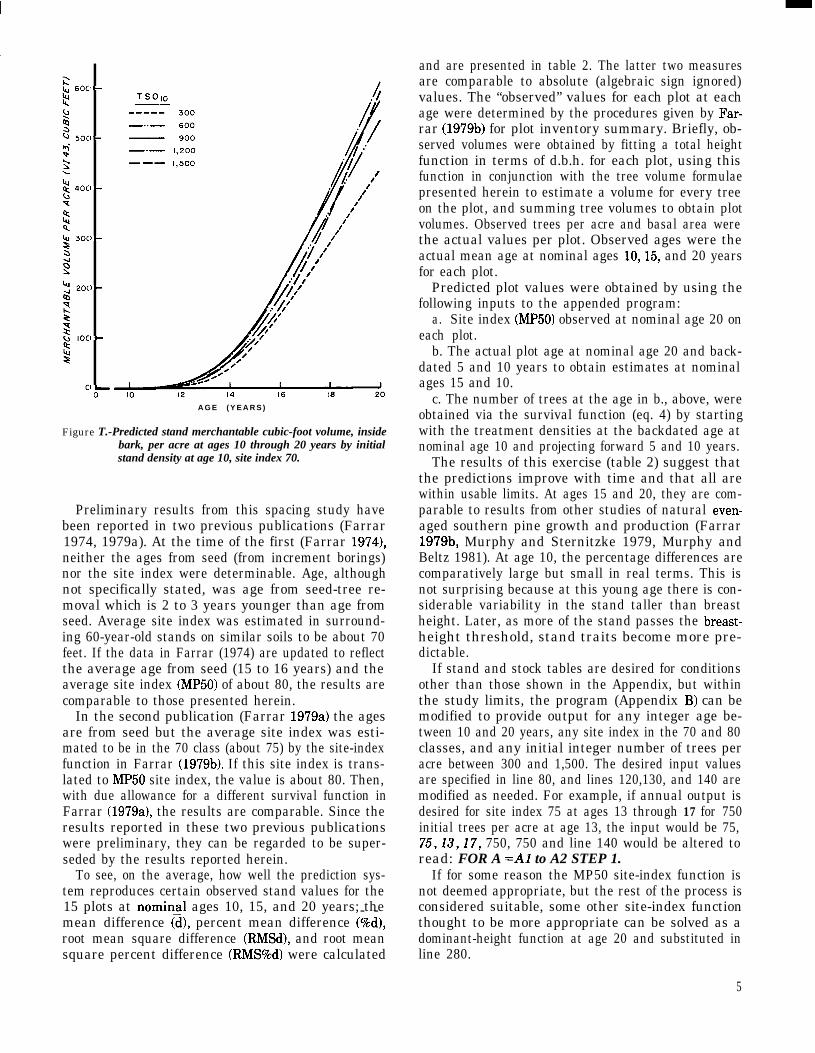
Figure T.-Predicted stand merchantable cubic-foot volume, insidebark, per acre at ages 10 through 20 years by initialstand density at age 10, site index 70.
Preliminary results from this spacing study havebeen reported in two previous publications (Farrar1974, 1979a). At the time of the first (Farrar 1974),neither the ages from seed (from increment borings)nor the site index were determinable. Age, althoughnot specifically stated, was age from seed-tree re-moval which is 2 to 3 years younger than age fromseed. Average site index was estimated in surround-ing 60-year-old stands on similar soils to be about 70feet. If the data in Farrar (1974) are updated to reflectthe average age from seed (15 to 16 years) and theaverage site index (MP50) of about 80, the results arecomparable to those presented herein.
In the second publication (Farrar 1979a) the agesare from seed but the average site index was esti-mated to be in the 70 class (about 75) by the site-indexfunction in Farrar (1979b). If this site index is trans-lated to MP50 site index, the value is about 80. Then,with due allowance for a different survival function inFarrar (1979a), the results are comparable. Since theresults reported in these two previous publicationswere preliminary, they can be regarded to be super-seded by the results reported herein.
To see, on the average, how well the prediction sys-tem reproduces certain observed stand values for the15 plots at nomin.1 ages 10, 15, and 20 years; the- -mean difference (d), percent mean difference (%d),root mean square difference (RMSd), and root meansquare percent difference (RMS%d) were calculated
and are presented in table 2. The latter two measuresare comparable to absolute (algebraic sign ignored)values. The “observed” values for each plot at eachage were determined by the procedures given by Far-rar (197913) for plot inventory summary. Briefly, ob-served volumes were obtained by fitting a total heightfunction in terms of d.b.h. for each plot, using thisfunction in conjunction with the tree volume formulaepresented herein to estimate a volume for every treeon the plot, and summing tree volumes to obtain plotvolumes. Observed trees per acre and basal area werethe actual values per plot. Observed ages were theactual mean age at nominal ages 10,15, and 20 yearsfor each plot.
Predicted plot values were obtained by using thefollowing inputs to the appended program:
a. Site index (MP50) observed at nominal age 20 oneach plot.
b. The actual plot age at nominal age 20 and back-dated 5 and 10 years to obtain estimates at nominalages 15 and 10.
c. The number of trees at the age in b., above, wereobtained via the survival function (eq. 4) by startingwith the treatment densities at the backdated age atnominal age 10 and projecting forward 5 and 10 years.
The results of this exercise (table 2) suggest thatthe predictions improve with time and that all arewithin usable limits. At ages 15 and 20, they are com-parable to results from other studies of natural even-aged southern pine growth and production (Farrar197913, Murphy and Sternitzke 1979, Murphy andBeltz 1981). At age 10, the percentage differences arecomparatively large but small in real terms. This isnot surprising because at this young age there is con-siderable variability in the stand taller than breastheight. Later, as more of the stand passes the breast-height threshold, stand traits become more pre-dictable.
If stand and stock tables are desired for conditionsother than those shown in the Appendix, but withinthe study limits, the program (Appendix B) can bemodified to provide output for any integer age be-tween 10 and 20 years, any site index in the 70 and 80classes, and any initial integer number of trees peracre between 300 and 1,500. The desired input valuesare specified in line 80, and lines 120,130, and 140 aremodified as needed. For example, if annual output isdesired for site index 75 at ages 13 through 17 for 750initial trees per acre at age 13, the input would be 75,75,13,17, 750, 750 and line 140 would be altered toread: FOR A =A1 to A2 STEP 1.
If for some reason the MP50 site-index function isnot deemed appropriate, but the rest of the process isconsidered suitable, some other site-index functionthought to be more appropriate can be solved as adominant-height function at age 20 and substituted inline 280.
5
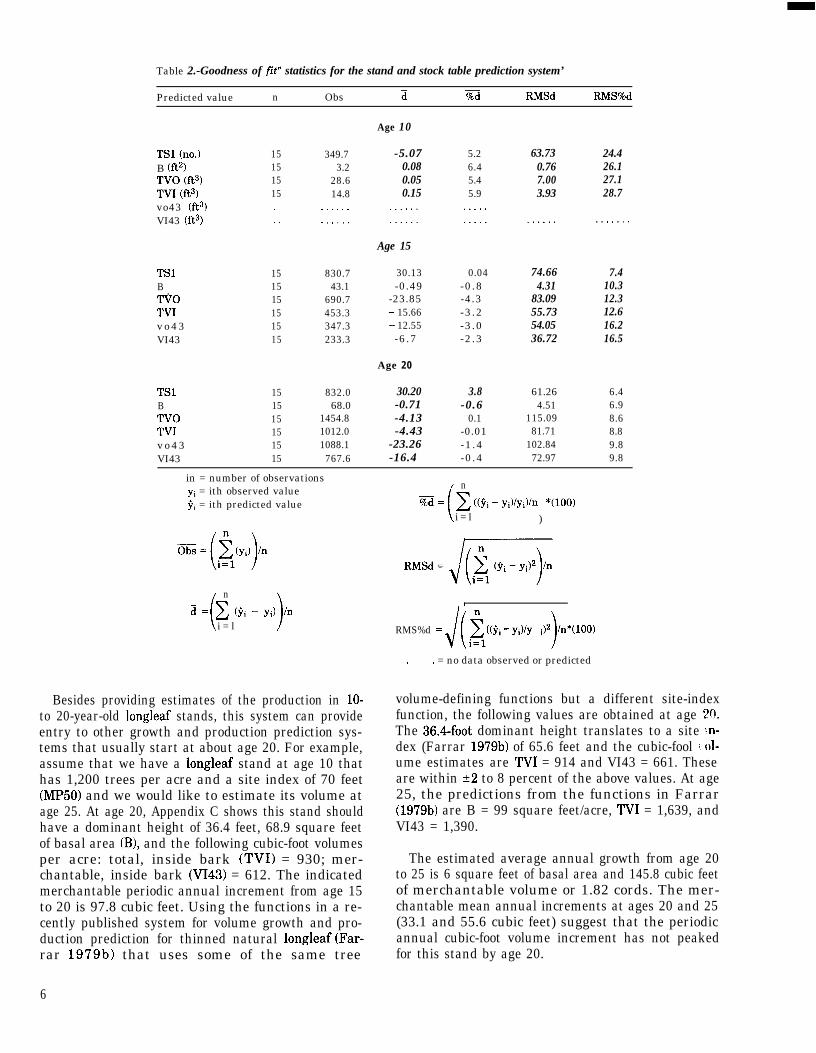
Table 2.-Goodness of fit” statistics for the stand and stock table prediction system’
Predicted value n Obs ;i %d RMSd RMS%d
Age 10
-5.07 5.2 63.73 24.40.08 6.4 0.76 26.10.05 5.4 7.00 27.10.15 5.9 3.93 28.7
TSl (no.)B Wt2)TV0 (ft3)TV1 (ft3)vo43 (fta)VI43 (ft3)
15 349.715 3.215 28.615 14.8. . . . . . .. . . . . . . .
Age 15
TSl 15 830.7 30.13 0.04 74.66 7.4B 15 43.1 -0.49 -0.8 4.31 10.3TV0 15 690.7 -23.85 -4.3 83.09 12.3TV1 15 453.3 - 15.66 -3 .2 55.73 12.6v o 4 3 15 347.3 - 12.55 -3 .0 54.05 16.2VI43 15 233.3 -6 .7 -2 .3 36.72 16.5
Age 20
TSl 15 832.0 30.20 3.8 61.26 6.4B 15 68.0 -0.71 -0.6 4.51 6.9TV0 15 1454.8 -4.13 0.1 115.09 8.6TV1 15 1012.0 -4.43 -0.01 81.71 8.8v o 4 3 15 1088.1 -23.26 -1 .4 102.84 9.8VI43 15 767.6 -16.4 -0 .4 72.97 9.8
i
n
$GI = C ((yi - yiYyiYn *(lOO)i = l )
in = number of observationsyi = ith observed valueyi = ith predicted value
n
;i = C (yi - yi)( 1 /ni = l
I
RMS%d = Jc i$C@i - yrYy iY),n*ClOOJ. . = no data observed or predicted
volume-defining functions but a different site-indexfunction, the following values are obtained at age 20.The 36.4-foot dominant height translates to a site n-dex (Farrar 1979b) of 65.6 feet and the cubic-fool c, ol-ume estimates are TV1 = 914 and VI43 = 661. Theseare within +2 to 8 percent of the above values. At age25, the predictions from the functions in Farrar(197913) are B = 99 square feet/acre, TV1 = 1,639, andVI43 = 1,390.
Besides providing estimates of the production in lo-to 20-year-old longleaf stands, this system can provideentry to other growth and production prediction sys-tems that usually start at about age 20. For example,assume that we have a longleaf stand at age 10 thathas 1,200 trees per acre and a site index of 70 feet(MP50) and we would like to estimate its volume atage 25. At age 20, Appendix C shows this stand shouldhave a dominant height of 36.4 feet, 68.9 square feetof basal area (B), and the following cubic-foot volumesper acre: total, inside bark (TV11 = 930; mer-chantable, inside bark (VI43) = 612. The indicatedmerchantable periodic annual increment from age 15to 20 is 97.8 cubic feet. Using the functions in a re-cently published system for volume growth and pro-duction prediction for thinned natural longleaf (Far-rar 1979b) that uses some of the same tree
The estimated average annual growth from age 20to 25 is 6 square feet of basal area and 145.8 cubic feetof merchantable volume or 1.82 cords. The mer-chantable mean annual increments at ages 20 and 25(33.1 and 55.6 cubic feet) suggest that the periodicannual cubic-foot volume increment has not peakedfor this stand by age 20.
6

LITERATURE CITED
Bailey, R. L. 1974. Computer programs for quantify-ing diameter distributions with the Weibull Func-tion. For Sci. 20: 229.
Clutter, J. L., and D. M. Belcher. 1978. Yield of site-prepared slash pine plantations in the lower coastalplain of Georgia and Florida. In: Proc. of IUFROsymposium on growth models for long term fore-casting of timber yields and forest resources man-agement. Va. Poly. Inst., Blacksburg, Va. p. 53-70.
Dell, T. R., D. P., Feduccia, T. E. Campbell, W. F.Mann, Jr., and B. H. Polmer. 1979. Yields of un-thinned slash pine plantations on cutover sites inthe West Gulf region. U.S. Dep. Agric., For. Serv.Res. Pap. SO-147. South. For. Exp. Stn., New Or-leans, La., 84 p.
Farrar, R. M., Jr. 1973. Southern pine site-indexequations. J.For. 71: 696-697.
Farrar, R. M., Jr. 1974. Growth and yield of younglongleaf pine. In Proc.: Symp. on mangt. of youngpines. (Alexandria, La., Oct.: Charleston, S.C., Dec.1974), p. 276-287. U.S. Dep. Agric., For. Serv.Southeast. Area, State and Priv. For., South. andSoutheast. For. Exp. Stns.
Farrar, R. M., Jr. 1979a. Volume production ofthinned natural longleaf. In Longleaf pine work-
shop (October 17-19, 1978), p. 30-53. Southeast.Area, State and Priv. For., South. For. Exp. Stn.,Ala. For. Comm., Ala. Ext. Serv., Mobile, Ala.
Farrar, R. M., Jr. 197913. Growth and yield predictionsfor thinned stands of even-aged natural longleafpine. U.S. Dep. Agric., For. Serv. Res. Pap. SO-156.South. For. Exp. Stn., New Orleans, La., 78 p.
Farrar, R. M., Jr. 1981. Cubic-foot volume, surfacearea, and merchantable height functions for long-leaf pine trees. U.S. Dep. Agric., For. Serv. Res.Pap. SO-166. South. For. Exp. Stn., New Orleans,La., 7 p. ’
Hamilton, D. A., Jr. 1974. Event probabilities esti-mated by regression. USDA For. Serv. Res. Pap.INT-152, Intermountain Forest and Range Experi-ment Station, 18 p.
Murphy, P. A., and R. C. Beltz. 1981. Growth andyield of shortleaf pine in the West Gulf Region. U.S.Dep. Agric., For. Serv. Res. Pap. SO-169. South.For. Exp. Stn., New Orleans, La., 15 p.
Murphy, P. A., and H. S. Sternitzke. 1979. Growthand yield estimation for loblolly pine in the WestGulf. U.S. Dep. Agric., For. Serv. Res. Pap. SO-154.South. For:’ Exp. Stn., New Orleans, La., 8 p.
U.S. Forest Service. 1976. Volume, yield, and standtables for second-growth southern pines. 1929 (Rev.1976). USDA Misc. Publ. 50. 202 p.
Appendix A-System Predictor Groups and Components
(1) Hz0 = (S&( 1O)~z’zc’-s’5o’)
(2) Szc = (HdexpM20) - fl2O))l = Hz0
(34 HI& = C320)[exp{f(A) - fIZO)}l
where: Hz0 = mean height of dominant stand at age20, predicted from MP50 dominant-height function (Farrar 1973), feet
Sso = site index, index age 50 years, feet(65 < She I 85)
(3b) g(A) = -11.870(1/A) + 1263.79(1/A)3- 12409.5(1/A)4 (Farrar 1973)
S20 = site index, index age 20 years, feet
(3c) f(A) = 51.5672(1/A) - 976.490(1/A)2+ 3836.84(1/A)3 ’
‘From the fitted function:
(3d) ln(HDl* = 3.08908 + 51.5672(1/A) - 976.490(1/A)’+ 3836.84(1/AJ3
A = given age, years
HDIA =predicted mean height of dominantstand at age A, feet (A, here, = 10, 11,- - - 19, or 20).
Total tree frequencies per stand at age A
The number of surviving trees per acre is predictedin an iterative fashion by a modified form of a functionpresented by Hamilton (1974).
(4) TSOA + i = TS0,/[0.99999 + exp{-20.964. + 1.1808(A) - 0.25569(HDl,)
+ O.O031657(TSO,)}]
where: TSOA = number of surviving trees per acre(all) at age A years
TSOA+i = number of surviving trees per acre(all) at age (A + 1) years. Note thatTSOA + 1 becomes TSOA for eachnew iteration of this function. Mini-mum A = 10, maximum (A + 1) = 20,minimum TSOio = 300, maximumTSOio = 1,500.
7
The number of surviving trees in the l-inch class andlarger is predicted by:
(5) TSIA = TSOJ0.99999 + exp(3.7052- 2.5068(HDlA/A)- 94.772(HDlA/TSOA)}l
where: TSIA = number of surviving trees per acre(d.b.h. > = 0.6 inches) at age A years.
Mean height for a given d.b.h. class at age P
(6a) H&A = (HDlA)[exp{boA + blA(l/Di)}l
where: HliA = predicted mean tree total height forthe ith l-inch d.b.h. class at age A, feet
(6b) bOA = 0.23727 + 5.9139/HDlA
(6~) blA = -0.19070 - 0.012645(TSlA/A)- 0.11953(HDlA) + 0.0010798(TSlA)+ 0.0016258(HD1A)2
. Di = midpoint of the ith 1 inch d.b.h. class,inches.
Mean crown ratio for a given d.b.h. class at age A
(7a) CRiA = {(HliA - SLiA)/HliA}(lOO)
where: CRiA = mean crown ratio for the ith l-inch where: TVOiA = same specifications as TVIiA exceptd.b.h. class at age A, percent outside bark
(7b) SLiA = (HDlJ[exp{coA + ciA(l/Di)j1 b. = -0.30925
where: SLiA = predicted mean tree height to the livecrown base for the ith l-inch d.b.h.class at age A, feet
(7c) C‘,A = 3.4392 - 0.54950(A)+ O.O45001(HDl) + 0.00057003(A3)+ 0.000000048139(A3)(TSlA)
(7d) ciA = -0.53734 - 0.0025185(A2)+ 0.000018202(A)(TS1A). ,
Tree frequencies by d.b.h. class at age A
(8a) TSliA = N~A - NlA
where: NlA = (TSlA)[l - exp{-((Di - a)/bA)cA}]
andN~A = (TSl,)[l - exp{-((Di + l-a)/bA)cA}]
TSliA = number of surviving trees per acre(d.b.h. > = 0.6 inch) in the ith l-inchd.b.h. class at age A years.
a = 0.55
(8b) bA = -0.78012- O.O00084899(HDlA)(TSlA)+ 0.17355(HDlA)+ 0.00087836(TSlA)- O.OOOOO~~O~~(HD~A)~(TS~A)+ ~.OOOOOOOO~O~~~(HD~A)~(~~~A)~
(8~) cA = 0.80699 - O.O0025619(HDlA)(TSlA)+ O.OOOOOO~O~OO(HD~,)(TS~A)~+ 0.16045(HDlA)+ O.O0096973(TSl,).
Basal area per acre by d.b.h. class at age A
(9) BiA = (TSliA)(r/576)(Di)2
where: BiA = basal area per acre in the ith l-inchd.b.h. class at age A, square feet.
Mean tree volume for a given d.b.h. class at age A
(10) TVIiA = 0.00535 + 0.0021971(Di)2(HliA)
where: TVIiA = tree volume in cubic feet, inside bark,from a 0.2-foot stump to a zero-inchtop d.o.b., d.b.h. > = 0.6 inch
(11) TVOiA = (TVI,){l + (lObo)(TVIiA)b’}
bi = -0.21895
(12) VI42iA = (TVIiA)/{l + ( 10b02)(TVIiA)b’2}
where: VI42iA = tree merchantable volume in cubicfeet, inside bark, from a 0.2-footstump to a a-inch top d.o.b.,d.b.h. > = 3.6 inches
b,, = -1.2415
bi2 = -1.2107
(13) vo42iA = (vI42iA){l + (10bo)(V142iA)b’)
where: VO42iA = same specifications as VI42iAexceptoutside bark
(14) vI43iA = (TVIiA)/{l + ( 10b03)(TVIiA)b’3}
where: VI43iA = tree merchantable volume in cubicfeet, inside bark, from a 0.2-foot
8

stump to a 3-inch top d.o.b.,d.b.h. > = 3.6 inches
.
b,,a = -0.54930
his = -1.3024
(15) VO43iA = (VI43i,){ 1 + ( 10bo)(V143i~)b’}
where: V043iA = same specifications as VI43iA exceptoutside bark.
Per acre tabular values
n
(16) TSlA = C (TSliA)i= l
n
(17) BA = C (BiA)i= l
n
(13) VolumeA = C {(VolumeiA)(TSliA)} where CRA = arithmetic mean crown rati per-i= l centage.
where Volume* = a total volume and Vol-umeiA = volume per tree in the ith l-inch d.b.h.class, for any volume function
n
(19) DA = { 2 (Di)(TSliA)}flSlAi= l
where DA = arithmetic mean d.b.h.
(20) & = ~B,/{(~/g76)(TSl,)}
where Be = quadratic mean d.b.h.
(21) % Survival = TSOJl?SOio
n
(22) CRA = {C (CRiA)(TSliA)}/TSlAi= l
Appendix B-Coefficient of Determination and Standard Error of Regression forFitted Functions
Equation no. n R2 or r2 svx
(3d)(4)(5)
(6b)(6~)(7c)(7d)(8b)C3c)
90 0.987*0.987* 0.063*150 0.315* 2.653*90 0.735* 2.211*90 0.811 0.09490 0.727 0.21490 0.482 0.28090 0.204 0.39790 0.984 0.14890 0.846 0.327
*In logarithmic form, from regression where y was transformedto In (y).
9
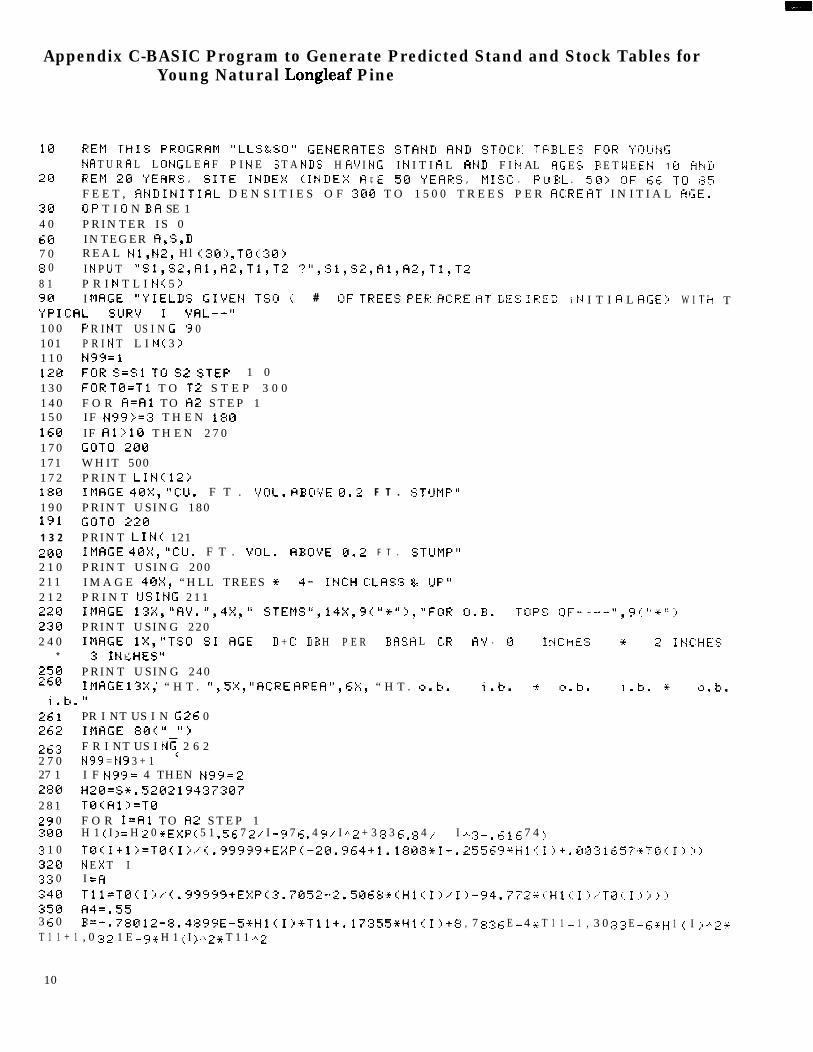
Appendix C-BASIC Program to Generate Predicted Stand and Stock Tables forYoung Natural Longleaf Pine
10 REM THIS PRI~I;RHM “LL:~&!~I:l” C;ENERHTE!s :3TAt.+D Ht.jD :$TOC:i:: TPE:L.ES ,=OF: ‘(ijl_:Ii~;
H H T U R H L L 0 N G L E H F P I N E S T A N Is S H H 6 I N r, I N I T I H L H N II F I N AL H 1; E :S F: E T 1.1 E E N 1 13 1-4 t.4 1120 R EPI 2 0 ‘,r’E H F: :s , s 1 T E 1 t.4 11 E X ( I t.4 11 E )( fi I; E 5 0 ‘,‘E H R !:; , F1 1 :j I: . F 1-1 1: L . 5 0 ;I !TI F 6 6 T III ;+ F:
F E E T , HND INITIHL D E N S I T I E S O F :300 T O 1 5 0 0 T R E E S P E R HC:RE liT I N I T I A L AI;E.
:EE:I i N
30 0 P T I 6 N B H SE 14 0 P R I N T E R I S 060 I N T E G E R H, S, 117 0 R E A L Nl, NZ, Hl (30:) r T0(30>8 0 I N P U T “!~l,S2,Hl,fi~,Tl,T2 ‘?“,Sl,S2,Hl,AZ,Tl,T28 1 P R I N T L I N 1: 5 >90 I MHGE “‘fIEl_IIS I;I$‘Et,j T!:;Ci I: # I:!F TREE!2 PER HC:tTyE RT DE!;;
‘I’ p 1 1: fi L Sl_lR’G 1 yfiL--”
1 0 0 P R I N T US I N G 9 0101 P R I N T L I N C 3 >1 1 0 N’39=1120 FOR :;=Sl TO S2 STEP 1 01 3 0 FOR T0=Tl T O T2 S T E P 3 0 01 4 0 F O R A=Hl T O H2 S T E P 11 5 0 I F N99>=:3 T H E N 180l&0 IF ml:>10 T H E N 2 7 01 7 0 GOTO 200171 WHIT 5001 7 2 P R I N T LINClZ:,180 IMAGE 40:X, “c:lJ. F T . ‘VU!_. I=!BI~‘v’E 8.2 F T . :~Tl_ltlF’”
1 9 0 P R I N T U S I N G 1 8 0191 I;OT[I 226
1 3 2 P R I N T LINC 121200 1Mfi1;E 40X:, “CU. F T . C’rJL. HBI:I’v’E 0. 2 F T . STl_lMP”
2 1 0 P R I N T U S I N G 2 0 02 1 1 I M A G E 40X, “HLL TREES * 4- INCH I:I_H!~!~ & I-IF’”
2 1 2 P R I N T ClSING 2 1 1
I T I P L HGE ‘1 W I
230 P R I N T U S I N G 2 2 02 4 0 IMHGE 1X, “T!?O SI HGE D + 11: D B H P E R Jj fi !; Fl L 1:: F: H !,! . c_I1 1 pi 11 kj E :3
* 3 1 t.4 I- ’ H E S ”a
258 P R I N T U S I N G 2 4 02 60 __ I *IMHLE 1:3~, “ H T . “,5X, “HCRE FIRER”,&::%, “ H T . cl.b. i .tt. + 0 . t1 .i.b.”
261 PR I NT US I N G 26 0262 IMHGE 801::” “>2 g 132 7 0
F R I NT US I NC< 2 6 2N 9 9 = N ‘3 3 + 1
27 1 I F tJ’$‘3 = 4 THEN N’3’3 = 2280 H20=Ssm 5202144373072 8 1 TBCHl>=T02 9 0 F O R I=Hl T O H2 S T E P 1300 H 1 I: I ;I = H 2 0 s E :>( F ,’ 5 1 . 5 6 7 2 / I - ‘3 7 6 I 4 ‘3 .>’ I ./.. 2 + 3 :3 3 6 . 8 4 _.’ I ..‘.. 2: - . 6 1 6 7 4 ;,:3 1 0 T0(I+l>=T0(I~~.~(.‘~399’~+E~~P~-~0.~~~4+1.1:30~~I- . 2 5 5 6 ‘3 + H 1 I:: 1 ::a i , Q 0 :>ZjgQ td E :< T I13 :3 0 I = fi
TH T
::I ;a ::I
3 6 0 B=-. 78012-8.48’3’3E-5*Hl(I>sTll+. 17:355%H1(‘:>+8 , 7 8 3 6 E - 4 * T 1 1 - 1 , 3 0 2: :3 E - 6 * H 1 ( I ,:I .“.. 2 *T 1 1 + 1 , 0 3 2 1 E - ‘3 % H 1 I:: I :, ..‘I. 2 * T 1 1 .e. 2
10

4704714 8 @I4 4 856185 1 r_55205305 4 055615 6 857858E15815 ‘a 25 8 35 8 45865986 @ 86186296306486 5 866W6 7 068868165826 g :36 ‘3 07887107207 3 874G17417 5 87 6 87617707887817988688018 1 8820
C= . 86699-2. 5 6 19E-4+HSl l=B131:3=@Tlll=8TlZl=OTl2:3=0Vlll=B‘$/ 1 2 1 = @i) 1 2 :3 = 13V124=0c: I” p fj = 8
IF Ii=2 THEN Dll=1.5N 1 = T 1 1 + i; 1 - E 1; p ( - r: ( 11 1 1 -H 4 :, I’ B :) .“.. I;: ‘1 >1.1 2 = T 1 1 * ( 1 - E >si p (1 - ( ( 11 1 1 + 1 - H 4 :I ./’ 1: ::I .A I: 111 :J
TllS=NZ-NlIF D=l THEN T112=NlTl ~Z=PRI:II_INII(T~ 12? Ei:r
B@= , 23727+5.9133..~Hl(H>Al=_. 19~7~-. @12645+Tl ~,.AA-. 11953+Hl (H>+. ~01~7’~d:~+Tl l+. 0016258+Hl (.R:‘I/~~H 1 0 = H 1 r: fj :, % E ;.( p I: B bj + B 1 /’ I,l :I1:: 0 = :3 - -.73y2- , 54r35@+I+. 045B@l+HlC I::g+5. 7 0 0 3 E _ 4 + I ..‘.. 3 + 4 . :s 1 :3 -3 E - ;;: + 1 .+. 3 * T 1 11:1=- . 537:34-.@@251857sI^2+1 ,:~~~~E-5’I%Tlls1 =Hl (I >+EXP(I:~+C~~‘II>
Ct-.=(Hl@-Sl >/‘HlQ%lOB
IF t:r,:=5 T H E N C t-’ = 1 8B 8 n = Ij .4 2 + ( 3 . 1 4 1 5 ‘3 2 5 4 ./ 5 7 6 > + T’ 1 1 2
TOO=. 1313535+. Q@21971+D”.2+H10
T812=T88*T112T 0 1 = T Q 0 + ( 1 + 1 @ .+ ( - . 3 0 4 2 5 > + T 0 0 .“. I: - . 2 1 :3 9 5 ::I >TQl3=T@lsTll2Tl2l=T121+T812Tl23=Tl23+T@l:3Sll=Sll+B08D12=11*T112
D13=D13+D12
Ct-pc=CrsTl 12
Crpp=Crpp+CrpcC t-. = P R 0 U N II C C P g - 1 :,Tlll=T111+T112IF D=l THEN 8’36I F T l 12(. 513@@0@9&3b381 THEH 318IF TlC4 THEN 898
Is! 1 4 = T @ 0 ,...’ < 1 + 1 0 .A ( - 1 , 2 4 1 5 ;i +j T 0 0 ..“. ( - 1 . 2 1 0 7 ::I ;Ic’l 12=<)14wTl 12‘v’ll2= p R [I 1-l bl11 ( ‘v’ 1 1 2 , -. 1 iIv’ 1 5 = ‘u’ 1 4 * ( 1 + 1 @ A ,: -- . :3 0 ‘3 2 5 ) +. !,! 1 4 ..A. ,,: - . 2 1 8 ‘3 5 :a ::,$‘l 1:3=‘415+Tl 12ij 1 1 :3 = p R I] 1-l t.111 ( 0 1 1 :3 r - 1 >\I 1 5 = T 0 0 i I:: 1 + 1 8 .“Q ( - . 5 4 4 2; ;I s T 0 0 ‘. ( - 1 . :_I 0 ;2 4 ::I ::I
$‘I 14=$‘16wTl 12
‘v’ 1 1 4 = P R 0 U t.4 II C V 1 1 4 9 - 1 ‘1{,! 1 7 = $1 1 6 + ( 1 + 1 8 ci ( _ . 3 6 ‘3 2 5 1) .j+ ‘,,,’ 1 6 .‘.. r: - . 2 1 :s ‘3 5 ;I :I
c’l 15=‘+17wT1 12
V 1 1 5 = p R III l-1 t.4 11 i ‘8) 1 1 5 r - 1 i‘d 1 1 1 = v 1 1 1 + v 1 1 21,) 1 2 1 = ‘,C 1 2 1 + j/ 1 1 :3
11
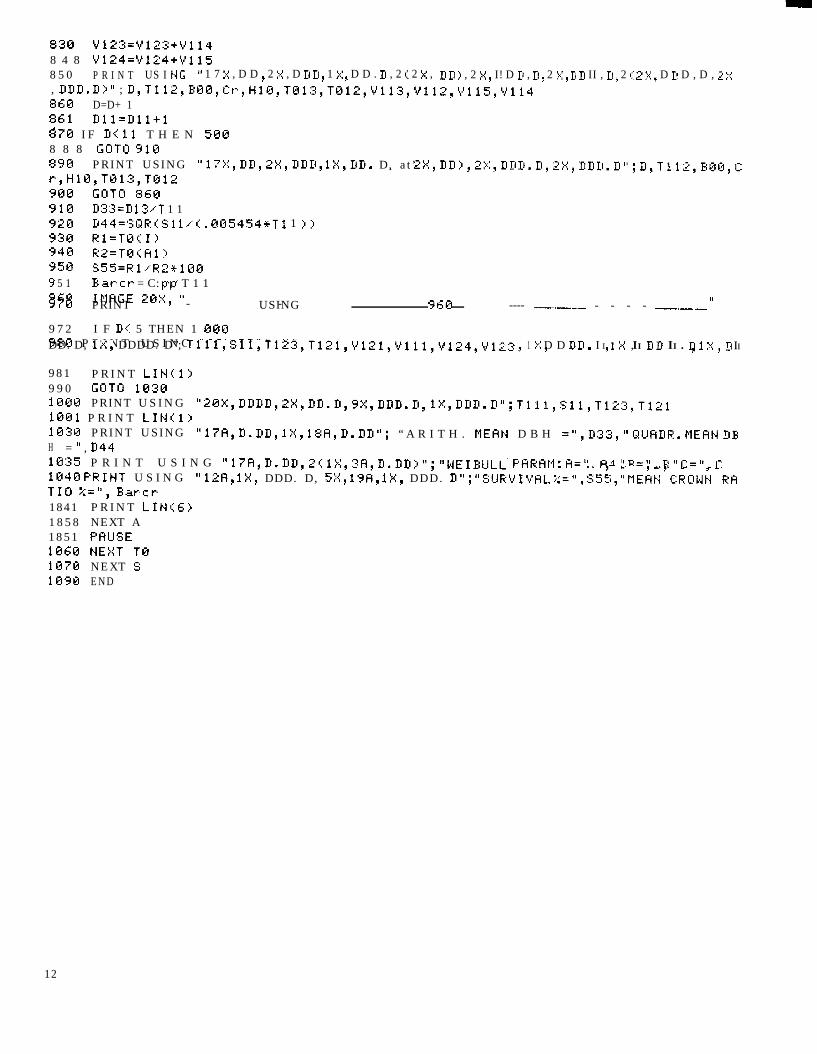
830 V123=Vl2:3+‘l)1148 4 8 V124=V124+V1158 5 0 P R I N T US I N G ” 1 7 ):: , D D ~ 2 x , D II Ii ~ 1 :.; ~ D D . II , 2 ( 2 :< ,, DDD. II> ” ;
II II > , 2 >I I I! D II , II r 2 :,t ~ II II II , II i 2 1:: 2 ::,< r D II D , D , 2 )<D,Tl12,E88,Cr,H14,T~l:~,T~l2,Vll~~Vll2~~~ll5~~~ll4
868 D=D+ 1861 Dl l=Dll+l8761 IF DC11 T H E N 5888 8 8 GOTO 91W898 PRINT USING “17X,DD,2X, DUD, lX,DD. D, at’-r,HlB,T813,T012
. L~,I~D>,~X,I~I~I~.D,~~,DIIII.II’~;D~T~~~,~~~,~
3861 GUT0 8661910 D33=D 13/T 1 1920 I144=!SQR(Sl I/‘(. @05454+Tl 1 >:I938 Rl=TG1( I>948 R2=T@i;Hl>958 S55=Rl/‘R2,lt313‘3 5 1 E ar c r = C: r ./ T 1 1p p96;G1 IMHGE 261X, ‘I 1,- -976t PRINT USING 360 ---- --v-w - - - - _-__
9 7 2 I F II,< 5 THEN 1 61689861 P R I N T U S I N G “261>;, IIIIDDDD. D, , 2 X , D D . D , 9 X , D D D D . D , 1 X .r D D D D . D 1 X D D 1111 . I I I x II 11 D II . II 1 :< 9
981
1X, DDDD. D”; T1li,S11,T12:3,T121,Vl2l,Vlll,Vl24~Vl2:~: ., .r r , ~ r II
PRINT LINCl>9 9 0 GOTO 18361888 PRINT USINGlGtW1 P R I N T LINCl>
“28X,DDDD,2X,DD.D,SX,DDD.D, 1X,DDD.D”;T111,S11,T12~~T121
1936 PRINT USINGH = ” , II44
“lTA,D.DD, 1X, 18H,D.DD”; “ A R I T H . MEHN D B H =“,D35, ‘I QUHDE. k1EHt.j DE
16135 P R I N T U S I N G “17H,D.DD,2~1;~,3H,D.DD>“;“WEIBULi PHRfitl: A=“,H~ “B=“,B “~=“,I-:184Q PRINT U S I N GTIO >;=‘I, Barer
“12A, 1X, DDD. D, 5X, 19H, 1X, DDD. 0”; “SIJRVIVHL :;=I”, $5;, “~,E& CROf&,-RH
1841 PRINT LINI:E;>1858 NEXT A1851 PHUSE18661 NEXT T818761 NEXT S1098 END
12
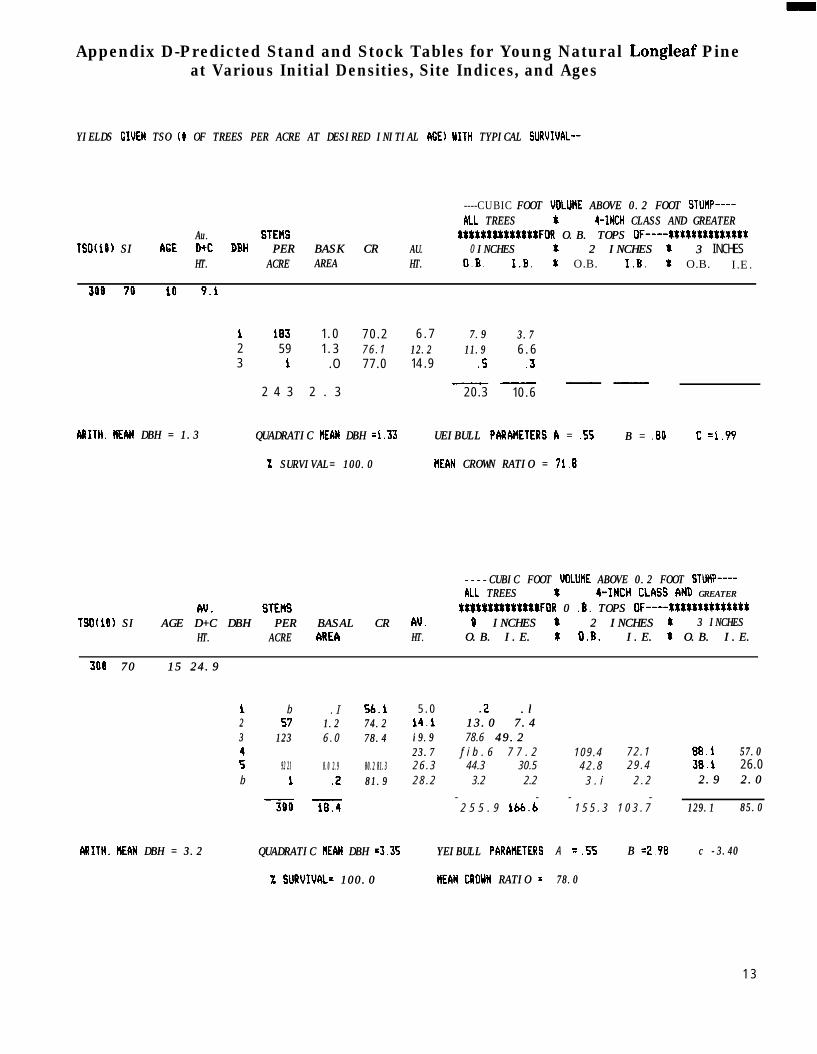
Appendix D-Predicted Stand and Stock Tables for Young Natural Longleaf Pineat Various Initial Densities, Site Indices, and Ages
YIELDS YIELDS GIVENGIVEN TSO TSO (t(t OF TREES PER ACRE AT DESIRED INITIAL OF TREES PER ACRE AT DESIRED INITIAL AGE)AGE) UITHUITH TYPICAL TYPICAL SURUIUnL--SURUIUnL--
----CUBIC FOOT FOOT VOLUMEVOLUME ABOVE 0.2 FOOT ABOVE 0.2 FOOT STUNP----STUNP----nLLnLL TREES TREES tt &INCH&INCH CLASS AND GREATER CLASS AND GREATER
Au.Au. STEMSTEM SttlltltSLSLttFORSttlltltSLSLttFOR O.B. TOPS O.B. TOPS OF----lStttltSSSllttOF----lStttltSSSllttTSO(iO)TSO(iO) SI SI AGEAGE D+CD+C DBHDBH PER BASK CRPER BASK CR AU.AU. 0 INCHESINCHES %% 2 INCHES 2 INCHES tt 3 3 INCHES
HT.HT. ACREACRE AREAAREA HT.HT. O.B. I.B. t O.B. X.8. I O.B. I.E.
MtITH.MtITH. REnNREnN DBH = 1.3 DBH = 1.3 QUADRATIC QUADRATIC HEANHEAN DBH DBH =1.33=1.33
i 183 1 . 0 7 0 . 22 5 9 1 . 3 76 .13 i . O 7 7 . 0
2 4 3 2 . 3
XX SURVIVAL= 100.0 SURVIVAL= 100.0
6 . 7 7.97.9 3.73.712.212.2 11.911.9 6 . 61 4 . 9 .s .3-- --
2 0 . 3 1 0 . 6
UEIBULL UEIBULL PMMETERSPMMETERS nn = = .55.55 B = B = .BO.BO
HEnNHEnN CROWN RATIO = CROWN RATIO = 71.071.0
c =I.99
----CUBIC FOOT ----CUBIC FOOT UOLUUEUOLUUE ABOVE 0.2 FOOT ABOVE 0.2 FOOT STUHP----STUHP----llLLllLL TREES TREES tt ~-INCH~-INCH cLnsscLnss &ND&ND GREATER GREATER
nu.nu. STEHSSTEHS SttlStWlXtttSFORSttlStWlXtttSFOR 0 0 .B. TOPS TOPS OF----tttlkttbStSLltOF----tttlkttbStSLltTSO(l0)TSO(l0) SI SI AGE D+C DBHAGE D+C DBH PER BASAL CR PER BASAL CR nU.nU. 00 INCHES INCHES tt 2 INCHES 2 INCHES $$ 3 INCHES3 INCHES
HT.HT. ACREACRE E\REAE\REA HT.HT. O.B. I.E.O.B. I.E. II O.B.O.B. I.E. I.E. 88 O.B. I.E. O.B. I.E.
300300 70 70 15 24.915 24.9
MITH.MITH. HEkNHEkN DBH = 3.2 DBH = 3.2 QUADRATIC QUADRATIC REINREIN DBH DBH =3.35=3.35 YEIBULL YEIBULL PARMETERSPARMETERS
i b . I f6.i22 5757 1.21.2 74.274.233 123123 6 . 0 78.478.4
:: 92 2192 21 8.0 2.98.0 2.9 80.2 81.380.2 81.3b i .2.2 81.981.9
380380 -m-m
XX SURUIWL=SURUIWL= 100.0 100.0 HEANHEAN CROUNCROUN RATIO RATIO ==
5 . 0 .2.2 .l .l14.114.1 13.0 7.413.0 7.4i9.9i9.9 78.6 49.249.223.723.7 f i b . 6 7 7 . 226 .3 44.3 30.528 .2 3.2 2.2
- -2 5 5 . 9 ibb.6
109.4 72 .142 .8 29 .4
3 . i 2 . 2- -
1 5 5 . 3 1 0 3 . 7
A = .SS B B =2.98=2.98
78.078.0
88.1 57.057.038.138.1 2 6 . 02.9 2.02.9 2.0
129.1129.1 85.085.0
c -3.40c -3.40
1 3
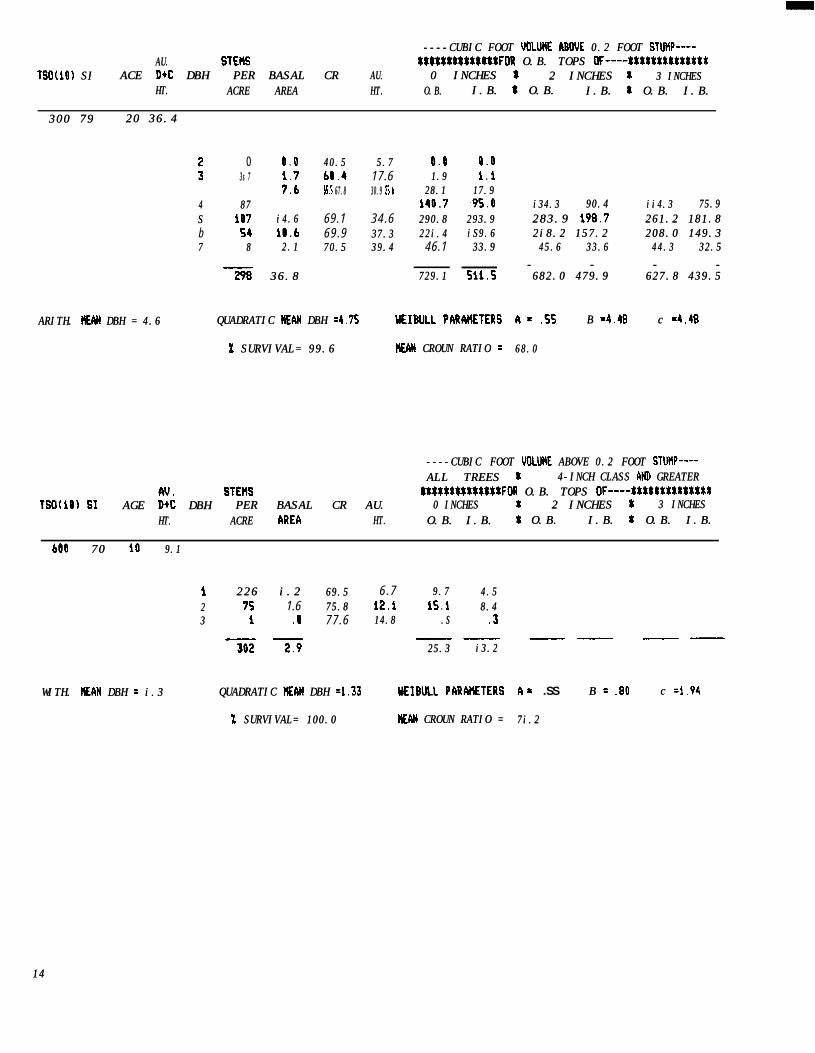
----CUBIC FOOT ----CUBIC FOOT UOLUHEUOLUHE I\BO'JEI\BO'JE 0.2 FOOT 0.2 FOOT STWP----STWP----AU.AU. STEHSSTEHS #WtlLWLWFOR#WtlLWLWFOR O.B. TOPS O.B. TOPS OF----SSStllt$ttlXSI:OF----SSStllt$ttlXSI:
TSO(i0)TSO(i0) SI SI ACE ACE D+CD+C DBH DBH PER PER BASAL CRBASAL CR AU.AU. 0 INCHES 0 INCHES 88 2 INCHES 2 INCHES LL 3 3 INCHESINCHESHT.HT. ACREACRE AREAAREA HT.HT. O.B.O.B. I.B. I.B. 88 O.B. O.B. I.B. I.B. 11 O.B. I.B. O.B. I.B.
300 79300 79 20 36.420 36.4
ARITH. ARITH. MANMAN DBH = 4.6 DBH = 4.6
i 0ii 3s 73s 7
44 8787SS 107107b 545477 88
298298
0.0 40.540.5 5.75.7.2.2 60.4 17.6
::3::3 65.5 67.8 67.8 30.9 30.9 ES.6ES.6
i4.6i4.6 69.1 34.6il.6 69.9 37.337.32.12.1 70.570.5 39.439.4
36.836.8
0.0 0.01.91.9 i.i
28.128.1 17.917.9i40.7i40.7 $95.0$95.0290.8290.8 293.9293.922i.422i.4 iS9.6iS9.646.1 33.933.9
729.1729.1 sii.5
QUADRATIC QUADRATIC MEANMEAN DBH DBH =4.75=4.75 WEIBULLWEIBULL PAR&METERSPAR&METERS A= .ss B B =4.48=4.48 c c =4.40=4.40
XX SURVIVAL= 99.6 SURVIVAL= 99.6 WNWN CROUN RATIO CROUN RATIO == 68.068.0
i34.3i34.3 90.490.4 ii4.3ii4.3 75.975.9283.9 283.9 198.7198.7 261.2 181.8261.2 181.82i8.2 157.22i8.2 157.2 208.0 149.3208.0 149.345.645.6 33.633.6 44.344.3 32.532.5
- - - -- - - -682.0 479.9682.0 479.9 627.8 439.5627.8 439.5
----CUBIC ----CUBIC FOOT FOOT VOLUMEVOLUME ABOVE 0.2 ABOVE 0.2 FOOT FOOT STUtlP----STUtlP----ALL TREES ALL TREES s:s: 4-INCH CLASS 4-INCH CLASS MDMD GREATER GREATER
Av.Av. STENSSTENS 8tttSt%8tft8ttFOR8tttSt%8tft8ttFOR O.B. TOPS O.B. TOPS OF----tltLSltttSLIXSOF----tltLSltttSLIXSTSO(iO)TSO(iO) SISI AGE AGE DtCDtC DBH DBH PER BASAL CR AU.PER BASAL CR AU. 0 INCHES0 INCHES %% 2 2 INCHES INCHES SS 3 INCHES3 INCHES
HT.HT. ACREACRE hREAhREA HT.HT. O.B. I.B.O.B. I.B. 88 O.B. O.B. I.B. I.B. 88 O.B. I.B. O.B. I.B.
600600 70 70 1010 9.19.1
II2233
WITH. WITH. HEQANHEQAN DBH DBH == i.3 i.3 QUADRATIC QUADRATIC NANNAN DBH DBH =1.33=1.33 UEIBULLUEIBULL PARMETERSPARMETERS
226 i.2226 i.2 69.569.57575 1.6 75.875.8ii .I.I 77.6
-iii-r9
6.7 9.79.7 4.54.5i2.ii2.i L5.iL5.i 8.48.414.814.8 .S.S .3.3--
25.325.3 i3.2i3.2
XX SURVIVAL= 100.0 SURVIVAL= 100.0 HEMHEM CROUN RATIO = CROUN RATIO =
A = .SS B B == .BO.BO
7i.27i.2
c c =1.94=1.94
1414

----CUBIC FOOT UOLUHE ----CUBIC FOOT UOLUHE MOUEMOUE 0.2 FOOT 0.2 FOOT STUhP----STUhP----AU.AU. STEHSSTEHS t8ttSt8tWttlFORt8ttSt8tWttlFOR O.B. TOPS O.B. TOPS OF----8WtttStttt~tOF----8WtttStttt~t
TSO(iO)TSO(iO) SI SI AGE AGE D+CD+C DBH DBH PER PER BASALBASAL CR CR AU.AU. 00 INCHES INCHES LL 2 INCHES 2 INCHES t.t. 3 INCHES3 INCHESHT.HT. ACREACRE AREAAREA HT.HT. O.B.O.B. I.B. 8 O.B. I.B. I O.B. I.E.
600 70 LS 24.9
ARITH. HEANHEAN DBHDBH = 2.8 = 2.8 QUADRhTICQUADRhTIC MEANMEAN DBH DBH =2.98=2.98 UEIEULLUEIEULL PARMETERS PARMETERS
49 .3 53.5i89 4.1 72.8214 i0.S 77.3110110 9.6 79.227 3.7 80.33 .6 81.0
592 28.8
XX SURVIVAL= 99.9 SURVIVAL= 99.9
5.35.3 1.8 1.8 .8.814.614.6 44.5 25.244.5 25.220.420.4 i39.7 87.5i39.7 87.524.124.1 t41.7t41.7 93.9 93.926.726.7 57.7 39.757.7 39.728 .6 9.6 9.6 6.8
- -394.9 254.0394.9 254.0
HEWHEW CROUN RATIO CROUN RATIO ==
133.1 87 8133.1 87 8 107.6 69 .855.8 38.455.8 38.4 49.849.8 34.034.09.4 9.4 6.7 8.88.8 6.26.2
- -- -198.3 132.9198.3 132.9 xizixizi iio.0iio.0
a= .ss 66 =2.ss=2.ss c c =2.49=2.49
74.474.4
----CUBIC FOOT UOLUHE ----CUBIC FOOT UOLUHE MOUEMOUE 0.2 FOOT 0.2 FOOT STUHP----STUHP----ALL TREES ALL TREES 88 4-INCH CLASS AND GREATER4-INCH CLASS AND GREATER
AU.AU. STEMSTEM ttSStttSS$SttLFORttSStttSS$SttLFOR O.E.O.E. TOPS TOPS OF----SttttttttWLYOF----SttttttttWLYTSO(iO)TSO(iO) SI SI AGE D+C DBHAGE D+C DBH PER BASAL CRPER BASAL CR AU.AU. 0 INCHES0 INCHES ** 2 INCHES 2 INCHES 11 3 INCHES3 INCHES
HT.HT. ACREACRE hREAhREA HT.HT. O.B. I.E.O.B. I.E. tt O.B. O.B. I.B. I.B. tt O.B. O.B. I.E.I.E.
600600 70 70 20 20 36.4
ARITH. ARITH. HEANHEAN DBH DBH == 3.8 3.8 @JADRATIC@JADRATIC HEM HEM DBHDBH =4.03=4.03 UEIBULL UEIBULL PARMETERSPARMETERS
107272is7is7182182i20i20434388II
593
.i 34.934.91 . 6 56 .27.77.7 bi .7.7is.9is.9 64 .116 .4 65.5
!l:: 66.4 67.0.3 67 .5
5 2 . 5
xx SURuIuAL=SURuIuAL= 99.1 99.1 hEANhEAN CROUN RATIO = CROUN RATIO =
6 . 5 .4.4i8.8i8.8 2i.22i.226.826.8 13i.213i.232.032.0 303.5303.535.535.5 334.3334.338.138.1 180.0180.040.140.1 46 .941 .7 7 . 8
1025.3
.252 .384 .0
205 .4234 .8i 2 9 . 93 4 . 6
5 . 9
290.2 195.7 248.4 ibf.532b.S 229.0 301.3 210.1177.5 128.0 ib9 .3 i2i .84b.S 3 4 . 3 45.1 33 .2
7 . 8 5 . 8 7 . 6 5 . 7
- -- -707.0 8 4 8 . 5 5 9 2 . 8 771.7 536 .3
A= .ss B B =3.68 c =3.00
62 .4
1515
----CUBIC FOOT ----CUBIC FOOT VOLUMEVOLUME ABOVE 0.2 FOOT ABOVE 0.2 FOOT STUHP----STUHP----ALL TREESALL TREES 4-INCH CLASS AND GREATER4-INCH CLASS AND GREATER
AU.AU. STEHSSTEHS tltS#WMtWlFO:tltS#WMtWlFO: O.B. TOPS O.B. TOPS OF----kttkktl~ltSSa~XOF----kttkktl~ltSSa~XTSO(l0)TSO(l0) SI SI AGE D+C DBHAGE D+C DBH PER BASAL CRPER BASAL CR AU.AU. 0 INCHES0 INCHES 2 INCHES 2 INCHES tt 3 INCHES3 INCHES
HT.HT. ACREACRE AREA HT.HT. O.B. I.B.O.B. I.B. :: O.B. I.B. O.B. I.B. tt O.B. O.B. I.B.I.B.
900 70 10 9.1900 70 10 9.1
MITH.MITH. NEMNEM DBH DBH == 1.3 1.3
:: 258 87258 87 :::::: 68 75:s75:s 9 9
33 22 .l.l 77.477.4
347347 3 . 43 . 4
QUADRATIC QUADRATIC HEANHEAN DBH DBH d.34d.34 UEIBULL UEIBULL PARMETERSPARMETERS
XX SURUIUMSURUIUM 108.0 MNMN CROUN RATIO CROUN RATIO ==
6.66.6 11.111.112.112.1 17.4 17.4 95::95::14.814.8 1.0 1.0 .b
- -29.4 If.429.4 If.4
A A == .55.55 B = B = .8i.8i c c =i.9i=i.9i
71.871.8
----CUBIC FOOT UOLUHE ----CUBIC FOOT UOLUHE ABOVEABOVE 0.2 FOOT 0.2 FOOT STUHP----STUHP----ALL TREES ALL TREES $$ 4-INCH CLASS AND GREATER4-INCH CLASS AND GREATER
AGE AGE EtEt DBH DBHSTEWSTEWPER PER BhSALBhSAL CR AU. CR AU.
Wt8tLlSSttttSFORWt8tLlSSttttSFOR O.B. TOPS O.B. TOPS OF----tttSSSL%ttttt#OF----tttSSSL%ttttt#TSO(I0)TSO(I0) 6161 0 INCHES 0 INCHES 88 2 INCHES 2 INCHES 88 3 INCHES3 INCHES
HT.HT. ACREACRE AREAAREA HT. O.B. HT. O.B. I.B. f O.B. I.B. 1 O.B. I.B.
900 70 15 24.9
1 137 .7 51.02 315 6 . 9 71.571.533 255255 12.512.5 76.276.244 11s11s 18.018.0 78.378.355 3131 4.24.2 79.479.4
7676 55 1 1 1.0 1.0 .3.3 80.i 80.i 80.6
859 3 5 . 6
ARITH.ARITH. HEYANHEYAN DBH = 2.5 DBH = 2.5 QUADRATIC MEAN DBH MEAN DBH 12.7612.76
XX SURVIVAL= 99.8 SURVIVAL= 99.8
5.75.7 S.3 2.4S.3 2.4IS.)IS.) 76.2 43.320.8 169.7 169.7 106.424.5 lS0.3 9 9 . 827.0 67.0 46.228.9 lb.1 11.430.2 4.5 3.3
- -489.0 312.9
YEIBULL YEIBULL PMMHETERSPMMHETERS
HEANHEAN CROUN RATIO = CROUN RATIO =
141.4 93.4141.4 93.4 Li4.6 7 4 . 564.9 44.6 58.0 39.615.8 ii .2 14.8 10.44.4 3.2 4.3 3.1
- - - -226.5 1 5 2 . 4 191.7 127 .6
A= .ss B B =2.2S C =2.03
70.9
1616

----CUBIC----CUBIC FOOT FOOT VOLUHEVOLUHE ABOVE 0.2 FOOT ABOVE 0.2 FOOT STUHP----STUHP----AU.AU. STEMSTEM 8SWtL8SttS:LlFOR8SWtL8SttS:LlFOR O.B. O.B. TOPSTOPS 0F--d-WSt18.tttSLttl0F--d-WSt18.tttSLttl
TSO(iO)TSO(iO) SI SI AGE AGE D+C DBH PER BhSK CR hV. 0 INCHES I 2 INCHES L 3 INCHESINCHESHT.HT. ACREACRE AREAAREA HT.HT. O.B. O.B. 1.8.1.8. tt O.B.O.B. I.B.I.B. IrIr O.B. O.B. I.B.I.B.
900 70900 70 20 36.420 36.4
ARITH. ARITH. UEANUEAN DBH DBH == 3.3 3.3
: 198 62 4.3 .3
3 248 1 2 . 2
t 197 109 i7.2 i4.96 43 8 . 47 12 3 . 28 3 1 . 0
872 6 1 . 6
29.229.251.851.857.657.660.360.361.861.862.762.763.463.463.963.9
QUADRATIC QUADRATIC HEANHEAN DBH DBH =3.60=3.60
7.7. SURVIVAL= SURVIVAL= 97.797.7
2x2x2.92.9
271927196i.56i.5
2i5.22i5.233.033.0 338.2338.236.436.4 3iO.83iO.838.938.9 183.5183.540.840.8 71.571.542.342.3 23.823.8
1207.a1207.a
3s3si38:2i38:2229.3229.32i8.72i8.7132.6132.652.852.817.917.9
-E?
UEIBULL UEIBULL PARMETERSPARMETERS
BEAN CROYN RATIO BEAN CROYN RATIO ==
323.6323.6 218.9218.9303.8303.8 ti3.4ti3.4i8i.Oi8i.O 130.7130.770.970.9 SE.3SE.323.623.6 17.717.7
909.1909.1 -iai-iai
A= .ss
55.8
BB =3.i4=3.i4 C C =2.18=2.18
278.7 i86.2278.7 i86.2280.9 196.3280.9 196.3172.9 124.5172.9 124.568.968.9 SO.7SO.723.223.2 17.417.4
824.824.
----CUBIC FOOT VOLUHE ABOVE 0.2 FOOT STUMP--------CUBIC FOOT VOLUHE ABOVE 0.2 FOOT STUMP----ALL TREESALL TREES 4-INCH4-INCH CLASS AND GREATER CLASS AND GREATER
&J.&J. STEUSSTEUS SttSStttlSttt~F~SttSStttlSttt~F~ O.B. TOPS O.B. TOPS OF--'-SSLtSSttSSLtXSOF--'-SSLtSSttSSLtXSTSO(iO)TSO(iO) SISI AGE AGE D+CD+C DBH DBH PER PER BASALBASAL CR AU. CR AU. 0 INCHES 0 INCHES 88 2 INCHES 2 INCHES tt 3 INCHES3 INCHES
HT.HT. ACREACRE AREAAREA HT.HT. O.B. I.B.O.B. I.B. 88 O.B. I.B. O.B. I.B. $$ O.B. O.B. I.E.I.E.
1200 70 1200 70 1010 9.1 9.1
i 293 i.6293 i.6 68.268.2 6.56.5 12.5 12.5 5.85.8
II ioiioi 2 2.2 2 2.2 .i.i 75.3 77.275.3 77.2 12.0 12.0 14.714.7 20.1 1.0 ii.2 20.1 1.0 ii.2 .6.6
3 9 6 3 . 93 9 6 3 . 9 --e----e-- 33.6 17.6 33.6 17.6
ARITH. ARITH. HEANHEAN DBH = i.3 DBH = i.3 QUADRATIC QUADRATIC HEANHEAN DBH DBH ~1.34~1.34 YEIBULL YEIBULL PARMETERSPARMETERS A A == .SS.SS EE == .8i.8i C C =1.87=1.87
XX SURVIVAL= 100.0 SURVIVAL= 100.0 HEANHEAN CROWN RATIO CROWN RATIO == 70.1 70.1
1717

----CUBIC ----CUBIC FOOT FOOT UOLUMEUOLUME ABOVE 0.2 FOOT ABOVE 0.2 FOOT STUHP----STUHP----AU.AU. STEMSSTEMS S8888tStS88888FORS8888tStS88888FOR O.B. TOPS O.B. TOPS OF----888888888888%8OF----888888888888%8
TSO(iO)TSO(iO) SISI AGE AGE D+CD+C DBH DBH PER BASAL CRPER BASAL CR AU.AU. 0 INCHES0 INCHES 2 INCHES2 INCHES 8 8 '' 3 INCHES 3 INCHESHT.HT. ACREACRE AREAAREA HT.HT. O.B.O.B. I.B.I.B. :: O.B. O.B. I.B. 8 O.B. I.B.I.B. 8 O.B. I.B.
1290-1290- 79 79 if 24.9if 24.9
i 221221 i.2i.2 48.648.6 6.16.1 6.96.9 4.14.13232 428 297428 297 it:it: 75.2 70.275.2 70.2 2i.22i.2 15.5 15.5 201.0 201.0 iO6.iiO6.i 126.3 60.5126.3 60.5
44 ii6ii6 1o.i1o.i 77.477.4 24.924.9 153.5153.5 iO2.0iO2.0 144.6144.6 9S.b i i i . 6 76 .55 28 3.83.8 78.678.6 27.327.3 6i.i 42.242.2 59.259.2 40.840.8 53.053.0 36 .26 5 1 .0 79.379.3 29.129.1 ib.3ib.3 ii.5ii.5 16.0 i i .3.3 14.914.9 10.510.5
-GE 40.0-- -- P_
546.9 546.9 346.7 219.8 147.7219.8 147.7 1BS.S1BS.S 123.2 123.2
ARITH.ARITH. MEAN DBH MEAN DBH == 2.4 2.4 QUADRATIC QUADRATIC #AN#AN DBH DBH ~2.59~2.59 YEIBULL YEIBULL PARMETERSPARMETERS A A == .SS.SS BB =2.06=2.06 C C =1.92=1.92
xx SURVIVAL= 99.4 SURVIVAL= 99.4 HEHEANHEHEAN CROWCROW RATIO RATIO == 68.2
----CUBIC ----CUBIC FOOT FOOT UOLUnEUOLUnE ABOVEABOVE 0.2 FOOT 0.2 FOOT STUHP----STUHP----ALL TREES 8ALL TREES 8 4-INCH CLASS AND GREATER4-INCH CLASS AND GREATER
AU.AU. STEHSSTEHS 88888t8888t8t8F0R88888t8888t8t8F0R O.B. TOPS O.B. TOPS OF----88888888888tt8OF----88888888888tt8TSO(iI)TSO(iI) SI SI AGE AGE D+CD+C DBH DBH PER BASAL CR PER BASAL CR AU.AU. 0 0 INCHESINCHES 88 2 INCHES 82 INCHES 8 3 INCHES3 INCHES
HT.HT. ACREACRE AREAAREA HT.HT. O.B. O.B. I.B.I.B. 8 O.B.8 O.B. I.B. 8 O.B.I.B. 8 O.B. I.B.I.B.
ieooieoo 70 70 20 20 36.4
MITH.MITH. MAN MAN DMiDMi == 3.i 3.i
124124 .7.7 23.923.9300300 6.56.5 47.747.7308308 iS.iiS.i 53.953.92i32i3 18.618.6 56.756.7iO8iO8 14.714.7 58.358.34242 8.28.2 59.359.31313 3.s3.s 60 .033 i.0i.0 60.560.5ii .4.4 60.960.9
mm ba.9ba.9
QUADRATIC QUADRATIC HEANHEAN DBHDBH =3.37=3.37 UEIBULLUEIBULL PARMETERSPARMETERS
XX SURVIVAL= SURVIVAL= 94.594.5 HEANHEAN CROYN RATIO = CROYN RATIO =
8.28.2 6.i2i.i2i.i 97 .628.928.9 276 .233.933.9 374.0374.037.237.2 314.1314.13 9 . 6 iB2.2iB2.241.541.5 7 8 . 642.942.9 24.124.144.044.0 10.310.3
1364.i
177.8177.8254 .6221.3221.313i.913i.958.158.1i8.ii8.i7.87.8
359.4359.4 243.4243.4 310.7310.7 2oe.i2oe.i307.2307.2 216.1216.1 204.7204.7 199.2199.2i79.Bi79.B 130.0130.0 i72.0i72.0 i24.0i24.077.977.9 5 7 . 6 75.875.8 55.855.823.923.9 18.018.0 23.S23.S 17.617.6io.2io.2 7.87.8 i0.ii0.i 7.77.7
- --929.0929.0 958.4 958.4 672.9 8 7 6 . 8 612.4
a = .ss B B =2.84=2.84 c c =i.ps=i.ps
so.2so.2
1818
----CUBIC FOOT ----CUBIC FOOT UOLUHEUOLUHE ABOVE 0.2 FOOT ABOVE 0.2 FOOT STUIIP----STUIIP----AU.AU. STEMSTEM ISt:tt8StS~tS8FORISt:tt8StS~tS8FOR O.B. TOPS O.B. TOPS OF----tSt:tlStSWtSOF----tSt:tlStSWtS
TSO(i0)TSO(i0) SI SI AGE AGE D+CD+C DBH DBH PER BASAL CRPER BASAL CR AU.AU. 0 INCHES0 INCHES 2 INCHES2 INCHESHT.HT. ACREACRE AREAAREA HT.HT. O.B.O.B. I.B. I.B. :: O.B. O.B.
3 INCHES3 INCHESI.B.I.B. :: O.B.O.B. I.E.I.E.
15001500 7070 LOLO 9.1 9.1
: 330 330 ii5 2.5 i.82.5 i.8 75.0 75.0 67.5
33 33 .i.i 77.077.0
4484.5
ARITH. ARITH. tiEANtiEAN DBHDBH == 1.3 1.3 QUADRATXCQUADRATXC HEANHEAN DEHDEH =1.3S=1.3S
XX SURUIUAL=SURUIUAL= iOO.0iOO.0
6 . 5 14.0 6.512.012.0 22.8 12.722.8 12.7i4.7i4.7 1.51.5 .9.9
- -- -38.2 20.i38.2 20.i
UEXDULLUEXDULL PARMETERSPARMETERS
HEANHEAN CROUN RATIO = CROUN RATIO =
A = A = .SS.SS B = B = .8i.8i cc =b.04=b.04
69.569.5
----CUBIC FOOT ----CUBIC FOOT UOLUHEUOLUHE ABOVE 0.2 FOOT ABOVE 0.2 FOOT STUIIP----STUIIP----ALL TREESALL TREES 88 &INCH CLASS AND GREATER CLASS AND GREATER
AV.AV. STEHSSTEHS StLtMt%ttSSSIFORStLtMt%ttSSSIFOR O.B. TOPS O.B. TOPS OF----tltttWttttSStOF----tltttWttttSStTSO(iO)TSO(iO) SI- AGE SI- AGE D+CD+C DEHDEH PER BASAL CR AU.PER BASAL CR AU. 0 INCHES 0 INCHES $$ 2 INCHES 2 INCHES II 3 INCHES3 INCHES
H7.H7. ACREACRE AREAAREA HT.HT. O.B. I.E.O.B. I.E. ** O.B. O.B. I.B. I.B. tt O.B. O.B. I.B.I.B.
15001500 70 70 1515 24.9 24.9
i 263 i.4i.4 46.446.422 sb2sb2 12.312.3 69 .133 359359 i 7 . b 74.374.344 108108 9.49.4 7 6 . 55 ib 2.22.2 77.877.8b i .2.2 7 8 . 6
-iiG 43.1
ARITH. ARITH. HEANHEAN DBHDBH = 2.3 = 2.3 QUADRATIC QUADRATIC liEANliEAN DBH DBH =2.46=2.46
XX SURVIVAL= SURVIVAL= 98 .6
6 . 3 10.9 5.010.9 5.015.915.9 i42.4 81.4i42.4 81.421 .6 246.7 i55.2i55.225.225.2 1 4 4 . 6 9 6 . 227 .6 35.3 24.435.3 24.429.429.4 3.3 2.33.3 2.3
- -- -583.2 583.2 364.6
UEIBULLUEIBULL PARAHETERSPARAHETERS
HEANHEAN CROUN RATIO = CROUN RATIO =
136.3 90 .3 i i i . 2 72 .434 .2 23 .6 30 .6 20 .9
3 . 2 2 . 3 3 .0 2 . 1- - - - -
173.7 i i b . 2 144.8 95 .4
A- .55 B B =1.96=1.96 C C =2.07=2.07
66.7
19

----CUBIC FOOT ----CUBIC FOOT 'JOLUME'JOLUME LBO'JELBO'JE 0.2 FOOT 0.2 FOOT STUHP----STUHP----&J.&J. STEMSTEM BttttSL8:S8tk8FORBttttSL8:S8tk8FOR O.B. TOPS O.B. TOPS OF----tSLtLttS:ltttlOF----tSLtLttS:ltttl
TSO(iO)TSO(iO) SISI ACE ACE D+CD+C DBH DBH PER PER BAMLBAML CR CR AU.AU. OINCHESOINCHES tt 2 INCHES 2 INCHES 88 3 INCHES3 INCHESHT.HT. ACREACRE AREAAREA HT.HT. O.B.O.B. I.B. $ O.B. I.B. 8 O.B. I.B.
1501 70 20 36.4
i 141 .82 367 8.03 378 i0.b4 244 21.3S 109 14.9
76 35 8 b-.9 2.18 i .3
1283 n.8
19.9 8.98.9 7.47.4 3.53.544.6 2i.92i.9 i23.Si23.S 72.772.7Si.0 29.729.7 346.9346.9 223.8223.853.9 34.534.5 437.0437.0 297.3297.355.5 37.837.8 321.6321.6 226.8226.85 6 . 6 40.140.1 is3.7is3.7 iii.3iii.357 .4 4i.94i.9 48.948.9 3L.i3L.i5 7 . 9 43.343.3 8.18.1 6.16.1
ARRITH.ARRITH. HEAN DBH = 3.0 DBH = 3.0 QUADRATIC QUADRATIC HEhNHEhN DBH DBH =3.23=3.23
xx sURVIUAL=sURVIUAL= 88.288.2
1447.21447.2 977.7977.7
UEIBULL UEIBULL PARMETERSPARMETERS
HEhNHEhN CROUNCROUN RbTIORbTIO ==
419.4 204.5419.4 204.5 363.8 244.i363.8 244.i314.7 314.7 221.6 292.0 204.6292.0 204.6151.7 109.8151.7 109.8 145.2145.2 104.8 104.848.548.5 35.835.8 47.147.1 34.834.88.1 8.1 6.16.1 7.9 5.97.9 5.9
- - - -- - - -942.4 942.4 657.8657.8 856.0856.0 594.2 594.2
A= .ss B B =2.73=2.73 C C =2.04=2.04
46 .9
2020

----CUBIC FOOT FOOT VOLUHEVOLUHE ABOVE Q.2 FOOT ABOVE Q.2 FOOT STU+---STU+---ALLTREESALLTREES 8 8 4-INCH CLASS CLASS hNDhND GREATER GREATER
AU.AU. STEffiSTEffi 88888888888888FOR88888888888888FOR O.B. TOPS OF----88888888888888 O.B. TOPS OF----88888888888888TSO(iO)TSO(iO) SI SI ACE D+C DBH 'PER BASAL CRACE D+C DBH 'PER BASAL CR AU.AU. QINCHES 8QINCHES 8 2 2 INCHES 3 INCHES
HT. ACREACRE AREAAREA HT.HT. O.B.O.B. I.B. 8 O.B. I.B. : O.B. I.B.
300 80 10 10.4
ARITH.ARITH. HEANHEAN DBH = 1.4 DBH = 1.4 RUADRATICRUADRATIC #AN#AN DBH DBH =i.Si=i.Si
: 104 i62i62 2::2:: 70.7 70.7 61.2
33 4 4 .2.2 73.473.4
-5-5 3 . 3 3 . 3
XX SURVIVAL= SURVIVAL= 100.0100.0
6.36.3i2.1i2.1 i:::i:::is.1is.1 2.1 i.2 2.1 i.2
- -- -29.629.6 is.9is.9
UEIBULLUEIBULL PARAMETERS PARAMETERS
HEANHEAN CROUNCROUN RATIO RATIO ==
A= A= .SS.SS B= B= .99.99 C C =2.09=2.09
b5.ib5.i
----CUBIC FOOT ----CUBIC FOOT VOLWEVOLWE ABOVE 0.2 FOOT ABOVE 0.2 FOOT STUHP----STUHP----ALL TREES 8ALL TREES 8 4-INCH4-INCH CLASS CLASS MDMD GREATER GREATER
AU.AU. STEMSSTEMS 88888888888888FOR88888888888888FOR O.B. TOPS OF----88888888888888 O.B. TOPS OF----88888888888888TSO(iO)TSO(iO) SI SI MEME D+C DBH D+C DBH PER BASAL CRPER BASAL CR IIV.IIV. 00 INCHES 8 INCHES 8 2 INCHES 82 INCHES 8 3 INCHES3 INCHES
HT.HT. ACREACRE hREhhREh HT.HT. O.B. I.B.O.B. I.B. 8 O.B.8 O.B. I.B. 8 O.B. I.B.
300 80 15 28.4
ARITH. ARITH. HEANHEAN DBH DBH == 3.7 3.7
: 3: :: 67.0 40.4 14.7 4.9 7.4 .i 4.2 .Q
3 95 4.7 72.9 2i.3 b4.4 40.5
: ii5 5i io.0 7.0 75.4 76.8 25.6 28.5 lf6.i lf6.i ii5.9 104.0 80.26 6 1.2 77.7 30.7 20.5 14.6
380 23.5 -- 3b4.3 243.5
UUADRATICUUADRATIC HEANHEAN DBH DBH =3.79=3.79 YEIBULL YEIBULL PhRAHETERSPhRAHETERS A = .55 B =3.45=3.45 c c r3.73r3.73
XX SURVIVIK=SURVIVIK= iQQ.0iQQ.0 UEANUEAN CROWN RATIO = CROWN RATIO = 73.873.8
147.3 97.6 120.6 78.6ii2.4 77.7 101.2 69.420.120.1 14.3 iB.9 13.414.3 iB.9 13.4
279.8279.8 --- i89.b --- i89.b 240.7240.7 ibi.4 ibi.4
2121

----CUBIC FOOT FOOT UOLUHEUOLUHE ABOVE 0.2 FOOT ABOVE 0.2 FOOT STUHP----STUHP----AU.AU. STEtlSSTEtlS StSt~tt8tlStSIFORStSt~tt8tlStSIFOR O.B. O.B. TOPSTOPS OF----SSXtWLtStSSSXOF----SSXtWLtStSSSX
TSO(iO)TSO(iO) SISI ACEACE D+CD+C DBHDBH PER BASAL CRPER BASAL CR AU.AU. 00 INCHES INCHES 88 2 INCHES 2 INCHES LL 3 INCHES3 INCHESHT.HT. ACREACRE MEAMEA HT.HT. O.B.O.B. I.E.I.E. tt O.B. O.B. 1.B.1.B. tt O.B. O.B. 1.E1.E
310310 8080 20 41.620 41.6
1.0 26.126.1 6.66.6 0.90.9ib :: :: Sb.0 49.9 49.9 20.1 29.120.1 29.1 14.4 14.4 .b
53 9853 98 13.4 4.613.4 4.6 58.858.8 60.4 35.0 39.135.0 39.1 298.2 298.2 9b.i
9292 i8.ii8.i 61.461.4 42.b42.b 422.8422.83434 9.19.1 62 .1 44.344.3 219.0219.033 i.0i.0 62 .6 4 b . i 25 .8
0.0
9::65.4 92.3 62 .6 80 .2 53.9
2io .7 292.0 206.i 27i.B 190.9306 .4 416.7416.7 302.4302.4 399.9399.9 289.4289.4162.4162.4 2i7.22i7.2 ibi.0ibi.0 211.6211.6 156.6156.6i9.si9.s 25.725.7 19.419.4 25.225.2 i9.0i9.0
298 97.8 -- 1076.0 774.1774.1 -- 1043.9 751.5 1043.9 751.5 P_ 988.7 709.8 988.7 709.8
CIRITH.CIRITH. HEANHEAN DBH = 5.2 DBH = 5.2 QUADRLTICQUADRLTIC HEANHEAN DBH DBH =S.36=S.36 UEIBULLUEIBULL PhRfaHETERSPhRfaHETERS A A == .SS.SS BB =5.13=5.13 c c =4.96=4.96
XX SURVIUK=SURVIUK= 99.9 99.9 HEANHEAN CROUNCROUN RATIO RATIO == 60.0
----CUBIC FOOT ----CUBIC FOOT 'JOLUHE'JOLUHE ABOVE 0.2 FOOT ABOVE 0.2 FOOT STUHP----STUHP----ALL TREES ALL TREES $$ 4-INCH4-INCH CLASS AND GREATER CLASS AND GREATER
I\u.I\u. STEMSTEM ttSlttSt8:LSSSFORttSlttSt8:LSSSFOR O.B. TOPS O.B. TOPS OF----ttlLttSStttSttOF----ttlLttSStttSttTSO(iO)TSO(iO) SISI ACEACE D+CD+C DBH DBH PER PER BASALBASAL CR CR AU.AU. RINCHESRINCHES ss 2 INCHES 2 INCHES tt 3 INCHES3 INCHES
HT.HT. ACREACRE AREAAREA HT.HT. O.B. O.B. I.B.I.B. 88 O.B. O.B. 1.B.1.B. tt O.B. O.B. I.B.I.B.
400400 8080 1010 10.4 10.4
ARITH.ARITH. HEANHEAN DBH DBH == 1.4 1.4 QlJhDRATICQlJhDRATIC HEMHEM DBH DBH =i.Si=i.Si
i23
230 1.3 59.414i 3.1 70.1
8 .4 72.9
3794.7
XX SURVIVAL= 100.0 SURVIVAL= 100.0
6 . 2 9.4 4.49.4 4.412.012.0 28.0 28.0 15.6i s . 0 3.9 2.43.9 2.4
- - - - - -- - - - - -41.4 22.441.4 22.4
NEJBULLNEJBULL PARAHEfERSPARAHEfERS A = A = .SS.SS B=B= .98.98 C C =1.98=1.98
HEANHEAN CROUN RATIO = 63.6 CROUN RATIO = 63.6
2222
----CUBIC FOOT FOOT VOLUMEVOLUME ABOVE 0.2 FOOT ABOVE 0.2 FOOT STUHP----STUHP----AU.AU. STEHSSTEHS :888888:::88:8FOR:888888:::88:8FOR O.B. O.B. TOPS OF----88888888888888TOPS OF----88888888888888
TSD(iO)TSD(iO) SISI AGE AGE D+C DBH PER PER BbSKBbSK CR CR IIV.IIV. 0 INCHES0 INCHES 2 2 INCHES 3 INCHESHT. ACRE AREA HT. O.B. I.B. : O.B. I.B. : O.B. I.E.
--ho S O i5 20.4
i 31 .22 146 3.23 210 10.3
: 147 53 i2.8 7.2b 9 1.87 ! .3
-597 -iFi
36 .7 5.3 1.25.3 1.2 .5bS.1 15.315.3 35.835.8 20.420.47i.4 21.821.8 145.5145.5 91.674.1 26 .0 202.8202.8 i35.275 .b 28.928.9 122.0122.0 84 .67b.b7b.b 3i.i3i.i 3i.i3i.i 22.277.277.2 32.7 32.7 4.84.8 3.5
ARITH. ARITH. HEANHEAN DBH = 3.1 DBH = 3.1 QUADRATIC QUADRATIC HEANHEAN DBH DBH =3.31=3.31
%% SURVIVhL=SURVIVhL= 100.0 100.0
543.1543.1 358.0
MIBULL MIBULL PIRAHETERSPIRAHETERS
HEM HEM CROWN RATIO =
19i.b 127.2118.4 81.9
3 0 . 6 2i .84.8 3.5
- -345.4 234.4
A = .55 B B =2.90
b9 .2
157.4 102.9106.8 73.328.8 20.4
4.6 3.3- -297.6 199.9
C C r2.63
----CUBIC FOOT FOOT UOLUHEUOLUHE ABOVE 0.2 FOOT FOOT STUHP----STUHP----ALL TREESALL TREES 88 4-IWCH4-IWCH CLASS AND GREATER CLASS AND GREATER
AV.AV. STEHSSTEHS :888t888888:88FOR:888t888888:88FOR O.B. TOPS OF----88888888888888 O.B. TOPS OF----88888888888888TSU(iO)TSU(iO) STST AGE AGE D+CD+C DBHDBH PER BASAL CRPER BASAL CR AV.AV. 00 INCHES 8 INCHES 8 2 INCHES 82 INCHES 8 3 INCHES3 INCHES
HT.HT. ACREACRE AREAAREA HT.HT. O.B. O.B. I.B. 8 O.B. I.B. 8 O.B. I.B.
--GO S O 20 41.6
ARITH. ARITH. MEANMEAN DBH = 4.2 DBH = 4.2 QUADRATIC QUADRATIC HEANHEAN DBH DBH =4.45=4.45 YEIBULL PARAHETERSYEIBULL PARAHETERS
546
121112111741741511517777212133
-57
.a i9.i1.0 44.55.9 5i . i
15.2 54.i20 .6 55.855.815.115.1 51 .95 . 6 57 .61 .0 58.258.2
b4.5b4.5
XX SURVIVAL= SURVIVAL= 99.799.7 HEANHEAN CROUNCROUN RATIO RATIO ==
7.6 .2.2 .i21.521.5 is.2is.2 8.98.930.430.4 112.6 72.772.736.1 325.3325.3 222.0222.040.i40.i 471.0471.0 333.5333.543.043.0 360.6 262 .245.245.2 137.7137.7 io2.2io2.246.946.9 26 .2 19.819.8
i448.8i448.8 io21.5io21.5
3i2.9 2i2.93i2.9 2i2.9 273.4 i04.2273.4 i04.2461.5461.5 326.3 326.3 430.6 303.0303.0356.3 258.9258.9 342.2 248.0342.2 248.0136.6 101.4136.6 101.4 133.2133.2 90.790.7
2 b . i 19.719.7 25 .6 19.319.3- - - -- - - -i293.4 919.2i293.4 919.2 i205.0i205.0 853.2 853.2
A = .55 B =4.14 C =3.21
53.3
2323
----CUBIC FOOT ----CUBIC FOOT UOLWEUOLWE ABOVE 0.2 FOOT ABOVE 0.2 FOOT STUHP----STUHP----ALL TREES ALL TREES tt &INCH&INCH CLASS AND GREATER CLASS AND GREATER
AV.AV. STEHSSTEHS StWWSISXttSFORStWWSISXttSFOR 0.B.0.B. TOPS TOPS OF----tttXISltStStb:OF----tttXISltStStb:TSO(iO)TSO(iO) SI SI AGE D+C DBHAGE D+C DBH PER BASAL CRPER BASAL CR AU.AU. 00 INCHES L: 2 INCHES INCHES $$ 3 INCHES3 INCHES
HT.HT. ACREACRE AREAAREA HT.HT. O.B.O.B. I.B. t O.B. I.B. t O.B. I.B.
980980 80, 80, 1010 10.4 10.4
:33
ARITH. HEM DBH ARITH. HEM DBH == 1.4 1.4
273 273 i.Si.S 58.258.2164164 3.6 3.6 69.569.51010 .s.s 72.672.6
4 4 7 5 . 64 4 7 5 . 6
QUADRATIC QUADRATIC MEANMEAN DBH DBH =i.Si=i.Si
XX SURVIVAL= SURVIVAL= 100.0100.0
6.i6.i 1i.i1i.i 5.15.1ii.9ii.9 32.432.4 i8.0i8.014.914.9 4.94.9 3.03.0
4 8 . 44 8 . 4 26.226.2
UEIBULL UEIBULL PARAHETERSPARAHETERS
?tEAN?tEAN CROUNCROUN RATIO = RATIO =
-- --
A = .ss B B == .98.98 c c =1.93=1.93
62.562.5
----CUBIC FOOT ----CUBIC FOOT VOLUHEVOLUHE ABOVE 0.2 FOOT ABOVE 0.2 FOOT STUHP----STUHP----ALL TREES ALL TREES 88 4-INCH4-INCH CLASS AND GREATER CLASS AND GREATER
AU.AU. STEMSTEM tltXSLtf%MtStFORtltXSLtf%MtStFOR O.B.O.B. TOPS TOPS OF----lttlStStWttStOF----lttlStStWttStTSO(i0)TSO(i0) SISI _ _ AGEAGE D+CD+C DBH DBH PER BASAL CRPER BASAL CR AU.AU. 00 INCHES INCHES $$ 2 INCHES 2 INCHES 88 3 3 INCHES
HT. hCREhCRE AREAAREA HT.HT. O.B.O.B. I.B. I.B. SS O.B. I.E. O.B. I.E. tt O.B. O.B. I.B.I.B.
900 900 8080 1515 28.4 28.4
ARITH. WEAN DBH = 2.8ARITH. WEAN DBH = 2.8 QUADRATIC MEAN DBH QUADRATIC MEAN DBH =3.00=3.00
ii2ii2 .6.6 33.033.0204 6.2204 6.2 63.363.3268268 i3.2i3.2 70.070.0is0is0 13.113.1 72.872.85454 7.4 7.4 74.474.41313 2.6 75.4 2.6 75.422 .S.S 76.176.1
883883 43.543.5
XX SUR'JIWL=SUR'JIWL= 99.999.9
5.65.6 4.3 2.04.3 2.0if.8if.8 71.6 40.971.6 40.922.322.3 i89.Si89.S ii9.sii9.s26.526.5 2io.2 2io.2 i40.3i40.329.329.3 125.9 07.3125.9 07.33i.43i.4 45.4 32.445.4 32.433.033.0 9.8 7.19.8 7.1
- -- -656.7 429.6656.7 429.6
YEIBULL YEIBULL PARMETERSPARMETERS
MEANMEAN CROYNCROYN RATIO RATIO ==
198.8 132.1198.8 132.1 i64.0i64.0 i07.3 i07.3122.2122.2 84.684.6 iio.4iio.4 75.975.944.644.6 3i.83i.8 42.042.0 29.829.89.79.7 7.07.0 9.39.3 6.86.8
- - - -- - - -375.3 375.3 255.5255.5 325.7 325.7 219.8219.8
A= .ss B =?.Si C C =2.05=2.05
64.064.0
2424

----CUBIC FOOT ----CUBIC FOOT VOLUMEVOLUME ABOVE 0.2 FOOT ABOVE 0.2 FOOT STUtiP----STUtiP----AU.AU. STEMSSTEMS ILtttStltlttSLFORILtttStltlttSLFOR O.B. TOPS O.B. TOPS OF----ttXltt%tXSSXXXOF----ttXltt%tXSSXXX
TSO(l0)TSO(l0) SI SI AGE D+C DBHAGE D+C DBH PER BASAL CR PER BASAL CR A'J.A'J. 00 INCHES INCHES tt 2 INCHES 2 INCHES II 3 INCHES3 INCHESHT.HT. ACREACRE AREAAREA HT.HT. O.B.O.B. I.B. I.B. $$ O.B. O.B. I.B.I.B. 1:1: O.B. O.B. 1.B1.B
900 80900 80 20 41.620 41.6
ARITH. ARITH. IIEANIIEAN DBH DBH == 3.6 3.6 QUADRATIC QUADRATIC HEANHEAN DBH DBH r3.93r3.93 UEIBULL PARAHETERSUEIBULL PARAHETERS A = .ss B B =3.48=3.48 c c =2.22=2.22
4949 .3.3167167 3.63.6230230 11.311.3209209 la.2la.2137137 18.718.7
67 13.213.22s2s 6 . 777 2.42.4I .4.4
892892 74.874.8
11.711.738.738.745.745.748.948.950.750.751.951.952.852.853.453.453.853.8
XX SURVIVAL= SURVIVAL= 99.299.2 HEANHEAN CROUN RATIO = CROUN RATIO = 44.844.8
8.68.6 2.5 1.22.5 1.222.922.9 58.5 34.658.5 34.631.731.7 2 2 4 . 6 1 4 5 . 637.337.3 402.7 402.7 275.5275.541.241.2 437.9 310.6437.9 310.643.943.9 320.3 233.2320.3 233.246.046.0 166.9 124.0166.9 124.047.747.7 62.1 46.946.949.049.0 11.4 a.711.4 a.7
- -- -1686.9 1180.31686.9 1180.3
387.9387.9 264.6264.6429.4429.4 304.1304.13 ib .S 230.3230.3US.6 123.0123.061.861.8 46 .711.311.3 a.7a.7
1372.51372.5 977.4977.4
340.7 230.2340.7 230.2401.5401.5 283.0283.0304.4 220.9304.4 220.9161.5 119.8161.5 119.860.860.8 45.945.911.211.2 8.68.6
1280.11280.1 908.4 908.4
----CUBIC FOOT UOLUNE ABOVE 0.2 FOOT ----CUBIC FOOT UOLUNE ABOVE 0.2 FOOT STUHP----STUHP----ALL TREES ALL TREES tt 4-INCH4-INCH CLASS AND GREATER CLASS AND GREATER
AU.AU. STEHSSTEHS tUWtttSIStttF0R 0 .B..B. TOPS TOPS OF----lttt#tttltt%tOF----lttt#tttltt%tTSO(l0)TSO(l0) SI SI AGE AGE D+CD+C DBH DBH PER BASAL CRPER BASAL CR AU.AU. 0 INCHES 0 INCHES $$ 2 INCHES 2 INCHES :: 3 INCHES3 INCHES
HT.HT. ACREACRE AREAAREA HT.HT. O.B. I.B.O.B. I.B. tt O.B. O.B. I.B. I.B. XX O.B. O.B. 1.B1.B
1200 801200 80 IO 10.4IO 10.4
ARITH. ARITH. HEANHEAN DBH = 1.4 DBH = 1.4 QUADRATIC QUADRATIC NEANNEAN DBH DBH =l.Sl=l.Sl
12233
316 1.7316 1.7 57.857.8187187 4.14.1 69.069.01313 .b 72.272.2
516b.4516b.4
XX SURVIVAL= 100.0 SURVIVAL= 100.0
6 . 0 12.8 5.912.8 5.911.811.8 36.7 20.520.5i4.8i4.8 b.4 3.9b.4 3.9
- - - - - -- - - - - -55.955.9 30.2 30.2
UEIBULL PARAHETERS A = UEIBULL PARAHETERS A = .S'i.S'i B = B = .98.98 c c =1.88=1.88
HEANHEAN CROUN RATIO = 61.7 CROUN RATIO = 61.7
2525
----CUBIC FOOT ----CUBIC FOOT UOLUHEUOLUHE ABOVE 0.2 FOOT STUMP---- ABOVE 0.2 FOOT STUMP----AU.AU. STEMSSTEMS tStStttStStt:tFORtStStttStStt:tFOR 0.B0.B TOPS TOPS OF----SXttSttSStttMOF----SXttSttSStttM
TSO(iO)TSO(iO) SISI AGE AGE D+CD+C DBH DBH PER BASAL CRPER BASAL CR AU.AU. 0 INCHES0 INCHES LL 2 INCHES 2 INCHES tt 3 INCHES3 INCHESHT.HT. hCREhCRE AREAAREA HT.HT. O.B.O.B. I.B. I.B. tt O.B.O.B. I.B.I.B. tt 0.B0.B I I EE
i200i200 8080 1515 28.4 28.4
ARITH. ARITH. HEANHEAN DBH = 2.6 DBH = 2.6
194194 i.Li.L 29.429.4 6.06.0 7.8 3.67.8 3.641i41i 9.09.0 bi.5bi.5 ib.3ib.3 106.6 6i.i106.6 6i.i330330 ib.2ib.2 68.568.5 22 822 8 237.9 150.3237.9 150.3157157 13.713.7 7i.57i.5 26 .9 223.3 223.3 149.2149.24949 6.76.7 73.273.2 29.729.7 1iS.b1iS.b 80.2 80.21010 2.02.0 74.374.3 31.831.8 35.3 25.235.3 25.222 .s.s 75.075.0 33.333.3 9.8 7.29.8 7.2
- z- z 49.149.1 -- 736.3 476.8-- 736.3 476.8
GWDRATICGWDRATIC MEANMEAN DBH DBH =2.79=2.79 UEIBUtLUEIBUtL PARMETERS PARMETERS a= .55 B B =2.27=2.27 cc =I=I 94 94
22 SURVIVAL= 99.7 SURVIVAL= 99.7 NEANNEAN CROUN CROUN RhTIORhTIO q 60 I
211211 4 4 140140 77 174.9174.9 114114 7 71'12.31'12.3 77 77 88 ioiioi bb b9.9b9.934.734.7 24.724.7 32.732.7 23 23 229.79.7 7.17.1 9.49.4 68
- - _I_- -_.- . _ -._368.1368.1 250.3250.3 318318 6 6 ii4 ii4 66
----CUBIC FOOT VOLUME ABOVE 0.2 FOOT ----CUBIC FOOT VOLUME ABOVE 0.2 FOOT STUHP----STUHP----ALL TREESALL TREES $$ 4-INCH CLASS 4-INCH CLASS ANDAND GREATERGREATER
AU.AU. STEMSSTEMS ttlMStttSttttF0RttlMStttSttttF0R 0.B0.B TOPS TOPS OF----ttttttttStXXttOF----ttttttttStXXttTSO(iO)TSO(iO) SISI AGE AGE D+CD+C DBH DBH PER BASAL CRPER BASAL CR AV.AV. 0 INCHES 0 INCHES tt 2 INCHES 2 INCHES tt 3 INCHES3 INCHES
HT.HT. ACREACRE AREIAREI HT.HT. O.B.O.B. I.B.I.B. tt O.B. O.B. I.B.I.B. tt 0.B0.B 1.B1.B
1200 801200 80 20 20 41.6
ARITH. ARITH. DEANDEAN DBH DBH == 3.3 3.3 QUADRATIC QUADRATIC HEANHEAN DBH DBH =3.65=3.65 YEIBULL YEIBULL PARMETERSPARMETERS
108108274274386386238238i4ii4i66662525
::
.6 10 06 . 0 32.632.6
f5.0f5.0 40.140.120.820.8 43.543.519.219.2 45.445.4I3.0I3.0 46 .76.76.7 47.647.62.82.8 48.348.3
.9.9 48.848.8
ei.9ei.9
XX SURVIVAL= SURVIVAL= 98.098.0 HEANHEAN CROUN RATIO = CROUN RATIO =
9.89.824.424.433.133.138.538.542.242.244.944.946 .848.448.449 .6
6 . 0 2.9ioi.4ioi.4 60.260.2310.3 201.8310.3 201.8472.0 472.0 323.64bi.3 3 2 7 . 63 2 7 . 6321.7 234.5321.7 234.5i69.7 126.2i69.7 126.272.172.1 54.554.523.123.1 17.717.7
- -- -1937.4 1349.01937.4 1349.0
455.2455.2452.5452.53iB.O3iB.O168.4168.47i.77i.723.023.0
1488.81488.8
AA = = .55.55
37.537.5
311.3311.3 401.7401.7 272 i272 i32i.032i.0 424.0424.0 299 4299 423i.623i.6 306.i306.i 222 5222 5525.2525.2 ib4.4ib4.4 122122 0054 254 2 70 70 55 53.353.31717 bb 22.722.7 i7i7 4 4
- -- - -- - -- -IOb0.9IOb0.9 1389 41389 4 986 7986 7
RR =3.13=3.13 c c =1.95=1.95
2626

----CUBIC FOOT ----CUBIC FOOT VOLUHEVOLUHE ABOVE 0.2 FOOT ABOVE 0.2 FOOT STUHP----STUHP----AU.AU. STEMSSTEMS StStttttltttS#ORStStttttltttS#OR O.B. O.B. TWSTWS OF----SSlttttLtWWOF----SSlttttLtWW
TSO(iO)TSO(iO) SISI AGE AGE D+CD+C DBHDBH PER BASAL CRPER BASAL CR AU.AU. 0 INCHES 0 INCHES tt 2 INCHES 2 INCHES $$ 3 INCHES3 INCHESHT.HT. ACREACRE AREA HT.HT. O.B.O.B. I.B.I.B. $$ O.B. O.B. I.B.I.B. II O.B. O.B. I.B.I.B.
is00is00 SOSO 1010 10.4 10.4
.
1 360 2.0360 2.0 5.75.722 210210 4.6 68 .533 ibib .8.8 7i.97i.9
5Bb7.35Bb7.3
ARITH. ARITH. HEANHEAN DBH = DBH = i.4i.4 QUADRATIC QUADRATIC HEANHEAN DBH DBH d.51d.51
XX SURVIVAL= SURVIVAL= 100.0100.0
5.95.9 14.4 6.614.4 6.6ii.8ii.8 41.0 22.841.0 22.814.814.8 7.8 4.87.8 4.8
- - - - - -- - - - - -63.3 34.263.3 34.2
UEIBULL PARAHETERS A UEIBULL PARAHETERS A == .55.55 B B == .98.98 C C =I.85=I.85
HEANHEAN CROUN RATIO = CROUN RATIO = 60.860.8
----CUBIC FOOT VOLUME ABOVE 0.2 FOOT ----CUBIC FOOT VOLUME ABOVE 0.2 FOOT STUHP----STUHP----ALL TREESALL TREES tt 4-INCH4-INCH CLASS AND GREATER CLASS AND GREATER
AU.AU. STEMSSTEMS ttSSSltXtLtSt&FORttSSSltXtLtSt&FOR O.B. TOPS O.B. TOPS OF----:SLtStStlStttSOF----:SLtStStlStttSTSO(IO)TSO(IO) SI SI AGE AGE D+CD+C DBHDBH PER BASAL CRPER BASAL CR AU.AU. 0 INCHES 0 INCHES tt 2 INCHES 2 INCHES 88 3 INCHES3 INCHES
HT.HT. ACREACRE AREAAREA HT.HT. O.B. O.B. I.B. t O.B. I.B. t O.B. I.B.
i 210 i.1 25.7 6.46.4 8.8 8.8 4.12 565 12.3 59.7 i b . 8 iso.iso. 86.5 86.533 444444 21.821.8 67 .1 23.2 325.9 206.24 isa i3.8 70.3 27.3 2 2 7 . 8 152.55 20 3.8 72.0 30.1 66.8 46.4b 2 .4 73.i 32.1 7.1 5.1
1407 5 3 . 5 -- 78b.9 500.7
ARITH. ARITH. HEANHEAN DBH = 2.5 DBH = 2.5 QUADRATIC QUADRATIC HEANHEAN DBH DBH =2.63=2.63 UEIBULL UEIBULL PARAIIETERSPARAIIETERS
XX SURVIVAL= SURVIVAL= 99.299.2 WEAN WEAN CROUNCROUN RATIO = RATIO =
21S.9 143.8 i79 .2 i i 7 . 764.9 45.0 58.8 40.57.0 5.0 6.6 4.74.7
- -- -287.8 i93.8287.8 i93.8 -iirb-iiz-iirb-iiz
A = .ss B B =2.ib=2.ib C C =2.23
50.4
27
----CUBIC FOOT FOOT VOLUMEVOLUME ABOVE 0.2 FOOT ABOVE 0.2 FOOT STUtlP----STUtlP----AU.AU. STEMSSTEMS SSSttLZttLttttFORSSSttLZttLttttFOR O.B. TOPS O.B. TOPS OF----SStltlXL%ttMYOF----SStltlXL%ttMY
TSO(iO)TSO(iO) SXSX ACE ACE D*CD*C DBH DBH PER BASAL CRPER BASAL CR AU.AU. 00 INCHES INCHES II 2 2 INCHESINCHES 3 3 lNCHESHT.HT. ACREACRE AREAAREA HT.HT. O.B.O.B. I.B. 1: O.B. 1.B. : 0.B 1.h.
iSO0 80 20 4i.b
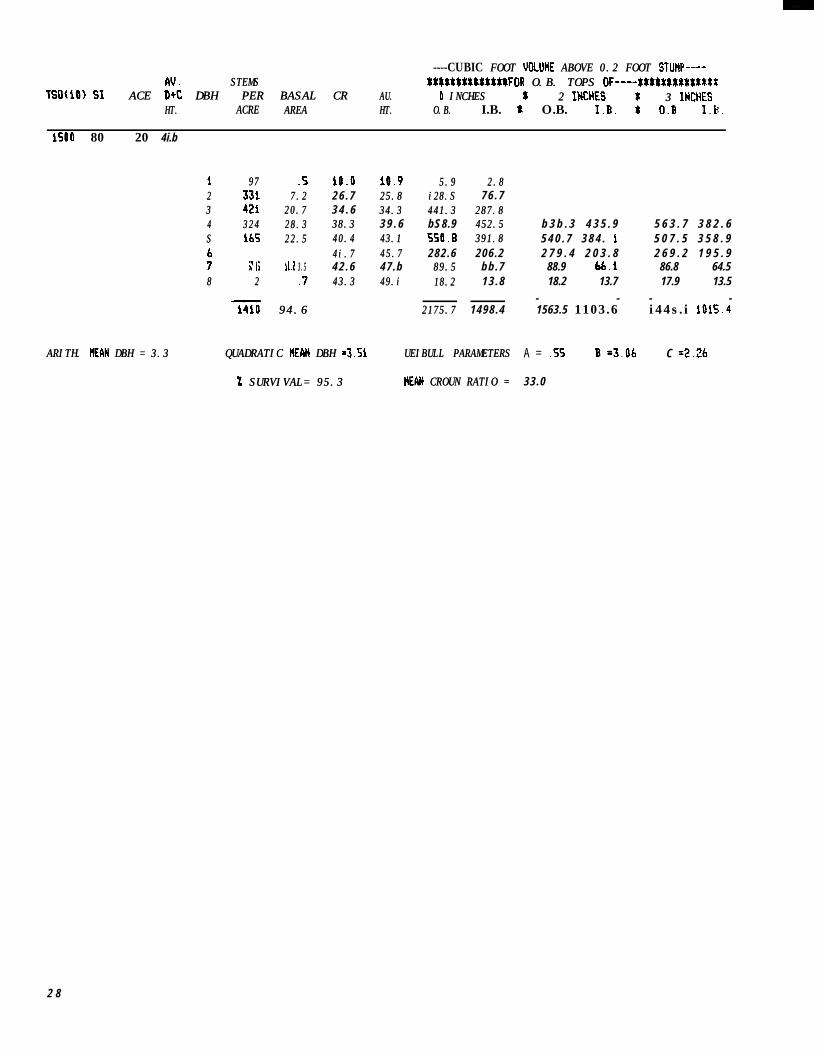
i 9797 .5.522 33i33i 7.27.233 421421 20.720.744 324324 28.328.3SS ibS 22.522.5
7676 5757 1313 ii.2ii.2 3.5 3.588 22 .7.7
14101410 94.694.6
10.0 10.910.9 5.95.9 2.82.826 .7 25.825.8 i28.Si28.S 76 .73 4 . 6 34.334.3 441.3441.3 287.8287.838.338.3 3 9 . 6 bS8.9 452.5452.540.440.4 43.143.1 550.8550.8 391.8391.84i.74i.7 45.745.7 282.6 206.242 .6 47.b 89.589.5 bb.743.343.3 49.i49.i 18.218.2 13 .8
ARITH. ARITH. HEANHEAN DBH = 3.3 DBH = 3.3 QUADRATIC QUADRATIC HEANHEAN DBH DBH =3.51=3.51
XX SURVIVAL= 95.3 SURVIVAL= 95.3
2175.72175.7 1498.4
UEIBULL PARAMETERSUEIBULL PARAMETERS
HEANHEAN CROUN RATIO = CROUN RATIO =
b 3 b . 3 4 3 5 . 9 5 6 3 . 7 3 8 2 . 65 4 0 . 7 3 8 4 . i 5 0 7 . 5 3 5 8 . 92 7 9 . 4 2 0 3 . 8 2 6 9 . 2 1 9 5 . 9
88.9 bb.i 86.8 64.518.2 13.7 17.9 13.5
- - - -1563.5 1103.6 i 4 4 s . i 1015.4
A = .ss B =3.0b C =2,26
33.0
2 8

Farrar, Robert M., Jr. 1985. Predicting stand and stock tablesfrom a spacing study in naturally regenerated longleaf pine.U.S. Dep. Agric. For. Serv. Res. Pap. SO-219, 28 p. South.For. Exp. Stn., New Orleans, LA.
Paper outlines a prediction system developed to calculatestand and stock tables for stands of natural longleaf pine 10to 20 years old. The system also provides entry to other standvolume prediction and projection systems that usually startat age 20.
Additional keywords: Pinus palustrus; volume prediction;volume yields; crown ratio, survival prediction.
,lJ.S.GOVERNMENT~GOFFlCE:1985 -659 -080/-080/ 40009 40009 REGlONNO.4.- _ _ _