Embed Size (px)
Citation preview
Unit 7: Introduction to Functions
Section 7.1: Relations and Functions
Section 7.2: Function Notation
Section 7.3: Domain and Range
Section 7.4: Practical Domain and Range
Section 7.5: Applications
KEY TERMS AND CONCEPTS
Look for the following terms and concepts as you work through the Media Lesson. In the
space below, explain the meaning of each of these concepts and terms in your own words.
Provide examples that are not identical to those in the Media Lesson.
Relation
Function
Vertical Line Test
Dependent Variable
Independent Variable

Behavior of Functions
Function Notation
Compare:
Find f(4)
Find x when f(x) = 4
Domain
Range
Practical Domain
Practical Range

Unit 7: Media Lesson
Section 7.1: Relations and Functions
Definitions
A RELATION is any set of ordered pairs.
A FUNCTION is a relation in which every input value is paired with exactly one output value
Table of Values
One way to represent the relationship between the input and output variables in a relation or
function is by means of a table of values.
Example 1: Which of the following tables represent functions?
Input Output Input Output Input Output
1
2
3
4
5
5
5
5
1
2
3
3
8
–9
7
12
2
1
4
–3
4
–5
10
–87
Yes
No
Yes
No
Yes
No
Ordered Pairs
A relations and functions can also be represented as a set of points or ordered pairs.
Example 2: Which of the following sets of ordered pairs represent functions?
A = {(0, –2), (1,4), (–3,3), (5,0)}
B = {(–4,0), (2, –3), (2, –5)}
C = {(–5,1), (2,1), (–3,1), (0,1)}
D = {(3, –4), (3, –2), (0, 1), (2, –1)}
E = {(1,3)}

Unit 7: Introduction to Functions Media Lesson
Example 3: On the graphs below, plot the points for A, B, C, and D from Example 2, then
circle the “problem points”
A B C D
The Vertical Line Test
• If all vertical lines intersect the graph of a relation at no more than one point, the
relation is also a function. One and only one output value exists for each input value.
• If any vertical line intersects the graph of a relation at more than one point, the relation
“fails” the test and is NOT a function. More than one output value exists for some (or
all) input value(s).
Example 4: Use the Vertical Line Test to determine which of the following graphs are
functions.
Behavior of Graphs
Increasing Decreasing Constant

Unit 7: Introduction to Functions Media Lesson
Dependent and Independent Variables
In general, we say that the output depends on the input.
Output variable = Dependent Variable
Input Variable = Independent Variable
If the relation is a function, then we say that the output is a function of the input.
Section 7.1 – You Try
Is it a function? Circle “Yes” or “No” for each of the following.
Yes or No Yes or No Yes or No
Input Output
4 12
6 14
8 14
10 16
(2, –3), (–5, 2), (–3, 1)

Unit 7: Introduction to Functions Media Lesson
Section 7.2: Function Notation: f (input) = output
If a relation is a function, we say that the output is a function of the input.
Function Notation: f (input) = output
Example: If y is a function of x, then we can write f (x) = y.
Example 1: The function V(m) represents value of an investment (in thousands of dollars)
after m months. Explain the meaning of V(36) = 17.4.
Ordered Pairs
Example 2:
Ordered Pair
(input, output)
Function Notation
f (input) = output
(2, 3) f (2) = 3
(–4, 6) f ( ____ ) = _____
( _____ , _____ ) f (5) = –1
Example 3: Consider the function: f = {(2, –4), (5, 7), (8, 0), (11, 23)}
f(5) = _________ f(______) = 0

Unit 7: Introduction to Functions Media Lesson
Table of Values
Example 4: The function B(t) is defined by the table below.
t 1 3 12 18 22 31
B(t) 70 64 50 39 25 18
B(12) = ______________________ B(t) = 18 when t = ____________________
Graph
Example 5: Consider the graph g(x) of shown below
g(2) = _________ g(______) = 2
Ordered pair:___________ Ordered pair:____________
g(0) = _________ g(______) = 1
Ordered pair:___________ Ordered pair:____________

Unit 7: Introduction to Functions Media Lesson
Section 7.2 –You Try
Complete the problems below.
a. Complete the table.
Ordered Pair Function Notation
(8, 1) f ( ____ ) = _____
( _____ , _____ ) f (0) = 11
b. The function k(x) is defined by the following table
x –2 –1 0 1 2 3 4
k(x) 8 2 –9 4 6 1 0
k(2) = _________ k(x) = 1 when x = _______
Ordered Pair: ___________ Ordered Pair: ___________
c. At an ice cream factory, the total cost production is a function of the number of
gallons of ice cream produced. The function C(g), gives the cost, in dollars, to
produce g gallons of ice cream. Explain the meaning of C(580)=126 in terms of
ice cream production.

Unit 7: Introduction to Functions Media Lesson
Section 7.3: Domain and Range
DEFINITIONS
The DOMAIN of a function is the set of all possible values for the input variable.
The RANGE of a function is the set of all possible values for the output variable.
DOMAIN AND RANGE
Example 1: Consider the function below
x –2 0 2 4 6
k(x) 3 –7 11 3 8
Input values ___________________________________
Domain: {___________________________}
Output values:__________________________________
Range: {___________________________}
Example 2: Consider the function: B = {(2, –4), (5, 7), (8, 0), (11, 23)}
Input values ___________________________________
Domain: {___________________________}
Output values:__________________________________
Range: {___________________________}
Example 3: Consider the graph of f(x) shown below
Domain: ______________ ≤ x ≤ _______________
Range: ______________ ≤ f(x) ≤ _______________
f (x)

Unit 7: Introduction to Functions Media Lesson
Example 4: Determine the Domain and Range of each of the following graphs:
A(x) B(x) C(x)
Domain Domain Domain
Range Range Range
SECTION 7.3 – YOU TRY
Determine the Domain and Range of the functions below.
a.
Input Output
4 12
6 12
8 12
10 12
Domain:
Range:
b. The graph of f(x) is shown below
Domain:
Range:

Unit 7: Introduction to Functions Media Lesson
Section 7.4: Practical Domain and Range
Definitions
The Practical Domain of a function is the set of all possible values for the input variable that
make sense in a given situation.
The Practical Range of a function is the set of all possible values for the output variable that
make sense in a given situation.
Example 1: The gas station is currently charging $3.83 per gallon for gas. The cost, C(n),
in dollars, to fill up your car depends on the number of gallons, n, that you pump. Your car’s
tank can hold a maximum of 20 gallons of gas.
a. In this situation, the input variable is ____________________________________.
b. The practical domain of this function is __________________________________.
c. The output variable in this situation is ___________________________________.
d. The practical range of this function is ___________________________________.

Unit 7: Introduction to Functions Media Lesson
Section 7.4 – You Try
The platform for the high dive is 35 feet above the water. A diver jumps from the platform
and lands in the water after 1.5 seconds. The function H(s) represents the height of the diver
after s seconds.
a. In this situation, the input variable is _____________________________________.
b. The practical domain of this function is ___________________________________.
c. The output variable in this situation is ____________________________________.
d. The practical range of this function is ____________________________________.
Unit 7: Introduction to Functions Media Lesson
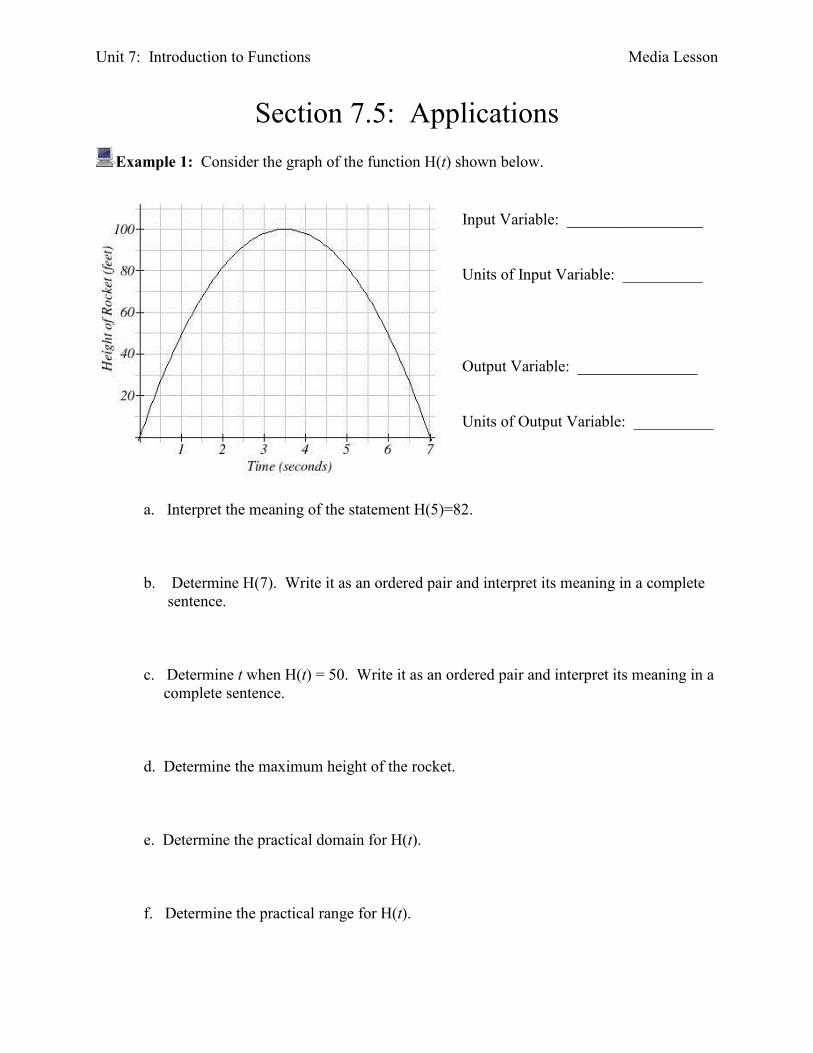
Section 7.5: Applications
Example 1: Consider the graph of the function H(t) shown below.
Input Variable: _________________
Units of Input Variable: __________
Output Variable: _______________
Units of Output Variable: __________
a. Interpret the meaning of the statement H(5)=82.
b. Determine H(7). Write it as an ordered pair and interpret its meaning in a complete
sentence.
c. Determine t when H(t) = 50. Write it as an ordered pair and interpret its meaning in a
complete sentence.
d. Determine the maximum height of the rocket.
e. Determine the practical domain for H(t).
f. Determine the practical range for H(t).

Unit 7: Introduction to Functions Media Lesson
Section 7.5 – You Try
The graph of A(m) below shows the amount of water in a play pool.
Input Variable: _______________________
Units of Input Variable: ________________
Output Variable: _______________________
Units of Output Variable: ________________
a. Interpret the meaning of the statement A(3)=28.
b. Determine A(5). Write it as an ordered pair and interpret its meaning in a complete
sentence.
c. Determine t when A(m) = 0. Write it as an ordered pair and interpret its meaning in a
complete sentence.
d. Describe what is happening to the water in the pool. (Is the pool being filled or
drained?)
e. Determine the practical domain for A(m). Use inequality notation and include units.
f. Determine the practical range for A(m). Use inequality notation and include units.

Unit 7: Practice Problems
Skills Practice
1. Are these functions? Circle yes or no.
Input Output Input Output Input Output
3
7
4
2
12
12
12
12
1
2
3
3
8
–9
7
12
2
1
4
–3
4
–5
10
–87
Yes
No
Yes
No
Yes
No
2. Are these functions? Circle yes or no.
a. {(2, –4), (6, –4), (0, 0), (5, 0)} Yes No
b. {(1, 1), (2, 2), (3, 3), (4, 4)} Yes No
c. {(1, –8), (5, 2), (1, 6), (7, –3)} Yes No
3. Are these functions? Circle yes or no.
Yes No
Yes No
Yes No
4. In the space below, draw a graph that represents a function, and a graph that does NOT
represent a function.
Function
Not a Function
Unit 7: Introduction to Functions Practice Problems
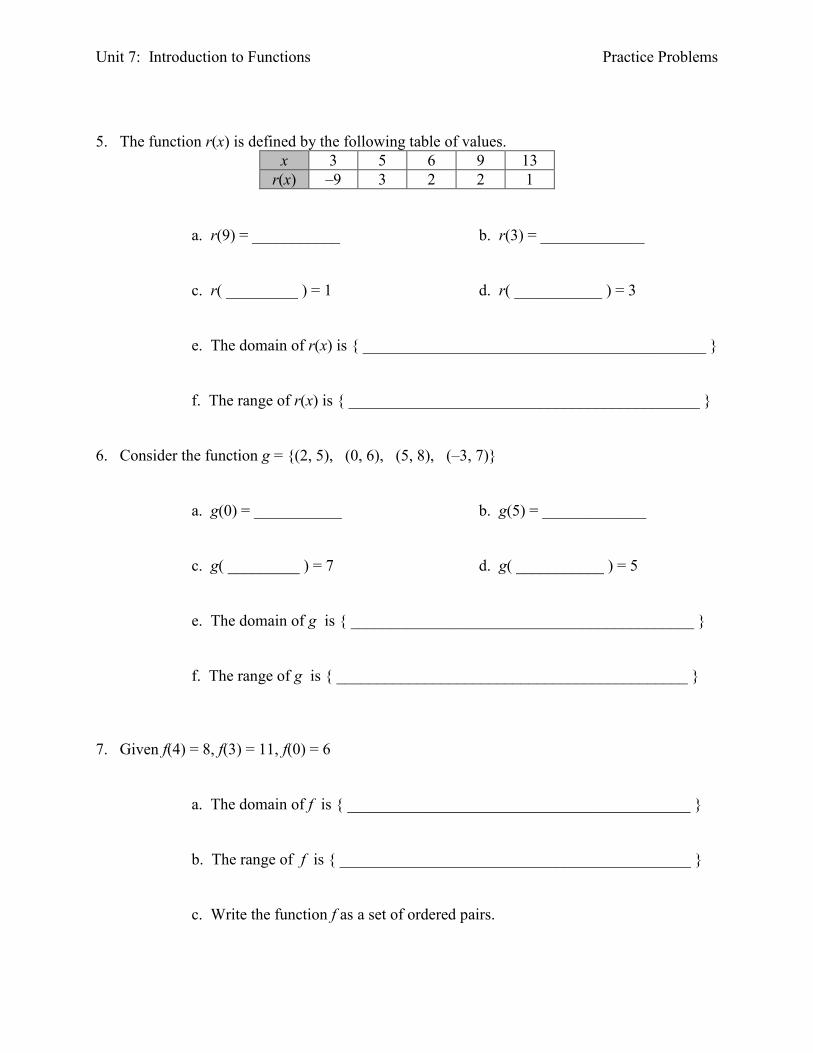
5. The function r(x) is defined by the following table of values.
x 3 5 6 9 13
r(x) –9 3 2 2 1
a. r(9) = ___________ b. r(3) = _____________
c. r( _________ ) = 1 d. r( ___________ ) = 3
e. The domain of r(x) is { ___________________________________________ }
f. The range of r(x) is { ____________________________________________ }
6. Consider the function g = {(2, 5), (0, 6), (5, 8), (–3, 7)}
a. g(0) = ___________ b. g(5) = _____________
c. g( _________ ) = 7 d. g( ___________ ) = 5
e. The domain of g is { ___________________________________________ }
f. The range of g is { ____________________________________________ }
7. Given f(4) = 8, f(3) = 11, f(0) = 6
a. The domain of f is { ___________________________________________ }
b. The range of f is { ____________________________________________ }
c. Write the function f as a set of ordered pairs.

Unit 7: Introduction to Functions Practice Problems
8. The graph of g(r) is given below.
a. Domain: _______________________
b. Range _______________________
c. g(–3) = _________
d. g(0) = _________
e. g(r) = 4 when r =__________
f. g(r) = 0 when r =__________
9. The graph of A(m) is given below.
a. Domain: _______________________
b. Range _______________________
c. A(-4) = _________
d. A(0) = _________
e. A(m) = -2 when m =__________
f. A(m) = 0 when m =__________
10. The graph of p(t) is given below.
a. Domain: _______________________
b. Range _______________________
c. p (–1) = _________
d. p(0) = _________
e. p (t) = –5 when t =__________
f. p (t) = 3 when t =__________________

Unit 7: Introduction to Functions Practice Problems
11. The graph of f(n) is given below.
a. Domain: _______________________
b. Range _______________________
c. f (–5) = _________
d. f (n) = 0 when n =__________
12. The graph of r(x) is given below.
a. Domain: _______________________
b. Range _______________________
c. r(–10) = _________
d. r(x) = 300 when x =__________

Unit 7: Introduction to Functions Practice Problems
Applications
13. A rock is dropped from the top of a building. The function H(t) gives the height (measured
in meters) of the rock after t seconds. In a complete sentence, explain the meaning of the
statement H(2) = 35. Your answer must include correct units.
14. The function P(n) represents a computer manufacturer’s profit, in dollars, when n computers
are sold. In a complete sentence, explain the meaning of the statement P(40) = 1680. Your
answer must include correct units.
15. The function E(t) gives the surface elevation (in feet above sea level) of Lake Powell t years
after 1999. In a complete sentence, explain the meaning of the statement E(5) = 3675. Your
answer must include correct units.
16. The function V(n) gives the value, in thousands of dollars, of an investment after n months.
In a complete sentence, explain the meaning of the statement V(24) = 18. Your answer
must include correct units.
17. The function P(t) can be used to approximate the population of a town, in thousands of
people, t years after 1980. In a complete sentence, explain the meaning of the statement
P(31) = 52. Your answer must include correct units.

Unit 7: Introduction to Functions Practice Problems
18. A candy company has a machine that produces candy canes. The table below is a partial list
of the relationship between the number of minutes the machine is operating and the number
of candy canes produced by the machine during that time period.
Minutes t 3 5 8 12 15
Candy Canes C(t) 12 20 32 48 60
a. Include units. C(12) = ________________________________
b. In a complete sentence and including all appropriate units, explain the meaning of your
answer in part a.
c. Include units. C(t) = 12 when t = ________________________________
d. In a complete sentence and including all appropriate units, explain the meaning of your
answer in part c.
e. This function is (circle one) increasing decreasing
f. Construct a properly scaled and labeled graph C(t).

Unit 7: Introduction to Functions Practice Problems
19. The function D(t) is shown below.
a. Determine D(0) and interpret its meaning in a complete sentence.
b. Determine D(8) and interpret its meaning in a complete sentence.
c. For what value of t is D(t) = 3? Write a sentence explaining the meaning of your
answer.
d. For what value of t is D(t) = 0? Write a sentence explaining the meaning of your
answer.
e. Determine the practical domain of D(t).
f. Determine the practical range of D(t).

Unit 7: Introduction to Functions Practice Problems
20. The graph of the function C(n) below shows the number of calories burned after riding a
stationary bike for n minutes.
a. Is this function increasing or decreasing? ___________________________________
b. Interpret the meaning of the statement C(8) = 32.
c. Determine C(10) and interpret its meaning in a complete sentence.
d. For what value of n is C(n) = 80? Write a sentence explaining the meaning of your
answer.

Unit 7: Introduction to Functions Practice Problems
Extension
21. Sort the following terms into the two groups below.
Dependent Variable
Domain
Horizontal Axis
Independent variable
Range
Vertical Axis
Input Output
22. In a relation, we say that the output depends on the input. If the relation is a function, then
we say that the output is a function of the input. For each of the following, identify the input
variable and the output variable, and then determine if the relation is a function.
a. Is the outside temperature in Tempe, AZ a function of the time of day?
Input Variable: _____________________________________________
Output Variable: ____________________________________________
Function? Yes No
b. Is your letter grade a function of your numerical grade in the class?
Input Variable: _____________________________________________
Output Variable: ____________________________________________
Function? Yes No
c. Is your numerical grade a function of your letter grade?
Input Variable: _____________________________________________
Output Variable: ____________________________________________
Function? Yes No

Unit 7: Introduction to Functions Practice Problems
23. Determine the domain and range of each of the graphs shown below. Use correct notation.
Domain: _______________________
Range: ________________________
Domain: _______________________
Range: ________________________
Domain: _______________________
Range: ________________________
Domain: _______________________
Range: ________________________

Unit 7: Review
1. In the space below, draw a graph that represents an increasing function, a constant function,
and a graph that does NOT represent a function.
Increasing Function
Constant Function
Not a Function
2. The graph of f(x) is given below. Use interval notation for the domain and range.
a) Domain: ______________
b) Range _____________
c) f (0) = ______
d) f (x) = 0 when x =_______
3. Consider the following table of values. Fill in the blanks below, and identify the corresponding
ordered pairs.
x –2 –1 0 1 2 3 4
g(x) 1 4 8 6 5 0 2
g(1) = _______ g(x) = 1 when x = ________
Ordered pair: ______________ Ordered Pair: ______________

Unit 7: Introduction to Functions Review
4. The function D(t) shown below represents Sally’s distance from home over a 30-minute time
period.
a. Identify the vertical intercept of D(t). Write it as an ordered pair and explain its
meaning in this situation.
b. Identify the horizontal intercepts of D(t). Write them as an ordered pairs and explain
their meaning in this situation.
c. Determine D(15) and interpret its meaning in a complete sentence.
d. For what value of t is D(t) = 5? Write a sentence explaining the meaning of your
answer.
e. Determine the practical domain of D(t). ____________________________________
f. Determine the practical range of D(t). _____________________________________