Embed Size (px)
Citation preview

1
Professional Development Programme on Enriching Knowledge of the Business, Accounting and Financial Studies (BAFS) Curriculum
Technology Education Section, Curriculum Development InstituteEducation Bureau, HKSARG
August 2008
Unit 4 : Financial Analysis
Course 1 : Contemporary Perspectives on Accounting
2Unit 4Department of Business Administration
Professional Development Programme (BAFS)Hong Kong Institute of Vocational Education (Chai Wan)
2
Learning objectives
On completion of this unit, you should be able to:
1. Understand different kinds of financial analysis, including horizontal analysis, vertical analysis, trend analysis and ratio analysis;
2. Calculate commonly used ratios relating to a company’s profitability, liquidity, solvency, management efficiency and return on investment;
3. Interpret and evaluate the ratios; and
4. Explain the limitations of ratios in financial analysis.

3Unit 4Department of Business Administration
Professional Development Programme (BAFS)Hong Kong Institute of Vocational Education (Chai Wan)
3
Organisation of Unit 4
Financial AnalysisObjectives of ratio analysis
Use of ratios in interpretation of financial statements
Profitability ratios Short-term liquidity and
efficiency ratios
Long-term solvency
ratios
Limitations of ratio analysis
Investment ratios
Percentage analysisLearning Resources
Corner
4Unit 4Department of Business Administration
Professional Development Programme (BAFS)Hong Kong Institute of Vocational Education (Chai Wan)
4
1. Introduction (1)
One purpose of financial statement analysis is to use the PAST PERFORMANCE of a company to PREDICT its future profitability and cash flows.
Another purpose is to EVALUATE the performance of a company with an eye toward identifying problem areas.
Financial analysis is the examination of both the relationships among financial statement numbers and the trends in those numbers over time.

5Unit 4Department of Business Administration
Professional Development Programme (BAFS)Hong Kong Institute of Vocational Education (Chai Wan)
5
1. Introduction (2)
Financial statements can be evaluated in different ways. The DuPont Framework (named after a system of ratio analysis developed internally at DUPONT around 1920) provides a systematic approach to identifying general factors causing Return on Equity to deviate from normal.
6Unit 4Department of Business Administration
Professional Development Programme (BAFS)Hong Kong Institute of Vocational Education (Chai Wan)
6
Major Users (1)
Internal users
• Management
• Employee
How about external users?

7Unit 4Department of Business Administration
Professional Development Programme (BAFS)Hong Kong Institute of Vocational Education (Chai Wan)
7
Major Users (2)
External users
• Shareholders
• Prospective investors
• Suppliers
• Bankers
• Customers
• Debenture holders
• Inland Revenue
8Unit 4Department of Business Administration
Professional Development Programme (BAFS)Hong Kong Institute of Vocational Education (Chai Wan)
8
2. Objectives of ratio analysis
Evaluate the current performance Evaluate the current performance and financial position of the and financial position of the companycompany
e.g. profitability, gearing
Make predictionsMake predictions
e.g. profits and dividends prospects
Evaluate the relative Evaluate the relative performance of a company performance of a company
e.g. trend analysis, industry analysis

9Unit 4Department of Business Administration
Professional Development Programme (BAFS)Hong Kong Institute of Vocational Education (Chai Wan)
9
3. Classification of ratios
Profitability ratios
Short-term liquidity and efficiency ratios
Long-term solvency ratios
Investment ratios
Professional Development Programme on Enriching Knowledge of the Business, Accounting and Financial Studies (BAFS) Curriculum
4. Profitability ratios

11Unit 4Department of Business Administration
Professional Development Programme (BAFS)Hong Kong Institute of Vocational Education (Chai Wan)
11
4. Profitability ratios (1)
Management: avoid companies with poor profit and return on investment
Investors: avoid poor earning potential companies
Bankers: avoid lending to companies with low profitability
Profitability ratios are used to assess the company’s performance and its efficiency of operation. These ratios show the relationship between profit and resources employed in the operation.
12Unit 4Department of Business Administration
Professional Development Programme (BAFS)Hong Kong Institute of Vocational Education (Chai Wan)
12
4. Profitability ratios (2)
The following are the commonly used ratios to assess the effectiveness and efficiency of a company in generating profit:
1) Gross profit ratio (Chick here for detail explanation)
2) Net profit ratio (Chick here for detail explanation)
3) Return on owners’ equity (before tax) (Chick here for detail explanation)
4) Return on capital employed (before tax) (Chick here for detail explanation)
Go back to organisation of unit 45) Assets turnover (Chick here for detail explanation)

13Unit 4Department of Business Administration
Professional Development Programme (BAFS)Hong Kong Institute of Vocational Education (Chai Wan)
13
4. Profitability ratios (3)
(a) Gross profit ratio (Gross profit margin)
Indicate how much profit is earned out of sales before operating costs
Measure the company’s ability to increase sales price and decrease cost of goods sold
Salesx 100%
Gross profit
Example – Click here Go back to section menu
14Unit 4Department of Business Administration
Professional Development Programme (BAFS)Hong Kong Institute of Vocational Education (Chai Wan)
14
Popcon Limited
Income statements for the year ended 31 December
1,1221,320
132
30
330
30
Other operating expenses
Debenture interest
600660Administrative expenses
360300Distribution costs
ExpensesLess:
1,9202,160Gross profit
4,0803,600Cost of goods sold
6,0005,760Sales
$’000$’000
Year 2Year 1
4. Profitability ratios (4)
Next page
15Unit 4Department of Business Administration
Professional Development Programme (BAFS)Hong Kong Institute of Vocational Education (Chai Wan)
15
4. Profitability ratios (5)
Click here for some hints Click here for suggested answer
Self-test 1
Now! Try to calculate the Gross profit ratio (Gross profit margin)
16Unit 4Department of Business Administration
Professional Development Programme (BAFS)Hong Kong Institute of Vocational Education (Chai Wan)
16
4. Profitability ratios (6)
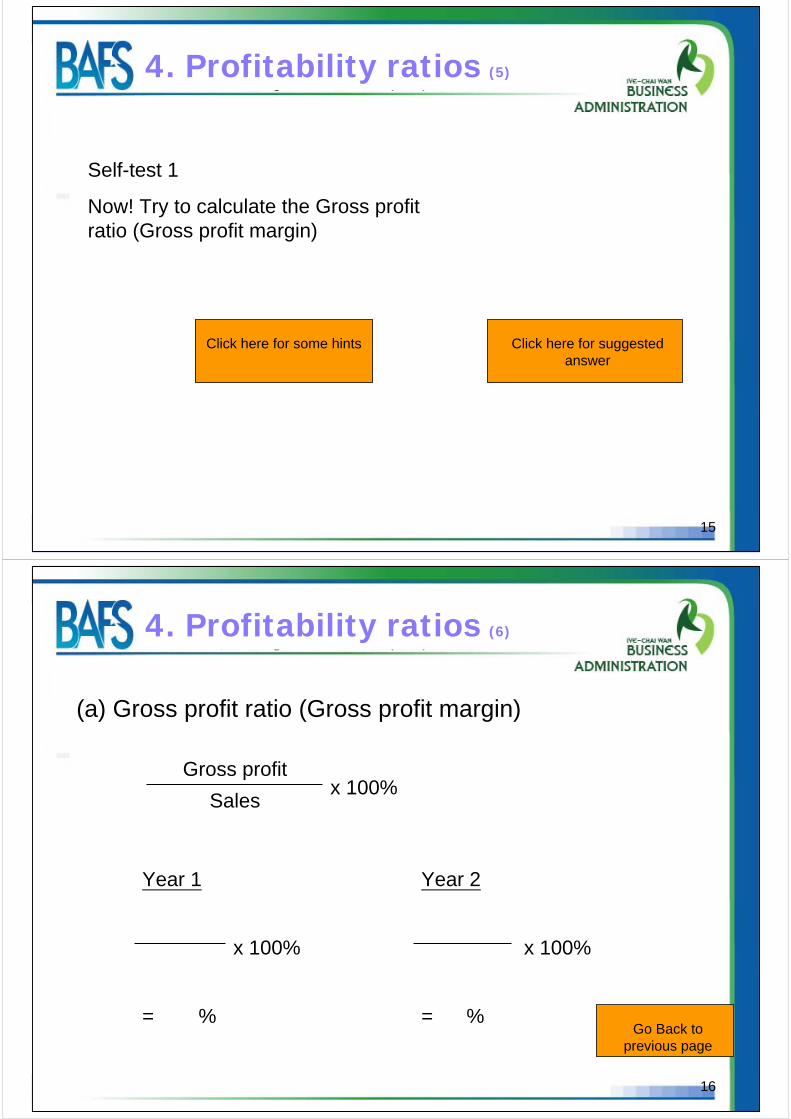
(a) Gross profit ratio (Gross profit margin)
Salesx 100%
Gross profit
Year 2Year 1
= %= %
x 100%x 100%
Go Back to previous page

17Unit 4Department of Business Administration
Professional Development Programme (BAFS)Hong Kong Institute of Vocational Education (Chai Wan)
17
4. Profitability ratios (7)
(a) Gross profit ratio (Gross profit margin)
Salesx 100%
Gross profit
6,0005,760
Year 2Year 1
= 32.0%= 37.5%
x 100%1,920
x 100%2,160
What’s your comment?
18Unit 4Department of Business Administration
Professional Development Programme (BAFS)Hong Kong Institute of Vocational Education (Chai Wan)
18
4. Profitability ratios (8)
(a) Gross profit ratio (Gross profit margin)
Salesx 100%
Gross profit
6,0005,760
Year 2Year 1
= 32.0%= 37.5%
x 100%1,920
x 100%2,160
The higher ratio in Year 1 indicates that the company’s ability to increase selling price and reduce cost of goods sold is better in Year 1 than in Year 2. Accordingly, the performance in Year 1 is better than in Year 2.
Next ratio

19Unit 4Department of Business Administration
Professional Development Programme (BAFS)Hong Kong Institute of Vocational Education (Chai Wan)
19
4. Profitability ratios (9)
(b) Net profit ratio (Net profit margin)
Indicate the profitability generated from sales
Low operating costs -> high ratio
High ratio -> efficient cost control
Generally use profit before tax (PBT)
Use profit before interest and tax (PBIT) -> useful for bankers and lenders
Salesx 100%
Net profit
Example – Click here Go back to section menu
20Unit 4Department of Business Administration
Professional Development Programme (BAFS)Hong Kong Institute of Vocational Education (Chai Wan)
20
Popcon Limited
Income statements for the year ended 31 December
1,1221,320
132
30
330
30
Other operating expenses
Debenture interest
600660Administrative expenses
360300Distribution costs
ExpensesLess:
1,9202,160Gross profit
4,0803,600Cost of goods sold
6,0005,760Sales
$’000$’000
Year 2Year 1
4. Profitability ratios (10)
Next page

21Unit 4Department of Business Administration
Professional Development Programme (BAFS)Hong Kong Institute of Vocational Education (Chai Wan)
21
Popcon Limited
Income statements for the year ended 31 December
684720Profit after tax
114120Tax
798840Profit before tax
540576Retained profit for the year
144144Dividend paid
Bal c/f
$’000$’000
Year 2Year 1
4. Profitability ratios (11)
Next page
22Unit 4Department of Business Administration
Professional Development Programme (BAFS)Hong Kong Institute of Vocational Education (Chai Wan)
22
4. Profitability ratios (12)
Click here for some hints Click here for suggested answer
Self-test 2
Now! Try to calculate the Net profit ratio (before interest and tax)

23Unit 4Department of Business Administration
Professional Development Programme (BAFS)Hong Kong Institute of Vocational Education (Chai Wan)
23
4. Profitability ratios (13)
(b) Net profit ratio (before interest and tax)
Salesx 100%
Profit before interest and tax
Year 2Year 1
= %= %
X 100%X 100%
Go Back to previous page
24Unit 4Department of Business Administration
Professional Development Programme (BAFS)Hong Kong Institute of Vocational Education (Chai Wan)
24
4. Profitability ratios (14)
(b) Net profit ratio (before interest and tax)
Salesx 100%
Profit before interest and tax
6,0005,760
Year 2Year 1
= 13.8%= 15.1%
X 100%798 + 30X 100%840 +
30
What’s your comment?

25Unit 4Department of Business Administration
Professional Development Programme (BAFS)Hong Kong Institute of Vocational Education (Chai Wan)
25
4. Profitability ratios (15)
(b) Net profit ratio (before interest and tax)
Salesx 100%
Profit before interest and tax
6,0005,760
Year 2Year 1
= 13.8%= 15.1%
X 100%798 + 30X 100%840 +
30
The higher the ratio, the better is the company’s performance. Accordingly, the performance in Year 1 is better than in Year 2.
Next ratio
26Unit 4Department of Business Administration
Professional Development Programme (BAFS)Hong Kong Institute of Vocational Education (Chai Wan)
26
4. Profitability ratios (16)
(c) Return on owners’ equity (before tax)
Measure profit before tax attributable to ordinary shareholders after deduction of any interest payments
High ratio -> good return to owners
Owners’ equity (ordinary share capital + reserves)
x 100%Profit before tax
Example – Click here Go back to section menu

27Unit 4Department of Business Administration
Professional Development Programme (BAFS)Hong Kong Institute of Vocational Education (Chai Wan)
27
Popcon Limited
Income statements for the year ended 31 December
684720Profit after tax
114120Tax
798840Profit before tax
540576Retained profit for the year
144144Dividend paid
$’000$’000
Year 2Year 1
4. Profitability ratios (17)
Next page
28Unit 4Department of Business Administration
Professional Development Programme (BAFS)Hong Kong Institute of Vocational Education (Chai Wan)
28
Popcon Limited
Balance sheets as at 31 December
1,5601,020Retained profit
Capital and reserves
120120Ordinary share capital, $1.20 each
1,6801,140
1,6801,140Net assets
30030010% Debentures (Year 6)
Long-term liabilities
$’000$’000
Year 2Year 1
4. Profitability ratios (18)
Next page
29Unit 4Department of Business Administration
Professional Development Programme (BAFS)Hong Kong Institute of Vocational Education (Chai Wan)
29
4. Profitability ratios (19)
Click here for some hints Click here for suggested answer
Self-test 3
Now! Try to calculate the Return on owners’ equity (before tax)
30Unit 4Department of Business Administration
Professional Development Programme (BAFS)Hong Kong Institute of Vocational Education (Chai Wan)
30
4. Profitability ratios (20)
(c) Return on owners’ equity (before tax)
Owners’ equity (ordinary share capital + reserves)
x 100%Profit before tax
Year 2Year 1
= %= %
x 100%x 100%
Go Back to previous page

31Unit 4Department of Business Administration
Professional Development Programme (BAFS)Hong Kong Institute of Vocational Education (Chai Wan)
31
4. Profitability ratios (21)
(c) Return on owners’ equity (before tax)
Owners’ equity (ordinary share capital + reserves)
x 100%Profit before tax
1,6801,140
Year 2Year 1
= 47.5%= 73.7%
x 100%798
x 100%840
What’s your comment?
32Unit 4Department of Business Administration
Professional Development Programme (BAFS)Hong Kong Institute of Vocational Education (Chai Wan)
32
4. Profitability ratios (22)
(c) Return on owners’ equity (before tax)
Owners’ equity (ordinary share capital + reserves)
x 100%Profit before tax
1,6801,140
Year 2Year 1
= 47.5%= 73.7%
x 100%798
x 100%840
The higher the ratio, the better is the company’s performance. Accordingly, the performance in Year 1 is better than in Year 2.
Next ratio
33Unit 4Department of Business Administration
Professional Development Programme (BAFS)Hong Kong Institute of Vocational Education (Chai Wan)
33
4. Profitability ratios (23)
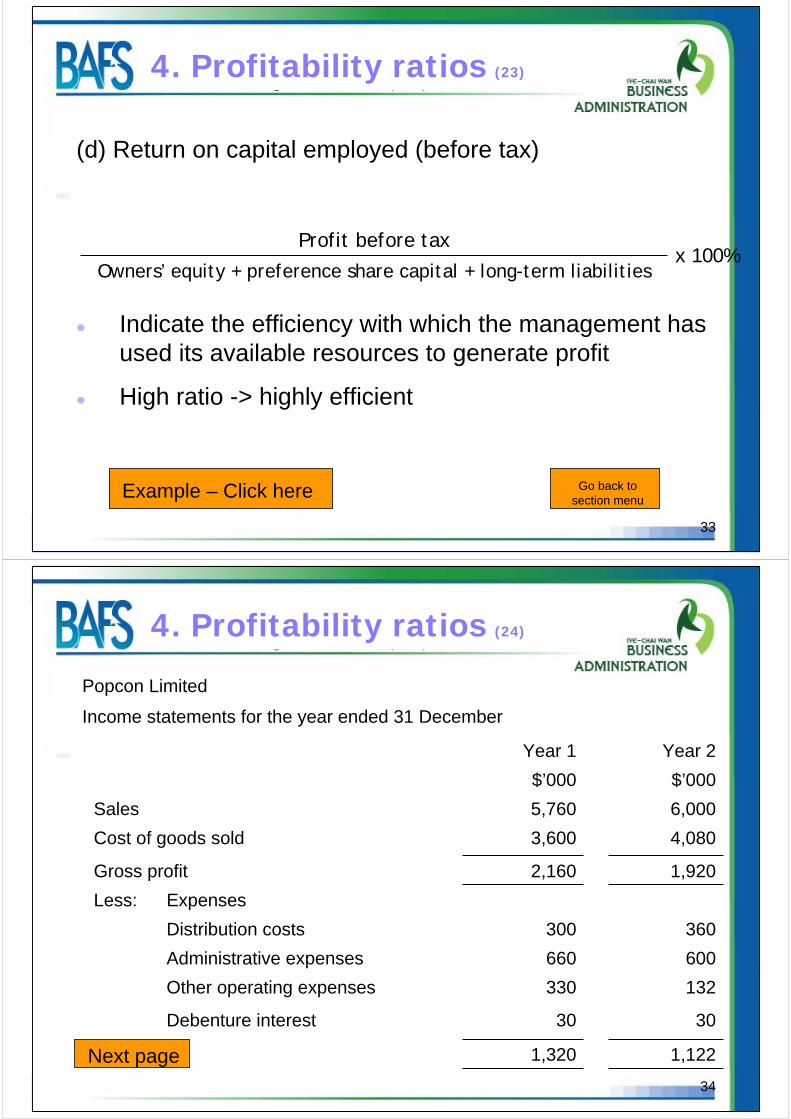
(d) Return on capital employed (before tax)
Indicate the efficiency with which the management has used its available resources to generate profit
High ratio -> highly efficient
Owners’ equity + preference share capital + long-term liabilitiesx 100%
Profit before tax
Example – Click here Go back to section menu
34Unit 4Department of Business Administration
Professional Development Programme (BAFS)Hong Kong Institute of Vocational Education (Chai Wan)
34
Popcon Limited
Income statements for the year ended 31 December
1,1221,320
132
30
330
30
Other operating expenses
Debenture interest
600660Administrative expenses
360300Distribution costs
ExpensesLess:
1,9202,160Gross profit
4,0803,600Cost of goods sold
6,0005,760Sales
$’000$’000
Year 2Year 1
4. Profitability ratios (24)
Next page

35Unit 4Department of Business Administration
Professional Development Programme (BAFS)Hong Kong Institute of Vocational Education (Chai Wan)
35
Popcon Limited
Income statements for the year ended 31 December
684720Profit after tax
114120Tax
798840Profit before tax
540576Retained profit for the year
144144Dividend paid
$’000$’000
Year 2Year 1
4. Profitability ratios (24)
Next page
36Unit 4Department of Business Administration
Professional Development Programme (BAFS)Hong Kong Institute of Vocational Education (Chai Wan)
36
Popcon Limited
Balance sheets as at 31 December
1,5601,020Retained profit
Capital and reserves
120120Ordinary share capital, $1.20 each
1,6801,140
1,6801,140Net assets
30030010% Debentures (Year 6)
Long-term liabilities
$’000$’000
Year 2Year 1
4. Profitability ratios (25)
Next page

37Unit 4Department of Business Administration
Professional Development Programme (BAFS)Hong Kong Institute of Vocational Education (Chai Wan)
37
4. Profitability ratios (26)
Click here for some hints Click here for suggested answer
Self-test 4
Now! Try to calculate the Return on capital employed (before tax)
38Unit 4Department of Business Administration
Professional Development Programme (BAFS)Hong Kong Institute of Vocational Education (Chai Wan)
38
4. Profitability ratios (27)
(d) Return on capital employed (before tax)
Year 2Year 1
= %= %
x 100%x 100%
Owners’ equity + preference share capital + long-term liabilitiesx 100%
Profit before tax
Go Back to previous page

39Unit 4Department of Business Administration
Professional Development Programme (BAFS)Hong Kong Institute of Vocational Education (Chai Wan)
39
4. Profitability ratios (28)
(d) Return on capital employed (before tax)
300 + 1,680300 + 1,140
Year 2Year 1
= 40.3%= 58.3%
x 100%798
x 100%840
Owners’ equity + preference share capital + long-term liabilitiesx 100%
Profit before tax
What’s your comment?
40Unit 4Department of Business Administration
Professional Development Programme (BAFS)Hong Kong Institute of Vocational Education (Chai Wan)
40
4. Profitability ratios (29)
(d) Return on capital employed (before tax)
300 + 1,680300 + 1,140
Year 2Year 1
= 40.3%= 58.3%
x 100%798
x 100%840
Owners’ equity + preference share capital + long-term liabilitiesx 100%
Profit before tax
The higher the ratio, the better is the company’s performance. Accordingly, the performance in Year 1 is better than in Year 2.
Next ratio
41Unit 4Department of Business Administration
Professional Development Programme (BAFS)Hong Kong Institute of Vocational Education (Chai Wan)
41
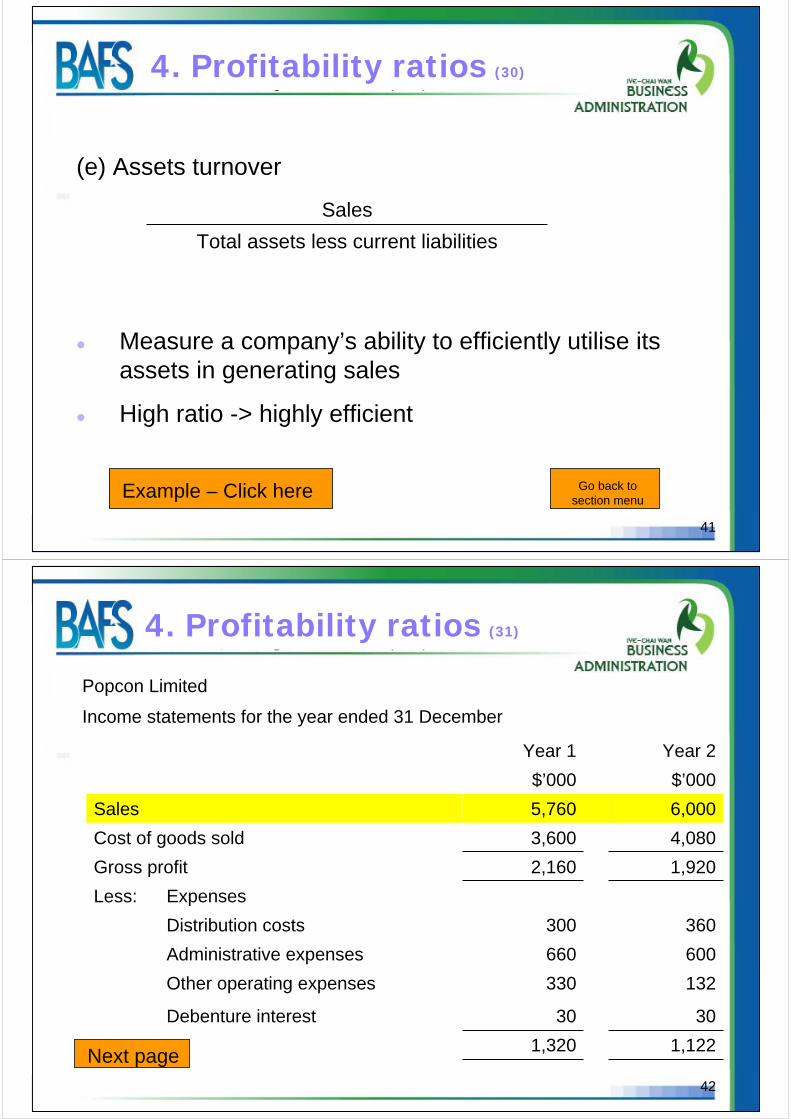
4. Profitability ratios (30)
(e) Assets turnover
Measure a company’s ability to efficiently utilise its assets in generating sales
High ratio -> highly efficient
Total assets less current liabilities
Sales
Example – Click here Go back to section menu
42Unit 4Department of Business Administration
Professional Development Programme (BAFS)Hong Kong Institute of Vocational Education (Chai Wan)
42
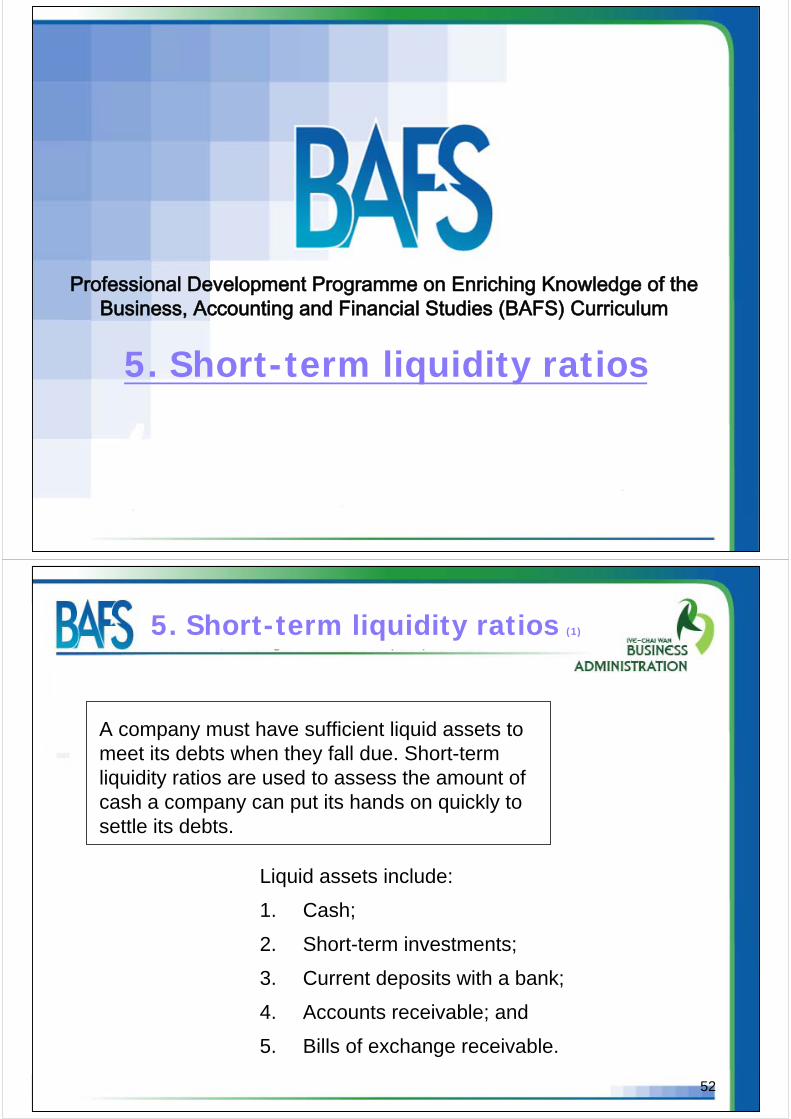
Popcon Limited
Income statements for the year ended 31 December
1,1221,320
132
30
330
30
Other operating expenses
Debenture interest
600660Administrative expenses
360300Distribution costs
ExpensesLess:
1,9202,160Gross profit
4,0803,600Cost of goods sold
6,0005,760Sales
$’000$’000
Year 2Year 1
4. Profitability ratios (31)
Next page

43Unit 4Department of Business Administration
Professional Development Programme (BAFS)Hong Kong Institute of Vocational Education (Chai Wan)
43
Popcon Limited
Balance sheets as at 31 December
2,0401,620Current assets
540360Non-current assets
1,4401,080Net current assets
1,9801,440Total assets less current liabilities
600540Current liabilities
$’000$’000
Year 2Year 1
4. Profitability ratios (32)
Next page
44Unit 4Department of Business Administration
Professional Development Programme (BAFS)Hong Kong Institute of Vocational Education (Chai Wan)
44
4. Profitability ratios (33)
Click here for some hints Click here for suggested answer
Self-test 5
Now! Try to calculate the Assets turnover

45Unit 4Department of Business Administration
Professional Development Programme (BAFS)Hong Kong Institute of Vocational Education (Chai Wan)
45
4. Profitability ratios (34)
(e) Assets turnover
Year 2Year 1
= =
Total assets less current liabilities
Sales
Go Back to previous page
46Unit 4Department of Business Administration
Professional Development Programme (BAFS)Hong Kong Institute of Vocational Education (Chai Wan)
46
4. Profitability ratios (35)
(e) Assets turnover
1,9801,440
Year 2Year 1
= 3.0 times= 4.0 times
6,0005,760
Total assets less current liabilities
Sales
What’s your comment?

47Unit 4Department of Business Administration
Professional Development Programme (BAFS)Hong Kong Institute of Vocational Education (Chai Wan)
47
4. Profitability ratios (36)
(e) Assets turnover
1,9801,440
Year 2Year 1
= 3.0 times= 4.0 times
6,0005,760
Total assets less current liabilities
Sales
The higher the ratio, the better is the company’s performance. Accordingly, the performance in Year 1 is better than in Year 2.
Next section
48Unit 4Department of Business Administration
Professional Development Programme (BAFS)Hong Kong Institute of Vocational Education (Chai Wan)
48
In this section,
Profit may be measured either by Profit before interest and tax and Profit before tax.
Profit before tax is used generally as the numerator in calculating Return on owners’ equity and Return on capital employed.
In calculating profitability ratios, it is suggested that Profit after tax may also be used.
Have you thought about why Profit before interest and taxor Profit before tax is used as the numerator in our calculations?
4. Profitability ratios (37)

49Unit 4Department of Business Administration
Professional Development Programme (BAFS)Hong Kong Institute of Vocational Education (Chai Wan)
49
Profit before interest and tax is the amount of profit which the company earned before having to pay interest to the providers of loan capital and other long-term liabilities. This profit figure is of particular importance to the bankers and lenders.
4. Profitability ratios (38)
50Unit 4Department of Business Administration
Professional Development Programme (BAFS)Hong Kong Institute of Vocational Education (Chai Wan)
50
Profit after tax measures a company’s final return. However, there are often unusual variations in the tax charge (e.g. due to tax planning, loss brought forward) from year to year which would distort the underlying profit figure. Hence, Profit before tax may be considered as a better measure of the profitability of a company’s operations.
4. Profitability ratios (39)
Go back to section menu
Professional Development Programme on Enriching Knowledge of the Business, Accounting and Financial Studies (BAFS) Curriculum
5. Short-term liquidity ratios
52Unit 4Department of Business Administration
Professional Development Programme (BAFS)Hong Kong Institute of Vocational Education (Chai Wan)
52
5. Short-term liquidity ratios (1)
Liquid assets include:
1. Cash;
2. Short-term investments;
3. Current deposits with a bank;
4. Accounts receivable; and
5. Bills of exchange receivable.
A company must have sufficient liquid assets to meet its debts when they fall due. Short-term liquidity ratios are used to assess the amount of cash a company can put its hands on quickly to settle its debts.

53Unit 4Department of Business Administration
Professional Development Programme (BAFS)Hong Kong Institute of Vocational Education (Chai Wan)
53
5. Short-term liquidity ratios (2)
The following are the commonly used ratios to assess the short-term liquidity of a company:
a) Current ratio (Chick here for detail explanation)
b) Liquid ratio (Chick here for detail explanation)
c) Inventory turnover (Chick here for detail explanation)
d) Accounts receivable turnover (Chick here for detail explanation)
e) Accounts payable turnover (Chick here for detail explanation)
Go back to organisation of unit 4
54Unit 4Department of Business Administration
Professional Development Programme (BAFS)Hong Kong Institute of Vocational Education (Chai Wan)
54
5. Short-term liquidity ratios (3)
(a) Current ratio (Working capital ratio)
Measure a company’s ability to meet its current liabilities out of current assets
Low ratio - indicates that the company may not be able to pay off bills as rapidly as it should
High ratio – indicates the money that could be working for the business is tied up in cash saving or other safe funds and has not being utilised
Generally accepted standard: “rule of thumb” – Current assets are about twice of current liabilities, or ratio of 2:1
However, depend on type of business
Be careful about the component of current assets
Current liabilities
Current assets
Example – Click here Go back to section menu

55Unit 4Department of Business Administration
Professional Development Programme (BAFS)Hong Kong Institute of Vocational Education (Chai Wan)
55
Popcon Limited
Balance sheets as at 31 December
540360Property, plant and equipment
2,0401,620
300540Bank balances and cash
1,200720Trade and other receivables
540360Inventory
Current assets
Non-current assets
Assets
$’000$’000
Year 2Year 1
5. Short-term liquidity ratios (4)
Next page
56Unit 4Department of Business Administration
Professional Development Programme (BAFS)Hong Kong Institute of Vocational Education (Chai Wan)
56
Popcon Limited
Balance sheets as at 31 December
1,9801,440
Total assets less current liabilities
1,4401,080Net current assets
600540
114120Current tax payable
486420Trade and other payables
Current liabilities
$’000$’000
Year 2Year 1
5. Short-term liquidity ratios (5)
Next page

57Unit 4Department of Business Administration
Professional Development Programme (BAFS)Hong Kong Institute of Vocational Education (Chai Wan)
57
5. Short-term liquidity ratios (6)
Click here for some hints Click here for suggested answer
Self-test 6
Now! Try to calculate the Current ratio
58Unit 4Department of Business Administration
Professional Development Programme (BAFS)Hong Kong Institute of Vocational Education (Chai Wan)
58
5. Short-term liquidity ratios (7)
(a) Current ratio
Year 2Year 1
= =
Current liabilities
Current assets
Go Back to previous page

59Unit 4Department of Business Administration
Professional Development Programme (BAFS)Hong Kong Institute of Vocational Education (Chai Wan)
59
5. Short-term liquidity ratios (8)
(a) Current ratio
600540
Year 2Year 1
= 3.4= 3.0
2,0401,620
Current liabilities
Current assets
What’s your comment?
60Unit 4Department of Business Administration
Professional Development Programme (BAFS)Hong Kong Institute of Vocational Education (Chai Wan)
60
5. Short-term liquidity ratios (9)
(a) Current ratio
600540
Year 2Year 1
= 3.4= 3.0
2,0401,620
Current liabilities
Current assets
The company’s current assets are adequate to cover the commitments to settle its current liabilities.
However, the ratios for the two years were well above the rule of thumb (1.5-2). It might not be good for the company as a whole.
Next ratio

61Unit 4Department of Business Administration
Professional Development Programme (BAFS)Hong Kong Institute of Vocational Education (Chai Wan)
61
5. Short-term liquidity ratios (10)
(b) Liquid ratio (Quick assets ratio or acid test ratio)
Indicate a company’s ability to meet its immediate commitments
Rule of thumb - 1:1
Again, depend on the type of business
Poor ratio -> a sign of approaching insolvency
Current liabilities
Current assets less inventory
Example – Click here Go back to section menu
62Unit 4Department of Business Administration
Professional Development Programme (BAFS)Hong Kong Institute of Vocational Education (Chai Wan)
62
Popcon Limited
Balance sheets as at 31 December
540360Property, plant and equipment
2,0401,620
300540Bank balances and cash
1,200720Trade and other receivables
540360Inventory
Current assets
Non-current assets
Assets
$’000$’000
Year 2Year 1
5. Short-term liquidity ratios (11)
Next page

63Unit 4Department of Business Administration
Professional Development Programme (BAFS)Hong Kong Institute of Vocational Education (Chai Wan)
63
Popcon Limited
Balance sheets as at 31 December
1,9801,440Total assets less current liabilities
1,4401,080Net current assets
600540
114120Current tax payable
486420Trade and other payables
Current liabilities
$’000$’000
Year 2Year 1
5. Short-term liquidity ratios (12)
Next page
64Unit 4Department of Business Administration
Professional Development Programme (BAFS)Hong Kong Institute of Vocational Education (Chai Wan)
64
5. Short-term liquidity ratios (13)
Click here for some hints Click here for suggested answer
Self-test 7
Now! Try to calculate the Liquid ratio (also named as quick assets ratio or acid test ratio)

65Unit 4Department of Business Administration
Professional Development Programme (BAFS)Hong Kong Institute of Vocational Education (Chai Wan)
65
5. Short-term liquidity ratios (14)
(b) Liquid ratio (Quick assets ratio or acid test ratio)
Year 2Year 1
= =
Current liabilities
Current assets less inventory
Go Back to previous page
66Unit 4Department of Business Administration
Professional Development Programme (BAFS)Hong Kong Institute of Vocational Education (Chai Wan)
66
5. Short-term liquidity ratios (15)
(b) Liquid ratio (Quick assets ratio or acid test ratio)
600540
Year 2Year 1
= 2.5=2.3
2,040 - 5401,620 - 360
Current liabilities
Current assets less inventory
What’s your comment?

67Unit 4Department of Business Administration
Professional Development Programme (BAFS)Hong Kong Institute of Vocational Education (Chai Wan)
67
5. Short-term liquidity ratios (16)
(b) Liquid ratio (Quick assets ratio or acid test ratio)
600540
Year 2Year 1
= 2.5=2.3
2,040 - 5401,620 - 360
Current liabilities
Current assets less inventory
The ratios for the two years were well above the rule-of-thumb. The company has sufficient liquid resources to meet its immediate liabilities.
Next ratio
68Unit 4Department of Business Administration
Professional Development Programme (BAFS)Hong Kong Institute of Vocational Education (Chai Wan)
68
5. Short-term liquidity ratios (17)
(c) Inventory turnover (inventory holding period)
Average inventory= ? times OR
Cost of goods sold
Cost of goods soldx 365 days
Average inventory
Inventory turnover measures how many times inventories have beenturned over (into cost of goods sold).
Inventory holding period indicates the average number of days that the average inventories are held for. A longer inventory turnover period from one year to the next indicates either a slow down intrading or the inventory level is becoming higher.
Example – Click here Go back to section menu

69Unit 4Department of Business Administration
Professional Development Programme (BAFS)Hong Kong Institute of Vocational Education (Chai Wan)
69
Popcon Limited
Balance sheets as at 31 December
540360Property, plant and equipment
2,0401,620
300540Bank balances and cash
1,200720Trade and other receivables
540360Inventory
Current assets
Non-current assets
Assets
$’000$’000
Year 2Year 1
5. Short-term liquidity ratios (18)
Next page
70Unit 4Department of Business Administration
Professional Development Programme (BAFS)Hong Kong Institute of Vocational Education (Chai Wan)
70
Popcon Limited
Income statements for the year ended 31 December
1,1221,320
132
30
330
30
Other operating expenses
Debenture interest
600660Administrative expenses
360300Distribution costs
ExpensesLess:
1,9202,160Gross profit
4,0803,600Cost of goods sold
6,0005,760Sales
$’000$’000
Year 2Year 1
5. Short-term liquidity ratios (19)
Next page

71Unit 4Department of Business Administration
Professional Development Programme (BAFS)Hong Kong Institute of Vocational Education (Chai Wan)
71
5. Short-term liquidity ratios (20)
Click here for some hints Click here for suggested answer
Self-test 8
Now! Try to calculate the Inventory holding period
72Unit 4Department of Business Administration
Professional Development Programme (BAFS)Hong Kong Institute of Vocational Education (Chai Wan)
72
5. Short-term liquidity ratios (21)
(c) Inventory holding period
Year 2Year 1
= days= days
x daysx days
Cost of goods soldx 365 days
Average inventory *
Go Back to previous page
* In this case, we assume that the closing inventory is equal to average inventory

73Unit 4Department of Business Administration
Professional Development Programme (BAFS)Hong Kong Institute of Vocational Education (Chai Wan)
73
5. Short-term liquidity ratios (22)
(c) Inventory holding period
4,0803,600
Year 2Year 1
= 48.3 days= 36.5 days
x 365 days540
x 365 days360
Cost of goods soldx 365 days
Average inventory
What’s your comment?
74Unit 4Department of Business Administration
Professional Development Programme (BAFS)Hong Kong Institute of Vocational Education (Chai Wan)
74
5. Short-term liquidity ratios (23)
(c) Inventory holding period
4,0803,600
Year 2Year 1
= 48.3 days= 36.5 days
x 365 days540
x 365 days360
Cost of goods soldx 365 days
Average inventory
Year 2 has longer inventory holding period than Year 1. It indicates either a slow down in trading or higher inventory level. Next ratio

75Unit 4Department of Business Administration
Professional Development Programme (BAFS)Hong Kong Institute of Vocational Education (Chai Wan)
75
5. Short-term liquidity ratios (24)
Indicate the average time to collect accounts receivable
The trend of the collection period over time is probably the best guide. If accounts receivable days are increasing year-by-year, it indicates the company’s poor management on the credit control function.
Credit salesx 365 days
Accounts receivable
(d) Accounts receivable turnover (in days)
Next ratio
76Unit 4Department of Business Administration
Professional Development Programme (BAFS)Hong Kong Institute of Vocational Education (Chai Wan)
76
5. Short-term liquidity ratios (25)
Indicate the average time to pay the suppliers
This ratio shows the average credit period allowed to the company by the suppliers. The longer the period is, the better to the company.
Credit purchasesx 365 days
Accounts payable
(e) Accounts payable turnover (in days)
Next ratio

Professional Development Programme on Enriching Knowledge of the Business, Accounting and Financial Studies (BAFS) Curriculum
6. Long-term solvency ratios
78Unit 4Department of Business Administration
Professional Development Programme (BAFS)Hong Kong Institute of Vocational Education (Chai Wan)
78
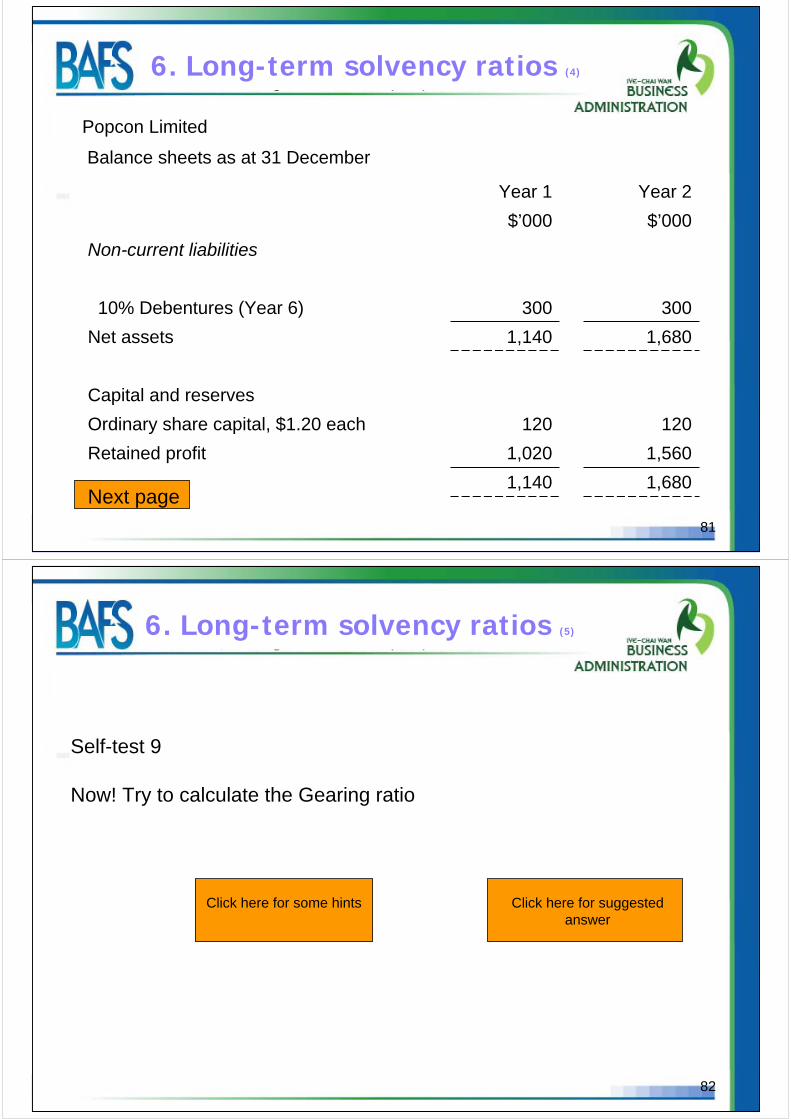
6. Long-term solvency ratios (1)
Long-term solvency ratios are concerned with how much the company owes, whether it is getting into heavier debts or improving its situation, and whether its debts burden seems heavy or light.
For example: If a company has heavy debts burden, high interest charges will reduce profit available to shareholders and make it potentially vulnerable if interest rates go up.
79Unit 4Department of Business Administration
Professional Development Programme (BAFS)Hong Kong Institute of Vocational Education (Chai Wan)
79
6. Long-term solvency ratios (2)
The following are the commonly used ratios to assess the long-term solvency of a company:
a) Gearing ratio (Chick here for detail explanation)
b) Interest cover (Chick here for detail explanation)
c) Debt to equity ratio (Chick here for detail explanation)
Go back to organisation of unit 4
80Unit 4Department of Business Administration
Professional Development Programme (BAFS)Hong Kong Institute of Vocational Education (Chai Wan)
80
6. Long-term solvency ratios (3)
(a) Gearing
Gearing -> long-term capital structure
Acceptable level of gearing is about 30% to 35%
High gearing ratio -> high financial risk
Owners’ equity + preference share capital + long-term liabilities
(long-term liabilities + preference share capital) x 100%
Example – Click here Go back to section menu
81Unit 4Department of Business Administration
Professional Development Programme (BAFS)Hong Kong Institute of Vocational Education (Chai Wan)
81
Popcon Limited
Balance sheets as at 31 December
1,5601,020Retained profit
Capital and reserves
120120Ordinary share capital, $1.20 each
1,6801,140
1,6801,140Net assets
30030010% Debentures (Year 6)
Non-current liabilities
$’000$’000
Year 2Year 1
6. Long-term solvency ratios (4)
Next page
82Unit 4Department of Business Administration
Professional Development Programme (BAFS)Hong Kong Institute of Vocational Education (Chai Wan)
82
6. Long-term solvency ratios (5)
Click here for some hints Click here for suggested answer
Self-test 9
Now! Try to calculate the Gearing ratio

83Unit 4Department of Business Administration
Professional Development Programme (BAFS)Hong Kong Institute of Vocational Education (Chai Wan)
83
6. Long-term solvency ratios (6)
(a) Gearing ratio
Owners’ equity + preference share capital + long-term liabilities
x 100%
Long-term liabilities + preference share capital
(owners’ equity + debentures)
Year 2Year 1
= %= %
x 100%X100%(debentures)
Go Back to previous page
84Unit 4Department of Business Administration
Professional Development Programme (BAFS)Hong Kong Institute of Vocational Education (Chai Wan)
84
6. Long-term solvency ratios (7)
(a) Gearing ratio
Owners’ equity + preference share capital + long-term liabilities
x 100%
Long-term liabilities + preference share capital
1,9801,440 (owners’ equity + debentures)
Year 2Year 1
= 15.2%= 20.8%
x 100%300
x 100%300 (debentures)
What’s your comment?

85Unit 4Department of Business Administration
Professional Development Programme (BAFS)Hong Kong Institute of Vocational Education (Chai Wan)
85
6. Long-term solvency ratios (8)
(a) Gearing ratio
1,9801,440 (owners’ equity + debentures)
Year 2Year 1
= 15.2%= 20.8%
x 100%300
x 100%300 (debentures)
Next ratio
The gearing ratio in Year 2 is lower than in Year 1. The lower risk to the ordinary shareholders will strengthen the company’s ability to survive in times of poor business.
86Unit 4Department of Business Administration
Professional Development Programme (BAFS)Hong Kong Institute of Vocational Education (Chai Wan)
86
6. Long-term solvency ratios (9)
Interest
Profit before interest and tax
Interest cover shows whether a company is earning enough profit to pay interest cost comfortably. It also shows possible effects on profit available for ordinary shareholders in the event of a fall in profit before interest and tax.
The higher the interest cover ratio, the lower will be the financial risk of the company.Note: The example for calculating interest cover is included in the Learning Resources Centre.
(b) Interest cover
Next ratio

87Unit 4Department of Business Administration
Professional Development Programme (BAFS)Hong Kong Institute of Vocational Education (Chai Wan)
87
6. Long-term solvency ratios (10)
(c) Debt to equity ratio
Owners’ equityx 100%
Total debts
(Long-term liabilities + current liabilities)
1) Indicate the proportion of the total debts to owners’ equity2) Rule of thumb - 50% as a safe limit.
Next ratioNote: The example for calculating debt to equity ratio is included in the Learning
Resources Centre
Professional Development Programme on Enriching Knowledge of the Business, Accounting and Financial Studies (BAFS) Curriculum
7. Investment ratios

89Unit 4Department of Business Administration
Professional Development Programme (BAFS)Hong Kong Institute of Vocational Education (Chai Wan)
89
7. Investment ratios (1)
Investment ratios help investors and analysts to assess the value and quality of an investment in the ordinary shares of a company.
It is important for investors and financial managers who are interested in the market price of the shares quoted on the stock exchange
90Unit 4Department of Business Administration
Professional Development Programme (BAFS)Hong Kong Institute of Vocational Education (Chai Wan)
90
7. Investment ratios (2)
The following are the commonly used investment ratios:
a) Earnings per share (EPS) (Chick here for detail explanation)
b) Dividend cover (Chick here for detail explanation)
c) Dividend yield (Chick here for detail explanation)
d) Price earnings (P/E) ratio (Chick here for detail explanation)
Go back to organisation of unit 4

91Unit 4Department of Business Administration
Professional Development Programme (BAFS)Hong Kong Institute of Vocational Education (Chai Wan)
91
7. Investment ratios (3)
(a) Earnings per share
Numerator: profit attributable to ordinary shareholders
Denominator: reflect the amount of shareholders’ capital that may have varied during the period as a result of a larger or lesser number of shares outstanding at any time
A traditional performance measure
EPS- -> good news
Weighted average number of ordinary shares outstanding
Profit after tax – preference dividends
Example – Click here Go back to section menu
92Unit 4Department of Business Administration
Professional Development Programme (BAFS)Hong Kong Institute of Vocational Education (Chai Wan)
92
Popcon Limited
Income statements for the year ended 31 December
684720Profit after tax
114120Tax
798840Profit before tax
540576Retained profit for the year
144144Dividend paid
$’000$’000
Year 2Year 1
7. Investment ratios (4)
Next page

93Unit 4Department of Business Administration
Professional Development Programme (BAFS)Hong Kong Institute of Vocational Education (Chai Wan)
93
Popcon Limited
Balance sheets as at 31 December
1,5601,020Retained profit
Capital and reserves
120120Ordinary share capital, $1.20 each
1,6801,140
1,6801,140Net assets
30030010% Debentures (Year 6)
Non-current liabilities
$’000$’000
Year 2Year 1
7. Investment ratios (5)
Next page
94Unit 4Department of Business Administration
Professional Development Programme (BAFS)Hong Kong Institute of Vocational Education (Chai Wan)
94
7. Investment ratios (6)
Click here for some hints Click here for suggested answer
Self-test 10
Now! Try to calculate the Earnings per share (EPS)

95Unit 4Department of Business Administration
Professional Development Programme (BAFS)Hong Kong Institute of Vocational Education (Chai Wan)
95
7. Investment ratios (7)
(a) Earnings per share (EPS)
Weighted average number of ordinary shares outstanding
Profit after tax – preference dividends
Year 2Year 1
= = Go Back to previous page
96Unit 4Department of Business Administration
Professional Development Programme (BAFS)Hong Kong Institute of Vocational Education (Chai Wan)
96
7. Investment ratios (8)
(a) Earnings per share (EPS)
Weighted average number of ordinary shares outstanding
Profit after tax – preference dividends
*100*100
Year 2Year 1
= $6.8= $7.2
$684$720
* Number of ordinary shares = $120 / $1.2 = 100
The company’s EPS in Year 1 is better than in Year 2.
Next ratio

97Unit 4Department of Business Administration
Professional Development Programme (BAFS)Hong Kong Institute of Vocational Education (Chai Wan)
97
7. Investment ratios (9)
(b) Dividend cover
Indicate the number of times which the ordinary dividends are covered by profit
High dividend cover
retain high profit for investment
may signal earnings growth in the futureNote: The example for calculating dividend cover is included in the Learning Resources Centre.
Ordinary dividends
Profit after tax – preference dividends
Next ratio
98Unit 4Department of Business Administration
Professional Development Programme (BAFS)Hong Kong Institute of Vocational Education (Chai Wan)
98
7. Investment ratios (10)
(c) Dividend yield
Market price per shareX 100%
Ordinary dividend per share
Example – Click here Go back to section menu
Dividend yield is the rate of return a shareholder is expecting on an investment in ordinary shares
Shareholders expect high dividend yield and capital growth. Dividend yield is an important indicator of a share’s performance

99Unit 4Department of Business Administration
Professional Development Programme (BAFS)Hong Kong Institute of Vocational Education (Chai Wan)
99
Popcon Limited
Income statements for the year ended 31 December
684720Profit after tax
114120Tax
798840Profit before tax
540576Retained profit for the year
144144Dividend paid
$’000$’000
Year 2Year 1
7. Investment ratios (11)
Next page
100Unit 4Department of Business Administration
Professional Development Programme (BAFS)Hong Kong Institute of Vocational Education (Chai Wan)
100
Popcon Limited
Balance sheets as at 31 December
$20$21.6Market price per share
1,5601,020Retained profit
Capital and reserves
120120Ordinary share capital, $1.20 each
1,6801,140
1,6801,140Net assets
30030010% Debentures (Year 6)
Non-current liabilities
$’000$’000
Year 2Year 1
7. Investment ratios (12)
Next page

101Unit 4Department of Business Administration
Professional Development Programme (BAFS)Hong Kong Institute of Vocational Education (Chai Wan)
101
7. Investment ratios (13)
Click here for some hints Click here for suggested answer
Self-test 11
Now! Try to calculate the Dividend yield
102Unit 4Department of Business Administration
Professional Development Programme (BAFS)Hong Kong Institute of Vocational Education (Chai Wan)
102
7. Investment ratios (14)
(c) Dividend yield
Market price per shareX 100%
Ordinary dividends per share
Year 2Year 1
==
x 100%x 100%
Go Back to previous page

103Unit 4Department of Business Administration
Professional Development Programme (BAFS)Hong Kong Institute of Vocational Education (Chai Wan)
103
7. Investment ratios (15)
(c) Dividend yield
Market price per shareX 100%
Ordinary dividends per share
$20$21.6
Year 2Year 1
= 7.2%= 6.7%
x 100%$144/100
x 100%$144/100
What’s your comment?
104Unit 4Department of Business Administration
Professional Development Programme (BAFS)Hong Kong Institute of Vocational Education (Chai Wan)
104
7. Investment ratios (16)
(c) Dividend yield
Market price per shareX 100%
Ordinary dividends per share
$20$21.6
Year 2Year 1
= 7.2%= 6.7%
x 100%$144/100
x 100%$144/100
Next ratio
In Year 2, the rate of return to shareholders is higher than in Year 1.

105Unit 4Department of Business Administration
Professional Development Programme (BAFS)Hong Kong Institute of Vocational Education (Chai Wan)
105
7. Investment ratios (17)
(d) Price earnings (P/E) ratio
Indicate the number of years required to earn the price paid for the shares out of profit at the current rate
Reflect the market’s appraisal of the share’s future prospects
Need to compare with the industry P/E ratio
Earnings per share
Current market price per share
106Unit 4Department of Business Administration
Professional Development Programme (BAFS)Hong Kong Institute of Vocational Education (Chai Wan)
106
7. Investment ratios (18)
(d) Price earnings (P/E) ratio
High P/E ratio may indicate:
1. The investors expect the company’s earnings to increase faster than the others
2. The investors expect the company to be a less risky company
3. The company operates in a more secure industry
In general, P/E ratio around 18 is considered reasonable for a large and established company.
Go back to organisation of unit 4

Professional Development Programme on Enriching Knowledge of the Business, Accounting and Financial Studies (BAFS) Curriculum
8. Limitations of ratio analysis
108Unit 4Department of Business Administration
Professional Development Programme (BAFS)Hong Kong Institute of Vocational Education (Chai Wan)
108
8. Limitations of ratio analysis (1)
Some people said that ratio analysis is often difficult to be applied. Why? (Click here for answer)
l Any limitations on ratio analysis?

109Unit 4Department of Business Administration
Professional Development Programme (BAFS)Hong Kong Institute of Vocational Education (Chai Wan)
109
8. Limitations of ratio analysis (2)
Limitations of financial statements:
Historical cost figures
Seasonal businesses
Accounting policies may be different among companies
For large companies, difficult to categorise into industry segments to allow cross-sectional comparison
Industry averages are not necessarily useful
Go back to organisation of unit 4
Professional Development Programme on Enriching Knowledge of the Business, Accounting and Financial Studies (BAFS) Curriculum
9. Percentage Analysis

111Unit 4Department of Business Administration
Professional Development Programme (BAFS)Hong Kong Institute of Vocational Education (Chai Wan)
111
9. Percentage analysis (1)
Horizontal analysis
A trend of changes over years
% change / base-year amount
Useful to determine:
Cause of the change
Whether the change is favourable or unfavourable
Whether any trends are expected to continue
Whether the change affects other related items in the financial statements
112Unit 4Department of Business Administration
Professional Development Programme (BAFS)Hong Kong Institute of Vocational Education (Chai Wan)
112
9. Percentage analysis (2)
Vertical analysis
Provide evidence of structural changes
Balance sheet: individual components are stated as a % of total assets or total liabilities and shareholders’equity
Income statement: each item is expressed as a % of sales
Useful for comparing companies of different sizes
113Unit 4Department of Business Administration
Professional Development Programme (BAFS)Hong Kong Institute of Vocational Education (Chai Wan)
113
9. Percentage analysis (4)
Trend analysis
Used to compare the financial data for three or more years
Used to assess a company’s growth
The earliest period is the base year
Base year: 100%
114Unit 4Department of Business Administration
Professional Development Programme (BAFS)Hong Kong Institute of Vocational Education (Chai Wan)
114
End of the Unit
This is the end of Unit 4. This is the end of Unit 4. Please go to the Unit Please go to the Unit Assessment before Assessment before attempting the next unit.attempting the next unit.
EndEnd--ofof--unit Assessmentunit Assessment

115Unit 4Department of Business Administration
Professional Development Programme (BAFS)Hong Kong Institute of Vocational Education (Chai Wan)
115
Unit 4 Financial Analysis
If you would like to:
(a) go through a comprehensive case on financial analysis,
(b) know more about an integrated analysis of ratios,
please go to the Learning Resources Corner.