Embed Size (px)
Citation preview

Unit 23
QCF Level 3 Extended Certificate
Unit 23
Human Computer Interaction
Previously
• In interface design we looked at Pattern and
the six sections it consisted of.
• And then we looked at Geons followed by
gross 3d Shapes

So now – Behaviour
• So now we start to look at behavioural
models.
• What do you think this could mean?

Behavioural models
• There are a number of models that predict
the way in which an interface or user will
behave.
• There are 6 types of behaviour models which
are split up into Predictive and Descriptive.

Behavioural models
• Models help HCI developers and designers
understand and work out how the interface
will preform tasks and how efficient it is, is it
worthy of computer use or device, or is it to
slow?
Predictive models
• There are a number of predictive models that
provide guidance when designing interfaces
and systems.
• This is a way of pre-empting what will happen
without having to carry out lengthy research
leading to delays in in delivering any interface
and allowing lots of people to test it.
Predictive models
• The reaction time to respond to a command
from a GUI will vary depending on the user
so,
• Consideration must be given to whether or
not the interface will respond within an
acceptable time relative to what it is doing.
• E.g. shutting down a computer should be
relatively quick, and Microsoft spent a great
deal of money in getting windows to start up
fast.

Predictive models
• As an aside there is also the three click rule
in web design which says that a typical user
should be able to accomplish what they want
by using no more than three clicks on the
mouse.
Behavioural models
• The Predictive models are as of follows:-
• Keystroke-level-model (KLM)
• Throughput (TP)
• Fitt's Law

Keystroke-level-model (KLM)
• The keystroke-level-model was built and
proposed by Card, Moran and Newell in the
1980s.
• The keystroke model was made to predict
and estimate how long it takes for a user to
input letters on the keyboard. The model is
made up of 11 steps which is used by both
users and organisations however, some
organisations who can't afford specialist
software usually use this method instead.
Keystroke-level-model (KLM)
• KLM recognises very low-level actions.
• The model breaks down the sequence of
operations into individual actions, e.g.
• hitting keys on the keyboard
• clicking on the mouse
• pointing with the mouse
• Moving between mouse and keyboard and back
again.
Each action is assigned a time in order to calculate
how the system will respond.

Activity - KLM
• Create a simple table to record times (in
seconds) for the following –
• The time you predict it will take to power up your
computer, log in and access one application.
• Carry out the above and time how long it actually
takes, record this in your table.
• Try the same activity using all mouse actions
and then again using all keyboard actions.
• Identify how long it takes for the system to
respond.
The throughput model –(TP)
• This relates to the productivity of the
computer.
• Throughput measures include the amount or
speed of processing in response to a
command.
• How can we measure processing?

The throughput model –(TP)
• By using the performance monitor on your
computer. (Task manager or performance)
• Find the performance monitor on your
computer and run it, what can you measure?
• (You probably will not be able to run task
manager)

The throughput model –(TP)
• Other measures of productivity include
performance in terms of speed of processing
and any variation in relation to the number of
tasks and their complexity.
• This is call Response time.
• See
http://en.wikipedia.org/wiki/Response_time_(tec
hnology)
Fitts’ Law
• Moving around an interface can improve or
degrade the experience for a user.
• It is important therefore that we design any
interface with this in mind and preferable
before the interface is built (programmed).

Fitts’ Law
• This can be achieved using Fitts’ law which is
a method for calculating throughput in
advance for any system design by predicting
human movement and motion based on time
and distance.
Fitts’ Law
• The science bit –
• “time taken to travel between points A and B
depends upon the size of the object to be
moved and the size of the object with which it
is moved.”
Fitts’ Law
• In English –
• User time will vary according to user, the
location of an icon, menu or GUI, the click of
the mouse button or hitting a key and even
the pressure applied.
Fitts’ Law
• How can we apply this?
• Fitts’ law says that you should make buttons
and other interface elements big enough, as
it is difficult for the users to click on the small
ones.
• So
Fitts’ Law
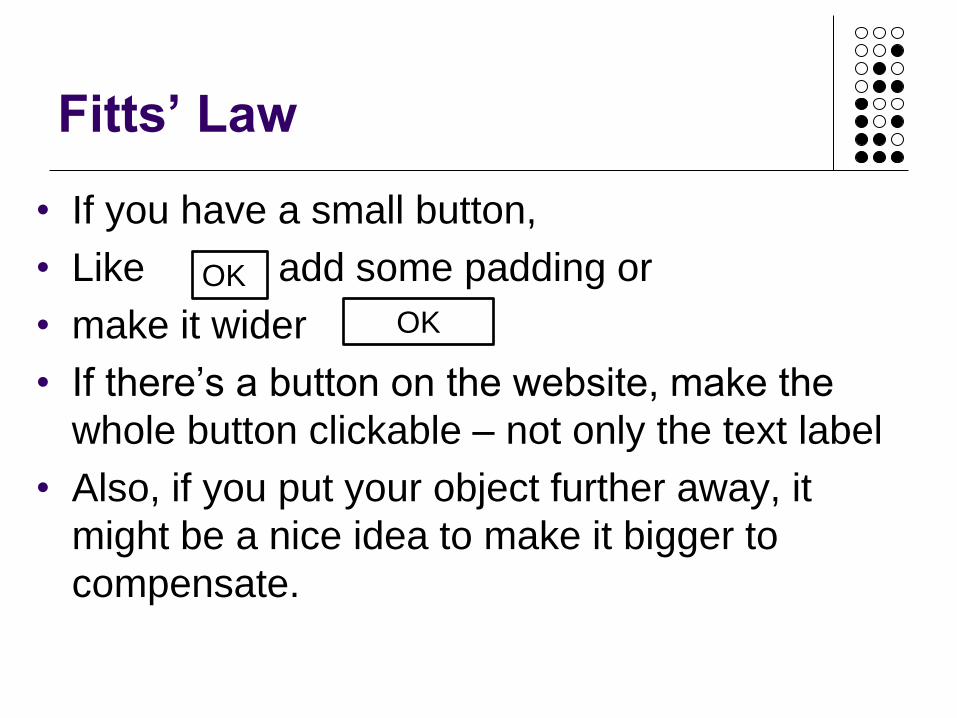
• If you have a small button,
• Like , add some padding or
• make it wider
• If there’s a button on the website, make the
whole button clickable – not only the text label
• Also, if you put your object further away, it
might be a nice idea to make it bigger to
compensate.
OK
OK
Descriptive Models
• These are used to help understand how a
user will interact with the HCI and from this
will also help improve upon the designs of the
actual HCI themselves.
Descriptive Models
• In this part we shall look at the three main
descriptive models.
1.The key-action model (KAM)
2.Buxton’s three state model
3.Guiard’s model.
Descriptive Models
• Key-Action Model (KAM)
• This allows you to look at how users will
interact with keyboards and therefore what
kind of shortcuts they will use to carry out
tasks.
• It identifies the need to evaluate how the user
will expect the computer to behave or react
and how this may be different from how the
computer actually reacts to commands etc.
Descriptive Models (KAM)
• In English then -
• This will show how what the user is expecting
the computer to do when you try to use
certain shortcuts and what the computer will
actually do when you press the shortcut.
Descriptive Models (KAM)
• An example of is in computer games.
• when gaming you can generally used the
arrows keys to move around as well as using
(W,A,S,D) (clearly an older game), if both
options were not available then most gamers
wouldn’t like how the controls were laid out
and therefore could decrease the enjoyability
of the game.

Descriptive Models (KAM)
• Keys on a keyboard are described as either 1
of 3 different things. They are either
1.Symbol- These tend to be letters, numbers or
punctuation symbols.
2.Executive key-These tend to carry out
specific actions for example the ENTER key
or F1.
Descriptive Models (KAM)
3. Modifier key- these don’t actually type
anything but they allow you to change what the
next keypress will actually type for example the
SHIFT key, if you press the shift key and then
the number 5 for example it will put this %.

Descriptive Models (KAM)
Descriptive Models (KAM)
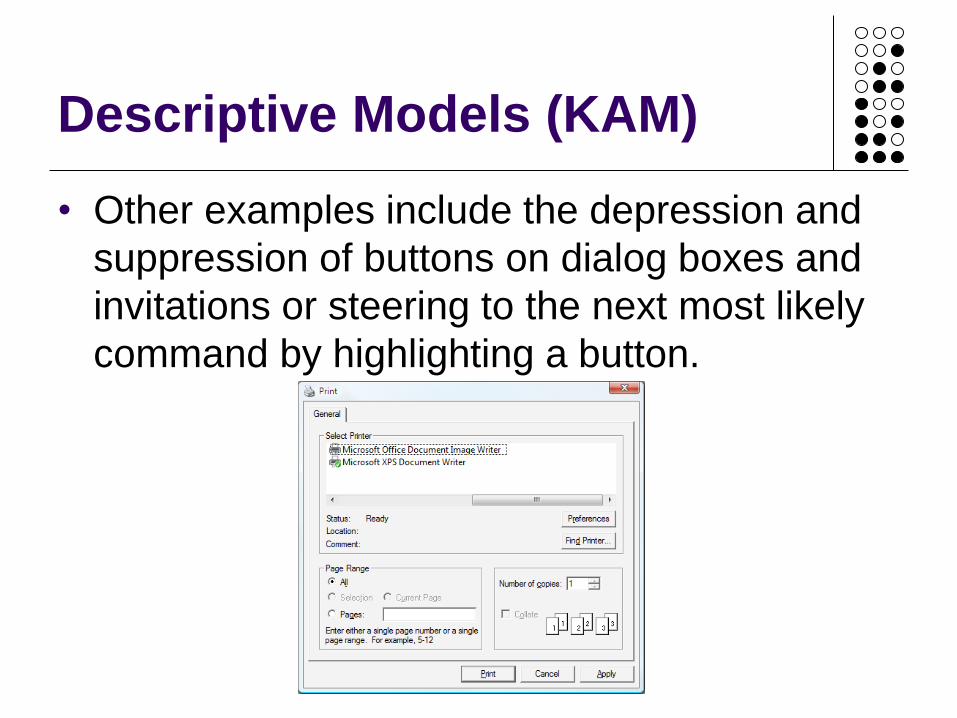
• Other examples include the depression and
suppression of buttons on dialog boxes and
invitations or steering to the next most likely
command by highlighting a button.
Descriptive Models
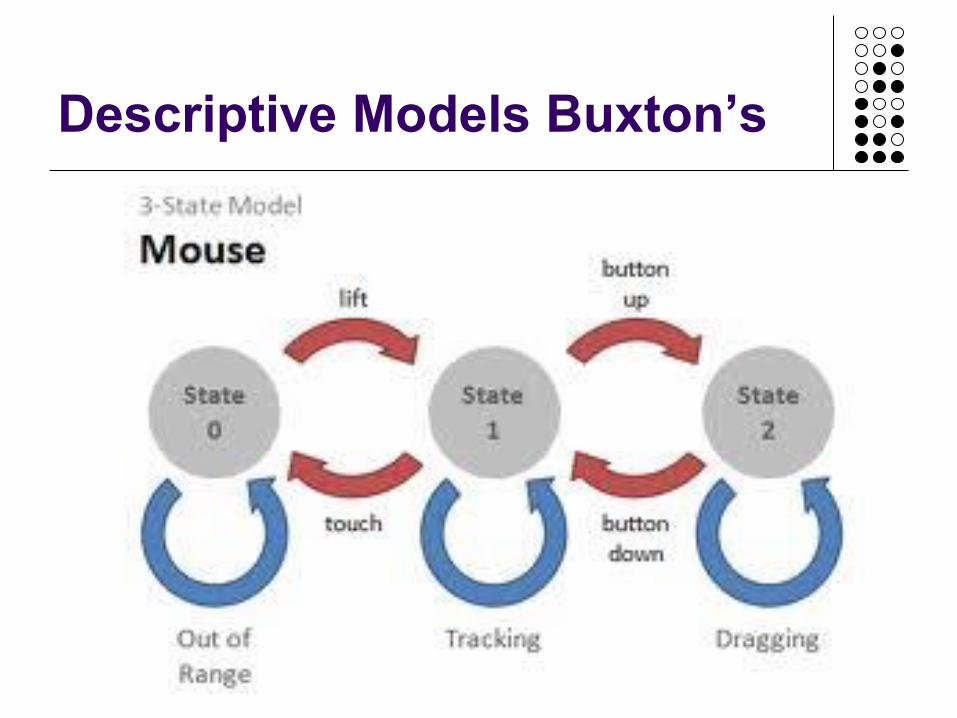
• Buxton’s three state model: this is used to
determine how easy it is to use a mouse or
the wheel and will measure how much
pressure a user puts on it and how much
dexterity and speed is used during this
action.
Descriptive Models Buxton’s
• There are three states which are used to
check this:
1.Out of range: Used to show re-positioning
and clutching of the mouse.
2.Tracking: For moving an item around the
screen such as a cursor.
3.Dragging: Checking the time it takes you to
drag an object across the screen or to group
an amount of items together.
Descriptive Models Buxton’s
Descriptive Models
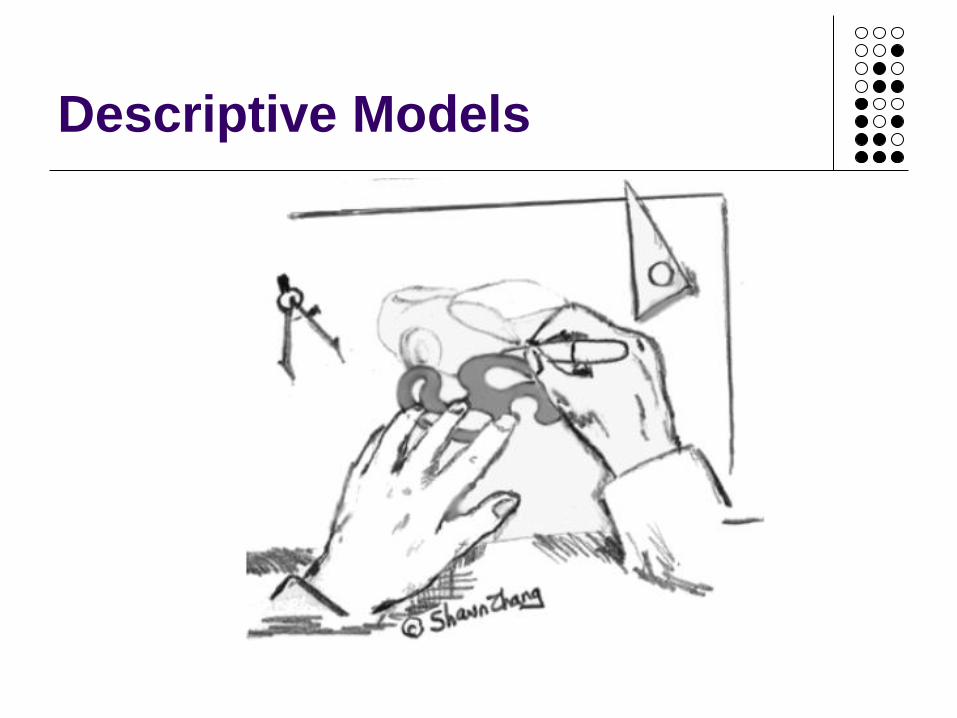
• Guiard’s model of bimanual skill relates to the
preferred method of interacting with
computers and input devices.
• for example when typing a keyboard layout is
most suitable for left handed people as the
more important keys are on the left side of
the keyboard. Guiard’s model looks at the
actual position of the keys on the keyboard.
Descriptive Models
Descriptive Models Guiard’s
• The above diagram shows that the preferred
hand is the right one but this is not always the
case, it will be the left hand in the case of
some people or in some cases preferred
hands change depending on which task
users are doing (ambidextrous).
Descriptive Models
• Activity
• Create a table to store timings in seconds.
• Predict how long it will take in seconds to
switch on your computer, then log in and start
Microsoft word. Record your prediction.
• Now do this and record the actual time.
• Repeat the above but use only your wrong
hand.
• What can you conclude.