Embed Size (px)
Citation preview

1 Created by Natalie Garthwaite August 2010
Unit 1: World at Risk Global hazards Revision Guide

2 Created by Natalie Garthwaite August 2010
Keywords
Context hazard: Widespread (global) threat due to environmental factors such as climate change
Geophysical hazard: A hazard formed by tectonic/geological processes (earthquakes, volcanoes and
tsunamis)
Hazard: A perceived natural event which has the potential to threaten both life and property
Hydro-meteorological hazard: A hazard formed by hydrological (floods) and atmospheric (storms
and droughts) processes
Vulnerability: A high risk combined with an inability of individuals and communities of cope
Disaster: A hazard becoming reality in an event that causes deaths and damage to goods/property
and the environment
Risk: The probability of a hazard event occurring and creating loss of lives and livelihoods
Albedo: How much solar radiation a surface reflects
Climate change: Any long term trend or shift in climate (average weather over 30 years) detected by
a sustained shift in the average value for any climatic element (e.g. rainfall, drought, storminess)
Enhanced greenhouse effect: This occurs when the levels of greenhouse gases in the atmosphere
increase owing to human activity.
Fossil fuels: Energy sources that are rich in carbon and which release carbon dioxide when burnt
(e.g. coal)
Global warming: A recently measured rise in the average surface temperature of the planet
Greenhouse effect: The warming of the Earth’s atmosphere due to the trapping of heat that would
otherwise be radiated back into space – it enabled the survival of life on Earth.
Tipping point: The point at which a system switches from one state to another
Feedback mechanism: Where the output of a system acts to amplify (positive) or reduce (negative)
further output (e.g. the melting of Arctic permafrost leads to the release of trapped methane which
leads to further global warming)
Frequency: How often an event of a certain size (magnitude) occurs.
Magnitude: The size of the event (e.g. size of an earthquake on the Richter scale)
Asthenosphere: A semi-molten zone of rock underlying the Earth’s crust
Conservative boundary: A boundary between plates where the movement of the plates is parallel to
the plate margin and the plates slide past each other.
Constructive boundary: A boundary between plates where the plates are diverging or moving apart
Destructive boundary: A boundary between plates where the plates are converging (moving together)
Lithosphere: The crust of the Earth, around 80-90km thick
Magma: Molten material that rises towards the Earth’s surface when hotspots within the
asthenosphere generate convection currents
Natural hazard: a natural event or process which affects people e.g. causing loss of life or injury,
economic damage, disruption to people’s lives or environmental degradation
Plates: Rigid, less dense ‘slabs’ of rock floating on the asthenosphere
Hotspot: A localised area of the Earth’s crust with an unusually high temperature
Plume: An upwelling of abnormally hot rock within the Earth’s mantle
Inter-tropical convergence zone: A zone of low atmospheric pressure near the equator. This
migrates seasonally.

3 Created by Natalie Garthwaite August 2010
The nature of hazard A natural event such as a tsunami only becomes a hazard if it threatens humans. There are many
different types of hazard. Environmental hazards are specific events like earthquakes or floods,
usually classified into
Natural processes: where the hazard results from an extreme geophysical or hydro-
meteorological event, such as a flood or volcanic eruption
Natural-technological disasters: where natural hazards trigger technological disaster (e.g.
flooding causes a dam to burst)
Technological accidents: such as Chernobyl nuclear power plant exploding
Chronic hazards such as global warming
and the El Nino-La Nina cycle may
increase the threat from environmental
hazards; for example, a sea level rise
increases the risk of coastal floods.
Some key features of environmental
hazards make them a huge threat:
The warning time is normally short
and onset is rapid (apart from
droughts)
Humans are exposed to hazards because people live in hazardous areas through perceived
economic advantage or over-confidence about safety.
Most direct losses to life or property occur within days or weeks of the event, unless there is a
secondary hazard.
The resulting disaster often justifies an emergency response, sometimes on the scale of
international humanitarian aid.
Some socioeconomic characteristics, such as a high population density, high poverty level or corrupt
and inefficient government increase people’s vulnerability and amplify the risks, particularly of death,
from environmental hazards.
Types of natural hazard Geophysical hazards result from
geological or geomorphological
processes (e.g. volcanoes,
earthquakes and tsunamis).
These are of two types, internal
earth processes of tectonic
origin (e.g. earthquakes, tsunami
and volcanic activity) and
external earth processes of
geomorphological origin involving
mass movements (e.g. landslides,
rockslides, rock falls)
Hydro-meteorological hazards
result from atmospheric or

4 Created by Natalie Garthwaite August 2010
hydrological processes (e.g. floods, storms and droughts). Hydro-meteorological hazards are
those caused by running water and its processes (hydro) and those associated with or caused by
weather patterns (meteorological). They include floods, debris and mud flows, hurricanes, coastal
storm surges, thunder and hailstorms, rain and wind storms (including tornadoes), blizzards and
other severe storms, drought, bushfires, temperature extremes, sand and dust storms.
What are disasters? When does a natural hazard become a disaster?
A disaster is a matter of scale; it is simply bigger
than a natural hazard. However, it is difficult to
define precisely. Insurance companies – who do a
lot of research into global hazards – attempt to
define disasters. In 1990, Swiss Re defined a
disaster as an event in which at least 20 people
died, or insured damage of over US$16 million value
was caused.
Disasters and vulnerable populations
Whether a hazard becomes a disaster or not can depend on how vulnerable the people who are
exposed to it are. An increasing proportion of the world’s population lives in areas which are exposed
to hazards. Examples include:
People in Bangladesh who are threatened by floods and cyclones
People who live on steep slopes where landslides may be common, such as the favelas (shanty
towns) in many Brazilian cities.
Which hazards have the worst impacts?
Floods and windstorms may be greatest in number, but do they cause the most deaths or create the
most damage? The data are complex but patterns do stand out:
Earthquakes cause occasional major damage, but there is no upward trend.
Damaging floods are increasing, but not consistently so
Damaging windstorms are also increasing, though again not always consistently.
Why are floods and windstorms increasing?
The media almost always say that it is due to global warming. The theory is that the
Increased warming of the earth causes warm air to rise, creating convection cells – which
form hurricanes
Increasing temperatures increase evaporation, which in turn leads to increasing rainfall – and
therefore greater flooding.
How significant are natural hazards?
There are no data for deaths from hazard events globally, only for those events which are large
enough to be called disasters. Although numbers vary considerably from year to year, on average
fewer than 100 000 deaths are recorded each year from natural disasters worldwide. This is:
30 times fewer than the number who die from HIV/AIDS
35 times fewer than the number of road deaths
50 times fewer than the number of smoking-related deaths

5 Created by Natalie Garthwaite August 2010
Why do people remain exposed to hazards? Changing risks: Natural hazards vary in space as well as time because of changing human activities
and changing physical factors, such as tectonic plate movements. The rise in sea level means that
low-lying coastal plains that were once safe places to live are now more prone to storm surge and
flood.
Lack of alternatives: Often the world’s poorest; most vulnerable people are forced to live in unsafe
locations such as hillsides or floodplains, or regions subject to drought, owing to shortage of land or
lack of knowledge or better alternatives.
Benefits versus costs: People may subconsciously weigh up the benefits versus the costs of living in
high risk areas. The benefits of fertile farming land on the flanks of a volcano, for example, may
outweigh the risk from eruptions.
Risk perception: People tend to be optimistic about the risk of hazards occurring. They are
comforted by statistics which show that the risk of death from hazard events is far lower than that
from influenza or car accidents. They also believe that if a high magnitude event has occurred, they
may be safe for the next few years, although this is not true.
Measuring risk – the risk equation The risk equation measures the level of hazard risk for an area:
Risk =
Frequency or magnitude of hazard x level of
vulnerability
Capacity of population to cope
R = H x V
C
Where: H = Type of hazard
V = Vulnerability to hazard
C = Capacity to cope/recover
The concept of vulnerability is quite easy to extend to other hazards; if you do not live in close
proximity to a volcano, then you are not likely to be threatened by lava flows.
Capacity (C) refers to the ability of a community to absorb, and ultimately recover from, the effects
of a natural hazard.

6 Created by Natalie Garthwaite August 2010
Changing patterns Frequency or magnitude of hazard is increasing
Use of fossil fuels is warming the planet. The resulting change in climate is increasing the frequency
and severity of weather-related hazards (e.g. floods, droughts, windstorms) and expanding the range
of disease carriers.
It is clear that the number of reported natural disasters is increasing with each passing year. Some
argue that this is due to improvements in technology that allow even the smaller-scale and more
isolated disasters to be recorded. Others suggest that with international monitoring agencies like
the Belgium-based Centre for Research on the Epidemiology of Disasters (CRED) in operation, people
are encouraged to report the occurrence of natural hazards more than in the past thus the numbers
go up because of better recording rather than any other trend.
Decreasing numbers of deaths
What is interesting about the increase in the reported number of natural disasters is the fact that
there has been a decrease in the number of reported deaths due to these disasters. During the
period from 1900 to 1940, approximately 500,000 people were reported to have been killed by
natural disasters each year. After 1940, however, this annual death toll rapidly decreased, to the
point where in the early part of this century, the number of people killed by natural disasters each
year is less than 50,000.
Increasing numbers of people affected and economic costs
While fewer people die each year as a result of natural hazards, these events are affecting more
people than ever before. At the same time, they are taking a greater economic toll than in the past.
Since 1980, the average annual economic cost of natural hazards has risen from less than $20 billion
to more than $160 billion. In the same period, the number of people reported as being affected has
risen from an annual average of 100 million to more than 200 million.
Level of vulnerability is increasing
Hazards become disasters only when people get in the way. Unsustainable development involves poor
land use (e.g. building on floodplains, unstable slopes and coasts) and environmental degradation (e.g.
bleaching of coral reefs, destruction of coastal mangroves, and deforestation of water catchments).
This is increasing the vulnerability of millions of people.
Capacity to cope is decreasing
Communities need skills, tools and money to cope with the effects of climate change. However, debt
repayments, unfair trade arrangements, selective foreign investment, and rich countries directing aid
funds towards politically strategic regions rather than the neediest mean that the poorest and most
vulnerable communities lack these resources. Rural-urban migration is also undermining traditional
coping strategies.
The future
The most affected areas will be the poorest countries and communities in the world, particularly in
sub-Saharan Africa, parts of south-east Asia, and many of the small island developing states. The
future risk equation emphasises how the development gap between rich and poor countries is actually
widening.

7 Created by Natalie Garthwaite August 2010
How good are disaster statistics? Disaster statistics are reported by governments to UN agencies. There are several reasons to
question the data obtained:
There is no universally agreed numerical threshold for designating an event as a disaster, such
as 25 or 100 deaths, or 1% of the population affected, or 1% of annual GDP lost, or a
combination of these.
Reporting of disaster death numbers depends on whether direct (primary) deaths only or
indirect (secondary) deaths from subsequent hazards or associated diseases are counted.
Location is significant. Events in remote places away from the media spotlight are frequently
under-recorded. Around 10% of all data from the last 10 years are missing.
Declaration of disaster deaths and casualties may be subject to political influences. The
impact of the 2004 tsunami in Myanmar (Burma) was ignored by its government, but in
Thailand, where many foreign tourists were killed, the impact was initially overstated and then
played down to conserve the Thai tourist industry.
Magnitude and frequency
Magnitude is the size of a natural hazard event so represents the amount of work done (e.g. the
energy given off during a volcanic eruption).
Lower magnitude events, such as an earth tremor of Richter Scale 2.5, have less impact on people
than high-magnitude events, such as the earthquake which caused the 2004 south Asia tsunami,
measuring 9.1 on the Richter scale.
Frequency is the number of events of a given magnitude that occur over a period of time. Low
magnitude events are likely to have a more frequency recurrence level and therefore to present more
frequent but less devastating risks.
Contrasting trends
For geophysical hazards, the variations over time can be accounted for by the clustering of events
along mobile (usually destructive) plate boundaries. However, there is no solid evidence that the
frequency or magnitude of earthquakes or volcanic eruptions is increasing. Nevertheless, geophysical
activity remains a huge killer.
8 Created by Natalie Garthwaite August 2010
In contrast, the number of reported hydro-meteorological events is definitely on the increase. This
is likely to be associated with climate change. It is predicted that global warming will increase the
frequency, magnitude and impact of hydro-meteorological disasters. Another explanation of the
increased frequency of such disasters lies in the context hazard of increased environmental
degradation caused by population pressure
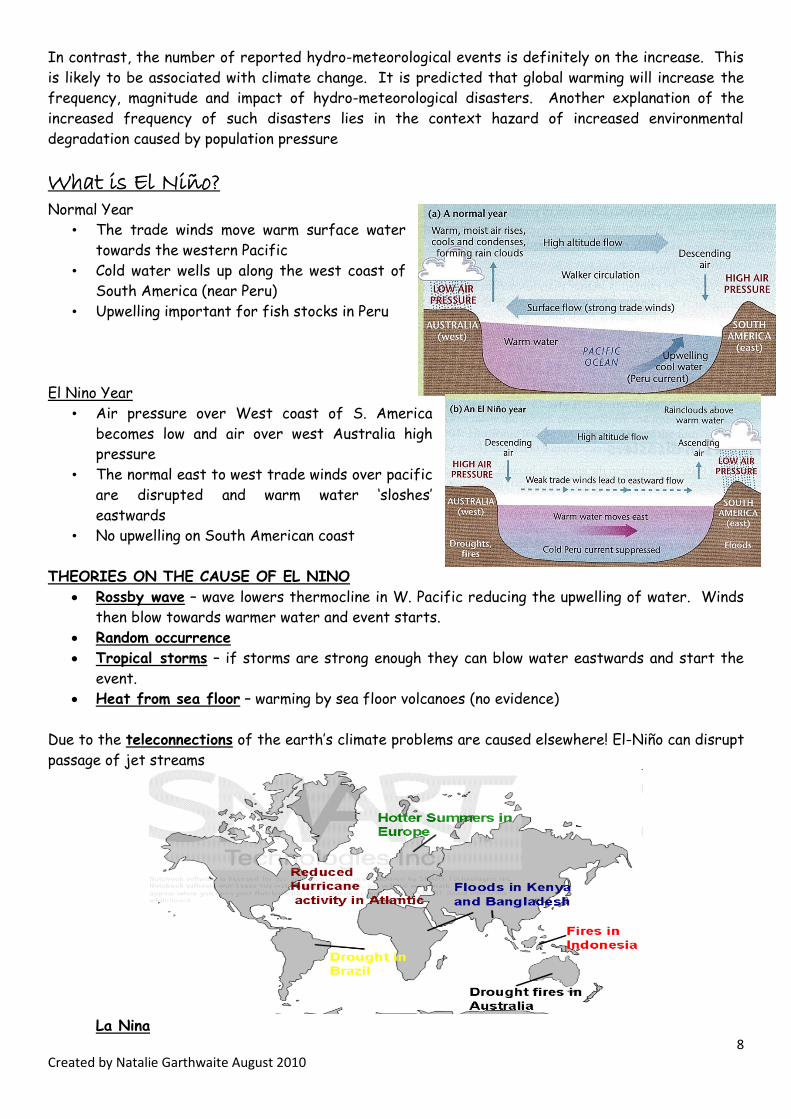
What is El Niño? Normal Year
• The trade winds move warm surface water
towards the western Pacific
• Cold water wells up along the west coast of
South America (near Peru)
• Upwelling important for fish stocks in Peru
El Nino Year
• Air pressure over West coast of S. America
becomes low and air over west Australia high
pressure
• The normal east to west trade winds over pacific
are disrupted and warm water ‘sloshes’
eastwards
• No upwelling on South American coast
THEORIES ON THE CAUSE OF EL NINO
Rossby wave – wave lowers thermocline in W. Pacific reducing the upwelling of water. Winds
then blow towards warmer water and event starts.
Random occurrence
Tropical storms – if storms are strong enough they can blow water eastwards and start the
event.
Heat from sea floor – warming by sea floor volcanoes (no evidence)
Due to the teleconnections of the earth’s climate problems are caused elsewhere! El-Niño can disrupt
passage of jet streams
La Nina

9 Created by Natalie Garthwaite August 2010
• Air pressure is unusually high over the
west coast of South America and low over
eastern Australia
• As warm water is pushed westwards sea
levels rise by up to 1m
• Around Indonesia and Philippines. Strong
uplift of air leads to heavy Rain!
Human factors in disasters Rapid population growth
Growing world population means
Pressure on land which leads to people living in high risk areas, such as low-lying flood-prone land
in Bangladesh
Growing numbers of very elderly people, e.g. there are concerns about the vulnerable elderly in
hazardous areas of the world such as Japan (prone to earthquakes) and Florida (hurricanes)
A growing proportion of the very young in developing countries who are also vulnerable in the
event of a disaster
Deforestation and land degradation
Pressure on land from growing populations also leads to:
Pressure on land to gain farmland, which can cause flooding and soil erosion and contributes to
climate change.
Destruction of mangroves as coastal areas are developed, which leads to coastal erosion and
flooding
Farming in marginal areas and deforestation for firewood, which leads to desertification
Urbanisation
Rural-urban migration and rapid uncontrolled growth of cities lead to:
The development of squatter settlements on areas at risk of landslides or flooding
Poverty and politics
Disasters tend to have a greater impact in poorer countries:
Earthquakes have much higher death tolls in less developed countries which cannot afford the
technology to build earthquake proof buildings
Developing countries may not be able to afford to prepare for emergencies (e.g. Bangladesh relies
on foreign aid to provide flood and cyclone shelters)
If populations are poorly educated and have little access to communications technology it is
harder to prepare them for disasters
It is difficult to get aid to remote areas with poor infrastructure such as roads and bridges

10 Created by Natalie Garthwaite August 2010
Corrupt governments may misuse resources, making disasters worse or prevent international aid
reaching their populations
The distribution of geophysical hazards The three main geophysical hazards are earthquakes, volcanoes and tsunamis. Knowledge of plate
tectonics is fundamental to understanding the occurrence of geophysical hazards.
Earthquakes
The main earthquake zones are clustered along plate boundaries. The most powerful earthquakes are
associated with destructive and conservative boundaries.
Plate tectonics
According to plate tectonics theory the lithosphere or Earth’s crust is divided into seven
major sections or plates, and a number of smaller ones. Some plates are oceanic (e.g. the
Pacific plate), others continental. These plates float on the underlying semi-molten mantle
known as the asthenosphere.
Hotspots from within the asthenosphere generate thermal convection currents which cause
magma (molten material) to ruse towards the Earth’s surface. This continuous process forms
new crust along the line of constructive boundaries, where the plates are diverging.

11 Created by Natalie Garthwaite August 2010
At the same time, older crust being destroyed at destructive boundaries, where plates
converge. The type of activity here depends on whether both plates are continental, both
plates are oceanic or an oceanic plate is being subducted or dragged down beneath a lighter
continental plate.
At conservative boundaries, two plates slide past each other and there is no creation or
destruction of crust.
The type of movement and the degree of activity at the plate margins almost totally controls
the distribution, frequency and magnitude of earthquakes and volcanic eruptions.
Destructive plate boundaries
Destructive boundaries where oceanic crust is being subducted beneath a continental plate, or
where two oceanic plates collide, produce a full range of earthquake types (shallow,
intermediate and deep). The force of compression as the plates meet causes stresses in the
crust, and when the pressure is suddenly released, the ground surface immediately above
shakes violently.
The point at which pressure release occurs within the crust is known as the earthquake focus,
and the point immediately above that at the Earth’s surface is the epicentre.
At the destructive boundaries where two continental plates are colliding to produce Fold
Mountains shallow, highly damaging earthquakes occur.
Constructive plate boundaries
Constructive plate boundaries (where oceanic plates are moving apart) are associated with large
numbers of shallow, low magnitude earthquakes as magma rises. Most are submarine so pose little
hazard to people.
Conservative plate boundaries
Conservative boundaries, where there is lateral crust movement, produce frequent shallow
earthquakes, sometimes of high magnitude: for example, San Andreas fault system
Other earthquakes
Occasionally, earthquakes can result from human actions such as dam and reservoir building, which
increase the weight and therefore stress on the land. These occur where there is no record of
earthquakes.

12 Created by Natalie Garthwaite August 2010
Earthquake hazards
Primary hazards result from ground movement and ground shaking. Surface seismic waves can
cause buildings and other infrastructure (e.g. pipes for water and gas supply) to collapse.
Secondary hazards include soil liquefaction, landslides, avalanches, tsunamis and exposure to
adverse weather. These can add significantly to the death toll.
Most of the injuries and deaths that occur in an earthquake are a result of people being hit by falling
roofs or being trapped in collapsed buildings. In the more developed world, and especially those parts
that are prone to earthquakes, buildings may be designed and engineered to withstand the vibrations
of an earthquake. Sadly, in less developed parts of the world, where buildings may be less rigidly
constructed or made from cheaper, readily available materials (including mud, bricks or stone), the
death toll from earthquakes can be significantly higher.
Volcanic eruptions
The world’s active volcanoes are found in three tectonics situations: at constructive and destructive
plate boundaries, and at hotspots. The type of tectonic situation determines the composition of the
magma and therefore the degree of explosivity of the eruption, which is a key factor in the degree
of hazard risk.
The materials ejected from volcanoes can include magma (molten rock, which when exposed above
ground, is referred to as ‘lava’), volcanic gases (such as hydrogen sulphide), ash and dust. An ‘active’
volcano is one which is in the process of erupting or showing signs that an eruption is imminent.
Constructive plate boundaries
Most of the magma that reaches the Earth’s surface wells up at oceanic ridges such as the mid-
Atlantic. These volcanoes are mostly on the sea floor and do not represent a major hazard to people
except where they emerge above sea level to form islands such as Iceland. Rift valleys occur where
the continental crust is being ‘stretched’.

13 Created by Natalie Garthwaite August 2010
Destructive plate boundaries
Some 80% of the world’s active volcanoes occur along destructive boundaries. Soufriere Hills in
Montserrat, West Indies is an example of a volcano formed where two ocean plates collide. The ‘ring
of fire’ around the Pacific has many such volcanoes.
Hotspots
Hotspots are localised areas of the lithosphere which have an unusually high heat flow, and where
magma rises to the surface as a plume. Hawaii is an example.
Volcanic hazards
Apart from the local impacts of lava flows the most catastrophic impacts of volcanoes are pyroclastic
flows, ash falls, tsunamis and mudflows.
The distribution of slides
Slides include a variety of rapid mass movements, such as rock slides, debris flows, snow avalanches,
and rainfall, and earthquake induced landslides.
Landslides
Landslides are the seventh biggest killer with over 1,400 deaths per year, ranking above both
volcanoes and drought. Most areas affected are mountainous, and experience landslides after
abnormally heavy rain and/or seismic activity.
Human factors also play a part. Deforestation of hillsides in Southeast Asia and building on
hill slopes in Hong Kong has both led to widespread slides following rain.
We associate landslides with high rainfall areas such as those located within the earth’s
tropics. Here, where hurricanes and monsoons can dump large amounts of rainfall in a matter
of hours, soil can very quickly become saturated.
Snow avalanches
Snow avalanches are concentrated in high mountainous areas such as the Southern Alps of
New Zealand or the Rockies of North America. Avalanches tend to occur on slopes steeper
than 35°.

14 Created by Natalie Garthwaite August 2010
An average of 40 deaths a year in Europe and over 100 in North America are caused by
avalanches. Recent research has suggested that global warming may be increasing avalanche
occurrence, although trends in deaths have slowed because of effective management.
The distribution of hydro-meteorological hazards Drought
Drought has a dispersed pattern – over one-third of the world’s land surface has some level of
drought exposure. This includes 70% of the world’s people and agricultural value, which means that
drought, has an effect on global food security.
A drought is an extended period of lower than average precipitation which causes water shortage.
Droughts can extend for as little as one year, during which the rainfall that is received is noticeably
lower than in average years. More often, however, a drought is a dry period that extends over two or
more growing seasons for years. Droughts can be localised, occurring in relatively small regions
(approximately the size of a country or state), or they can be much larger, affecting, at their worst,
entire continents. Includes large parts of Northern Africa, Central Asia and most of Australia.
Causes of drought
The causes of drought include the following:
Variations in the movement of the inter-tropical convergence zone (ITCZ). As the ITCZ moves
north and south through Africa, it brings a band of seasonal rain. In some years, high pressure
zones expand and block the rain-bearing winds. In southern Ethiopia and Somalia, where farmers
depend for food on rain-fed agriculture, famines may result if the summer rains never arrive.
El Nino can bring major changes to rainfall patterns. In particular, it can bring drought conditions
to Indonesia and Australia.
Changes in mid-latitude depression tracks. In temperate regions, depressions bring large amounts
of rainfall. However, if blocking anticyclones form and persist, depressions are forced to track
further north, leading to very dry conditions.

15 Created by Natalie Garthwaite August 2010
Drought hazards
Drought leads to failure of crops and loss of livestock, wildfires, dust storms and famine. It has
economic impacts on agriculture and water-related businesses in developed countries.
Flooding
Flooding is a frequent hazard and is evident in some 33% of the world’s area, which is inhabited by
over 80% of its population. Regional scale, high magnitude floods are frequent events in
India/Bangladesh and China.
A flood occurs when land that is usually dry becomes inundated. In most cases, floods occur after a
prolonged period of rainfall, which causes water course to burst their banks and overflow.
Sometimes, floods occur because the systems that have been designed to cope with average levels of
rainfall, such as storm water drains and levee banks, simply fail to work properly because of a
blockage or a structural weakness. Floods can even occur in regions that have experienced no recent
rainfall themselves.
Some areas are more prone to flooding than others. For example, the relatively low-lying nation of
Bangladesh is regularly inundated by melt waters that originate in the mountainous regions of its
neighbours India and Nepal.
Causes of flooding
By far the most common cause is excessive rainfall related to atmospheric processes, including
monsoon rainfall and cyclones. In temperate climates, a series of depressions sometimes brings
prolonged high rainfall.
Intense rainfall sometimes associated with thunderstorms can lead to localised flash flooding.
These sudden floods can have a devastating impact.
The El Nino Southern Oscillation can bring devastating floods, as in Mozambique in 1997 and
2006.
Rapid snowmelt can add water to an already swollen river system.

16 Created by Natalie Garthwaite August 2010
Flooding hazards
In developing countries flooding may lead to deaths by drowning and disease, destruction of food
crops and infrastructure and loss of homes. In developed countries it disrupts transport and
infrastructure, damages livelihoods and creates high insurance costs.
Storms
Storms include tropical cyclones, mid-latitude storms and tornadoes. Tropical cyclones are
violent storms between 200 and 700km in diameter. They occur in the latitudes 5-20° north
and south of the equator. Once generated, cyclones tend to move westward and are at their
height of destruction.
Tropical cyclones or hurricanes will only occur over warm ocean (over 26°C) of at least 70m
depth at least 5°N or 5°S of the equator in order that the Coriolis effect (very weak at the
equator) can bring about rotation of air.
Cyclones
The term ‘cyclone’ can be applied to any area of low atmospheric pressure that is created when air
rises from the surface of the earth. As the air rises into the atmosphere, it is cooled and
condensation occurs. This may result in the formation of clouds and eventually precipitation, both of
which often characterise low pressure systems. As the rising air is relatively unstable, cyclone can
also bring windy conditions and are often associated with storms. Tropical cyclones, also commonly
known as hurricanes and typhoons, are fuelled and formed by warm ocean water. Temperate cyclones
are formed when air of different characteristics converges and rises, drawn upwards by an
accelerating jet stream.
The most intense cyclones are those that develop over the warm waters of the earth’s tropics. Here,
the warmth of the tropical ocean rapidly heats the air lying just above its surface. As the air rises
into the atmosphere, condensation is rapid and cloud formation occurs quickly. The tropical cyclones
that result from this process are often very large, and their behaviour can be extremely hard to
predict. Tropical cyclones that begin life in the Atlantic Ocean are often referred to as ‘hurricanes’.
Those that begin in the Pacific Ocean are sometimes called ‘typhoons’ (Asia) or ‘cyclones’ (Australia).

17 Created by Natalie Garthwaite August 2010
Tropical storm hazards
Storms cause damage in several ways, including heavy rain (leading to floods and mudslides), high wind
velocity and very low central pressure (leading to storm surges and coastal flooding). They can be
devastating (e.g. Hurricane Katrina).
Disaster hotspots - Identifying and defining hazard hotspots These hotspots are multiple hazard
zones. The project assessed the risk of
death and damage. The level of risk was
estimated by combining exposure to the
six major natural hazards (earthquakes,
volcanoes, landslides, floods, drought
and storms). Historical vulnerability
(from data from the last 30 years) was
combined with potential vulnerability
based on size, density and poverty of
the population (as measures of
mortality) and GDP per unit area (as a
measure of potential economic damage).
Managing a hazard hotspot
The identification of multiple hazard zones has major implications for development and investment
planning, and for disaster preparedness and loss prevention. However, many hazard-prone areas have
long lists of priorities more immediate than risk management, such as poverty reduction, or fighting
HIV/AIDS, and may be unable to afford the technology required to cope with multiple hazards.
Most countries face some kind of hazard, but six countries stand out as being the most hazard-prone
in the world: the Philippines, Japan, India, Bangladesh, China and Indonesia.

18 Created by Natalie Garthwaite August 2010
COMPULSORY CASE STUDY: DISASTER HOTSPOTS: THE
PHILIPPINES Area: the Philippines consists of about 7000 islands, and is 25%
bigger than the UK
Population: 91 million in 2007
Wealth: GDP in 2006 was US$5000 per capita; a middle income
country according to the World Bank
Main problems faced:
It sits across a major plate boundary, so risks from volcanoes
and earthquakes
Its northern and eastern coasts face the Pacific, the world’s
most tsunami-prone ocean.
It lies within south-east Asia’s major typhoon belts. In most
years, it is affected by 15 typhoons and struck by 5 or 6 of
them.
Landslides are common in mountain districts due to
deforestation of many hillsides
Lower middle-income country rapidly growing population
high population densities especially coastal regions
Droughts these occur when the wet season (may-Oct)
hasn’t brought enough rain to last the dry season. In 2005 the reduction in rainfall decreased
the water flow in rivers, which affected power production from HEP plants.
Flooding during the wet season floods can be caused by typhoons and heavy rain.
Tectonic Risks: The Philippines lies on the boundary between two tectonic plates, the Philippine and
Eurasian. The Eurasian Plate is forced beneath the Philippine, creating the deep Manila Ocean
Trench, to the west. The plates move in a series of ‘jerks’, producing an earthquake each time they
do so.
Mount Pinatubo’s volcanic eruption in June 1991
Mount Pinatubo’s eruption was the biggest the world had seen for over 50 years. The volcano showed
signs of eruption in April 1991, with steam explosions and minor earthquakes. A 10km exclusion zone
was set up around Pinatubo by government advisers, who eventually extended the zone to 30km –
evacuating more people each time it was extended. By 9 June 1991, 58 000 had been evacuated

19 Created by Natalie Garthwaite August 2010
reaching 200 000 by 12 June (when the first eruption sent a cloud of ash 20km into the atmosphere,
spreading over South-East Asia within three days). The second eruption, on 15 June, was
cataclysmic, a dome on the side of the volcano collapsed, creating a pyroclastic blast and causing huge
lahars. However, effective monitoring and management reduced Pinatubo’s death and injury toll to
just over 4300 people.
350 people died, including 77 in the lahars that occurred.
Some evacuees died in camps, where they were exposed to disease
80 000 hectares of farmland were buried beneath ash, disrupting the livelihoods of 500 000
farmers and their family members
Economic losses were US$710 million mainly agriculture and property.
Landslides:
The Guinsaugon landslide
Guinsaugon was a village in the central Philippines. In February 2006, a mudslide completely engulfed
the village and its land, covering 3km² and killing about 1150 people. It was not unusual – a series of
storms in December 2004 killed 1800 people in the north-eastern Philippines. In 2003, 200 people
were killed in landslides. Typhoons and storms kill several thousand people there every decade.
The physical causes were:
There was unseasonable torrential rain; 2000mm of rain fell in 10 days in February – normally
the dry season
La Nina – a cyclic ocean and wind current affecting South East Asia – was probably the cause
of the rainfall.
A 2.6 magnitude earthquake struck just before the slide and may have triggered it
The human causes included: Deforestation of native forest cover protecting the soil. In 50 years, logging has reduced
several million hectares of forest to about 600 000 today
Replacement of native forest by shallow rooted trees, such as coconuts, further reducing soil
protection.
Other hazard risks
Some hazard risks in the Philippines are complex because they have multiple effects. One
earthquake in 2006:
Killed 15 people, injured 100 and damaged or destroyed 800 buildings
Generated a local tsunami 3 metres high
Triggered landslides which breached the crater wall of Parker Volcano, and then fell into
Maughan Lake...
...creating a flood which washed away houses
Government Responses:
In response, the government has established several organisations to carry out forecasting, warning,
hazard risk assessment, disaster training and education. These include the National Disaster Co-
ordinating Council; Philippine Atmospheric, Geophysical and Astronomical Services; and the Philippine
Institute of Volcanology and Seismology, Land use planning and building regulation, and structural
programmes of defences help people to survive the huge range of hazards facing them.
Sample Question: Using specific examples compare and contrast the Philippines with California as a
disaster hotspot (15)

20 Created by Natalie Garthwaite August 2010
COMPULSORY CASE STUDY: DISASTER HOTSPOTS: THE
CALIFORNIA COAST Area: the Philippines consists of about 7000
islands, and is 25% bigger than the UK
Population: 40 million
Wealth: economy is the world’s sixth largest,
bigger than France or Italy
Main problems faced:
1) Earthquakes – The San Andreas Fault runs
the length of California – Conservative plate
boundary. Has 2 or 3 earthquakes each year
2) Population – much of the coastline is
overcrowded - +70% live within 50km of a
fault line. Although a wealthy state around
20% of the residents live below the poverty line so have limited capacity to cope
3) Droughts – these can be caused by anticyclones (long-lasting periods of high air pressure with
sinking, dry air) or by La Nina events. Often leads to wildfires and in October 2007 22 people
were killed and 1300 homes destroyed by wildfires in Southern California
4) Tsunami – earthquakes under the Pacific ocean could cause a tsunami along the California coastline
5) Landslides – occur on unstable steep land. The risk of landslides is high in California because of
building on and around steep slopes, as well as building on coastal land overlooking the ocean
Plate tectonics and California
San Francisco seems like a city living on the brink of disaster. Its residents know that it lies along
the San Andreas Fault, where the Pacific Plate moves north-westwards past the North American
Plate. The two plates move in the same direction but the Pacific Plate moves move more quickly, thus
creating friction. This is called a conservative plate boundary. The San Andreas Fault is the
fracture – or fault line – between them. It runs along the Californian coast from Los Angeles north
to San Francisco. Other fault lines run parallel to the major fault; San Francisco is built over two of
them.
These faults move regularly, causing earthquakes. In 1906, San Francisco was destroyed in an
earthquake measuring 8.2 on the Richter scale. It fractured gas pipes (which caused explosions and
fires) and water mains (which could have prevented the spread of the fires). A further earthquake,
of magnitude 7.1, occurred in 1989. With is epicentre at Loma Prieta, it caused major damage and
deaths. Some buildings collapsed, while others were badly shaken. Five years later, a further
earthquake shook Northridge in Los Angeles.

21 Created by Natalie Garthwaite August 2010
The 1989 Loma Prieta earthquake in San Francisco
Date and time: 5.04pm, 17 October 1989
Magnitude and location: 7.1; epicentre Loma Prieta in the Santa Cruz mountains
A magnitude 5.2 aftershock struck the region 37 minutes after the main earthquake
63 people died and 13 757 were injured (most were killed when a freeway collapsed)
1018 homes were destroyed and 23 408 damaged
366 businesses were destroyed and 3530 damaged
The damage cost US$6 billion
The 1994 Northridge earthquake in Los Angeles
Date and time: 4.31am, 17 January 1994
Magnitude and location: 6.7; striking the densely populated San Fernando Valley in northern
Los Angeles
There were many thousands of aftershocks (mostly in magnitude 4.0-5.0) during the following
weeks, causing further damage
57 people died and over 1500 were seriously injured
12 500 buildings were damaged; 25% suffered severe-to-moderate damage
9000 homes and businesses were without electricity for several days (20 000 without gas),
and 48 500 people were without water
There was damage to several freeways serving Los Angeles – choking traffic for 30km.
Dealing with earthquake threats
What if there was another major earthquake? The panels above show that in wealthier countries the
economic damage can be great, whereas the impacts in developing economies tend to affect people.
To protect themselves, most Californians insure their property against earthquake damage. After
the Loma Prieta and Northridge earthquakes, demand for insurance rose sharply. But, by 1996, it had
dropped to below 1989 levels, and has declined further since. Many people avoid the cost of taking
out insurance.
Climatic patterns and California
California has a reputation as a state where the weather is always perfect, but it suffers periodic
changes which can be hazardous. Sometimes drought occurs and forest fires threaten, while at
other times floods and landslides provide headline news. Flood risks in California vary, but they
coincide with El Nino; forest fires and drought coincide with La Nina.
Practice Question: Using specific examples, explain why California is considered to be a disaster
hotspot (15)

22 Created by Natalie Garthwaite August 2010
Named Case Study: Hazard risk in your local area Northampton
Floods 1998
Location: Northampton lies 13
km east of Daventry and 17 km
west of Milton Keynes, at the
confluence of the River Nene’s
main tributaries, the Brampton
Branch and the Kislingbury.
Background: The majority of the
Far Cotton and St James areas
of Northampton were developed
in the 19th century, and these
areas had a history of flooding.
There had been no major
flooding in Northampton since
1939, and the core elements of
the flood defences in 1998 dated from this time.
Physical Causes:
With up to 3.2 times the average monthly rainfall totals over much of England and Wales.
Tuesday 7 April, an area of low pressure formed near Iceland. On 8 April this depression
moved southwards across the UK.
9 April, thunderstorms broke out ahead of it resulting in the ground reaching saturation point
in many areas.
Most of the rain fell in a band about 300 km long and between 50 and 100 km wide, stretching
from the Black Mountains in South Wales to the north of Cambridgeshire.
Many of the areas affected received more than 75 mm of rain – equivalent to 6 weeks of
average rainfall – in a 36-hour period.
Human Causes:
• Flood forecasting was handicapped by insufficient rainfall information which masked the severity of
the event.
• Flow measuring stations were poorly placed for flood monitoring and quickly became overwhelmed or
were by-passed altogether.
• Forecasting did not take into account that reservoirs upstream of the town were full prior to the
storm.
• River channels were poorly maintained in some places, with trees and debris reducing the storage
capacity of the channel.
• Flood defences were poorly maintained and funded – some defences had 4 metre gaps in them.
• Arrangements for direct warnings to the public were not in place, as the Environment Agency did
not see Northampton as being a high-risk area.

23 Created by Natalie Garthwaite August 2010
Consequences:
During the night of 9/10 April 1998 more than 2,400 properties in Northampton were
affected.
Power supplies were cut off, and as most people were asleep in their beds, there was little
time to take action to reduce damage
Water polluted with sewage, heavy metals and mercury had swept through 2,500 properties.
One in three households in St James was uninsured; 5,000 cars in the area were written off.
The Borough Council estimates its own expenses as a result of the flood to be somewhere in
the region of £6 million.
The Northampton Flood Relief Fund was established and over £160,000 was collected to help
flood victims.
The future
The Borough Council argued that all developments had been subject to planning permission and that
adequate flood protection measures had been taken. Now, the Borough Council will not grant planning
permission for any new Greenfield development on the floodplain, but admits that it finds it far more
difficult to refuse planning permission on existing Brownfield sites. Northampton is the sixth
fastest-growing town in the UK, with an average of 2,000 new inhabitants arriving each year, and the
Council must balance the risk of another severe flood against the need to continue to encourage new
industrial and residential developments in the town. Environment Agency has placed four flood
warning sirens – two in Far Cotton and two in St James – to alert residents to the risk of flooding as
early as possible.

24 Created by Natalie Garthwaite August 2010
NAMED CASE STUDY: Boxing Day tsunami, 2004
Tsunamis occur where:
Earthquakes measure more than 6.5 on the Richter Scale
The earthquake’s focus is shallow beneath the Earth’s surface
The focus is also beneath the ocean
The earthquake that caused the Boxing Day tsunami was estimated at between 9.0 and 9.3 on the
Richter scale, and was over 100 times stronger than the one which caused the Kobe earthquake in
1995. The thrust heaved the floor of the Indian Ocean towards Indonesia by about 15 metres, and,
in so doing, sent out shock waves. Once started, these radiated out in a series of ‘ripples’, moving
almost unnoticed across oceans until they hit land. The longer and shallower the costal approach, the
more the ripples built up in height. The waves that struck the shallow coastline near Banda Aceh
(only 15 minutes from their origin), and parts of Sri Lanka were nearly 17 metres high on impact.
Sri Lanka – who died in the 2004 tsunami?
Sri Lanka was the second most seriously affected country after Indonesia, with over 30 000 deaths,
5 700 people missing and 861 000 people displaced. One survey carried out in Ampara (an eastern
coastal district of Sri Lanka) found that the most vulnerable people had suffered the most. This
area had previously experienced rapid coastal urbanisation. Its economy is also based on tourism and
subsistence fishing, which left it vulnerable to the tsunami.

25 Created by Natalie Garthwaite August 2010
In this part of Ampara, out of a population of 3533
(living in 859 households), 12.9% died. Of these:
Most deaths occurred during and
immediately after the disaster
More than double the number of women died,
compared to men
56% of victims were children
The elderly and disabled were more likely to
die than young, healthy adults; 15% of deaths
were of people aged over 50
Other factors which increased people’s vulnerability
were:
Whether they were indoors at the time of
the tsunami (13.8% of casualties). Women
and children were more likely to be inside on
the morning of the tsunami. Even compared
with those on the beach or in the sea, people
at home were more likely to die.
The quality of the building they were in,
either in terms of its structure or its location and exposure to the full force of the waves.
14% of deaths occurred in buildings that held up well or withstood the initial impact.
Whether they belonged to a fishing family (15% of deaths)
Whether they had lower educational qualifications. Those with higher educational
qualifications were 20% less likely to die if educated to secondary level, and 60% less likely if
educated to university level. University educated people earn more and could afford to live
away from high-risk locations.
Whether they earned lower incomes. In Ampara, 15 000 rupees (US$150) per month is a high
wage. Most deaths occurred in households earning 1-2999 and 3000-5999 rupees, with few
deaths in the highest earnings category.
Environmental change and the tsunami
One clear factor has emerged from several countries affected by the tsunami – the countries which
suffered most were those where the tourism industry has grown rapidly in recent years. Many
coastal areas of Thailand and Sri Lanka have been cleared of coastal mangrove swamps to make way
for hotels and resorts. Mangroves act as a natural barrier, absorbing wave power and creating a
natural coastal buffer zone. Damage from the tsunami was noticeably reduced in coastal areas which
had maintained their mangrove swamps, beach forest and coral reefs.

26 Created by Natalie Garthwaite August 2010
Climate change and its causes
Climate change is any significant change in the weather of a region over a period of at least several
decades
Long-term climate change temperatures have been much higher at some points in the past than
they are today. Climate has shifted between cold glacial periods that lasted around 100,000 years
and warmer interglacial periods that lasted around 10,000 years.
Medium-term climate change the last glacial period ended 18,000 years ago and the warming of the
climate was fast but not always constant. Around 5,000 years ago temperatures were 1-2°c higher
than today
Short-term climate change there has been a sharp rise in temperature over the last 1000 years.
Global temperatures rose steadily from early 20th century until the 1940s, and then dropped back
down. Temperatures however have since risen rapid since the 1970s (global warming)
27 Created by Natalie Garthwaite August 2010
What is the evidence? Long Term change Ice cores – scientists
can analyse the gases
trapped when the ice
was formed to tell
what the temperature
was each year. Then
they can figure how
temperature has
changed over time.
Pollen analysis – pollen
from plants is
preserved in sediment
and can be identified
and dated so know
what the conditions
were like at that
particular time
Sea level change – past
sea levels are shown by
raised beached e.g.
Isle of Arran
Medium change Historical records –
indirectly indicate the
conditions e.g. paintings
Tree rings – a new tree
ring is formed each
year as a tree grows,
wide rings show good
growing conditions,
narrow periods of
climate stress. Show
climate conditions up
to 10,000 years ago
Retreating glaciers –
the distance from the
rocks deposited by the
glacier up to its
current position
indicate the
temperature changes
Short-term change Weather records –
consistently collected
since 1861 and show
detailed climate
changes
Polar ice melt –
changes in the extent
of polar ice shows
changes in climatic
factors affecting them
Ecosystem changes –
affects the availability
of food and shelter, as
well as what species
can live in an area
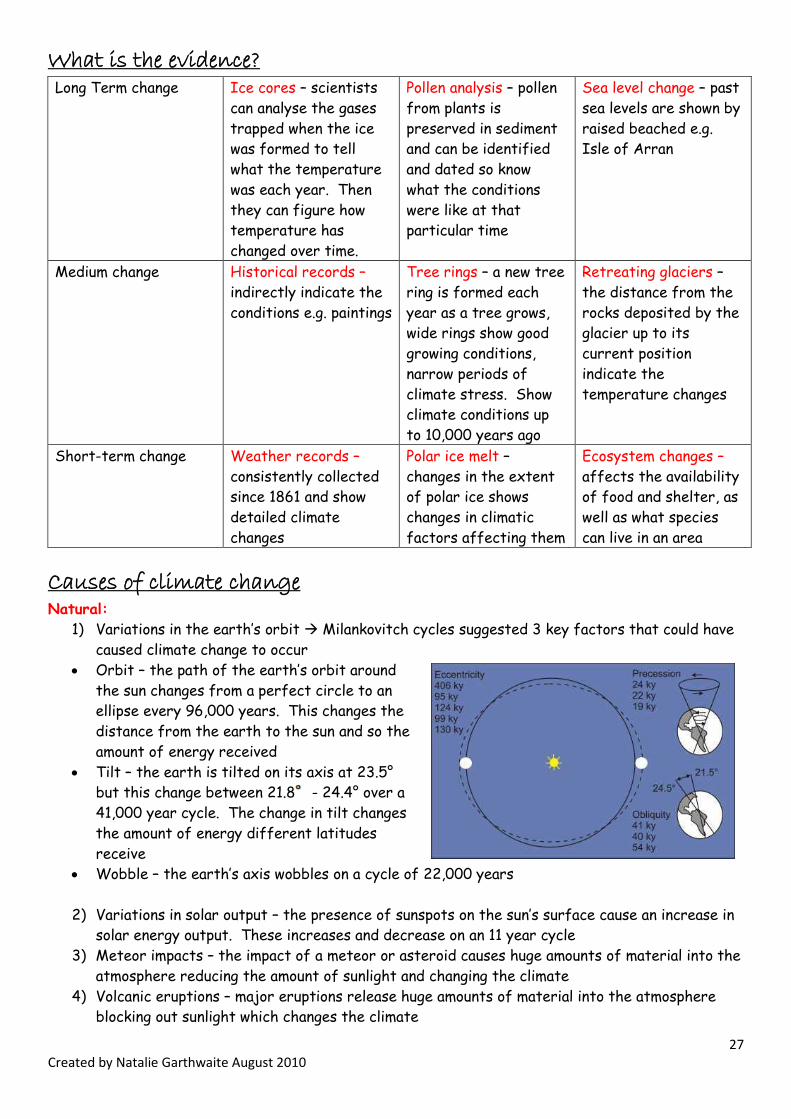
Causes of climate change Natural:
1) Variations in the earth’s orbit Milankovitch cycles suggested 3 key factors that could have
caused climate change to occur
Orbit – the path of the earth’s orbit around
the sun changes from a perfect circle to an
ellipse every 96,000 years. This changes the
distance from the earth to the sun and so the
amount of energy received
Tilt – the earth is tilted on its axis at 23.5°
but this change between 21.8 - 24.4° over a
41,000 year cycle. The change in tilt changes
the amount of energy different latitudes
receive
Wobble – the earth’s axis wobbles on a cycle of 22,000 years
2) Variations in solar output – the presence of sunspots on the sun’s surface cause an increase in
solar energy output. These increases and decrease on an 11 year cycle
3) Meteor impacts – the impact of a meteor or asteroid causes huge amounts of material into the
atmosphere reducing the amount of sunlight and changing the climate
4) Volcanic eruptions – major eruptions release huge amounts of material into the atmosphere
blocking out sunlight which changes the climate

28 Created by Natalie Garthwaite August 2010
Human:
1) Enhanced greenhouse gas emissions – the greenhouse effect is a natural phenomenon and is
essential for keeping the planet warm however, increased presence of greenhouse gases such
as carbon dioxide, methane etc. causes too much energy to become trapped and warms up the
planet
2) Destruction of natural C02 sinks – the biggest sinks are the oceans and plants. Co2 is released
into the atmosphere when trees are burnt by forest fires or to make way for agriculture

29 Created by Natalie Garthwaite August 2010
Impacts of climate change
Compulsory Case Study – Impact of climate change on the Arctic
Region Facts:
Average Artic temperatures have risen at x2 the rate of the rest
of the world (3-4°c in the last 50 years)
Over the next 100 years they are expected to rise a 3-5°c over land
and 7°c over the oceans
Suffers from positive feedback (albedo effect) – small increases in
snow and ice raise the surface reflectivity so more solar energy is
reflected back into space. By an increase in global temperature
snow and ice melting less radiation is reflected more ice melts
= vicious cycle
Impacts
Natural systems Animal species Society
Vegetation shifts – predicted to
move northwards with coniferous
forests moving into ice areas
impact on food webs
Warmer growing season = growth
of agriculture
Northward species shift –
shift north with the forests
decline in some species
Loss of hunting culture and
decline of food security for
indigenous population
Permafrost thawing – up to 40%
expected to thaw releasing huge
amounts of methane. Melting to
cause new wetlands and impact
on species
Marine species – those
dependant on sea ice e.g.
polar bears will
decline/extinct. Birds to
have different migration
patterns
Need for herd animals e.g.
reindeer to change their
migration routes
Increased fires and insects –
increase in insect caused tree
death = loss of valuable habitats
Land species – many species
that have adapted to the
artic climate are at risk e.g.
artic fox, vole
Decline in northern
freshwater fisheries but
enhanced marine fisheries e.g.
cod to warmer waters
UV impacts – Increase UV
reaching the surface = loss of
snow and ice. Destroys
phytoplankton as the base of the
marine food we
Increased access for marine
shipping but disruption of
land-based transport due to
permafrost thawing
Carbon cycle changes – replacing
artic vegetation = more forests =
higher primary productivity and
increase carbon dioxide intake
Enhanced agriculture and
forestry
Other – increased coastal
erosion and waves/storm surges
as protection from sea ice is lost
New land and open sea so
Artic becomes more accessible
= exploitation for oil, gas, fish
etc.

30 Created by Natalie Garthwaite August 2010
Compulsory Case Study – Impact of climate change on Africa Due to the variety of climates in Africa global warming will have different impacts on different
areas:
- Areas that are already dry e.g. arid or semi-arid will get drier
- Wetter areas e.g. tropical or sub-tropical will get wetter
- Whole continent is getting warmer – 0.5°c in the last century
Africa’s population are also very VULNERABLE as the poor people have a reduced capacity to cope
and are less able to prepare for and respond to the impacts of climate change.
Potential Exam Question: Explain the
environmental and ecological impact of
global warming in a named area of the
world (10)
Water issues:
- Demand outstrips supply for 25%
of Africans
- Water stress could lead to wars,
global migrations and famine
Food insecurity:
- 70% of population are subsistence
farmers, who won’t be able to feed
themselves if water supplies dry up
- Increase in locust plagues expected
Health:
- Increase in malaria and water-
borne diseases
- 80% of health services rely on wild
plants for remedies which are under
threat
Natural Resources:
- Poor people rely directly on wild
plants and animals
- Loss of biodiversity will threaten
them
Development of coastal zones
- Movement of environmental
refugees with put pressure on
coastal zones as they set up shanty
towns
- 60% live in coastal zones which are
at risk of coastal flooding and
erosion
Desertification
- This is increased by
unreliable or
decreasing rainfall
Poverty:
- 2/3rds of the least developed countries are
located in Africa
Debt crisis – most African countries can only
reduce their debt through the production of
cash crops which has led to forest clearance for
commercial farming. This combined with global
warming will create drought, desertification and
place Africa’s food security under threat
Impacts!

31 Created by Natalie Garthwaite August 2010
Indirect impacts of global warming: Rising sea levels
The worst case scenario predicts a 15m rise in sea level by 2100 which would put major cities such as
London, New York and Tokyo at risk. This is because the melting of the ice on land e.g. Greenland
means that water stored as ice returns to the sea. This increases the volume of water in the oceans
causing the sea level to rise (EUSTATIC). Combined with thermal expansion, the volume of water
contained in the oceans will also increase as the oceans get warmer.
Vulnerable areas:
Named area: Low-lying = Bangladesh 80% of the land area is low-lying (less than 6m above sea level)
Could lose up to 20% of its land, displacing up to 40m people
Threaten to reduce supplies of food and fresh drinking water and damage agricultural land
(65% population are subsistence farmers)
Multiple hazard zone = river floods, coastal floods, storm surges and typhoons)
Vulnerable population with a low capacity to cope
Named area: low-lying but already defended: Netherlands One of the richest countries in the world
Over 50% of land are is reclaimed from the sea (polders) so sits below sea level
Densely population and heavily developed
Complex protection system of dukes and coastal sand dunes
A 1m rise in sea level would cost $12,000 million to defend
Named area: Small, low-lying island: The Maldives 311,000 people – dense and growing populations
1,196 islands, most just 2m above sea level – also small physical size means nowhere to flee
Prone to natural disaster e.g. hurricanes –
Vulnerability of groundwater to contamination by sea water
A rise in sea level of 0.5m would submerge most of the country
The economy is dependent on tourism, which would be threatened by a rise in sea level
Changing Salinity – oceans and winds help distribute heat between its warmest and coldest parts.
They transport heat from the equator towards the poles. The current of warm water in the Atlantic
is known as the Gulf Stream and the North Atlantic Drift ensures the UK’s climate is warmer than it
should be for its latitude. More freshwater is entering the oceans which lowers the salinity and
decreases the density of the oceans. This affects these warm currents and some say could turn off
the North Atlantic Drift

32 Created by Natalie Garthwaite August 2010
Predicting the impacts of Climate change Scientists try to predict how emissions will change in the future, so that they can try to predict the
change in climate and its impacts. The Intergovernmental Panel on Climate Change (IPCC) have
produced a number of emissions scenarios. In 2007, greenhouse gas levels stood at 430ppm carbon
dioxide (280ppm before Industrial revolution).
It is difficult to predict the impacts
because:
1) We don’t actually know how emissions
will change
2) We don’t know how much of the
emissions will be absorbed in natural
CO2 sinks
3) We don’t know the exact climate
changes each emission scenario will cause
4) The extent of climate change due to
natural causes isn’t know
5) We don’t know what attempts to manage
climate change there will be or how
successful

33 Created by Natalie Garthwaite August 2010
Concept of a ‘tipping point’ The tipping point is reached when climate change occurs irreversibly and at an increasing rate. This
was originally agreed that this was at a certain level of greenhouse emissions (450ppm carbon
dioxide) and a threshold temperature rise of 2°c. This may happen because of positive feedback
loops – where a change in the climate is speeded up by the impacts already causes e.g. Albedo effect!
In 2006 the UK government published the Stern Review which focused on the impacts of global
warming and the actions needed to deal with them.
Environmental impacts of global warming:
Increasing flood risk
Declining crop yields e.g. Africa as climate belts shift
Rising sea levels, leaving 200m people permanently homeless
Extinction of 40% of the earth’s species
Economic impacts of global warming:
More extreme weather could reduce global GDP by 1%
A 2-3°c rise in temperatures could reduce global economic output by 3%
If temperatures rise by 5°c, 10% global output could be lost
How strategies can attempt to limit the impacts of climate change at
various scales
Mitigation vs. Adaptation?
Mitigation means reducing the output of greenhouse gases and increases the size of greenhouse gas
sinks e.g. setting targets to reduce emissions or capturing carbon emissions from power stations
Adaptation means changing our lifestyles to cope with a new environment rather than trying to stop
climate change e.g. managed retreat from vulnerable coastlines or developing drought-resistant crops
The ability for a country to adapt is linked to the level of development. Most adaptation strategies
will be local in scale as they need to be tailored to local impacts of climate change. Mitigation on the
other hand occurs at a range of scales from global to local e.g. international agreements to individual
governments deciding how agreements should be implemented.
34 Created by Natalie Garthwaite August 2010
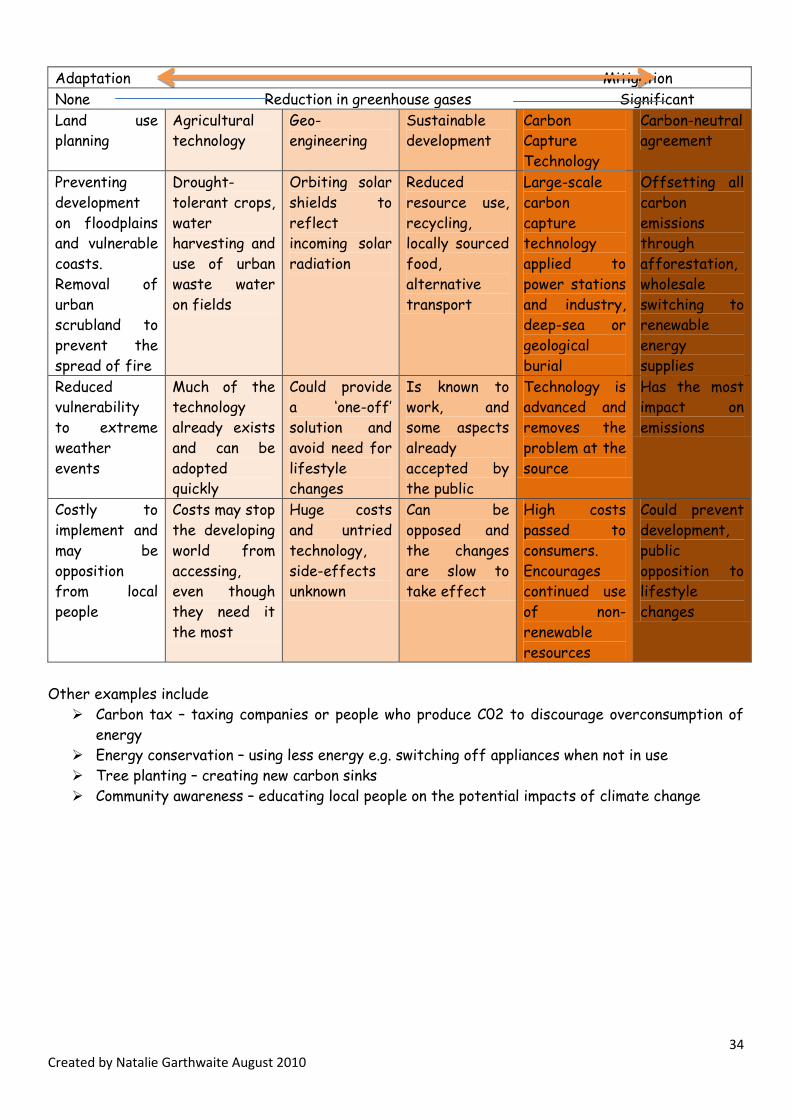
Adaptation Mitigation
None Reduction in greenhouse gases Significant
Land use
planning
Agricultural
technology
Geo-
engineering
Sustainable
development
Carbon
Capture
Technology
Carbon-neutral
agreement
Preventing
development
on floodplains
and vulnerable
coasts.
Removal of
urban
scrubland to
prevent the
spread of fire
Drought-
tolerant crops,
water
harvesting and
use of urban
waste water
on fields
Orbiting solar
shields to
reflect
incoming solar
radiation
Reduced
resource use,
recycling,
locally sourced
food,
alternative
transport
Large-scale
carbon
capture
technology
applied to
power stations
and industry,
deep-sea or
geological
burial
Offsetting all
carbon
emissions
through
afforestation,
wholesale
switching to
renewable
energy
supplies
Reduced
vulnerability
to extreme
weather
events
Much of the
technology
already exists
and can be
adopted
quickly
Could provide
a ‘one-off’
solution and
avoid need for
lifestyle
changes
Is known to
work, and
some aspects
already
accepted by
the public
Technology is
advanced and
removes the
problem at the
source
Has the most
impact on
emissions
Costly to
implement and
may be
opposition
from local
people
Costs may stop
the developing
world from
accessing,
even though
they need it
the most
Huge costs
and untried
technology,
side-effects
unknown
Can be
opposed and
the changes
are slow to
take effect
High costs
passed to
consumers.
Encourages
continued use
of non-
renewable
resources
Could prevent
development,
public
opposition to
lifestyle
changes
Other examples include
Carbon tax – taxing companies or people who produce C02 to discourage overconsumption of
energy
Energy conservation – using less energy e.g. switching off appliances when not in use
Tree planting – creating new carbon sinks
Community awareness – educating local people on the potential impacts of climate change

35 Created by Natalie Garthwaite August 2010
Key Player Role Conflicts Example
Businesses e.g. Shell Can be responsible
for contributing to
climate change or
can help to slow it
down.
Can lobby governments to reduce
restrictions and allow them to
continue producing greenhouse gases
Argue that reducing pollution costs
jobs, money and profits
Have funded research to counter
the warnings about global warming
Shift towards being more ‘green’ as
pressure mounted
Shell
Pumps C02 from an oil refinery into 500 greenhouses
growing fruit in the Netherlands which:
- Avoids annual emissions of 170,000 tonnes
- Saves greenhouse owners from turning 95m3 of gas
to get the C02 they need for heat retention
Governments Develop strategies
on an international,
national and local
scale
Often public opposition to some of
the proposals e.g. wind power
turbines are noisy and an eye-sore
UK
Aim: Reduce carbon dioxide emissions by 60% by 2050
- 10% of electricity to come from renewable sources by
2010
- 20% by 2020
- Tax system introduced so that choosing to drive a large
car costs, more as it pollutes more
London Congestion Charge
Since 2003 drivers have been charged £8 per day to drive
in the central London zone
- Traffic levels down 15%
- Congestion down 30%
- Road traffic accidents down 5%
- 12% decline in C02 and NOx in the zone
- No effect on businesses
- £170m income in the first 2 years
Groups e.g. EU Work together to
suggest solutions
that Europe could
implement
Forces businesses to move to other
areas which do not have the limits
Companies passed the cost of the
credits onto the customers
Does not lead to investment in green
technology
European Emissions Trading Scheme (ETS)
Began in 2005 and is the world’s only compulsory ‘cap and
trade’ system. Sets a limit on the emission of a pollutant
(cap) but allows companies that are within the set limit to
sell credits to companies who need to pollute more (trade).
- Covers 50% of all EU carbon emissions
Key Players in Climate Change

36 Created by Natalie Garthwaite August 2010
International Agreements e.g. Kyoto Protocol 1997 Industrialised countries were expected to cut their overall emissions by 5% below their 1990 levels by 2008-12.
How Successful?
Some countries delayed signing e.g. Russia signed in 2004
Some countries never signed e.g. Australia – world’s 2nd biggest per capita producer
Industrialised countries such as UK did cut emissions by 3% below their 1990 by 2000
UN says currently off target and expected to by 10% above 1990 by 2010
Developing countries signed up but did not have to commit actual figures
Many scientists believe the targets were too low and needed 60%
Communities/individuals Strategies
developed at a large
scale are carried out
at a local level
People have no say in the strategies
that are implemented e.g. 2 weekly
bin collections
Conflict regarding lifestyle changes
UK Recycling
- Government target is 30% of domestic waste to be
recycled by 2010
- Funds advertising campaigns to persuade people to
recycle
- Local council provides recycling bins, boxes and can fine
you if you refuse
Individuals can also be more responsible by switching to
energy efficient light-bulbs, using public transport etc.
NGOs Use climate change
as a selling point to
keep climate change
in the news
Conflicting views with local
governments who are looking to
develop through unsustainable means
e.g. China
Conflict with businesses as they
place increasing pressure on them to
go greener
Greenpeace
Have produced 8 papers outlining how each sector could
prevent dangerous climate change. They aim to :
Get companies to quit coal in favour of wind and solar
power
Protect forests so they can continue to clean the
atmosphere
Switch to natural refrigeration
Encourage IT companies who offer climate solutions and
good environmental laws
For the UK?
Change from coal to gas-fired power stations has
reduced emissions
Renewable energy policy to produce 10% of
electricity
Government taxed petrol more highly to try to
cut demand – protests!
Needs to be a shift to nuclear power but huge
public opposition

37 Created by Natalie Garthwaite August 2010
‘Act local, think global’ International agreements help at the largest scale, but changes need to be co-ordinated at all levels.
Most people think the ‘act local, think global’ approach is the way forward, as individuals can make
small changes that will help the global problem e.g. reduce their carbon footprint.
Some people believe that if everyone took steps to decrease their carbon footprint, it would make a
big different, whilst others believe that individual impacts aren’t significant. However, if every light
bulb in London was an energy-efficient one it would save 575,000 tonnes of carbon dioxide emissions
each year.
It is however likely that changes to emissions will be incremental (steps, rather than constantly) as
large-scale initiatives and changes to attitudes cause sudden changes
The challenge of global hazards for the future
1) Water Shortages
Water demands estimated to rise by 50%
50% of the world’s population will face severe water shortages by 2025
In the Andes and Himalayas the disappearance of glaciers means that people can no longer
rely on glacial melt water as a water source
2) Food insecurity
Results from either a lack of available food due to physical factors such as climate, or
adequate food but individuals are too poor to access it
Higher temperatures stress crops and reduce yields
Higher concentration of carbon dioxide seeds plant growth and increase resilience to
water stress
Certain areas with have more rainfall e.g. east Africa
Higher temperatures can promote grow of crop pests and diseases
Crop yields could drop by up to 10% for every 1°c temperature rise in Asia
The problems of water shortages and food security will cause political disputes between countries
and can lead to armed conflict. Examples include the River Nile, which supplies Egypt, Ethiopia and
Sudan. If global warming continues to cause droughts in Sudan and Ethiopia they will be forced to
take more water from the Nile, effecting Egypt’s supply. Egypt has said they will use force to
protect its access to the Nile. Conflict, famine, poverty and climate change makes managing global hazards more difficult due to the downwards cycle that occurs

38 Created by Natalie Garthwaite August 2010
Vicious cycle of climate change
Tackling the challenge of global warming Energy Efficiency
Reduced emissions and also cuts costs and local pollution
Examples include – green transport using new or greener fuels or remodelling houses for
greater efficiency
Named Example: India and China Rapid economic growth (6-10% per year) and have a critical part to play in controlling
emissions
India’s greenhouse emissions could rise by 70% by 2025
India’s energy consumption rose by 280% between 1980-2201 and nearly ½ population still
lacks regular access to electricity
Most of new energy will need to come from coal – China builds 1 coal-fuelled power station
every day
They can get the international community to pay for improvements under the Kyoto agreement
without limiting their own development e.g. Clean Development Mechanism (CMD) allows
developed countries to sponsor gas-cutting projects in exchange for carbon credits to meet
their own targets

39 Created by Natalie Garthwaite August 2010
Green Strategies
Tree planting – in the first 10 years of its life, a growing tree releases more carbon dioxide
then it stores but after this they become a carbon dioxide store. Under Kyoto countries can
claim carbon credits for new planting
Renewable energy – these range from large scale e.g. Three Gorges Dam in China, to small
scale biomass cooking
Named example: Community hydropower in Kenya - Provide lighting, radio and telecommunications to 200 households
- Saves 42 tonnes of carbon dioxide as no kerosene is needed
Community based solutions – these are ‘bottom-up’ and are developed by local people for local
people
Named Example: Wolvercote, Oxfordshire - This village has created a number of schemes to lower the village’s carbon footprint
- Each road has waste champions who organise rubbish swaps of unwanted items and take surplus to
recycling centre
- Information circulated on the best ways to reduce carbon emissions
- Green transport strategies – car shares for work, safe cycling
- Cloth bags available to cut down on the use of plastic bags
Solutions to a hazardous world, at all scales, need to focus on the
underlying issues of risk and vulnerability
Named Case Study: Tackling increasing flood risk in Bangladesh Background:
World’s most densely populated country (population 142m in 2005)
Largest system of mega-deltas in the world
Every year huge areas flood due to Himalayan snowmelt, monsoon rains and high tides in the Bay of
Bengal
60% of country lies 1m above sea level
Impacts of global warming:
Glacier melt in the Himalayas will increase flooding by 2030
Increased water temperatures will cause increasing number of bacteria and water-borne
diseases
Coastal areas at risk from flooding and seawater contamination destroy crops and increase
risk of hunger
Tens of millions of people could be displaced if Bangladesh was permanently lost to the sea
Increase in numbers of intense tropical cyclones
Adapting to global warming:
Technology In 1990s the capital, Dhaka cleared 102km of drains and opened up 633
channels to improve drainage
Early warming/flood prediction enables people to be evacuated quickly and flood shelters
built on raised ground (targeted at most vulnerable)

40 Created by Natalie Garthwaite August 2010
Behavioural changing land uses and food choices. Stopping urban growth in areas of flood
risk
Managerial improving sanitation, waste management and slum improvement in the worst
areas, so water infections from disease during floods are reduced
However, the issue Bangladesh faces in terms of adapting to climate change is in terms of funding.
As well as this there population is very vulnerable and although it has some of the worlds most
sophisticated flood monitoring it is not sure whether it will be able to survive.

41 Created by Natalie Garthwaite August 2010
What questions have been asked?
Choose either the Philippines or California and explain why it is considered a disaster hotspot (10)
Suggest how melting ice in the Arctic might a. bring advantages and b. create problems for people
there and elsewhere (10)
Why does climate change present potential problems for the African continent? (10)
Explain why international agreements are essential if anything effective is to be done about global
warming (15)
Using examples, explain why hazard events sometimes bring more problems for some people and
societies than other (10)
Explain how evidence can support arguments for both a. natural and b. human causes of global
warming (10)
Explain how people are attempting to deal with the effects of global warming at either a local or a
global scale (15)
Describe and explain how the number of deaths and the amount of economic loss caused by
disasters is changing (15)
Outline the sources of evidence for long-term climate change (10)
Describe and explain how human activity is affecting climate change (15)
With reference to the IPCC emissions scenarios, explain why the impacts of global warming are
difficult to predict (15)
Explain the environmental and ecological impacts of global warming in a named area of the world
(10)
Using a named example, explain why global agreements on coping with climate change are complex
(15)
Explain how global warming could increase water shortages, famine and conflict (10)
Suggest reasons for the trends in natural disasters shown in the graph.(10)

42 Created by Natalie Garthwaite August 2010
Suggest what this survey, carried out in the USA, shows about people’s views on global warming.
(10)
Suggest why droughts, such as the one shown, have severe impacts on people and the environment.
(10)
Explain the increasing frequency of hydro-meteorological hazards (such as cyclones, storms,
droughts or floods). (15)

43 Created by Natalie Garthwaite August 2010
Suggest why action needs to be taken at different scales to reduce the rate of global warming.
(10)
Explain why some governments are more willing than others to help tackle climate change. (15)
Suggest why many megacities could face increased vulnerability to natural disasters.(10)
Explain how global warming and El Niño events may lead to increasing natural hazards. (15)
Suggest ways in which climate change might affect Africa’s physical environment. (10)

44 Created by Natalie Garthwaite August 2010
Examine the possible economic impacts of projected climate change for the African continent.
(15)