Embed Size (px)
Citation preview

UNFCCC/CCNUCC CDM – Executive Board AM0031 / Version 01 Sectoral Scope: 07 28 July 2006
Approved baseline methodology AM0031
“Baseline Methodology for Bus Rapid Transit Projects”
Sources This baseline methodology is based on the proposals NM0105-rev “Baseline Methodology for Bus Rapid Transit Projects,” whose baseline methodology was developed by Gruetter consulting. For more information regarding the proposal and its consideration by the Executive Board please refer to http://cdm.unfccc.int/methodologies/approved. This methodology also refers to the latest approved version of the “Tool for the demonstration and assessment of additionality”, which is available on the UNFCCC website http://cdm.unfccc.int Selected approach from paragraph 48 of the CDM modalities and procedures Existing actual or historical emissions, as applicable; Applicability The methodology is applicable to project activities that reduce emissions through the construction and operation of a Bus Rapid Transit (BRT) system for urban road based transport. The methodology is also applicable for extensions or expansions of existing BRT systems (adding new routes and lines). The following applicability conditions apply:
• The project has a clear plan to reduce existing public transport capacities either through scrapping, permit restrictions, economic instruments or other means and replacing them by a BRT system.
• Local regulations do not constrain the establishment or expansion of a BRT system • The fuel(s) used in the baseline and/or project case are unblended1 gasoline, diesel, LNG or CNG.
Projects using biofuels either in the baseline or project case are not eligible to use this methodology.2
• The BRT system as well as the baseline public transport system and other public transport options are road-based (the methodology excludes rail, air and water-based systems from analysis).
• The BRT system partially or fully replaces a traditional public transport system in a given city. The methodology cannot be used for BRT systems in areas where currently no public transport is available.
• The methodology is applicable if the analysis of possible baseline scenario alternatives leads to the result that a continuation of the current public transport system is the scenario that reasonably represents the anthropogenic emissions by sources of greenhouse gases (GHG) that would occur in the absence of the proposed project activity (i.e. the baseline scenario).
This baseline methodology shall be used in conjunction with the approved monitoring methodology AM0031 (Monitoring methodology for Bus Rapid Transit project) Summary description 1 Less than 3 % fuel additive is permitted 2 Project participants wishing to consider biofuels may propose a revision to this methodology

UNFCCC/CCNUCC CDM – Executive Board AM0031 / Version 01 Sectoral Scope: 07 28 July 2006
2
Bus Rapid Transit (BRT) is a bus-based mass transit system that delivers fast, comfortable, and cost-effective urban mobility. A BRT system can reduce greenhouse gas emissions via:
• Improved fuel-use efficiency through new and larger buses. • Mode switching due to the availability of a more efficient and attractive public transport system. • Load increase by having a centrally managed organisation dispatching vehicles. • Potentially a fuel switch to low carbon fuels.
BRT systems replace conventional public transport systems. The new bus system transports passengers who, in absence of the project, would have used the conventional public transport system or other modes of transport such as passenger cars. A reduction or retirement of some of the conventional buses through scrapping, reduction of permits3 or market-based instruments4 is thus an integral part of this methodology. Project Boundary The project boundary is defined by the passenger trips completed on the BRT project that is part of the public and private road-based passenger transport sector of the city in which the project is realized. The physical delineation is determined by the outreach of the new BRT or public or private urban passenger transport project. Figure 1: Project Boundary
Table 1. Emissions sources included in or excluded from the project boundary
Source Gas Included? Justification / Explanation
3 Permits to operate certain routes given by the corresponding authority 4 Incentives or disincentives; A market based strategy is also to simply let the rule of supply and demand work i.e. the reduced demand for conventional non-BRT bus transport will automatically lead to a reduced supply through less passengers i.e. less income and thus a drop in the profit rate for operating buses.
Emission sources considered in the Methodology
Direct project and baseline emissions Emissions caused by passengers transported in
the BRT project
Upstream emissions included as leakage • Construction emissions caused by the project• Reduced life-span of buses due to scrappage • Well-to-tank emissions of fuels used by
project and baseline
Downstream emissions included as leakage Congestion change provoked by project resulting in (inter alia): • Increased vehicle speed • Rebound effect
Other emissions included as leakage Change of baseline factors monitored during project and included as leakage: • Change of load
factors of taxis provoked indirectly by project
• Change of load factor of remaining conventional buses provoked indirectly by project
Emission sources not considered in the Methodology
Emissions caused by remaining transport system (taxis, cars, conventional public transport
Emissions caused by freight, ship, rail and air transport

UNFCCC/CCNUCC CDM – Executive Board AM0031 / Version 01 Sectoral Scope: 07 28 July 2006
3
CO2 Yes Main source CH4 Yes
Bas
elin
e Mobile source emissions of different modes of road transport for passengers which use BRT system (buses, passenger cars, motorcycles, taxis)
N2O Yes
CO2 Yes Main source CH4 Yes
Proj
ect
Act
ivity
BRT bus emissions (feeder and trunk routes) N2O Yes
Identification of the Baseline Scenario Step 1: Identify all options available that meet the same requirement as the proposed project activity. Alternatives assessed include, but not limited to: A continuation of the current road-based public transport system; The project proposal (BRT system) not implemented as a CDM project activity; Rail or water-based systems; Comprehensive re-organization of the transport system.
Step 2: Analyze all options identified in Step 1 using the latest version of the “Tool for the demonstration and assessment of additionality”. Step3: If Step 2 results in more than one possible alternative baseline scenario, the most likely baseline scenario is the scenario with the lowest baseline emissions. This methodology is only applicable if the identified baseline scenario is continuation of the current public transport system up to the end of the crediting period. Baseline emissions are those corresponding to existing actual or historical emissions by sources in the baseline scenario and are calculated ex-post. The parameter “emissions per passenger per trip” (or per passenger per km) is taken to measure the efficiency of the current system in respect to GHG emissions. Additionality The additionality of the project is determined using the latest version of the “Tool for the demonstration and assessment of additionality”. The following steps are used without repeating the details described in the above mentioned tool: Step 0: Preliminary screening based on the starting date of the project activity. This step is only required if project participants wish to have the crediting period starting prior to the registration of their project activity. Step 1: Identification of alternatives to the project activity consistent with current laws and regulations. Alternatives included are at minimum a continuation of the current public transport system and the BRT system proposed as project. All alternatives, which are potentially viable, are included in the further steps and may represent the baseline scenario. Step 2: In cases where the BRT project is fully privately financed (including roads, infrastructure etc) or where the public financed component is fully repaid on commercial terms through tariffs charged to system users the financial analysis as described in the tool under step 2 can be used.

UNFCCC/CCNUCC CDM – Executive Board AM0031 / Version 01 Sectoral Scope: 07 28 July 2006
4
If the BRT project is financed partially through public funding, the cost-benefit calculations of the public sector should include external costs and benefits such as the macroeconomic impact of reduced congestion or reduced health costs due to reduced air pollution. The relative comparison shall be made to other transport investment opportunities. Step 3: Barrier analysis including typical barriers in public transport projects: • Financial or investment barriers due to resource constraints of public bodies while having many
potential investment opportunities aside from transport such as investment in health, education, social welfare etc.
• Prevailing practice barriers if such projects are first in its kind in the region or country. • Resistance to change from the existing transport operators and resistance to change from an informal
to a formal transport system. Transport operators in many countries are a powerful body and fear reduced profits.
• Political resistance or political risk to implement continuously such projects. Urban public transport projects are in general realized in phases. Public authorities however change office and often projects are abandoned after one phase as the political benefit of additional phases is limited and new administrations tend to prefer new projects to reap the related publicity benefits.
• Technological or organizational barriers e.g. if buses with new technologies (e.g. CNG) are introduced or latter require special fuel (e.g. low-sulphur diesel) or the new transport system requires sophisticated management not available currently.
Depending on the project either step 3 (barrier analysis) or a combination of step 2 and 3 is undertaken. Where the BRT project is fully privately financed (including roads, infrastructure etc) or where the publicly financed component is fully repaid on commercial terms through tariffs charged to system users, the project proponent should use both investment analysis and barrier analysis. If the infrastructure is fully publicly financed or not being repaid on commercial terms, project proponents may use a barrier analysis only. In many BRT systems only operational costs excluding infrastructure costs are taken as a basis when calculating the tariffs while the infrastructure is paid through other means (e.g. general government revenues or special fuel taxes). The PDD should indicate the sources of financing for the investment, and whether or not these are repaid on commercial terms. Step 4: Common practice analysis assessing the number of similar projects that exist in comparable project contexts without the CDM. Step 5: Impact of CDM registration Baseline emissions Baseline emissions are estimated using two main steps:
1. Determination of emissions per passenger transported per vehicle category: This is calculated ex-ante, including the usage of a fixed technology change factor. The baseline emission factor is adapted to potential changes in trip distance and type of fuel used by passenger cars if the surveys indicate that changes in trip distance or fuel type used would lead to lower baseline emission factors.
2. Baseline emissions: are estimated ex-post based on the passengers transported by the project and their modal split. Core baseline parameters used for calculating the baseline emission factors are reviewed through an annual survey, with changes only being applied if the baseline emissions factors would be lower than the original factor. The system operator records passenger numbers.
NOTE: If the project does not generate credits for the modal switch, it need not determine emissions per passenger using passenger cars, taxis or motorcycles. The annual modal survey will also not include

UNFCCC/CCNUCC CDM – Executive Board AM0031 / Version 01 Sectoral Scope: 07 28 July 2006
5
these categories or questions related directly to these categories (change of trip distance of passenger cars or fuel type of passenger cars). The survey will, however, include the categories of public transport, non-motorised transport (NMT), and induced traffic (i.e. categories with emission factors lower than the project, to ensure that emission reductions are not overstated). Figure 2. Determination of Baseline Emissions Two methodological alternatives or paths can be used to determine the baseline emission per passenger transported:
A) As a function of emissions per kilometre and passengers per kilometre. B) As a function of sectoral fuel consumptions per vehicle category and passengers transported.
A mixed approach can also be used i.e. approach A for certain vehicle categories and approach B for others. The criteria for selecting of the approach are data availability and data quality. NOTE: Alternative B should only be chosen if the project proponent can ascertain that full consumption data as well as total passenger transported data are consistent (spatial, and vintage) and complete. This shall be verified by the DOE at validation.
1. Determine Vehicle Categories
2. PATH A: Relative Data 2. PATH B: Sectorial Data
2.A.1. Emissions per Kilometer
3. Technology Improvement Factor
2.A.2. Emissions per Passenger
2.B.1. Emissions per Passenger
5. Policy Effects
4. Change of Baseline Parameters during Project
6. Baseline Emissions

UNFCCC/CCNUCC CDM – Executive Board AM0031 / Version 01 Sectoral Scope: 07 28 July 2006
6
1. Determine Vehicle Categories Identify relevant vehicle categories, which include:
• Buses, differentiating large, medium and small buses, if appropriate • Passenger cars • Taxis • Motorcycles
Criteria for identifying the categories are as follows:
• At a minimum, public transport, non-motorised transport and induced traffic have to be included. • Conditions to include categories are that there are reliable data on fuel consumption and load
factors. • Only include categories that are relevant for the BRT project. If the project will only generate
credits from public transport without modal switch, then passenger cars, taxis and motorcycles need not be included.
• Differentiate relevant fuel types for each category. Diesel, gasoline and gas (CNG or LPG) are listed separately if a minimum of 10% of vehicles of the respective category use such a fuel, while the threshold for zero-emission5 fuels is minimum 1%. The 10% threshold is justified, as GHG emission differentials between diesel, gasoline and gaseous fuels are less than 20%.
• If electric vehicles are included in the analysis, their emissions can be calculated using GHG grid factors using AMS.1.D. .
• In case of a system extension the currently operating system is not included as a vehicle category. 2.A. Calculate Emissions Per Passenger Based on Relative Data 2.A.1. Determine Emissions per Kilometre for Vehicle Categories CO2e emissions per kilometre are calculated, fixed ex-ante for the project period, based on the consumption of each fuel type, the CO2e emissions per litre of fuel and the fraction of vehicles using the specific fuel type. • CO2 emissions are developed on the basis of the carbon content of the fuel. • CH4 and N2O emission factors: CH4 emissions are a function of the fuel and engine type, and any
post-combustion controls. N2O emissions are technology based for each fuel type, vehicle category, installed control technologies and local data such as average driving speeds, temperatures, and altitude. The emission factors are transformed into CO2eq using GWP factors approved by the Conference of the Parties to the UNFCCC.
Two methods are possible to determine the relevant CH4 and N2O emission factors: 1. Local measured emission factors based on a reliable data source to be detailed in the PDD. 2. The pre-determined default value per vehicle category is used (described later in this section). The
default value per vehicle category is the technology with the lowest sum of CO2eq emissions of N2O and CH4. This ensures a conservative approach.
Alternative 1 is preferred. However, using the default value is a conservative approach. Using fixed and average values is also justified as CH4 as well as N2O emissions in vehicles account on average for less than 1-2% of total CO2e emissions.
5 Zero-emission in the context of operating emissions and not well-to-wheel or life-cycle emissions; this includes hydrogen. Biofuels are excluded.

UNFCCC/CCNUCC CDM – Executive Board AM0031 / Version 01 Sectoral Scope: 07 28 July 2006
7
The default parameters per vehicle category for CH4 and N2O are presented in the Appendix in gCO2e per litre of fuel consumed. Formula (1): This formula calculates emissions per km for vehicles of different vehicle categories.
( )∑
×++×=
x i
ixxONxCHxCOixiKM N
NEFEFEFSECEF ,
,2,4,2,, (1)
where: EFKM,i Transport emissions factor per distance of vehicle category i (gCO2e per kilometer driven) SECx,i Specific energy consumption of fuel type x in vehicle category i (litre per kilometer) EFCO2,x CO2 emission factor for fuel type x (gCO2 per litre) EFCH4,x CH4 emission factor for fuel type x (gCO2e per litre, based on GWP) EFN2O,x N2O emission factor for fuel type x (gCO2e per litre, based on GWP) Ni Total number of vehicles in category i Nx,i Number of vehicles in vehicle category i using fuel type x If fewer than 10% of vehicles in a specific vehicle category are gasoline, diesel, CNG or LPG powered then this respective fuel can be omitted for simplicity purposes. In alternative vehicles the threshold value is less than 1%. Two methodological alternatives are proposed for the fuel consumption data (in order of preference):
Alternative 1: Measurement of fuel consumption data using a representative sample for the respective category and fuel type. To ensure a conservative approach the top 20% of the sample is not included in calculations. Alternative 2: Use of fixed values based on the national or international literature. The literature data can either be based on measurements of similar vehicles in comparable surroundings (e.g. from comparable cities of other countries) or may include identifying the vehicle age and technology of average vehicles circulating in the project region and then matching this with the most appropriate IPCC default values. The most important proxy to identify vehicle technologies is the average age of vehicles used in the area of influence of the project. To determine if either US or European default factors apply either local vehicle manufacturer information can be used (in the case of having a substantial domestic vehicle motor industry) or source of origin of vehicle imports.
A technical improvement factor is thereafter introduced. The technology improvement factor results in dynamic emission factors for the different units. See step 3.
UNFCCC/CCNUCC CDM – Executive Board AM0031 / Version 01 Sectoral Scope: 07 28 July 2006
8
2.A.2. Calculate Emissions per Passenger per vehicle Category This step calculates emission factors showing the emissions per passenger per average trip for each vehicle category. Formula (2): This formula is used to determine the emissions per passenger transported for passenger cars, taxis or motorcycles. All data used is determined ex-ante project. A change in the occupancy rate of taxis is registered as leakage of the project.
i
iiKMiP OC
TDEFEF
×= ,
, (2)
Where: EFP,i Transport emissions factor per passenger before project start, where i=C (passenger cars), M
(motorcycles) or T (taxis) (grams per passenger) EFKM,i Transport emissions factor per distance of category i (gCO2e per kilometer driven) OCi average vehicle occupancy rate of vehicle category i6 (passengers) TDi average trip distance for vehicle category i (kilometers) Formula (3):
Z
LZLZKMMZMZKMSZSZKMZP P
DDEFDDEFDDEFEF ,,,,,,,,,
,
×+×+×= (3)
Where: EFP,Z Transport emissions factor in buses for before project start (grams per passenger) EFKM,Z,S Emissions from small buses (gCO2e per kilometer) DDZ,S Total distance driven by small buses (kilometer) EFKM,Z,M Emissions from medium buses (gCO2e per kilometer) DDZ,M Total distance driven by medium buses (kilometer) EFKM,Z,L Emissions from large buses (gCO2e per kilometer) DDZ,S Total distance driven by large buses (kilometer) PZ Passengers transported by buses in the baseline The time period for passengers and distance must be equal (e.g. one year or one month). All data used is determined ex-ante project. A change in the occupancy rate of buses is registered as leakage of the project. 2. B. Calculate Emission Factor Based on Sector Data This approach is based on sector fuel consumption data and differentiates fuel consumption per fuel type for all different vehicle categories such as identified in the first step. Following conditions apply to using this alternative: • A study on sector fuel consumption separating the vehicle categories is available with a confidence
interval of minimum 95% (i.e. maximum error margin of 5%). • The geographic region of the project can be separated well. • Data for fuel consumption must have the same year/time period and the same geographic boundaries
as data of passengers transported.
6 In the case of taxis the driver is not counted and only passengers are included in the occupancy rate

UNFCCC/CCNUCC CDM – Executive Board AM0031 / Version 01 Sectoral Scope: 07 28 July 2006
9
• Data must be cross-checked with total fuel consumption of the region. Formula (4): calculates the emission factor per passenger for different vehicle categories.
( )[ ]
i
xxONxCHxCOix
iP P
EFEFEFTCEF
∑ ++×=
,2,4,2,
, (4)
Where: EFP,i Transport emissions factor in vehicle category i before project start (grams per passenger) TCx,i Total consumption of fuel type x by vehicle category i (litres) EFCO2,x CO2 emission factor for fuel type x (gCO2 per litre) EFCH4,x CH4 emission factor for fuel type x (gCO2e per litre, based on GWP) EFN2O,x N2O emission factor for fuel type x (gCO2e per litre, based on GWP) Pi Passengers transported by category i in the baseline 3. Technological Change Under business as usual conditions emission factors per vehicle category per fuel type may change due to: • Vehicles are replaced with more efficient ones • Vehicles in stock tend to increase emissions based on wear and tear.
For simplicity purposes a constant average improvement rate per annum is established per vehicle category. The improvement rate is applied to each calendar year. Year 0 is the year for which specific or sector fuel consumption data was collected or determined. Emissions per vehicle category are multiplied with the corresponding technology improvement factor. The default technology improvement factors per vehicle category are included in the appendix. 4. Change of Baseline Parameters during Project crediting period The change of baseline parameters is only necessary if the project includes a modal-switch (change from passenger cars, motorcycles or taxis to BRT). In this case, some parameters used for calculating the baseline emission factors could change over time: • The load factor or the number of passengers per vehicle. The load factor is potentially influenced
indirectly by the project. This factor is included in the monitoring of leakage of the project and thus not included in the baseline calculations.
• The distance driven by passengers using the BRT system might change or not be equivalent to the average distance driven used to calculate the baseline emission parameter. This factor is monitored through the survey conducted annually of passenger using the system (see corresponding monitoring methodology).
• Type of fuel used by passenger cars. This factor is only relevant for people who have switched from cars to public transport. The annual passenger survey monitors the fuel used by passengers switching from passenger cars to the BRT system and adjusts the corresponding baseline emission factor for passenger cars.
The methodology only takes changes in passenger emission factors into account if these are reduced. Details of the survey used for data on change of trip distances as well as for change of fuel used by passenger cars are included in the monitoring methodology section. The baseline emissions per passenger trip for taxis, passenger cars and motorcycles are adjusted annually with a correction factor for changing trip distances (formula 5).

UNFCCC/CCNUCC CDM – Executive Board AM0031 / Version 01 Sectoral Scope: 07 28 July 2006
10
Formula (5):
i
yiyi TD
TDCD ,
, = (5)
Where: CDi,y Correction factor for changing trip distance in category i for the year y, where i = T(taxis), C
(passenger cars) or M (motorcycles) TDi average trip distance in kilometers in category i before project start TDi,y average trip distance in kilometers in category in year y Note: The adjustment is only made if TDi.y < TDi to ensure a conservative approach7. 4.2. Change of Fuel Used by Passenger Cars For passengers that, in absence of the project, would have used a passenger car, the type of fuel used by their car is determined via a survey (see Monitoring Methodology). Formula (1) is used to re-calculate the new emission factors for passenger cars. The same threshold values for fuel types apply as described in step 1 (determination of vehicle categories). The applicability condition for applying this change in fuel type used for passenger cars is: EFKM,C,y < EFKM,C . In other words, the baseline emission factor is only changed if the new emission factor is lower than the original emission factor. Note: This question, and the corresponding adjustment in the emissions factor estimation, is only included in the survey if modal switch from passenger cars and the associated emission reductions are included in the project. 5. Policy Effects Only policies with a measurable impact on GHG emissions shall be considered. Project participants need to assess if policies might have effects on various parameters. To remain conservative the full impact monitored is attributed to the policy.8 All relevant policies and their impact are included in the baseline from the date of their planned implementation9. However, broad development strategies and concepts are not considered if they do not have a legally binding character including as minimum an implementation date, enforcement procedures and clear activities. The project proponent shall analyze all policies following these steps: 1. Identification of policies with a potential impact on GHG emissions of the current transport system. 2. Has the policy been legally adopted with a clear implementation date? If no implementation date is
given then the policy is not further considered. If the date is fixed and within the time frame of the project proposed then the policy is included in the analysis.
3. Assess the potential impact of the policy on any of the baseline parameters listed above
7 Larger distances would increase baseline emissions per passenger trip. The project emissions of larger trip distances are however fully recorded as project emissions are based on total fuel consumed. 8 E.g. a new policy to reduce private vehicles will potentially have an impact on the modal split. The full change of the modal split will be accounted as a result of the policy even though this could also be influenced by other factors e.g. improved supply of public transport. 9 Policies, which potentially have an impact, include mainly fuel policies (e.g. compulsory usage of bio-fuel blends), fiscal policies (e.g. differential fuel taxes according to carbon contents), and transport policies (e.g. promotion of Non-Motorized Transport or car restriction policies).
UNFCCC/CCNUCC CDM – Executive Board AM0031 / Version 01 Sectoral Scope: 07 28 July 2006
11
4. Introduce a correction factor if required. The correction factor must be determined to achieve a conservative result.
A general formula for introducing policy aspects cannot be stated at the level of a methodology as this element is project specific. Policies and their implementation data are assessed ex-ante. Monitoring shall be carried out on a regular basis for policies affecting parameters of the baseline. This involves: 1. Assessing new and enforced policies, which could significantly affect the modal split of passengers in
the project area. This is defined here as policies which expect to change the modal split by 5% or more towards public transport. If several policies, which change the modal split, are enforced during the project’s crediting period then the cumulative effect of these policies must be superior to 5 percentage points. This threshold value only applies to policies affecting the modal split. The expected modal split change is based on calculation or targets realized by the policy proponents (i.e. the ministry or governmental authority in charge of the policy). If such a policy has been enforced in year x, a year where no survey has been carried out, the modal split of the most recent year prior to that no survey is realized, and the modal split of the year x-1 is applied to all passengers using the system.
2. Assessing new and enforced policies that change the fuel usage of vehicles (either fuel type or regulations concerning maximum fuel usage). This potentially changes the emission factor per distance driven of vehicles.
3. Assessing any other policy which results in a measurable and verifiable manner in a change of a parameter used for calculating baseline emissions such as a compulsory technology change by establishing and enforcing maximum vehicle ages.
Determination of Baseline Emissions The baseline emissions for all passengers transported are calculated. This is differentiated according to the mode of transport, which the person would have used in absence of the project. Passengers transported are determined through the project (activity level of the project). The system operator shall report the total amount of passengers transported by the project. Formula (6):
( )∑ ×=i
yiyiPy PEFBE .,, (6)
Where: BEy Baseline emissions in year y (tCO2e) EFP,i,y Transport emissions factor per passenger in vehicle category i in year y (grams per
passenger) Pi,y Passengers transported by the project (BRT) in year y that without the project activity would
have used category i, where i= Z (buses, public transport), T (taxis), C (passenger cars) or M (motorcycles)10 (millions of passengers).
Formula (7):
yitiiPyiP CDIREFEF ,,,,, ××= (7) Where:
10 NMT and IT are not included as emissions are 0 for this category in the baseline

UNFCCC/CCNUCC CDM – Executive Board AM0031 / Version 01 Sectoral Scope: 07 28 July 2006
12
EFP,i,y Transport emissions factor per passenger in vehicle category i in year y (grams per passenger)
EFP,i Transport emissions factor per passenger before project start (grams per passenger) CDi,y Correction factor for changing trip distance in category i for the year y, where i = T(taxis), C
(passenger cars) or M (motorcycles) IRi,t Technology improvement factor at year t for vehicle category i t age in years of fuel consumption data used for calculating the emission factor in year y11 See applicability condition for CDi,y (Formula 5: The adjustment is only made if TDi,y < TDi). For passenger cars, EFKM,C,y is annually adjusted as described under heading 4.2 above, considering the applicability condition of reduced emissions per kilometer. Formula (8):
yiyyi SPP ,, ×= (8) Where: Pi,,y Passengers transported by the project which in absence of latter would have used transport
type i, where i= Z (buses, public transport), T (taxis), C (passenger cars), M (motorcycles), NMT (non-motorized transport) and IT (induced transport, i.e. would not have traveled in absence of project) (millions).
Py Total passengers transported by the project monitored in year y (millions) Si,,y Share of passengers transported by the project which in absence of latter would have used
transport type i, where i= Z (buses, public transport), T (taxis), C (passenger cars), M (motorcycles), NMT (non-motorized transport) and IT (induced transport, i.e. would not have traveled in absence of project) (%).
If the project does not include an estimate of credits for modal shift then the survey only includes the categories of public transport, NMT and induced traffic. Details of the survey are found in the appendix. Induced travel is included in leakage calculations (induced travel in passenger cars) as well as in the baseline (induced travel in public transport). Sensitivity Analysis A sensitivity analysis is carried out for data and parameters, which are used to calculate baseline as well as project emissions (at minimum where uncertainty level of data is considered moderate or high). The PDD shall identify data with this level of uncertainty. The sensitivity analysis shall also identify potential critical parameters and to further discuss these in the PDD. The sensitivity analysis made shall be based on calculating the change of the data parameter that would be required to reduce emission reductions by 5%. This value gives an indication of the magnitude of change of the data parameter required to significantly change calculated emission reductions. A sensitivity analysis shall be undertaken at a minimum for the load factor and for the modal distribution. Steps to carry out the sensitivity analysis include: 1. Identify all data with moderate or high uncertainty levels 2. Carry out a sensitivity analysis on these parameters calculating the level of change of the parameter
required to reduce emission reductions by 5% below that originally estimated. 3. Assess the result in light of possible data uncertainty:
11 e.g. “t=7” for the year 2007 if the fuel data is from the year 2000

UNFCCC/CCNUCC CDM – Executive Board AM0031 / Version 01 Sectoral Scope: 07 28 July 2006
13
• The parameter change required is considered as highly improbable. The PDD needs to deliver the arguments why this is considered improbable.
• The parameter change is considered as plausible. In this case the maximum plausible change must be incorporated in the parameter to assure for a conservative calculation of emission reductions e.g. if fuel consumption values for the baseline could also be 20% lower and would change the emission reductions by more than 5% then the PDD must use a parameter for fuel consumption which is 20% lower than the original data indicates.
Project activity emissions The project emissions are only from the new transport system. All emissions from trips undertaken in the new system need to be included (i.e., both on trunk routes and feeder lines). Total emissions can be calculated in one of two ways, depending on data availability. If records exist, the data quality of both alternatives is equal. Reliable data are, e.g., based on electronic measurement of fuel consumption or data monitored by the bus company managing the units. For both alternatives, specific fuel consumption data (i.e. consumption per distance driven) needs to be crosschecked in the QA system. Cross-checks include a comparison over time within the same company, as well as a comparison with, e.g., other companies operating in the BRT system using the same type of buses. Alternative A: Use of Fuel Consumption Data This alternative is based on the total fuel consumed. Formula (9):
[ ]∑ ++×=x
x,O2Nx,4CHx,2COy,x,PJy )EFEFEF(TCPE (9)
Where: PEy Project emissions in year y (tCO2e) TCPJ,x,y Total consumption of fuel type x in year y by the project (million litres) EFCO2,x CO2 emission factor for fuel type x (gCO2 per litre) EFCH4,x CH4 emission factor for fuel type x (gCO2e per litre, based on GWP) EFN2O,x N2O emission factor for fuel type x (gCO2e per litre, based on GWP) Alternative B: Use of Specific Fuel Consumption and Distance Data This alternative uses as a basis fuel efficiency data (i.e. consumption per kilometre driven). Formula (10):
( )[ ]∑ ++×=x
xONxCHxCOyxjyjKM EFEFEFSECEF ,2,4,2,,,, (10)
where: EFKM,j,y Transport emissions factor per distance for project bus category j in year y (gCO2e per
kilometer) SECj,x,y Specific energy consumption of fuel type x in project bus category j in year y (litre per
kilometer) EFCO2,x CO2 emission factor for fuel type x (gCO2 per litre) EFCH4,x CH4 emission factor for fuel type x (gCO2e per litre, based on GWP) EFN2O,x N2O emission factor for fuel type x (gCO2e per litre, based on GWP)

UNFCCC/CCNUCC CDM – Executive Board AM0031 / Version 01 Sectoral Scope: 07 28 July 2006
14
Fuel-efficiency data is derived from annual data reported by the bus companies operating the units either of all units or of a representative sample of comparable units (comparable technology, vintage and size). To ensure a conservative approach, all data with specific fuel consumption values which are more than 20% lower than the average specific fuel consumption of comparable units are omitted from calculations. This ensures a conservative approach, as project emissions are potentially overstated. If the CDM project includes only parts of a larger activity, the fuel used for the CDM project is separated from the total fuel used. The separation is done (in order of preference) by the following means: • By operators: This method is used if certain operators are assigned to certain parts of the project • By distance driven: the fuel share for each part of the project is based on the share of kilometers per
project part • By passengers: the fuel share for each part of the project is based on the share of passengers per part of
the project (based on the entry points of passengers) Formula (11): Total project emissions are calculated from the following equation.
( ) ( )[ ]y,FBy,FB,KMy,TBy,TB,KMy DDEFDDEFPE ×+×= (11) Where: PEy Project emissions in year y (tCO2e) EFKM,TB,y Transport emissions factor per distance for trunk buses in year y (gCO2e per kilometer) DDTB,y Total distance driven by trunk buses in year y (million kilometers) EFKM,FB,y Transport emissions factor per distance for feeder buses in year y (gCO2e per kilometer) DDFB,y Total distance driven by feeder buses in year y (million kilometers) Leakage The following leakage sources are addressed:
1. Upstream emissions due to: o Construction: Emissions due to the construction of dedicated lanes for the BRT project. o Reduced life-span: Additional emissions due to earlier replacement of buses than under
business as usual. This includes emissions due to scrapage policies. o Life-cycle effect of reduced fuel usage
Upstream emissions are estimated ex-ante and monitored annually. 2. Change of load factor of the baseline transport system due to the project, i.e. the project
potentially influences the occupancy rate of the remaining vehicles. This is monitored on a regular basis during project execution.
3. Reduced congestion in remaining roads, provoking higher average vehicle speed, plus a rebound effect. The total impact of congestion is calculated ex-ante and not monitored.
For the sake of a conservative approach, leakage is only considered if the total annual effect is to reduce estimated emission reductions. Construction and reduced life-span emissions are annualized based on the crediting period of the project. This is due to the fact that these emissions occur at the beginning (even before start of the crediting period), while other leakage emissions are annual. Not annualizing the construction and “scrappage” emissions would thus grossly overstate leakage in the first year and would not be compatible with the approach of monitoring annually leakage and only accounting for leakage if the net effect is to reduce the credited emissions reductions. 1. Upstream Emissions

UNFCCC/CCNUCC CDM – Executive Board AM0031 / Version 01 Sectoral Scope: 07 28 July 2006
15
1.1. Construction Emissions The basic impact of construction is due to new trunk lanes being built for the BRT project. The emissions occur during production of the required building materials, and are thus upstream. The methodology focuses solely on cement and/or asphalt as the main energy-intensive materials used for construction. The total amount of cement is calculated per kilometre of trunk lane to have a simple indicator. For calculation purposes, it is important to specify the number of additional lanes built for the BRT system. See data parameters at the end of this section. Formula (12):
YDTEFASPEFCEMLE ASPCEM
yCON××+×
=)(
, (12)
Where: LECON,y Leakage emissions from construction in year y (tCO2e) CEM Cement used in construction (tons per kilometre of trunk lane) EFCEM Specific emissions factor for cement (tCO2e/t cement) ASP Asphalt used in construction (tons per kilometre of trunk lane) EFASP Specific emissions factor for asphalt (tCO2e/t asphalt) DT Distance of trunk lanes built in project (kilometres), based on kilometres x number of trunk
lanes Y crediting years of the project12 Default emission factors for cement and asphalt are listed in the appendix. 1.2. Vehicle Replacement Emissions The process of scrapping itself creates no additional emissions, as buses would have been scrapped sooner or later anyway. The emissions due to scrappage or bus retirement are basically a reduced life-span of the vehicle. This means increased energy use for manufacturing the buses per operating year or kilometre. Energy used for the manufacturing buses creates upstream emissions. If the project activity does not include scrapping of buses, this source of leakage is not included. Formula (13):
YBA
BABAEFBSCRLE
y
w BL
PJBLBMw
yLSP
∑=
−××
= 1, (13)
Where: LELSP,y Leakage emissions from reduced life-span of buses in year y (tCO2e) BSCRw Bus units scrapped by project in year w, where w = 1 to y (NB: if buses are not scrapped the
estimated number of retired buses is taken) EFBM Emissions factor for bus manufacturing (tCO2e per bus) BABL Average age when buses are replaced /retired in the baseline scenario (years) BAPJ Average bus age of scrapped buses under the project activity (years) Y crediting years of the project13 12 If the project opts for a 7 year renewable crediting period, total crediting years for the purpose of this formula is taken as 7 years. 13 If the project opts for a 7 year renewable crediting period, total crediting years for the purpose of this formula is taken as 7 years.

UNFCCC/CCNUCC CDM – Executive Board AM0031 / Version 01 Sectoral Scope: 07 28 July 2006
16
For BABL the age taken is the 99th percentile of buses operating in the city i.e. 99% of buses are younger than BABL. If no statistics are available with an annual distribution of buses, the average replacement age is taken as 40 years (default value). The emissions used to manufacture a bus are based on life-cycle estimates. The project proponent can either identify the life-cycle emissions relevant for the type of vehicles circulating in the project region, or use the default value given by the methodology. Using a national/regional value would be the first option. However, since this source of leakage emissions is only minor and that the inclusion of upstream emissions per se is very conservative, use of a default factor is deemed as appropriate. The default factor is a constant of 42 tCO2e per large bus manufactured. The average vehicle age of scrapped buses is estimated ex-ante for calculation purposes. Medium sized and small buses are “converted” into large buses based on the passenger capacity, taking large buses as having a capacity of 80 persons14. 1.3. Upstream Fuel Emissions The extraction, production and transport of fuels results in GHG emissions. Reduced fuel consumption thus reduces more than the combustion emissions. A parameter for upstream emission is applied. This parameter can either be determined based on national studies for upstream fuel emissions or using the default value based on international literature. This source of leakage is only considered if the fuel is not refined in an Annex I country. Considering this type of leakage results in additional emission reductions. Formula (14):
( ) UEFBEPELE yyUFP ×−= (14) Where: LEUFP Emission leakage due to upstream fuel production emissions in year y (tCO2) PEy Project emissions in year y (tCO2e) BEy Baseline emissions in year y (tCO2e) UEF Upstream emissions multiplier, based on default factor from literature (see appendix) (%) 1.4. Summary Upstream Emissions Formula (15):
yUFPyLSPyCONyUP LELELELE ,,,, ++= (15) Where: LEUP,y Leakage emissions due to upstream processes in year y (tCO2e) LECON,y Leakage emissions due to construction in year y (tCO2e) LELSP,y Leakage emissions due to reduced life-span of buses in year y (tCO2e) LEUFP,y Leakage emissions due to upstream emissions from fuel production in year y (tCO2e) 2. Change of Load Factor The project could have a negative impact on the load factor of taxis or the remaining conventional bus fleet. Load factor changes in the baseline public transport system are thus monitored. Leakage is only included if the load factor changes by more than 10 percentage points, as certain variations in the load factor caused by external circumstances are normal. The methodology also considers load factor changes
14 If for example medium buses have a capacity of 40 passengers then the emission factor is taken as 40/80*42tCO2

UNFCCC/CCNUCC CDM – Executive Board AM0031 / Version 01 Sectoral Scope: 07 28 July 2006
17
in taxis if they are included as vehicle category by the project, thus claiming credits from a modal shift from taxi to the BRT system. In the case of lower load factors, it is assumed that this change has occurred immediately after the last measurement, and the leakage calculation for this year includes the sum of load-factor leakage of all years since the last monitoring. This ensures a conservative approach. To avoid the risk of having to include ex-post leakage from former years, the project proponent can monitor the load factor annually. Formula (16):
yi
yiyi CV
OCROC
,
,, = (16)
Where: ROCi,y Average occupancy rate relative to capacity in category i in year y, where i = Z (buses) or T
(taxis) OCi,y Average occupancy of vehicle in category i in year y (persons) CVi,y Average capacity of vehicle i in year y (persons) In the case of public transport, the occupancy rate is measured in relation to the bus capacity, as bus sizes may change over time or before/after project. ROCi,y shall be monitored directly through visual surveys. Formula (17): This formula determines leakage emissions from change of load factors in buses.
−×××=
0,
,,,,, 1
Z
yZyZZZKMyZLF ROC
ROCNVDEFLE (17)
Where: LELF,Z,y Leakage emissions from change of load factor in buses in year y (tCO2e) EFKM,z Baseline transport emissions factor per distance for buses (gCO2e per kilometer) VDZ Annual distance driven per vehicle for buses before the project start, determined ex-ante with
Formula 18 (kilometers) NZ,y Number of buses in the conventional transport system operating in year y ROCZ,y Average occupancy rate relative to capacity of conventional buses in year y, based on the
most recent study of occupancy rates. ROCZ,0 Average occupancy rate relative to capacity of buses before start of project Formula (18): (18)
Where: VDZ Distance driven per bus before the project start (kilometers) DDZ,k Total distance driven by buses of size k (kilometers) NZ,k Number of buses in the conventional transport system of size k
∑∑
=
==
LMSkkZ
LMSkkZ
Z N
DDVD
,,,
,,,

UNFCCC/CCNUCC CDM – Executive Board AM0031 / Version 01 Sectoral Scope: 07 28 July 2006
18
Note: If ROCZ,0 - ROCZ, y ≤ 0.1 then LELF,Z,y = 0, i.e., if the occupancy rate of buses is not reduced by more than 0.1 then the project has had no negative effect (leakage). Formula (19): This formula determines leakage emissions from change of load factors in taxis.
−×××=
0,
,,,,, 1
T
yTyTTTKMyTLF OC
OCNVDEFLE (19)
Where: LELF,T,y Leakage emissions from change of load factor in taxis in year y (tCO2e) EFKM,T Transport emissions factor per distance of taxi baseline (gCO2e per kilometer) VDT Distance driven per taxi on average before the project starts (kilometres) NT,y Number of taxis operating in year y OCT,y Average occupancy rate of taxi for the year y (passengers only: driver not counted) OCT,0 Average occupancy rate of taxi before project start (passengers only: driver not counted) Note: If OCT,0 - OCT,y ≤ 0.1 then LELF,T,y = 0, i.e. if the occupancy rate of taxis is not reduced by more than 0.1 then the project has had no negative effect (leakage). The measurement of the occupancy rate is based on representative surveys, which register all taxis passing the survey points. Taxis without passengers are counted as “0” occupancy rate. Only circulating taxis are counted. 3. Impact of Reduced Congestion on Remaining Roads A BRT project reduces buses on the road and thus potentially reduces congestion. Reduced congestion has the following impacts relevant for GHG emissions: “Rebound effect” leading to additional trips and thus higher emissions Higher average speeds and less stop-and-go traffic leading to lower emissions
If a project leads to increased congestion, then all formula presented can be used equally. The effects will simply be reversed, i.e., the lower average speed and increased stop-and-go traffic will lead to increased emissions while the rebound effect will lead to less induced traffic than under BAU. Steps to Address Congestion Impact Two elements need to be considered: • Trunk roads can potentially reduce the space of remaining roads. The proportion of reduced road space
available to passenger cars has to be calculated. • Conventional buses are retired thus freeing road space. The proportion of retired buses and the
proportion of public transport in road space have to be determined. The additional impact of new and longer trips shall be assessed via the direct application of a “capacity elasticity”, i.e., percentage additional cars resulting from a percentage change in road capacity. Step 1: Calculate additional road-space available. Formula (20): This formula determines the additional road space available in year y if good quality data is available.
∑=
−−×=
yw Z
wy RSB
RSPRSBSRSN
BSCRARS...1
(20)

UNFCCC/CCNUCC CDM – Executive Board AM0031 / Version 01 Sectoral Scope: 07 28 July 2006
19
where: ARSy Additional road space available in year y (in percentage) BSCRw Bus units scrapped by project in year w, where w = 1 to y (NB: if buses are not scrapped the
estimated amount of retired buses is taken) NZ Number of buses in use in the baseline SRS Share of road space used by public transport in the baseline (in percentage) RSB Total road space available in the baseline (lane-kilometers) RSP Total available road space in the project (= RSB minus kilometre of lanes that where reduced
due to dedicated bus lanes) (lane-kilometers) If ARSy < 0, then we have a reduced road space in that year, and thus increased emissions due to reduced vehicle speed, but reduced emissions due to a negative “rebound effect”. Formula (21): This formula is required to determine SRS if no recent and good quality study is available which has calculated this parameter.
CTZ
Z
DDDDDDDDSRS
++= (21)
where: SRS Share of road space used by public transport in the baseline (in percentage) DDZ Total distance driven by public transport buses baseline (kilometers) DDT Total distance driven in kilometers by taxis baseline (kilometers) DDC Total distance driven in by passenger cars baseline (kilometers) For all distance variables the same vintage of data, the same spatial scope and the same time-span (e.g. one month or one year) is required. Step 2: Assess the rebound impact of the additional road space Formula (22): This formula calculates leakage emissions from additional/longer trips (“rebound effect”).
yCKMCyyTRIPS DEFTDARSITRLE ××××= ,, (22) where: LETRIPS,y Leakage emissions from additional and/or longer trips in year y (tCO2e) ITR Elasticity factor for additional and/or longer trips: the factor is fixed at 0.1 ARSy Additional road space available (percentage) TRC Number of daily trips realized by passenger cars baseline (number) TDC Average trip distance for passenger cars (kilometers) EFKM,C Transport emissions factor per distance of passenger cars before the project start (gCO2e per
kilometer) (see Formula 2) Dy Number of days buses operate in year y The impact is calculated as immediately although the short-term reaction of induced traffic is significantly lower than the long-term (3 years+) reaction. Step 3: Assess the impact of changing vehicle speed from passenger cars

UNFCCC/CCNUCC CDM – Executive Board AM0031 / Version 01 Sectoral Scope: 07 28 July 2006
20
Formula (23):
[ ] yCVBKMCVPKMCCySP DWEFEFTDTRLE ×−××= ,,,,, (23) where: LESP,y Leakage emissions from change in vehicle speed in year y (tCO2e) TRC Number of daily trips realized by passenger cars baseline (number) TDC Average trip distance driven by passenger cars (kilometers) EFKM,VP,C Transport emissions factor per distance for passenger cars at project speed (gCO2 per km) EFKM,VB,C Transport emissions factor per distance for passenger cars at baseline speed (gCO2 per km) DWy number of days per year in year y The new vehicle speed is calculated based on the number of retired vehicles or additional available road space. The project proponent can either use a speed dependency factor developed with an officially recognized methodology for the project region (with the corresponding documentation to ensure a good quality; if latter is available this would be the first preference) or use as default relation the speed dependency factor Passenger Cars (gCO2 per km) developed by CORINAR. If the project has no data on speed changes or current speed, then it is assumed that the speed impact is equal to 0. Formula (24) CORINAR speed emission factor formula:
2,, 0144.0314.244.135 VVEF CmKM ×+×−= (24)
Where: EFKM,m,C Transport emissions factor per distance for passenger cars traveling at speed m (gCO2 per km) V Vehicle speed (km/h); calculated both for the project speed (VP) and baseline speed (VB)
Step 4: Sum of Congestion Impacts and Determination of Leakage Factor The sum of the rebound and the speed impact is included as leakage. The congestion impact is only calculated ex-ante. Formula (25):
ySPyTRIPSyCONG LELELE ,,, += (25) where: LECONG,y Leakage emissions from reduced congestion in year y (tCO2e) LETRIPS,y Leakage emissions from additional and/or longer trips in year y (tCO2e) LESP,y Leakage emissions from change in vehicle speed in year y (tCO2e) Total Leakage Formula (26):
yCONGyTLFyZLFyUPy LELELELELE ,,,,,, +++= (26) where: LEy Emissions leakage in year y (tCO2e)

UNFCCC/CCNUCC CDM – Executive Board AM0031 / Version 01 Sectoral Scope: 07 28 July 2006
21
LEUP,y Leakage emissions due to upstream processes in year y (tCO2e) LELF,Z,y Leakage emissions from change of load factor in buses in year y (tCO2e) LELF,T,y Leakage emissions from change of load factor in taxis in year y (tCO2e) LECONG,y Leakage emissions from reduced congestion in year y (tCO2e) If LEy < 0, then leakage is not included If LEy > 0, then leakage is included. The impact of induced traffic (additional trips) provoked through the new transport system is addressed directly in the project emissions and is not part of the leakage. This is addressed by including as project emissions the trips of passengers, which, in absence of the BRT project, would not have realized the trip. Emission reductions Formula (27):
yyyy LEPEBEER −−= (27) where: ERy Emission reductions in year y (tCO2e) BEy Baseline emissions in year y (tCO2e) PEy Project emissions in year y (tCO2e) For BEy see formula (6), for PEy formula (9) or (11) and for LEy formula (26) Changes required for methodology implementation in 2nd and 3rd crediting periods The revision at the end of the first crediting period in preparation for the next crediting period shall include an assessment of: • The applicability conditions for the approved methodology shall still be valid at the time of the
revision. • Project participants shall evaluate the institutional and legal conditions, particularly related with
environmental and fuel regulations governing the project, to determine whether original baseline conditions still apply.
UNFCCC/CCNUCC CDM – Executive Board AM0031 / Version 01 Sectoral Scope: 07 28 July 2006
22
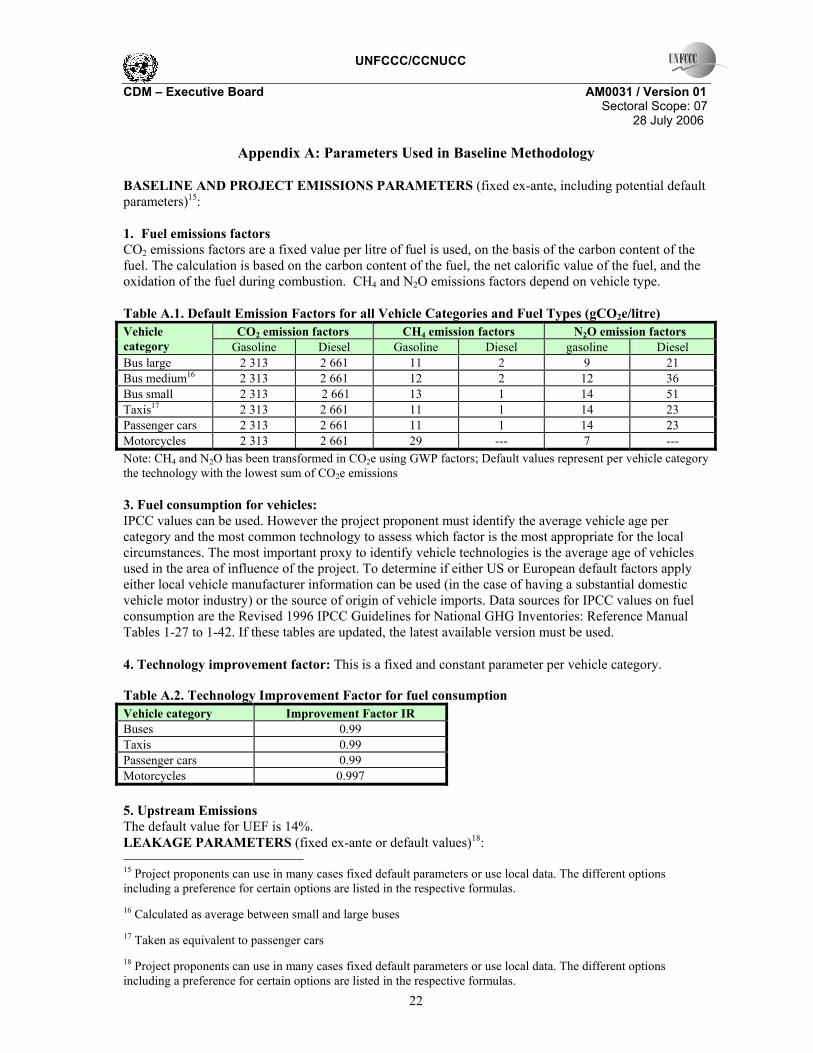
Appendix A: Parameters Used in Baseline Methodology BASELINE AND PROJECT EMISSIONS PARAMETERS (fixed ex-ante, including potential default parameters)15: 1. Fuel emissions factors CO2 emissions factors are a fixed value per litre of fuel is used, on the basis of the carbon content of the fuel. The calculation is based on the carbon content of the fuel, the net calorific value of the fuel, and the oxidation of the fuel during combustion. CH4 and N2O emissions factors depend on vehicle type. Table A.1. Default Emission Factors for all Vehicle Categories and Fuel Types (gCO2e/litre)
CO2 emission factors CH4 emission factors N2O emission factors Vehicle category Gasoline Diesel Gasoline Diesel gasoline Diesel Bus large 2 313 2 661 11 2 9 21 Bus medium16 2 313 2 661 12 2 12 36 Bus small 2 313 2 661 13 1 14 51 Taxis17 2 313 2 661 11 1 14 23 Passenger cars 2 313 2 661 11 1 14 23 Motorcycles 2 313 2 661 29 --- 7 --- Note: CH4 and N2O has been transformed in CO2e using GWP factors; Default values represent per vehicle category the technology with the lowest sum of CO2e emissions 3. Fuel consumption for vehicles: IPCC values can be used. However the project proponent must identify the average vehicle age per category and the most common technology to assess which factor is the most appropriate for the local circumstances. The most important proxy to identify vehicle technologies is the average age of vehicles used in the area of influence of the project. To determine if either US or European default factors apply either local vehicle manufacturer information can be used (in the case of having a substantial domestic vehicle motor industry) or the source of origin of vehicle imports. Data sources for IPCC values on fuel consumption are the Revised 1996 IPCC Guidelines for National GHG Inventories: Reference Manual Tables 1-27 to 1-42. If these tables are updated, the latest available version must be used. 4. Technology improvement factor: This is a fixed and constant parameter per vehicle category. Table A.2. Technology Improvement Factor for fuel consumption Vehicle category Improvement Factor IR Buses 0.99 Taxis 0.99 Passenger cars 0.99 Motorcycles 0.997 5. Upstream Emissions The default value for UEF is 14%. LEAKAGE PARAMETERS (fixed ex-ante or default values)18: 15 Project proponents can use in many cases fixed default parameters or use local data. The different options including a preference for certain options are listed in the respective formulas. 16 Calculated as average between small and large buses 17 Taken as equivalent to passenger cars 18 Project proponents can use in many cases fixed default parameters or use local data. The different options including a preference for certain options are listed in the respective formulas.

UNFCCC/CCNUCC CDM – Executive Board AM0031 / Version 01 Sectoral Scope: 07 28 July 2006
23
1. Emission factor for cement: The default emission factor per ton of cement produced includes process as well as energy related GHG emissions. The default value is 0.99 tCO2eq per t of cement. 2. Emission factor asphalt: The default emission factor per ton of asphalt produced includes process as well as energy related GHG emissions. One tonne of asphalt production requires on average 370 MJ of fossil fuel oil (UBA Germany). Based on IPCC emission factors for oil (21.1 tC/TJ), emissions equal 0.03 tCO2e per t asphalt. 3. Emission factor for bus manufacturing: The emissions used to manufacture a bus are based on life-cycle estimates. The usage of a fixed factor of 42 tCO2e per bus manufactured is justified as the total leakage from construction of buses is <1% of emission reductions. 4. Default factor retirement age of buses: In case of non-availability of local statistics of buses per year, a default retirement age of 40 years is used. 5. Fixed elasticity factor for relation between additional road space and induced trips: This parameter cannot be observed with a reasonable effort during the project. The default factor taken is 0.1, based on literature, taking a conservative approach. 6. Fixed relation between vehicle speed and emissions: The relation is based upon the speed dependency factor Passenger Cars (gCO2 per km) developed by CORINAR. The category from this analysis used is 1.4l <CC<2.0l for Euro I onwards with a speed range between 13.1 and 130 km/h.

UNFCCC/CCNUCC CDM – Executive Board AM0031 / Version 01 Sectoral Scope: 07 28 July 2006
24
Approved monitoring methodology AM0031
“Monitoring methodology for Bus Rapid Transit Projects”
Sources This baseline methodology is based on the proposals NM0105-rev “Baseline Methodology for Bus Rapid Transit Projects,” submitted by Transmilenio SA. For more information regarding the proposal and its consideration by the Executive Board please refer to http://cdm.unfccc.int/methodologies/approved. This methodology also to the latest approved version of the “tool for the demonstration and assessment of additionality”, which is available on the UNFCCC website http://cdm.unfccc.int . Applicability The methodology is applicable to project activities that reduce emissions through the construction and operation of a Bus Rapid Transit (BRT) system for urban road based transport. The methodology is applicable also for extensions or expansions of existing BRT systems (adding new routes and lines) whenever they replace a traditional public transport system. The monitoring methodology is to be used in conjunction with the proposed baseline methodology: Baseline Methodology for Bus Rapid Transit Projects. The following applicability conditions apply:
• The project significantly reduces emissions per passenger transported. • The project has a clear plan how to reduce existing public transport capacities either through
scrapping, permit restrictions, economic instruments or other means and replacing them by a BRT system.
• Data in the required quality is available or can be made available through the project. • Local regulations do not constrain the establishment or expansion of a BRT system • The fuel(s) used in the baseline and/or project case are gasoline, diesel, LNG, CNG or electricity.
Projects in which biofuels are used in the baseline or project case are excluded. • The BRT system as well as the baseline public transport system and other public transport options
are road-based (the methodology excludes rail, air and water-based systems from analysis). • The BRT system replaces a traditional public transport system in a given city partially or fully.
The methodology cannot be used for BRT systems in areas where currently no public transport is available.
• The number of passengers transported by public transport during the crediting period are higher than the pre-project situation.
The methodology is applicable if the analysis of possible alternatives leads to the result that a continuation of the current public transport system is the scenario that reasonably represents the anthropogenic emissions by sources of greenhouse gases (GHG) that would occur in the absence of the proposed project activity (i.e. the baseline scenario). This monitoring methodology shall be used in conjunction with the approved monitoring methodology AM0031 (Baseline methodology for Bus Rapid Transit Project) Methodology description

UNFCCC/CCNUCC CDM – Executive Board AM0031 / Version 01 Sectoral Scope: 07 28 July 2006
25
BRT systems have as core environmental aspect that the resource efficiency of transporting passengers in a city shall be improved i.e. fuel consumption and emissions per passenger trip shall be reduced compared to the situation without project. The methodology directly addresses the objective of increased resource efficiency and is thus based upon emissions per transported passenger. The monitoring methodology for the baseline has ex-ante determined emission factors per passenger transported for all modes of transport. These factors are fixed but not constant. For passengers using the project, which in absence would have used taxis, passenger cars or motorcycles, the change in distance travelled and in the fuel-mix is monitored based on a questionnaire. To ensure a conservative approach the baseline emission factors are only changed if the monitoring results show that the new factors would be lower than the ones originally used. The total baseline emissions are derived by applying to these emission factors the activity level (passengers per mode transported) of the project. Data sources are either from recent statistics or measurements made or are based on fixed default values taken from the international literature, primarily IPCC. Preference is for local data. Default values are last options in case of non-availability of more precise data. The project proponents can choose to either invest resources to carry out measurements or opt for the simpler and less expensive alternative of using default values with the drawback of claiming less emission reductions as the default values of the baseline methodology are very conservative. All data used to calculate the baseline emission factors are monitored ex-ante. For calculating the total baseline emissions the number of passengers using the project and the traffic mode they would have used in absence of the new transport system needs to be monitored (public transport, taxis, passenger cars, motorcycles, Non-Motorized Transport or induced traffic). Baseline emissions can thus only be calculated ex-post. The monitoring methodology for the project is based on measuring the total fuel consumption and thus emissions of the new transport system. From a methodological viewpoint data is derived from measurements. Data reliability is very high due to having exact measurements and established control procedures for the data required. Default values for fuel consumption cannot be used for project emissions. The monitoring methodology for leakage depends basically on elements calculated ex-ante based on pre-established factors and to a minor degree on measurements during project execution. Congestion leakage is calculated ex-ante for the project period and not monitored. Data is derived basically from planning sources, fixed parameters derived from the international literature and from periodic surveys. QA and QC is assured by having a monitoring manual containing inter alia how to proceed with key measurements and survey, how to screen data for quality and potential errors and by training the staff in charge of monitoring. Also for the periodic survey of passengers and for the surveys monitoring the load factor the core outline is included in this methodology and the PDD contains a detailed design of both instruments.

UNFCCC/CCNUCC CDM – Executive Board AM0031 / Version 01 Sectoral Scope: 07 28 July 2006
26
Table B1. Main Points of Monitoring Methodology Element Monitoring Methodology Core data for determining baseline emissions Alternative A based on relative data (fuel
consumption and distance driven per vehicle category and fuel type) Alternative B: sectoral fuel consumption Technology improvement factor Passengers per transport mode using new
transport system after project start (relative distribution and absolute numbers)
Alternative A: fuel consumption based on measurement of a
representative sample, international literature, IPCC values related to local circumstances and distance driven based on official statistics Alternative B: Based on representative surveys Default value based on international literature Monitored annually by project based on surveys plus
registration of total passengers transported by the system
Core data for determining project emissions Fuel consumption of project
or Fuel efficiency and distance driven by
project
Measured annually by project based on company accounts and
measurements or Distance driven measured annually by GPS; fuel efficiency
based on measurement Core data for determining leakage Upstream emissions (construction,
scrapping and well-to-tank fuel emissions) Change of load factor Congestion impact (rebound effect and
change in vehicle speed)
Based on planning and historical data and default values
derived from international literature sources; value is calculated ex-ante and most values are thereafter monitored Measured regularly by project based on representative samples Based on transport models, local statistics and default values
from international literature sources; value is calculated ex-ante

UNFCCC/CCNUCC CDM – Executive Board AM0031/ Version 01 Sectoral Scope: 07 28 July 2006
27
Project emissions ID number
Data variable
Source of data
Data unit
Measured (m), calculated (c) or estimated (e)
Recording frequency
Proportion of data to be monitored
How will the data be archived? (electronic/ paper)
Comment
1. TCPJ,x,i
Total fuel consumption
Proprietary litre M Annual 100% Electronic Required if alternative A is chosen for as described in baseline methodology (for total project or only for trunk lanes); Based in general on company records.
2. SECj,x,y
Fuel efficiency
Proprietary l/km M Annual 100% or sample
Electronic Required if alternative B is chosen as described in baseline methodology for total or part of the project; required for trunk and for feeder buses separately.
3. DDTB,y DDFB,y
Distance Proprietary million km
M Annual 100% Electronic Required for alternative B baseline (see above); required for trunk and for feeder buses separately; based in general on GPS (at minimum for trunk buses) and/or reports checked by the operator of the BRT system as payments are based inter alia on distance driven
Alternative A: Use of Fuel Consumption Data This alternative is based on the total fuel consumed by the project activity, and uses formula (9) from the associated baseline methodology AM0031. Alternative B: Use of Specific Fuel Consumption and Distance Data This alternative uses as a basis fuel efficiency data (i.e. consumption per kilometre driven), and uses formula (10) from the associated baseline methodology AM0031.. Fuel-efficiency data is derived from annual data reported by the bus companies operating the units either of all units or of a representative sample of comparable units (comparable technology, vintage and size). To ensure a conservative approach, all data with specific fuel consumption values which are more than 20% lower than the average specific fuel consumption of comparable units are omitted from calculations. This ensures a conservative approach, as project emissions are potentially overstated.

UNFCCC/CCNUCC CDM – Executive Board AM0031/ Version 01 Sectoral Scope: 07 28 July 2006
28
If the CDM project includes only parts of a larger activity, the fuel used for the CDM project is separated from the total fuel used. The separation is done (in order of preference) by the following means: • By operators: This method is used if certain operators are assigned to certain parts of the project • By distance driven: the fuel share for each part of the project is based on the share of kilometers per project part • By passengers: the fuel share for each part of the project is based on the share of passengers per part of the project (based on the entry points of passengers) Total project emissions are calculated by using formula (11) from the associated baseline methodology AM0031.

UNFCCC/CCNUCC CDM – Executive Board AM0031/ Version 01 Sectoral Scope: 07 28 July 2006
29
Baseline emissions ID number
Data variable
Source of data
Data unit Measured (m), calculated (c), estimated (e)
Recording frequency
Proportion of data to be monitored
How will the data be archived? (electronic/ paper)
Comment
4. Ni,x
Number of vehicles
Official statistics and proprietary
Vehicles m Before project start and annually (in the case of modal shift for passenger cars)
100% and annually based on a survey of passengers using the new system
Electronic Per vehicle category the amount of vehicles per relevant fuel type (gasoline, diesel, LNG, CNG or electric vehicles) needs to be identified. Only categories are included where modal shift is expected (next to public transport) – see NMB. Annual recording of fuel type used from passengers using the new system which in absence of the project would have used a passenger car (only required if a modal shift of passenger cars is included in the project).
5. SECx,i
Fuel efficiency
Proprietary, IPCC or international literature
litres/km m Before project start
Sample Electronic Per vehicle category required; Based either on local measurements or international data from comparable regions or IPCC values adapted to local circumstances
6. DDZ,S DDZ,M DDZ,L DDT
Total distance driven by all vehicles in category
Official statistics
km m Before project start and partially annually
Sample Electronic Statistics are based in general on samples. Required for all sub-categories of buses baseline and for taxis and potentially other categories. Important is to have the same data source for distance driven and passengers for public transport to ensure consistency. Data can be either with or without the informal sector as long as above mentioned parameters are from the same data source. In general data including only the formal sector is of better data quality and should thus be taken.

UNFCCC/CCNUCC CDM – Executive Board AM0031/ Version 01 Sectoral Scope: 07 28 July 2006
30
ID number
Data variable
Source of data
Data unit Measured (m), calculated (c), estimated (e)
Recording frequency
Proportion of data to be monitored
How will the data be archived? (electronic/ paper)
Comment
7. Pi
Passengers transported baseline by vehicle category i
Official statistics
Passengers m Before project start
100% Electronic This is for calculation the emission factor for the baseline and is not for calculating the total baseline emissions. Latter are calculated based on the passengers transported by the project. It is important to have the same data source for distance driven (ID 6) and passengers (ID 7) to ensure consistency. Data can be either with or without the informal sector as long as above-mentioned parameters are from the same data source. In general data including only the formal sector is of better data quality and should thus be taken.
8. OCi OCi,y
Average occupancy rate baseline of vehicle category i
Official statistics or proprietary
Passengers m Before project start and for buses and taxis minimum year 3, 6 and 10
Sample Electronic Required for all categories of vehicles baseline if passenger-km is calculated based on occupancy rate and trip distance and for leakage taxis and buses. For buses, monitoring required at a minimum in years 3, 6 and 10 as part of leakage. For taxis also if this vehicle category is included in the project. Need to have explanation of how this survey is done
9. TDi TDi,y
Average trip distance baseline for vehicle category i
Official statistics or proprietary
Km m Before project start and annually (in the case of modal shift for passenger cars)
Sample and sample survey
Electronic Required for all categories of vehicles baseline if passenger-km is calculated based on occupancy rate and trip distance. Average trip distances of passengers using the new system are recorded through surveys based on the mode of transport they would have used in absence of the project (for users which would have used passenger cars, taxis or motorcycle; only required if modal shift effects are demanded by the project).

UNFCCC/CCNUCC CDM – Executive Board AM0031/ Version 01 Sectoral Scope: 07 28 July 2006
31
ID number
Data variable
Source of data
Data unit Measured (m), calculated (c), estimated (e)
Recording frequency
Proportion of data to be monitored
How will the data be archived? (electronic/ paper)
Comment
10. TCx.i
Total fuel consumption per vehicle category
Official statistics or proprietary
Litres m Before project start
Sample Electronic Required if calculations are based on sectoral fuel consumption data
11. Py
Passengers transported by project
Proprietary Passengers m Annually 100% Electronic Statistics of transit management unit show the number of passengers transported by the project in total. This is based on electronic or mechanical measurement of all passengers using the system. Used to calculate ex-post the baseline emissions and to fulfil the applicability conditions.
11bis. Si
Share of passengers that would have taken transport mode i
Proprietary % m The project monitors what transport mode passengers would have used in absence of the project. See paragraph below for details on the survey. The survey is also required if no modal shift is included in the project. In this case the modes of transport are only public transport, NMT and induced traffic.
12. Pi,y
Passengers transported by project who would have used transport mode i
Proprietary Passengers c Bi-monthly
Sample survey
Electronic

UNFCCC/CCNUCC CDM – Executive Board AM0031/ Version 01 Sectoral Scope: 07 28 July 2006
32
ID number
Data variable
Source of data
Data unit Measured (m), calculated (c), estimated (e)
Recording frequency
Proportion of data to be monitored
How will the data be archived? (electronic/ paper)
Comment
13. Policies
Policies that affect baseline
Proprietary None E Before project start and annually
100% Electronic Transport policies, which affect the baseline emissions, are identified and their impact on any of the baseline factors is estimated. This is done ex-ante to project start. Annually the project assesses if a new policy has been implemented which changes in a measurable manner a baseline parameter. Project participants need to assess if policies might have effects on various parameters.
Details of Data on Fuel Consumption Baseline (ID 5) Two methodological alternatives are proposed for the fuel consumption data (in order of preference):
Alternative 1: Measurement of fuel consumption data using a representative sample for the respective category and fuel type. Factors such as the specific urban driving conditions (drive-cycle, average speed etc), vehicle maintenance and geographical conditions (altitude, road gradients etc) are thus included. The sample must be large enough to be representative 19. To ensure a conservative approach the top 20% of the sample is not included in calculations. This ensures a conservative approach. Such surveys are potentially conducted by international organizations or by local transit or environmental authorities. As such surveys are however costly they are only available in few cities. Alternative 2: Use of fixed values based on the national or international literature. The literature data can either be based on measurements of similar vehicles in comparable surroundings (e.g. from comparable cities of other countries) or may include identifying the vehicle age and technology of average vehicles circulating in the project region and then matching this with the most appropriate IPCC values. The most important proxy to identify vehicle technologies is the average age of vehicles used in the area of influence of the project. To determine if either US or European default factors apply either local vehicle manufacturer information can be used (in the case of having a substantial domestic vehicle motor industry) or source of origin of vehicle imports.
Note that a technical improvement factor is also considered (see Formula in Annex to the Baseline methodology).
19 Variances of fuel consumption will result due to different routes, load factors, engine and vehicle types, driver, driving conditions, ambient conditions etc.
UNFCCC/CCNUCC CDM – Executive Board AM0031/ Version 01 Sectoral Scope: 07 28 July 2006
33
Details of Survey to Identify Mode of Transport (ID 12 and 9) The survey is used to distribute the electronically or mechanically registered total number of passengers to different transport modes that they would have used in absence of the project. The basic goal of this survey is to identify the mode of transport used in absence of the project. Additionally the survey is also used to track any changes in distance driven of passengers (which in absence would have used passenger cars, motorcycles or taxis) as well as the fuel type used in passenger cars for passengers using the system which an absence of latter would have used passenger cars. The precise survey methodology to be used will vary with each individual project. The PDD must contain an elaborated version of such a survey. Also a sensitivity analysis shall be made in the PDD to assess the sensitivity of emission reductions to changes in the recorded shares of passengers towards different modes of transport, change of distance driven per mode of transport and change of fuel type used by passenger cars. The survey is conducted annually during project duration based on a representative survey of all passengers. The categories of transport modes include public transport (buses), taxis, passenger cars, motorcycles, non-motorized transport and induced traffic (i.e. passenger would not have realized the trip in absence of the project). The relative distribution is measured and the absolute numbers are calculated based on total passengers transported. Additionally, per specific transport mode the users are asked for their trip origin and destination to calculate distance driven. Users of the system that would have used passenger cars in absence of the BRT system are additionally asked what fuel type their passenger car uses. The following survey principles shall be followed:
• The survey must be realized with maximum 5% error margin and a 95% confidence interval. This confidence interval corresponds to the guidelines issued by the EB in its 22nd meeting Annex 2 (EB 22 report Annex 2, D, page 3): “Methodologies employing sampling to derive parameters in estimating emissions reductions shall quantify these parameter uncertainties at the 95% confidence level”.
• The sampling size is determined by the 95% confidence interval and the 5% maximum error margin. • Sampling must be statistically robust and relevant i.e. the survey has a random distribution and is representative of the persons using the BRT system. • The methodology to select persons for interviews is based on a systematic random sampling based on the flow of passengers per station per day per hour
(i.e. the number of persons to be interviewed randomly per bus station and per hour per day is based on the total flow of passengers per station-day-hour to have a representative sample)
• Only persons over age 12 are interviewed • Minimum bi-monthly and preferably monthly surveys are to be realized to avoid any problems due to varying usage dependent on month of use (e.g.
vacations) • The survey shall be executed by an external organization with specialized knowledge on survey and survey techniques. • Training of the people conducting the questionnaire must be made by the organization performing latter to ensure good quality. The training must be based
on standard questionnaire techniques and quality assurance.

UNFCCC/CCNUCC CDM – Executive Board AM0031/ Version 01 Sectoral Scope: 07 28 July 2006
34
• Before starting the official monitoring a test-run using the same questionnaire should be realized. This to ensure that the questions and multiple-choice answers are correctly understood by the passengers.
• The PDD must contain the design details of the survey. Relevant for the PDD is that the design can guarantee a representative survey with the targeted confidence interval. The same question should be used throughout the crediting period to ensure consistency.
• The survey must allow for a clear separation of modes of transport which the passenger would have used in absence of the project. • The survey should include control questions to assure a conservative approach • A sensitivity analysis of the share of passengers that would have taken a given transport mode in absence of the project needs to be carried out showing the
percentage change in the modal split required to change emission reductions by 5%. • A sensitivity analysis is realized to calculate the impact of lower than baseline trip distances and of changing fuel types in passenger cars • The relative modal distribution is maintained constant for the year after a policy affecting potentially the modal distribution has been enforced. The
emission reductions due to the policy change are thus fully accounted for in the baseline in a conservative manner (100% is attributed to the policy change). • BRT projects are in general implemented gradually. The questions asked by surveys can thus compare a still existing public transport system with the
project situation. • If a passenger is not sure how he would have made a trip he is assigned to induced transport. This ensures a conservative approach.
The default questionnaire to be used is included in Appendix A below. This questionnaire should be used by all projects except if valid arguments exist to change the questionnaire and to adapt it to local circumstances. The questionnaire must be realized in the local language. Formula (1) from the associated baseline methodology AM00XX is used to calculate transport emissions factor per distance of vehicle category. If fewer than 10% of vehicles in a specific vehicle category are gasoline, diesel, CNG or LPG powered then this respective fuel can be omitted for simplicity purposes. In alternative vehicles the threshold value is less than 1%. Two methodological alternatives are proposed for the fuel consumption data (in order of preference):
Alternative 1: Measurement of fuel consumption data using a representative sample for the respective category and fuel type. To ensure a conservative approach the top 20% of the sample is not included in calculations. Alternative 2: Use of fixed values based on the national or international literature. The literature data can either be based on measurements of similar vehicles in comparable surroundings (e.g. from comparable cities of other countries) or may include identifying the vehicle age and technology of average vehicles circulating in the project region and then matching this with the most appropriate IPCC default values. The most important proxy to identify vehicle technologies is the average age of vehicles used in the area of influence of the project. To determine if either US or European default factors apply either local vehicle manufacturer information can be used (in the case of having a substantial domestic vehicle motor industry) or source of origin of vehicle imports.

UNFCCC/CCNUCC CDM – Executive Board AM0031/ Version 01 Sectoral Scope: 07 28 July 2006
35
A technical improvement factor is thereafter introduced. The technology improvement factor results in dynamic emission factors for the different units. See step 3. Calculate Emissions per Passenger per vehicle Category This step calculates emission factors showing the emissions per passenger per average trip for each vehicle category and uses formulas (2) (for buses) and (3) (for passenger cars, taxis and motorcycles) from the associated baseline methodology AM0031. The time period for passengers and distance must be equal (e.g. one year or one month). All data used is determined ex-ante project. A change in the occupancy rate of buses is registered as leakage of the project. Calculate Emission Factor Based on Sector Data This approach is based on sector fuel consumption data and differentiates fuel consumption per fuel type for all different vehicle categories such as identified in the first step. Following conditions apply to using this alternative: • A study on sector fuel consumption separating the vehicle categories is available with a confidence interval of minimum 95% (i.e. error margin maximum 5%). • The geographic region of the project can be separated well. • Data for fuel consumption must have the same year/time period and the same geographic boundaries as data of passengers transported. • Data must be crosschecked with total fuel consumption of the region.
Emissions per passenger are calculated by taking the sector consumption and the passengers transported per vehicle category, and uses formula (4) from the associated baseline methodology AM00XX. Fuel consumption data is transformed to CO2e emissions. This is calculated for all relevant vehicle categories. If alternative fuels such as gas (CNG or LNG) are used they are included in the calculations using the appropriate default values for CO2, CH4 and N2O. Change of Baseline Parameters during Project crediting period

UNFCCC/CCNUCC CDM – Executive Board AM0031/ Version 01 Sectoral Scope: 07 28 July 2006
36
The baseline emissions per passenger trip for taxis, passenger cars and motorcycles are adjusted annually with a correction factor to changing trip distances, and uses formula (5) from the associated baseline methodology AM00XX. Note: The adjustment is only made if TDi.y < TDi to ensure a conservative approach20. The baseline emissions for all passengers transported are calculated. This is differentiated according to the mode of transport, which the person would have used in absence of the project. Passengers transported are determined through the project (activity level of the project). The total amount of passengers transported by the project shall be reported by the system operator. Total baseline emissions. These are calculated using formulas (6), (7), (8) from the associated baseline methodology AM0031.
20 Larger distances would increase baseline emissions per passenger trip. The project emissions of larger trip distances are however fully recorded as project emissions are based on total fuel consumed.

UNFCCC/CCNUCC CDM – Executive Board AM0031/ Version 01 Sectoral Scope: 07 28 July 2006
37
Leakage ID number
Data variable
Source of data
Data unit Measured (m), calculated (c), estimated (e)
Recording frequency
Proportion of data to be monitored
How will the data be archived? (electronic/ paper)
Comment
14. CEM
Amount of cement used per km trunk road
Proprietary t/km m Annually 100% Electronic Measured annually during construction phase. Calculations ex-ante are based on construction plans
15. ASP
Amount of asphalt used per km trunk road
Proprietary t/km m Annually 100% Electronic Measured annually during construction phase. Calculations ex-ante are based on construction plans
16. DT
Length of trunk roads
Proprietary Km m Annually 100% Electronic Measured annually during construction phase. Calculations ex-ante are based on construction plans
17. BSCRw
Buses scrapped by project
Proprietary Buses m Annually 100% Electronic For leakage calculations ex-ante the expected number of scrapped buses are estimated. Monitoring is based on scrapping reports; size of bus (large, medium, small) must be recorded; “Transformation” into large buses is made based on passenger capacity (large units = 80 passengers)
18. BABL
Average age of retired buses baseline
Official statistics
Years m Before project start
100% Electronic Based on transport or vehicle registration statistics. Estimated from average of buses retired in the 3 years prior to the project
19. BAPJ
Average age of scrapped buses
Proprietary Years m Annually 100% Electronic For leakage calculations ex-ante the expected age of scrapped buses is estimated. If scrappage data does not contain the age of the vehicle then vehicle registration statistics can be taken assuming that always the eldest vehicles will be scrapped first (this is also the methodology used for calculations ex-ante)

UNFCCC/CCNUCC CDM – Executive Board AM0031/ Version 01 Sectoral Scope: 07 28 July 2006
38
ID number
Data variable
Source of data
Data unit Measured (m), calculated (c), estimated (e)
Recording frequency
Proportion of data to be monitored
How will the data be archived? (electronic/ paper)
Comment
20. ROCi,y OCi,y
Occupancy rate of vehicle category i relative to capacity; occupancy of vehicle category i
Proprietary % C,M Before project start plus regular intervals thereafter
Sample Electronic The occupancy rate of taxis and the remaining bus fleet is monitored through representative samples. If results show negative changes > 10 % in the load factor, this change is attributed and included in the leakage calculation for all years since the last monitoring of the load factor. Recommended interval: year 3, 6 and 10 for 10 year crediting period; year 3 and 7 for 7 year crediting period See details below.
21. NZ,y, NT,y
Number of conventional buses and taxis still operating
Official statistics or proprietary
Units M Before project start plus regular intervals thereafter
100% Electronic Registration statistics. Same years to be monitored as in Item 20
22. SRS
Share of road space used by public transport baseline
Official statistics or proprietary
Percentage E, c Before project
Electronic Used for urban transport and infrastructure models; see baseline formulae for calculation of SRS if the data is not available from reports: The share of road space used by public transport is a figure often calculated in transport studies. If no reliable data is available as proxy the relative distance driven per different vehicles can also be taken. SRS would then be the distance driven by the public transport (baseline) divided by the total distance of all vehicles driven (baseline). This would be a conservative factor as buses

UNFCCC/CCNUCC CDM – Executive Board AM0031/ Version 01 Sectoral Scope: 07 28 July 2006
39
ID number
Data variable
Source of data
Data unit Measured (m), calculated (c), estimated (e)
Recording frequency
Proportion of data to be monitored
How will the data be archived? (electronic/ paper)
Comment
are larger than private cars and thus occupy a larger share of road space per kilometre driven.
23. RSP, RSB
Road space baseline and project
Official statistics and proprietary
Index, km E Before project start
100% Electronic Road space baseline based on official information. Reduced road space based on construction plans (reduced road space is lanes which where eliminated due to dedicated bus lanes). Road space project = road space baseline – eliminated lanes
24. TRC
Number of daily trips undertaken by passenger cars
Official statistics or proprietary
Unit m Before project start
Sample Electronic Based on suveys. Used for urban transport and infrastructure models
25. VPJ, VBL
Average speed passenger car in baseline and project
Proprietary km/h m/e Before project start
100% Electronic Based on transport models The average speed of passenger cars before project start and the expected speed after decongestion is calculated
Details of Load Factor Study The frequency of the road load study is:
• If 100% of the project is implemented at the start: Year 2 to monitor short-term response of remaining bus fleet to project and years 5 and 10 to monitor medium-term response. Data of year 2 is used for years 3-5 and data of year 5 for rest of crediting period. To monitor the occupancy rate of the remaining buses every year is not considered as necessary, as changes are expected either in the first years (short-term response) or then in the medium-term. In between only incremental annual changes are expected which would not justify the considerable expenses for realizing such surveys.
• With gradual project implementation monitoring years may vary. It is proposed to monitor at a minimum every 3 years e.g. year 3, 6 and 10.

UNFCCC/CCNUCC CDM – Executive Board AM0031/ Version 01 Sectoral Scope: 07 28 July 2006
40
If the load factor reduces less than 10 percentage points no leakage is included. If the load factor reduces by more than 10 percentage points relative to the measurement before project start (benchmark) then leakage is calculated and included. In this case the amount of leakage is the cumulative sum of all years since the last load factor survey was realized assuming that the reduction of the load factor occurred immediately since the last survey. Guideline for the establishment of load factor studies for buses Load factor surveys shall be based on “Visual Occupation Studies”. The procedures to establish visual occupation are as follows: 1. Vehicle categories are defined according to the characteristics of the fleet and types of services (e.g. with or without standing passengers). 2. Occupation categories are defined (usually 5 or 6), for instance <50% occupied, 50-100% seats occupied, 100% seats occupied, <50% space for standing
passengers occupied, 50-100% of standing space occupied, overload (>100% of legally permitted space occupied) 3. The number of passengers corresponding to each vehicle category and type of service is defined. A pilot study could be completed to calibrate the levels of
occupation with actual in vehicle counts. 4. Formats for field study are prepared 5. Field data collectors are trained 6. Locations, days and times for field study are defined. Points are strategically located to cover all the routes with the minimum of points. Suggested days are
Tuesday to Thursday, avoiding days immediately after or before a holiday. Atypical seasons (school or university vacations) should be avoided. The recommended time period for the study is 6AM-9PM. More important is, however, that the same days and time periods are chosen for the baseline as well as for the monitoring studies to ensure data comparability.
7. Field data is collected. Coverage of the occupation counts should be higher than 95% of the number of buses that cross the checkpoint. 100% coverage is desired. To control this outcome, a separate vehicle count is advised. Data can be adjusted with the actual count.
8. Data is digitized and its quality is controlled. In case of mistakes in data collection, counts should be repeated. 9. The total number of vehicles, number of available spaces (vehicle capacity) and the total number of passengers is reported. Occupation is the number of
passengers divided by the vehicle capacity. The average load factor is equal to the average load factor of each route multiplied by the total number of passengers in the route, divided by the total passengers in the network. Guideline for the establishment of load factor studies for taxis This study is only conducted if modal shift is claimed from former taxi passengers. The actual number of passengers excluding the driver of taxis is counted in a given point within a given time period. The counting is based on visual occupation counting the number of passengers occupying the taxi. Procedures to establish visual occupation:

UNFCCC/CCNUCC CDM – Executive Board AM0031/ Version 01 Sectoral Scope: 07 28 July 2006
41
1. Locations, days and times for field study are defined. Suggested days are Monday to Friday, avoiding days immediately after or before a holiday. Atypical seasons (school or university vacations) should be avoided. The recommended time period for the study is 6AM-9PM. More important is, however, that the same days and time periods are chosen for the baseline as well as for the monitoring studies to ensure data comparability.
2. Field data is collected. Coverage of the occupation counts should be higher than 95% of the number of taxis that cross the checkpoint. 100% coverage is desired. To control this outcome a separate vehicle count is advised. Data can be adjusted with the actual count.
3. Data is digitized and its quality is controlled. In case of mistakes in data collection counts should be repeated. 4. Occupation is the number of passengers using the taxi. The driver is not counted. Taxis without passengers are counted as 0 occupation. 5. The total number of taxis and the total number of passengers is reported. The average occupation rate of taxis is the total number of passengers divided by
the total number of taxis in which counts were performed. 6. The study is realized in different locations of the city during minimum 5 days. 7. The same methodology is used for the load study performed prior to the project as during the monitoring. Locations of monitoring can however change as
traffic flows in cities change over time. Other parameters of the study (duration, sample size, counting method etc) however should remain constant to ensure consistency and comparability of studies.
1. Upstream Emissions. These are calculated using formulas (12) to (19), formula (20) or (21), and formulas (22) to (26) from the associated baseline methodology AM0031.

UNFCCC/CCNUCC CDM – Executive Board AM0031 / Version 01 Sectoral Scope: 07 28 July 2006 B.7. Please indicate whether quality control (QC) and quality assurance (QA) procedures are being undertaken for the items monitored: Data (Indicate table and ID number e.g. 3.-1.; 3.2.)
Uncertainty level of data (High/Medium/Low)
Explain QA/QC procedures planned for these data, or why such procedures are not necessary.
fuel consumption project 2-1; 1
Low Data of measurements can be cross-checked against specific fuel consumption data. Variations in the specific fuel consumption from the average factor need to be controlled. Variations are possible due to different bus models used, variations resulting from routes and frequency, load factor variances and driver variances.
Fuel efficiency project 2-1; 2
Low Operators record fuel consumption data. Distance driven based in general on GPS. Thus precise results for project data. Variations in the specific fuel consumption in a specific enterprise and between enterprises need to be controlled. Variations are possible due to different bus models used, variations resulting from routes and frequency, load factor variances and driver variances. Controls are based on checking data with the operators including checks of bills issued by fuel companies. If project fuel emissions are based on specific fuel consumption values of not the total fleet but only a representative sample then all data with specific fuel consumptions more than 20% lower than the average specific fuel consumption of comparable units is omitted to ensure a conservative approach.
distance driven project 2-1; 3
Low Based in general on GPS; Kilometres driven is the base for paying bus operators. This data is thus well checked and verified by the transit operator.
number of vehicles baseline 2-3; 4
Low In general various official sources are available (vehicle registration data; transportation statistics). Important is to have the same data source for distance driven and passengers for public transport to ensure consistency. Data can be either with or without the informal sector as long as above-mentioned parameters are from the same data source. In general data including only the formal sector is of better data quality and should thus be taken. To ensure quality the data source and calculation method need to be stated. With the annual survey data on the fuel type of passenger cars used by passengers now using the BRT system is recorded. Changes to the baseline emission factor for passenger cars are only made if the monitored data results in lower emission factors, not so however if the data results in higher emission factors.
fuel efficiency vehicles baseline 2-3; 5
Medium Result is checked for consistency against manufacturer data and default IPPC values (alternative for baseline estimation; see baseline methodology).
distance driven baseline buses and taxis 2-3; 6
Medium In general various official sources are available (vehicle registration data; transportation statistics). For QA it is important to have the same data source for items 4, 5 and 7 if calculations are related.
passengers transported baseline 2-3; 7
Low In general various official sources are available (vehicle registration data; transportation statistics). The same data source should be taken as for item 6 to ensure data consistency.

UNFCCC/CCNUCC CDM – Executive Board AM0031 / Version 01 Sectoral Scope: 07 28 July 2006
43
average occupancy rates vehicles baseline 2-3; 8
Medium The same data source should be taken as for item 9 to ensure data consistency.
average trip distance baseline 2-3; 9
Low Data is based on origin-trip survey used to design the project including the QA procedures involved in such studies The same data source should be taken as for item 8 to ensure data consistency. The annual survey is based on a questionnaire, which is representative. Data from the annual survey is however only used if this results in lower baseline emissions (i.e. lower trip distances are monitored than the original baseline data)
Total fuel consumption per vehicle category 2-3; 10
Low Data is based on sector surveys of fuel consumption per category and can be checked against statistics of total fuel consumption; The study should have a 95% confidence interval with a 5% error margin.
passengers transported by project 2-3; 11
Low Statistics are based on electronic or mechanic measurements and are cross-checked against financial receipts from the sale of tickets.
passengers transported by the project which in absence of latter would have used other transport modes 2-3; 12
Low Important is that the same methodology is used to estimate transport modes over the whole crediting period. For QA a precise and transparent data collection protocol is established detailing methodology and operational issues (including frequency, location, time, duration of measurement). The sample size is determined to ensure a 90% confidence interval using statistical techniques for random surveys. The PDD must contain a survey format as well as the survey methodology to be used. A sensitivity analysis of this parameter must be realized.
Policies which affect baseline 2-3; 13
Moderate Policies are assessed. Their potential impact on the modal split and on other relevant parameters affecting baseline emissions is assessed based on information or studies realized by the policy promoter. If the impact in modal switch is significant it is assumed that the full modal switch of the implementation year is attributable to the policy and not the project. If a measurable impact exists on any baseline parameter the respective baseline emission factors are changed.
amount of cement used in trunk roads 4-1; 14
Low Based on implementations and payments realized; ex-ante based on plans and public bids where also constructors make estimates
amount of asphalt used in trunk roads 4-1; 15
Low Based on implementations and payments realized; ex-ante based on plans and public bids where also constructors make estimates
longitude of trunk roads 4-1; 16
Low Based on implementations and payments realized; ex-ante based on plans and public bids where also constructors make estimates
buses scrapped 4-1; 17
Low Based on scrapping reports required to enter bids for the operation of lines
Average age of retired buses baseline 4-1; 18
Low Official data sources are in general available (registration data and transport statistics).

UNFCCC/CCNUCC CDM – Executive Board AM0031 / Version 01 Sectoral Scope: 07 28 July 2006
44
average age of scrapped buses 4-1; 19
Low Based on scrapping reports required to enter bids for the operation of lines
average occupancy rates of remaining taxis and conventional buses (relative to capacity in buses) 4-1; 20
Medium Important is that the same methodology is used to measure the occupancy rate thus ensuring data consistency. For QA a precise and transparent data collection protocol is thus established detailing methodology and operational issues (including frequency, location, time, duration of measurement). The data is only required at a medium level as only changes >10 percentage points will be registered. The same data source should be taken as for item 19 to ensure data consistency.
Number of conventional buses and taxis still operating 4-1; 21
Low In general various official sources are available (vehicle registration data; transportation statistics). Important is to ensure that over time the same source or the same calculation method (e.g. average of sources) is applied. The same data source should be taken as for item 20 to ensure data consistency.
share of road space used by public transport 4-1; 22
Medium Based on calculations made for urban infrastructure and transport scenarios or on the calculation method provided using data on the distance driven of various vehicle categories
Road space baseline and project 4-1; 23
Low Based on calculation (RSP) and infrastructure statistics
number of daily trips realized by passenger cars 4-1; 24
Low Based on calculations made for urban infrastructure and transport scenarios; based on sample countings in general
Average speed passenger car baseline and project 4-1; 25
Medium Traffic models use such data and have verified them. The data accuracy is not very important as data is only used to estimate roughly leakage based on change of vehicle speed and induced traffic. Both elements in it have a moderate accuracy.

UNFCCC/CCNUCC CDM – Executive Board AM0031 / Version 01 Sectoral Scope: 07 28 July 2006 Appendix B DEFAULT QUESTIONNAIRE FOR MODAL SPLIT SURVEY (ID 12, partially 4 and 9) Interviewer:…………………………… Date: .-…………………………………. Time:……………………………………. Bus identification (line):……………………………… “Assuming that the bus system you are currently using would not exist: What mode of transport would you have used for this specific trip you are doing currently”. For the interviewer:
- The question is related to this specific trip and not to the trips realized by the person during the year in general.
- To clarify mention that you are comparing the system he/she is using currently to the one which existed formerly respectively (according to project) continues to exist in other parts of the city not served by the BRT system
- Persons which cannot relate it to any mode of transport are taken as induced traffic (conservative default parameter)
Multiple-choice answers (Only tick one; if the passenger would have used more than one transport mode for the trip he/she is realizing currently then tick the mode, which involves the longest distance):
1. Conventional bus based public transport (this exists normally still as BRT systems are implemented gradually; otherwise a description can be given of the former existing system including photos of former buses)
2. Passenger car → please go to 2A 3. Taxi (if relevant in the project) → please go to 3A 4. Motorcycle (if relevant in the project) → please go to 4A 5. NMT (per foot or bicycle) 6. I would not have made the trip (induced traffic)
If the passenger responds with the answer 2 then ask: 2A. Do you or your family own a car or do you have access to a car (e.g. car-sharing)?
□ NO □ YES If the passenger responds with NO this specific questionnaire is deemed as non-consistent and
removed from the final counting 2B. What fuel type does the car use to which you have access?
□ gasoline □ diesel □ gas (CNG or LPG) □ electric □ I don’t know □ other: which:…………………………………………. 2C. What is the starting point of your trip (origin) and which is the final (destination) point? Please name the station or location where you first boarded a bus and where you will make the final stop? For the interviewer: Please advise the passenger that the original departing and final point is required. This may include bus transboarding such as first using a feeder line and then a main line. It is thus the origin and final destination of the passenger trip and not of the ride on this specific bus-line.
Origin (departing point): ……………………………………………………

UNFCCC/CCNUCC CDM – Executive Board AM0031 / Version 01 Sectoral Scope: 07 28 July 2006
46
Destination (final point): …………………………………………………… If the passenger responds with the answer 3 then ask: 3A. Have you used in the last 12 months a taxi ?
□ NO □ YES If the passenger responds with NO this specific questionnaire is deemed as non-consistent and
removed from the final counting 3B. What is the starting point of your trip (origin) and which is the final (destination) point? Please name the station or location where you first boarded a bus and where you will make the final stop? For the interviewer: Please advise the passenger that the original departing and final point is required. This may include bus transbording such as first using a feeder line and then a main line. It is thus the origin and final destination of the passengers trip and not of the ride on this specific bus-line.
Origin (departing point): …………………………………………………… Destination (final point): ……………………………………………………
If the passenger responds with the answer 4 then ask: 4A. Do you or your family own a motorcycle or do you have access to a motorcycle ?
□ NO □ YES If the passenger responds with NO this specific questionnaire is deemed as non-consistent and
removed from the final counting 4B. What is the starting point of your trip (origin) and which is the final (destination) point? Please name the station or location where you first boarded a bus and where you will make the final stop? For the interviewer: Please advise the passenger that the original departing and final point is required. This may include bus transbording such as first using a feeder line and then a main line. It is thus the origin and final destination of the passengers trip and not of the ride on this specific bus-line.
Origin (departing point): …………………………………………………… Destination (final point): ……………………………………………………
The project proponent must include the questionnaire as annex to the PDD. The questionnaire is to be reviewed by the DOE. The DOE assesses if the questionnaire is in accordance with the principles (core elements of survey) specified above.
-.-.-.-