Embed Size (px)
Citation preview

UNFCCC/CCNUCC CDM – Executive Board AM0021 / Version 03 Sectoral Scope: 05 EB 45
1/23
Draft revision to the approved baseline and monitoring methodology AM0021
“Baseline Methodology for decomposition of N2O from existing adipic acid production plants” I. SOURCES AND APPLICABILITY Source This methodology is based on the N2O Emission Reduction Project in Onsan, Republic of Korea, whose baseline study, monitoring and verification plan and project design document were prepared by Rhodia Energy SAS, France, Rhodia Polyamide Intermediate SAS France, and Perspective Climate Change, Germany. For more information regarding the proposal and its consideration by the Executive Board please refer to case NM0061: “N2O Emission Reduction Project in Onsan” on <http://cdm.unfccc.int/methodologies/PAmethodologies/approved.html>. This methodology also refers to the latest approved versions of the following tools:
• “Tool to calculate baseline, project and/or leakage emissions from electricity consumption”; • “Tool to calculate project or leakage CO2 emissions from fossil fuel combustion”; • “Tool for the demonstration and assessment of additionality”.
Selected approach from paragraph 48 of the CDM modalities and procedures “Existing actual or historical emissions as applicable” Applicability This methodology is applicable to project activities that consist of the installation of a new dedicated N2O decomposition facility at existing adipic acid production plants.1 The N2O destruction facility could be either catalytic or thermal decomposition, and will convert the nitrous oxide into nitrogen, and thereby prevent its release to the atmosphere. The methodology is applicable only for existing production capacity of adipic acid where the commercial production had begun by 31 December 2004.
1 Production of adipic acid generates N2O as a by-product. Nitrous oxide (N2O) is typically released into the
atmosphere as it does not have any economic value.

UNFCCC/CCNUCC CDM – Executive Board AM0021 / Version 03 Sectoral Scope: 05 EB 45
2/23
II. BASELINE METHODOLOGY PROCEDURE Project Boundary The spatial extent of the project boundary is the site of the adipic acid production facility and N2O decomposition facility. Schematic illustration of the project boundary is provided in Figure 1 below.
Figure 1: Schematic illustration of the project boundary
Gases and sources considered in the project boundary are provided in Table 1 below.
N2O Decomposition facility
Q_steam_ p
Q_steam_c Fossil Fuels
Adipic Acid Facility
N2O_GE
Q_GE
Electricity
P_AdOH
Q_N2O
ND_N2O
Q_N2O_by-passQ_N2O_ feed %_on - line
Steam Steam
Measured
Measured
Measured
Calculate from Q_GE & N2O_GE
Calculated from Q_N2O & %_on -line
Calculated from Q_N2O & %_on - line
Measured
Measured
Measured
Measured
Calcul ated from P_AdOH
Gaseous effluentPROJECT BOUNDARY
UNFCCC/CCNUCC CDM – Executive Board AM0021 / Version 03 Sectoral Scope: 05 EB 45
3/23
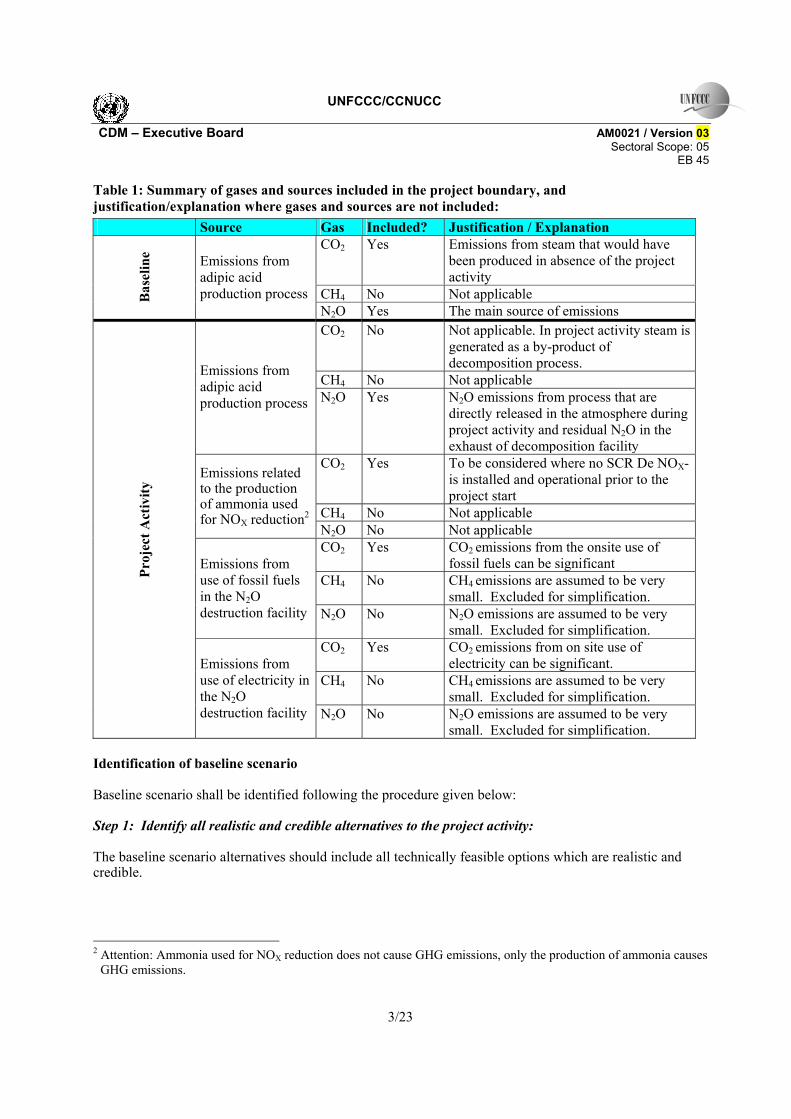
Table 1: Summary of gases and sources included in the project boundary, and justification/explanation where gases and sources are not included:
Identification of baseline scenario Baseline scenario shall be identified following the procedure given below: Step 1: Identify all realistic and credible alternatives to the project activity: The baseline scenario alternatives should include all technically feasible options which are realistic and credible.
2 Attention: Ammonia used for NOX reduction does not cause GHG emissions, only the production of ammonia causes
GHG emissions.
Source Gas Included? Justification / Explanation CO2 Yes Emissions from steam that would have
been produced in absence of the project activity
CH4 No Not applicable Bas
elin
e Emissions from adipic acid production process
N2O Yes The main source of emissions CO2 No Not applicable. In project activity steam is
generated as a by-product of decomposition process.
CH4 No Not applicable Emissions from adipic acid production process N2O Yes N2O emissions from process that are
directly released in the atmosphere during project activity and residual N2O in the exhaust of decomposition facility
CO2 Yes To be considered where no SCR De NOX-is installed and operational prior to the project start
CH4 No Not applicable
Emissions related to the production of ammonia used for NOX reduction2
N2O No Not applicable CO2 Yes CO2 emissions from the onsite use of
fossil fuels can be significant CH4 No CH4 emissions are assumed to be very
small. Excluded for simplification.
Emissions from use of fossil fuels in the N2O destruction facility N2O No N2O emissions are assumed to be very
small. Excluded for simplification. CO2 Yes CO2 emissions from on site use of
electricity can be significant. CH4 No CH4 emissions are assumed to be very
small. Excluded for simplification.
Proj
ect A
ctiv
ity
Emissions from use of electricity in the N2O destruction facility N2O No N2O emissions are assumed to be very
small. Excluded for simplification.

UNFCCC/CCNUCC CDM – Executive Board AM0021 / Version 03 Sectoral Scope: 05 EB 45
4/23
Sub-step 1a: The baseline scenario alternatives should include all possible options that are technically feasible to handle N2O emissions. These options shall include, inter alia:
• The continuation of the current situation, where there will be no installation of unit for the destruction or abatement of N2O;
• Switch to alternative production methods that avoid production of N2O; • Alternative use of N2O such as:
o Recycling and reuse of N2O within the chemical complex; o The use of N2O for external purposes.
• Installation of a Non-Selective Catalytic Reduction (NSCR) DeNOx unit; • Installation of a N2O destruction or abatement technology, i.e., project activity implemented
without CDM. Sub-step 1b: In addition to the baseline scenario alternatives of Step 1a, all possible options that are technically feasible to handle NOX emissions shall be considered, for instance, the installation of a NSCR DeNOx unit could also cause N2O emission reduction. Therefore NOX emission regulations have to be taken into account in determining the baseline scenario. The respective options are, inter alia:
• The continuation of the current situation, where either a DeNOx-unit is installed or not; • Installation of a new Selective Catalytic Reduction (SCR) DeNOx unit; • Installation of a new NSCR DeNOx unit for the purpose of NOX reduction; • Installation of any other new tertiary measure that combines NOX and N2O emission reduction.
Step 2: Eliminate baseline alternatives that do not comply with mandatory legal or regulatory requirements:
(1) The baseline alternatives shall be in compliance with all applicable legal and regulatory requirements, even if these laws and regulations have objectives other than GHG reductions (N2O), e.g. national or local NOX regulations or byproduct waste. This step does not consider national and local policies that do not have legally binding status. Eliminate all baseline alternatives that do not comply with the legal and regulatory requirements on N2O and NOX emissions;
(2) If an alternative does not comply with all applicable legislation and regulations, then show that, based on an examination of current practice in the country or region in which the law or regulation applies, those applicable legal or regulatory requirements are systematically not enforced and that non-compliance with those requirements is widespread in the country. If this cannot be shown, then eliminate the alternative from further consideration;
(3) If the proposed project activity is the only alternative amongst the ones considered by the project participants that is in compliance with all regulations with which there is general compliance, then the proposed project activity is the baseline scenario.

UNFCCC/CCNUCC CDM – Executive Board AM0021 / Version 03 Sectoral Scope: 05 EB 45
5/23
Table 2: Potential baseline scenarios taking legal or regulatory requirements into account: Adipic acid Production Plant in compliance with N2O and NOX regulation
Adipic acid Production Plant not in compliance with NOX regulation
Adipic acid Production Plant not in compliance with N2O regulation
Continuation Status quo SCR DeNOx installation SCR De NOX installation that combines N2O and NOX emission reduction
Installation of N2O destruction or abatement technology
Installation of NSCR De NOX technology
Installation of N2O destruction or abatement technology
Alternative use of N2O Destruction method that combines NOX and N2O emission reduction
Alternative use of N2O
Step 3: Eliminate baseline alternatives that face prohibitive barriers (barrier analysis): Sub-Step 3a: On the basis of the alternatives that are technically feasible and in compliance with all legal and regulatory requirements, the project participant should establish a list of barriers that would prevent alternatives to occur in the absence of CDM. Barriers should include, among others:
• Investment barriers, inter alia:
o Debt funding is not available for this type of innovative project activity; o No access to international capital markets due to real or perceived risks associated with
domestic or foreign direct investment in the country where the project activity is to be implemented.
• Technological barriers, inter alia:
o Technical and operational risks of alternatives; o Technical efficiency of alternatives (e.g. N2O destruction, abatement rate); o Skilled and/or properly trained labor to operate and maintain the technology is not available
and no education/training institution in the host country provides the needed skill, leading to equipment disrepair and malfunctioning;
o Lack of infrastructure for implementation of the technology.
• Barriers due to prevailing practice, inter alia:
o The project activity is the “first of its kind”: No project activity of this type is currently operational in the host country or region.
Provide transparent and documented evidence, and offer conservative interpretations of this documented evidence, as to how it demonstrates the existence and significance of the identified barriers. Anecdotal evidence can be included, but alone is not sufficient proof of barriers. The type of evidence to be provided may include:
(a) Relevant legislation, regulatory information or industry norms; (b) Relevant (sectoral) studies or surveys (e.g. market surveys, technology studies, etc) undertaken
by universities, research institutions, industry associations, companies, bilateral/multilateral institutions etc;
(c) Relevant statistical data from national or international statistics;

UNFCCC/CCNUCC CDM – Executive Board AM0021 / Version 03 Sectoral Scope: 05 EB 45
6/23
(d) Documentation of relevant market data (e.g. market prices, tariffs, rules); (e) Written documentation from the company or institution developing or implementing the CDM
project activity or the CDM project developer, such as minutes from Board meetings, correspondence, feasibility studies, financial or budgetary information, etc;
(f) Documents prepared by the project developer, contractors or project partners in the context of the proposed project activity or similar previous project implementations;
(g) Written documentation of independent expert judgments from industry, educational institutions (e.g. universities, technical schools, and training centers), industry associations and others.
Sub-Step 3b: Show that the identified barriers would not prevent the implementation of at least one of the alternatives (except the proposed CDM project activity):
• If any of the baseline scenario alternatives face barriers that would prohibit them from being implemented, then these should be eliminated;
• If all project alternatives are prevented by at least one barrier, either the proposed CDM project is itself the baseline or the set of project alternatives has to be completed to include the potential baseline;
• If there are several potential baseline scenario candidates, choose the most conservative alternative as a baseline scenario and go to Step 5, otherwise go to Step 4.
Step 4: Identify the most economically attractive baseline scenario alternative:
Determine which of the remaining project alternatives that are not prevented by any barrier is the most economically or financially attractive.
To conduct the investment analysis, use the following sub-steps: Sub-step 4a: Determine appropriate analysis method:
Determine whether to apply a simple cost analysis or an investment comparison analysis. If all remaining project alternatives generate no financial or economic benefits other than CDM related income, then apply the simple cost analysis (Option 1). Otherwise, use the investment comparison analysis (Option 2).
Sub-step 4b: Option 1: Apply simple cost analysis:
Document the costs associated with alternatives to the CDM project activity and demonstrate that the corresponding activities produce no financial or economic benefits.
• If all alternatives do not generate any financial or economic benefits, then the least costly alternative
among these alternative is pre-selected as the most plausible baseline scenario candidate; • If one or more alternatives generate financial or economic benefits, then the simple cost analysis
cannot be used to select the baseline scenario.
Sub-step 4c: Option 2: Apply investment comparison analysis:
Identify the financial indicator, such as IRR, NPV, cost benefit ratio, or unit cost of service most suitable for the project type and decision-making context.
Calculate the suitable financial indicator for each of the project alternatives that have not been eliminated in Step 3 and include all relevant costs (including, for example, the investment cost, the operations and maintenance costs, financial costs, etc.) and revenues (including subsidies/fiscal incentives, etc. where applicable), and, as appropriate, non-market costs and benefits in the case of public investors.

UNFCCC/CCNUCC CDM – Executive Board AM0021 / Version 03 Sectoral Scope: 05 EB 45
7/23
Present the investment analysis in a transparent manner and provide all the relevant assumptions in the CDM-PDD, so that a reader can reproduce the analysis and obtain the same results. Clearly present critical techno-economic parameters and assumptions (such as capital costs, fuel prices, lifetimes, and discount rate or cost of capital). Justify and/or cite assumptions in a manner that can be validated by the DOE. In calculating the financial indicator, the project’s risks can be included through the cash flow pattern, subject to project-specific expectations and assumptions (e.g. insurance premiums can be used in the calculation to reflect specific risk equivalents).
Assumptions and input data for the investment analysis shall not differ across the project activity and its alternatives, unless differences can be well substantiated. Present in the CDM-PDD submitted for validation a clear comparison of the financial indicator for the proposed project alternative.
The alternative that has the best indicator (e.g. highest IRR) can be pre-selected as the most plausible baseline scenario candidate. Sub-step 4d: Sensitivity analysis (only applicable to Option 2)
Include a sensitivity analysis that shows whether the conclusion regarding the financial attractiveness is robust to reasonable variations in the critical assumptions. The investment analysis provides a valid argument in selecting the baseline only if it consistently supports (for a realistic range of assumptions) the conclusion that the pre-selected baseline scenario candidate is likely to remain the most financially and/or economically attractive.
In case the sensitivity analysis is not fully conclusive, select the most conservative among the project alternatives that are the most financially and/or economically attractive according to both Steps 4c and the sensitivity analysis in the Step 4d, e.g., if the sensitivity analysis shows that one or more project alternatives compete with the one identified in Step 4c., select the alternative with the lowest GHG emissions. Additionality The additionality of the project activity shall be demonstrated and assessed using the latest version of the “Tool for the demonstration and assessment of additionality” agreed by the Executive Board, taking into account similarity of approaches used to determine baseline scenario and additionality. Consistency shall be ensured between the identification of baseline scenario and the additionality demonstration. The baseline scenario alternative selected in the previous section shall be used as an alternative when applying the “Tool for the demonstration and assessment of additionality”. In case of a re-assessment of the baseline scenario as a consequence of new NOX regulations over the course of the crediting period of the proposed project activity, the re-assessment of baseline scenario shall be undertaken using the same procedure indicated above. In such a case, the additionality of the project must also be re-demonstrated.

UNFCCC/CCNUCC CDM – Executive Board AM0021 / Version 03 Sectoral Scope: 05 EB 45
8/23
Baseline Emissions Baseline emissions of year y (measured in t CO2 eq.) are estimated for: (i) the Nitrous oxide destroyed in the project activity, which in the absence of project activity would have been released into the atmosphere; and (ii) steam generated in the project activity using waste heat of N2O destruction process, which in absence of the project activity would have been generated using fossil fuels. The Nitrous oxide eligible for crediting should be adjusted both for any increase in production over the crediting period and implementation of regulations on N2O emissions. The following equation estimates the baseline emissions:
ySteam,CO2,yp,N2OyN2Oy EF Q_Steam GWP ,Q BE ×+×= (1) Where: QN2O,y = Quantity of N2O destructed by the N2O destruction facility in the year y GWPN2O = Global warming potential of N2O, 310 Q_Steamp,y = Quantity of steam generated by the N2O destruction facility in the year y, which in
absence of the project activity would have been generated using fossil fuels EFCO2,Steam,y = CO2 emission factor of steam To determine the quantity of N2O destructed (QN2O,y) by the N2O destruction facility the minimum of the following two options shall be adopted. Option A: Based on the consumption of HNO3
yBl,O,2NyAdOH,yN2O, EF P Q ×= (2) Where: PAdOH,y = Total amount of adipic acid produced credited for emission reduction in year y
(tonnes) EFN2O,Bl,y = N2O emissions factor for adipic acid production (tN2O/t adipic acid). This is
estimated as lower of the two: estimated as per Equation 4 below; and 0.27 t N2O per tonne of adipic acid produced as specified by the IPCC Good Practice Guidance
Procedure for estimating PAdOH,y To exclude possible increase in production of adipic acid during the crediting period and to avoid claiming of emission reductions from the increased capacity, the PAdOH,y is capped to the highest value of historical production data during 3 years prior to the implementation of the project activity and the quantity of N2O estimated or measured shall be adjusted accordingly.
},{ minimum ,,,, blAdOHyprAdOHyAdOH PPP = (3) Where: PAdOH,pr,y = Is the total amount of adipic acid produced in year y (tonnes) PAdOH,BL = Is the maximum value of total amount of adipic acid produced in most recent 3 years
before the implementation of the project activity (tonnes)

UNFCCC/CCNUCC CDM – Executive Board AM0021 / Version 03 Sectoral Scope: 05 EB 45
9/23
Procedure for estimating N2O emission factor EFN2O,Bl,y is estimated based on HNO3 consumption and the assumption that by-products from nitric acid consumption are N2O and N2 that are released with the reaction off-gases, as below:
44 R 263 *
PQ
EF yN2,-N2O,AdOH
cheml HNO3,yBl,N2O, ××=
y
(4)
Where: QHNO3,cheml. = Total chemical consumption of HNO3, which is defined as total HNO3 consumed less
physical losses, as estimated using Equation 5 below RN2O-N2,y = The ratio of N2O to N2 decomposed from the process for the year y Project Participants may choose a conservative value for the ratio of N2O to N2 depending on the feedstock. To obtain a conservative value for RN2O-N2,y the following method shall be used:
• Establish a table of RN2O-N2 in relation to the key factors such as ratio of cyclohexanone and cyclohexanol, drawing upon industry-approved or peer reviewed scientific information or validated in-house data, taking into account uncertainty;
• Establish a ceiling value of RN2O-N2 (RN2O-N2,max), based on the lowest annual average of the key factors affecting RN2O-N2 during the past three years;
• Establish an estimate of RN2O-N2 realtime (RN2O-N2,y), based on the key figures obtained during the implementation of project. RN2O-N2,y should not exceed RN2O-N2,max.
Total chemical consumption of HNO3 shall be determined as follows:
)( ,,,,3,,3,,03,,3,3 yoffgasesNOXyAdOHHNOypbyHNOywwHNyconsHNOChemlHNO QQQQQQ +++−= − (5)
Where: QHNO3,cheml. = Total chemical consumption of HNO3 QHNO3,cons,y = Consumption of HNO3 in year y (tonnes) QHNO3,ww,y = Quantity of nitrate in the waste water (tonnes). This is measured as product of nitrate
concentration in waste water and waste water flow, measured on a daily basis QHNO3,by-p,y = Quantity of nitrate in the by-products (tonnes). This is measured as product of nitrate
concentration in by-products and by-products, measured on a regular interval QHNO3,AdOH,
y = Quantity of nitrate in the adipic acid produced (tonnes). This is measured as product
of nitrate concentration in adipic acid and adipic acid production, measured on a regular interval
QHNO3,offgass
es,y = Quantity of nitrogen content in form NOX in the flue gases (tonnes). This is measured
as product of NOX concentration in flue gases, quantity of flue gases and appropriate conversion factor from N in NOX to N in HNO3. The NOX measurement should be taken at a daily frequency

UNFCCC/CCNUCC CDM – Executive Board AM0021 / Version 03 Sectoral Scope: 05 EB 45
10/23
Option B: Direct measurement of the quantity of N2O entering the destruction facility The actual quantity of N2O fed to the destruction facility shall be continuously monitored ex post during the crediting period. The measuring equipment shall be installed at the inlet of the N2O destruction facility. The measured value of N2O shall be adjusted for 5% uncertainty in measurements as follows:
f95.0QQ y,m,O2Ny,O2N ××= (6) Where: QN2O,y = The quantity of N2O destructed during the year y in tonnes QN2O,m,y = Measured value of the quantity of N2O fed to the destruction facility in tonnes f = Correction factor for adipic acid production in year y
yAdOH
yAdOH
PP
fPr,,
,= (7)
Where, PAdOH,y and PAdOF,Pr,y are defined in Equation 3 above. Procedure for Monitoring of N2O (QN2O,m,y) To monitor the actual quantity of N2O fed to the decomposition facility, N2O concentration and gas volume flow are to be monitored on the same basis i.e. wet or dry. The monitoring system is to be installed using the European Norm 14181. This monitoring system provides separate readings for N2O concentration and gas flow volume for a defined period of time (e.g. every hour of operation, it provides an average of the measured values for the previous 60 minutes). Error readings (e.g. downtime or malfunction) and extreme values are to be automatically eliminated from the output data series by the monitoring system. Measurement results can be distorted before and after periods of downtime or malfunction of the monitoring system and can lead to mavericks. To eliminate such extremes and to ensure a conservative approach, the following statistical evaluation is to be applied to the complete data series of N2O concentration as well as to the data series for gas volume flow. The statistical procedure will be applied to data obtained after eliminating data measured for periods where the plant operated outside the plant’s normal operating parameters:
(a) Calculate the sample mean (x); (b) Calculate the sample standard deviation (s); (c) Calculate the 95% confidence interval (equal to 1.96 times the standard deviation); (d) Eliminate all data that lie outside the 95% confidence interval; (e) Calculate the new sample mean from the remaining values (volume of gas (VSG) and N2O
concentration of gas (NCG)). The average mass of N2O emissions per hour is estimated as product of the NCG and VSG. Total annual quantity of N2O can be determined as follows:
yhh
hymON hVSGNCGQ ××= ∑,,2 (8)

UNFCCC/CCNUCC CDM – Executive Board AM0021 / Version 03 Sectoral Scope: 05 EB 45
11/23
Where: NCGh = The N2O concentration at the inlet of the destruction facility during the hour h
(ton N2O/m3)3 VSGh = The volume of gas flow at the inlet of the destruction facility during the hour h (m3) hy = The number of hours of operation in a year y The above procedure shall be followed also for measuring the amount of N2O that may be released to the atmosphere (QN2O, by-pass,y ) and the amount of N2O in exhaust of decomposition facility (QND_N2O ,y), as defined in Equation 10 in project emission section. Procedure for adjusting baseline N2O emissions for regulations The quantity of N2O determined shall be adjusted for mandatory regulations if exist/introduced in the Host country during the crediting period as follows: If the regulation is based on the absolute quantity of N2O emission permitted:
}Q ,{Q of minimum Q N2OregyN2O,yN2O, = (9)
Where, QN2O,reg is absolute quantity of N2O emission restriction and QN2O,y is minimum of the two values estimated based on Option A and Option B described above. If the regulation is an N2O emissions rate:
},{minimum ,2,,2,2 regONyAdOHyONyON EFxPQQ = (10)
Where, EFN2O,reg is the emission rate limit set by regulation, QN2O,y is minimum of the two values estimated based on Option A and Option B described above, and PAdOH,y is estimated using equation 3. If the regulation is expressed as the share (ry) of the N2O in the waste stream required to be destroyed:
)r1(QQ yy,O2Ny,O2N −= (11)
Where QN2O,y is minimum of the two values estimated based on Option A and Option B described above.
3 VCGh and NCGh should be measured simultaneously, at same basis (wet or dry) and values should be expressed on
the same basis (wet or dry) and should be corrected to normal conditions (101.325 kPa, 0 deg C). If the instrument (or measurement system) uses an algorithm to convert actual conditions to normal conditions, the proper source of such an algorithm should be used (e.g. based on procedures of EN14181). For all the cases, either manual or algorithm-based conversion of actual conditions to normal conditions, the temperature and pressure of actual conditions of gas should be recorded.

UNFCCC/CCNUCC CDM – Executive Board AM0021 / Version 03 Sectoral Scope: 05 EB 45
12/23
Project emissions The emissions due to project activity in a year y (PEy) are determined as:
yHCEyNHyECyjFC PEPEPEPEP ,,3,,,yN2O,y E PE ++++= (12) Where: PEN2O,y = Project N2O emissions in year y PEFC,j,y = Project emissions from consumption of fossil fuel in the decomposition facility in year y.
This includes hydro carbons used directly in the decomposition facility as well as fossil fuel used for generating steam or other form of energy that is used by the decomposition unit. Use the “Tool to calculate project or leakage CO2 emissions from fossil fuel combustion” to estimate this source of project emissions, where j are the process where fossil fuel is used in the decomposition process
PEEC,y = Project emissions from consumption of electricity in the decomposition facility in year y. Use the “Tool to calculate baseline, project and/or leakage emissions from electricity consumption” to estimate this source of project emissions
PENH3,y = Project emissions from use of Ammonia in DeNOx facility in year y PEHCE,y = Project emissions from use of hydro carbons in decomposition facility in year y
GWP )Q (Q PE N2OyND_N2O,ypass,-byN2O,yN2O, ×+= (13)
Where: QN2O, by-
pass,y
= Project N2O emissions from N2O that is not sent to the decomposition facility in year y
QND_N2O ,y = Project N2O emissions from N2O released in effluent gases of decomposition facility in year y
C Q Q yN2O_GE,yGE,yND_N2O, ×= (14)
Where: QGE,y = The mass of effluent gas from decomposition facility (tonnes), in the year y CN2O_GE,y = The concentration of N2O in effluent gas from decomposition facility
(tonnes N2O/tonne effluent gas) in year y QN2O,bypass,y shall be directly monitored ex post during the crediting period. Otherwise project participants may monitor the time of opening the bypass line to enable gas venting into the atmosphere and account the bypass quantity as follows:
y,openym,2O,Nypass,-byN2O, T Q Q ×= (15) Where: QN2O,m,y = Measured value of the quantity of N2O fed to the destruction facility in tonnes in year y Topen,y = % of time the valve on the line feeding the decomposition facility is open in year y to
release the gas directly into the atmosphere

UNFCCC/CCNUCC CDM – Executive Board AM0021 / Version 03 Sectoral Scope: 05 EB 45
13/23
PENH3: Ammonia input to the destruction facility:
• In case a SCR DeNOx unit is already installed prior to the starting date of the project activity or has to be installed according to legal requirements, the project ammonia input will be considered equal to the ammonia input of the baseline scenario;
• Should no SCR DeNOx unit be installed prior to the starting date of the project activity, project emissions related to the production of ammonia are considered as follows:
EF Q PE NH3yNH3,yNH3, ×= (16)
Where: PENH3,y = Project emissions related to ammonia input to destruction facility in year y (tCO2e) QNH3,y = Ammonia input to the destruction facility in year y (tNH3) EFNH3 = GHG emissions factor for ammonia production (CO2e/tNH3), a default factor of 2.14
tCO2e/tNH3 is suggested (GEMIS 4.2) Project emissions are limited to the existing production capacity (maximum of 3 years historical production data prior to the implementation of the project activity) of the existing adipic acid production plant. If the actual production (PAdOH,y) exceeds the existing capacity then emissions related to the production above existing capacity will neither be claimed for the baseline nor for the project scenario. Leakage Leak emissions comprise the emissions associated with the energy sources used to generate any steam used by the decomposition plant, where the steam is produced outside the project boundary. When the steam is produced within the project boundary, these emissions are captured as project emissions from consumption of fossil fuels. Leakage amounts to:
yc,St,yc,St,y EF Q L ×= (17) Where: QSt,c,y = The steam consumption of the facility (TJ) ESt,c,y = The CO2 emission factor of the steam generation, tCO2/TJ and is taken as the emission
factor of the plant from which the steam is purchased Emission Reductions The greenhouse gas emission reduction (ERy) achieved by the project activity in a year y is the baseline emissions of the adipic acid plant less the greenhouse gas emissions generated by the decomposition process (PEy) less leakage due to the decomposition process (Ly). ERy = BEy - PEy - Ly (18)

UNFCCC/CCNUCC CDM – Executive Board AM0021 / Version 03 Sectoral Scope: 05 EB 45
14/23
Changes required for methodology implementation in 2nd and 3rd crediting periods
• If new or modified NOX emission regulations are introduced after the project start, determination of the baseline scenario will be re-assessed at the renewal of the crediting period.
For the determination of the adjusted baseline scenario the project participant should re-assess the baseline scenario and shall apply baseline determination process as stipulated above (Steps 1 – 4).
Potential outcomes of the re-assessment of the Baseline Scenario (to be in line with NOX regulation)
Consequence (adjusted baseline scenario)
SCR De NOX installation Continuation of original (N2O) baseline scenario NSCR De NOX installation The N2O emissions outlet of NSCR become adjusted
baseline N2O emissions, as NSCR may reduce N2O emissions as well as NOX
Tertiary measure that combines NOX and N2O emission reduction
Adjusted baseline scenario results in zero N2O emissions reduction
Continuation of original baseline scenario
Continuation of original baseline scenario
Data and parameters not monitored Data / parameter: GWPN2O Data unit: tCO2e/tN2O Description: Global warming potential of the N2O during the crediting period Source of data: IPCC Measurement procedures (if any):
Any comment: Default value 310, to be checked at the renewal of crediting period Data / parameter: EFNH3 Data unit: Tonnes N2O/tonnes NH3 Description: Emmission factor of N2O per per tonne of NH3 used Source of data: GEMIS 4.2 Measurement procedures (if any):
Any comment: Default value 2.14

UNFCCC/CCNUCC CDM – Executive Board AM0021 / Version 03 Sectoral Scope: 05 EB 45
15/23
Data / parameter: PAdOH,BL Data unit: Tonnes of AdOH Description: Maximum value of total amount of adipic acid produced in most recent 3 years
before the implementation of the project activity Source of data: Measured Measurement procedures (if any):
Any comment: For the cases, where adipic acid production cannot be measured directly, refer to the procedure under Annex 1 on “Procedure to estimate adipic acid production in cases it cannot be measured directly” .
Data / parameter: NCGh Data unit: ton N2O/m3
at normal conditions
Description: N2O concentration at the inlet of the destruction facility during the hour h Source of data: Measured Measurement procedures (if any):
Monitoring frequency: Continuous QA/QC procedures: Metering instruments shall be calibrated regularly to industry standards Any comment: Records to be maintained during project’s lifetime Data / parameter: VSGh at normal conditions Data unit: m3 Description: Volume of gas flow at the inlet of the destruction facility during the hour h Source of data: Measured Measurement procedures (if any):
Monitoring frequency: Continuous QA/QC procedures: Metering instruments shall be calibrated regularly to industry standards Any comment: Records to be maintained during project’s lifetime Data / parameter: hy Data unit: - Description: Number of hours of operation in a year y Source of data: Measured Measurement procedures (if any):
Monitoring frequency: Monthly QA/QC procedures: Any comment: Records to be maintained during project’s lifetime

UNFCCC/CCNUCC CDM – Executive Board AM0021 / Version 03 Sectoral Scope: 05 EB 45
16/23
Data / parameter: PAdOH,pr,y Data unit: Tonnes of AdOH Description: Quantity of Adipic acid produced during the year y Source of data: Measured Measurement procedures (if any):
Monitoring frequency: Monthly QA/QC procedures: Metering instruments shall be calibrated regularly to industry standards Any comment: Records to be maintained during project’s lifetime. For the cases, where adipic
acid production cannot be measured directly, refer to the procedure under Annex-1 on “Procedure to estimate adipic acid production in cases it cannot be measured directly” .
Data / parameter: QHNO3,cons,y Data unit: Tonnes Description: Quantity of HNO3 consumption during the year y Source of data: Measured Measurement procedures (if any):
Monitoring frequency: Monthly QA/QC procedures: Metering instruments shall be calibrated regularly to industry standards Any comment: Records to be maintained during project’s lifetime Data / parameter: QHNO3,ww,y Data unit: Tonnes Description: Quantity of HNO3 loss in waste water during the year y Source of data: Measured Measurement procedures (if any):
This is measured as product of nitrate concentration in waste water and waste water flow
Monitoring frequency: Daily QA/QC procedures: Metering instruments shall be calibrated regularly to industry standards Any comment: Records to be maintained during project’s lifetime Data / parameter: QHNO3,by-p,y Data unit: Tonnes Description: Quantity of HNO3 in byproducts, during the year y Source of data: Measured Measurement procedures (if any):
Monitoring frequency: Monthly QA/QC procedures: Metering instruments shall be calibrated regularly to industry standards Any comment: Records to be maintained during project’s lifetime

UNFCCC/CCNUCC CDM – Executive Board AM0021 / Version 03 Sectoral Scope: 05 EB 45
17/23
Data / parameter: QHNO3,AdOH,y Data unit: Tonnes Description: Quantity of HNO3 in adipic acid produced during the year y Source of data: Measured Measurement procedures (if any):
This is measured as product of nitrate concentration in adipic acid and adipic acid produced.
Monitoring frequency: Monthly QA/QC procedures: Measuring instruments shall be calibrated regularly to industry standards Any comment: Records to be maintained during project’s lifetime Data / parameter: QNOx,offgases,y Data unit: Tonnes Description: Quantity of nitrogen content in off gases during the year y Source of data: Measured Measurement procedures (if any):
This is measured as product of NOX concentration in flue gases, flow of gas, appropriate conversion factor from N in NOX to N in HNO3.
Monitoring frequency: Daily QA/QC procedures: Measuring instruments shall be calibrated regularly to industry standards Any comment: Records to be maintained during project’s lifetime Data / parameter: RN2O-N2,y Data unit: Description: Ratio of N2O to N2 Source of data: Measured/Calculated Measurement procedures (if any):
To obtain figures for RN2O-N2,y the following methods must be selected: ・ Establish a table of RN2O-N2 in relation to the key factors such as ratio of
cyclohexanone and cyclohexanol, drawing upon industry-approved or peer reviewed scientific information or validated in-house data, taking into account uncertainty;
・ Establish a ceiling value of RN2O-N2 (RN2O-N2,max), based on the lowest annual average of the key factors affecting RN2O-N2 during the past three years’;
・ Establish an estimate of RN2O-N2 realtime (RN2O-N2,y), based on the key figures obtained during the implementation of project. RN2O-N2,y should not exceed RN2O-N2,max.
Monitoring frequency: Daily QA/QC procedures: Measuring instruments shall be calibrated regularly to industry standards Any comment: Records to be maintained during project’s lifetime Data / parameter: QN2O,reg Data unit: Tonnes Description: Quantity of N2O allowed under regulations Source of data: Regulation Measurement procedures (if any):
Depends on regulation.
Monitoring frequency: At date of introduction or change of regulation QA/QC procedures: Any comment: Records to be maintained during project’s lifetime

UNFCCC/CCNUCC CDM – Executive Board AM0021 / Version 03 Sectoral Scope: 05 EB 45
18/23
Data / parameter: EFN2O,reg Data unit: Tonnes N2O/tones AdOH Description: Quantity of N2O allowed under regulations per tonne of AdOH produced Source of data: Regulation Measurement procedures (if any):
Depends on regulation.
Monitoring frequency: At date of introduction or change of regulation QA/QC procedures: Any comment: Records to be maintained during project’s lifetime Data / parameter: ry Data unit: Description: % of N2O allowed under regulations Source of data: Regulation Measurement procedures (if any):
Depends on regulation.
Monitoring frequency: At date of introduction or change of regulation QA/QC procedures: Any comment: Records to be maintained during project’s lifetime Data / parameter: Q_Steam_p,y Data unit: TJ/hr. Description: Steam production by the decomposition process Source of data: Measured Measurement procedures (if any):
Measured as energy value by means of pressure, temperature and flow of steam
Monitoring frequency: Continuous QA/QC procedures: Shall be measured using steam flow meter Any comment: Records to be maintained during project’s lifetime Data / parameter: EFCO2,Steam,y Data unit: tCO/t-steam Description: CO2 intensity for steam4 Source of data: Calculated Measurement procedures (if any):
Monitoring frequency: Yearly QA/QC procedures: Any comment: Records to be maintained during project’s lifetime
4 This CO2 intensity is related to the steam produced by the existing supplier and that will be produced by the project.

UNFCCC/CCNUCC CDM – Executive Board AM0021 / Version 03 Sectoral Scope: 05 EB 45
19/23
Data / parameter: QSt_c,y Data unit: TJ/hr. Description: Steam consumption by the decomposition process Source of data: Measured Measurement procedures (if any):
Measured as energy value by means of pressure, temperature and flow of steam
Monitoring frequency: Continuous QA/QC procedures: Shall be measured using steam flow meter Any comment: This parameter is applicable only when the destruction facility uses steam
supplied by others. Records to be maintained during project’s lifetime Data / parameter: EFSt,c,y Data unit: tCO2/t-steam Description: CO2 intensity for steam5 Source of data: Calculated Measurement procedures (if any):
Calculated from the steam supplier data
Monitoring frequency: Yearly QA/QC procedures: Any comment: Records to be maintained during project’s lifetime Data / parameter: QN2O,bypass,y Data unit: Tonnes of N2O Description: Quantity of N2O bypassed during the year y Source of data: Measured Measurement procedures (if any):
To monitor the actual quantity of N2O, both N2O concentration and gas volume flow are to be measured. The product of N2O concentration and flow is the actual N2O fed to the decomposition facility. The monitoring system shall comply with the European Norm 14181. Further details are provided in the baseline methodology procedure.
Monitoring frequency: Continuous QA/QC procedures: Metering instruments shall be calibrated regularly to industry standards Any comment: Records to be maintained during project’s lifetime Data / parameter: QGE,y Data unit: Tonnes Description: Quantity of effluent gas generated during the year y Source of data: Measured Measurement procedures (if any):
Monitoring frequency: Continuous QA/QC procedures: Metering instruments shall be calibrated regularly to industry standards Any comment: Records to be maintained during project’s lifetime. The monitoring system shall
comply with the European Norm 14181. Further details are provided in the baseline methodology procedure.
5 This CO2 intensity is related to the steam produced by the existing supplier and that will be produced by the project.

UNFCCC/CCNUCC CDM – Executive Board AM0021 / Version 03 Sectoral Scope: 05 EB 45
20/23
Data / parameter: CN2O,GE,y Data unit: Tonnes of N2O/tonne of effluent gas Description: N2O concentration in the effluent gas Source of data: Measured Measurement procedures (if any):
Monitoring frequency: Monthly QA/QC procedures: Metering instruments shall be calibrated regularly to industry standards Any comment: Records to be maintained during project’s lifetime. The monitoring system shall
comply with the European Norm 14181. Further details are provided in the baseline methodology procedure.
Data / parameter: TOpen,y Data unit: % Description: % of time the valve on the line feeding the decomposition facility is open in year
y Source of data: Measured Measurement procedures (if any):
Measured as a percentage by monitoring the period of opened condition and the total operating hours of the production facility
Monitoring frequency: Yearly QA/QC procedures: Metering instruments shall be calibrated regularly to industry standards Any comment: Records to be maintained during project’s lifetime. This parameter is used when
QN2O,bypass,y is not directly monitored Data / parameter: PEFC,j,y Data unit: tCO2e Description: Project emissions from consumption of fossil fuel in the decomposition facility in
year y Source of data: Calculated as per the “Tool to calculate project or leakage CO2 emissions from
fossil fuel combustion” Measurement procedures (if any):
As per the “Tool to calculate project or leakage CO2 emissions from fossil fuel combustion”
Monitoring frequency: As per the “Tool to calculate project or leakage CO2 emissions from fossil fuel combustion”
QA/QC procedures: As per the “Tool to calculate project or leakage CO2 emissions from fossil fuel combustion”
Any comment: -

UNFCCC/CCNUCC CDM – Executive Board AM0021 / Version 03 Sectoral Scope: 05 EB 45
21/23
Data / parameter: PEEC,y. Data unit: tCO2 Description: Project emissions from consumption of electricity in the decomposition facility in
year y Source of data: Calculated as per the “Tool to calculate baseline, project and/or leakage
emissions from electricity consumption” Measurement procedures (if any):
As per the “Tool to calculate baseline, project and/or leakage emissions from electricity consumption”
Monitoring frequency: As per the “Tool to calculate baseline, project and/or leakage emissions from electricity consumption”
QA/QC procedures: As per the “Tool to calculate baseline, project and/or leakage emissions from electricity consumption”
Any comment: - Data / parameter: QNH3,y Data unit: tNH3 Description: Ammonia input to the destruction facility in year y Source of data: Measured Measurement procedures (if any):
Monitoring frequency: Continuous QA/QC procedures: Metering instruments shall be calibrated regularly to industry standards Any comment: Records to be maintained during project’s lifetime
- - - - -

UNFCCC/CCNUCC CDM – Executive Board AM0021 / Version 03 Sectoral Scope: 05 EB 45
22/23
Annex 1
Procedure to estimate adipic acid production in cases it cannot be measured directly6 In order to apply this procedure to their project activity, the project proponents are required to demonstrate the following.
• It should be demonstrated that direct measurement of adipic acid is not possible due to factors such as facility design; and
• It should be demonstrated that it is not possible to consume adipic acid sourced from outside in the production process concerned, for the purpose of producing derivatives of adipic acid.
For facilities where production of adipic acid (PAdOH) cannot be obtained by measurement as specified in this methodology, it can be estimated through a stoichiometric calculation from derivative of AdOH, through the following equation;. PAdOH, = (146.14/MWx) * Px, Where: Px, = Total amount of derivative of AdOH (substance x) produced credited for emission
reduction in year y (tonnes) MWx = Molecular weight of substance x which is the derivative of adipic acid (AdOH)
(g/mole) 146.14 = Molecular weight of adipic acid. An example of substance eligible for substance x is AHS, then MWx is 262.14: In the case of nylon 66 salt (AHS) production, its quantity is estimated as the product of nylon 66 salt concentration in aqueous solution of nylon 66 salt and mass of aqueous solution of nylon 66 salt production). Further revision from the methodology AM0021 may be proposed for the production of other substances (e.g. finished product of nylon 66), in case this guidance cannot be applied to the production of these substances.
6 There is a separate EB guidance “Guidance to estimate adipic acid production in cases where it cannot be measured directly” which makes this procedure applicable to all the versions of AM0021.

UNFCCC/CCNUCC CDM – Executive Board AM0021 / Version 03 Sectoral Scope: 05 EB 45
23/23
History of the document Version Date Nature of revision(s) 03 EB 45, Annex #
13 February 2009 Revision includes the procedure in Annex 1 to estimate the adipic acid production in cases it cannot be measured directly.
02.2 EB 41, Annex 7 02 August 2008
Editorial revision to add footnote 3 to clarify that volume of gas and N2O concentration should be measured simultaneously and at same basis (wet or dry) and should be expressed at the normal conditions. The clarification made in the monitoring tables of these parameters also.
02.1 EB 39, Paragraph 22 16 May 2008
“Tool to calculate baseline, project and/or leakage emissions from electricity consumption” replaces the withdrawn “Tool to calculate project emissions from electricity consumption”.
02 EB 36, Annex 8 30 November 2007
Revision to include the following • Clear procedures for the identification of the baseline scenario; • Clearer procedures for estimating the baseline N2O emission using
equations; • A requirement to measure the N2O emissions before the destruction unit to
estimate the baseline N2O emissions; • Further clarity in the monitoring requirements.
01 EB 18, Annex 2 25 February 2005
Initial adoption.


![Chapter 246-215 WAC FOOD SERVICE RULE REVISION DRAFT …...WAC 246‐215 Rule Revision Draft for Comment [ 1 ] 12‐31‐19](https://img.dokumen.tips/doc/110x75/5e91ea25c5c6d758ac6cfecc/chapter-246-215-wac-food-service-rule-revision-draft-wac-246a215-rule-revision.jpg)