Embed Size (px)
Citation preview

1
Supplementary information 1
Underwater contact adhesion and microarchitecture in 2
polyelectrolyte complexes actuated by solvent exchange 3
Qiang Zhao1†, Dong Woog Lee2†, B. Kollbe Ahn3†, Sungbaek Seo3, Yair Kaufman2, Jacob N. 4
Israelachvili2 and J. Herbert Waite4* 5
1. Materials Research Laboratory, University of California, Santa Barbara, California 93106, USA. 6
2. Chemical Engineering, University of California, Santa Barbara, California 93106, USA. 7
3. Marine Science Institute, University of California, Santa Barbara, California 93106, USA. 8
4. Molecular, Cellular and Developmental Biology, University of California, Santa Barbara, California 9
93106, USA. 10
11
1. Chemicals 12
tert-Butyl acrylate, hydroquinone, acrylic acid, glycidyltrimethylammonium chloride 13
(GTMAC), bis(trifluoromethane)sulfonimide lithium (LiTf2N), chitosan and 14
azobisisobutyronitrile (AIBN) were purchased from Sigma-Aldrich. Eugenol, triethylsilane 15
(TES), tris(pentafluorophenyl)borane (TPFPB), 3-chloroperoxybenzoic acid (mCPBA) and 16
AMC-2TM were obtained from Spectrum, Oakwood, Gelest, Acros organics and AMPAC 17
Fine Chemical, respectively. All glassware was pre-dried in an oven at 150 oC for 30 min. 18
Biotage IsoleraTM Prime is used for automatic flash column purification. 19
2. Co-polymers synthesis 20
2.1. Synthesis and characterization of poly(acrylic acid) functionalized with catechol 21
groups (PAAcat) (Supplementary Fig. 1 - Fig. 4). 22
The synthesis of poly(acrylic acid) copolymer functionalized with catechols (PAAcat) 23
involved the synthesis of monomers (Supplementary Fig. 1a) and its copolymerization 24
(Supplementary Fig. 1b). The experimental details were given below according to our 25
previous publication [S1]. 26
Underwater contact adhesion andmicroarchitecture in polyelectrolyte complexes
actuated by solvent exchange
SUPPLEMENTARY INFORMATIONDOI: 10.1038/NMAT4539
NATURE MATERIALS | www.nature.com/naturematerials 1
© 2016 Macmillan Publishers Limited. All rights reserved.

2
1
Supplementary Fig. 1. (a) Synthesis scheme of monomers: triethylsilane-protected eugenol 2
(1), triethylsilane-protected eugenol epoxide (2), and triethylsilane-protected eugenol acrylate 3
(3); (b) polymerization of monomer (3) with tert-Butyl acrylate (4). 4
Triethylsilane-protected eugenol (1). Eugenol (5.15 ml, 33.49 mmol, 1.0 equiv) and 5
triethylsilane (11.8 ml, 73.69 mmol, 2.2 equiv) were agitated in a 1000 ml round bottom flask 6
at room temperature for 2 min. Subsequently, tris(pentafluorophenyl)borane (38 mg, 74 μmol, 7
0.0022 equiv) was added into the reaction mixture. After 30 min of reaction, extra 8
triethylsilane (3 ml) and tris(pentafluorophenyl)borane (20 mg) were added into the reaction 9
mixture. The reaction was then continued for 3 hours. The reaction mixture was passed 10
through neutral alumina with hexane as an eluent. Hexane and excess of triethylsilane were 11
removed with a rotary evaporator, and the product dried under vacuum. Triethylsilane-12
protected eugenol (12.5 g, 99 %) was obtained without further purification. 13
1H NMR (600 MHz, CDCl3): = 6.72 (d, 1H, Ar-H), 6.63 (s, 1H, Ar-H), 6.59 (d, 1H, Ar-H), 14
5.98 (m, 1H, -CH=CH2), 5.02 (m, 2H, -CH=CH2), 3.24 (d, 2H, -CH2-CH=CH2), 0.98 (t, 18H, 15
-Si-CH2-CH3), 0.73 (q, 12H, -Si-CH2-CH3). 16
Triethylsilane-protected eugenol epoxide (2). mCPBA (17 g, 99.02 mmol, 3.0 equiv) was 17
added to a stirred solution of 1 (12.5 g, 33.01 mmol, 1.0 equiv) in 400 ml dichloromethane at 18
0 oC. After 5 min, the ice bath was removed and the reaction continued overnight. 19
Subsequently, the crude material was filtered through a fritted funnel with hexane as an 20
eluent. After repeated purification by Biotage IsoleraTM Prime automatic column 21
SiSi
Si
© 2016 Macmillan Publishers Limited. All rights reserved.

3
chromatography (Biotage SNAP 340g silica column; hexane/diethyl ether 100 : 0 to 94 : 6 1
gradient; flow rate 100 ml/min), 10 g (77 % yield) of a clear oil was obtained. 2
1H NMR (600 MHz, CDCl3): = 6.73 (d, 1H, Ar-H), 6.70 (d, 1H, Ar-H), 6.65 (q, 1H, Ar-H), 3
3.08 (m, 1H, -CH2CH-O-CH2), 2.81 (q, 1H, -CH2CH-O-CH2), 2.77 (t, 1H, -CH2CH-O-CH2), 4
2.67 (q, 1H, -CH2CH-O-CH2), 2.49 (q, 1H, -CH2CH-O-CH2), 0.96 (t, 18H, -Si-CH2CH3), 5
0.73 (q, 12H, -Si-CH2CH3). EI-MS, m/z = 417.22 [M+Na+] 6
Triethylsilane-protected eugenol acrylate (3). Triethylsilane-protected eugenol epoxide 2 7
(10 g, 25.34 mmol, 1.0 equiv) was agitated with hydroquinone (84 mg, 0.76 mmol, 0.03 8
equiv), acrylic acid (2.78 ml, 40.54 mmol, 1.6 equiv) and AMC-2 (291 µl, 0.76 mmol, 0.03 9
equiv) at 90 °C for 1 hour. The crude material was dissolved in 150 ml diethyl ether, and the 10
solution washed with saturated aq. sodium bicarbonate solution until a neutral pH was 11
reached. After purification by Biotage IsoleraTM Prime automatic column chromatography 12
(Biotage SNAP 50g silica column; hexane/diethyl ether 100 : 0 to 67 : 33 gradient; flow rate 13
40 ml/min), 5.9 g (50 % yield) of a clear oil was obtained. 14
1H NMR (600 MHz, CDCl3): = 6.74 (d, 1H, Ar-H), 6.67 (d, 1H, Ar-H), 6.63 (q, 1H, Ar-H), 15
6.45 (q, 1H, -CH2CH=CH2), 6.16 (d, 1H, -CH2CH=CH2), 5.86 (d, 1H, -CH2CH=CH2), 4.21 16
(q, 1H, -CH(OH)CH2OOC-), 4.07 (q, 2H, -CH(OH)CH2OOC-), 2.70 (m, 2H, -CH2CH(OH)-), 17
2.20(d, 1H, -CH(OH)-), 0.96 (t, 18H, -Si-CH2CH3), 0.73 (q, 12H, -Si-CH2CH3). EI-MS, m/z 18
= 489.24 [M+Na+] 19
Triethylsilane-protected eugenol acrylate (3) was used for polymer synthesis without further 20
purification. tert-Butyl acrylate (4) was filtered through basic alumina column to remove 21
hydroquinone (polymerization inhibitor). AIBN was purified byrecrystallization in methanol. 22
Synthesis of copolymer (P1) 23
Triethylsilane-protected eugenol acrylate(3) (1050 mg, 2.25 mmol, 0.30 equiv) and tert-24
butyl acrylate (4) (769 µl, 5.25 mmol, 0.70 equiv) and AIBN (12 mg, 0.075 mmol, 0.01 equiv) 25
were dissolved separately in degassed toluene (8.5 ml) in a 20 ml vial under argon (30 mol%). 26
Catechol contents were reduced to 20 mol% and 10 mol% by changing the molar ratio 27
between 3 and 4. The solutions were added into 350 ml Schlenk flask, and stirred at room 28
temperature for 1 minute, to obtain homogenous solution. After three repeats of the degassing 29
procedure (freeze-vacuum-thaw-argon purging), the reaction mixture was agitated for 12 h at 30
80 oC. Subsequently, toluene was removed by using a rotavap, the crude product was 31
© 2016 Macmillan Publishers Limited. All rights reserved.

4
dissolved in tetrahydrofuran (5 ml), and purified by two repeats of precipitation in methanol 1
(50 ml) at 4 oC using centrifuge at 10,000 rpm for 30 min. The copolymer was obtained as 2
clear viscous liquid in ~50 % yield. The molar ratio between triethylsilane-protected eugenol 3
acrylate and tert-butyl acrylate was about 30 : 67, calculated by 1H NMR integration of 4
aromatic proton chemical shifts (a, 3H) at 6.50-6.75 ppm and methyl proton chemical shifts 5
(f, 9H) at 1.25-1.75 ppm(Supplementary Fig. 2). The number average molecular weight (Mn) 6
of the copolymer was 1,261 Da, and its PDI was 1.16 (Supplementary Fig. 3). 7
8
Supplementary Fig. 2. 1H NMR spectrum of P1 copolymer in CDCl3. 9
10
Supplementary Fig. 3. GPC curve of P1 copolymer. 11
Cleavages of silyl-protecting and tert-butyl groups in the copolymer (P2). 12
The copolymer (2 g) was dissolved in 1,4-dioxane (80 ml). Subsequently, hydrochloric 13
acid (37 %, 8 ml) was added to a flask equipped with a reflux condenser, and agitated for 6 h 14
at 80 oC. After the reaction, the solvent was removed using a rotary evaporator. The product 15
was dissolved in tetrahydrofuran (5 ml), and purified by precipitation in hexane (50 ml) at 4 16
oC using centrifuge at 10,000 rpm for 30 min. The purified polymer was obtained as slightly 17
yellowish viscous liquid in 50 % yield. The cleavages of silyl-protecting and tert-butyl 18
© 2016 Macmillan Publishers Limited. All rights reserved.

5
groups were confirmed by 1H NMR; the methyl proton chemical shifts of silyl protecting 1
group (-Si-CH2CH3) at ~1.4 ppm, the ethyl proton chemical shifts of silyl protecting group (-2
Si-CH2CH3) at ~ 0.9, and methyl proton chemical shifts of tert-butyl group (-C-CH3) at ~0.7 3
ppm were disappeared after the reaction (Supplementary Fig. 4). 4
5
Supplementary Fig. 4. 1H NMR spectrum of P2 copolymer in methanol-d4. 6
2.2. Synthesis of quaternized chitosan (QCS-Tf2N) (Supplementary Fig. 5) 7
QCST-f2N was synthesized in a two-step procedure (Supplementary Fig. 5), i.e., the 8
quaternization of chitosan (a) and subsequent counter anion exchange (b). First, Chitosan (3 g) 9
and isopropanol (115 mL) were added in a round bottled flask (250 mL), into which aqueous 10
GTMAC solution (12 g GTMAC in 40 mL water) was added. Then the reaction mixture was 11
refluxed (85 oC, 24 h). Elemental analysis show that a high degree of quaternization (i.e. 12
x/(x+y)=80%) was achieved in this step, which is supported by the fact that quanternized 13
chitosan (QCSCl) becomes soluble in water owing to the quaternization. The QCSCl 14
producte was filtrated, washed with isopropanol three times, and dried at 60 oC 24 h. Second, 15
counter anion exchange was performance to prepare QCS-Tf2N (Supplementary Fig. 5b). 16
LiTf2N (0.6 g) was dissolved in water (10 mL), which was added into aqueous QCSCl 17
solution (0.4 g QCSCl in 40 mL water) under vigourous stiring. White precipitates (QCS-18
Tf2N) were collected by filtration, washed with water, and dried (60 oC, 24 h). Owing to the 19
bulk nature of Tf2N, importantly QCS-Tf2N was rendered soluble in DMSO. This organic 20
solublity of chitosan polymer is a critica prerequisite for the implementation of the solvent-21
exchange strategy. 22
© 2016 Macmillan Publishers Limited. All rights reserved.

6
1
Supplementary Fig. 5 Synthesis of QCS-Tf2N (a) quaternization of chitosan yielding QCS-2
Cl, (b) counter anion exchange of QCS-Cl with LiTf2N. 3
3. Methods 4
3.1. Characterizations 5
The copolymer composition was determined by 1H NMR (600 MHz) analysis using 6
Varian VNMRS 600 MHz spectrometer in chloroform-d (CDCl3) or methanol-d4. The 7
number average molecular weight (Mn) and polydispersity index (PDI=Mw/Mn) of the 8
copolymers were calculated by Gel Permeation Chromatography (GPC). The eluent was 9
chloroform with 0.25 % TEA. The set-up consisted of two polystyrene gel columns (Agilent 10
PLgel 5 µm MIXED-D, 300 x 7.5 mm; flow rate 1.0 ml/min) connected to a Waters Alliance 11
HPLC System pump and a Waters 2410 Differential RI detector. Injection volume was 20 µl. 12
The columns were calibrated against ten standard polystyrene samples (Mw = 692 – 349,000). 13
3.2. Fluorescence microscope (FM) 14
An Olympus Fluoview 1000S laser scanning confocal on an inverted microscope stand was 15
used to monitor the intensity change of a polymer added with DIL dye molecule (1,1'-16
dioctadecyl-3,3,3'3'-tetramethyl indocarbocyanineperchlorate) (See below for a scheme). An 17
uncoated MatTek dish with a #1.5 thick coverglass bottom was filled with DI water. A 30x 18
silicon objective lens (NA 1.05) and the transmitted light detector were used to focus upon 19
the inner surface of the coverglass surface prior to adding the polymer. Once the polymer was 20
added to the dish, a 559 laser at 4.8% was used to excite the DIL labeled polymer and the 21
confocal PMT detector was used to monitor the intensity of the labeled polymer 22
© 2016 Macmillan Publishers Limited. All rights reserved.

7
contentiously (800x800 pixel, 2us/pixel). 1
2
Schematic illustration of the Experimental set up for Fluorescence microscope. Please 3
note: the fluorescent dye added to the polymer solution is 1,1'-dioctadecyl-3,3,3'3'-4
tetramethyl indocarbocyanineperchlorate (DMSO soluble and water insoluble). 5
3.3. Surface Forces Apparatus. 6
The Surface forces Apparatus (SFA) is a well-established technique[S2] which have been used 7
to measure interaction forces between wide range of surfaces including biomolecules[S3], bio-8
membranes[S4], inorganic materials[S5], polymers[S7], and so on. Please see below for a 9
schematic illustration of a SFA. 10
11
Schematic illustration of a Surface Forces Apparatus (a) A photograph of Surface Forces 12
Apparatus (SFA) and schematics for both the (b) adhesion and (c) friction experiments set-up 13
without using optics. When the surfaces are too thick or translucent, SFA experiments without 14
optics are necessary. In this work, our coatings were too thick for optics, so we used the SFA 15
© 2016 Macmillan Publishers Limited. All rights reserved.

8
as (b) a high resolution adhesion force measuring device and (c) a micro tribometer. For the 1
load measurement, strain gauges are glued to the double cantilever springs in the form of 2
Wheatstone bridge. In order to actuate the lateral motion and measure friction force, the top 3
mount (see panel a) is replaced by a friction device [S2]. Load/adhesion and friction signals 4
collected from the deflection of the springs are amplified by the Signal Conditioning 5
Amplifier and recorded by the Chart recorder. Also, we needed the polymer coatings to be 6
underwater, so a cup was used to fully immerse the samples in water and also not to 7
compromise the electronic wirings attached to the strain gauges. 8
3.3.1. Adhesion force measurements 9
For the adhesion force measurements, since we used a thick layer of polymer (~2 μm), we did 10
not measure distances between substrates, meanwhile we used semi-conductive strain gauges 11
to measure the load and adhesion force directly. Also, to avoid the direct contact of water to 12
the stain gauges, small-cup set up was utilized which enabled the surfaces to be always inside 13
the water. 14
One spherical glass disk and one flat glass disk were used as the substrate. On the flat disk, 15
freshly cleaved and molecularly smooth muscovite mica was glued using epoxy glue (EPON 16
1004 F, Exxon Chemicals). Thoroughly cleaned spherical disk was tight fitted to the custom-17
made cup (see Fig. 4c). 18
For the adhesion force measurements (Fig. 3b), both surfaces were mounted in the SFA and 19
distilled water was injected inside the cup, and made sure that the water filled up the gap 20
between upper and lower surfaces. After approaching both surfaces close to each other, the 21
polymer blend was injected between the surfaces, immediately followed by the low 22
compression of the surfaces. The setting (or water bathing) was processed for a desired time 23
(5 sec, 2, 5, 10 and 60 min) and the surfaces were separated using course micrometer to 24
measure adhesion force between the polymer coating and the glass. 25
For the friction experiments (Fig. 4), only lower surface was mounted first with the 26
presence of water in the cup. Then, polymer blend was injected onto the lower spherical disc 27
and setting for 10 min, followed by mounting the upper surface. The load was applied using 28
the micrometer, while shearing the upper surface using friction device attachment[S2]. The 29
applied shearing velocity and the peak-to-peak shearing distance were 23 μm/s and 230 μm, 30
respectively. The load was increased gradually to investigate the friction forces at the wide 31
range of applied loads. 32
© 2016 Macmillan Publishers Limited. All rights reserved.

9
3.3.2. Polymer film thickness measurements after water blasting (control experiments) 1
For the polymer thickness measurements after water blasting, a back-silvered mica was 2
used as the substrate[S2]. Back-silvered mica sheets were glued on to two cylindrical glass 3
discs, silver side down. They were mounted in SFA in a cross-cylindrical geometry and zero 4
thickness was calibrated which is the mica-mica distance at the contact using multiple beam 5
interferometry technique [S6]. Upper disc was dismounted from SFA placed under water in a 6
petri dish. 100 μl of polymer solution (QCS-Tf2N or PAAcat) was spread on to the mica 7
surface, followed by 1 h immersing in water. The polymer deposited surface was water 8
blasted (10 bar) for 15 s and weakly bound polymers were detached from the surface. The 9
disc was mounted back to the SFA and the hard wall thickness of the remaining polymer was 10
measured after compression using course micrometer. 11
4. Other supplemental data 12
13
Supplementary Fig. 6 (A) QCS/PAAcat wet adhesive prepared by longer water setting time 14
(ts1 h), (B) as prepared wet adhesive resists higher pressure (30 bar) water blasting. 15
16
17
Supplementary Fig. 7 A smiling pattern was drawn on a glass slide immersed in water 18
(setting time 30 mins, left) and immersed in boiling water 1 h (middle), 25 oC DMSO 1h 19
(right). Please note: the adhesive was also tested to be stable in other solvents including 20
methanol, ethanol, isopropanol, acetone, tetrahydrofuran diethyl ether, and 21
dimethylformamide. 22
© 2016 Macmillan Publishers Limited. All rights reserved.
10
1
Supplementary Fig. 8 Underwater adhesive on various plastic substrates. Note for 2
experimental details: QCS-Tf2N/PAAcat blend solution was extruded to substrates immersed 3
in water, and was kept in water for 1 min, which was then subjected to water blasting (1.5 bar, 4
15s). Abbreviations: PE: polyethylene; PP: polypropylene; PS: polystyrene; polymethyl 5
methacrylate; PET: polyethylene terephthalate; PTFE: Polytetrafluoroethylene. The scale bar 6
is 1 cm. 7
8
Supplementary Fig. 9 Underwater adhesives on aluminum, metal, leaf, stone, and wood 9
substrates. Experimental details: QCS-Tf2N/PAAcat blend solution was extruded to substrates 10
immersed in water, and was kept in water for 1 min, which was then subjected to water 11
blasting (1.5 bar, 15s). The scale bar is 1 cm. 12
© 2016 Macmillan Publishers Limited. All rights reserved.

11
1
Supplementary Fig.10 Two glass slides glued together by a QCS/PAAcat wet adhesive; 2
dashed rectangular area marks the joint area of two glass slides. Experimental details: 3
QCS/PAAcat polymer solution (10 μL) with dye was extruded onto a glass slide submerged 4
in water. A second glass slide was immediately placed over the extruded polymer on the first 5
slide. After setting in water for 5 min without applied compressive pressure, the two glass 6
plates remained glued together. 7
8
9
Supplementary Fig. 11 Photographs of turbidity generation by mixing QCS-Cl (A) and 10
PAAcat (B) aqueous solution. Note: white precipitates (C) occurred after mixing the two 11
solutions. This control supports that QCS and PAAcat will complex to each other in water 12
(higher ε), but can coexist uncomplexed in DMSO (lower ε). 13
© 2016 Macmillan Publishers Limited. All rights reserved.

12
1
Supplementary Fig. 12 Coacervate morphology viewed by an optical microscope. Note: 2
QCSTf2N+PAAcat solution was injected onto a glass substrate in water, and the picture was 3
taken at 2 min after solvent exchange. A supplementary movie (Video R1) was provided 4
showing the moving fluidic coacervate droplets. 5
6
7
Supplementary Fig. 13. Progression of complexation trigger by top-down diffusion of 8
water-DMSO exchange. 9
10
© 2016 Macmillan Publishers Limited. All rights reserved.

13
1
Supplementary Fig. 14 Control experiments: a smiling face was drawn underwater by 2
extruding polymer solution containing (A) only QCS-Tf2N, (B) only PAAcat, (C) QCS-Tf2N 3
+ PAA, and (D) QCS-Tf2N + PAAcat to PTFE immersed in water (1 min setting) and then 4
subjected to water blasting (2.0 bar, 15s). Note: Wet adhesion on PTFT was barely detectable 5
when either QCS or PAAcat were used alone, likely because of the lack of electrostatic 6
complexation for network cohesion. The QCS/PAA system devoid of catechols showed much 7
weaker wet adhesion on PTFE on which catechols could provide hydrophobic interactions. 8
© 2016 Macmillan Publishers Limited. All rights reserved.

14
1
Supplementary Fig. 15 Control experiments: a smiling face was drawn underwater by 2
extruding polymer solution containing (A) only QCS-Tf2N, (B) only PAAcat, and (C) QCS-3
Tf2N + PAA, to glass slides immersed in water (1 min setting time) and then subjected to 4
water blasting (2.0 bar, 15s). Note: D: wet adhesive made from QCS-Tf2N + PAAcat. 5
6
Supplementary Fig. 16 A control experiment to block the participation of catechol groups in 7
wet adhesion. Note for experimental details: Fe3+ was added to the polymer blend solution, 8
with the stoichiometric ratio of Fe3+ to catechol groups kept at 1:1. The solution was extruded 9
onto a glass slide immersed in water and allowed to set for 1 min. The subsequent water 10
© 2016 Macmillan Publishers Limited. All rights reserved.

15
blasting washed away most of the polymer materials, hence indicative of poor wet adhesion. 1
These results suggest that Fe3+ chelation of catechol groups competes with interfacial binding 2
by catechol groups. 3
4
Supplementary Fig. 17 Digital photographs of (a, b) QCS/PAAcat wet adhesive set in DI 5
water for 1 h and 48 h, respectively, (c) put b) in 0.1 mM sodium periodate aqueous solution 6
for 10 s. Scale bars are 1 cm. These pictures imply that the oxidative crosslinking of catechol 7
groups in DI water is trivial under the experimental conditions in this study (1 hr in DI water). 8
Note: unlike the other underwater coating experiments (Figure 1b, Figure 3c), NO dye was 9
added to this polymer solution, so that we could follow the tanning of the polymers. 10
11
Supplementary Fig. 18 Atomic force microscope image (height channel) of the 12
QCS/PAAcat adhesive on glass slide in deionized water. The image was acquired using MFP-13
3D-Bio atomic force microscopy (Asylum Research) using SNL probe ~0.1 N/m (Bruker) at 14
22±3°C in tapping mode. Solution of QCS-Tf2N/PAAcat (concentration 1 wt%) was spread 15
over ~1cm2 glass slide and allowed to set in water (ts = 1 h). Then the solution was rinsed 16
(with deionized water) and scanned in deionized water. Please note: the AFM set-up was 17
schemed at the top. 18
© 2016 Macmillan Publishers Limited. All rights reserved.

16
1
Supplementary Fig. 19 Correlation of catechol content with surface morphologies of 2
underwater adhesives as viewed by SEM. (a) QCS/PAA, (b) QCS/PAAcat (10 mol%), (c) 3
QCS/PAAcat (20 mol%), (d) QCS/PAAcat (30 mol%), respectively. Additional experimental 4
details: the four polymer blended solutions were injected onto glass substrates underwater, 5
respectively, set for 1 h in water, air dried, and then subjected to SEM observations. The mass 6
ratio of QCS to PAA (or PAAcat) was fixed at 1:1.25 for each of the four solutions. PAAcat 7
(X mol%) means that the catechol monomer content in the PAAcat copolymer is X mol%. 8
9
Supplementary Fig. 20 Effect of weight ratio of PAAcat (30 mol%) polymer to QCS on the 10
porous microarchitecture of wet adhesives after a setting time of 1h. Mass ratio: PAAcat/QCS 11
= (a) 0.6, (b) 0.8, (c) 1.0, (d) 1.25. 12
© 2016 Macmillan Publishers Limited. All rights reserved.

17
1
Supplementary Fig. 21 Adhesion force of underwater adhesives of (a) QCS/PAA, (b) 2
QCS/PAAcat (10 mol%), (c) QCS/PAAcat (10 mol%), (d) QCS/PAAcat (30 mol%), 3
respectively. Note: data bars (left to right) correlate to samples in Supplementary Fig. 19 4
(a)-(d), respectively. 5
6
Supplementary Fig. 22 (a) Calculation of polymer solution shrinkage during the solvent 7
exchange. Left: polymer solution with an initial volume of 5 μL, Right: the volume of the 8
coating (ts =1 h) is calculated by the thickness (h) and radii (r) of the coating. (b) Thickness of 9
the cured QCS/PAAcat adhesive measured by AFM in DI water. Note: 4 places were 10
measured to calculate the average value. Thus the volume of the cured coating was calculated 11
to be: ~ 0.18 ± 0.1 μL. 12
© 2016 Macmillan Publishers Limited. All rights reserved.
18
1
2
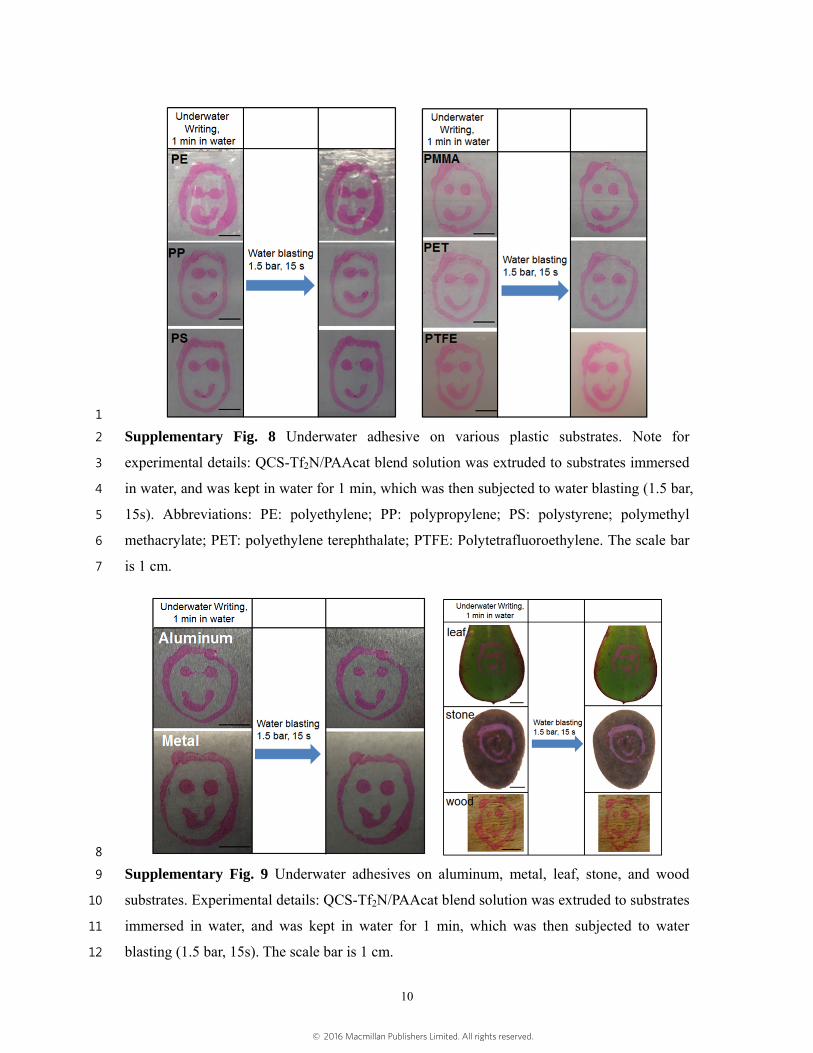
Supplementary Fig. 23 Control experiments: QCS-Tf2N only, PAAcat only, QCS-3
Tf2N+PAA mixture, and PAA only show little or no adhesion force (energy). 4
5
6
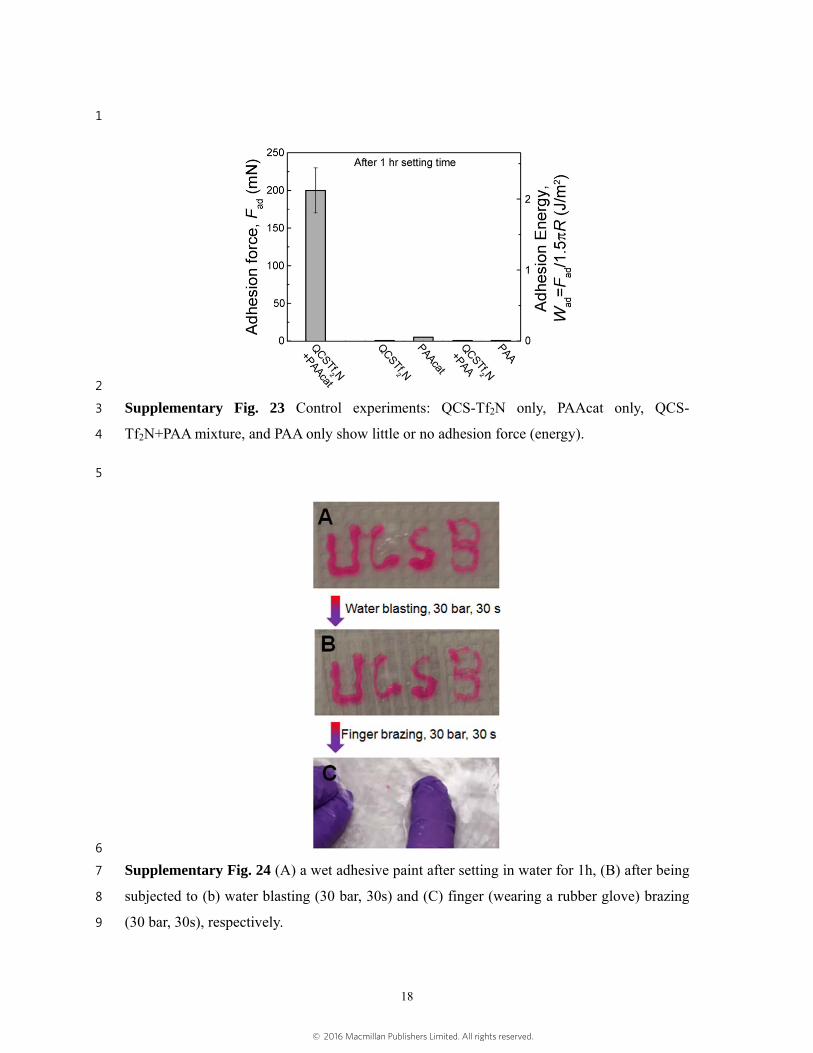
Supplementary Fig. 24 (A) a wet adhesive paint after setting in water for 1h, (B) after being 7
subjected to (b) water blasting (30 bar, 30s) and (C) finger (wearing a rubber glove) brazing 8
(30 bar, 30s), respectively. 9
© 2016 Macmillan Publishers Limited. All rights reserved.

19
1
2
Supplementary Fig. 25 Underwater friction experiments of epoxy glue vs. adhesive coated 3
glass performed using an SFA. Black dots and lines indicate friction results between epoxy 4
glue and polymer while red dots and lines indicate friction results between epoxy glue and 5
bare glass. 6
7
Supplementary Fig. 26 (a) Schematic underwater coating of a glass fiber (diameter 200 μm), 8
(b, c) morphology of the adhesive coated on glass fiber viewed by SEM. Note: the polymer 9
solution was extruded onto a glass fiber (200 micron diameter) placing in water (Fig. 26a). 10
The solution spreading driven by gravity turns out to be a synergy with the rapid curing, 11
resulting a porous coating on its surface (Fig. 26b,c). 12
13
14
© 2016 Macmillan Publishers Limited. All rights reserved.

20
Supplementary Table 1 Elemental analysis of QCS-Tf2N/PAAcat physical blend and 1
QCS/PAAcat complex. 2
Materials Sulfur (wt%) Carbon (wt%) Nitrogen (wt%)
QCS-Tf2N/PAAcat blend 3.1 53.6 5.4
QCS/PAAcat complex N/A 61.4 5.5
3
Supplementary References 4
[S1] S. Seo, S. Das, P. J. Zalicki, R. Mirshafian, C. D. Eisenbach, J. N. Israelachvili, J. H. Waite, B. K. Ahn, J. 5 Am. Chem. Soc. 2015, 137, 9214-9217. 6
[S2] J. Israelachvili, Y. Min, M. Akbulut, A. Alig, G. Carver, W. Greene, K. Kristiansen, E. Meyer, N. Pesika, K. 7 Rosenberg, H. Zeng, Rep Prog Phys 2010, 73, 1-16. 8
[S3] D. W. Lee, C. Lim, J. N. Israelachvili, D. S. Hwang, Langmuir 2013, 29, 14222-14229. 9
[S4] D. W. Lee, X. Banquy, K. Kristiansen, Y. Kaufman, J. M. Boggs, J. N. Israelachvili, P. Natl. Acad. Sci. 10 USA 2014, 111, E768-E775. 11
[S5] N. A. Alcantar, C. Park, J. M. Pan, J. N. Israelachvili, Acta. Mater. 2003, 51, 31-47. 12
[S6] J. N. Israelachvili, J. Colliod Interface Sci. 1973, 44(2), 259-272. 13
[S7] K. Ahn, D. W. Lee, J. N. Israelachvili, J. H. Waite, Nat. Mater. 2014, 13, 867-872. 14
© 2016 Macmillan Publishers Limited. All rights reserved.


![MOLECULAR- JET CHEMICAL VAPOR DEPOSITION OF Sic/67531/metadc669369/... · SiCH3H3 (MS) [2], silacyclobutane (31, hexamethyldisilane [4.51. and triethylsilane [SI. Reactive sputtering](https://img.dokumen.tips/doc/110x75/6142e6f97bbb8b3311171d4a/molecular-jet-chemical-vapor-deposition-of-sic-67531metadc669369-sich3h3.jpg)


![Organofluorine chemistry: Difluoromethylene motifs spaced ...2826 Figure 3: 1H NMR spectra of 4c. A) shows the spectrum in [2H8]-toluene, and B) shows the spectrum in chloroform (CDCl3)](https://img.dokumen.tips/doc/110x75/5e4495056fb70b1fa975c13d/organofluorine-chemistry-difluoromethylene-motifs-spaced-2826-figure-3-1h.jpg)