Embed Size (px)
Citation preview
Understanding Your Exposure: ETFs vs. Competing Structures
Rebecca Hampson European Editor ETF.com
Matt Hougan President ETF.com
Allan Lane Managing Partner Twenty20 Investments

Rebecca Hampson European Editor ETF.com
An Overview
What Is An ETF & How Does It Work?

£10,000
£10,000 £10,000
£10,000
How A Mutual Fund Works

100 @ $100
100 @ $100
100 @ $100
100 @ $100
£40,000
£10,000
£10,000 £10,000
£10,000
How A Mutual Fund Works
£40,000
100 @ $200
100 @ $200 100 @ $200
100 @ $200 100 @ £100
100 @ £100 100 @ £100
100 @ £100
How A Mutual Fund Works

$20,000
£80,000
100 @ £200
100 @ £200 100 @ £200
100 @ £200
How A Mutual Fund Works

£70,000
100 @ £200 100 @ £200
100 @ £200 £20,000
50 @ $200
£10,000
How A Mutual Fund Works

£10,000 of FTSE 100 ETF Please!
How It Really Works

£10,000 of FTSE 100 ETF Please!
Broker
How It Really Works

£10,000
702 @ $14.23
Broker
£10,000 of FTSE 100 ETF
Please!
Assets: £1,200,000.00 Shares: 8,000,000 Net Asset Value: £1.50
How It Really Works

ETFs, Inc.
?
How An ETF Works

CSCO AAPL CAT MSFT IBM
$2.5 million
100K @ $25 ETFs, Inc.
Authorized Participant
ETF Anatomy: Creation/Redemption

100K @ $25
IBM
MSFT
AAPL
CAT
CSCO
ETFs, Inc.
Authorized Participant
ETF Anatomy: Creation/Redemption

100K @ $25
Authorized Participant
IBM MSFT AAPL CAT CSCO ETFs, Inc.
ETF Anatomy: Creation/Redemption

Authorized Participant
$25.00 $25.00
Why Be an AP?
Fair Value $25.00

Selling Pressure
Buying Pressure
Authorized Participant
Why Be an AP?
$25.01 $25.01
Fair Value $25.01

Authorized Participant
Buy! 100K @ $24.90
Fair Value $25.00
$25.00
Why Be an AP?
$24.90

Matt Hougan President ETF.com
The Right Tool For The Right Occasion
ETFs vs. Competing Products

What Other Products Are There?
Key competitors include…
• Index Tracker Funds • Actively Managed Mutual Funds • Investment Trusts
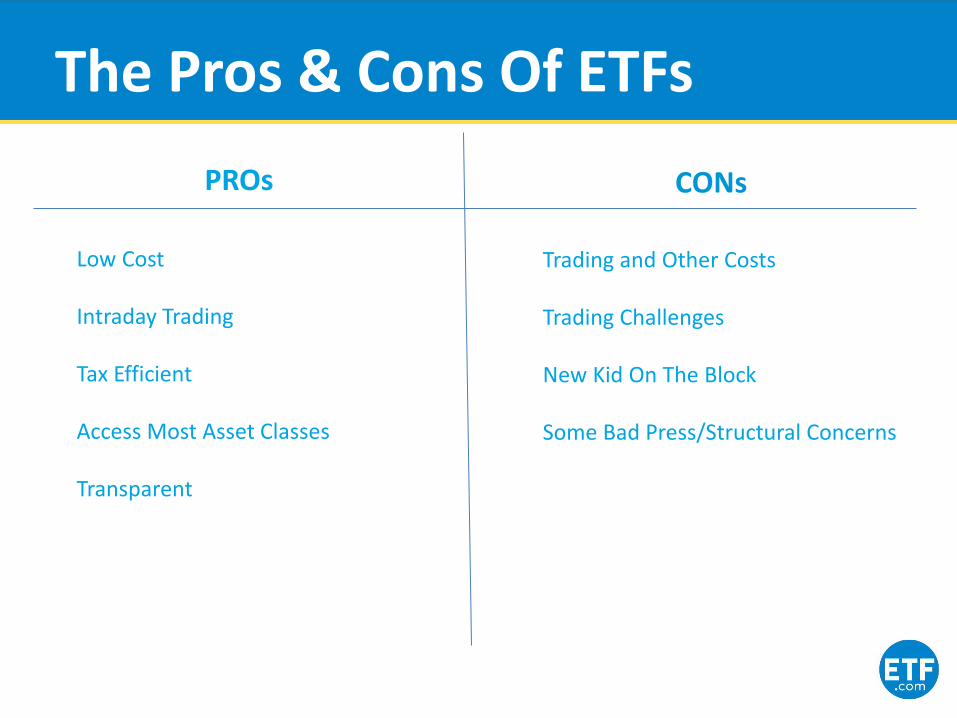
The Pros & Cons Of ETFs
Low Cost Intraday Trading Tax Efficient Access Most Asset Classes Transparent
Trading and Other Costs Trading Challenges New Kid On The Block Some Bad Press/Structural Concerns
PROs CONs

Annual Fees As ETFs: € 20 Billion
Annual Fees As Funds: € 74 Billion
AUM (€, B) Average ETF ER Average Active Mutual
Fund ER
Equity 3,732 0.39% 1.35%
Fixed Income 2,925 0.23% 0.84%
The Potential Cost Savings of ETFs
Source: Morningstar, ETF.com

€54 Billion Per Year
(That’s €147.9 million per day)
(Or €102,739 per minute)
The Potential Cost Savings of ETFs
Source: ETF.com as of 12/31/2013
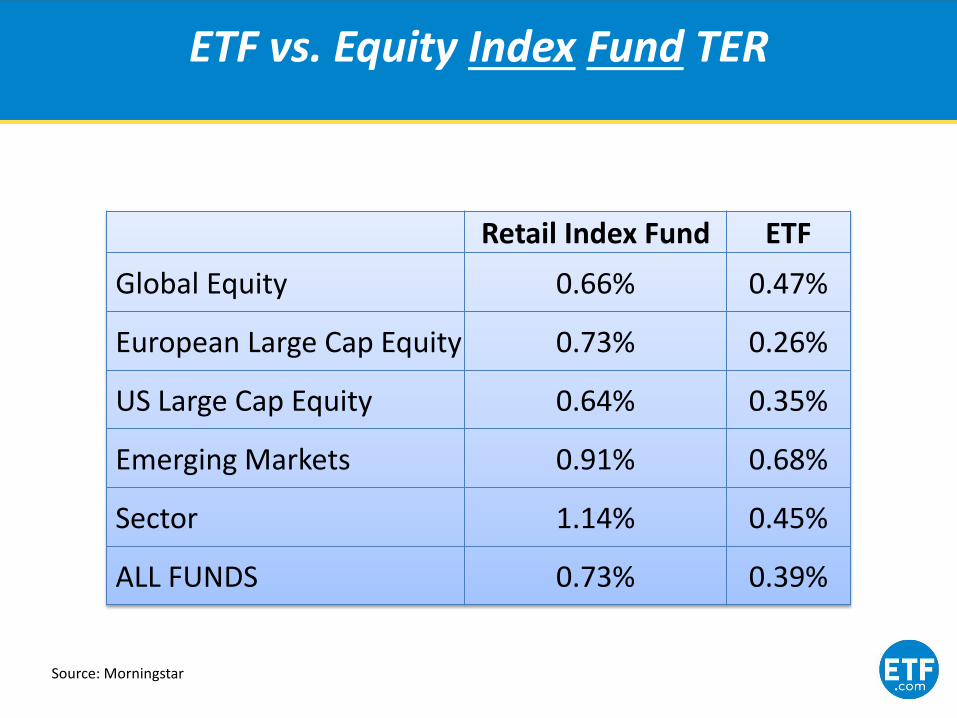
ETF vs. Equity Index Fund TER
Retail Index Fund ETF
Global Equity 0.66% 0.47%
European Large Cap Equity 0.73% 0.26%
US Large Cap Equity 0.64% 0.35%
Emerging Markets 0.91% 0.68%
Sector 1.14% 0.45%
ALL FUNDS 0.73% 0.39%
Source: Morningstar

Retail Index Fund ETF
Global 0.32% 0.24%
European Sovereign 0.32% 0.18%
European Corporate 0.49% 0.23%
US Sovereign N/A 0.21%
Emerging Markets N/A 0.48%
ALL FUNDS 0.35% 0.23%
ETF vs. Fixed Income Index Fund TER
Source: Morningstar

Retail Index Fund
Institutional Index Fund ETF
Global 0.32% 0.20% 0.24%
European Sovereign 0.32% 0.29% 0.18%
European Corporate 0.49% 0.21% 0.23%
US Sovereign N/A 0.23% 0.21%
Emerging Markets N/A 0.49% 0.48%
ALL FUNDS 0.35% 0.28% 0.23%
ETF vs. Institutional FI Index Fund TER
Source: Morningstar

Commodity Comparisons Are A Joke
Retail Index Fund
Institutional Index Fund ETF
Broad Based 1.19% 0.48% 0.53%
Agricultural N/A N/A 0.58%
Precious Metals N/A N/A 0.49%
Energy N/A N/A 0.41%
Industrial Metals N/A N/A 0.54%
ALL FUNDS 1.19% 0.48% 0.43%
Source: Morningstar

Asset Class Weight Fund Ticker ER
Eurozone Equity 30% Db X-trackers EURO STOXX 50 XESX 0.09%
U.S. Equity 25% Vanguard S&P 500 VUSA 0.09%
Emerging Markets Equity
5% Amundi MSCI Emerging Market AEEM 0.45%
Fixed Income 30% Vanguard UK Gov’t Bond VGOV 0.12%
Commodities 5% Lyxor Commodities Thomson/Reuters
Jefferies CRB TR CRBL 0.35%
Gold 5% iShares Physical Gold SGLN 0.25%
All-In Costs 0.14%
London’s Cheapest ETF Portfolio: 14 Bps
Source: ETF.com

Winning In A Fee-Only World Which Conversation Do You Want To Have?
Active Fund Costs: 1.35% Advisory Fee: 1.00% ALL-IN FEE: 2.35%
Low-cost ETF Portfolio: 0.14% Advisory Fee: 1.00% ALL-IN FEE: 1.14%

But Remember Trading Costs
Total Cost of ETF =
TER + Spread + Commission

Trade
And Trading Complications
For internal use only Source: Bloomberg,

Index Trackers Vs. ETFs
Low Cost – Competitive With ETFs Transparent Traded Once A Day Limited Access To Asset Classes
Low Cost – Competitive with Index Trackers Transparent Intraday Trading Access Most Asset Classes
Index Trackers ETFs

Active Funds Vs. ETFs
Expensive Aims to Outperform the Market Trades Once Per Day Vast majority don’t outperform Opaque – Holdings Are Published Periodically
Low Cost Aims to Track An Index Intraday Trading Tax Efficient Access Most Asset Classes Transparent
Active Funds ETFs

The Impact Of Costs

Most Active Funds Underperform
Percentage of Active Funds Underperforming Their Benchmark
Source: Vanguard

Percentage of Active Funds Underperforming Their Benchmark
Most Active Funds Underperform
Source: Vanguard

Investment Trust Vs. ETFs
Closed End Funds Intraday Trading Higher Costs Borrowing Powers Retain Income Premiums and Discounts
Open ended Intraday Trading Low Cost Tax Efficient Access Most Asset Classes Transparent
Investment Trusts ETFs

Premiums and Discounts: An Absurd Idea

A User’s Perspective
Why I Use ETFs In Portfolios
Allan Lane Managing Partner Twenty20 Investments

Twenty20 Investments
• A closer look at model portfolios
• Simple steps for determining which vehicle to use
• All ETF portfolios - Do they work?
Agenda

Twenty20 Investments
“ETFs are growing in popularity because of their versatility, ease of access and intraday liquidity, giving investors plenty of options.
However, investors have not abandoned more traditional investment vehicles such as tracker funds, mutual funds, investment trusts,
structured notes & certificates, individual stocks, bond and futures.”
Rebecca Hampson
www.ETF.com

Twenty20 Investments
How Big Is The Opportunity Set?
www.twenty20investments.com

Let’s Start At The Beginning …
Twenty20 Investments
“It is widely agreed that asset allocation accounts for a large part of the variability in the return on a typical investor's portfolio. This is especially true if the overall portfolio is invested in multiple funds, each including a number of securities” William F. Sharpe - Journal of Portfolio Management, Winter 1992, pp. 7-19

Twenty20 Investments
The Versatility And Growth Of ETFs
ETFs can help managers concentrate on their own areas of expertise by allowing them to
• Get exposure to other asset classes • Quickly shift unwanted market risk
• Instantaneously take positions
• Use ETFs for transition management • Use ETFs as an alternative to
derivatives
• Use ETFs for asset allocation
Annual growth rate over the last 5 years of 25% Over 5,000 ETFs to select from
Source: BlackRock June 2014
AUM
Number of ETFs

SYMBOL ETF Name AUM TER
SRD:TH SPDR S&P 500 ETF Trust 158648.0 9
IVV:US iShares Core S&P 500 ETF 56275.4 7
EFA:US iShares MSCI EAFE ETF 54296.1 34
QQQ:US Powershares QQQ Trust Series 1 43937.0 20
VWO:US Vanguard FTSE Emerging Markets ETF 42393.1 15
VTI:US Vanguard Total Stock Market ETF 41449.3 5
EEM:US iShares MSCI Emerging Markets ETF 36130.0 67
GLD:US SPDR Gold Shares 32879.6 40
IWM:US iShares Russell 2000 ETF 26635.7 24
DAXEX:GR ISHARES DAX UCITS DE 22854.3 16
IWF:US iShares Russell 1000 Growth ETF 22672.2 20
IWD:US iShares Russell 1000 Value ETF 21875.5 21
VNQ:US Vanguard REIT ETF 21005.0 10
VEA:US Vanguard FTSE Developed Markets ETF 20802.1 9
IJH:US iShares Core S&P Mid-Cap ETF 20416.3 15
BND:US Vanguard Total Bond Market ETF 19426.8 10
VIG:US Vanguard Dividend Appreciation ETF 18919.1 10
XLF:US Financial Select Sector SPDR Fund 18418.6 17
1321:JP Nomura ETF - Nikkei 225 Exchange Traded Fund 17963.2 24
LQD:US iShares iBoxx $ Investment Grade Corporate Bond ETF 16943.7 15
…
…
‘No, I can’t use ETFs, the market’s not big enough’ … Bart Simpson
Source: Bloomberg (26/04/2014)
The ETF Global Titans List
Restricting one’s attention to ETFs with an AUM > $1bn, at any one time there may well be more than 350 products to choose from

Twenty20 Investments
ETF Managed Portfolios – Why are they so popular in the US?
ETFs Phase II – Building on the success of ETFs, managed portfolios are the next staging post in the ongoing process where investment value propositions are being re-shaped Transparency – investors and advisors know exactly what is in the portfolio; no nasty surprises Low Fees/Liquidity – no lock-in period Versatility – using tactical asset allocation a skilled manager can offer solutions that provides both upside participation and downside protection Empowers the advisor – allows advisors to focus on their clients and to still have a very compelling story around the investment choices on offer
0
50
100
150
200
250
300
350
400
450
500
$
$20
$40
$60
$80
$100
$120
2008 2009 2010 2011 2012 2013 2014 2015
Nu
mb
er
of
Stra
tegi
sts
AU
M -
Bn
ETF Managed Portfolios Growth (USD)
Source: Twenty20 Investments, Morningstar, BlackRock May 2014
Empowering The Adviser

Twenty20 Investments
A Closer Look At Model Portfolios
www.twenty20investments.com

What Is A Model Portfolio?
• Often seen as 'off-the-shelf‘ portfolios with differing risk reward profiles
• On the basis that each model portfolio can be individually selected, the advisor can then blend these to form the investment solution most appropriate for their clients
• Typically a model portfolio only contains collective investments as limited by the infrastructure of the WRAP platform
• Of key consideration is the minimum investment amount, which in turn drives the size of the investor pool; a lower minimum amount means more investors can participate
WRAP: By a wrap platform we mean the successor to the concept of a fund supermarket which brings together product providers, financial advisors and end investors.
Twenty20 Investments
A Closer Look At Model Portfolios

Provider Details
• Expertise, track record and familiarity with advisors’ needs
• Experience in investment management
• Relationships with platform providers and product providers
Investment Philosophy
• Consistency
• Philosophy makes sense across various market cycles
Investment Strategy
• Return objectives / Cash flow needs
• Tax considerations
• Risk tolerance
• Investment horizon
• Instrument / Asset class preferences
Twenty20 Investments
Key Considerations When Selecting A Model Manager

Portfolio Structure And Construction Process
• Choice of benchmark
• Home bias, global or domestic selection
• Themed based investing or mainstream constructions
Operational Fit
• Scope of facilities
• Professionalism
• Technology
• Client services
• Operational controls
Platform Availability
• Integration considerations
Twenty20 Investments
Key Considerations When Selecting A Model Manager

Adviser / DFM Partnership
• Is the model manager positioned to empower you as the client-facing advisor?
• It’s a team effort, both the advisor and the DFM need to operate as one
• Looking after the best interest of the end investor is key
• The investment team must be accessible and approachable
• It is unlikely the DFM will not have any marketing material, how best to exploit that?
• For larger clients one may want to leverage the investment expertise
Ongoing Due Diligence Monitoring Process
• It is imperative that the DFM provides regular updates to its target audience – the advisors
• The philosophy of no surprises is always welcomed
DFM: Discretionary fund manager
Twenty20 Investments
Key Considerations When Selecting A Model Manager

Investment Objective
• Risk category
• Cautious
• Balanced
• Growth
• Adventurous
• Benchmark vs Absolute return
• Passive / Active
Risk management
• Risk targets
• Risk control techniques
Twenty20 Investments
Simple Steps To Determine Which Vehicle To Use – STEP 1
Investment Theme
• Capital appreciation
• Income
• Risk managed
• Tax efficient
• Socially responsible
Available asset classes
• Equities
• Fixed income
• Commodities
• Alternatives
Step 1 - Design your investment strategy

Operating Platform - Key factors to bear in mind
• Many WRAP platforms may not offer all instruments to trade
• Making your model portfolio available on more than one platform can add more restrictions
• Does the platform support your choice of benchmark?
• How dependent is your strategy on good execution when re-balancing your portfolio, do you need to be operating on a platform
that is a member of the LSE?
Risk Management System – The right tools for the job
• The increase in popularity of model portfolios has coincided with fairer market conditions, be prepared for your risk
management skills to be tested in the not too distant future
• Measuring and controlling risk cannot be achieved without the right tools
• Do not expect your WRAP platform to act as a risk management system
• Excel should not be confused as a risk management system, mainly due to the fact it introduces an unacceptable level of
operational risk
Twenty20 Investments
Simple Steps To Determine Which Vehicle To Use – STEP 2
Step 2 – Selecting your WRAP & risk management platforms

Index Funds, Mutual Funds, ETFs, Bonds or Futures? - Key Influencing Factors
• What risk factors am I looking to get exposure to?
• e.g. European equities, or government bonds, or property, or multi asset …
• Which investment products provide these same exposures?
• How much maintenance and monitoring do these instruments require?
• e.g. futures roll down, bonds reach maturity
• Do I understand all of the risks with each instrument chosen?
• Can the risk measurement system work with these choices?
• Core or satellite / low or higher turnover?
• Total cost of ownership – TER + trading costs + tracking difference
• The level of required liquidity based on the anticipated holding period
• For funds: track record
• Do you value the role that is played by transparency?
Twenty20 Investments
Simple Steps For Determining Which Vehicle To Use – STEP 3
Step 3 - Implementing your investment strategy

As ETFs become an asset class in their own right expect more questions around this proposition, and to date there is increasing evidence to support this idea.
• As each ETF is itself diversified, a portfolio of ETFs will have a lower drawdown when the next financial crisis hits. Watch this space!
• As a rule of thumb, this downside protection goes hand in hand with giving up some of the upside returns
• This, however, will not be true if a manager crystalizes their losses on each market correction
• As to be expected, the benefits of using passive investment vehicles still requires a disciplined approach to investment management
• While in many ways ETF only portfolios place less demands on the manager, the role of the asset allocator becomes all the more critical
• With so many ETFs to choose from, there is an increased need to make good of the due diligence process
• In the same way one has come to respect the skill of an absolute return manager, in the future the skill of the ‘ETF Strategist’ will be rewarded
All ETF Portfolios - Do They Work?
In the US, ETF only portfolios are very popular with financial advisors. As one of the fastest growing segments in finance their popularity is expected to rise in the UK as well

Twenty20 Investments
Twenty20 Investments is a division within Hutchinson Lilley Investments LLP which is Authorised and Regulated by the Financial Conduct Authority.
This report has been prepared by Hutchinson Lilley Investments LLP. For the purpose of the UK Financial Services & Markets Act 2000 this publication has been issued by Hutchinson Lilley Investments LLP (“HLI”), which is authorised and regulated by the UK Financial Conduct Authority (“FCA”) (firm reference number: 524544). This report is for distribution only under such circumstances as may be permitted by applicable law. It should not be considered investment advice and has no regard to the specific investment objectives, financial situation or particular needs of any specific recipient. It is published solely for informational purposes and is not to be construed as a solicitation or an offer to buy or sell any securities or related financial instruments. No representation or warranty, either express or implied, is provided in relation to the accuracy, completeness or reliability of the information contained herein, except with respect to information concerning HLI, nor is it intended to be a complete statement or summary of the securities, markets or developments referred to in the report. The report should not be regarded by recipients as a substitute for professional advice or the exercise of their own judgement. Any opinions expressed in this report are subject to change without notice and may differ or be contrary to opinions expressed by other business areas or groups within HLI as a result of using different assumptions and criteria. HLI is under no obligation to update or keep current the information contained herein. HLI, its partners, officers, employees, consultants or clients (including those associated with Twenty20 Investments) may have or have had interests or long or short positions in the securities or other financial instruments referred to herein, and may at any time make purchases and/or sales in them as principal or agent.
The securities described herein may not be eligible for sale in all jurisdictions or to certain categories of investors. Options, derivative products and futures are not suitable for all investors, and trading in these instruments is considered high risk. Past performance is not necessarily indicative of future results. Foreign currency rates of exchange may adversely affect the value, price or income of any security or related instrument mentioned in this report. For investment advice, trade execution or other enquiries, clients should contact their local sales representative. Neither HLI nor any of its affiliates, directors, employees, consultants or agents accepts any liability for any loss or damage arising out of the use of all or any part of this report.
Additional information will be made available upon request. Except as otherwise specified herein, this material is communicated to persons who are Professional Clients or Eligible Counterparties as that term is defined under the Markets in Financial Instruments Directive (2004/39/EC) or any other persons to whom it may lawfully be communicated. It is not made to or directed at Retail Clients as defined by FCA and should to be distributed to or relied upon by Retail Clients under any circumstances. This report may not be reproduced or redistributed, in whole or in part, without the written permission of HLI and HLI accepts no liability whatsoever for the actions of third parties in this respect.
Disclaimer

? Any Questions?


![Introduction - QUANTITATIVE RESEARCH AND TRADINGjonathankinlay.com › wp-content › uploads › Canonical...ETFs = TemporalData[ETFs] DateListPlot[ETFs] TemporalData 2008 2010 2012](https://img.dokumen.tips/doc/110x75/60be3b7b4d2c2d25820ec04a/introduction-quantitative-research-and-t-a-wp-content-a-uploads-a-canonical.jpg)