Embed Size (px)
Citation preview

UNDERSTANDING RESEARCH UNDERSTANDING RESEARCH RESULTS: STATISTICAL INFERENCE

A FEW TERMS
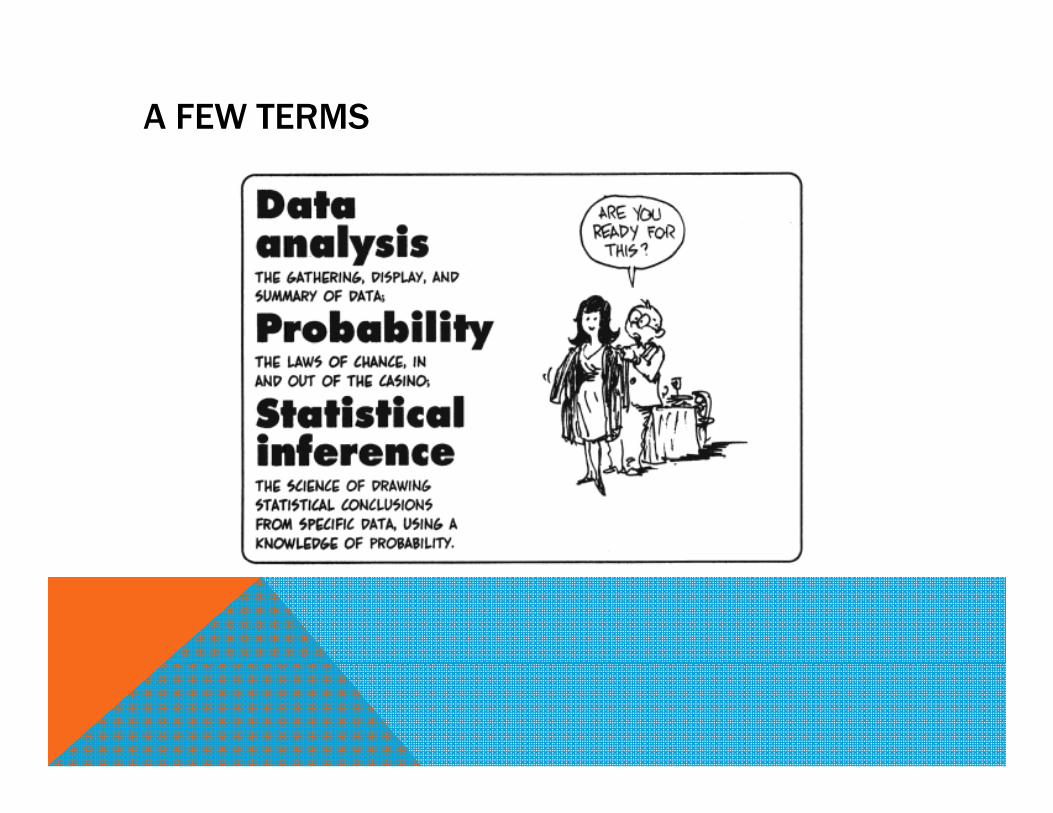
A FEW TERMS

SAMPLES AND POPULATIONS
Inferential statistics are necessary because The results of a given study are based on data obtained from a single sample of researcher participants andsingle sample of researcher participants andData are not based on an entire population of scores
Allows conclusions on the basis of sample data
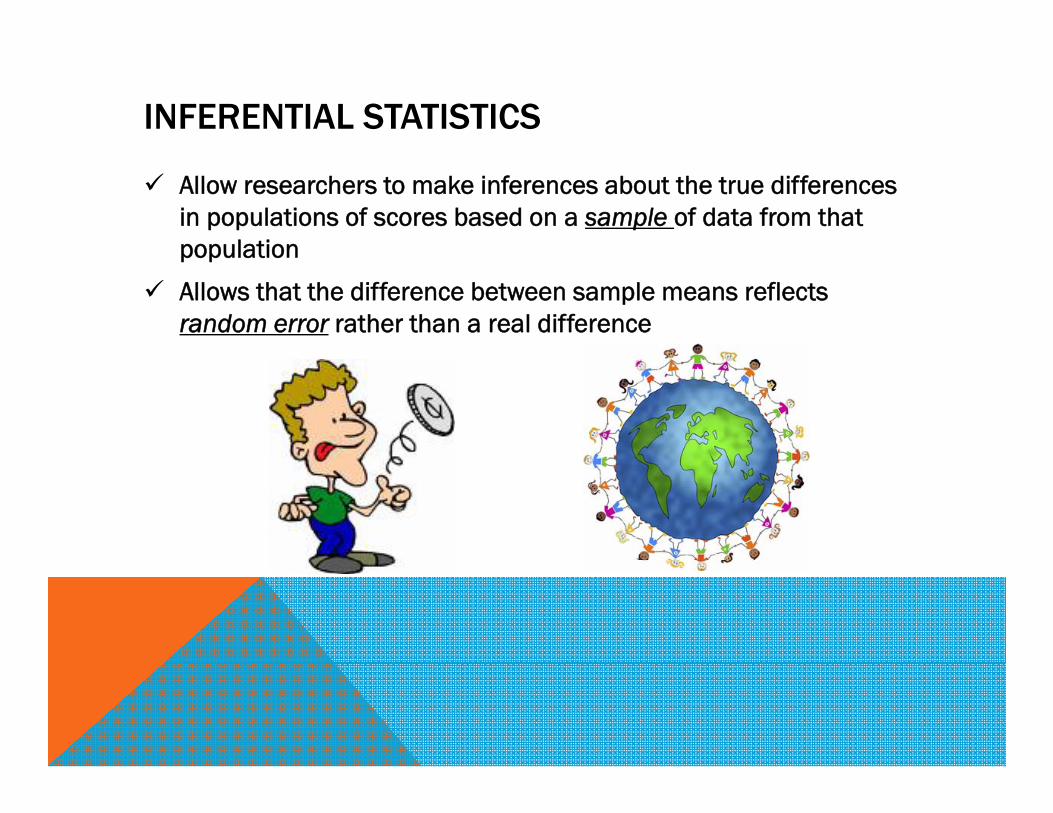
INFERENTIAL STATISTICS
Allow researchers to make inferences about the true differences in populations of scores based on a sample of data from that populationpopulation
Allows that the difference between sample means reflects random error rather than a real difference

NULL AND RESEARCH HYPOTHESES
Null Hypothesis H0: Population Means are EqualAny differences between groups are due to chance aloneAny differences between groups are due to chance alone
Research HypothesisH1: Population Means are Not EqualAny differences between groups are due to the IV
Statistical Significance: Unlikely to be due to chance alone

PROBABILITY AND SAMPLING DISTRIBUTIONS
Probability: The Case of ESPAre correct answers due to chance or due to something more?
Sampling DistributionsAssumes Null is TrueBinomial Distributions
Sample Size

THE T TEST
t value is a ratio of two aspects of the dataThe difference between the group means and The variability within groupsThe variability within groups
t= between-groups difference
within-groups difference
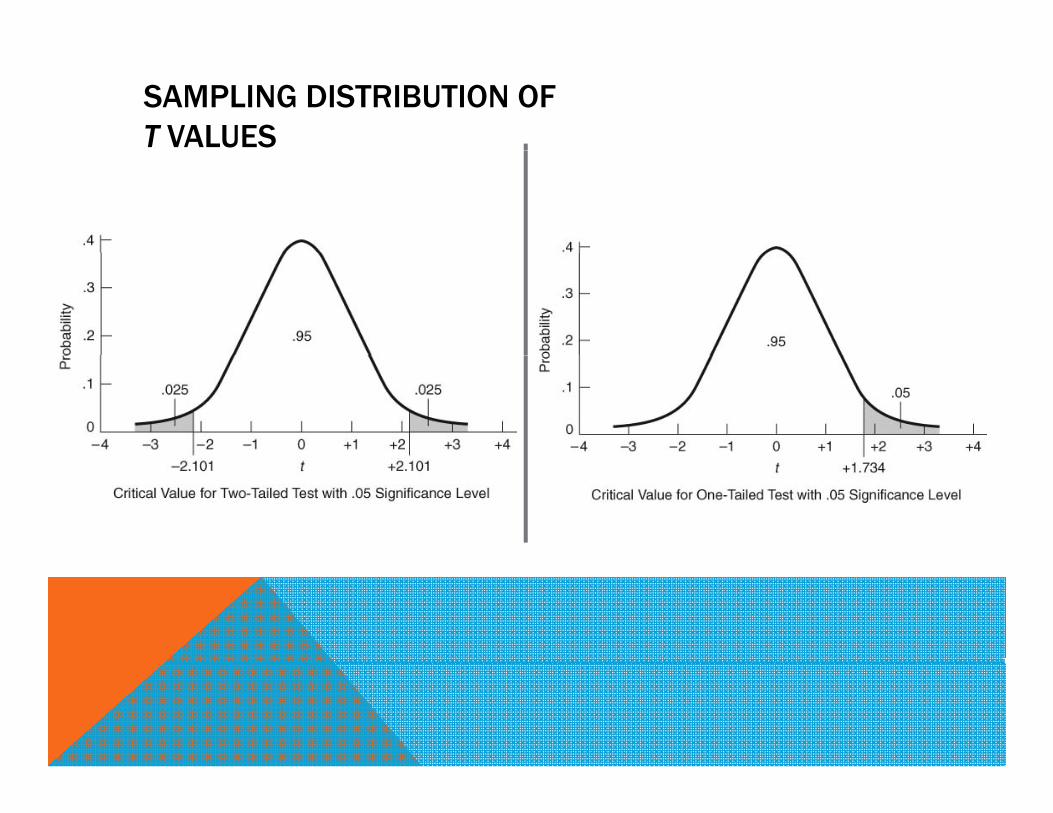
SAMPLING DISTRIBUTION OF T VALUES

EXAMPLE: THE T AND F TESTS
Degrees of FreedomThe number of scores that are free to vary when making an estimate.
One-Tailed vs. Two-Tailed TestsDirectional vs Nondirectional Hypotheses?Directional vs. Nondirectional Hypotheses?
The F Test (analysis of variance)Systematic variance / Between-Groups VarianceSystematic variance / Between Groups VarianceError variance / Within-Groups Variance

ONE-TAILED VS. TWO-TAILED TESTS
What is a directional hypothesis?
Is a one-tailed test valid?

EXAMPLE: THE T AND F TESTS
Calculating Effect Size (r, Cohen’s d, , etc.)
Confidence Intervals and Statistical Significance
2pη
Statistical Significance

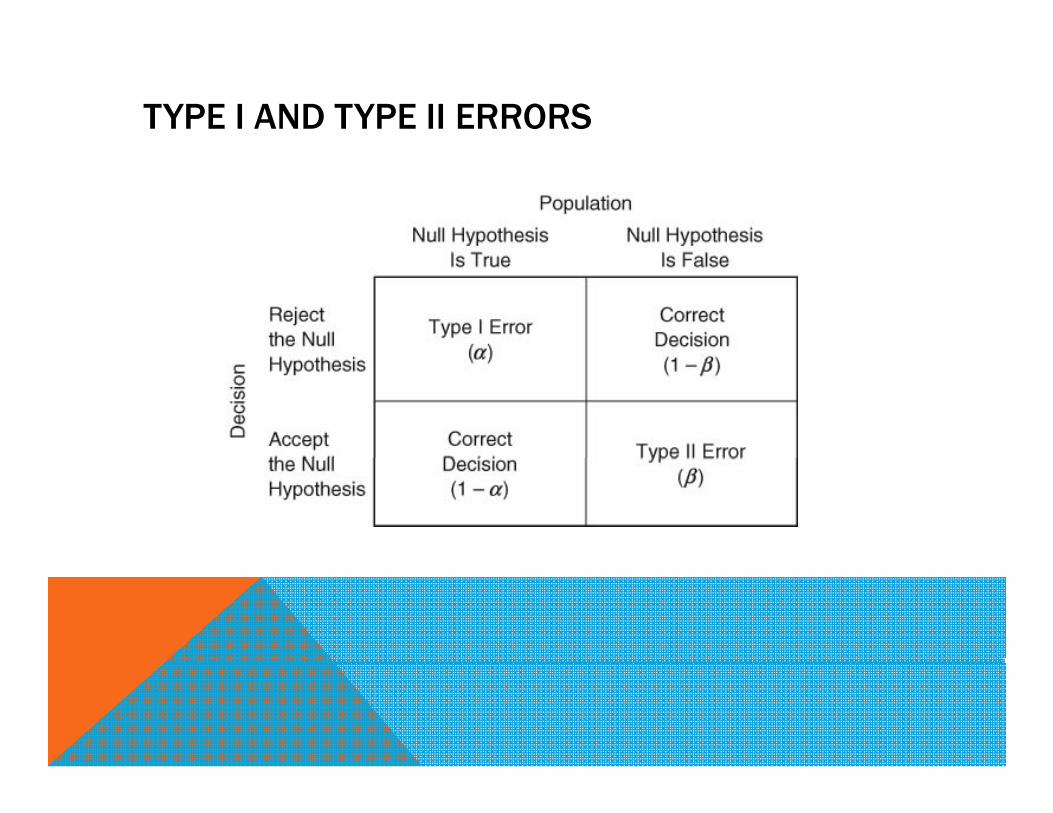
TYPE I AND TYPE II ERRORS
Type I ErrorsMade when the null hypothesis is rejected but the null hypothesis is actually trueyp yObtained when a large value of t or F is obtained by chance aloneType II ErrorsypMade when the null hypothesis is accepted although in the population the research hypothesis is trueFactors related to making a Type II error
Significance (alpha) levelSample sizeEffect size
TYPE I AND TYPE II ERRORS

THE EVERYDAY CONTEXT OF TYPE I AND TYPE II ERRORS

SIGNIFICANCE LEVEL & STATISTICAL ERRORS
Researchers traditionally have used either a .05 or a .01 significance level in the decision to reject the null hypothesis
A t th t th f ki T I Agreement that the consequences of making a Type I error are more serious than those associated with a Type II errorArlo’s Two Cents: It depends on context.
A d hi h AIDSe.g., A new drug which may cure AIDS
Interpreting nonsignificant resultsp g gAbsence of evidence is not evidence of absence.Nothing is ever proven or disproven!

CHOOSING A SAMPLE SIZE: POWER ANALYSIS
Power is a statistical test that determines optimal sample size based on probability of correctly rejecting the null hypothesisyp
Power = 1 – p(Type II error)
Eff i d d i d Effect sizes range and desired powerSmaller effect sizes require larger samples to be significantHigher desired power demands a greater sample sizeResearchers usually use a power between 70 and 90Researchers usually use a power between .70 and .90

IMPORTANCE OF REPLICATIONS
Scientists attach little importance to results of a single study
Detailed understanding requires numerous studies examining same i blvariables
Researchers look at the results of studies that replicate previous investigations
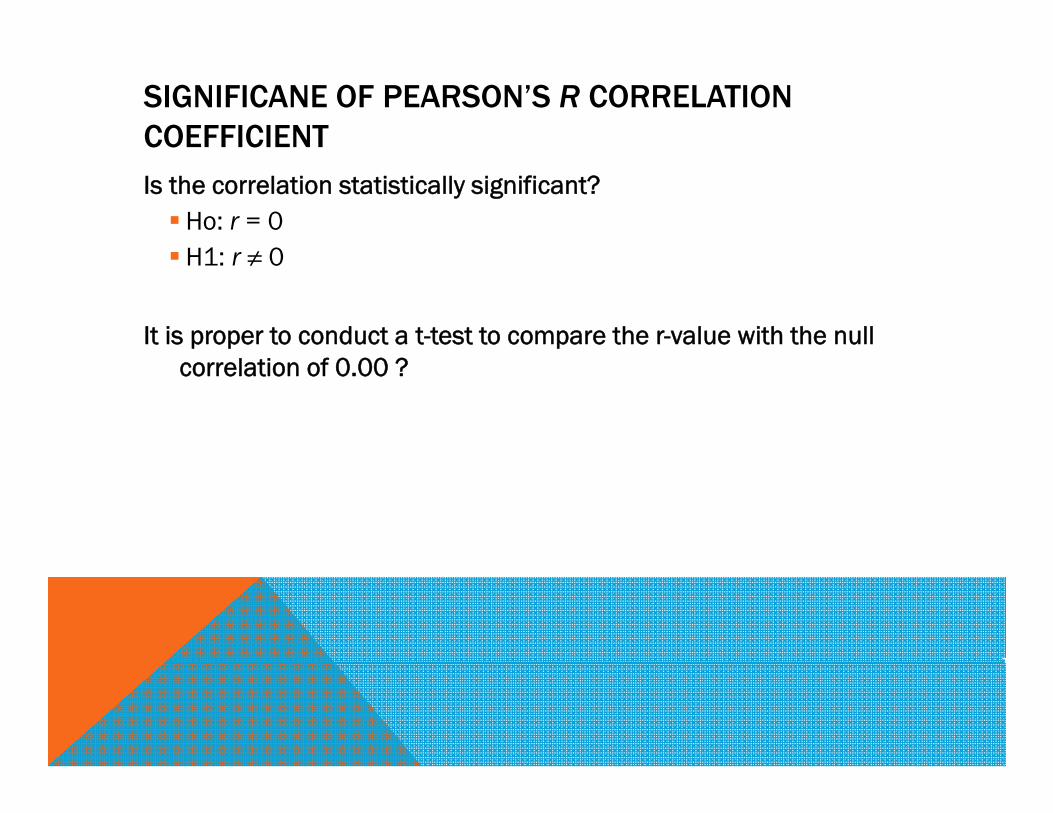
SIGNIFICANE OF PEARSON’S R CORRELATION COEFFICIENTIs the correlation statistically significant?
Ho: r = 0 H1: r ≠ 0H1: r ≠ 0
It is proper to conduct a t-test to compare the r-value with the null correlation of 0.00 ?

COMPUTER ANALYSIS OF DATA
Software Programs includeSPSSSASSASMinitabMicrosoft Excel
Steps in analysisSteps in analysisInput data
Rows represent cases or each participant’s scoresColumns represent a participant’s score for a specific variablep p p p
Conduct analysisInterpret output

SELECTING THE APPROPRIATE SIGNIFICANCE TESTSELECTING THE APPROPRIATE SIGNIFICANCE TEST
IV DV Statistical Test
Nominal Nominal Chi SquareNominalMale-Female
NominalVegetarian – Yes / No
Chi Square
Nominal (2 Groups) Interval / Ratio t testMale-Female Grade Point Average
Nominal (3 groups)Study time (Low,
Interval / RatioTest Score
One-way ANOVA
Medium, High)
Interval / RatioOptimism Score
Interval / RatioSick Days Last Year
Pearson’s correlation

SELECTING THE APPROPRIATE SIGNIFICANCE TEST
Multiple Independent VariablesNominal Scale Data – ANOVA Factorial DesignOrdinal Scale Data no appropriate test is availableOrdinal Scale Data – no appropriate test is availableInterval or Ratio Scale Data – Multiple Regression