Embed Size (px)
Citation preview
Understanding permeable and impermeable surfacesTechnical report on surfacing options and cost benefit analysis
www.communities.gov.ukcommunity, opportunity, prosperity
Understanding permeable and impermeable surfacesTechnical report on surfacing options and cost benefit analysis
Paul Shaffer, CIRIASteve Wilson, The Environment Protection Group
Fred Brindle, William Clark PartnershipBarbara Baffoe-Bonnie, Claire Prescott, Neil Tarbet, WRC
September 2009Department for Communities and Local Government
Department for Communities and Local GovernmentEland HouseBressenden PlaceLondon SW1E 5DUTelephone: 020 7944 4400Website: www.communities.gov.uk
© Crown Copyright, 2009
Copyright in the typographical arrangement rests with the Crown.
This publication, excluding logos, may be reproduced free of charge in any format or medium for research, private study or for internal circulation within an organisation. This is subject to it being reproduced accurately and not used in a misleading context. The material must be acknowledged as Crown copyright and the title of the publication specified.
Any other use of the contents of this publication would require a copyright licence. Please apply for a Click-Use Licence for core material at www.opsi.gov.uk/click-use/system/online/pLogin.asp, or by writing to the Office of Public Sector Information, Information Policy Team, Kew, Richmond, Surrey TW9 4DU
e-mail: [email protected]
If you require this publication in an alternative format please email [email protected]
Communities and Local Government PublicationsTel: 030 0123 1124Fax: 030 0123 1125
Email: [email protected] via the Communities and Local Government website: www.communities.gov.uk
September 2009
Product Code: 09COMM06044
ISBN: 978 1 4098 1714 7
Contents
Executive summary 5
Chapter 1 7Introduction
1.1 Background and policy context 71.2 Aims of the research 81.3 Rationale for using permeable surfaces 91.4 Use of surfaces 121.5 Myths about permeable surfaces 12
Chapter 2 13Range of surfaces
2.1 Definition of surface types 132.2 Surface materials 142.3 Terminology 162.4 Impermeable surfaces 172.5 Permeable surfaces 202.6 Uptake of permeable materials 262.7 Sustainability of materials 27
Chapter 3 29Cost benefit analysis
3.1 Cost assumptions 293.2 Review of CBA methodology 393.3 CBA methodology 403.4 Summary of results for front gardens (option 2) 443.5 Summary of results for non-domestic properties (option 3) 483.6 Summary of result for back gardens (option 4) 50
Chapter 4 54Consultation on approaches to implement permeable surfaces around buildings
4.1 Online survey 544.2 Interviews with stakeholders 554.3 Results of consultation 564.4 Conclusions to the consultation 65
Chapter 5 66Conclusion and recommendations
5.1 Results of CBA 665.2 Research to provide more robust data for the CBA 665.3 Recommendations from consultation 67
Appendix A 68Skill and availability of materials – permeable surfaces
Appendix B 70Infiltration rates and clogging of permeable surfaces
Appendix C 72Design references for pavement thickness or rain garden size
Appendix D 75Pavement design thickness or rain garden size
Appendix E 77Maintenance assumptions – not used in cost benefit analysis and provided for information only
Appendix F 83Assumptions made in costs estimates
Appendix G 86Summary of previous cost benefit analyses
Appendix H 91Summary of hydraulic benefits of permeable surfaces
Appendix J 92Flow charts for CBA
Appendix K 101Cost and benefits
Appendix L 104Details of CBA for each option considered
References 113
Executive summary | 5
Executive summary
The flooding experienced during the summer of 2007 demonstrated the challenges presented by our current approach to surface water management. These challenges are likely to increase in future as a result of climate change and a tendency to replace green areas such as gardens in cites with hard areas such as parking, buildings or extensions.
The use of permeable surfaces can help manage or reduce flooding and other adverse impacts associated with increased rainfall and runoff in urban areas. There are many different types of permeable surfaces including gravel, reinforced grass, concrete block permeable paving and porous asphalt. These allow the water to soak into the ground beneath or provide underground storage. Impermeable surfaces can also be drained in a more sustainable way by using soakaways and rain gardens that also allow water to soak into the ground beneath.
This report discusses the design, construction, maintenance and performance of the various surfaces together with associated quantification of costs and benefits. The use of permeable surfaces in all areas of the built environment can help to reduce the risk of flooding and pollution of watercourses. They also have many other environmental benefits.
Changes have been made to the permitted development rights (PDR) for homeowners so that front gardens can now be paved over with permeable materials without the need to apply for planning permission. The use of impermeable surfaces over 5m2 that drain direct to the sewer will require planning permission to be applied for. The Government is also considering extending this approach to back gardens and non-domestic buildings inline with recommendations from the Pitt flooding review (Cabinet Office, 2008).
The cost benefit analysis shows that overall introducing PDR for front gardens is more cost beneficial than for back gardens and domestic properties ie most scenarios and options analysed showed a positive NPV. This conclusion is based on only costs and benefits that could be quantified. However, taking into account the non monetised benefits excluded from the analysis, total benefits are likely to outweigh costs. Moreover, it is possible that the material and construction costs for the permeable surfaces will decrease considerably over time due to increased take up, economies of scale and greater competition between suppliers and installers.

6 | Understanding permeable and impermeable surfaces
Consultation with those within industry and regulation likely to be affected by the changes to the PDR indicates that there is a need to raise public awareness of the changes and of the differences between permeable and impermeable surfaces. In some instances local authorities are providing information through websites and at time of application for pathway/footpath crossovers.
It is also important to quickly raise awareness and provide training to installers about the changes to PDR approaches for permeable surfacing and ensure that the changes to PDR are enforced in a consistent manner across England.
Chapter 1 Introduction | 7
Chapter 1
Introduction
The flooding experienced during the summer of 2007 demonstrated the challenges presented by our current approach to surface water management (draining rainwater). The Foresight Future Flooding report (DTI 2004) and the Stern review (HM Treasury 2005) suggested that as a result of climate change the potential for surface water flooding and the impacts on people, environment and the economy are likely to grow in the future.
Urbanisation and the impact of urban creep (the development of green areas in and around towns and cities) is reducing the area of permeable ground. This can increase flood risk from surface water in many areas of the UK. Specific examples of urban creep include extensions and trends in building conservatories and (impermeable) paving for off street parking.
The flooding experienced during the summer of 2007 coupled with the recommendations in the Pitt Review (Cabinet Office 2008) have led to changes in householders’ permitted development rights. There is now a requirement for planning permission to pave domestic front gardens (greater than 5m2), unless using either permeable surfaces or impermeable surfaces that drain to a porous or permeable area that enables the water to soak into the ground (soakaway). The Government is also considering options for encouraging the use of permeable surfaces in non-domestic sectors.
1.1 Background and policy context
According to the Pitt Review (Cabinet Office 2008), paving over front and rear gardens is having a significant impact on the natural drainage of surface water in towns and cities because it reduces the volume of water soaking into the ground. Hard surfaces lead to accelerated runoff of surface water, which can overload sewerage systems in most urban areas. Ofwat estimates that about half the average annual sewerage flooding incidents are as a result of the capacity of the drainage system being exceeded.
The issue of surface water runoff is not just limited to flooding; it also concerns the significant quantities of pollutants that can be washed from impermeable surfaces. Urban runoff may contain pollution such as oils, petrol and heavy metals that come from vehicles, on-street activities such as car washing, car parks and

8 | Understanding permeable and impermeable surfaces
industrial estates. When rainwater washes these pollutants into streams or other water courses, they can reduce the water quality of these water bodies. There are also pollution discharges from combined sewerage overflows (CSOs) during flood events leading to an increase in diffuse pollution runoff into water courses.
The removal of the right of householders and business owners to lay impermeable surfaces was one of the recommendations of the Pitt Review. The Review proposed that householders would require planning permission if they chose impermeable surfaces, but not if they chose permeable surfaces such as gravel or permeable paving. Specifically Recommendation 9 of the Review states: “Householders should no longer be able to lay impermeable surfaces as of right on front gardens and the Government should consult on extending this to back gardens and business premises”.
The main objective of this study is to develop a cost benefit analysis (CBA) approach for assessing the contribution that changes to the permitted development rights (PDR) can make to surface water management and the implementation of permeable surfaces. The CBA process will consider the capital, operational as well as performance and potential benefits of introducing the proposed change. The CBA work will be complemented by an assessment of how changes to PDR may develop and how it could be successfully implemented through work with the supply chain and raising awareness. (Detailed spreadsheets of the CBA have been provided to the Communities and Local Government.)
This report also provides technical information to the Government to help gain an improved understanding of permeable and impermeable surfaces and their impact on surface water management. This includes information on the characteristics, design, suitability, costs and benefits of different surfaces (both permeable and impermeable) used in the built environment. The information provided will also help assess market readiness to respond to the changes in permitted development rights and options for improving market conditions throughout the supply-chain process for driveways and other areas of hardstanding.
1.2 Aims of the research
The overall aim of the research is to provide Communities and Local Government (the Department) a clear understanding of the different characteristics of various permeable and impermeable surfaces that can be used for paving front gardens and other domestic and non-domestic areas of hard standing. This includes:
Chapter 1 Introduction | 9
a. defining the range of permeable and impermeable surfaces and designs used for hard surfacing, and identification of their properties in terms of permeability, efficiency, and maintenance requirements
b. assessing relative life cycles and maintenance requirements of the different materials defined in (a)
c. current and estimated future uptake of materials defined in (a)
d. provide an assessment of the current and estimated future prices of the materials defined in (a)
e. assessing the sustainability of the materials defined in (a)
f. provide an overall cost benefit analysis of permeable versus impermeable materials
g. identifying the most cost effective ways of raising awareness of permeable surfacing and the new policy
h. assessing how quickly the paving industry can adapt to the changes
i. using market research techniques make an assessment of the readiness of the market (e.g. in terms of materials availability, expertise) to adapt to changes in legislation and an assessment of how long it might take for the market to be fully responsive
1.3 Rationale for using permeable surfaces
There are several different types of permeable surface (see section 2) that allow rain water to soak into the surface. The water is stored temporarily under the surface in the sub-base layer that is located below the surfacing (a storage layer). It is then allowed to slowly seep into the ground, or if the ground is unsuitable for this it flows to the drains. Even when connected to the drains the permeable surfaces act as a buffer to slow the rate of water flow and reduce the volume of water entering the drainage system. A lot of the rain that falls on permeable surfaces is soaked up into the blocks, asphalt or other materials and evaporates back into the air.
Permeable surfaces reduce:
• thetotalvolume
• thefrequencyand
• thepeakflowrate
of rainwater that enters drains and water courses. Thus they can help to reduce the impact of rainfall on the drainage system.
10 | Understanding permeable and impermeable surfaces
If sufficient area is covered by permeable surfaces it can help to reduce the risk of flooding from sewers and water courses. Quantitative information on the benefits of permeable surfaces is provided in Section 3. Some 68 percent of respondents to the Communities and Local Government consultation on this subject felt that there needed to be a national restriction on hard surfaces. Many existing sewers are at or beyond their capacity to accept rainwater. Climate change may increase the volumes of rainfall that occur and therefore the risk of flooding from sewers and water courses could very well increase, even without any extra areas contributing flows. Reducing the flow of rainwater by using permeable surfaces will therefore help to mitigate against the effects of climate change, although it should not be seen as the only solution.
The permitted development rights also allow extensions, garages, conservatories, etc that could potentially cover a greater area of gardens than driveways and other hard areas. The roofs of these structures behave as hard impermeable areas when rain falls and thus the impact of these on surface water flow to sewers could be greater than driveways.
In some areas and sites the use of permeable surfaces alone may not be feasible, for example due to the slope of the ground or the type of soil. Similar benefits can be achieved if impermeable surfaces are drained to soakaways or rain gardens or if permeable surfaces are connected to the drains and these are discussed later in this section.
Urban runoff may also contain pollution (Figure 1.1) that includes oil and heavy metals. When rainwater washes these into streams or other water courses they can cause pollution and reduce environmental quality.
Figure 1.1 Pollution in urban runoff
Chapter 1 Introduction | 11
Permeable surfaces and their underlying structures (and soakaways and rain gardens) provide mechanisms that encourage removal of pollution by filtration, sedimentation, adsorption (essentially pollutants “sticking” to soil or rock particles), chemical/biological treatment and storage. The local nature of the surface water inflows means that such flows are limited in magnitude and velocity, which improves the effectiveness of these treatment processes. Thus permeable surfaces have a beneficial effect on the environmental quality of water courses, which is where many surface water drains outfall. Further quantitative information on the costs of pollution and the performance of permeable surfaces is provided in Section 3.
It is also possible to drain impermeable surfaces in a more sustainable way, i.e. draining them to areas that slow down and reduce the volume of water entering the drains. Rain gardens or soakaways will be the most suitable for domestic driveways or for retrofitting to larger areas such as car parks. There are many factors that affect the choice of surfacing such as visual requirements, familiarity of contractors, soil conditions or the slope of the driveway and impermeable surfaces drained in a sustainable way may be the most appropriate solution in many cases.
Permeable surfaces can also contribute to wider sustainable water management if they are combined with rainwater harvesting (capturing rainwater for watering gardens or flushing toilets), reducing the demand for potable mains water. However the amount of water they contribute is much less than, for example, collecting roof water. This is because rainwater harvesting relies on collecting water from smaller, more frequent, rainfall events. There is no runoff into the storage from permeable surfaces for a lot of these events.
There are also a number of benefits to using permeable pavements that are difficult to monetise:
• additionalrechargingtoaquifers
• deferredinvestmentsinsewagetreatmentcapacity
• enhancementsinbiodiversity
• enhancedamenityvalue
12 | Understanding permeable and impermeable surfaces
1.4 Use of surfaces
This report only covers surfaces that are used mainly by light vehicle traffic, such as driveways and car parks. It is assumed that larger car parks will carry occasional HGV traffic (< 5 commercial vehicles per day) but it does not cover surfaces that are required to carry HGVs more frequently. Permeable surfaces can be designed to carry regular HGV traffic but the design is more dependent on site specific factors such as the strength of the soil and surfacing with permeable materials may not be best option in many cases. Permeable surfaces may also be unsuitable in industrial sites where the risk of clogging can be much greater than normal (this is not always true but does require careful consideration). This does not mean that these areas cannot be drained following the philosophy of sustainable drainage, but it does mean that other methods may be more appropriate (for example swales).
1.5 Myths about permeable surfaces
There are some common misconceptions about permeable surfaces:
• theycannotbeusedonclaysoils
• theyaredamagedbyfrost/freezinginwinter
• theyclogeasilyandstopworking
None of these are true. They can be used on clay soils but a piped outlet to the drains will be required rather than allowing all the water to soak into the ground. All the evidence from the mid west of the USA and Sweden shows that permeable surfaces are less susceptible to damage from frost and freezing than normal pavements surfaces. They do suffer a loss of permeability as the gaps in the surface fill with dust and other debris, but the clogging is very rarely sufficient to stop water draining through faster than it falls onto the surface. They are easily refreshed using road sweepers if this does occur.
Chapter 2 Range of surfaces | 13
Chapter 2
Range of surfaces
2.1 Definition of surface types
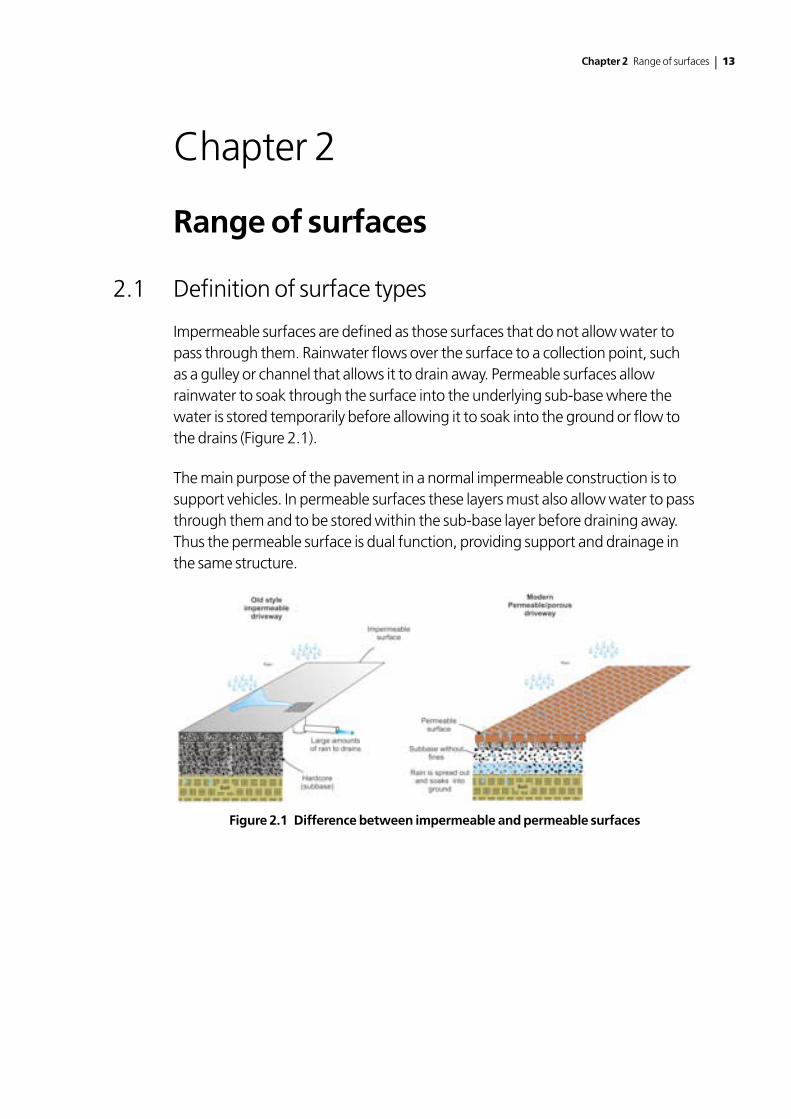
Impermeable surfaces are defined as those surfaces that do not allow water to pass through them. Rainwater flows over the surface to a collection point, such as a gulley or channel that allows it to drain away. Permeable surfaces allow rainwater to soak through the surface into the underlying sub-base where the water is stored temporarily before allowing it to soak into the ground or flow to the drains (Figure 2.1).
The main purpose of the pavement in a normal impermeable construction is to support vehicles. In permeable surfaces these layers must also allow water to pass through them and to be stored within the sub-base layer before draining away. Thus the permeable surface is dual function, providing support and drainage in the same structure.
Figure 2.1 Difference between impermeable and permeable surfaces
14 | Understanding permeable and impermeable surfaces
2.2 Surface materials
2.2.1 Impermeable surfacesThe three impermeable surfacing materials that are most commonly used on driveways and car parks at present are:
• asphalt
• concrete
• concrete/clayblockspaving
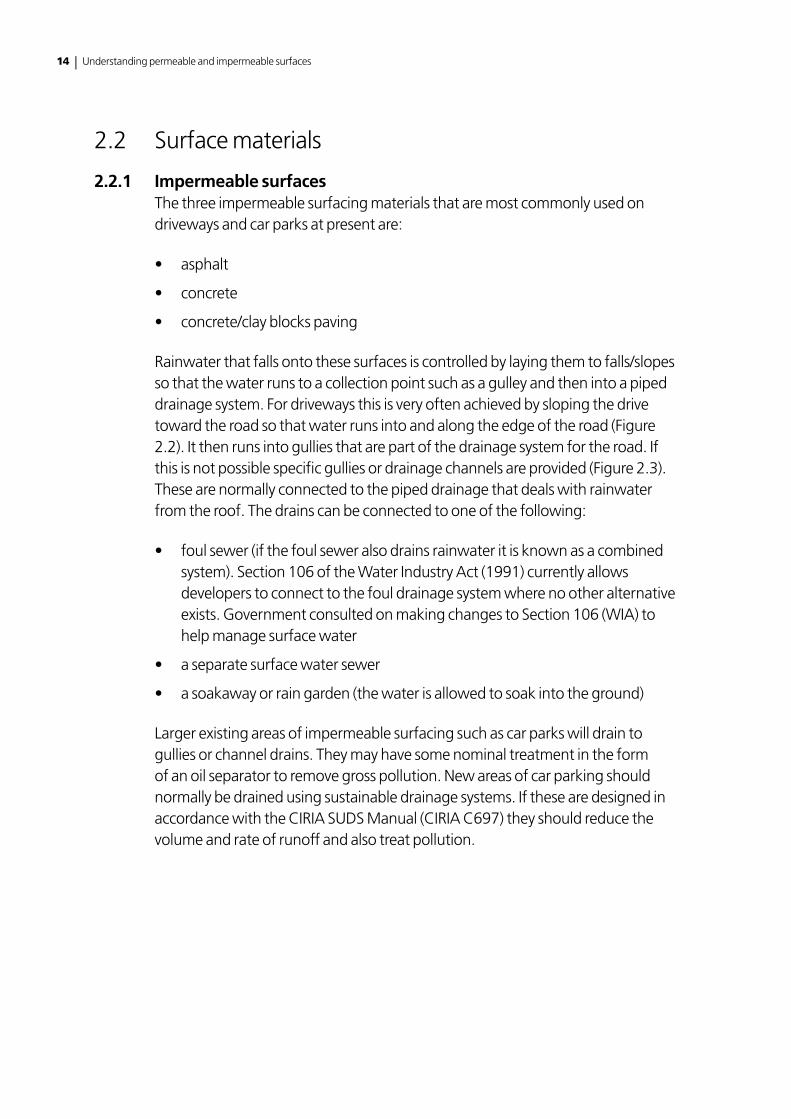
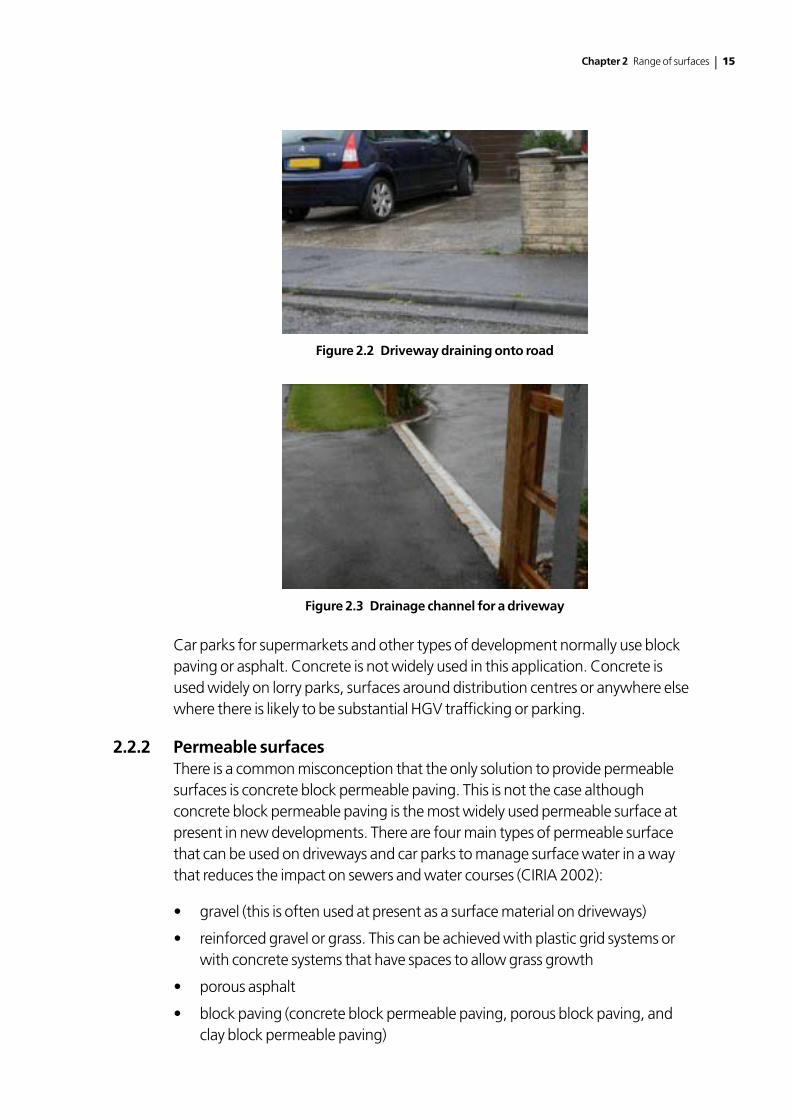
Rainwater that falls onto these surfaces is controlled by laying them to falls/slopes so that the water runs to a collection point such as a gulley and then into a piped drainage system. For driveways this is very often achieved by sloping the drive toward the road so that water runs into and along the edge of the road (Figure 2.2). It then runs into gullies that are part of the drainage system for the road. If this is not possible specific gullies or drainage channels are provided (Figure 2.3). These are normally connected to the piped drainage that deals with rainwater from the roof. The drains can be connected to one of the following:
• foulsewer(ifthefoulseweralsodrainsrainwateritisknownasacombinedsystem). Section 106 of the Water Industry Act (1991) currently allows developers to connect to the foul drainage system where no other alternative exists. Government consulted on making changes to Section 106 (WIA) to help manage surface water
• aseparatesurfacewatersewer
• asoakawayorraingarden(thewaterisallowedtosoakintotheground)
Larger existing areas of impermeable surfacing such as car parks will drain to gullies or channel drains. They may have some nominal treatment in the form of an oil separator to remove gross pollution. New areas of car parking should normally be drained using sustainable drainage systems. If these are designed in accordance with the CIRIA SUDS Manual (CIRIA C697) they should reduce the volume and rate of runoff and also treat pollution.
Chapter 2 Range of surfaces | 15
Figure 2.2 Driveway draining onto road
Figure 2.3 Drainage channel for a driveway
Car parks for supermarkets and other types of development normally use block paving or asphalt. Concrete is not widely used in this application. Concrete is used widely on lorry parks, surfaces around distribution centres or anywhere else where there is likely to be substantial HGV trafficking or parking.
2.2.2 Permeable surfacesThere is a common misconception that the only solution to provide permeable surfaces is concrete block permeable paving. This is not the case although concrete block permeable paving is the most widely used permeable surface at present in new developments. There are four main types of permeable surface that can be used on driveways and car parks to manage surface water in a way that reduces the impact on sewers and water courses (CIRIA 2002):
• gravel(thisisoftenusedatpresentasasurfacematerialondriveways)
• reinforcedgravelorgrass.Thiscanbeachievedwithplasticgridsystemsorwith concrete systems that have spaces to allow grass growth
• porousasphalt
• blockpaving(concreteblockpermeablepaving,porousblockpaving,andclay block permeable paving)
16 | Understanding permeable and impermeable surfaces
The main applications at present are in car parks to commercial, leisure and similar developments and communal parking areas for housing. Drainage of impermeable driveway surfaces in a sustainable way can also be achieved by using features such as rain gardens or soakaways. These can be considered when permeable surfaces are not a suitable solution.
There may be some sites where none of these options are technically suitable for driveways and normal drainage is the most suitable option (e.g. sloping sites in clay soils where a driveway slopes towards a house and there is limited room to install a rain garden). In these cases it may be possible to install small scale attenuation systems and it is possible the paving industry may respond to the legislation with new methods of achieving the desired objectives. For larger areas such as car parks if permeable surfaces are not suitable there will be some other form of sustainable drainage that can be used.
2.3 Terminology
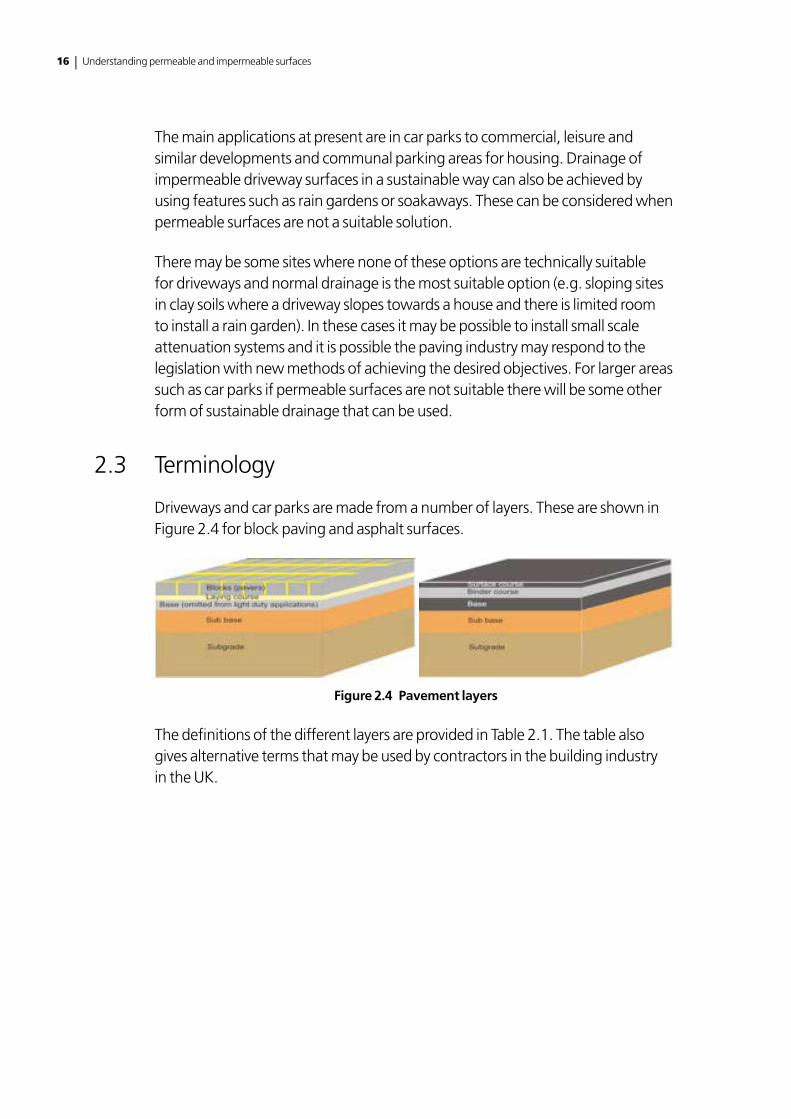
Driveways and car parks are made from a number of layers. These are shown in Figure 2.4 for block paving and asphalt surfaces.
Figure 2.4 Pavement layers
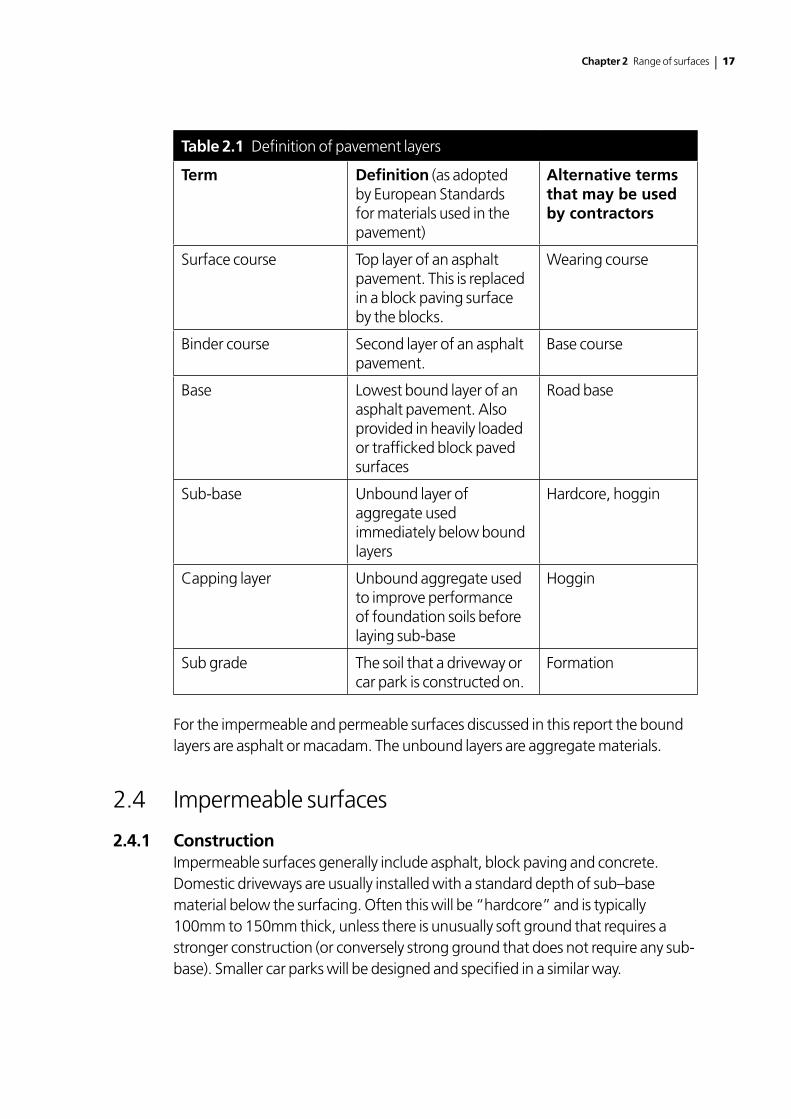
The definitions of the different layers are provided in Table 2.1. The table also gives alternative terms that may be used by contractors in the building industry in the UK.
Chapter 2 Range of surfaces | 17
Table 2.1 Definition of pavement layers
Term Definition (as adopted by European Standards for materials used in the pavement)
Alternative terms that may be used by contractors
Surface course Top layer of an asphalt pavement. This is replaced in a block paving surface by the blocks.
Wearing course
Binder course Second layer of an asphalt pavement.
Base course
Base Lowest bound layer of an asphalt pavement. Also provided in heavily loaded or trafficked block paved surfaces
Road base
Sub-base Unbound layer of aggregate used immediately below bound layers
Hardcore, hoggin
Capping layer Unbound aggregate used to improve performance of foundation soils before laying sub-base
Hoggin
Sub grade The soil that a driveway or car park is constructed on.
Formation
For the impermeable and permeable surfaces discussed in this report the bound layers are asphalt or macadam. The unbound layers are aggregate materials.
2.4 Impermeable surfaces
2.4.1 ConstructionImpermeable surfaces generally include asphalt, block paving and concrete. Domestic driveways are usually installed with a standard depth of sub–base material below the surfacing. Often this will be “hardcore” and is typically 100mm to 150mm thick, unless there is unusually soft ground that requires a stronger construction (or conversely strong ground that does not require any sub-base). Smaller car parks will be designed and specified in a similar way.
18 | Understanding permeable and impermeable surfaces
Larger car parks to supermarkets, retail parks, leisure facilities, etc may be designed using the design guidance available for block paving and asphalt areas:
• QuarryProductsAssociation(2006),Constructionandsurfacingofcarparking areas including private drives. Asphalt information service.
• BritishStandardsInstitution(2001),Pavementsconstructedwithclay,natural stone or concrete pavers. Part 2: Guide for the structural design of lightly trafficked pavements constructed of clay pavers or precast concrete paving blocks.
Often in larger car parks and similar areas the pavement will be a minimum thickness of 450mm overall to prevent damage to the underlying soils by frost penetration. This criteria is not normally applied to smaller areas and driveways because the cost of providing such a thick construction outweighs the risk of frost damage occurring and the cost of repairing it.
There is no readily available design guidance for simple concrete slab driveways (according to Interpave, 2006). They are normally 100mm to 150mm concrete slabs that may have up to 100mm of sub-base below, depending on soil conditions.
2.4.2 DrainageDrainage of driveways with impermeable surfaces is often achieved by allowing them to slope towards the road or to a lawn or similar area (i.e. there is no specific drainage provision). Larger driveways or where a drive slopes towards a house may be provided with specific drainage that is connected into the roof drainage. Specific drainage using gullies or channels is provided in car parks and similar large areas.
Large car parks are normally provided with an oil separator to try and reduce the pollution in the runoff from the car park.
2.4.3 Skills and availability of materialsAll of the materials required to construct impermeable surfaces (and used in the pavement specifications in Section 3) are readily available in any quantity from a range of suppliers. Larger quantities can be obtained direct from producers and smaller quantities are available from builder’s merchants and DIY superstores. The construction industry has a wealth of experience in constructing these surfaces from the smallest builder up to the largest contractors. As a result of this experience the prices for the materials are well known and those used in the CBA are based on typical industry values.
Chapter 2 Range of surfaces | 19
2.4.4 Durability and design lifeAll of the impermeable surface materials are durable when used in driveways and car parks (providing they are specified and installed correctly). Almost all of the data and information relating to the durability of these materials has been derived from their use in roads. These are in general far more heavily trafficked than driveways and car parks and so any estimates for the life of lightly trafficked areas based on this data are likely to be conservative.
Block paving and asphalt are designed to have a total life of 20 years before total reconstruction is required (ie replacement of all layers including the sub-base). However if these surfaces are only trafficked by cars and have been constructed correctly they may last much longer than 20 years. Asphalt surfaces may require intermediate maintenance after 10 years in the form of resurfacing (this requires the top 20mm to 40mm to be planed off and replaced to restore skid resistance and visual appearance or because of health and safety reasons).
Surfaces that carry HGV’s are normally designed to be totally reconstructed after 20 years (for asphalt and block paving) or 40 years (concrete). There is some evidence that block paving may also last for 40 years before requiring reconstruction (Interpave 2006).
When the surfaces are used in driveways and small car parks the materials are likely to last at least 20 years and there are many examples of driveways that have survived far in excess of this period. There are examples of concrete driveways that are still in good condition after 40 years. Driveways are normally replaced because of poor visual appearance rather than as a result of failing to provide support to cars.
The Environment Agency (2007) suggests that tarmac will be completely dug out at end of its life rather than overlaid and that maintenance of permeable surfaces costs less. For the purposes of this report it assumed that pavements will be fully reconstructed at the end of their life which is considered to be worst case.
2.4.5 Maintenance requirementsWhere driveways slope towards a road or lawn there is no specific maintenance requirement. Where specific drainage with gullies or channels is provided these will require cleaning out on a regular basis (although this rarely occurs until a blockage occurs and jetting may then be required to clean them out).
In large car parks the gullies, channels and oil separators will require more regular maintenance. The gullies and channels may require removal of accumulated oil and silt every six to twelve months typically (Daywater 2006) although this may not be done on many sites until a blockage occurs. Larger car parks may also require regular sweeping (with a road sweeper) to remove dust and litter from
20 | Understanding permeable and impermeable surfaces
the surface in order to maintain an acceptable visual appearance. Oil separators require maintenance every six months to remove accumulated oil and silt (Environment Agency 2006).
Interpave (2006a) suggest that the gullies and channels on larger car parks will require an inspection and cleaning as necessary and allowed for this to happen once every ten years. For this report the costs of cleaning the oil separator are deemed to be included with the gulley emptying as the operation will probably be based on a visit to site by a gulley sucker that can empty anything that is required. The assumptions made about maintenance for the cost benefit analysis are discussed in section 3.
2.5 Permeable surfaces
2.5.1 ConstructionThe design and specification of the sub-base depth is slightly more complicated than for impermeable surfaces because the sub-base has a dual function:
• tosupportthevehicleloads
• toprovidedrainageandwaterstoragecapacity
Gravel is probably the most commonly used permeable surface on domestic driveways at present. There is no specific guidance on the construction of gravel drives, and it will be based on a contractors experience and knowledge of a local area. The most commonly used ‘hard’ permeable pavement surface at present is concrete block permeable paving. These surfaces are designed and constructed following either guidance provided by Interpave or to specific recommendations from individual manufacturers.
There is very limited generic guidance on the design and construction of the other types of permeable surface. Most guidance is provided by individual manufacturers for their products and the specifications used for the costing are based on typical examples (see Section 3).
The depth of sub-base in driveways below all these types of systems is likely to be 150mm to 200mm depth as a minimum. The greater depth compared to impermeable surfaces is because the presence of water in the pavement layers will reduce its strength. To compensate for this a thicker construction is necessary.
The sub-base used below the permeable surfaces is different to that used below impermeable surfaces. Normal sub-base (known as Type 1 or hardcore) has fine material in between the larger stones to make it stronger (but this stops water flowing through it quickly). Permeable surfaces use a sub-base that is known
Chapter 2 Range of surfaces | 21
as open graded. This means that it comprises only larger particles of stone with spaces between them that allow water storage and flow through it quickly. There are various specifications for open graded materials:
1. Interpave (2007) specify a material known as 4/20 (this means the stones are mainly 4mm to 20mm diameter).
2. Block paving manufacturers also have their own individual specifications for similar materials (for example Formpave Limited).
3. Type 3 sub-base from the Highways Agency Specification for Highway Works (Highways Agency 2004).
4. Type A filter material (0mm/20mm) from the Specification for Highway Works, modified to limit the amount of fine particles. This may be suitable as it is similar to specifications used in Belgium and Australia (Beeldens 2006 and Shackel 2008). There is no real experience of using this material in pavements in the UK but it may be more readily available than the other materials because it is used in drainage works.
The construction of permeable surfaces follows the same process as impermeable surfaces, ie the materials need to be laid and compacted. On driveways the construction process should not affect the costs of installation. However on larger car parks where the sub-base is normally used as a road for construction traffic there may be a cost implication because the contractor may have to change their method of working to avoid running construction traffic on the open sub-base (it clogs with mud). Alternatively they will have to protect the sub-base, for example by laying impermeable asphalt over it and then punching holes in the asphalt afterwards to allow water to soak into it before laying the final surface (Interpave 2007).
2.5.2 DrainageDrainage of impermeable surfaces is achieved by allowing water to soak into the surface. The water passes into the underlying sub-base where it is stored temporarily. The water then soaks into the ground or flows into the drains, depending on the type of soil below a site.
There is no need for gullies, channels or oil separators with permeable surfaces. Permeable surfaces that are designed and constructed correctly do not have standing water on the surface when it rains. In comparison impermeable surfaces with normal drainage frequently have puddles on the surface when it rains. Permeable surfaces can generally deal with rainfall events in excess of a 1 in 100 year rainfall event (ie they can deal with extreme and intense rainfall).
22 | Understanding permeable and impermeable surfaces
2.5.3 Skills and availability of materialsThe experience of the construction industry in installing permeable surfaces and the availability of materials depends on the type of surface material. The current situation is summarised in Appendix A. The skills required to install the surfaces are no different to those required for permeable surfaces. The main issue is in understanding that different materials are used (especially the different sub-base material and porous asphalt). This has been raised by the industry as a significant issue that needs to be addressed. Therefore there is an urgent need for education and raising awareness, rather than learning new skills to lay these surfaces.
All the materials discussed are available from suppliers and are commonly used on larger development projects. The materials can also be used on domestic driveways but at present there is not a widespread knowledge of their availability and they are not widely stocked in DIY stores or builders merchants. However this situation is likely to quickly change in response to the new legislation on permitted development rights, because the products are already made.
2.5.4 Durability and design lifeFrom a structural point of view a correctly designed and constructed hard permeable surface (concrete block permeable paving and porous asphalt) should have the same design life as impermeable surfaces (Interpave 2006b). Gravel and reinforced gravel/grass may have a shorter design life than the hard materials.
The main factor that affects the durability of permeable surfaces is clogging of the surface. In theory the surfaces clog if they are not maintained. However there is increasing evidence that the surfaces do not clog completely, even if they are not maintained (Interpave 2007, CIRIA 2002, Ferguson 2005, Daywater 2006). Thus they should have an operational life comparable to impermeable surfaces.
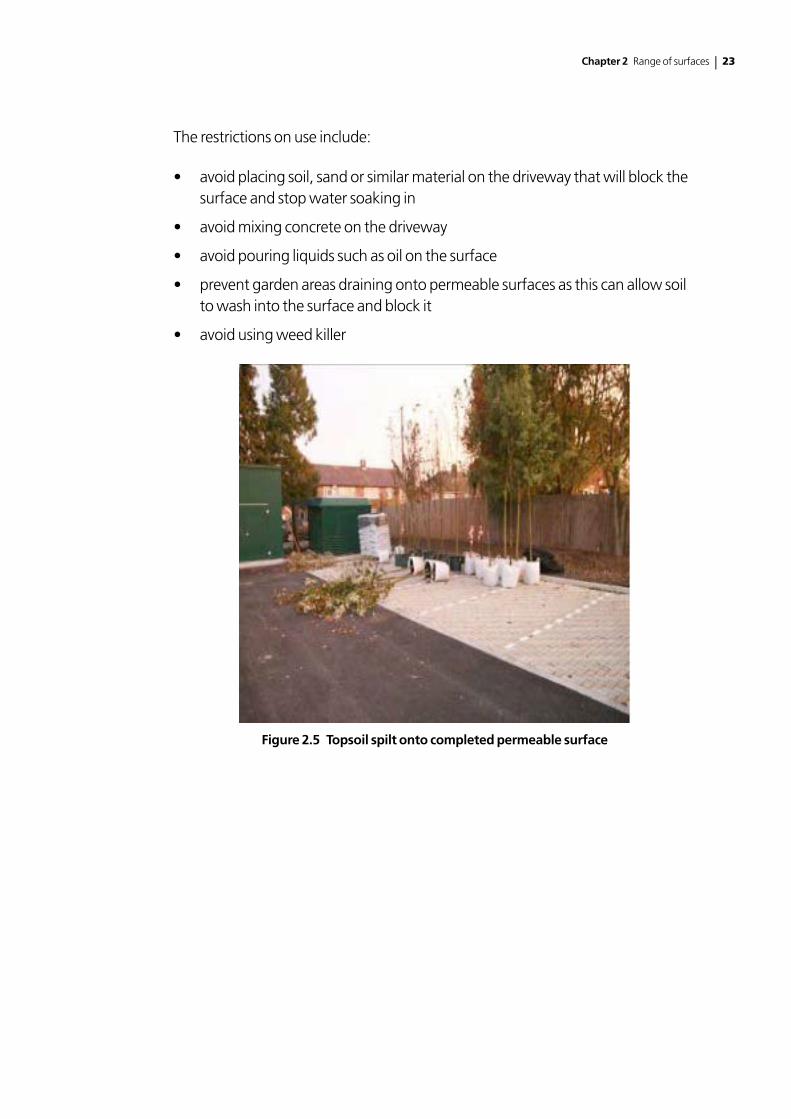
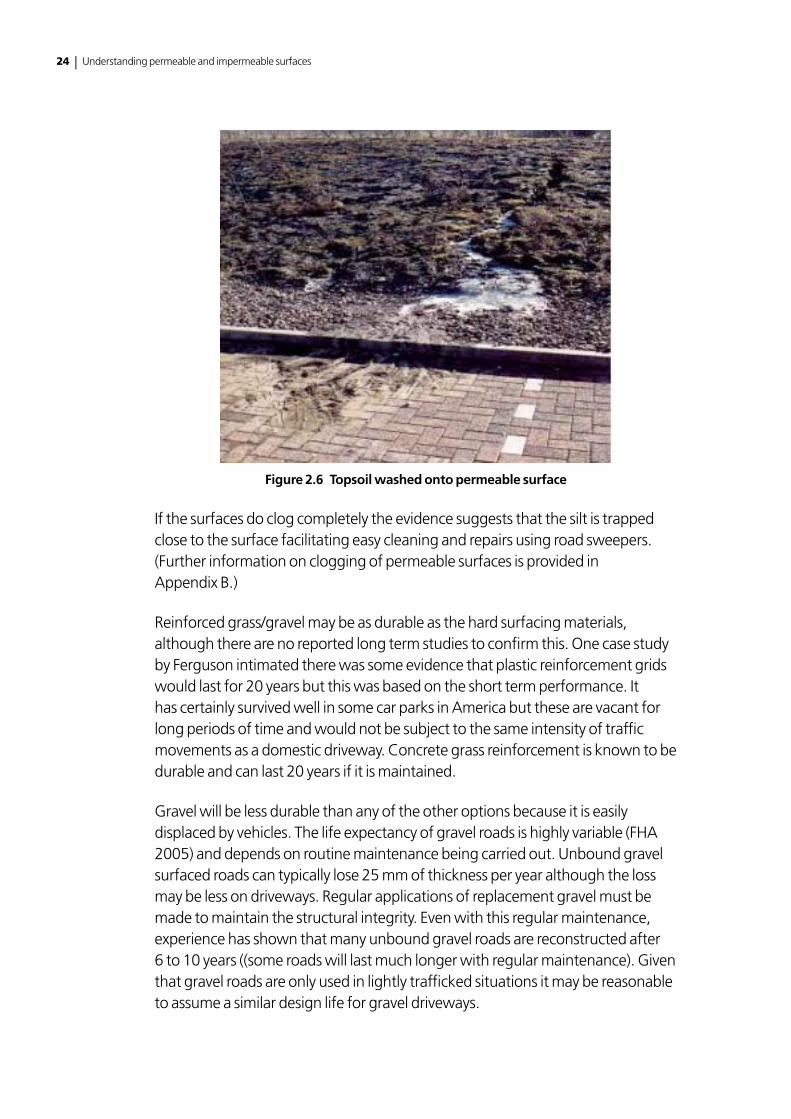
The main source of clogging is construction traffic compressing mud and dirt into the surface, contractors spilling dirt on the completed surface (Figure 2.5) and inappropriate landscape design that allows dirt to be washed from flower beds, etc (Figure 2.6) onto the surface (Interpave 2007). Clogging may be more significant an issue on domestic driveways if they are mistreated (for example by mixing concrete on them) and there is a need for education to help people understand what they can and cannot do on permeable surfaces (this is included in the Guidance on permeable surfacing of front gardens (CLG 2008)).
There is a need to educate the public about these surfaces and how they can be damaged and the need to look after them.
Chapter 2 Range of surfaces | 23
The restrictions on use include:
• avoidplacingsoil,sandorsimilarmaterialonthedrivewaythatwillblockthesurface and stop water soaking in
• avoidmixingconcreteonthedriveway
• avoidpouringliquidssuchasoilonthesurface
• preventgardenareasdrainingontopermeablesurfacesasthiscanallowsoilto wash into the surface and block it
• avoidusingweedkiller
Figure 2.5 Topsoil spilt onto completed permeable surface
24 | Understanding permeable and impermeable surfaces
Figure 2.6 Topsoil washed onto permeable surface
If the surfaces do clog completely the evidence suggests that the silt is trapped close to the surface facilitating easy cleaning and repairs using road sweepers. (Further information on clogging of permeable surfaces is provided in Appendix B.)
Reinforced grass/gravel may be as durable as the hard surfacing materials, although there are no reported long term studies to confirm this. One case study by Ferguson intimated there was some evidence that plastic reinforcement grids would last for 20 years but this was based on the short term performance. It has certainly survived well in some car parks in America but these are vacant for long periods of time and would not be subject to the same intensity of traffic movements as a domestic driveway. Concrete grass reinforcement is known to be durable and can last 20 years if it is maintained.
Gravel will be less durable than any of the other options because it is easily displaced by vehicles. The life expectancy of gravel roads is highly variable (FHA 2005) and depends on routine maintenance being carried out. Unbound gravel surfaced roads can typically lose 25 mm of thickness per year although the loss may be less on driveways. Regular applications of replacement gravel must be made to maintain the structural integrity. Even with this regular maintenance, experience has shown that many unbound gravel roads are reconstructed after 6 to 10 years ((some roads will last much longer with regular maintenance). Given that gravel roads are only used in lightly trafficked situations it may be reasonable to assume a similar design life for gravel driveways.
Chapter 2 Range of surfaces | 25
2.5.5 MaintenanceBecause the permeable surface is acting as a drainage system, as well as supporting vehicles, it requires a different maintenance regime to impermeable materials. On larger car parks the maintenance for permeable surfaces is no more onerous and at best is less onerous than that for impermeable surfaces.
On driveways the maintenance required for permeable surfaces may in theory be more onerous than for impermeable surfaces. In practice however it will be carried out by the householder and mainly involves weeding and cleaning (which are needed anyway to maintain the appearance of impermeable surfaces) so there is unlikely to be a significant cost differential.
The maintenance requirements that are currently considered necessary are:
• cleanupleaves,mudandlitterbeforetheyhaveachancetoclogthesurface
• brushthesurfaceifanydirtcollectsonitandthiswillreducetheriskofitblocking and help stop weeds growing. For larger car parks this should be done twice a year (Interpave 2006a, Daywater 2006)
• removeweedsbyhandorwithaweedburnerifpossible
There is a lot of data suggesting that these types of surface are very robust and in most cases do not completely clog (see previous section). There are examples of all types of permeable surface that have not been maintained and are still providing adequate drainage. The maintenance requirements can therefore be considered the maximum that is required.
If the surfaces do clog and stop draining in most cases it is possible to repair them using a road sweeper (Robinson 2007). Remedial cleaning requires a combination of spraying at high pressure and vacuuming (Daywater 2006) and specific machines are available to do this (Balades et al 1995). In some cases this may not be successful if the clogging is particularly severe. In these situations the surface material may need to be lifted (in the case of blocks and reinforced grass) and re-laid with clean laying course. Porous asphalt would require the top surface course to be planed off and replaced.
Reinforced grass will require mowing (Ferguson 2005) but on driveways this will be carried out by the owner and so there is no particular cost attached to it. The need to mow may well influence the choice of surface as in many cases gardens are paved over to reduce maintenance requirements as well as provide parking spaces.
26 | Understanding permeable and impermeable surfaces
The mowing may not be a substantial cost in small car parks as it would be completed at the same time as mowing of other landscaped areas. Reinforced gravel will need raking and shovelling of gravel back into place once a year, which Ferguson estimated would take around 4 to 6 man hours per year.
Gravel driveways will require some gravel replacing each year and the surface re grading.
2.6 Uptake of permeable materials
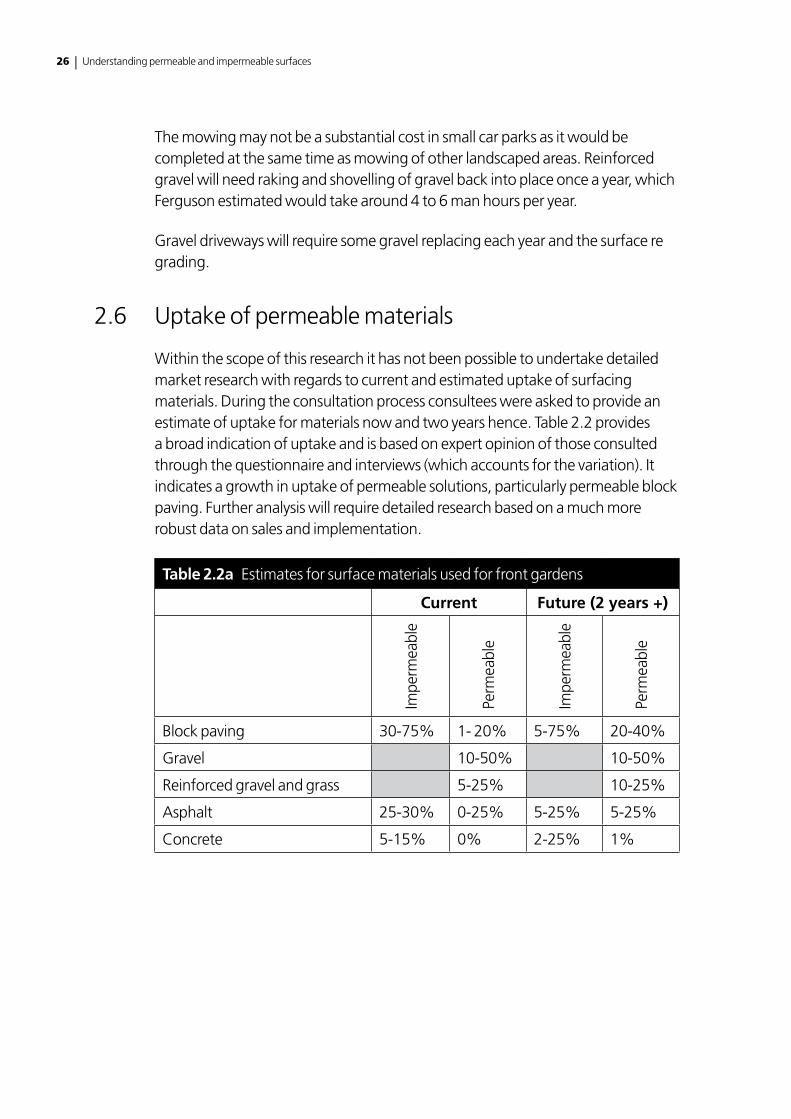
Within the scope of this research it has not been possible to undertake detailed market research with regards to current and estimated uptake of surfacing materials. During the consultation process consultees were asked to provide an estimate of uptake for materials now and two years hence. Table 2.2 provides a broad indication of uptake and is based on expert opinion of those consulted through the questionnaire and interviews (which accounts for the variation). It indicates a growth in uptake of permeable solutions, particularly permeable block paving. Further analysis will require detailed research based on a much more robust data on sales and implementation.
Table 2.2a Estimates for surface materials used for front gardens
Current Future (2 years +)
Impe
rmea
ble
Perm
eabl
e
Impe
rmea
ble
Perm
eabl
e
Block paving 30-75% 1- 20% 5-75% 20-40%
Gravel 10-50% 10-50%
Reinforced gravel and grass 5-25% 10-25%
Asphalt 25-30% 0-25% 5-25% 5-25%
Concrete 5-15% 0% 2-25% 1%
Chapter 2 Range of surfaces | 27
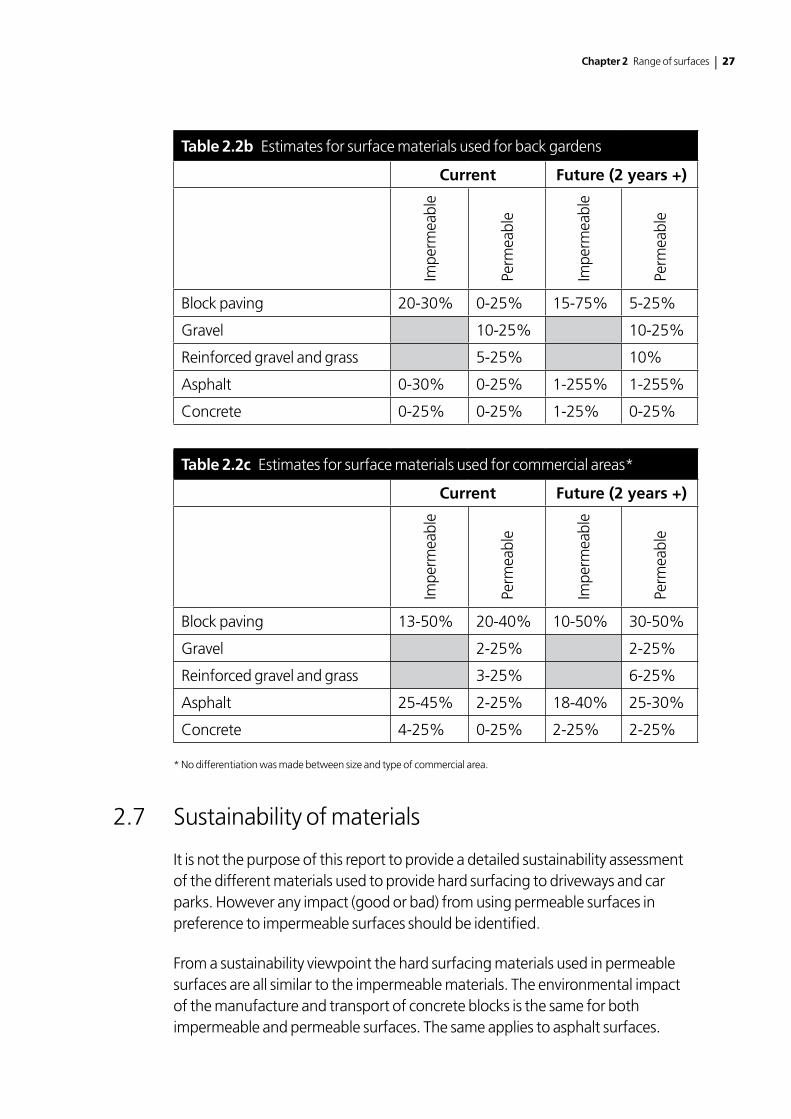
Table 2.2b Estimates for surface materials used for back gardens
Current Future (2 years +)
Impe
rmea
ble
Perm
eabl
e
Impe
rmea
ble
Perm
eabl
e
Block paving 20-30% 0-25% 15-75% 5-25%
Gravel 10-25% 10-25%
Reinforced gravel and grass 5-25% 10%
Asphalt 0-30% 0-25% 1-255% 1-255%
Concrete 0-25% 0-25% 1-25% 0-25%
Table 2.2c Estimates for surface materials used for commercial areas*
Current Future (2 years +)
Impe
rmea
ble
Perm
eabl
e
Impe
rmea
ble
Perm
eabl
e
Block paving 13-50% 20-40% 10-50% 30-50%
Gravel 2-25% 2-25%
Reinforced gravel and grass 3-25% 6-25%
Asphalt 25-45% 2-25% 18-40% 25-30%
Concrete 4-25% 0-25% 2-25% 2-25%
* No differentiation was made between size and type of commercial area.
2.7 Sustainability of materials
It is not the purpose of this report to provide a detailed sustainability assessment of the different materials used to provide hard surfacing to driveways and car parks. However any impact (good or bad) from using permeable surfaces in preference to impermeable surfaces should be identified.
From a sustainability viewpoint the hard surfacing materials used in permeable surfaces are all similar to the impermeable materials. The environmental impact of the manufacture and transport of concrete blocks is the same for both impermeable and permeable surfaces. The same applies to asphalt surfaces.
28 | Understanding permeable and impermeable surfaces
Further information on the environmental rating of the different surfaces is provided in The Green Guide to Specification (Anderson and Shiers, 2002 ), The Green Guide to Housing Specification (Anderson and Howard, 2007) and at www.thegreenguide.org.uk.
There may be slightly more aggregate required in the construction of permeable surfaces (the sub-base is generally thicker for a given surfacing material). The aggregate also needs to be high quality crushed rock or similar material which means that in many cases a natural resource has to be used up. There can be increased impacts from transporting the materials from the source to the site, depending on locations. It is easier to use recycled crushed concrete as sub-base to impermeable surfaces than it is for permeable surfaces.
Similarly the thicker sub-base required for permeable surfaces means that greater volumes of soil will be removed and transported to a disposal site which will have an increased environmental impact over impermeable surfaces.
Chapter 3 Cost benefit analysis | 29
Chapter 3
Cost benefit analysis
3.1 Cost assumptions
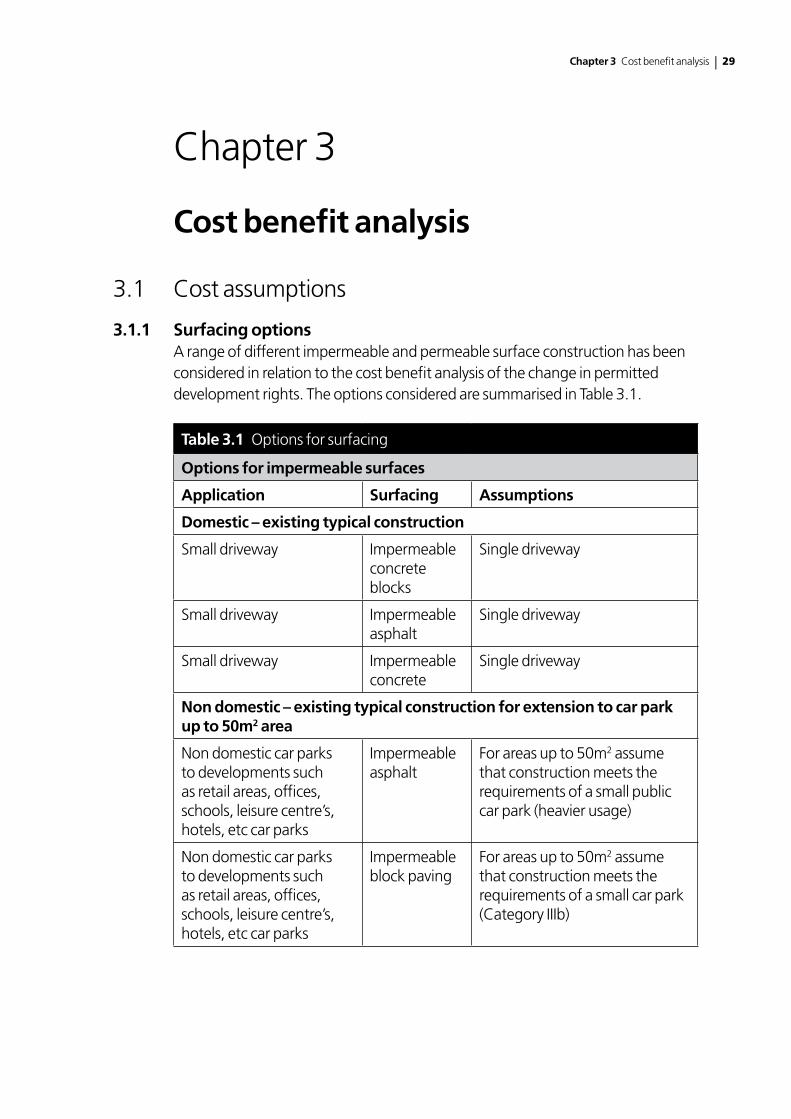
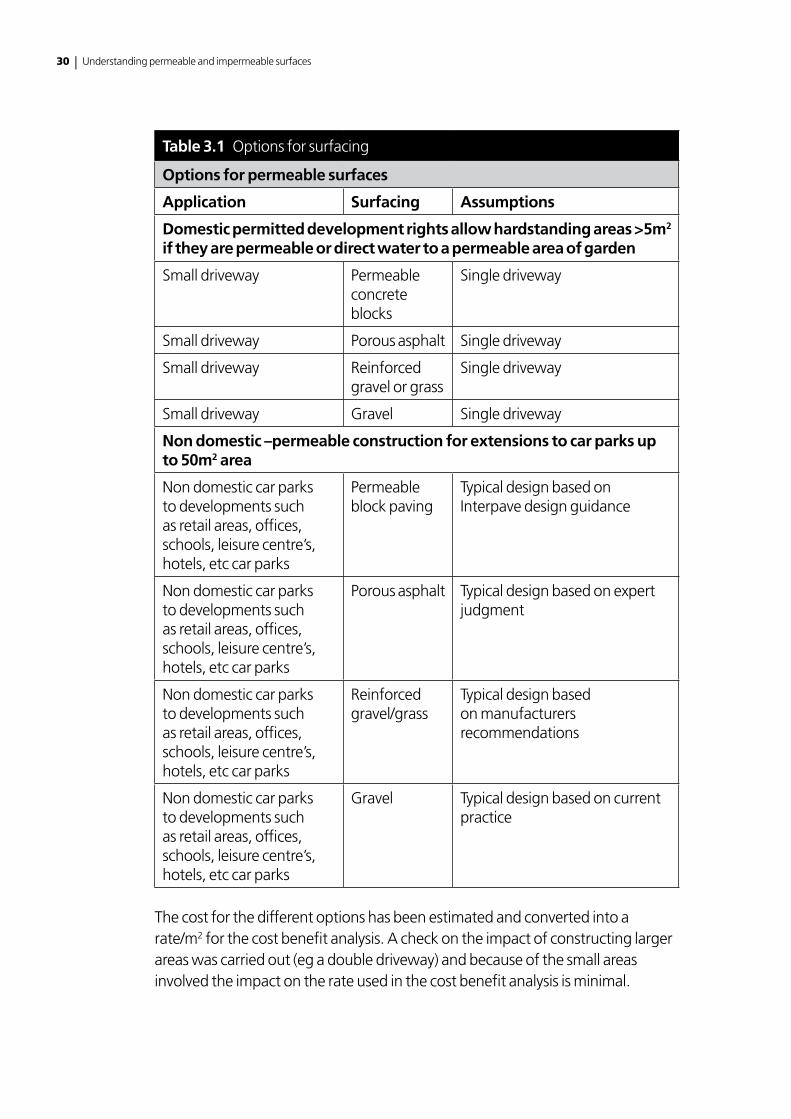
3.1.1 Surfacing optionsA range of different impermeable and permeable surface construction has been considered in relation to the cost benefit analysis of the change in permitted development rights. The options considered are summarised in Table 3.1.
Table 3.1 Options for surfacing
Options for impermeable surfaces
Application Surfacing Assumptions
Domestic – existing typical construction
Small driveway Impermeable concrete blocks
Single driveway
Small driveway Impermeable asphalt
Single driveway
Small driveway Impermeable concrete
Single driveway
Non domestic – existing typical construction for extension to car park up to 50m2 area
Non domestic car parks to developments such as retail areas, offices, schools, leisure centre’s, hotels, etc car parks
Impermeable asphalt
For areas up to 50m2 assume that construction meets the requirements of a small public car park (heavier usage)
Non domestic car parks to developments such as retail areas, offices, schools, leisure centre’s, hotels, etc car parks
Impermeable block paving
For areas up to 50m2 assume that construction meets the requirements of a small car park (Category IIIb)
30 | Understanding permeable and impermeable surfaces
Table 3.1 Options for surfacing
Options for permeable surfaces
Application Surfacing Assumptions
Domestic permitted development rights allow hardstanding areas >5m2 if they are permeable or direct water to a permeable area of garden
Small driveway Permeable concrete blocks
Single driveway
Small driveway Porous asphalt Single driveway
Small driveway Reinforced gravel or grass
Single driveway
Small driveway Gravel Single driveway
Non domestic –permeable construction for extensions to car parks up to 50m2 area
Non domestic car parks to developments such as retail areas, offices, schools, leisure centre’s, hotels, etc car parks
Permeable block paving
Typical design based on Interpave design guidance
Non domestic car parks to developments such as retail areas, offices, schools, leisure centre’s, hotels, etc car parks
Porous asphalt Typical design based on expert judgment
Non domestic car parks to developments such as retail areas, offices, schools, leisure centre’s, hotels, etc car parks
Reinforced gravel/grass
Typical design based on manufacturers recommendations
Non domestic car parks to developments such as retail areas, offices, schools, leisure centre’s, hotels, etc car parks
Gravel Typical design based on current practice
The cost for the different options has been estimated and converted into a rate/m2 for the cost benefit analysis. A check on the impact of constructing larger areas was carried out (eg a double driveway) and because of the small areas involved the impact on the rate used in the cost benefit analysis is minimal.
Chapter 3 Cost benefit analysis | 31
There is a huge variety of surfaces and designs that are used in back gardens and a significant proportion of patio, etc will be completed as DIY projects. The construction below the surface is also generally thinner in back gardens and therefore the cost differences between the use of impermeable and permeable materials for back gardens are based on a simple percentage increase in the cost of materials, rather than considering costs based on example construction details.
3.1.2 DesignThe design standards and references used for the different surfaces are summarised in Appendix C. Where available, recognised UK guidance documents have been used as the basis for the designs. If standards are not available the design is based on typical practice (e.g. for gravel driveways). The use of design standards and recognised good practice should help reduce the liabilities for manufacturers and contractors and other stakeholders involved in the implementation of permeable surfaces.
The thickness of each layer used in the designs is summarised in Appendix D. The pavement designs are based on a single CBR value of 5 per cent (CBR is a measure of the strength of the soil and 5 per cent is a reasonable value for many soils in the UK and in practice the majority of driveways that are installed have a sub-base thickness appropriate to this value). This assumption will have no significant effect on the cost benefit analysis because the strength of the soil only affects the thickness of the pavement construction below the surface (the thickness of the sub-base). The effects of weaker soils in terms of costs will therefore be similar for all surfaces.
The designs included in Appendix D for commercial areas mainly apply to new large areas of hard standing. The proposed permitted development rights for non-domestic areas only cover areas up to 50m2 (i.e. an area of 5m by 10m or four parking bays), except for industrial sites where they will apply to areas up to 100m2. The design of such a small area is unlikely to be based on the heavier loaded situations. Therefore the pavement designs for the heavier loaded areas are not used in the cost benefit analysis and are provided for information only.
3.1.3 MaintenanceThe costs for maintenance are based on the information discussed in section 2. The assumptions made regarding maintenance requirements for costing purposes are summarised in Appendix E. For domestic driveways it has been assumed that in reality very little maintenance will be carried out by private owners and this has been ignored for all options in the cost benefit analysis.
For larger car parks the maintenance regimes proposed by Interpave (2006a) are considered to be appropriate. These requirements were base on assumptions about what maintenance would be required to meet specific drivers (e.g. health
32 | Understanding permeable and impermeable surfaces
and safety requirements). They were confirmed by interviews with supermarket building services managers. However these will probably only apply to large car parks in practice and it has been assumed that for the smaller areas covered by the proposed permitted development rights for non-domestic situations (between 50m2 and 100m2 ) that no maintenance will be carried out for any of the surfaces.
3.1.4 Construction and maintenance costsThe cost of constructing impermeable and permeable driveways and car parks up to 50m2 has been estimated based on the costs of materials, plant and labour. The construction and maintenance costs for all types of surface are very difficult to accurately estimate for a cost benefit analysis. This is because the construction details and costs will vary depending on specific site variables, for example the cost of skilled labour is greater in the south east of England which may make certain construction activities more expensive than in the north of England. For a broad cost benefit analysis some simplifying assumptions have had to be made and these are summarised in Appendix F. As a result of this it is likely that the estimated costs for all surfaces could be at least +/- 30 percent (possibly more) depending on the location and site specific details.
The construction of driveways and car parks is assumed to be a retro-fit in isolation to any other work. This means that for most items minimum load charges and hire rates will apply. For domestic driveways the costs apply to constructing a new area of drive way in place of a grassed or similar permeable area. If an existing driveway was to be replaced the costs could be greater depending on why the driveway is being replaced.
If an existing driveway or car park is to be removed to provide a different surface it would probably be removed completely to allow construction of the new area and the costs would be similar to those used in the cost benefit analysis. However in some case if there is only a need to resurface the existing driveway then replacement with a permeable surface could be much more expensive. This is because instead of replacing the surface layer the whole depth of construction would need to be replaced so that new permeable sub-base can be laid.
It is assumed that paving over back gardens will mainly be carried out as DIY projects. The construction of the subbase layer is also less critical because it does not have to support vehicles so there will be no difference between permeable and impermeable surfaces. Therefore cost difference between impermeable and permeable surfaces will be the premium charged for the permeable materials (if any). The basic cost for impermeable surfaces to which the percentage increase is applied is the modal value for typical surfaces included in the SPON’S External Works and Landscape Price Book for minor works (prices for measured works). The modal rate ignores any very expensive materials or laying patterns (eg radial).
Chapter 3 Cost benefit analysis | 33
If larger areas are assumed as part of the initial construction (ie not small extensions, reconstruction or conversion/alteration) the rates used in normal construction contracts will apply. In all cases preliminaries, compliance with CDM Regulations, supervision issues, etc are not considered because they are very site specific and the results could be too hypothetical. The costs also ignore site specific issues which would have to be accommodated in any case regardless of surface/drainage option chosen eg levels or poor ground. The assumptions made in the cost estimates are summarised in Appendix F.
3.1.5 Pollution costsThe use of permeable surfaces should improve water quality as a result of a reduction in pollution and a reduction in peak flows to receiving waters, which enhances the settlement and biodegradation of pollutants. Where the outflow is released to surface waters the reduced peak flow causes less of a short term shock pollutant load to the receiving waters and allows increased dilution and reduces bank erosion.
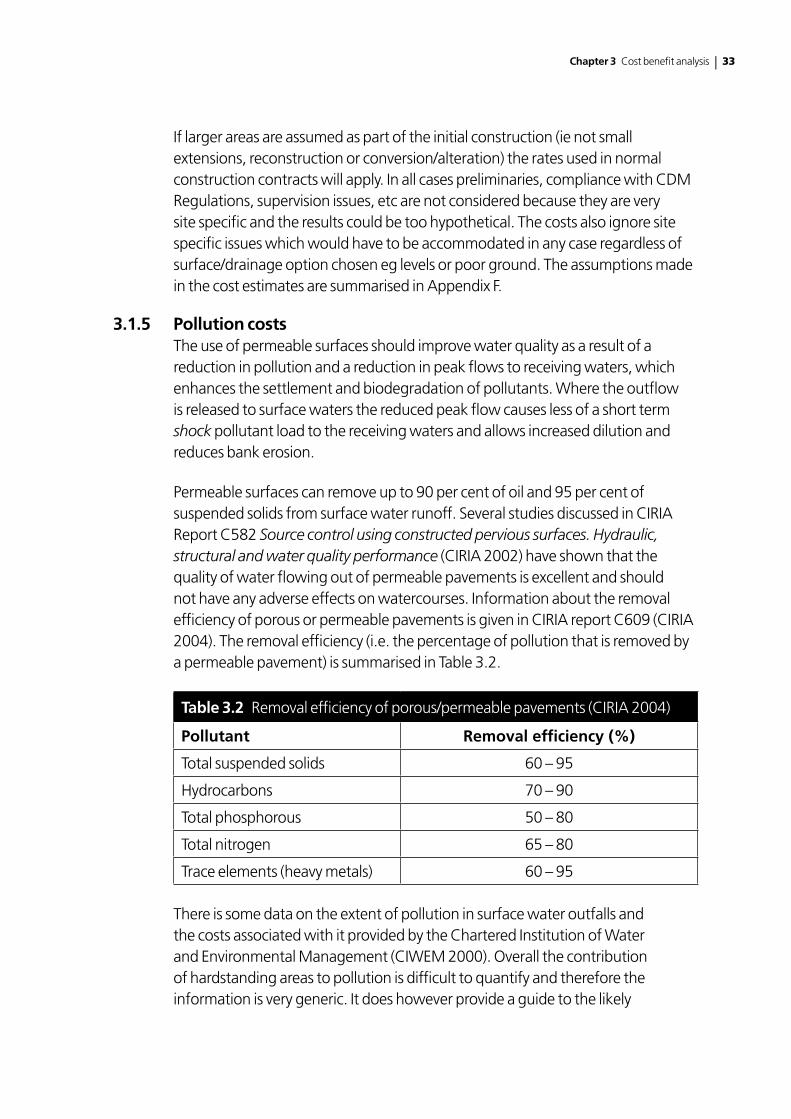
Permeable surfaces can remove up to 90 per cent of oil and 95 per cent of suspended solids from surface water runoff. Several studies discussed in CIRIA Report C582 Source control using constructed pervious surfaces. Hydraulic, structural and water quality performance (CIRIA 2002) have shown that the quality of water flowing out of permeable pavements is excellent and should not have any adverse effects on watercourses. Information about the removal efficiency of porous or permeable pavements is given in CIRIA report C609 (CIRIA 2004). The removal efficiency (i.e. the percentage of pollution that is removed by a permeable pavement) is summarised in Table 3.2.
Table 3.2 Removal efficiency of porous/permeable pavements (CIRIA 2004)
Pollutant Removal efficiency (%)
Total suspended solids 60 – 95
Hydrocarbons 70 – 90
Total phosphorous 50 – 80
Total nitrogen 65 – 80
Trace elements (heavy metals) 60 – 95
There is some data on the extent of pollution in surface water outfalls and the costs associated with it provided by the Chartered Institution of Water and Environmental Management (CIWEM 2000). Overall the contribution of hardstanding areas to pollution is difficult to quantify and therefore the information is very generic. It does however provide a guide to the likely
34 | Understanding permeable and impermeable surfaces
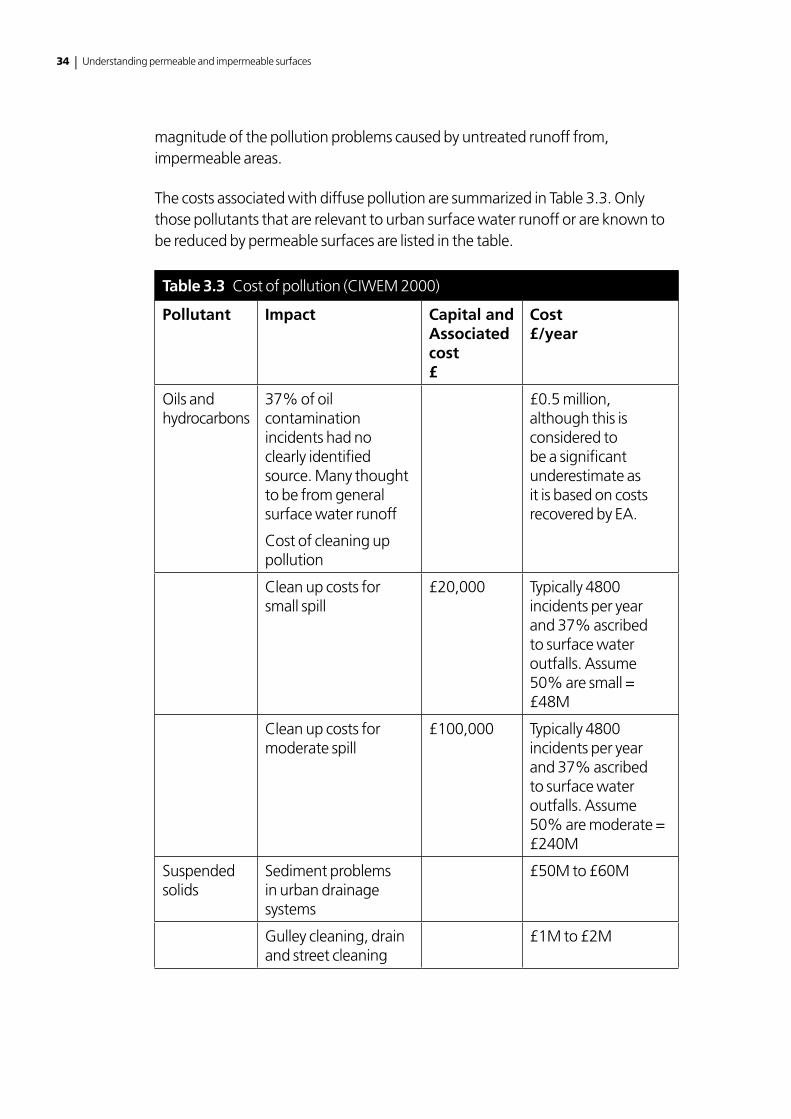
magnitude of the pollution problems caused by untreated runoff from, impermeable areas.
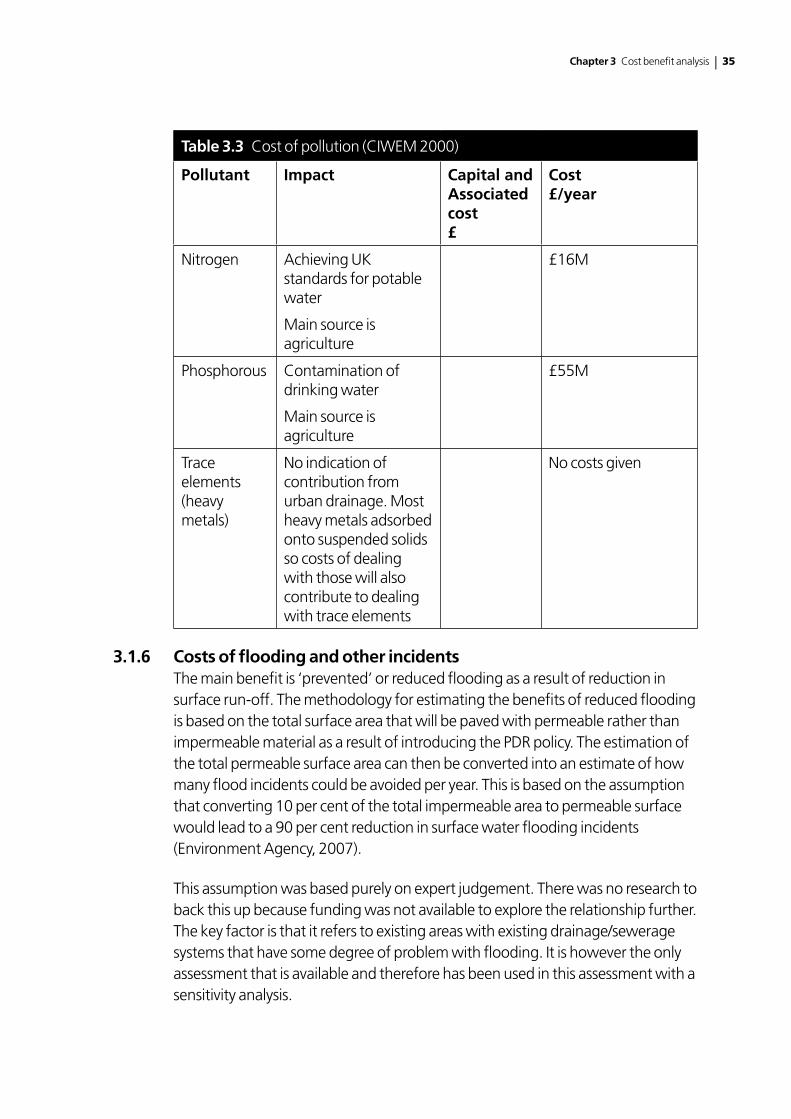
The costs associated with diffuse pollution are summarized in Table 3.3. Only those pollutants that are relevant to urban surface water runoff or are known to be reduced by permeable surfaces are listed in the table.
Table 3.3 Cost of pollution (CIWEM 2000)
Pollutant Impact Capital and Associated cost£
Cost£/year
Oils and hydrocarbons
37% of oil contamination incidents had no clearly identified source. Many thought to be from general surface water runoff
Cost of cleaning up pollution
£0.5 million, although this is considered to be a significant underestimate as it is based on costs recovered by EA.
Clean up costs for small spill
£20,000 Typically 4800 incidents per year and 37% ascribed to surface water outfalls. Assume 50% are small = £48M
Clean up costs for moderate spill
£100,000 Typically 4800 incidents per year and 37% ascribed to surface water outfalls. Assume 50% are moderate = £240M
Suspended solids
Sediment problems in urban drainage systems
£50M to £60M
Gulley cleaning, drain and street cleaning
£1M to £2M
Chapter 3 Cost benefit analysis | 35
Table 3.3 Cost of pollution (CIWEM 2000)
Pollutant Impact Capital and Associated cost£
Cost£/year
Nitrogen Achieving UK standards for potable water
Main source is agriculture
£16M
Phosphorous Contamination of drinking water
Main source is agriculture
£55M
Trace elements (heavy metals)
No indication of contribution from urban drainage. Most heavy metals adsorbed onto suspended solids so costs of dealing with those will also contribute to dealing with trace elements
No costs given
3.1.6 Costs of flooding and other incidentsThe main benefit is ‘prevented’ or reduced flooding as a result of reduction in surface run-off. The methodology for estimating the benefits of reduced flooding is based on the total surface area that will be paved with permeable rather than impermeable material as a result of introducing the PDR policy. The estimation of the total permeable surface area can then be converted into an estimate of how many flood incidents could be avoided per year. This is based on the assumption that converting 10 per cent of the total impermeable area to permeable surface would lead to a 90 per cent reduction in surface water flooding incidents (Environment Agency, 2007).
This assumption was based purely on expert judgement. There was no research to back this up because funding was not available to explore the relationship further. The key factor is that it refers to existing areas with existing drainage/sewerage systems that have some degree of problem with flooding. It is however the only assessment that is available and therefore has been used in this assessment with a sensitivity analysis.
36 | Understanding permeable and impermeable surfaces
The 10 per cent reduction in impermeable area refers to an average reduction of 10 per cent of the total area of hard standing in the UK. This does not mean that in every location the area of hard standing needs to be reduced by 10 per cent. The relationship will vary depending on the nature of the site, surrounding catchment, watercourses and drainage system. For example in an area that is borderline with respect to flooding from the drainage system, any small increase in the volume of water entering the drainage system would increase the flooding risk in that site, so even a 1 per cent increase in impermeable surface area in the catchment might result in flooding. Equally in other locations it wouldn’t matter if the whole site area was paved with impermeable surfaces, it would not increase the flooding risk from the drainage within that location.
The impacts of runoff elsewhere outside a site also have to be considered. Although a location itself may not be at risk, its run-off may be discharged into a watercourse which then may result in flooding from the watercourse some distance downstream. Hence what is done in one location where there is low flood risk from the drainage system has an impact on another location that is at risk of flooding from a watercourse. It could be envisaged that in such a situation, it may be more beneficial to have 100 per cent permeable surfaces in the upstream location (where there is low risk of flooding) rather than the downstream location where the risk of flooding is high.
The number of flood incidences per year was calculated from the numbers submitted by sewerage companies in England in their June Return reports to Ofwat for 2007. The cost per each flooding incident was estimated as £39,000 in line with estimates given in the EA research undertaken in 2007. It should be noted that these benefits are based on current estimates of flood damage and do not take into consideration an expected increase in flooding incidents as a result of climate change.
3.1.7 Hydraulic benefits (reduced runoff)The hydraulic benefits of permeable pavements are well understood and there is a wealth of information provided in CIRIA Report C582 (CIRIA, 2002) on this aspect of permeable pavements. The runoff benefits provided by permeable paving are maximised when the water is allowed to simply soak into the underlying ground. In this case runoff is reduced by 100 percent for many events (the exact capacity will depend on ability of the soil to accept water). However even if the permeable pavement allows water to flow into the sewer it still acts as a buffer that reduces the rate and volume of runoff. Further details on the hydraulic benefits are provided in Appendix H.
Chapter 3 Cost benefit analysis | 37
The effects of permeable pavement will vary depending, amongst other things, on whether the water flows into the ground or into the sewer. It is assumed that an outlet to the drains will be needed where there are clay soils. The distribution of clay soils across England has been assessed from geological maps although there will be significant local variations in soil type, for example urban areas may have a significant cover of Made Ground over the natural soils. From inspection of the maps it is estimated that in the worst case scenario permeable pavements in some 40 percent to 50 percent of England may need an outlet to the sewer. .
3.1.8 Areas available for pavingFront garden areasAlexander (2006) identified that in London over a third of green space and about two-thirds of tree cover are located in domestic gardens. The highest percentages of front gardens that have been paved over were reported to be the North East, the South West and Eastern England (Table 6). The paper indicates that in the London Borough of Ealing there are estimated to be 74 300 front gardens. These account for 55 per cent of the total area of the Borough and in 25 per cent of cases (18 575 gardens) the whole garden is paved. A total of 66 per cent of houses have 50 per cent or more of the front garden paved (this includes the previous 25 per cent).
Back garden areasThe only readily available case study into urban impermeable area creep found that patios and all paved areas other than driveways were not connected to either foul or surface water sewerage networks (the study was limited to one area of Derby). This was true even though the area studied was on a clayey soil. The study concluded that paved patio and other areas do not contribute to a property’s percentage urban creep (Cutting 2003). Therefore it is assumed that only a small percentage of back gardens drain to the sewer, even when covered by hard surfacing.
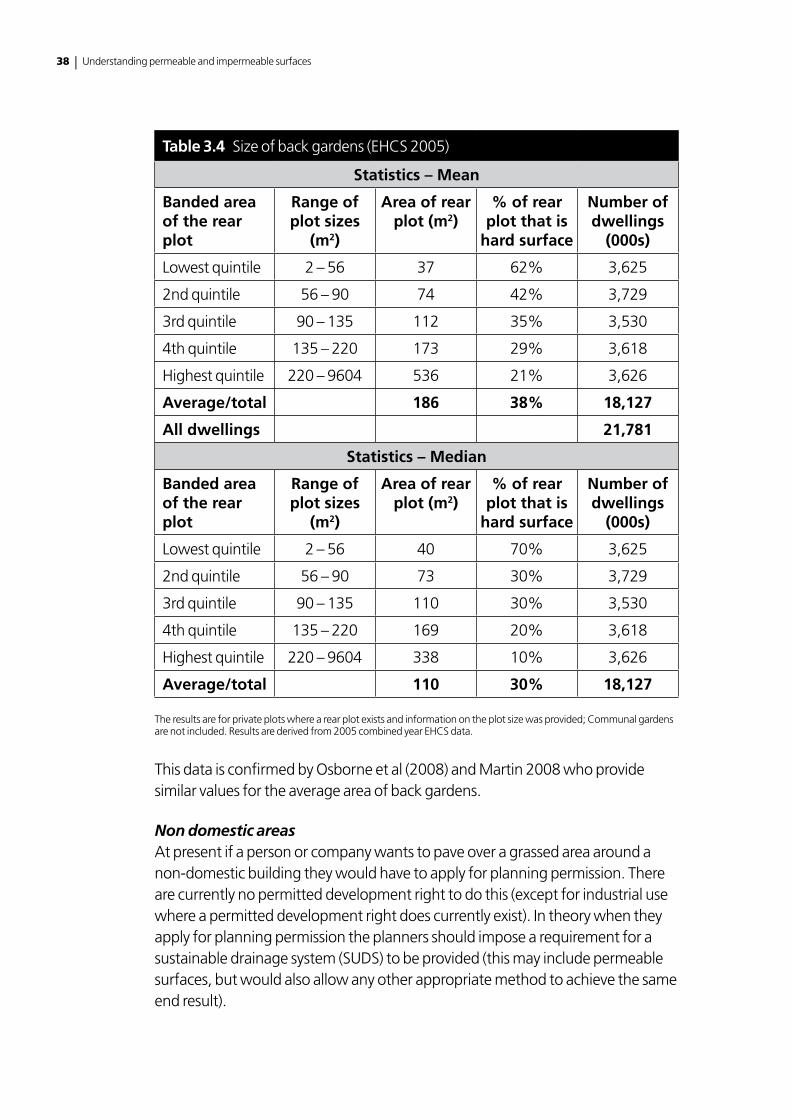
The English Housing Condition Survey 2005 also provides information on the number of dwellings in England and the area of back gardens (Table 3.4) and thus the total area of back gardens can be estimated.
38 | Understanding permeable and impermeable surfaces
Table 3.4 Size of back gardens (EHCS 2005)
Statistics – Mean
Banded area of the rear plot
Range of plot sizes
(m2)
Area of rear plot (m2)
% of rear plot that is
hard surface
Number of dwellings
(000s)
Lowest quintile 2 – 56 37 62% 3,625
2nd quintile 56 – 90 74 42% 3,729
3rd quintile 90 – 135 112 35% 3,530
4th quintile 135 – 220 173 29% 3,618
Highest quintile 220 – 9604 536 21% 3,626
Average/total 186 38% 18,127
All dwellings 21,781
Statistics – Median
Banded area of the rear plot
Range of plot sizes
(m2)
Area of rear plot (m2)
% of rear plot that is
hard surface
Number of dwellings
(000s)
Lowest quintile 2 – 56 40 70% 3,625
2nd quintile 56 – 90 73 30% 3,729
3rd quintile 90 – 135 110 30% 3,530
4th quintile 135 – 220 169 20% 3,618
Highest quintile 220 – 9604 338 10% 3,626
Average/total 110 30% 18,127
The results are for private plots where a rear plot exists and information on the plot size was provided; Communal gardens are not included. Results are derived from 2005 combined year EHCS data.
This data is confirmed by Osborne et al (2008) and Martin 2008 who provide similar values for the average area of back gardens.
Non domestic areasAt present if a person or company wants to pave over a grassed area around a non-domestic building they would have to apply for planning permission. There are currently no permitted development right to do this (except for industrial use where a permitted development right does currently exist). In theory when they apply for planning permission the planners should impose a requirement for a sustainable drainage system (SUDS) to be provided (this may include permeable surfaces, but would also allow any other appropriate method to achieve the same end result).
Chapter 3 Cost benefit analysis | 39
Thus the construction costs associated with paving over an area should already allow for permeable surfaces or a soakaway or similar. The construction costs under the proposed permitted development rights will also allow for permeable surfaces or a soakaway or similar, i.e. they are the same. However in practice it is likely that planners will not include a requirement for using SUDS in a significant proportion of cases, especially if the area is small, as proposed in the extension of the PDR. In these situations there will be a cost difference between permeable and impermeable. It has been assumed that currently all planning applications for small car parks or extensions will not have a SUDS requirement placed on the permission.
The number of non-domestic properties has been estimated from the statistics published by the Department for Communities and Local Government (Commercial and industrial property: summary statistics for all bulk premises, Government Office Regions, 1 April, 1998-2007). Based on this data an assumption can be made about the percentage of premises that will use the permitted development right to construct permeable paved areas up 50m2 if the legislation is changed to allow them to do this.
3.2 Review of CBA methodology
In developing this CBA methodology, a number of similar studies that assessed the costs and performance or benefits of various paving or SUDS options and other surface water management options were reviewed. These are:
• Defra:Impact Assessment of Surface Water Management Plans (Consultation)
• UKWIR:Performance and whole life costs of best management practices and sustainable urban drainage systems
• Interpave:Whole life cost analysis for various pavements and drainage options
• EnvironmentAgency:A review of the cost benefit of undertaking SUDS retrofit in urban areas
These reports and studies provided a good background to developing a robust CBA methodology for this project. A summary of each study is given in Appendix G.
40 | Understanding permeable and impermeable surfaces
3.3 CBA methodology
3.3.1 OverviewCBA is an economic tool that provides a structured set of methods for understanding the costs and benefits (both direct and indirect) of a course of action or alternative options. Costs and benefits are assessed in a consistent manner using a common unit of measurement which is usually money and they have to be expressed at a particular time and so future costs and benefits are discounted. The analysis of a project or policy usually includes the “do nothing” or “without project” option as baseline scenario. The main objective of this study is to develop a CBA approach for assessing the benefit and costs of the proposed changes to the permitted development rights (PDR) in monetary terms.
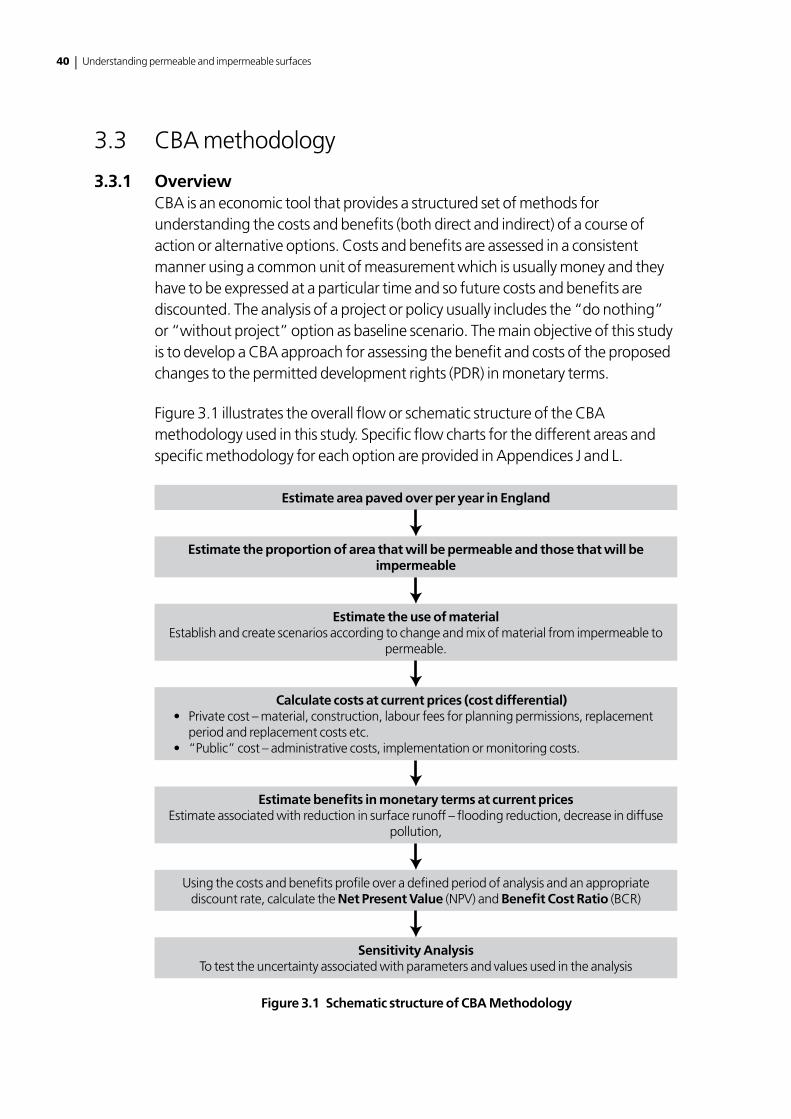
Figure 3.1 illustrates the overall flow or schematic structure of the CBA methodology used in this study. Specific flow charts for the different areas and specific methodology for each option are provided in Appendices J and L.
Estimate area paved over per year in England
Estimate the proportion of area that will be permeable and those that will be impermeable
Estimate the use of materialEstablish and create scenarios according to change and mix of material from impermeable to
permeable.
Calculate costs at current prices (cost differential)• Privatecost–material,construction,labourfeesforplanningpermissions,replacement
period and replacement costs etc.• “Public”cost–administrativecosts,implementationormonitoringcosts.
Estimate benefits in monetary terms at current pricesEstimate associated with reduction in surface runoff – flooding reduction, decrease in diffuse
pollution,
Using the costs and benefits profile over a defined period of analysis and an appropriate discount rate, calculate the Net Present Value (NPV) and Benefit Cost Ratio (BCR)
Sensitivity AnalysisTo test the uncertainty associated with parameters and values used in the analysis
Figure 3.1 Schematic structure of CBA Methodology
Chapter 3 Cost benefit analysis | 41
3.3.2 Scope of analysisThe scope of the analysis is England and this analysis will primarily provide cost and benefit assessment for the proposed changes made to PDRs for domestic front gardens. However, a similar framework will be used to assess the costs and benefits for proposed changes to the PDRs for non-domestic car parks and domestic back gardens. New build properties that currently require planning approval will not be included in the analysis.
The CBA is based upon the best information currently available. Where reliable data is not available then clearly stated values will be assumed. The CBA spreadsheet developed as part of this study is designed such that if more reliable or alternative data becomes available, for example as a result of the consultation, the data can easily be substituted and a revised CBA calculated.
Policy options consideredThe range of options assessed in this analysis is:
• Option1–Donothingoption–layingimpermeablehardstandingcontinuesto be permitted development. This implies that property owners will continue to pave over their gardens with impermeable hard standing which could result in increased flooding and other issues. This option was considered as part of the interim impact assessment carried out by DCLG and so further cost benefit analysis has not been carried out.
• Option2–IntroducePDRforpermeablesurfacinginfrontgardens
• Option3–IntroducePDRforpermeablesurfacingfornon-domesticcarparks
• Option4–IntroducePDRforpermeablesurfacinginbackgardens
A detailed description of the approach taken for each option is provided in Appendix K.
3.3.2 General assumptionsThe following assumptions have been used in the CBA model to estimate annual costs and benefits of introducing PDR for permeable surfacing
• the40-yearperiodofanalysisisusedinthemethodology.Thisisinlinewiththe expected life of paving blocks in the EA report (2007) and assumption used in the Department’s Impact assessment – Permeable surfaces (2008)
• futuretotalcostsandbenefitsarediscountedtopresentvalueatarateof3.5per cent for the first 30 years and 3 percent for the remaining in line with the HM Treasury’s “Green Book”
42 | Understanding permeable and impermeable surfaces
• therelativecostofpermeableandimpermeablesurfaceshavebeenprovidedfrom various manufacturers and firms within the industry and collated by a cost consultant
• thebenefitofreducedfloodingismeasuredinlinewiththeassumptionsinthe EA report that for every 10 per cent reduction in run off surfaces there will be a 90 per cent decrease in sewer related flooding
• theaveragecostoffloodingisassumedtobe£39,000.Thisisbasedonresearch by the insurance industry that a typical sewerage flooding case will result in repairs costing an average of £15,000 – £30,000 with a further £9,000 to replace damaged belongings
• thebenefitforCSOreductionisalsomeasuredinlinewithassumptionsandestimation methodology used in the EA report (2007)
• thenumberofsewerrelatedfloodingeventsisassumedtobe2452.Thisis based on total number of flood incidents as a result of sewer overload recorded in the Ofwat June Returns (2007) for all the sewerage companies in England
3.3.4 Estimation of the costs and benefitsThe analysis focuses on the economic viewpoint of assessing the costs and benefits of each option. An economic assessment seeks to evaluate all the costs and benefits to the society affected by a proposed development or policy. The analysis not only assesses the financial direct and tangible costs or revenue which accrues to the policy or project implementers but also the impact on householders and society as a whole. In economic appraisal of this kind, the major challenge is usually the assessment of the benefits which may not be readily available in cash terms.
The monetised impacts have been calculated based on the assumptions given in this section and in Appendix K.
3.3.5 Discounting future costs and benefitsThe annual costs and benefits of each scheme or proposal over the period of analysis are discounted in order to convert future values to present values so that the net present value (NPV) can be calculated. The discount rate is the rate used to convert all future costs and benefits to present value so they can be compared.
The formula for calculating present value PV is given:
Where FV = future value, r = discount rate, t = time (year)
Chapter 3 Cost benefit analysis | 43
The choice of discount rate can have a significance effect on the evaluation of costs and benefits of a scheme and consequently the calculated net present value (NPV).
The Social Time Preference Rate (STPR), also referred to as the social discount rate is the preferred rate to use when the objective of the CBA is to consider the costs and benefits of a project to society at large. This rate has two components embedded in it: assumed rate of time preference (this measures the rate at which individuals discount future consumption over present consumption) and annual growth in real per capita consumption (reflecting that future consumption will be higher relative to the current position). The HM Treasury “Green Book” (HM Treasury 2005) recommends a social discount rate of 3.5 per cent as the standard real discount rate and a declining discount rate from year 31 onwards (i.e. 3 per cent).
3.3.6 Decision criteria – net present valueThe basic decision rule in CBA is that the net present value (NPV) of investment should be positive (strictly non-negative).
The NPV of a projected stream of costs and benefits is estimated as the summation of the difference between the annual discounted costs and benefits of a project over the period of analysis or the presumed lifespan of the project. This is calculated as:
Where is the discount factor and r is the discount rate.
3.3.7 Sensitivity analysisSensitivity analysis is the most common method of incorporating uncertainty in a CBA. The CBA spreadsheet developed allows risks and uncertainty in parameters and assumptions used in the analysis to be tested by assessing the sensitivity or robustness of the expected NPV to changes in variables entering the CBA. Various sensitivity tests were carried out to test the assumptions and parameters used the CBA for all the three options i.e. front garden, back garden and non-domestic properties.
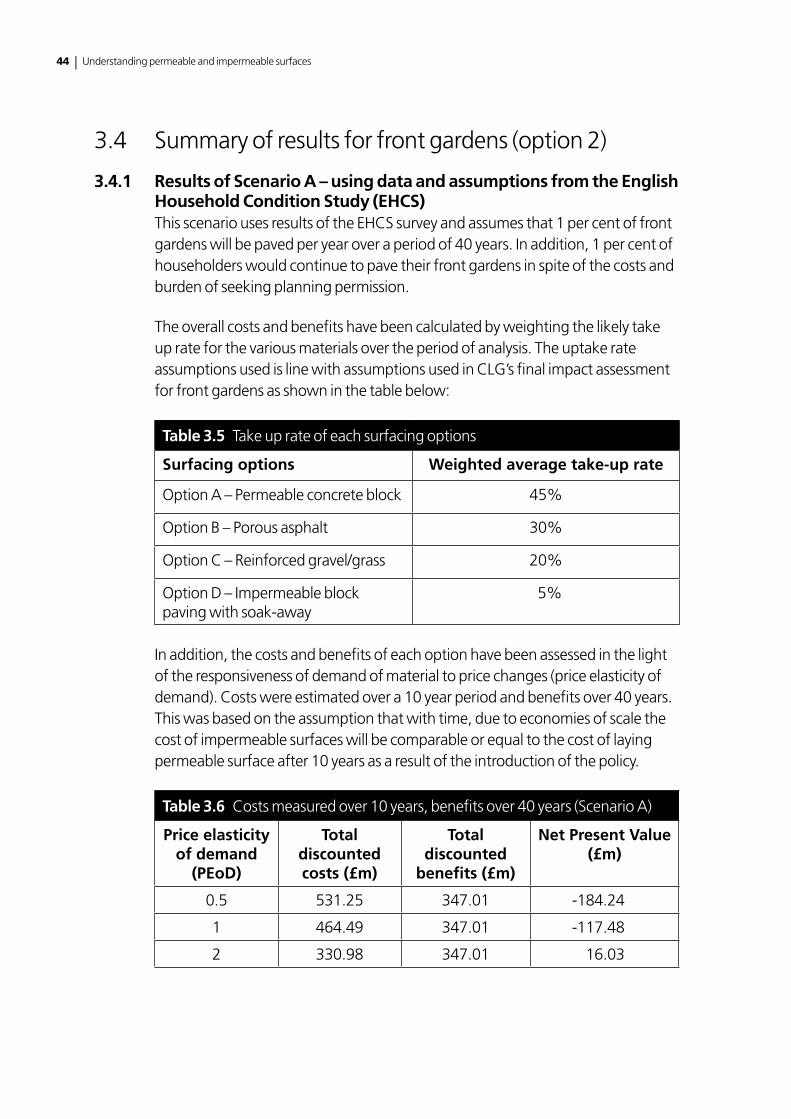
44 | Understanding permeable and impermeable surfaces
3.4 Summary of results for front gardens (option 2)
3.4.1 Results of Scenario A – using data and assumptions from the English Household Condition Study (EHCS)This scenario uses results of the EHCS survey and assumes that 1 per cent of front gardens will be paved per year over a period of 40 years. In addition, 1 per cent of householders would continue to pave their front gardens in spite of the costs and burden of seeking planning permission.
The overall costs and benefits have been calculated by weighting the likely take up rate for the various materials over the period of analysis. The uptake rate assumptions used is line with assumptions used in CLG’s final impact assessment for front gardens as shown in the table below:
Table 3.5 Take up rate of each surfacing options
Surfacing options Weighted average take-up rate
Option A – Permeable concrete block 45%
Option B – Porous asphalt 30%
Option C – Reinforced gravel/grass 20%
Option D – Impermeable block paving with soak-away
5%
In addition, the costs and benefits of each option have been assessed in the light of the responsiveness of demand of material to price changes (price elasticity of demand). Costs were estimated over a 10 year period and benefits over 40 years. This was based on the assumption that with time, due to economies of scale the cost of impermeable surfaces will be comparable or equal to the cost of laying permeable surface after 10 years as a result of the introduction of the policy.
Table 3.6 Costs measured over 10 years, benefits over 40 years (Scenario A)
Price elasticity of demand
(PEoD)
Total discounted costs (£m)
Total discounted
benefits (£m)
Net Present Value(£m)
0.5 531.25 347.01 -184.24
1 464.49 347.01 -117.48
2 330.98 347.01 16.03
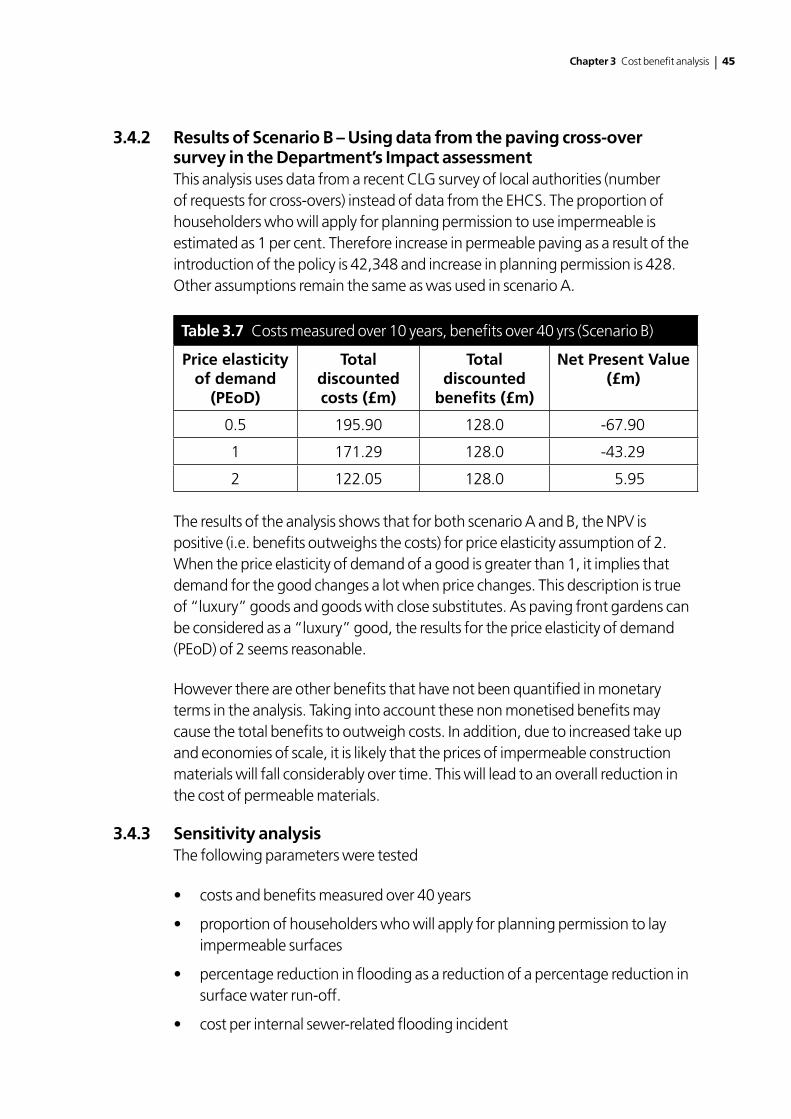
Chapter 3 Cost benefit analysis | 45
3.4.2 Results of Scenario B – Using data from the paving cross-over survey in the Department’s Impact assessmentThis analysis uses data from a recent CLG survey of local authorities (number of requests for cross-overs) instead of data from the EHCS. The proportion of householders who will apply for planning permission to use impermeable is estimated as 1 per cent. Therefore increase in permeable paving as a result of the introduction of the policy is 42,348 and increase in planning permission is 428. Other assumptions remain the same as was used in scenario A.
Table 3.7 Costs measured over 10 years, benefits over 40 yrs (Scenario B)
Price elasticity of demand
(PEoD)
Total discounted costs (£m)
Total discounted
benefits (£m)
Net Present Value(£m)
0.5 195.90 128.0 -67.90
1 171.29 128.0 -43.29
2 122.05 128.0 5.95
The results of the analysis shows that for both scenario A and B, the NPV is positive (i.e. benefits outweighs the costs) for price elasticity assumption of 2. When the price elasticity of demand of a good is greater than 1, it implies that demand for the good changes a lot when price changes. This description is true of “luxury” goods and goods with close substitutes. As paving front gardens can be considered as a “luxury” good, the results for the price elasticity of demand (PEoD) of 2 seems reasonable.
However there are other benefits that have not been quantified in monetary terms in the analysis. Taking into account these non monetised benefits may cause the total benefits to outweigh costs. In addition, due to increased take up and economies of scale, it is likely that the prices of impermeable construction materials will fall considerably over time. This will lead to an overall reduction in the cost of permeable materials.
3.4.3 Sensitivity analysisThe following parameters were tested
• costsandbenefitsmeasuredover40years
• proportionofhouseholderswhowillapplyforplanningpermissiontolayimpermeable surfaces
• percentagereductioninfloodingasareductionofapercentagereductioninsurface water run-off.
• costperinternalsewer-relatedfloodingincident
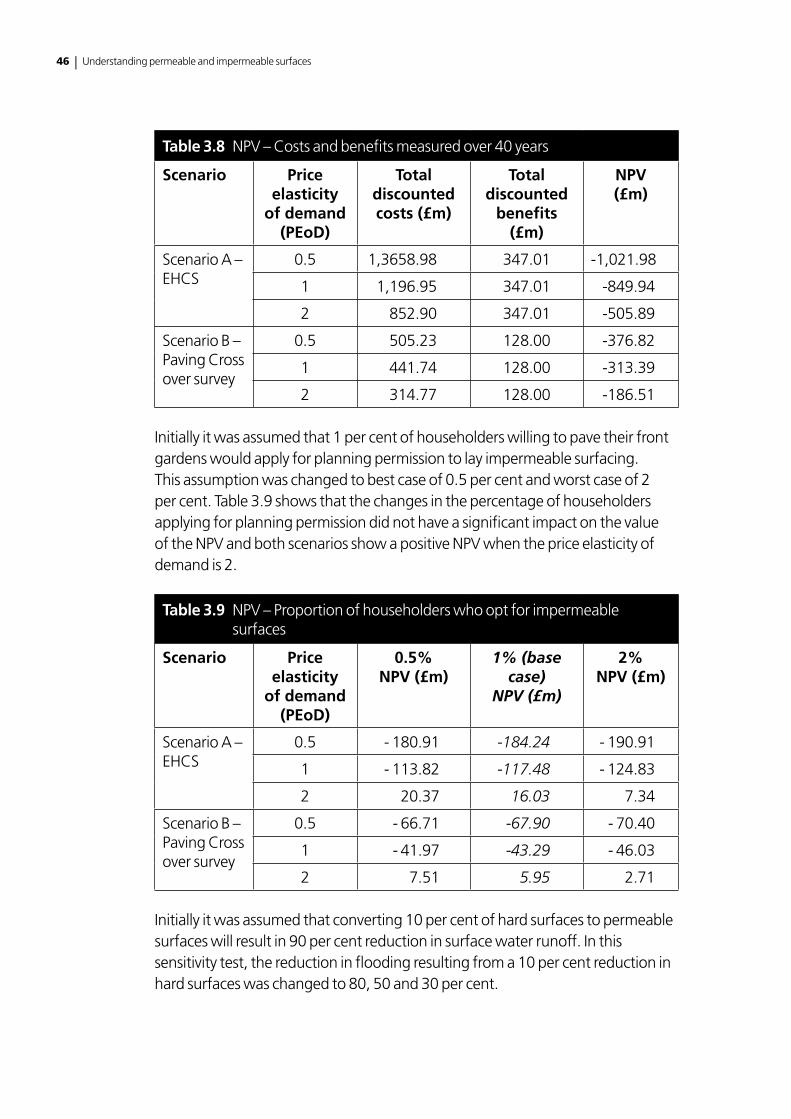
46 | Understanding permeable and impermeable surfaces
Table 3.8 NPV – Costs and benefits measured over 40 years
Scenario Price elasticity
of demand (PEoD)
Total discounted costs (£m)
Total discounted
benefits (£m)
NPV (£m)
Scenario A – EHCS
0.5 1,3658.98 347.01 -1,021.98
1 1,196.95 347.01 -849.94
2 852.90 347.01 -505.89
Scenario B – Paving Cross over survey
0.5 505.23 128.00 -376.82
1 441.74 128.00 -313.39
2 314.77 128.00 -186.51
Initially it was assumed that 1 per cent of householders willing to pave their front gardens would apply for planning permission to lay impermeable surfacing. This assumption was changed to best case of 0.5 per cent and worst case of 2 per cent. Table 3.9 shows that the changes in the percentage of householders applying for planning permission did not have a significant impact on the value of the NPV and both scenarios show a positive NPV when the price elasticity of demand is 2.
Table 3.9 NPV – Proportion of householders who opt for impermeable surfaces
Scenario Price elasticity
of demand (PEoD)
0.5% NPV (£m)
1% (base case)
NPV (£m)
2% NPV (£m)
Scenario A – EHCS
0.5 - 180.91 -184.24 - 190.91
1 - 113.82 -117.48 - 124.83
2 20.37 16.03 7.34
Scenario B – Paving Cross over survey
0.5 - 66.71 -67.90 - 70.40
1 - 41.97 -43.29 - 46.03
2 7.51 5.95 2.71
Initially it was assumed that converting 10 per cent of hard surfaces to permeable surfaces will result in 90 per cent reduction in surface water runoff. In this sensitivity test, the reduction in flooding resulting from a 10 per cent reduction in hard surfaces was changed to 80, 50 and 30 per cent.
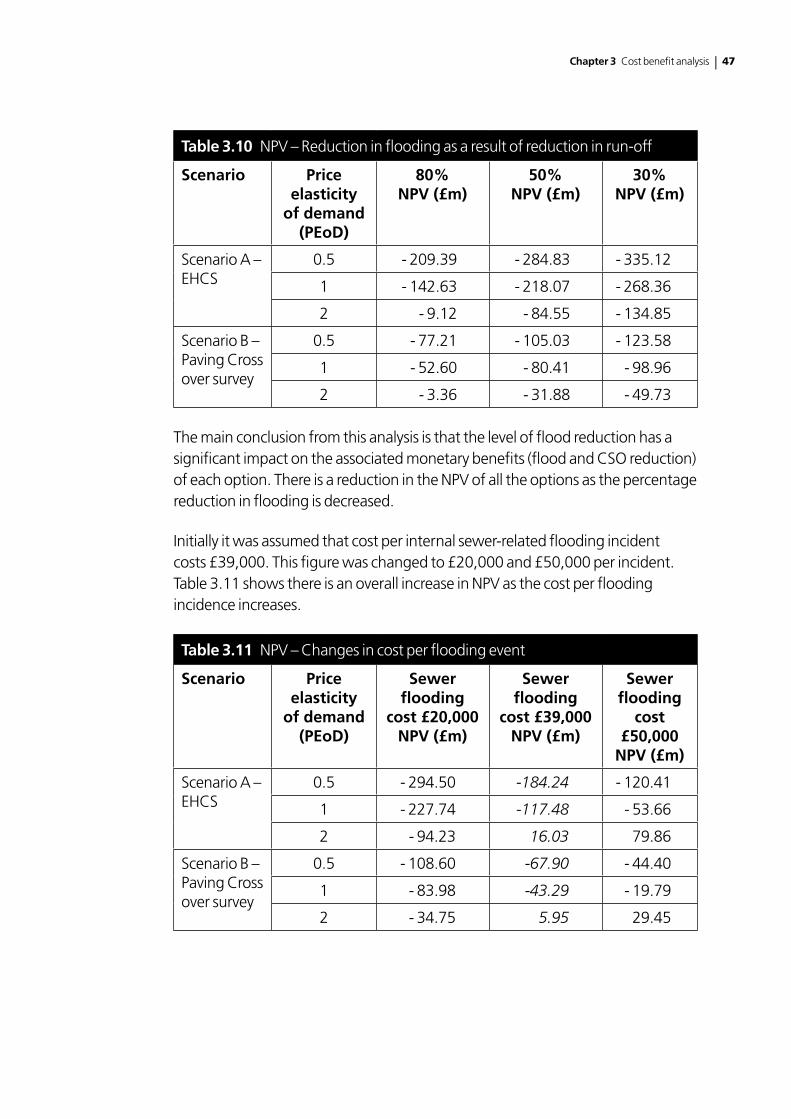
Chapter 3 Cost benefit analysis | 47
Table 3.10 NPV – Reduction in flooding as a result of reduction in run-off
Scenario Price elasticity
of demand (PEoD)
80%NPV (£m)
50%NPV (£m)
30%NPV (£m)
Scenario A – EHCS
0.5 - 209.39 - 284.83 - 335.12
1 - 142.63 - 218.07 - 268.36
2 - 9.12 - 84.55 - 134.85
Scenario B – Paving Cross over survey
0.5 - 77.21 - 105.03 - 123.58
1 - 52.60 - 80.41 - 98.96
2 - 3.36 - 31.88 - 49.73
The main conclusion from this analysis is that the level of flood reduction has a significant impact on the associated monetary benefits (flood and CSO reduction) of each option. There is a reduction in the NPV of all the options as the percentage reduction in flooding is decreased.
Initially it was assumed that cost per internal sewer-related flooding incident costs £39,000. This figure was changed to £20,000 and £50,000 per incident. Table 3.11 shows there is an overall increase in NPV as the cost per flooding incidence increases.
Table 3.11 NPV – Changes in cost per flooding event
Scenario Price elasticity
of demand (PEoD)
Sewer flooding
cost £20,000NPV (£m)
Sewer flooding
cost £39,000NPV (£m)
Sewer flooding
cost £50,000
NPV (£m)
Scenario A – EHCS
0.5 - 294.50 -184.24 - 120.41
1 - 227.74 -117.48 - 53.66
2 - 94.23 16.03 79.86
Scenario B – Paving Cross over survey
0.5 - 108.60 -67.90 - 44.40
1 - 83.98 -43.29 - 19.79
2 - 34.75 5.95 29.45
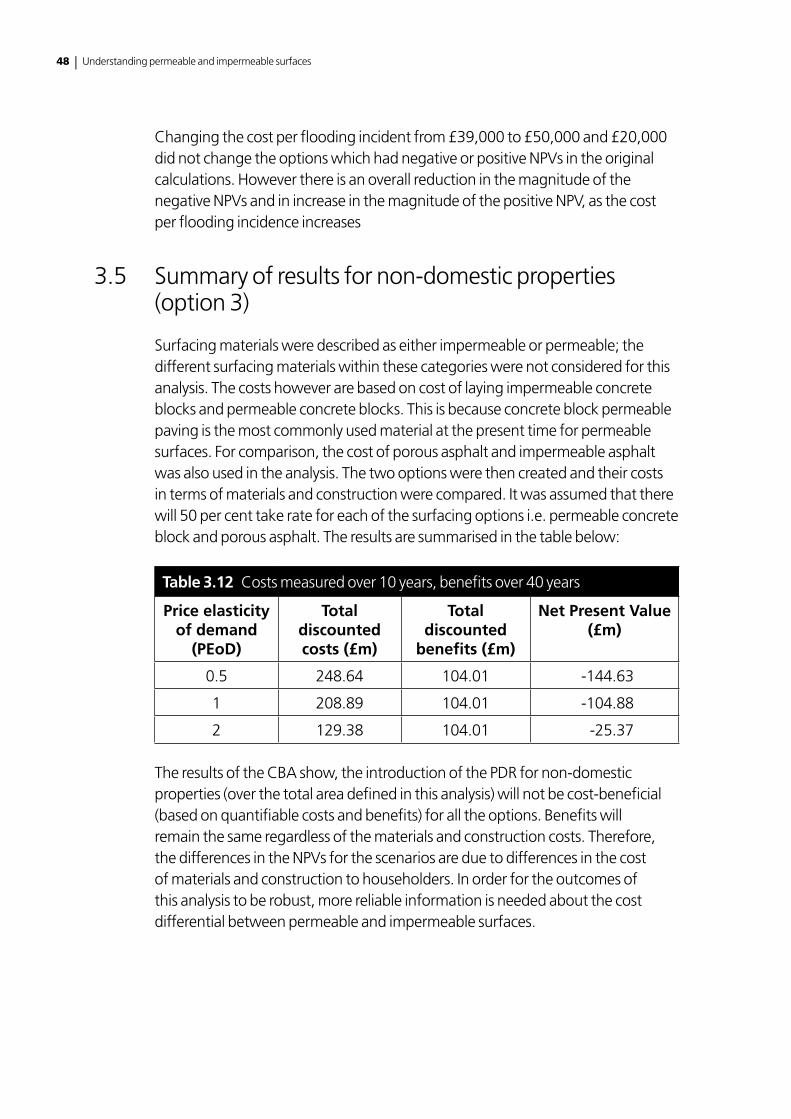
48 | Understanding permeable and impermeable surfaces
Changing the cost per flooding incident from £39,000 to £50,000 and £20,000 did not change the options which had negative or positive NPVs in the original calculations. However there is an overall reduction in the magnitude of the negative NPVs and in increase in the magnitude of the positive NPV, as the cost per flooding incidence increases
3.5 Summary of results for non-domestic properties (option 3)
Surfacing materials were described as either impermeable or permeable; the different surfacing materials within these categories were not considered for this analysis. The costs however are based on cost of laying impermeable concrete blocks and permeable concrete blocks. This is because concrete block permeable paving is the most commonly used material at the present time for permeable surfaces. For comparison, the cost of porous asphalt and impermeable asphalt was also used in the analysis. The two options were then created and their costs in terms of materials and construction were compared. It was assumed that there will 50 per cent take rate for each of the surfacing options i.e. permeable concrete block and porous asphalt. The results are summarised in the table below:
Table 3.12 Costs measured over 10 years, benefits over 40 years
Price elasticity of demand
(PEoD)
Total discounted costs (£m)
Total discounted
benefits (£m)
Net Present Value(£m)
0.5 248.64 104.01 -144.63
1 208.89 104.01 -104.88
2 129.38 104.01 -25.37
The results of the CBA show, the introduction of the PDR for non-domestic properties (over the total area defined in this analysis) will not be cost-beneficial (based on quantifiable costs and benefits) for all the options. Benefits will remain the same regardless of the materials and construction costs. Therefore, the differences in the NPVs for the scenarios are due to differences in the cost of materials and construction to householders. In order for the outcomes of this analysis to be robust, more reliable information is needed about the cost differential between permeable and impermeable surfaces.
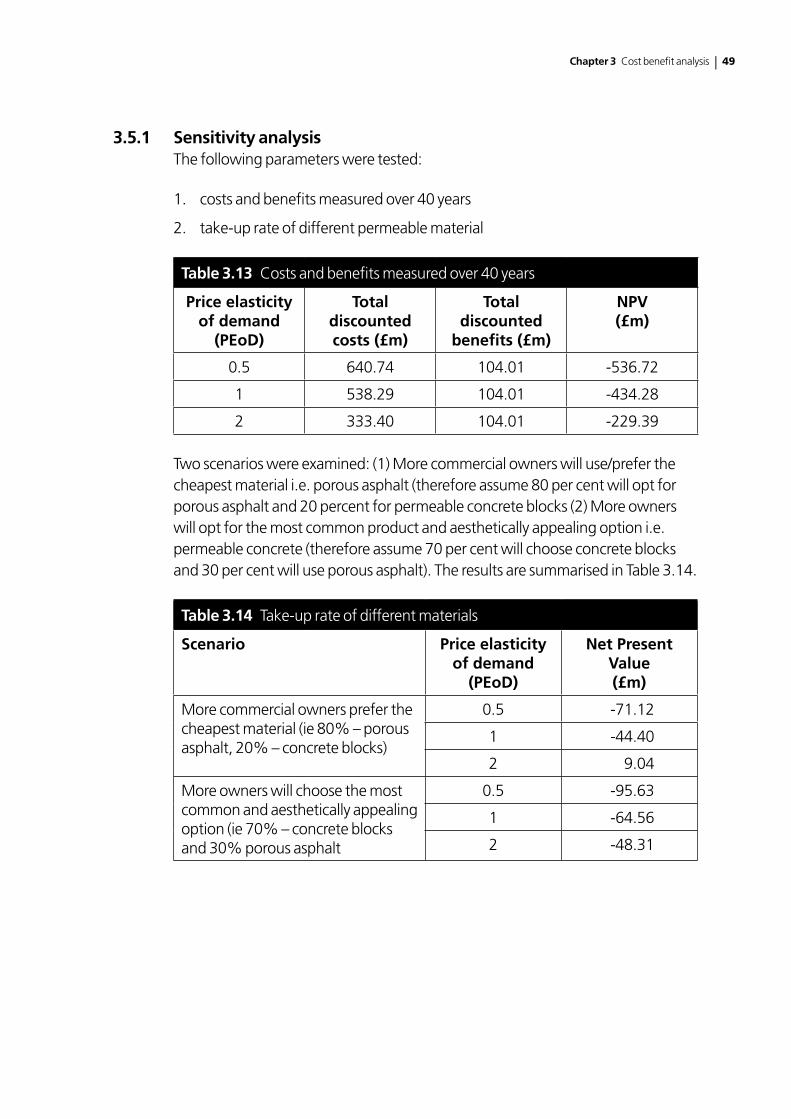
Chapter 3 Cost benefit analysis | 49
3.5.1 Sensitivity analysisThe following parameters were tested:
1. costs and benefits measured over 40 years
2. take-up rate of different permeable material
Table 3.13 Costs and benefits measured over 40 years
Price elasticity of demand
(PEoD)
Total discounted costs (£m)
Total discounted
benefits (£m)
NPV(£m)
0.5 640.74 104.01 -536.72
1 538.29 104.01 -434.28
2 333.40 104.01 -229.39
Two scenarios were examined: (1) More commercial owners will use/prefer the cheapest material i.e. porous asphalt (therefore assume 80 per cent will opt for porous asphalt and 20 percent for permeable concrete blocks (2) More owners will opt for the most common product and aesthetically appealing option i.e. permeable concrete (therefore assume 70 per cent will choose concrete blocks and 30 per cent will use porous asphalt). The results are summarised in Table 3.14.
Table 3.14 Take-up rate of different materials
Scenario Price elasticity of demand
(PEoD)
Net Present Value(£m)
More commercial owners prefer the cheapest material (ie 80% – porous asphalt, 20% – concrete blocks)
0.5 -71.12
1 -44.40
2 9.04
More owners will choose the most common and aesthetically appealing option (ie 70% – concrete blocks and 30% porous asphalt
0.5 -95.63
1 -64.56
2 -48.31
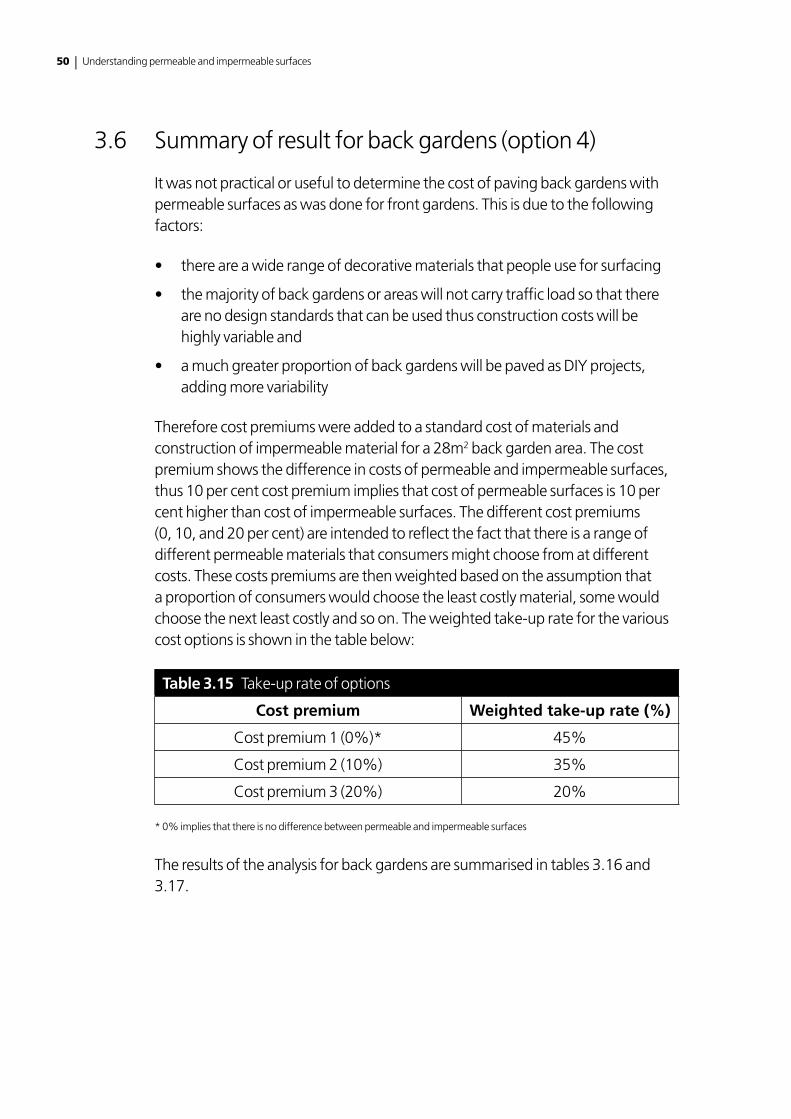
50 | Understanding permeable and impermeable surfaces
3.6 Summary of result for back gardens (option 4)
It was not practical or useful to determine the cost of paving back gardens with permeable surfaces as was done for front gardens. This is due to the following factors:
• thereareawiderangeofdecorativematerialsthatpeopleuseforsurfacing
• themajorityofbackgardensorareaswillnotcarrytrafficloadsothatthereare no design standards that can be used thus construction costs will be highly variable and
• amuchgreaterproportionofbackgardenswillbepavedasDIYprojects,adding more variability
Therefore cost premiums were added to a standard cost of materials and construction of impermeable material for a 28m2 back garden area. The cost premium shows the difference in costs of permeable and impermeable surfaces, thus 10 per cent cost premium implies that cost of permeable surfaces is 10 per cent higher than cost of impermeable surfaces. The different cost premiums (0, 10, and 20 per cent) are intended to reflect the fact that there is a range of different permeable materials that consumers might choose from at different costs. These costs premiums are then weighted based on the assumption that a proportion of consumers would choose the least costly material, some would choose the next least costly and so on. The weighted take-up rate for the various cost options is shown in the table below:
Table 3.15 Take-up rate of options
Cost premium Weighted take-up rate (%)
Cost premium 1 (0%)* 45%
Cost premium 2 (10%) 35%
Cost premium 3 (20%) 20%
* 0% implies that there is no difference between permeable and impermeable surfaces
The results of the analysis for back gardens are summarised in tables 3.16 and 3.17.
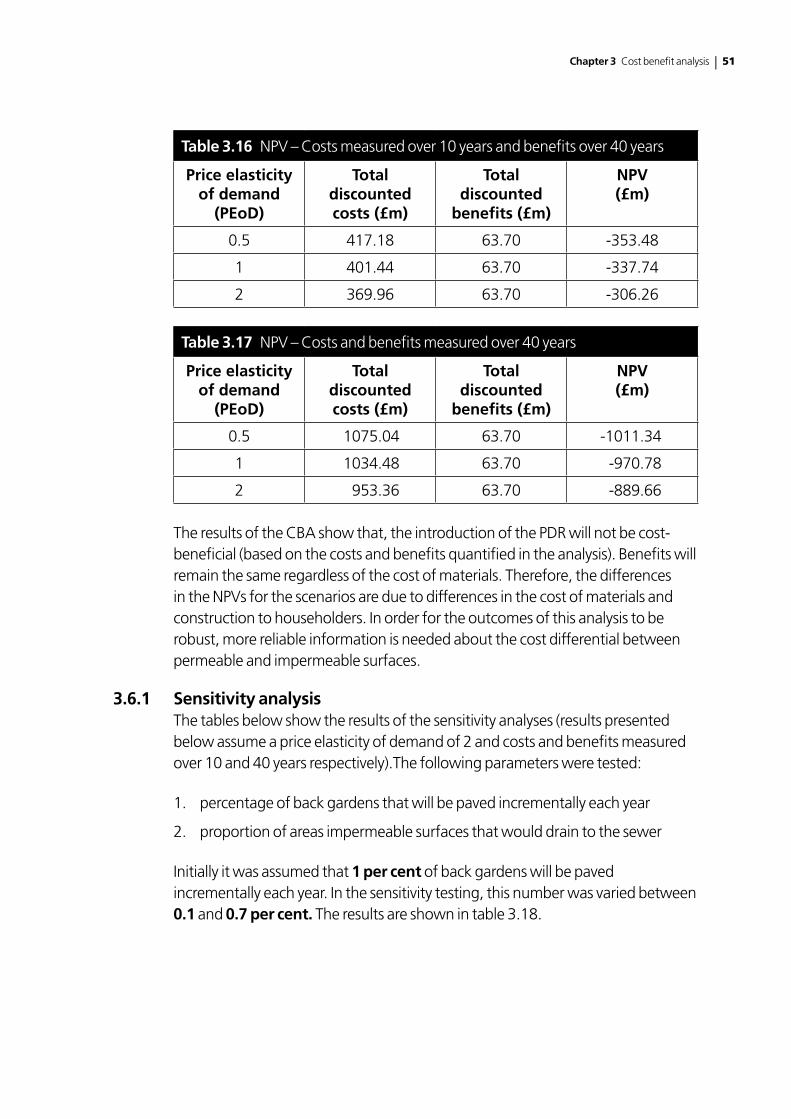
Chapter 3 Cost benefit analysis | 51
Table 3.16 NPV – Costs measured over 10 years and benefits over 40 years
Price elasticity of demand
(PEoD)
Total discounted costs (£m)
Total discounted
benefits (£m)
NPV(£m)
0.5 417.18 63.70 -353.48
1 401.44 63.70 -337.74
2 369.96 63.70 -306.26
Table 3.17 NPV – Costs and benefits measured over 40 years
Price elasticity of demand
(PEoD)
Total discounted costs (£m)
Total discounted
benefits (£m)
NPV(£m)
0.5 1075.04 63.70 -1011.34
1 1034.48 63.70 -970.78
2 953.36 63.70 -889.66
The results of the CBA show that, the introduction of the PDR will not be cost-beneficial (based on the costs and benefits quantified in the analysis). Benefits will remain the same regardless of the cost of materials. Therefore, the differences in the NPVs for the scenarios are due to differences in the cost of materials and construction to householders. In order for the outcomes of this analysis to be robust, more reliable information is needed about the cost differential between permeable and impermeable surfaces.
3.6.1 Sensitivity analysisThe tables below show the results of the sensitivity analyses (results presented below assume a price elasticity of demand of 2 and costs and benefits measured over 10 and 40 years respectively).The following parameters were tested:
1. percentage of back gardens that will be paved incrementally each year
2. proportion of areas impermeable surfaces that would drain to the sewer
Initially it was assumed that 1 per cent of back gardens will be paved incrementally each year. In the sensitivity testing, this number was varied between 0.1 and 0.7 per cent. The results are shown in table 3.18.
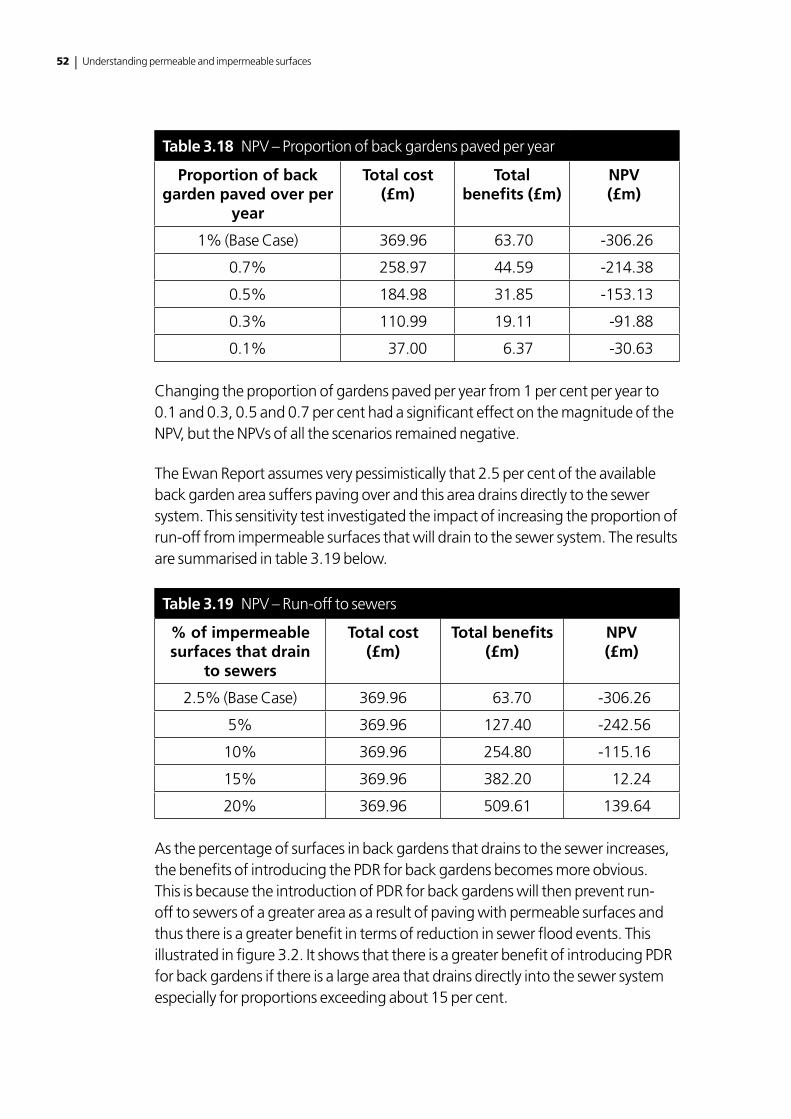
52 | Understanding permeable and impermeable surfaces
Table 3.18 NPV – Proportion of back gardens paved per year
Proportion of back garden paved over per
year
Total cost(£m)
Total benefits (£m)
NPV(£m)
1% (Base Case) 369.96 63.70 -306.26
0.7% 258.97 44.59 -214.38
0.5% 184.98 31.85 -153.13
0.3% 110.99 19.11 -91.88
0.1% 37.00 6.37 -30.63
Changing the proportion of gardens paved per year from 1 per cent per year to 0.1 and 0.3, 0.5 and 0.7 per cent had a significant effect on the magnitude of the NPV, but the NPVs of all the scenarios remained negative.
The Ewan Report assumes very pessimistically that 2.5 per cent of the available back garden area suffers paving over and this area drains directly to the sewer system. This sensitivity test investigated the impact of increasing the proportion of run-off from impermeable surfaces that will drain to the sewer system. The results are summarised in table 3.19 below.
Table 3.19 NPV – Run-off to sewers
% of impermeable surfaces that drain
to sewers
Total cost(£m)
Total benefits (£m)
NPV(£m)
2.5% (Base Case) 369.96 63.70 -306.26
5% 369.96 127.40 -242.56
10% 369.96 254.80 -115.16
15% 369.96 382.20 12.24
20% 369.96 509.61 139.64
As the percentage of surfaces in back gardens that drains to the sewer increases, the benefits of introducing the PDR for back gardens becomes more obvious. This is because the introduction of PDR for back gardens will then prevent run-off to sewers of a greater area as a result of paving with permeable surfaces and thus there is a greater benefit in terms of reduction in sewer flood events. This illustrated in figure 3.2. It shows that there is a greater benefit of introducing PDR for back gardens if there is a large area that drains directly into the sewer system especially for proportions exceeding about 15 per cent.
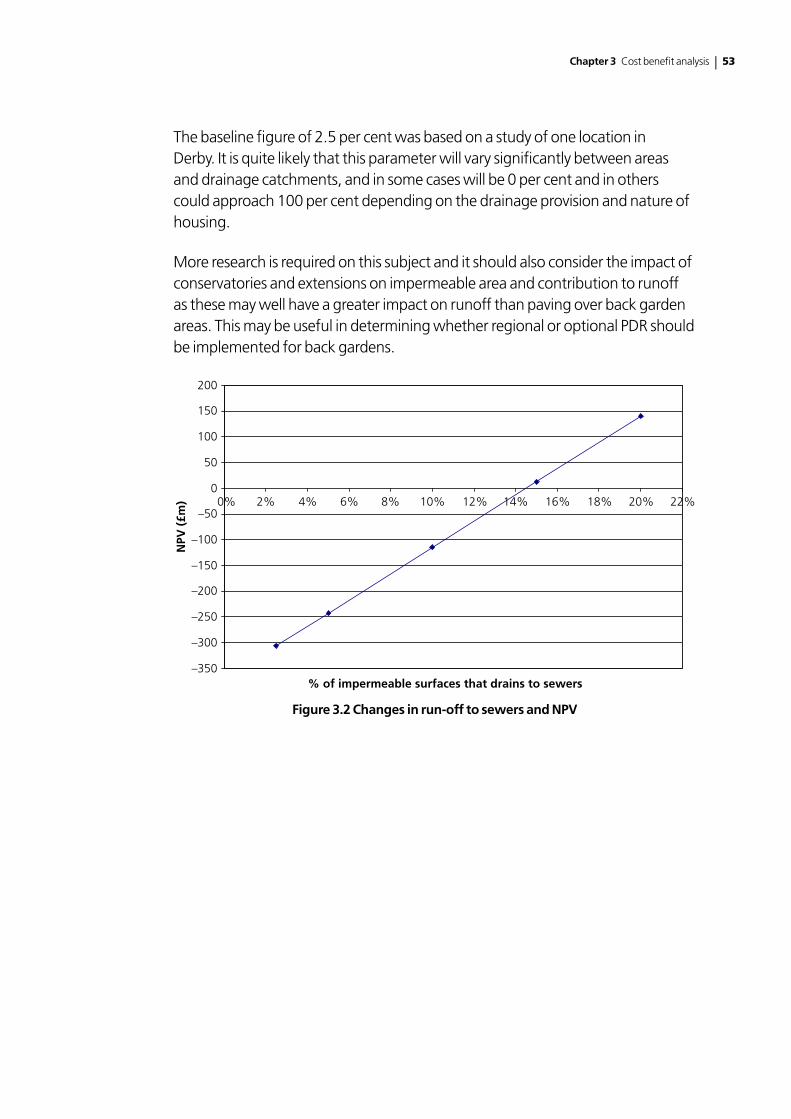
Chapter 3 Cost benefit analysis | 53
The baseline figure of 2.5 per cent was based on a study of one location in Derby. It is quite likely that this parameter will vary significantly between areas and drainage catchments, and in some cases will be 0 per cent and in others could approach 100 per cent depending on the drainage provision and nature of housing.
More research is required on this subject and it should also consider the impact of conservatories and extensions on impermeable area and contribution to runoff as these may well have a greater impact on runoff than paving over back garden areas. This may be useful in determining whether regional or optional PDR should be implemented for back gardens.
200
NPV
(£m
)
% of impermeable surfaces that drains to sewers
150
100
50
–50
–100
–150
–200
–250
–300
–350
00% 2% 4% 6% 8% 10% 12% 14% 16% 18% 20% 22%
Figure 3.2 Changes in run-off to sewers and NPV
54 | Understanding permeable and impermeable surfaces
Chapter 4
Consultation on approaches to implement permeable surfaces around buildings
Informal stakeholder engagement occurred through personal and organisational networks. Formal consultation was undertaken utilising an online survey and interviews with relevant stakeholders working in this area. Key stakeholders include:
• permeablesurfacemanufacturers
• contractorsinstallingpermeableandimpermeablesurfaces
• tradeassociationformanufacturersandcontractors
• policymakersandimplementers
• localauthorities
4.1 Online survey
An electronic link for the online survey was emailed to 600 contacts on 26 September 2008 with just over a three week period given for responses to be submitted (closing date 20 October 2008). Twenty-two responses were received (4 per cent response rate) which was disappointing, but about average for this kind of survey. The survey link was sent (with a reminder) to CIRIA contacts registered with LANDFORM (a local authority Network on Drainage and Flood Risk Management managed by CIRIA), contacts who had previously had bought related guidance from CIRIA and contractors who were members of Interlay. The breakdown of disciplines that responded is presented in figure 4.1.
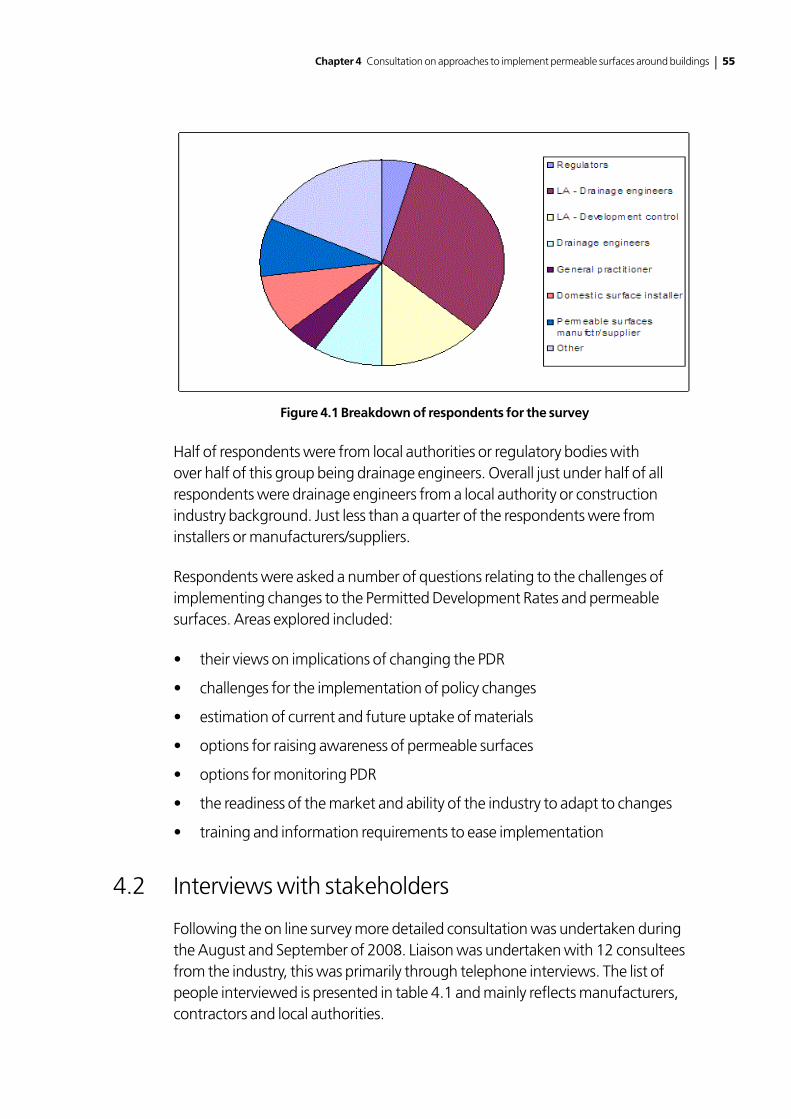
Chapter 4 Consultation on approaches to implement permeable surfaces around buildings | 55
!
Figure 4.1 Breakdown of respondents for the survey
Half of respondents were from local authorities or regulatory bodies with over half of this group being drainage engineers. Overall just under half of all respondents were drainage engineers from a local authority or construction industry background. Just less than a quarter of the respondents were from installers or manufacturers/suppliers.
Respondents were asked a number of questions relating to the challenges of implementing changes to the Permitted Development Rates and permeable surfaces. Areas explored included:
• theirviewsonimplicationsofchangingthePDR
• challengesfortheimplementationofpolicychanges
• estimationofcurrentandfutureuptakeofmaterials
• optionsforraisingawarenessofpermeablesurfaces
• optionsformonitoringPDR
• thereadinessofthemarketandabilityoftheindustrytoadapttochanges
• trainingandinformationrequirementstoeaseimplementation
4.2 Interviews with stakeholders
Following the on line survey more detailed consultation was undertaken during the August and September of 2008. Liaison was undertaken with 12 consultees from the industry, this was primarily through telephone interviews. The list of people interviewed is presented in table 4.1 and mainly reflects manufacturers, contractors and local authorities.
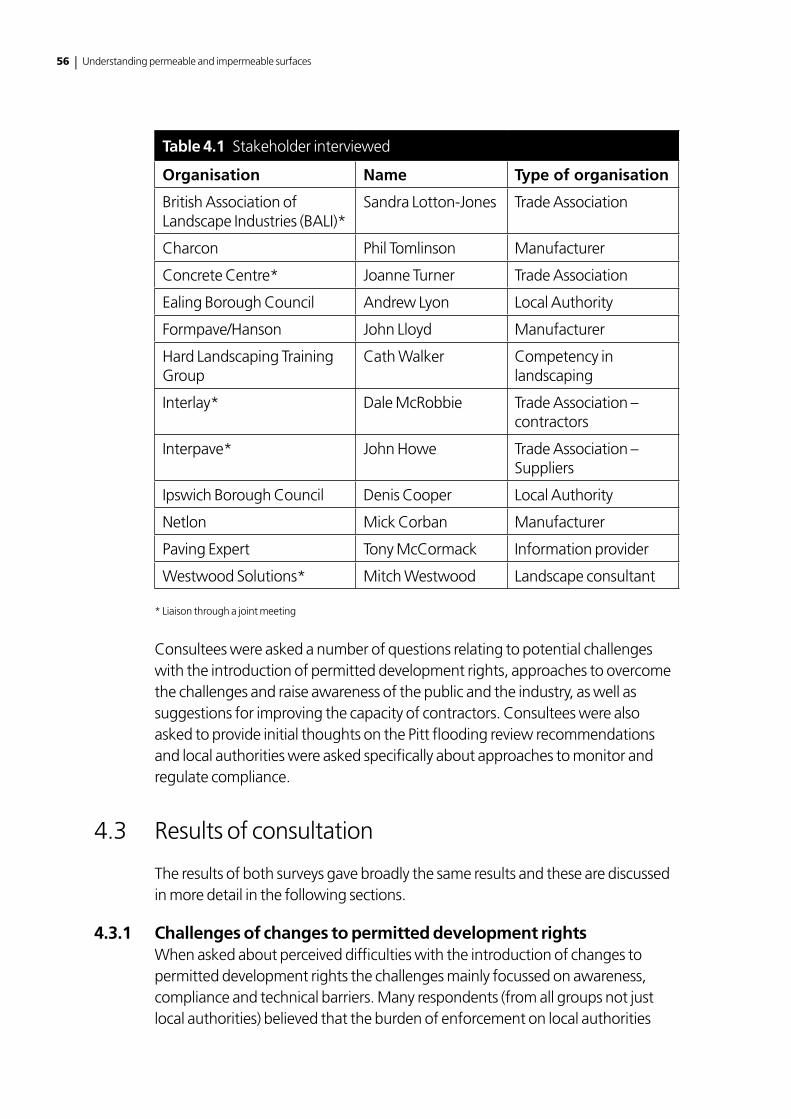
56 | Understanding permeable and impermeable surfaces
Table 4.1 Stakeholder interviewed
Organisation Name Type of organisation
British Association of Landscape Industries (BALI)*
Sandra Lotton-Jones Trade Association
Charcon Phil Tomlinson Manufacturer
Concrete Centre* Joanne Turner Trade Association
Ealing Borough Council Andrew Lyon Local Authority
Formpave/Hanson John Lloyd Manufacturer
Hard Landscaping Training Group
Cath Walker Competency in landscaping
Interlay* Dale McRobbie Trade Association – contractors
Interpave* John Howe Trade Association – Suppliers
Ipswich Borough Council Denis Cooper Local Authority
Netlon Mick Corban Manufacturer
Paving Expert Tony McCormack Information provider
Westwood Solutions* Mitch Westwood Landscape consultant
* Liaison through a joint meeting
Consultees were asked a number of questions relating to potential challenges with the introduction of permitted development rights, approaches to overcome the challenges and raise awareness of the public and the industry, as well as suggestions for improving the capacity of contractors. Consultees were also asked to provide initial thoughts on the Pitt flooding review recommendations and local authorities were asked specifically about approaches to monitor and regulate compliance.
4.3 Results of consultation
The results of both surveys gave broadly the same results and these are discussed in more detail in the following sections.
4.3.1 Challenges of changes to permitted development rightsWhen asked about perceived difficulties with the introduction of changes to permitted development rights the challenges mainly focussed on awareness, compliance and technical barriers. Many respondents (from all groups not just local authorities) believed that the burden of enforcement on local authorities
Chapter 4 Consultation on approaches to implement permeable surfaces around buildings | 57
was too great and that difficulties of policing compliance and enforcement may lead to evasion. This would not stimulate the market to respond positively to the changes.
If residents or neighbours do not volunteer information local authorities will not be aware of what is happening and which front garden surfaces have been altered. Difficulties in enforcement are also likely to lead to evasion of planning procedures and bring the planning system into disrepute. Consultees also thought there would be difficulty in deciding on appropriate sanctions for non compliance.
Property owner awarenessIt was suggested by many of the consultees that most of the public is unaware of the changes in PDR, let alone the justification for it or the options for improving permeability of front drives. It was thought that some of the less scrupulous contractors could potentially benefit from this and install impermeable surfaces at the expense of contractors installing permeable surfaces.
It was also suggested that there may not be enough information to facilitate the general public acting as an intelligent client in terms of specifying and assessing permeable surface solutions. Where the public is aware of changes in legislation it was thought that unless they embrace sustainability and environmental initiatives they are unlikely to welcome the increased expense of a permeable solution. Most respondents considered that public awareness of the changes to PDR needs to be increased.
They also thought that there is likely to be property owner resistance and some resentment due to ignorance of the benefits of permeable surfaces compared to impermeable options. People are likely to go for the least cost solution which may not include permeable surfaces.
Awareness and capacity of industryAwareness of the regulations by installers, merchants, retailers, etc was thought to be problematic. There was also thought to be a lack of communications between authorities to determine best practice for materials and specification. Lack of contractor skills, knowledge, familiarity and effective training with regards to implementation of permeable surfaces was considered to pose a significant challenge that needs to be addressed. In the short term there will be difficulty in up skilling the workforce quickly enough to install permeable surfaces.
It was suggested that some of the less reputable contractors are unaware of the changes to permitted development rights and many are unaware of the availability of permeable surface solutions and the differences required in construction.
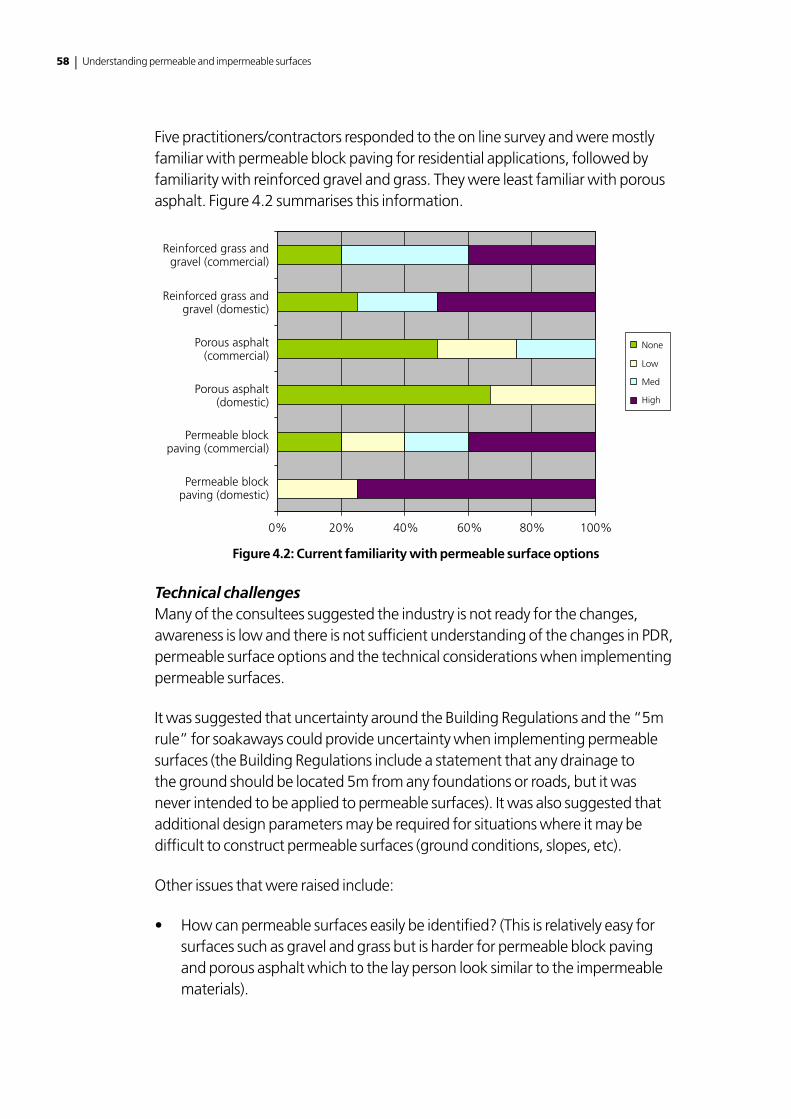
58 | Understanding permeable and impermeable surfaces
Five practitioners/contractors responded to the on line survey and were mostly familiar with permeable block paving for residential applications, followed by familiarity with reinforced gravel and grass. They were least familiar with porous asphalt. Figure 4.2 summarises this information.
Reinforced grass andgravel (commercial)
Reinforced grass andgravel (domestic)
Porous asphalt(commercial)
Porous asphalt(domestic)
Permeable blockpaving (commercial)
Permeable blockpaving (domestic)
0% 20% 40% 60% 80% 100%
None
Low
Med
High
Figure 4.2: Current familiarity with permeable surface options
Technical challengesMany of the consultees suggested the industry is not ready for the changes, awareness is low and there is not sufficient understanding of the changes in PDR, permeable surface options and the technical considerations when implementing permeable surfaces.
It was suggested that uncertainty around the Building Regulations and the “5m rule” for soakaways could provide uncertainty when implementing permeable surfaces (the Building Regulations include a statement that any drainage to the ground should be located 5m from any foundations or roads, but it was never intended to be applied to permeable surfaces). It was also suggested that additional design parameters may be required for situations where it may be difficult to construct permeable surfaces (ground conditions, slopes, etc).
Other issues that were raised include:
• Howcanpermeablesurfaceseasilybeidentified?(Thisisrelativelyeasyforsurfaces such as gravel and grass but is harder for permeable block paving and porous asphalt which to the lay person look similar to the impermeable materials).
Chapter 4 Consultation on approaches to implement permeable surfaces around buildings | 59
• Somesitesaredifficultforpermeablesurfaces,e.g.claysubstrate,smallorsloping front gardens. (These problems are not insurmountable but do need careful thought).
• Thefuturemaintenanceofpermeablesurfacesandtheireffectivenesswith time needs to be guaranteed. (Note that there will still benefits from the widespread use of permeable surfaces even if a proportion are lost or damaged).
• Maintainingpermeabilityoffrontgardens,i.e.changesinuseetc.
• Depthofservicesbeneathdrivewaysmayprovetobeabarriertoinstallation
• Thecostofsharedoutfalls?
Compliance and enforcementThe lack of awareness of both the public and industry was thought to raise difficulties with compliance and for the public trying to find contractors that were both aware of PDR and understood permeable surfaces. There was also concern that contractors who comply with the PDR may be less competitive compared to those that are not aware or ignore changes to PDR.
Local authorities are currently struggling with resources, skills and experience with regards to drainage engineering and other technical aspects which may limit their ability to effectively enforce the changes to PDR. Effective enforcement is crucial to ensure that front gardens utilise permeable solutions. Neighbours whistle blowing on each other may be the only way to facilitate enforcement at present, although this will be late in the process and will not help deliver a sense of community.
4.3.2 Suggested approaches to raise awarenessRaising public awarenessRaising awareness among householders of the new legislation for domestic permitted development rights is required. There were many suggestions for more promotional work and advertising through a variety of media. Many respondents suggested it was the responsibility of the government and local authorities to promote changes in the PDR through mailings, billing literature and websites. They also saw the merit of promotional campaigns using the media and welcomed material suppliers and local authorities working in partnership. The suggestions made for raising awareness of the changes to PDR for front and back gardens are summarised below (these should also be easily transferable to commercial situations if the PDR are changed).
60 | Understanding permeable and impermeable surfaces
Many local authorities (Wealden, St Albans, and London Borough of Richmond) have included guidance on the changes to PDR on their websites with many referring residents to the Department’s Guidance on the permeable surfacing of front gardens (DCLG, 2008) and/or the Planning Portal.
Front and back gardens• changesinPDRshouldbepublicisedvialocalauthoritypromotionalactivities,
council tax bills, websites
• DIYstoresandbuildersmerchantsshoulddisseminateinformationforexample by providing fact-sheets on DIY projects
• campaignswithmanufacturers,suppliers,contractorsandregulatorybodiesmight be useful. Campaigns could be delivered in partnership between manufacturers, suppliers and local authorities
• useoflocalpresswhichshouldbeaugmentedwithnationalpressandmediacoverage on changes to PDR
• professionalsshouldbeinformedthroughuseofinstitutionsandtradeassociations
• itwouldbeusefulifalocalauthorityhadalistofapprovedcontractorstorecommend to the public
• informationshouldbeprovidedatpointofsupplywithsuppliershavinginformation boards
• thereshouldbeadviceon(planning)applicationforms
• anationalwebsitewithpracticaladviceshouldbesetup
Commercial buildings (over and above front and back gardens)• publicitytoarchitects,developersanddesigners
• publicityintradeandprofessionaljournals
• enforcementbylocalauthorities
It was suggested that there needs to be a consistent approach to promotion and enforcement of policy relating to PDR across local authorities. There is unlikely to be a broader generic approach from builders merchants (discussed with Builders Merchants Federation). However, it was suggested that garden and home improvement magazines may be a good vehicle for communicating changes to the PDR and general approaches to implementing permeable front gardens.
Some proactive local authorities are considering using the application for footpath crossovers as a trigger to provide further information about PDRs and promoting permeable surfaces for front gardens.
Chapter 4 Consultation on approaches to implement permeable surfaces around buildings | 61
There was some recognition of information being provided to householders through Interpave and the department’s guidance. However, it was suggested this needs to be improved by:
• makinggreaterreferencetoBuildingRegulations
• providingfurtherguidanceonpermeablefrontgardensindifficultsituations
It was also suggested that future changes in Building Regulations (currently Part H, dealing with drainage) should facilitate permeable surfaces and sustainable drainage being included within the curtilage of properties, facilitating the control of runoff close to its source.
Industry awarenessKnowledge of changes to PDR and the impact this has on domestic front gardens is not thought to be universally understood across contractors. Some contractors are concerned that following the PDR will make their services less competitive compared to those that are unaware or chose to flout the regulations.
To facilitate educations and awareness building some manufacturers are providing training for contractors on their particular permeable surface materials and approach. However, it is unlikely that the training covers the suite of permeable surface solutions. Many of the consultees suggested that training needs to be implemented for contractors to cover the whole suite of permeable surfaces that are possible. It was recognised, that it may be difficult to get the momentum rolling and there needs to be some commercial benefit for attendance of courses. The training being developed by one of the manufacturers lasts a day and a half.
Trade associations for contractors and manufacturers have also delivered training courses to raise awareness and improve skills with the implementation of permeable surfaces. There was encouraging feedback from those on the course and this approach could provide a model to facilitate improved understanding and uptake of the industry.
The development of a self competency/self certification scheme (like CORGI etc) for contractors could be a useful way to stimulate the market. A list of approved contractors could be held by the LA or trading association and there could be a mechanism to provide greater certainty about compliance. In the longer term there could be potential for developing a National Vocational Qualification (NVQ), but in the short term there could be greater focus on continuing professional development (CPD).
62 | Understanding permeable and impermeable surfaces
4.3.3 Approaches for monitoring and enforcing complianceIt was generally accepted that monitoring and enforcement would technically be challenging unless there is a process that pathway and footpath crossovers and applications for dropped curbs triggered some kind of investigation of the surface being constructed. However, this is difficult in itself in terms of reviewing the date and type of construction. Enforcement approaches are likely to be fairly prescriptive and late in the process.
Many believed that enforcement is likely to be too resource intensive to have a beneficial impact. Fundamentally, enforcement approaches would require sufficient support and funding. The two local authority representatives supported by other consultees considered that many local authorities did not have the relevant resources or skills to enforce changes to the PDR. Consultees believed that without appropriate enforcement many contractors would flout the changes in regulation.
Some suggestions focused on the use of satellite imagery and on the ground inspection as an approach to enforcement. It was suggested that enforcement could concentrate on areas where the benefits of reduced flood risk are greatest and that incentives for the first two to three years would be more effective then regulation.
Suggested approaches for compliance• localauthorityenforcementthroughplanningand/orbuildingcontrolstaff.
• aerialphotographycouldbeutilisedtoascertainchangesinuse(thiscouldbecombined with geographical information systems)
• siteinspectionsundertakenbyBuildingControlofficers
• permeabilityassessments
• compliancecouldbeencouragedbyaccreditingcontractors
• contractorsshouldbeinvolvedininformingandmonitoringtheprocess
4.3.4 Promoting the implementation of permeable back gardensMany of the challenges that exist with the current PDR for front gardens apply to rear gardens and the pragmatism of an approach to promote permeable back gardens was generally questioned by those consulted. It was thought that other construction projects like conservatories, building extensions etc would have a greater impact on permeability and may need to be addressed through Building Regulations.
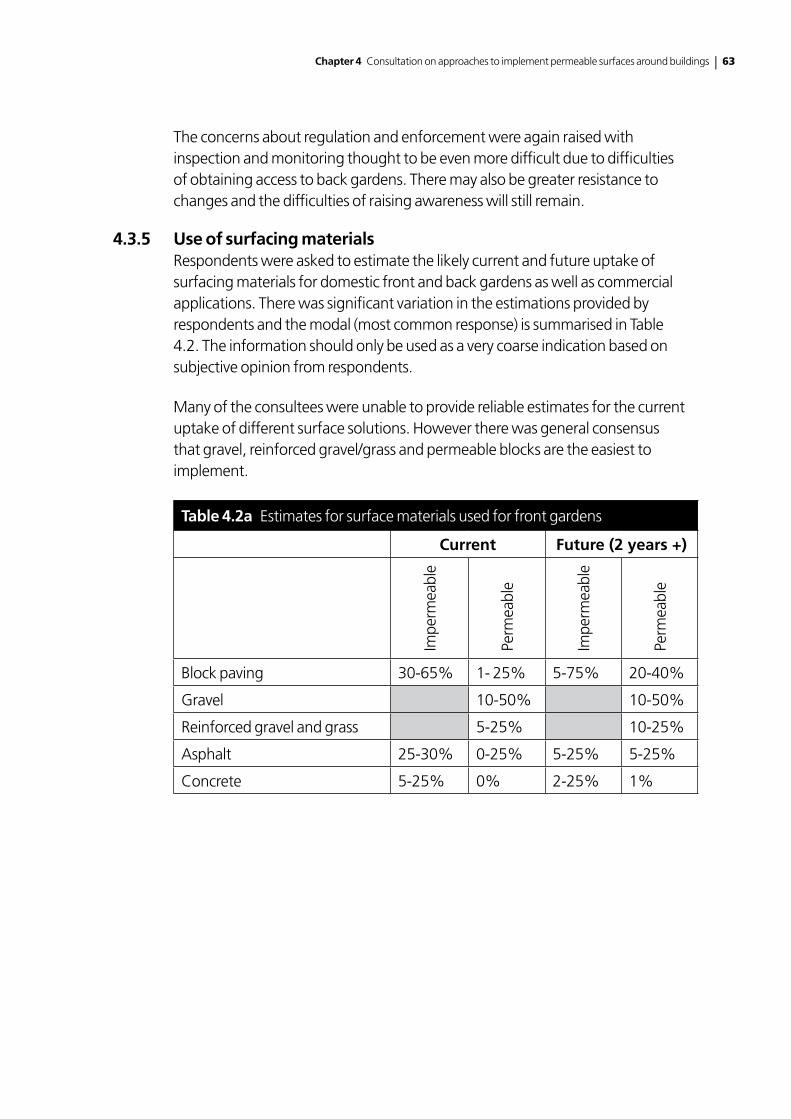
Chapter 4 Consultation on approaches to implement permeable surfaces around buildings | 63
The concerns about regulation and enforcement were again raised with inspection and monitoring thought to be even more difficult due to difficulties of obtaining access to back gardens. There may also be greater resistance to changes and the difficulties of raising awareness will still remain.
4.3.5 Use of surfacing materialsRespondents were asked to estimate the likely current and future uptake of surfacing materials for domestic front and back gardens as well as commercial applications. There was significant variation in the estimations provided by respondents and the modal (most common response) is summarised in Table 4.2. The information should only be used as a very coarse indication based on subjective opinion from respondents.
Many of the consultees were unable to provide reliable estimates for the current uptake of different surface solutions. However there was general consensus that gravel, reinforced gravel/grass and permeable blocks are the easiest to implement.
Table 4.2a Estimates for surface materials used for front gardens
Current Future (2 years +)
Impe
rmea
ble
Perm
eabl
e
Impe
rmea
ble
Perm
eabl
eBlock paving 30-65% 1- 25% 5-75% 20-40%
Gravel 10-50% 10-50%
Reinforced gravel and grass 5-25% 10-25%
Asphalt 25-30% 0-25% 5-25% 5-25%
Concrete 5-25% 0% 2-25% 1%
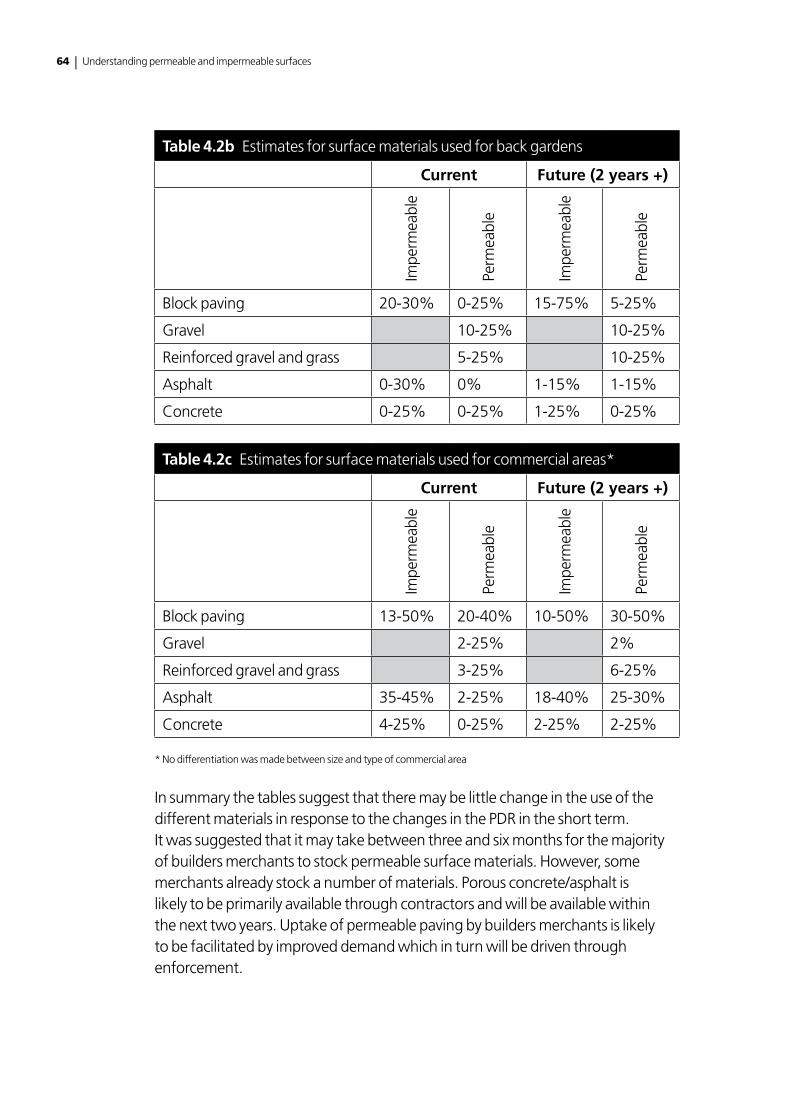
64 | Understanding permeable and impermeable surfaces
Table 4.2b Estimates for surface materials used for back gardens
Current Future (2 years +)
Impe
rmea
ble
Perm
eabl
e
Impe
rmea
ble
Perm
eabl
e
Block paving 20-30% 0-25% 15-75% 5-25%
Gravel 10-25% 10-25%
Reinforced gravel and grass 5-25% 10-25%
Asphalt 0-30% 0% 1-15% 1-15%
Concrete 0-25% 0-25% 1-25% 0-25%
Table 4.2c Estimates for surface materials used for commercial areas*
Current Future (2 years +)
Impe
rmea
ble
Perm
eabl
e
Impe
rmea
ble
Perm
eabl
e
Block paving 13-50% 20-40% 10-50% 30-50%
Gravel 2-25% 2%
Reinforced gravel and grass 3-25% 6-25%
Asphalt 35-45% 2-25% 18-40% 25-30%
Concrete 4-25% 0-25% 2-25% 2-25%
* No differentiation was made between size and type of commercial area
In summary the tables suggest that there may be little change in the use of the different materials in response to the changes in the PDR in the short term. It was suggested that it may take between three and six months for the majority of builders merchants to stock permeable surface materials. However, some merchants already stock a number of materials. Porous concrete/asphalt is likely to be primarily available through contractors and will be available within the next two years. Uptake of permeable paving by builders merchants is likely to be facilitated by improved demand which in turn will be driven through enforcement.
Chapter 4 Consultation on approaches to implement permeable surfaces around buildings | 65
4.4 Conclusions to the consultation
Awareness of changes to PDR and appropriate permeable surfacing options was generally considered to be the greatest challenge to the successful implementation of changes to PDR. It was thought that this would reduce the chances of the public acting as an intelligent client and correctly specifying permeable surfaces for front gardens. Similarly, it was also recognised that some contractors may not be aware of changes to regulations or possess the skills to satisfactorily install permeable surfaces. Feedback from the consultation suggested that resources for better enforcement (by local authorities) would be essential in providing a level playing field to how local authorities and the industry respond to the change in PDR.
In terms of approaches to raise awareness of the changes to PDR and solutions for permeable surfaces it was encouraging to note that some parts of the industry were beginning to positively respond to the changes in the PDR.
There was strong support for organisations like local authorities, manufacturers, suppliers, trade associations and central government to take the lead in raising awareness of changes and potential solutions through promotional campaigns. Some local authorities are beginning to use their websites to raise awareness making reference to changes in PDR, referencing the planning portal and guidance from the Department.
Some manufacturers and trade associations have also been delivering training courses on changes to PDR and implementation of permeable surfaces. There were also some preliminary discussions as to the advantages of a self certifying scheme for contractors familiar with the installation of permeable surfaces.
66 | Understanding permeable and impermeable surfaces
Chapter 5
Conclusion and recommendations
5.1 Results of CBA
The cost benefit analysis shows that overall introducing PDR for front gardens is more cost beneficial than for back gardens and domestic properties ie most scenarios and options analysed showed a positive NPV. This conclusion is based on only costs and benefits that could be quantified. However, taking into account the non monetised benefits excluded from the analysis, total benefits are likely to outweigh costs. Moreover, it is possible that the material and construction costs for the permeable surfaces will decrease considerably over time due to increased take up, economies of scale and greater competition between suppliers and installers
5.2 Research to provide more robust data for the CBA
This cost benefit analysis only includes those costs and benefits to which a monetary value can be assigned. There are other costs and benefits which have not been monetised. It would therefore be beneficial to commission further research to obtain the data required and include the “non quantifiable” impacts in the impact assessment. This would provide policy makers with additional information that has not been fully captured in the CBA.
It is possible that the material and installation costs for the permeable surfaces will decrease over time as demand increases and there is greater competition between suppliers and installers. The CBA has not been taken this into account because at the moment it is not possible to quantify to likely scale of any such cost reductions. It would be useful to assess the impact of the introduction of the PDR for front gardens on material prices after it has been in place for one year. This will help to inform future decisions on permeable surfaces.
The results of this analysis have been built on a number of critical assumptions which are based on “expert judgement” rather than scientific evidence. This is particularly the case with regards to the judgement made about the estimated benefits of laying permeable surfaces, including the reduction in flooding as a result of a 10 percent decrease in impermeable surfaces and the monetary savings on reduction in flood and CSO incidents. This may underestimate or overestimate
Chapter 5 Conclusion and recommendations | 67
the benefits of the policy. It is recommended that further research is needed to identify and quantify the benefits of permeable surfaces in order to better inform the policy decision making processes.
Further research on the area of impermeable surfaces that drain to public sewers would also be useful to manage the uncertainty when determining the costs and benefits of introducing PDR for back gardens. This may be useful in determining whether regional or optional PDR should be implemented for back gardens.
5.3 Recommendations from consultation
Three overriding concerns have come out of the consultation process:
• thereisneedtoprovidetrainingandinformationonhowtoinstallpermeablesurfaces. The training should be provided to contractors and regulators
• thereisaneedtoincreaseawarenessofthelegislationamongstthegeneralpublic, contractors and regulators
• theneedtomonitorcomplianceforfrontgardensandensurethatthelegislation is followed. The best way to do this effectively should be discussed with regulators
If the changes in PDR are to be successful these issues need to be addressed. The industry is beginning to respond to the training issue by providing courses to contractors (Interlay are providing training that is specific to permeable concrete block paving). This needs to be encouraged and training provided to cover all types of surfacing materials.
A public awareness campaign needs to be undertaken to promote the changes in legislation and especially the benefits from reducing impermeable areas. The results of the consultation process indicate that most people think this should be undertaken by the government and local authorities. Campaigns to raise awareness of the adverse impact of drainage on the environment have been carried out in other countries and it would be useful to look at these to see if the approaches could be usefully applied in England.
A consistent approach to enforcement is required. Initially enforcement should focus on those areas that have most to gain from the changes in PDR as a result of reduced flood risk.
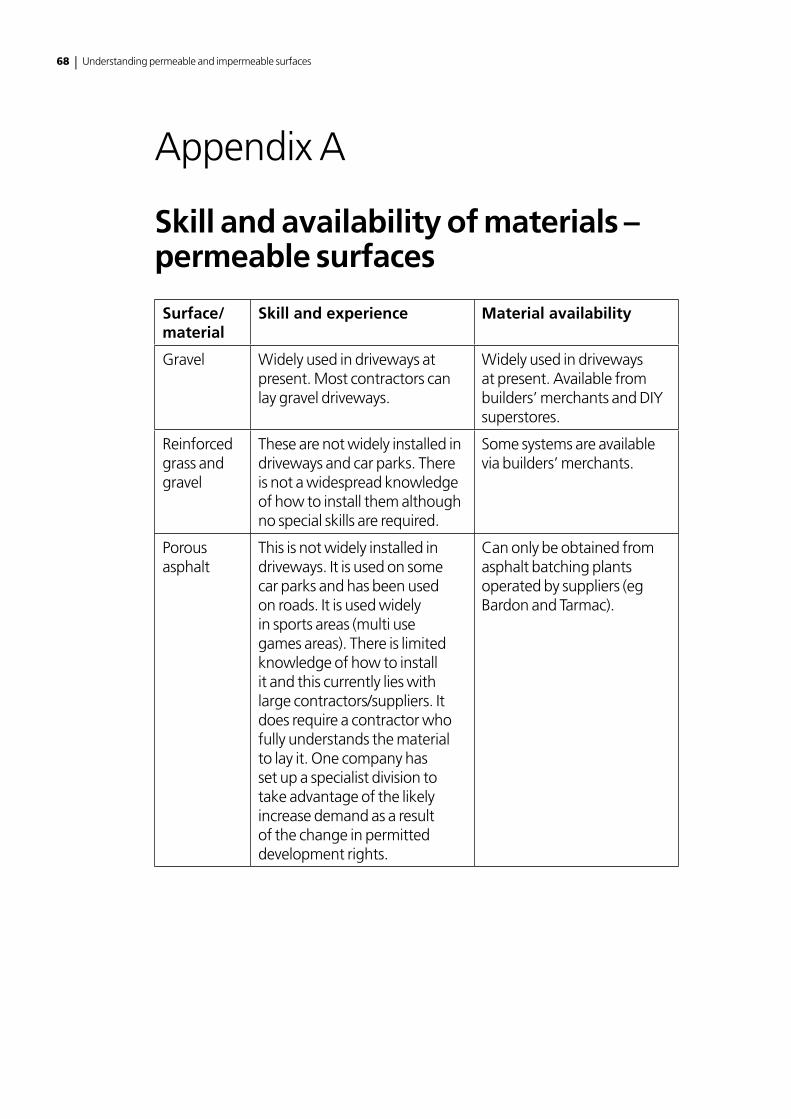
68 | Understanding permeable and impermeable surfaces
Appendix A
Skill and availability of materials – permeable surfaces
Surface/material
Skill and experience Material availability
Gravel Widely used in driveways at present. Most contractors can lay gravel driveways.
Widely used in driveways at present. Available from builders’ merchants and DIY superstores.
Reinforced grass and gravel
These are not widely installed in driveways and car parks. There is not a widespread knowledge of how to install them although no special skills are required.
Some systems are available via builders’ merchants.
Porous asphalt
This is not widely installed in driveways. It is used on some car parks and has been used on roads. It is used widely in sports areas (multi use games areas). There is limited knowledge of how to install it and this currently lies with large contractors/suppliers. It does require a contractor who fully understands the material to lay it. One company has set up a specialist division to take advantage of the likely increase demand as a result of the change in permitted development rights.
Can only be obtained from asphalt batching plants operated by suppliers (eg Bardon and Tarmac).
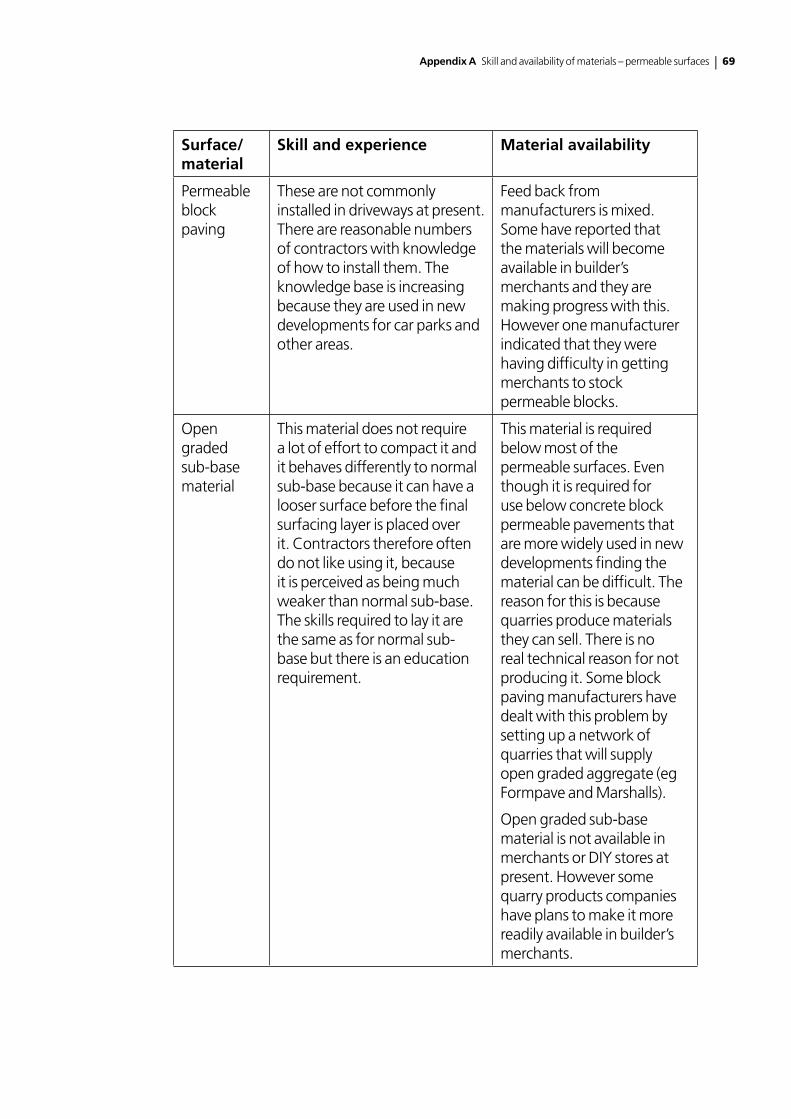
Appendix A Skill and availability of materials – permeable surfaces | 69
Surface/material
Skill and experience Material availability
Permeable block paving
These are not commonly installed in driveways at present. There are reasonable numbers of contractors with knowledge of how to install them. The knowledge base is increasing because they are used in new developments for car parks and other areas.
Feed back from manufacturers is mixed. Some have reported that the materials will become available in builder’s merchants and they are making progress with this. However one manufacturer indicated that they were having difficulty in getting merchants to stock permeable blocks.
Open graded sub-base material
This material does not require a lot of effort to compact it and it behaves differently to normal sub-base because it can have a looser surface before the final surfacing layer is placed over it. Contractors therefore often do not like using it, because it is perceived as being much weaker than normal sub-base. The skills required to lay it are the same as for normal sub-base but there is an education requirement.
This material is required below most of the permeable surfaces. Even though it is required for use below concrete block permeable pavements that are more widely used in new developments finding the material can be difficult. The reason for this is because quarries produce materials they can sell. There is no real technical reason for not producing it. Some block paving manufacturers have dealt with this problem by setting up a network of quarries that will supply open graded aggregate (eg Formpave and Marshalls).
Open graded sub-base material is not available in merchants or DIY stores at present. However some quarry products companies have plans to make it more readily available in builder’s merchants.
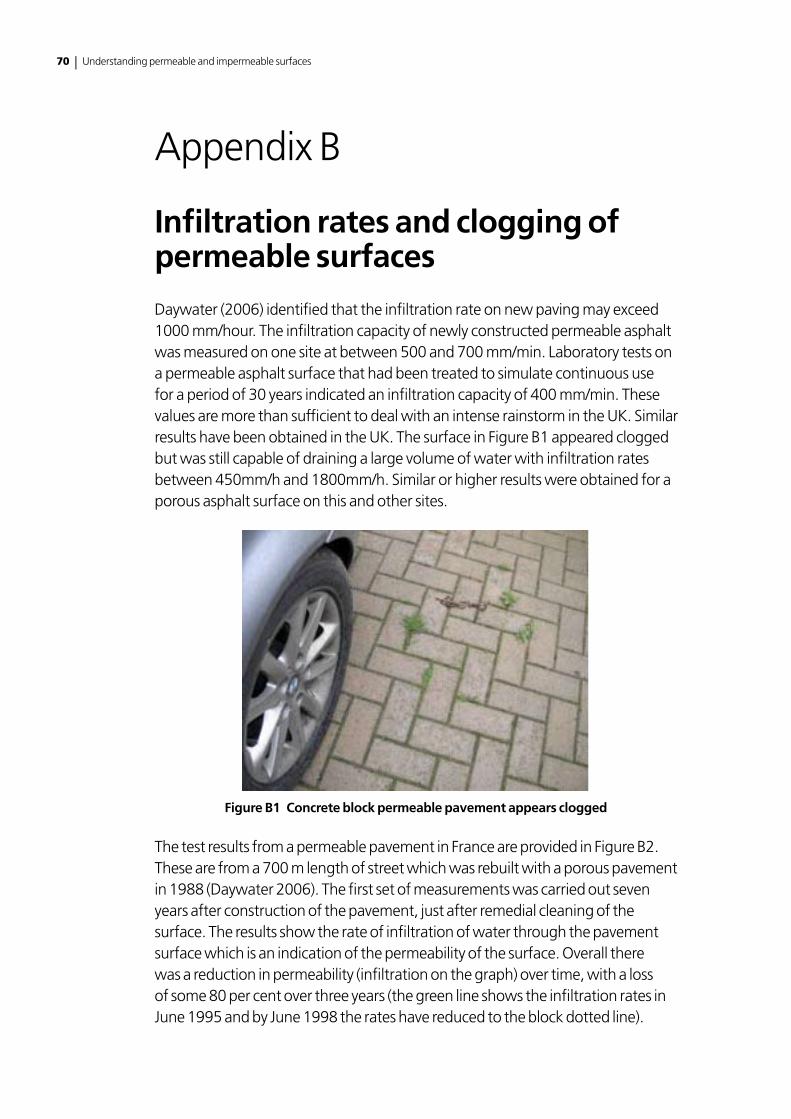
70 | Understanding permeable and impermeable surfaces
Appendix B
Infiltration rates and clogging of permeable surfaces
Daywater (2006) identified that the infiltration rate on new paving may exceed 1000 mm/hour. The infiltration capacity of newly constructed permeable asphalt was measured on one site at between 500 and 700 mm/min. Laboratory tests on a permeable asphalt surface that had been treated to simulate continuous use for a period of 30 years indicated an infiltration capacity of 400 mm/min. These values are more than sufficient to deal with an intense rainstorm in the UK. Similar results have been obtained in the UK. The surface in Figure B1 appeared clogged but was still capable of draining a large volume of water with infiltration rates between 450mm/h and 1800mm/h. Similar or higher results were obtained for a porous asphalt surface on this and other sites.
Figure B1 Concrete block permeable pavement appears clogged
The test results from a permeable pavement in France are provided in Figure B2. These are from a 700 m length of street which was rebuilt with a porous pavement in 1988 (Daywater 2006). The first set of measurements was carried out seven years after construction of the pavement, just after remedial cleaning of the surface. The results show the rate of infiltration of water through the pavement surface which is an indication of the permeability of the surface. Overall there was a reduction in permeability (infiltration on the graph) over time, with a loss of some 80 per cent over three years (the green line shows the infiltration rates in June 1995 and by June 1998 the rates have reduced to the block dotted line).
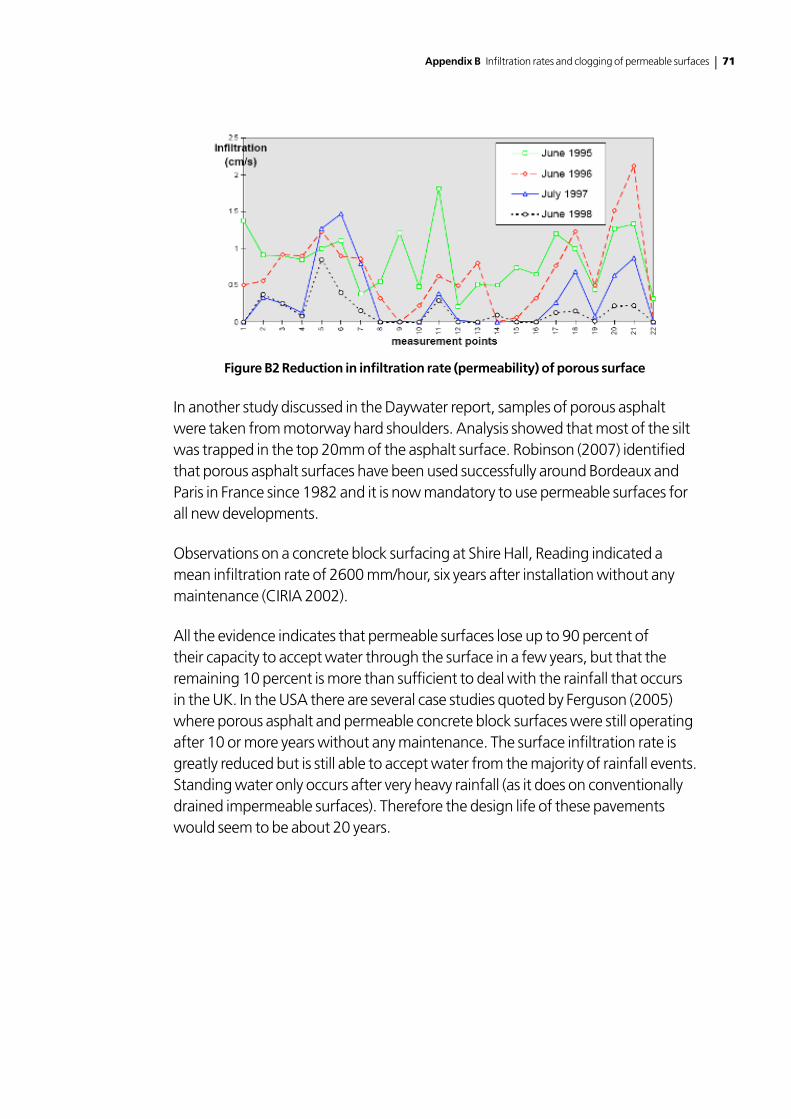
Appendix B Infiltration rates and clogging of permeable surfaces | 71
!
Figure B2 Reduction in infiltration rate (permeability) of porous surface
In another study discussed in the Daywater report, samples of porous asphalt were taken from motorway hard shoulders. Analysis showed that most of the silt was trapped in the top 20mm of the asphalt surface. Robinson (2007) identified that porous asphalt surfaces have been used successfully around Bordeaux and Paris in France since 1982 and it is now mandatory to use permeable surfaces for all new developments.
Observations on a concrete block surfacing at Shire Hall, Reading indicated a mean infiltration rate of 2600 mm/hour, six years after installation without any maintenance (CIRIA 2002).
All the evidence indicates that permeable surfaces lose up to 90 percent of their capacity to accept water through the surface in a few years, but that the remaining 10 percent is more than sufficient to deal with the rainfall that occurs in the UK. In the USA there are several case studies quoted by Ferguson (2005) where porous asphalt and permeable concrete block surfaces were still operating after 10 or more years without any maintenance. The surface infiltration rate is greatly reduced but is still able to accept water from the majority of rainfall events. Standing water only occurs after very heavy rainfall (as it does on conventionally drained impermeable surfaces). Therefore the design life of these pavements would seem to be about 20 years.
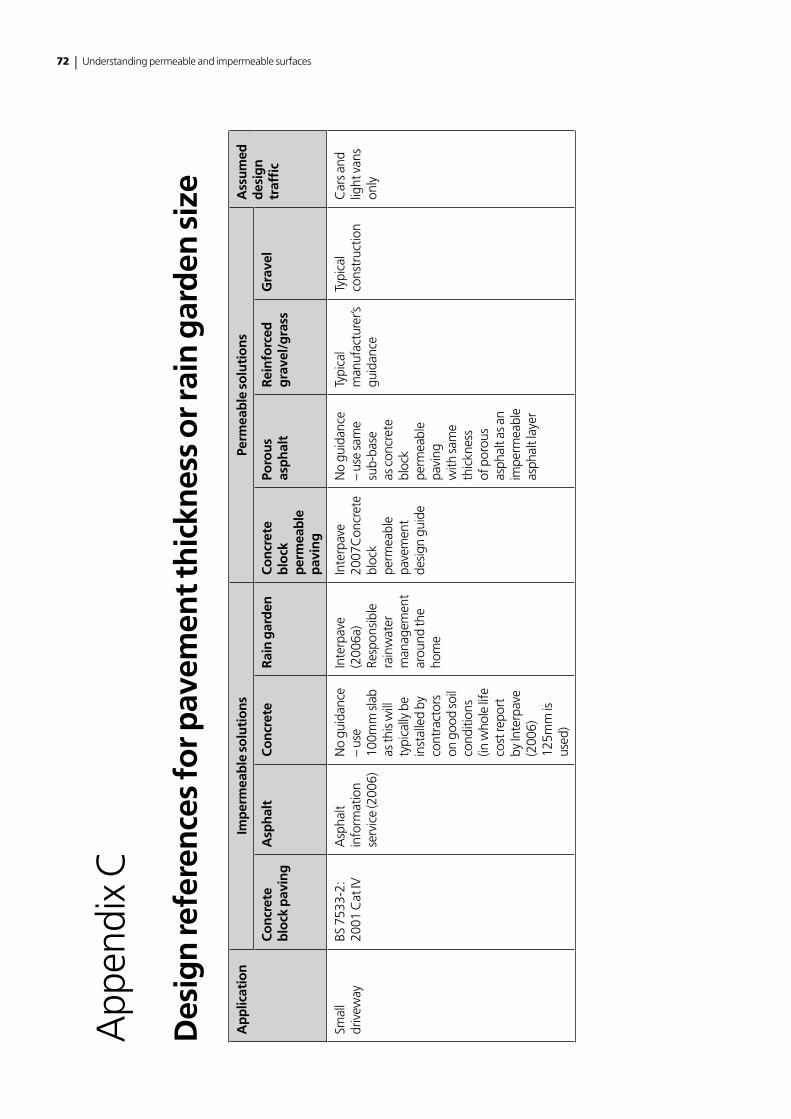
72 | Understanding permeable and impermeable surfaces
App
endi
x C
Des
ign
refe
ren
ces
for p
avem
ent t
hic
knes
s o
r rai
n g
ard
en s
ize
Ap
plic
atio
nIm
per
mea
ble
so
luti
on
sPe
rmea
ble
so
luti
on
sA
ssu
med
d
esig
n
traf
fic
Co
ncr
ete
blo
ck p
avin
gA
sph
alt
Co
ncr
ete
Rai
n g
ard
enC
on
cret
e b
lock
p
erm
eab
le
pav
ing
Poro
us
asp
hal
tR
ein
forc
ed
gra
vel/
gra
ssG
rave
l
Smal
l dr
ivew
ayBS
753
3-2:
20
01 C
at IV
Asp
halt
info
rmat
ion
serv
ice
(200
6)
No
guid
ance
–
use
100m
m sl
ab
as th
is w
ill
typi
cally
be
inst
alle
d by
co
ntra
ctor
s on
goo
d so
il co
nditi
ons
(in w
hole
life
co
st re
port
by
Inte
rpav
e (2
006)
12
5mm
is
used
)
Inte
rpav
e (2
006a
) Re
spon
sibl
e ra
inw
ater
m
anag
emen
t ar
ound
the
hom
e
Inte
rpav
e 20
07C
oncr
ete
bloc
k pe
rmea
ble
pave
men
t de
sign
gui
de
No
guid
ance
–
use
sam
e su
b-ba
se
as c
oncr
ete
bloc
k pe
rmea
ble
pavi
ng
with
sam
e th
ickn
ess
of p
orou
s as
phal
t as a
n im
perm
eabl
e as
phal
t lay
er
Typi
cal
man
ufac
ture
r’s
guid
ance
Typi
cal
cons
truc
tion
Car
s and
lig
ht v
ans
only
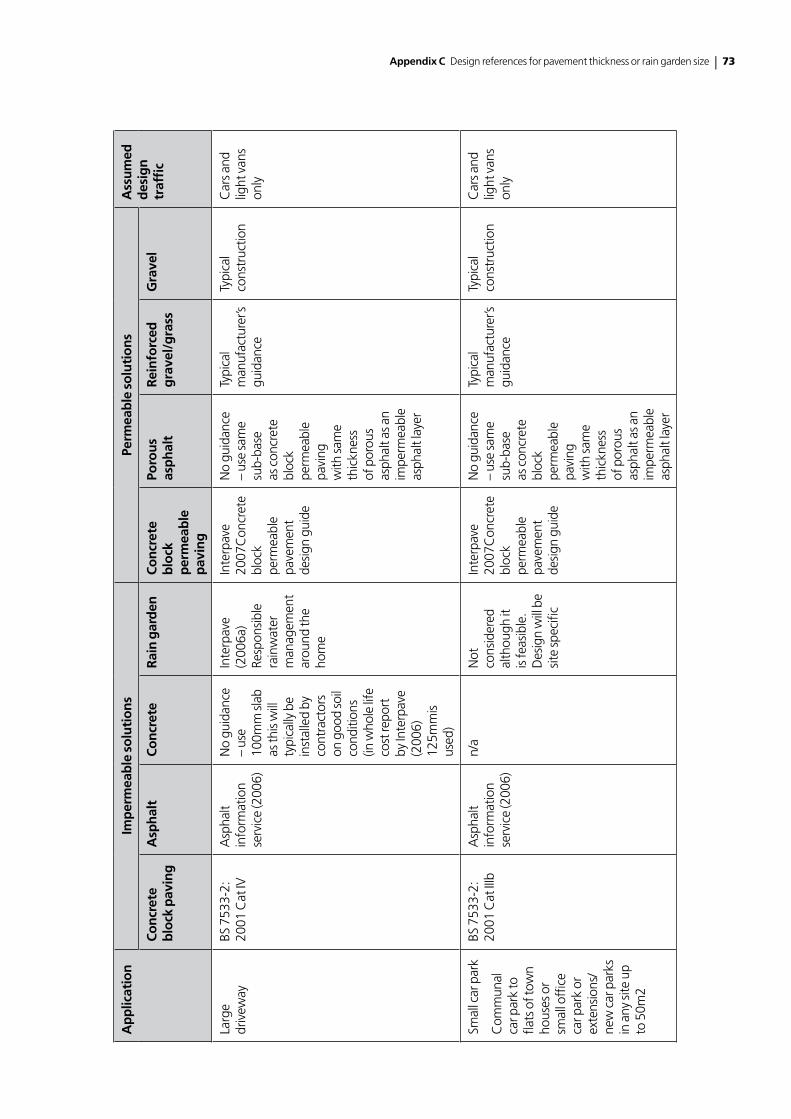
Appendix C Design references for pavement thickness or rain garden size | 73
Ap
plic
atio
nIm
per
mea
ble
so
luti
on
sPe
rmea
ble
so
luti
on
sA
ssu
med
d
esig
n
traf
fic
Co
ncr
ete
blo
ck p
avin
gA
sph
alt
Co
ncr
ete
Rai
n g
ard
enC
on
cret
e b
lock
p
erm
eab
le
pav
ing
Poro
us
asp
hal
tR
ein
forc
ed
gra
vel/
gra
ssG
rave
l
Larg
e dr
ivew
ayBS
753
3-2:
20
01 C
at IV
Asp
halt
info
rmat
ion
serv
ice
(200
6)
No
guid
ance
–
use
100m
m sl
ab
as th
is w
ill
typi
cally
be
inst
alle
d by
co
ntra
ctor
s on
goo
d so
il co
nditi
ons
(in w
hole
life
co
st re
port
by
Inte
rpav
e (2
006)
12
5mm
is
used
)
Inte
rpav
e (2
006a
) Re
spon
sibl
e ra
inw
ater
m
anag
emen
t ar
ound
the
hom
e
Inte
rpav
e 20
07C
oncr
ete
bloc
k pe
rmea
ble
pave
men
t de
sign
gui
de
No
guid
ance
–
use
sam
e su
b-ba
se
as c
oncr
ete
bloc
k pe
rmea
ble
pavi
ng
with
sam
e th
ickn
ess
of p
orou
s as
phal
t as a
n im
perm
eabl
e as
phal
t lay
er
Typi
cal
man
ufac
ture
r’s
guid
ance
Typi
cal
cons
truc
tion
Car
s and
lig
ht v
ans
only
Smal
l car
par
k
Com
mun
al
car p
ark
to
flats
of t
own
hous
es o
r sm
all o
ffice
ca
r par
k or
ex
tens
ions
/ne
w c
ar p
arks
in
any
site
up
to 5
0m2
BS 7
533-
2:
2001
Cat
IIIb
Asp
halt
info
rmat
ion
serv
ice
(200
6)
n/a
Not
co
nsid
ered
al
thou
gh it
is
feas
ible
. D
esig
n w
ill b
e si
te sp
ecifi
c
Inte
rpav
e 20
07C
oncr
ete
bloc
k pe
rmea
ble
pave
men
t de
sign
gui
de
No
guid
ance
–
use
sam
e su
b-ba
se
as c
oncr
ete
bloc
k pe
rmea
ble
pavi
ng
with
sam
e th
ickn
ess
of p
orou
s as
phal
t as a
n im
perm
eabl
e as
phal
t lay
er
Typi
cal
man
ufac
ture
r’s
guid
ance
Typi
cal
cons
truc
tion
Car
s and
lig
ht v
ans
only
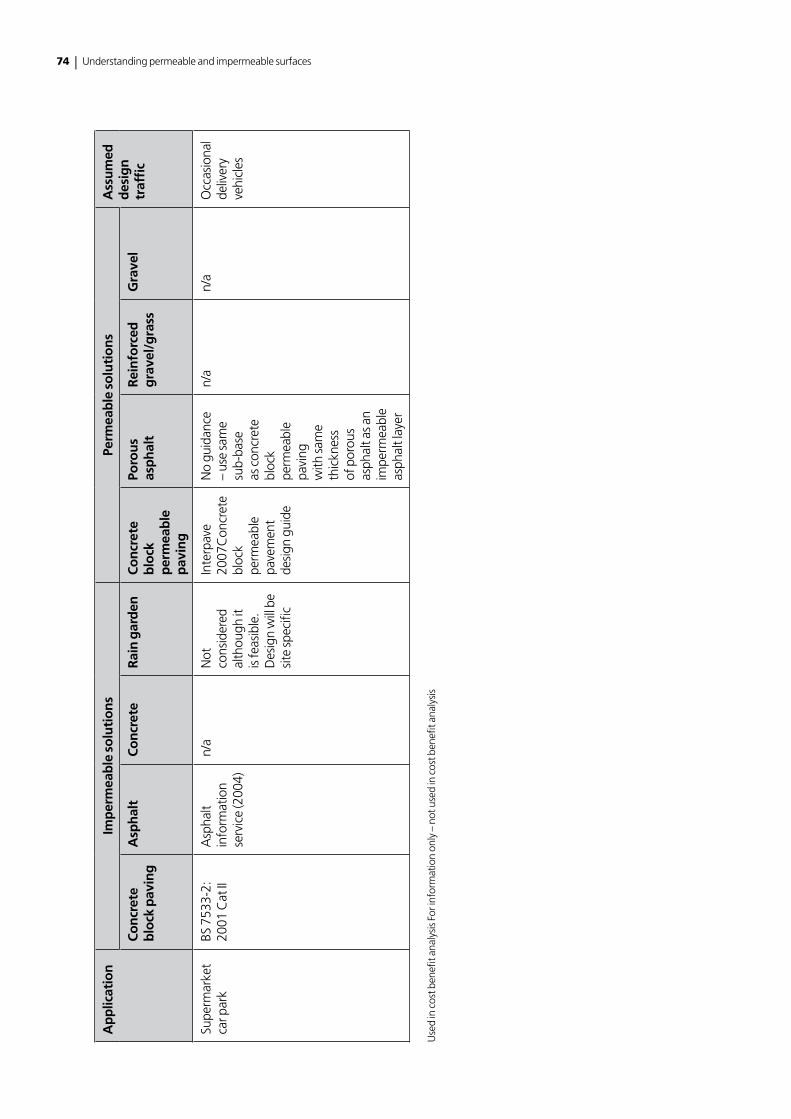
74 | Understanding permeable and impermeable surfaces
Ap
plic
atio
nIm
per
mea
ble
so
luti
on
sPe
rmea
ble
so
luti
on
sA
ssu
med
d
esig
n
traf
fic
Co
ncr
ete
blo
ck p
avin
gA
sph
alt
Co
ncr
ete
Rai
n g
ard
enC
on
cret
e b
lock
p
erm
eab
le
pav
ing
Poro
us
asp
hal
tR
ein
forc
ed
gra
vel/
gra
ssG
rave
l
Supe
rmar
ket
car p
ark
BS 7
533-
2:
2001
Cat
IIA
spha
lt in
form
atio
n se
rvic
e (2
004)
n/a
Not
co
nsid
ered
al
thou
gh it
is
feas
ible
. D
esig
n w
ill b
e si
te sp
ecifi
c
Inte
rpav
e 20
07C
oncr
ete
bloc
k pe
rmea
ble
pave
men
t de
sign
gui
de
No
guid
ance
–
use
sam
e su
b-ba
se
as c
oncr
ete
bloc
k pe
rmea
ble
pavi
ng
with
sam
e th
ickn
ess
of p
orou
s as
phal
t as a
n im
perm
eabl
e as
phal
t lay
er
n/a
n/a
Occ
asio
nal
deliv
ery
vehi
cles
Use
d in
cos
t ben
efit a
naly
sis F
or in
form
atio
n on
ly –
not
use
d in
cos
t ben
efit a
naly
sis
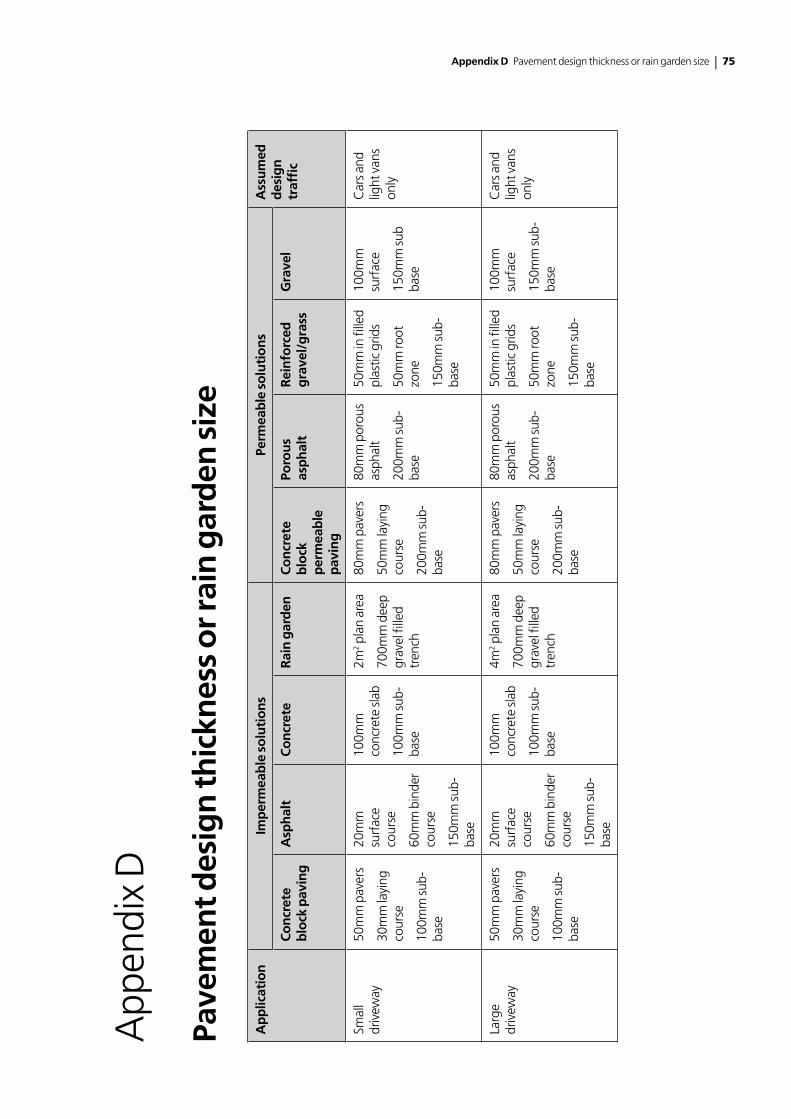
Appendix D Pavement design thickness or rain garden size | 75
App
endi
x D
Pave
men
t des
ign
thic
knes
s o
r rai
n g
ard
en s
ize
Ap
plic
atio
nIm
per
mea
ble
so
luti
on
sPe
rmea
ble
so
luti
on
sA
ssu
med
d
esig
n
traf
fic
Co
ncr
ete
blo
ck p
avin
gA
sph
alt
Co
ncr
ete
Rai
n g
ard
enC
on
cret
e b
lock
p
erm
eab
le
pav
ing
Poro
us
asp
hal
tR
ein
forc
ed
gra
vel/
gra
ssG
rave
l
Smal
l dr
ivew
ay50
mm
pav
ers
30m
m la
ying
co
urse
100m
m su
b-ba
se
20m
m
surf
ace
cour
se
60m
m b
inde
r co
urse
150m
m su
b-ba
se
100m
m
conc
rete
slab
100m
m su
b-ba
se
2m2 p
lan
area
700m
m d
eep
grav
el fi
lled
tren
ch
80m
m p
aver
s
50m
m la
ying
co
urse
200m
m su
b-ba
se
80m
m p
orou
s as
phal
t
200m
m su
b-ba
se
50m
m in
fille
d pl
astic
grid
s
50m
m ro
ot
zone
150m
m su
b-ba
se
100m
m
surf
ace
150m
m su
b ba
se
Car
s and
lig
ht v
ans
only
Larg
e dr
ivew
ay50
mm
pav
ers
30m
m la
ying
co
urse
100m
m su
b-ba
se
20m
m
surf
ace
cour
se
60m
m b
inde
r co
urse
150m
m su
b-ba
se
100m
m
conc
rete
slab
100m
m su
b-ba
se
4m2 p
lan
area
700m
m d
eep
grav
el fi
lled
tren
ch
80m
m p
aver
s
50m
m la
ying
co
urse
200m
m su
b-ba
se
80m
m p
orou
s as
phal
t
200m
m su
b-ba
se
50m
m in
fille
d pl
astic
grid
s
50m
m ro
ot
zone
150m
m su
b-ba
se
100m
m
surf
ace
150m
m su
b-ba
se
Car
s and
lig
ht v
ans
only
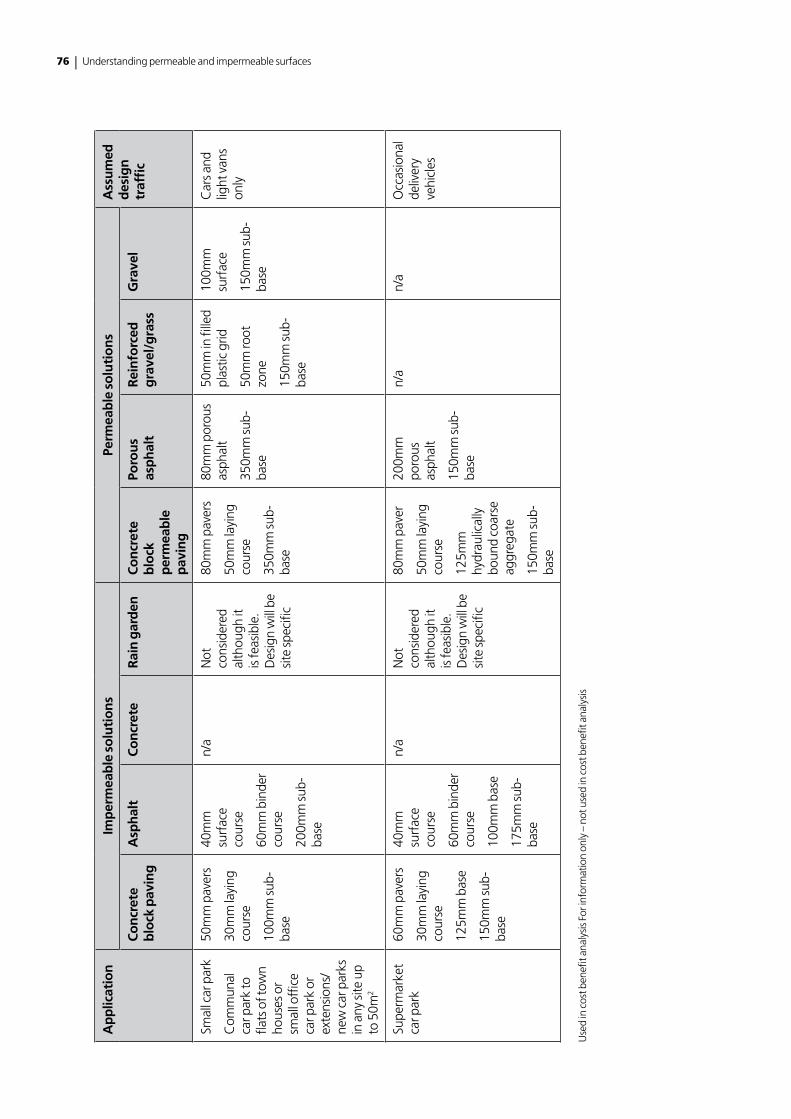
76 | Understanding permeable and impermeable surfaces
Ap
plic
atio
nIm
per
mea
ble
so
luti
on
sPe
rmea
ble
so
luti
on
sA
ssu
med
d
esig
n
traf
fic
Co
ncr
ete
blo
ck p
avin
gA
sph
alt
Co
ncr
ete
Rai
n g
ard
enC
on
cret
e b
lock
p
erm
eab
le
pav
ing
Poro
us
asp
hal
tR
ein
forc
ed
gra
vel/
gra
ssG
rave
l
Smal
l car
par
k
Com
mun
al
car p
ark
to
flats
of t
own
hous
es o
r sm
all o
ffice
ca
r par
k or
ex
tens
ions
/ne
w c
ar p
arks
in
any
site
up
to 5
0m2
50m
m p
aver
s
30m
m la
ying
co
urse
100m
m su
b-ba
se
40m
m
surf
ace
cour
se
60m
m b
inde
r co
urse
200m
m su
b-ba
se
n/a
Not
co
nsid
ered
al
thou
gh it
is
feas
ible
. D
esig
n w
ill b
e si
te sp
ecifi
c
80m
m p
aver
s
50m
m la
ying
co
urse
350m
m su
b-ba
se
80m
m p
orou
s as
phal
t
350m
m su
b-ba
se
50m
m in
fille
d pl
astic
grid
50m
m ro
ot
zone
150m
m su
b-ba
se
100m
m
surf
ace
150m
m su
b-ba
se
Car
s and
lig
ht v
ans
only
Supe
rmar
ket
car p
ark
60m
m p
aver
s
30m
m la
ying
co
urse
125m
m b
ase
150m
m su
b-ba
se
40m
m
surf
ace
cour
se
60m
m b
inde
r co
urse
100m
m b
ase
175m
m su
b-ba
se
n/a
Not
co
nsid
ered
al
thou
gh it
is
feas
ible
. D
esig
n w
ill b
e si
te sp
ecifi
c
80m
m p
aver
50m
m la
ying
co
urse
125m
m
hydr
aulic
ally
bo
und
coar
se
aggr
egat
e
150m
m su
b-ba
se
200m
m
poro
us
asph
alt
150m
m su
b-ba
se
n/a
n/a
Occ
asio
nal
deliv
ery
vehi
cles
Use
d in
cos
t ben
efit a
naly
sis F
or in
form
atio
n on
ly –
not
use
d in
cos
t ben
efit a
naly
sis
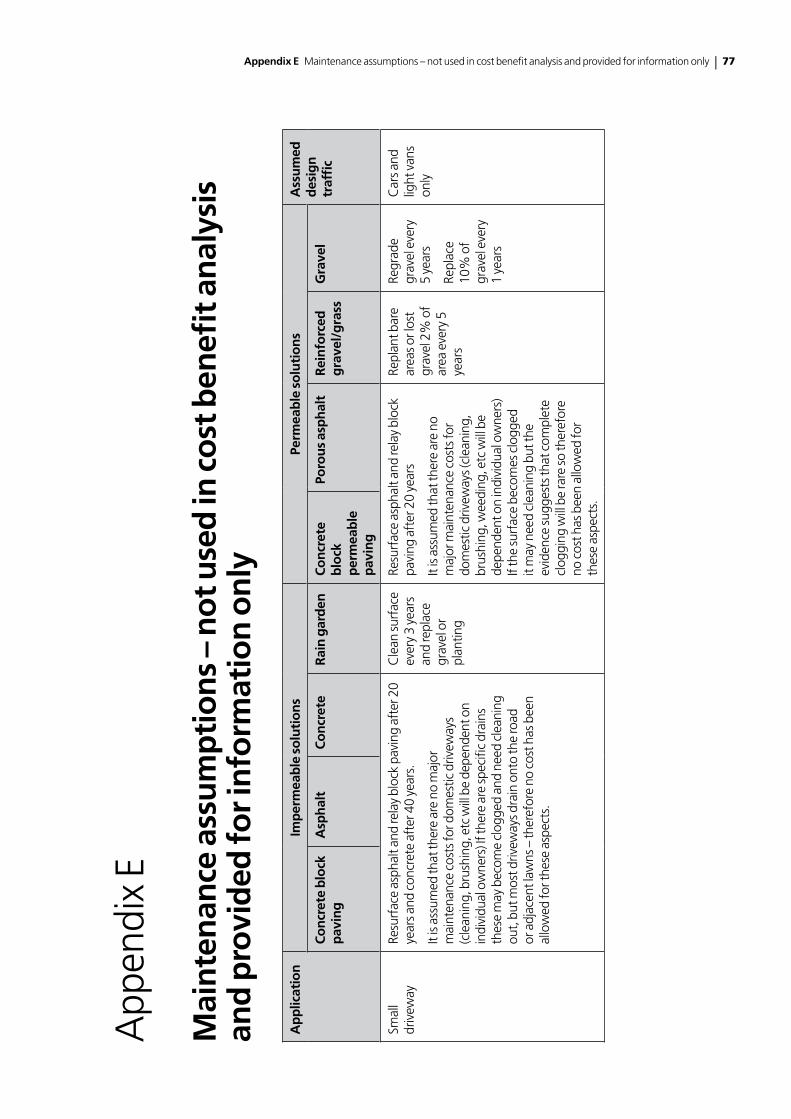
Appendix E Maintenance assumptions – not used in cost benefit analysis and provided for information only | 77
App
endi
x E
Mai
nte
nan
ce a
ssu
mp
tio
ns
– n
ot u
sed
in c
ost
ben
efit a
nal
ysis
an
d p
rovi
ded
for i
nfo
rmat
ion
on
ly
Ap
plic
atio
nIm
per
mea
ble
so
luti
on
sPe
rmea
ble
so
luti
on
sA
ssu
med
d
esig
n
traf
fic
Co
ncr
ete
blo
ck
pav
ing
Asp
hal
tC
on
cret
eR
ain
gar
den
Co
ncr
ete
blo
ck
per
mea
ble
p
avin
g
Poro
us
asp
hal
tR
ein
forc
ed
gra
vel/
gra
ssG
rave
l
Smal
l dr
ivew
ayRe
surf
ace
asph
alt a
nd re
lay
bloc
k pa
ving
aft
er 2
0 ye
ars a
nd c
oncr
ete
afte
r 40
year
s.
It is
ass
umed
that
ther
e ar
e no
maj
or
mai
nten
ance
cos
ts fo
r dom
estic
driv
eway
s (c
lean
ing,
bru
shin
g, e
tc w
ill b
e de
pend
ent o
n in
divi
dual
ow
ners
) If t
here
are
spec
ific
drai
ns
thes
e m
ay b
ecom
e cl
ogge
d an
d ne
ed c
lean
ing
out,
but
mos
t driv
eway
s dra
in o
nto
the
road
or
adj
acen
t law
ns –
ther
efor
e no
cos
t has
bee
n al
low
ed fo
r the
se a
spec
ts.
Cle
an su
rfac
e ev
ery
3 ye
ars
and
repl
ace
grav
el o
r pl
antin
g
Resu
rfac
e as
phal
t and
rela
y bl
ock
pavi
ng a
fter
20
year
s
It is
ass
umed
that
ther
e ar
e no
m
ajor
mai
nten
ance
cos
ts fo
r do
mes
tic d
rivew
ays (
clea
ning
, br
ushi
ng, w
eedi
ng, e
tc w
ill b
e de
pend
ent o
n in
divi
dual
ow
ners
) If
the
surf
ace
beco
mes
clo
gged
it
may
nee
d cl
eani
ng b
ut th
e ev
iden
ce su
gges
ts th
at c
ompl
ete
clog
ging
will
be
rare
so th
eref
ore
no c
ost h
as b
een
allo
wed
for
thes
e as
pect
s.
Repl
ant b
are
area
s or l
ost
grav
el 2
% o
f ar
ea e
very
5
year
s
Regr
ade
grav
el e
very
5
year
s
Repl
ace
10%
of
grav
el e
very
1
year
s
Car
s and
lig
ht v
ans
only
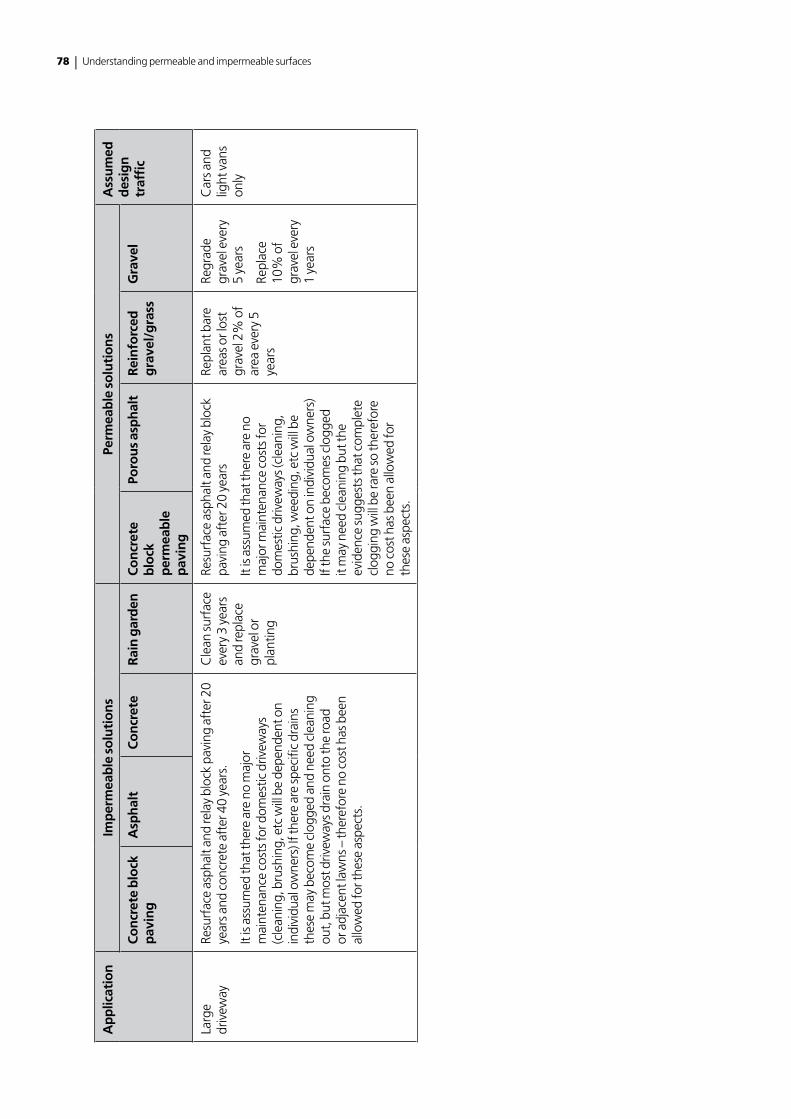
78 | Understanding permeable and impermeable surfaces
Ap
plic
atio
nIm
per
mea
ble
so
luti
on
sPe
rmea
ble
so
luti
on
sA
ssu
med
d
esig
n
traf
fic
Co
ncr
ete
blo
ck
pav
ing
Asp
hal
tC
on
cret
eR
ain
gar
den
Co
ncr
ete
blo
ck
per
mea
ble
p
avin
g
Poro
us
asp
hal
tR
ein
forc
ed
gra
vel/
gra
ssG
rave
l
Larg
e dr
ivew
ayRe
surf
ace
asph
alt a
nd re
lay
bloc
k pa
ving
aft
er 2
0 ye
ars a
nd c
oncr
ete
afte
r 40
year
s.
It is
ass
umed
that
ther
e ar
e no
maj
or
mai
nten
ance
cos
ts fo
r dom
estic
driv
eway
s (c
lean
ing,
bru
shin
g, e
tc w
ill b
e de
pend
ent o
n in
divi
dual
ow
ners
) If t
here
are
spec
ific
drai
ns
thes
e m
ay b
ecom
e cl
ogge
d an
d ne
ed c
lean
ing
out,
but
mos
t driv
eway
s dra
in o
nto
the
road
or
adj
acen
t law
ns –
ther
efor
e no
cos
t has
bee
n al
low
ed fo
r the
se a
spec
ts.
Cle
an su
rfac
e ev
ery
3 ye
ars
and
repl
ace
grav
el o
r pl
antin
g
Resu
rfac
e as
phal
t and
rela
y bl
ock
pavi
ng a
fter
20
year
s
It is
ass
umed
that
ther
e ar
e no
m
ajor
mai
nten
ance
cos
ts fo
r do
mes
tic d
rivew
ays (
clea
ning
, br
ushi
ng, w
eedi
ng, e
tc w
ill b
e de
pend
ent o
n in
divi
dual
ow
ners
) If
the
surf
ace
beco
mes
clo
gged
it
may
nee
d cl
eani
ng b
ut th
e ev
iden
ce su
gges
ts th
at c
ompl
ete
clog
ging
will
be
rare
so th
eref
ore
no c
ost h
as b
een
allo
wed
for
thes
e as
pect
s.
Repl
ant b
are
area
s or l
ost
grav
el 2
% o
f ar
ea e
very
5
year
s
Regr
ade
grav
el e
very
5
year
s
Repl
ace
10%
of
grav
el e
very
1
year
s
Car
s and
lig
ht v
ans
only
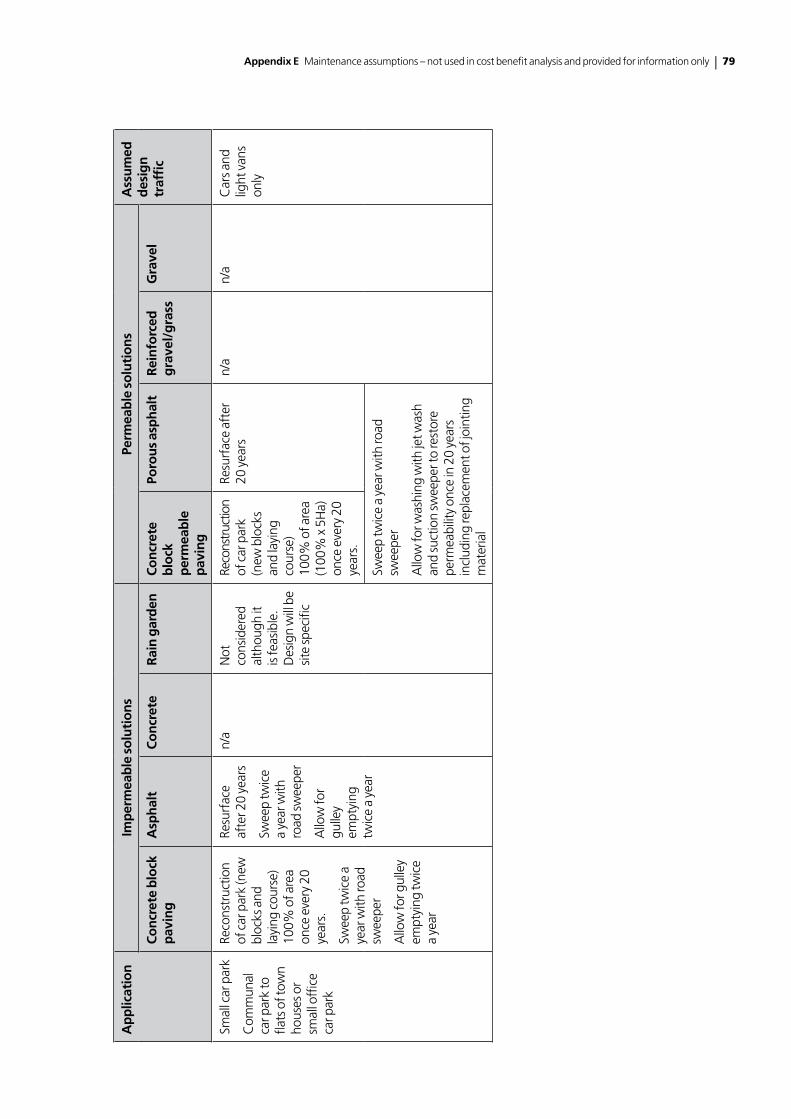
Appendix E Maintenance assumptions – not used in cost benefit analysis and provided for information only | 79
Ap
plic
atio
nIm
per
mea
ble
so
luti
on
sPe
rmea
ble
so
luti
on
sA
ssu
med
d
esig
n
traf
fic
Co
ncr
ete
blo
ck
pav
ing
Asp
hal
tC
on
cret
eR
ain
gar
den
Co
ncr
ete
blo
ck
per
mea
ble
p
avin
g
Poro
us
asp
hal
tR
ein
forc
ed
gra
vel/
gra
ssG
rave
l
Smal
l car
par
k
Com
mun
al
car p
ark
to
flats
of t
own
hous
es o
r sm
all o
ffice
ca
r par
k
Reco
nstr
uctio
n of
car
par
k (n
ew
bloc
ks a
nd
layi
ng c
ours
e)
100%
of a
rea
once
eve
ry 2
0 ye
ars.
Swee
p tw
ice
a ye
ar w
ith ro
ad
swee
per
Allo
w fo
r gul
ley
empt
ying
twic
e a
year
Resu
rfac
e af
ter 2
0 ye
ars
Swee
p tw
ice
a ye
ar w
ith
road
swee
per
Allo
w fo
r gu
lley
empt
ying
tw
ice
a ye
ar
n/a
Not
co
nsid
ered
al
thou
gh it
is
feas
ible
. D
esig
n w
ill b
e si
te sp
ecifi
c
Reco
nstru
ctio
n of
car
par
k (n
ew b
lock
s an
d la
ying
co
urse
) 10
0% o
f are
a (1
00%
x 5
Ha)
on
ce e
very
20
year
s.
Resu
rfac
e af
ter
20 y
ears
n/a
n/a
Car
s and
lig
ht v
ans
only
Swee
p tw
ice
a ye
ar w
ith ro
ad
swee
per
Allo
w fo
r was
hing
with
jet w
ash
and
suct
ion
swee
per t
o re
stor
e pe
rmea
bilit
y on
ce in
20
year
s in
clud
ing
repl
acem
ent o
f joi
ntin
g m
ater
ial
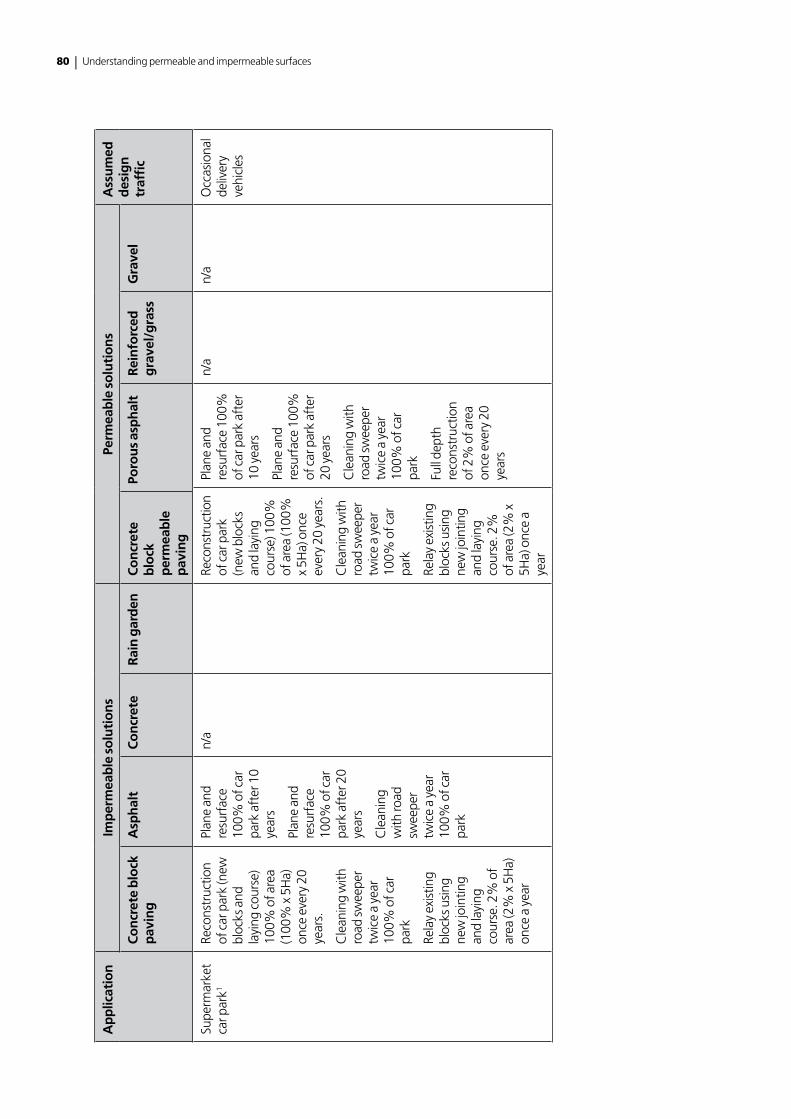
80 | Understanding permeable and impermeable surfaces
Ap
plic
atio
nIm
per
mea
ble
so
luti
on
sPe
rmea
ble
so
luti
on
sA
ssu
med
d
esig
n
traf
fic
Co
ncr
ete
blo
ck
pav
ing
Asp
hal
tC
on
cret
eR
ain
gar
den
Co
ncr
ete
blo
ck
per
mea
ble
p
avin
g
Poro
us
asp
hal
tR
ein
forc
ed
gra
vel/
gra
ssG
rave
l
Supe
rmar
ket
car p
ark1
Reco
nstr
uctio
n of
car
par
k (n
ew
bloc
ks a
nd
layi
ng c
ours
e)
100%
of a
rea
(100
% x
5H
a)
once
eve
ry 2
0 ye
ars.
Cle
anin
g w
ith
road
swee
per
twic
e a
year
10
0% o
f car
pa
rk
Rela
y ex
istin
g bl
ocks
usi
ng
new
join
ting
and
layi
ng
cour
se. 2
% o
f ar
ea (2
% x
5H
a)
once
a y
ear
Plan
e an
d re
surf
ace
100%
of c
ar
park
aft
er 1
0 ye
ars
Plan
e an
d re
surf
ace
100%
of c
ar
park
aft
er 2
0 ye
ars
Cle
anin
g w
ith ro
ad
swee
per
twic
e a
year
10
0% o
f car
pa
rk
n/a
Reco
nstr
uctio
n of
car
par
k (n
ew b
lock
s an
d la
ying
co
urse
) 100
%
of a
rea
(100
%
x 5H
a) o
nce
ever
y 20
yea
rs.
Cle
anin
g w
ith
road
swee
per
twic
e a
year
10
0% o
f car
pa
rk
Rela
y ex
istin
g bl
ocks
usi
ng
new
join
ting
and
layi
ng
cour
se. 2
%
of a
rea
(2%
x
5Ha)
onc
e a
year
Plan
e an
d re
surf
ace
100%
of
car
par
k af
ter
10 y
ears
Plan
e an
d re
surf
ace
100%
of
car
par
k af
ter
20 y
ears
Cle
anin
g w
ith
road
swee
per
twic
e a
year
10
0% o
f car
pa
rk
Full
dept
h re
cons
truc
tion
of 2
% o
f are
a on
ce e
very
20
year
s
n/a
n/a
Occ
asio
nal
deliv
ery
vehi
cles
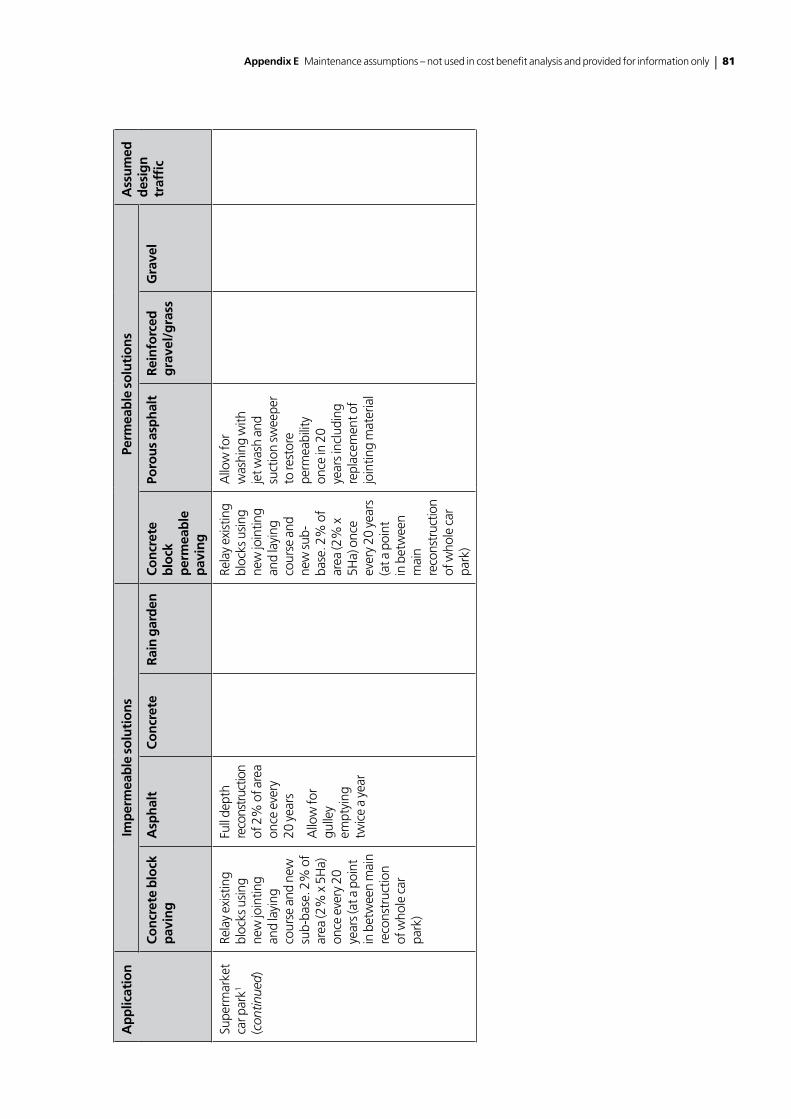
Appendix E Maintenance assumptions – not used in cost benefit analysis and provided for information only | 81
Ap
plic
atio
nIm
per
mea
ble
so
luti
on
sPe
rmea
ble
so
luti
on
sA
ssu
med
d
esig
n
traf
fic
Co
ncr
ete
blo
ck
pav
ing
Asp
hal
tC
on
cret
eR
ain
gar
den
Co
ncr
ete
blo
ck
per
mea
ble
p
avin
g
Poro
us
asp
hal
tR
ein
forc
ed
gra
vel/
gra
ssG
rave
l
Supe
rmar
ket
car p
ark1
(con
tinue
d)
Rela
y ex
istin
g bl
ocks
usi
ng
new
join
ting
and
layi
ng
cour
se a
nd n
ew
sub-
base
. 2%
of
area
(2%
x 5
Ha)
on
ce e
very
20
year
s (at
a p
oint
in
bet
wee
n m
ain
reco
nstr
uctio
n of
who
le c
ar
park
)
Full
dept
h re
cons
truc
tion
of 2
% o
f are
a on
ce e
very
20
yea
rs
Allo
w fo
r gu
lley
empt
ying
tw
ice
a ye
ar
Rela
y ex
istin
g bl
ocks
usi
ng
new
join
ting
and
layi
ng
cour
se a
nd
new
sub-
base
. 2%
of
area
(2%
x
5Ha)
onc
e ev
ery
20 y
ears
(a
t a p
oint
in
bet
wee
n m
ain
reco
nstr
uctio
n of
who
le c
ar
park
)
Allo
w fo
r w
ashi
ng w
ith
jet w
ash
and
suct
ion
swee
per
to re
stor
e pe
rmea
bilit
y on
ce in
20
year
s inc
ludi
ng
repl
acem
ent o
f jo
intin
g m
ater
ial
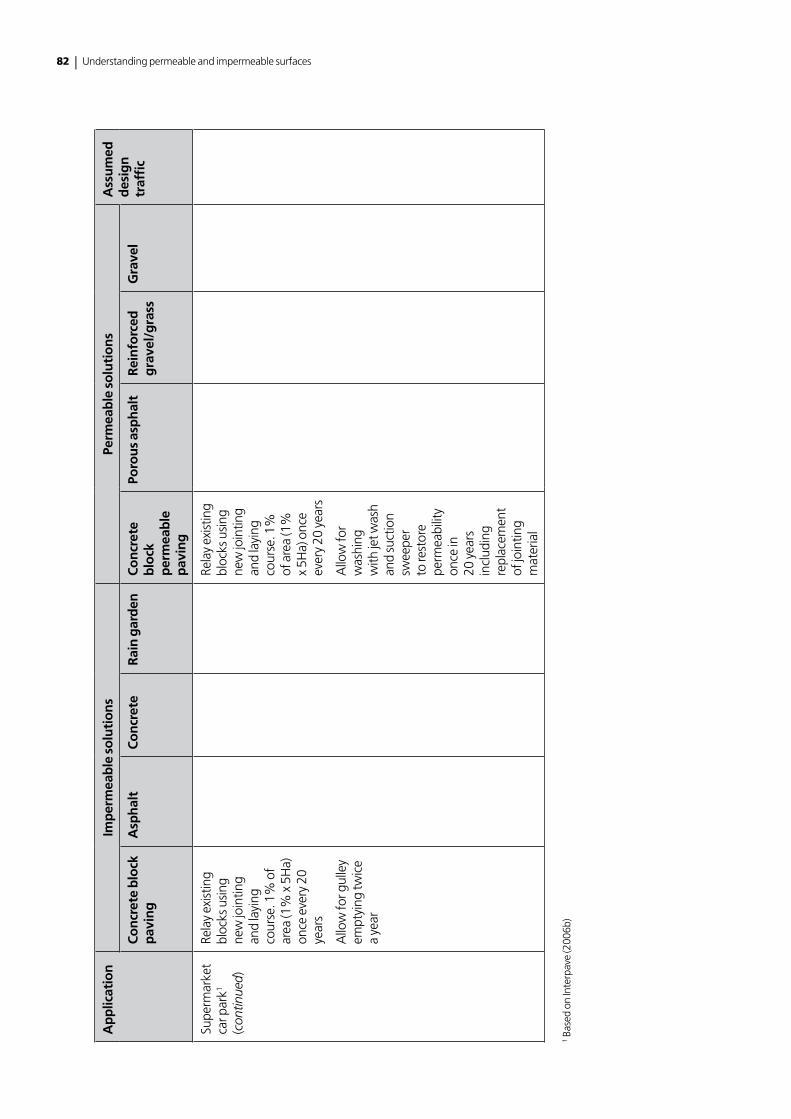
82 | Understanding permeable and impermeable surfaces
Ap
plic
atio
nIm
per
mea
ble
so
luti
on
sPe
rmea
ble
so
luti
on
sA
ssu
med
d
esig
n
traf
fic
Co
ncr
ete
blo
ck
pav
ing
Asp
hal
tC
on
cret
eR
ain
gar
den
Co
ncr
ete
blo
ck
per
mea
ble
p
avin
g
Poro
us
asp
hal
tR
ein
forc
ed
gra
vel/
gra
ssG
rave
l
Supe
rmar
ket
car p
ark1
(con
tinue
d)
Rela
y ex
istin
g bl
ocks
usi
ng
new
join
ting
and
layi
ng
cour
se. 1
% o
f ar
ea (1
% x
5H
a)
once
eve
ry 2
0 ye
ars
Allo
w fo
r gul
ley
empt
ying
twic
e a
year
Rela
y ex
istin
g bl
ocks
usi
ng
new
join
ting
and
layi
ng
cour
se. 1
%
of a
rea
(1%
x
5Ha)
onc
e ev
ery
20 y
ears
Allo
w fo
r w
ashi
ng
with
jet w
ash
and
suct
ion
swee
per
to re
stor
e pe
rmea
bilit
y on
ce in
20
yea
rs
incl
udin
g re
plac
emen
t of
join
ting
mat
eria
l
1 Bas
ed o
n In
terp
ave
(200
6b)
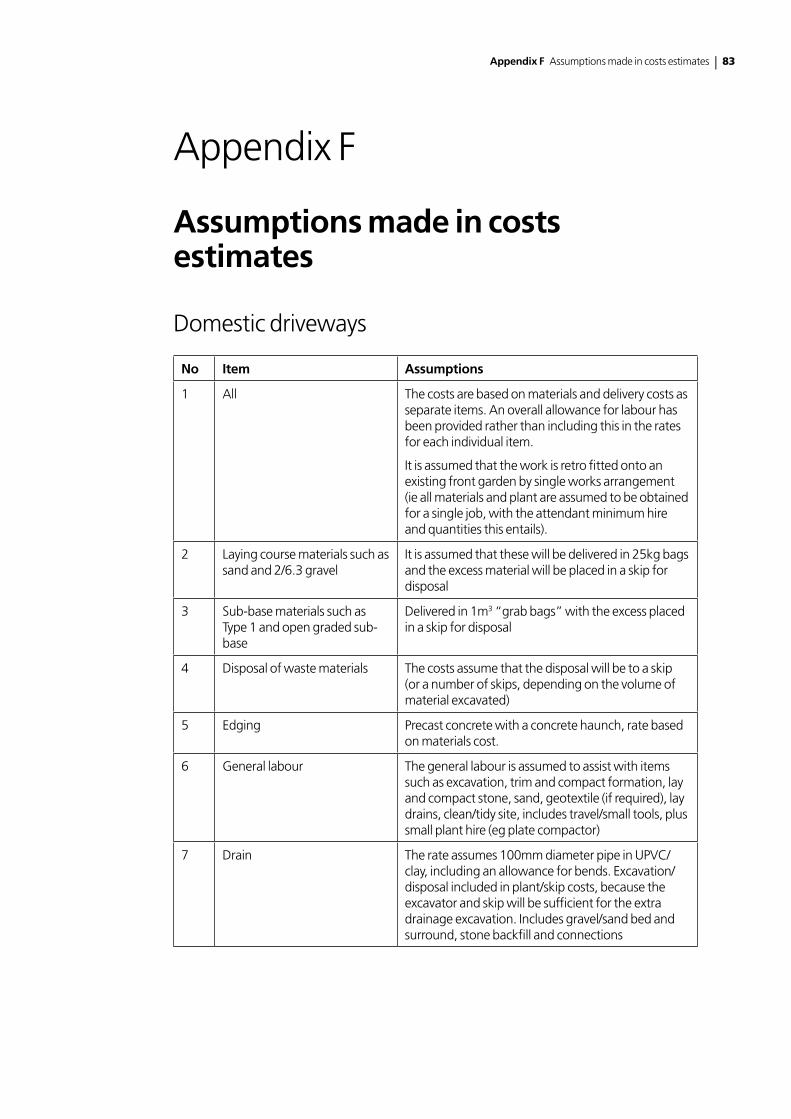
Appendix F Assumptions made in costs estimates | 83
Appendix F
Assumptions made in costs estimates
Domestic driveways
No Item Assumptions
1 All The costs are based on materials and delivery costs as separate items. An overall allowance for labour has been provided rather than including this in the rates for each individual item.
It is assumed that the work is retro fitted onto an existing front garden by single works arrangement (ie all materials and plant are assumed to be obtained for a single job, with the attendant minimum hire and quantities this entails).
2 Laying course materials such as sand and 2/6.3 gravel
It is assumed that these will be delivered in 25kg bags and the excess material will be placed in a skip for disposal
3 Sub-base materials such as Type 1 and open graded sub-base
Delivered in 1m3 “grab bags” with the excess placed in a skip for disposal
4 Disposal of waste materials The costs assume that the disposal will be to a skip (or a number of skips, depending on the volume of material excavated)
5 Edging Precast concrete with a concrete haunch, rate based on materials cost.
6 General labour The general labour is assumed to assist with items such as excavation, trim and compact formation, lay and compact stone, sand, geotextile (if required), lay drains, clean/tidy site, includes travel/small tools, plus small plant hire (eg plate compactor)
7 Drain The rate assumes 100mm diameter pipe in UPVC/clay, including an allowance for bends. Excavation/disposal included in plant/skip costs, because the excavator and skip will be sufficient for the extra drainage excavation. Includes gravel/sand bed and surround, stone backfill and connections
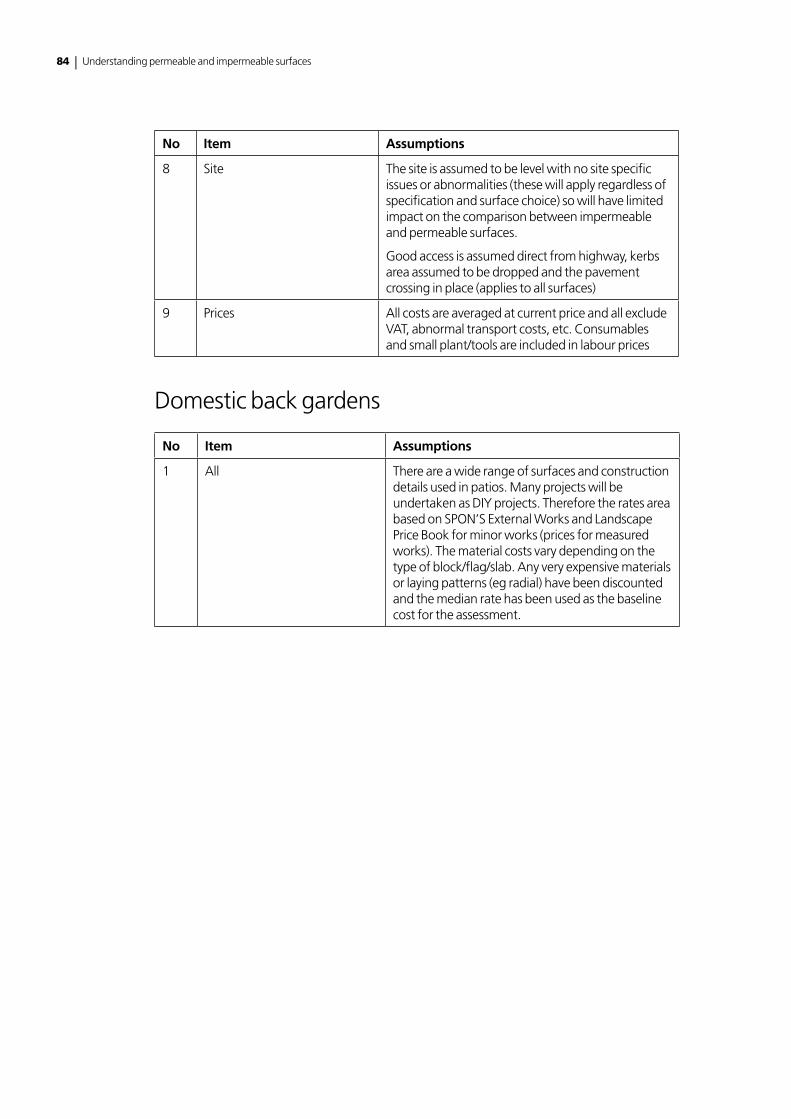
84 | Understanding permeable and impermeable surfaces
No Item Assumptions
8 Site The site is assumed to be level with no site specific issues or abnormalities (these will apply regardless of specification and surface choice) so will have limited impact on the comparison between impermeable and permeable surfaces.
Good access is assumed direct from highway, kerbs area assumed to be dropped and the pavement crossing in place (applies to all surfaces)
9 Prices All costs are averaged at current price and all exclude VAT, abnormal transport costs, etc. Consumables and small plant/tools are included in labour prices
Domestic back gardens
No Item Assumptions
1 All There are a wide range of surfaces and construction details used in patios. Many projects will be undertaken as DIY projects. Therefore the rates area based on SPON’S External Works and Landscape Price Book for minor works (prices for measured works). The material costs vary depending on the type of block/flag/slab. Any very expensive materials or laying patterns (eg radial) have been discounted and the median rate has been used as the baseline cost for the assessment.
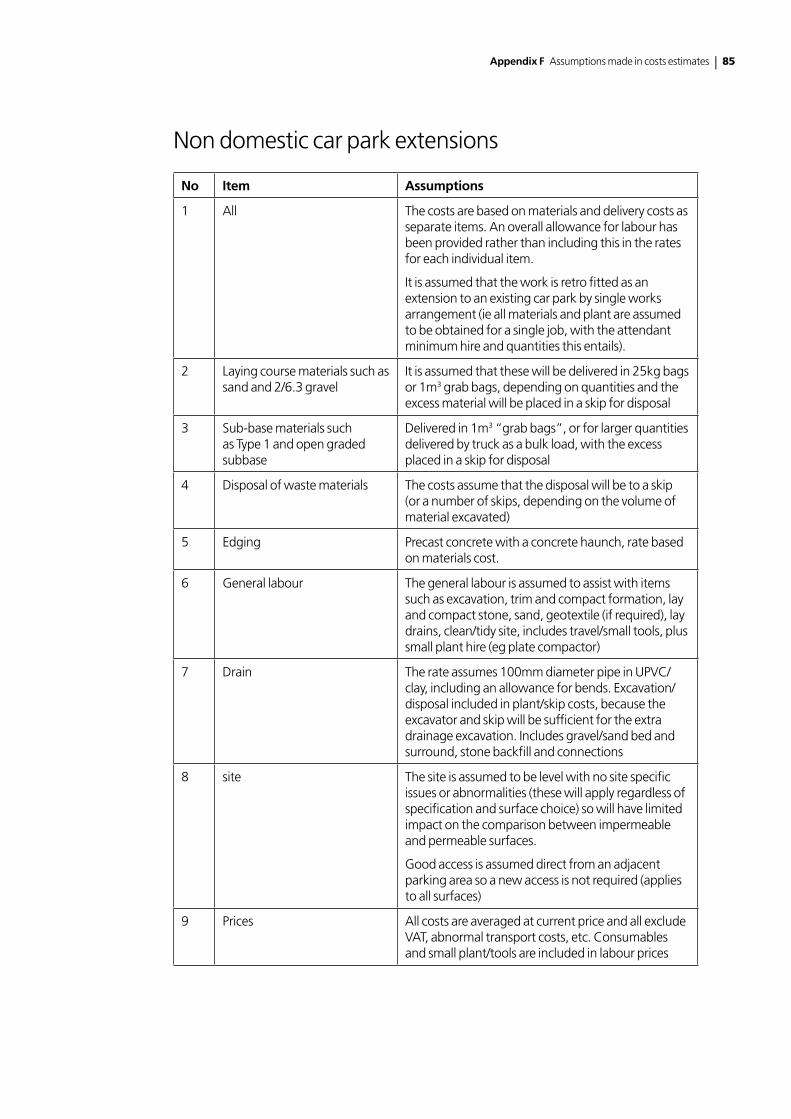
Appendix F Assumptions made in costs estimates | 85
Non domestic car park extensions
No Item Assumptions
1 All The costs are based on materials and delivery costs as separate items. An overall allowance for labour has been provided rather than including this in the rates for each individual item.
It is assumed that the work is retro fitted as an extension to an existing car park by single works arrangement (ie all materials and plant are assumed to be obtained for a single job, with the attendant minimum hire and quantities this entails).
2 Laying course materials such as sand and 2/6.3 gravel
It is assumed that these will be delivered in 25kg bags or 1m3 grab bags, depending on quantities and the excess material will be placed in a skip for disposal
3 Sub-base materials such as Type 1 and open graded subbase
Delivered in 1m3 “grab bags”, or for larger quantities delivered by truck as a bulk load, with the excess placed in a skip for disposal
4 Disposal of waste materials The costs assume that the disposal will be to a skip (or a number of skips, depending on the volume of material excavated)
5 Edging Precast concrete with a concrete haunch, rate based on materials cost.
6 General labour The general labour is assumed to assist with items such as excavation, trim and compact formation, lay and compact stone, sand, geotextile (if required), lay drains, clean/tidy site, includes travel/small tools, plus small plant hire (eg plate compactor)
7 Drain The rate assumes 100mm diameter pipe in UPVC/clay, including an allowance for bends. Excavation/disposal included in plant/skip costs, because the excavator and skip will be sufficient for the extra drainage excavation. Includes gravel/sand bed and surround, stone backfill and connections
8 site The site is assumed to be level with no site specific issues or abnormalities (these will apply regardless of specification and surface choice) so will have limited impact on the comparison between impermeable and permeable surfaces.
Good access is assumed direct from an adjacent parking area so a new access is not required (applies to all surfaces)
9 Prices All costs are averaged at current price and all exclude VAT, abnormal transport costs, etc. Consumables and small plant/tools are included in labour prices
86 | Understanding permeable and impermeable surfaces
Appendix G
Summary of previous cost benefit analyses
Impact Assessment of Surface Water Management Plans (Defra 2007)Surface water flooding occurs wherever high rainfall events exceed the drainage capacity in an area. Such events can lead to serious flooding of property and possessions. Also large amounts of surface water runoff lead to water quality problems. As water runs over land, it picks up pollutants and transports them into watercourses. Additional water quality problems can occur where water and sewage are transported in a combined pipe. Combined sewer overflows relieve excess hydraulic loads in combined sewers and help protect properties from flooding in heavy rainfall through overflows into watercourses, but these may significantly increase pollution loads in receiving waters from untreated human, commercial and industrial waste. Climate change and other future pressures are set to exacerbate the surface water drainage problems.
Surface water management plans (SWMP) will provide a key forum for local stakeholders to develop a shared understanding of the local factors that contribute to flood risk, which can then be used to inform housing allocations and investment strategies for drainage infrastructure. The impact assessment (IA) considered:
• whetherproducingaplanisindeedanecessaryfirststep
• whetherproductionoftheplancouldbeachievedthroughvoluntaryorstatutory approaches
• whichorganisationwouldbebestplacedtoleadtheprocess
The IA considered the costs and benefits for a range of options for developing SWMP in England. These included:
• donothingoption(thisoptionassumesthatifnothingisdoneriskofsurfacewater flood is likely to grow with associated increase in risk to life and cost of damage due to flooding)
• voluntaryproduceaSWMP(iestakeholdersareencouragedtoprepareaSWMP through government guidance)
• statutoryproductionofSWMPincriticaldrainageareas(byeitherlocalauthorities or water companies)
Appendix G Summary of previous cost benefit analyses | 87
The cost element was primarily resource (staff time) for preparing and maintaining SWMP borne by local authorities, Environment Agency and water companies. The main monetised benefit was reduced flooding in communities at risk from surface water flooding, leading to reduced material damage to properties and infrastructure and lower clean-up costs. It was assumed that surface water flood risk from all new development is reduced by 40 per cent under the statutory option and by one-fifth of this (8 per cent) under the voluntary option. These benefits will primarily be borne by households and businesses (reduced insurance costs, lower stress) and by government (reduced recovery costs). Key non monetised benefits were improved water quality through reduced pollution (sewage and diffuse), less potential loss of life and improved human health. The time period for the analysis was 80 years.
The key assumptions made in the IA were tested by examining the worst-case and best-case scenarios for each of the key variables. These variables were the cost of producing a SWMP, the number of local authorities that would undertake voluntary and statutory SWMP, and the percent reduction in flooding from all new development.
Performance and whole life costs of best management practices and sustainable urban drainage systems (UKWIR 2005)The objective of this study was to document the performance and whole life costs of best management practices (BMPs) and sustainable drainage systems (SUDS) in the UK and the USA. Some of the systems considered in the study include retention ponds, vegetated swales, infiltration/filter trenches, porous pavement and bioretention systems.
The performance of the different BMPs/SUDS were analysed in terms of water quality performance and hydraulic performance. The water-quality performance of the selected BMPs/SUDS was determined from a survey of the literature and an analysis of the international BMP Database. The hydraulic efficiency was estimated through computer modelling of the behaviour for observed events, design storms and five years of stochastically generated rainfall data in areas with different soil types and rainfall patterns. The report suggested that there was very little empirical data on the performance of permeable surfaces and there is a particular lack in understanding how different base materials and their installation might impact performance (note the authors of this report do not consider this to be true at the current time). Water quality benefits associated with permeable surfaces were reported to be not well documented at the time, although some reduction in runoff volume discharged to surface water has been noted.
A whole life cost model was developed in a spreadsheet format to allow the calculation of the expected costs of a facility based on drainage area,
88 | Understanding permeable and impermeable surfaces
maintenance expectations and other factors such as design life, operation and maintenance costs, environmental costs, disposal costs etc. Each of these factors was estimated for a range of BMPs/SUDS selected for analysis. Whole life cost analyses were performed using average expected cost for construction and various levels of maintenance for each type of BMP or SUDS under consideration. Unit costs for all items were calculated at then current prices. These costs were then discounted to the base period and summed to determine the net present value (NPV); this is the most comprehensive way to assess the relative costs of each facility.
The findings of the study revealed that the level of maintenance specified had a pronounced effect on the whole life cost for most facilities. For example, the model predicted that small sites with a high level of maintenance would have a greater whole life cost compared with facilities that were ten times as large, but maintained at low or medium levels. For a given size of facility, a high level of maintenance increased the whole life cost by two or three times compared with the same facility with a lower level of maintenance.
Whole life cost analysis for various pavements and drainage options (Interpave 2006)In this study, a whole life cost analysis was undertaken for three pavement surfaces across four applications: permeable block paving, unreinforced concrete and asphalt in supermarket car parks, industrial warehouse car parks, distribution roads on a housing estate and distribution roads on an industrial estate for two sub grade conditions. Whole life cost (WLC) analysis is employed to assess the true costs of an asset or project over its design life and to assess the cost effectiveness of solutions. The monetary costs in a WLC analysis generally involve initial construction costs, user costs, maintenance costs and where applicable, decommissioning costs.
The study specified the required construction costs and maintenance schedule over the design life of each of the pavement applications. Each of the pavement applications has different requirements: for example a supermarket will need a smooth, skid resistant surface with good aesthetic appearance, whereas an industrial application will have a more utilitarian focus. The discounted annual maintenance costs were combined with initial construction costs to provide whole life costs for each application.
This study showed that with the exception of the supermarket car parks, permeable concrete block paving gave the lowest whole life cost. Regarding the supermarket, two cases were analysed for the permeable concrete block paving (relating to a 20 and 40–year block durability), to form upper and lower limits to the WLCs. The 20–year block durability had slightly higher whole life
Appendix G Summary of previous cost benefit analyses | 89
costs than asphalt, whilst the 40-year block durability had lower whole life costs than asphalt. Permeable block paving was also considered to have significant environmental advantages over the impermeable asphalt and unreinforced concrete due to its performance as a sustainable drainage system (SUDS) and its inherent ability for reuse when being maintained.
In this study, the WLCs were taken to comprise the initial construction costs and the maintenance costs. Environmental and/or social impacts were not taken into consideration in assessing the whole life costs of each application. Also costing information provided in the study may not be relevant for assessing the cost of paving domestic driveways.
A review of the cost benefit of undertaking SUDS retrofit in urban areas (Environment Agency, 2007)This study assessed the costs and benefits of various sustainable drainage systems (SUDS) most likely to be applicable for retrofit over a period of 40 years. The scope of the analysis covered England and Wales and it was applied to many different types of structures such as schools, leisure centres, hospital, low rise flats, detached and semi-detached, rural and urban roads etc. This study also involved the comparison of the costs and benefits of a SUDS scheme with those of a conventional or traditional approach (e.g. comparison of permeable block paving with the traditional impermeable block paving). The SUDS schemes that were selected in the cost benefit modelling included permeable paving, infiltration trenches, filter drains, swales, green roofs, rainwater harvesting and water butts.
For each type of SUDS scheme considered in the cost benefit model, the relevant parameters and conditions for retrofitting were taken from national sources. For example, areas of hard standing surfaces and roof surfaces were calculated from the Generalised Land Use database in order to get the sum of hard standing and roof area available across England and Wales. Using this baseline position, an estimate was made of the proportion of the area that it might be reasonable to expect to be retrofitted with SUDS.
The costs in terms of both capital expenditure (Capex) and operating expenditure (Opex) were collected from a variety of available sources. The main benefit components included in the analysis were:
Reduction in floodingThe installation of SUDS would have a direct impact on the flows in sewers either by direct disconnection of rainwater from the sewer systems or by reducing the volume and rate at which the runoff enters the sewer system. The modelling assumed that converting 10 percent of the total impermeable area to “Greenfield flows” would lead to a 90 percent reduction in internal flooding incidents. Reductions in flooding incidents were assumed to be linearly related to the
90 | Understanding permeable and impermeable surfaces
reduction in impermeable area but the reduction would not exceed 90 percent. The results from the study suggested that the most important type of SUDS for reducing the number of floods were rainwater harvesting and permeable paving.
Reduction in unsatisfactory combined sewer overflows (CSOs)SUDS can improve the river water quality by reducing discharges from Combined Sewer Overflows (CSOs) through a reduction in volume. As CSO spills occur only when a drainage system is overloaded, a comparatively small reduction in peak flows within the system would greatly reduce the number of spills. Consequently reducing the impermeable area would reduce the number of CSOs categorised as unsatisfactory. Savings would therefore arise as the sewerage companies would no longer need to upgrade these. Average costs of £51,000 per CSO upgrade were estimated using Ofwat’s June returns. Reductions in the number being upgraded were again assumed to be 90 per cent if the impermeable area was reduced by 10 per cent. However, unlike flooding incidents it was assumed that the reduction could increase to 98 per cent if 25 per cent of the area was removed. The relationship was assumed to be linear between 0 and 25 per cent.
Water savingsThe use of some types of SUDS can also have a positive effect on the demand for potable water. Rainwater harvesting has the clear benefit of reducing water consumption, which benefits the water companies in their responsibility to ensure continuity of supply but also benefits the property owner via a reduction in their water bill (for metered customers). Infiltration SUDS methods may also increase groundwater recharge thus benefiting groundwater resources. It was assumed that full implementation of these SUDS would reduce demand for water from the supply network by 1.227 million m3 per year. This would lead to an annual reduction in water bills of approximately £2,400m per year, equating to a reduction in water bills of £21,477m discounted over twenty years.
From the results, the SUDS type that shows evidence of a clear net benefit is permeable paving. Evidence suggests that on a long term basis, it is less costly than traditional paving methods. The added benefits of reductions in run-off (however real and important) may therefore perhaps not be of great consequence when assessing whether or not it is worthwhile using it to replace traditional paving.
Some of the assumptions used in the EA study were adopted in assessing the cost and benefits of the policy in this project, wherever more up to date information was not available.
Appendix H Summary of hydraulic benefits of permeable surfaces | 91
Appendix H
Summary of hydraulic benefits of permeable surfaces
Data in CIRIA Report C582 (2002) suggests that the peak rate of runoff from concrete block pavements is reduced by between 23 per cent and 98 per cent with between 3 and 17mm of rainfall required before any water flows out from the subbase.
The Daywater report (Daywater 2006) includes details of two studies on the performance of permeable surfaces. The first was a study of a car park in Nottingham which suggested that a concrete block-surfaced car park reduced total runoff volumes by between 34 per cent – 47 per cent. Initial wetting loss before any discharge occurred were between 2.4 – 3.2 mm (ie this amount of rain needs to fall before there is any flow at all into the sewer).
The second was an example in France where the flow rate from a porous pavement structure was monitored. This showed that the majority of water infiltrating into the pavement was not discharging to the sewer but was infiltrating into the soil, was retained by the sub-base aggregates and/or evaporated. The proportion of storm water discharged into the sewer varied from 0 per cent to a maximum of 12.5 percent. Over a four year study period only 3.3 per cent of total rainfall that fell onto the pavement was discharged into the sewer.
There is also a lot of anecdotal evidence that permeable surfaces provide an acceptable drainage performance and that they reduce runoff into sewers and watercourses (for example in 2007 there were several rainfall events that caused surface water flooding problems in some parts of the country but none of the permeable surface sites in Oxfordshire had any problems – Landform 2008).
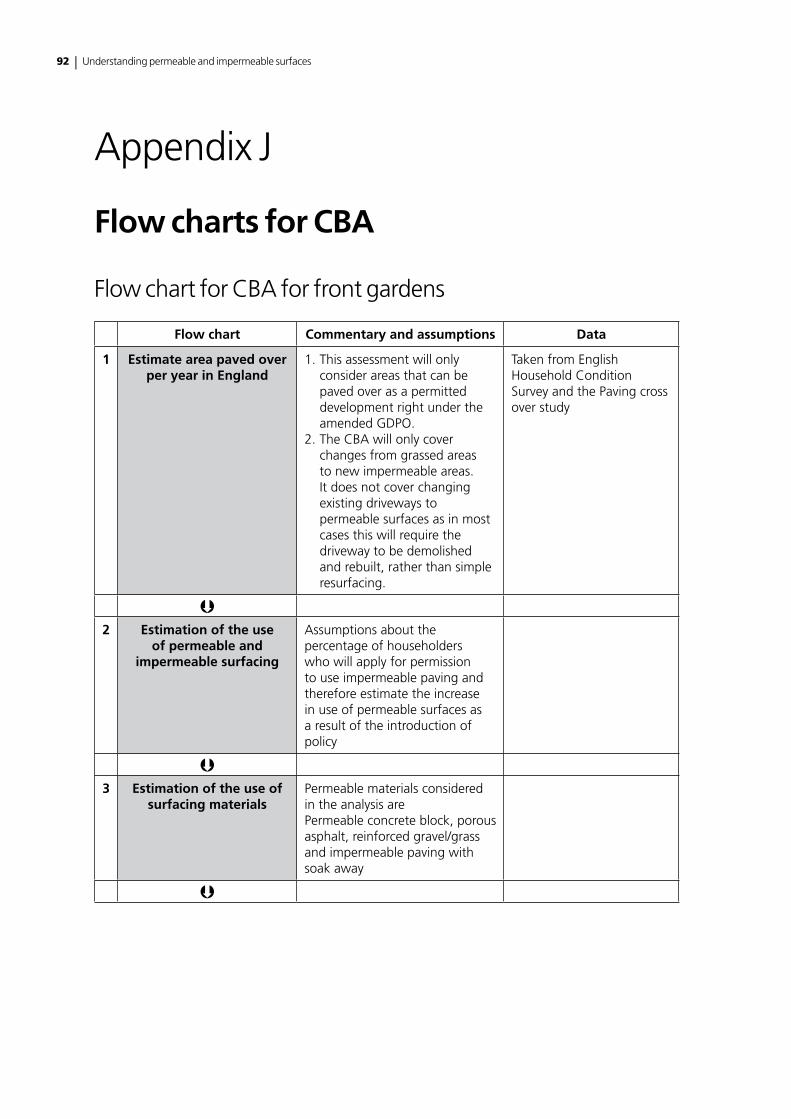
92 | Understanding permeable and impermeable surfaces
Appendix J
Flow charts for CBA
Flow chart for CBA for front gardens
Flow chart Commentary and assumptions Data
1 Estimate area paved over per year in England
1. This assessment will only consider areas that can be paved over as a permitted development right under the amended GDPO.
2. The CBA will only cover changes from grassed areas to new impermeable areas. It does not cover changing existing driveways to permeable surfaces as in most cases this will require the driveway to be demolished and rebuilt, rather than simple resurfacing.
Taken from English Household Condition Survey and the Paving cross over study
2 Estimation of the use
of permeable and impermeable surfacing
Assumptions about the percentage of householders who will apply for permission to use impermeable paving and therefore estimate the increase in use of permeable surfaces as a result of the introduction of policy
3 Estimation of the use of
surfacing materialsPermeable materials considered in the analysis arePermeable concrete block, porous asphalt, reinforced gravel/grass and impermeable paving with soak away
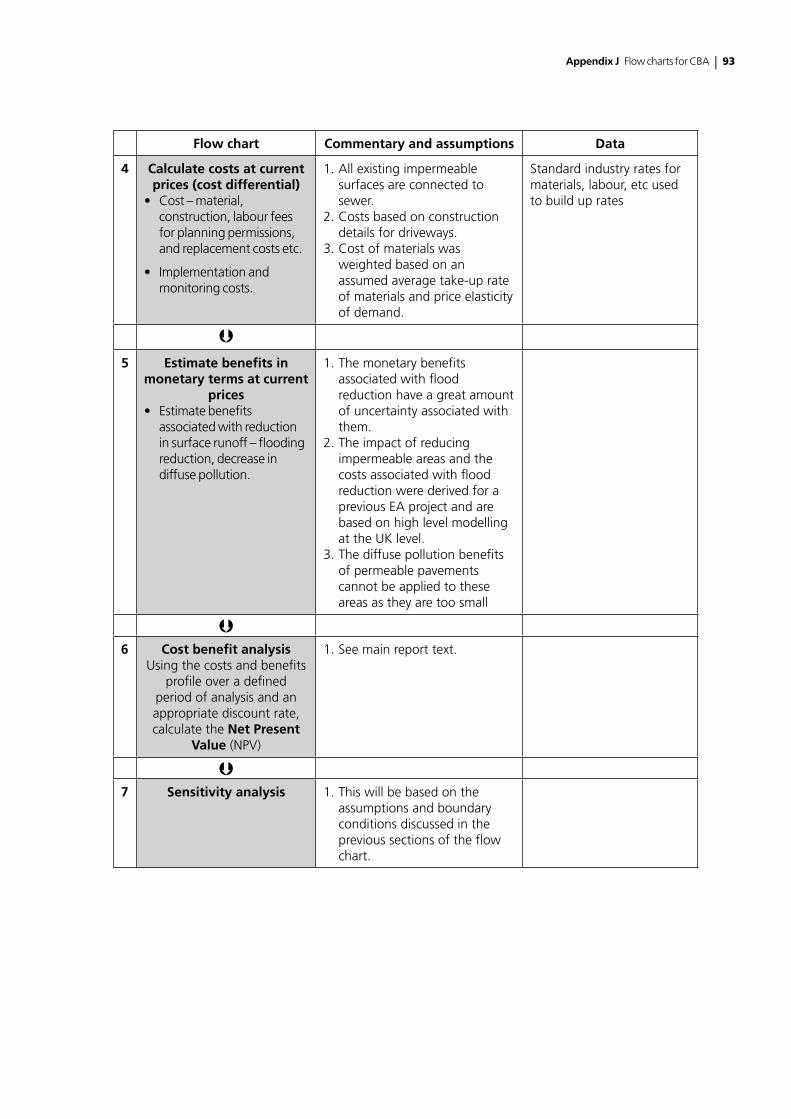
Appendix J Flow charts for CBA | 93
Flow chart Commentary and assumptions Data
4 Calculate costs at current prices (cost differential)
• Cost–material,construction, labour fees for planning permissions, and replacement costs etc.
• Implementationandmonitoring costs.
1. All existing impermeable surfaces are connected to sewer.
2. Costs based on construction details for driveways.
3. Cost of materials was weighted based on an assumed average take-up rate of materials and price elasticity of demand.
Standard industry rates for materials, labour, etc used to build up rates
5 Estimate benefits in
monetary terms at current prices
• Estimatebenefitsassociated with reduction in surface runoff – flooding reduction, decrease in diffuse pollution.
1. The monetary benefits associated with flood reduction have a great amount of uncertainty associated with them.
2. The impact of reducing impermeable areas and the costs associated with flood reduction were derived for a previous EA project and are based on high level modelling at the UK level.
3. The diffuse pollution benefits of permeable pavements cannot be applied to these areas as they are too small
6 Cost benefit analysis
Using the costs and benefits profile over a defined
period of analysis and an appropriate discount rate, calculate the Net Present
Value (NPV)
1. See main report text.
7 Sensitivity analysis 1. This will be based on the
assumptions and boundary conditions discussed in the previous sections of the flow chart.
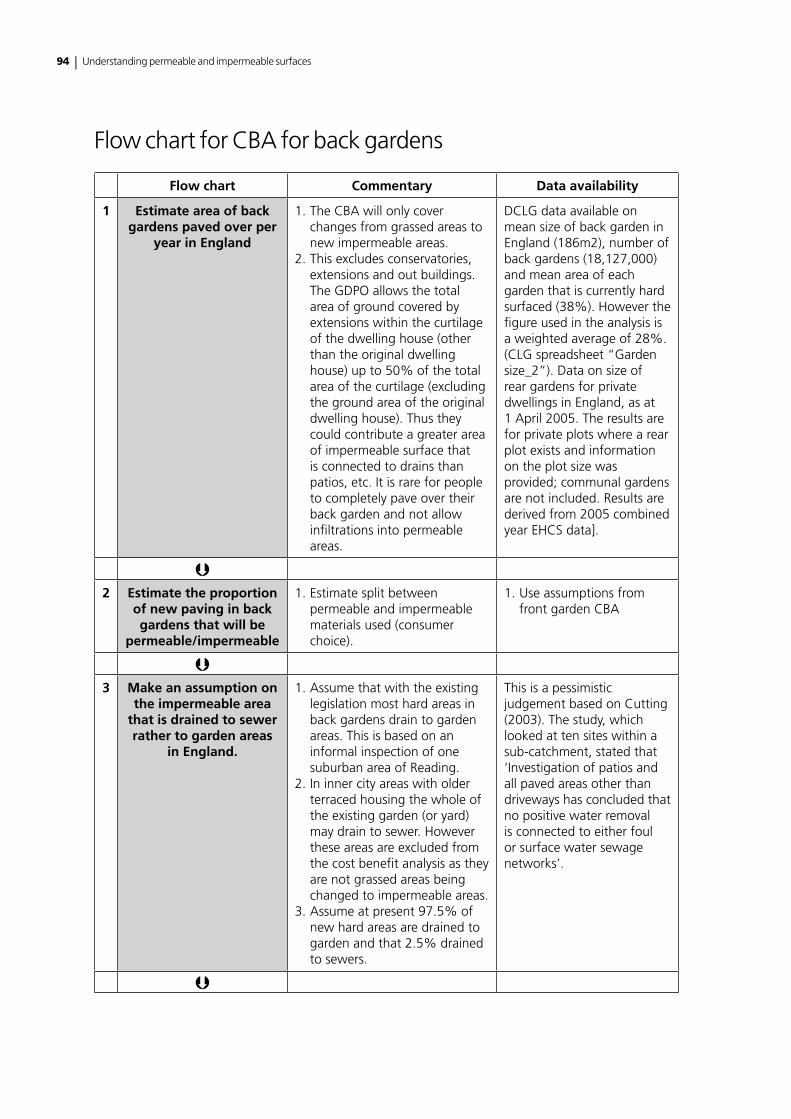
94 | Understanding permeable and impermeable surfaces
Flow chart for CBA for back gardens
Flow chart Commentary Data availability
1 Estimate area of back gardens paved over per
year in England
1. The CBA will only cover changes from grassed areas to new impermeable areas.
2. This excludes conservatories, extensions and out buildings. The GDPO allows the total area of ground covered by extensions within the curtilage of the dwelling house (other than the original dwelling house) up to 50% of the total area of the curtilage (excluding the ground area of the original dwelling house). Thus they could contribute a greater area of impermeable surface that is connected to drains than patios, etc. It is rare for people to completely pave over their back garden and not allow infiltrations into permeable areas.
DCLG data available on mean size of back garden in England (186m2), number of back gardens (18,127,000) and mean area of each garden that is currently hard surfaced (38%). However the figure used in the analysis is a weighted average of 28%. (CLG spreadsheet “Garden size_2”). Data on size of rear gardens for private dwellings in England, as at 1 April 2005. The results are for private plots where a rear plot exists and information on the plot size was provided; communal gardens are not included. Results are derived from 2005 combined year EHCS data].
2 Estimate the proportion
of new paving in back gardens that will be
permeable/impermeable
1. Estimate split between permeable and impermeable materials used (consumer choice).
1. Use assumptions from front garden CBA
3 Make an assumption on
the impermeable area that is drained to sewer rather to garden areas
in England.
1. Assume that with the existing legislation most hard areas in back gardens drain to garden areas. This is based on an informal inspection of one suburban area of Reading.
2. In inner city areas with older terraced housing the whole of the existing garden (or yard) may drain to sewer. However these areas are excluded from the cost benefit analysis as they are not grassed areas being changed to impermeable areas.
3. Assume at present 97.5% of new hard areas are drained to garden and that 2.5% drained to sewers.
This is a pessimistic judgement based on Cutting (2003). The study, which looked at ten sites within a sub-catchment, stated that ‘Investigation of patios and all paved areas other than driveways has concluded that no positive water removal is connected to either foul or surface water sewage networks’.
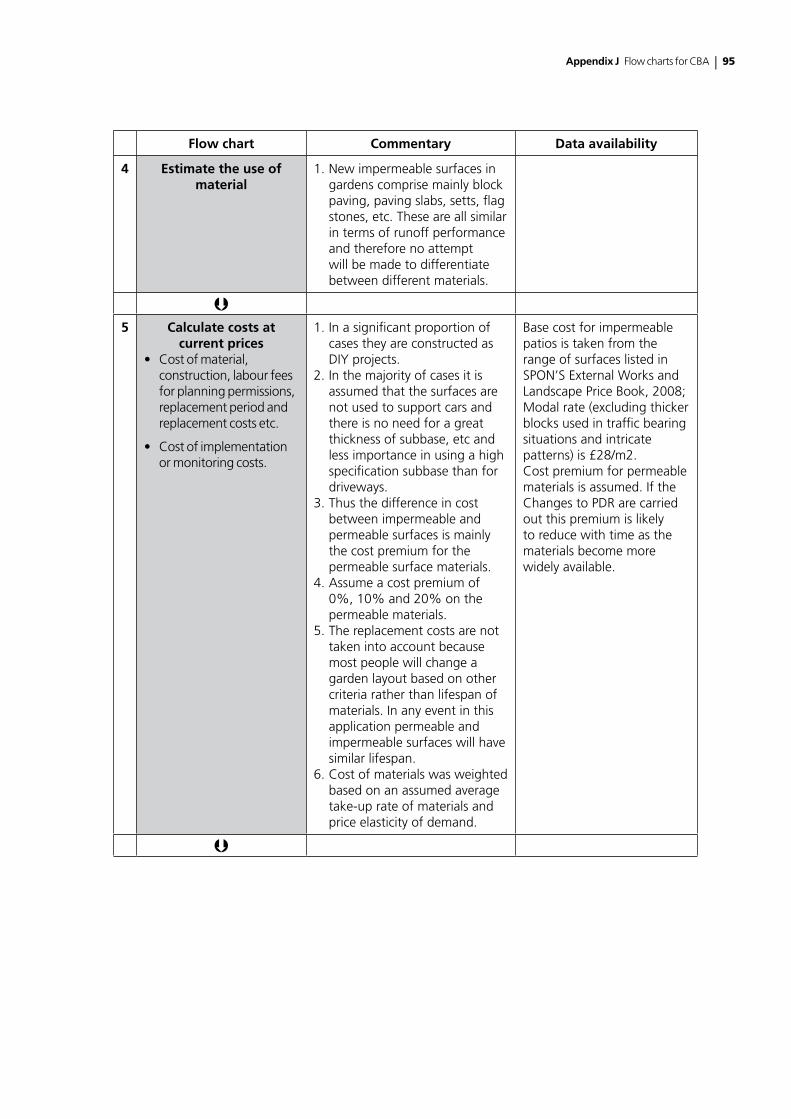
Appendix J Flow charts for CBA | 95
Flow chart Commentary Data availability
4 Estimate the use of material
1. New impermeable surfaces in gardens comprise mainly block paving, paving slabs, setts, flag stones, etc. These are all similar in terms of runoff performance and therefore no attempt will be made to differentiate between different materials.
5 Calculate costs at
current prices• Costofmaterial,
construction, labour fees for planning permissions, replacement period and replacement costs etc.
• Costofimplementationor monitoring costs.
1. In a significant proportion of cases they are constructed as DIY projects.
2. In the majority of cases it is assumed that the surfaces are not used to support cars and there is no need for a great thickness of subbase, etc and less importance in using a high specification subbase than for driveways.
3. Thus the difference in cost between impermeable and permeable surfaces is mainly the cost premium for the permeable surface materials.
4. Assume a cost premium of 0%, 10% and 20% on the permeable materials.
5. The replacement costs are not taken into account because most people will change a garden layout based on other criteria rather than lifespan of materials. In any event in this application permeable and impermeable surfaces will have similar lifespan.
6. Cost of materials was weighted based on an assumed average take-up rate of materials and price elasticity of demand.
Base cost for impermeable patios is taken from the range of surfaces listed in SPON’S External Works and Landscape Price Book, 2008; Modal rate (excluding thicker blocks used in traffic bearing situations and intricate patterns) is £28/m2.Cost premium for permeable materials is assumed. If the Changes to PDR are carried out this premium is likely to reduce with time as the materials become more widely available.
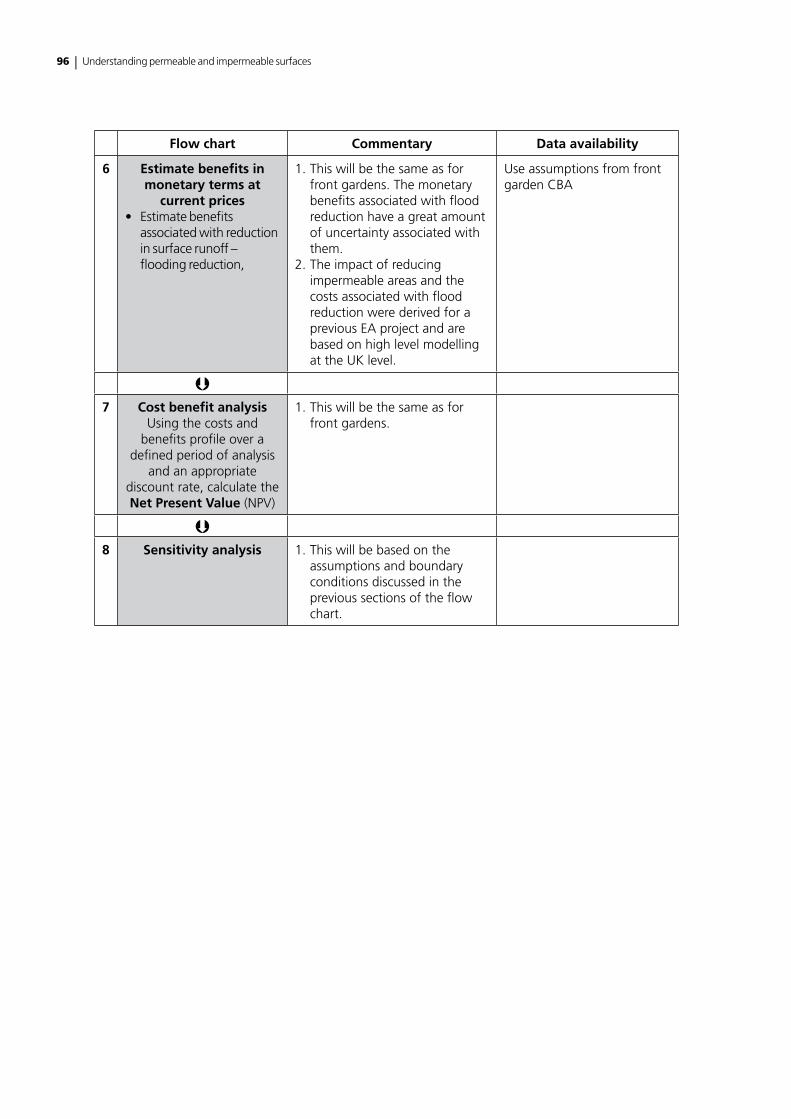
96 | Understanding permeable and impermeable surfaces
Flow chart Commentary Data availability
6 Estimate benefits in monetary terms at
current prices• Estimatebenefits
associated with reduction in surface runoff – flooding reduction,
1. This will be the same as for front gardens. The monetary benefits associated with flood reduction have a great amount of uncertainty associated with them.
2. The impact of reducing impermeable areas and the costs associated with flood reduction were derived for a previous EA project and are based on high level modelling at the UK level.
Use assumptions from front garden CBA
7 Cost benefit analysis
Using the costs and benefits profile over a
defined period of analysis and an appropriate
discount rate, calculate the Net Present Value (NPV)
1. This will be the same as for front gardens.
8 Sensitivity analysis 1. This will be based on the
assumptions and boundary conditions discussed in the previous sections of the flow chart.
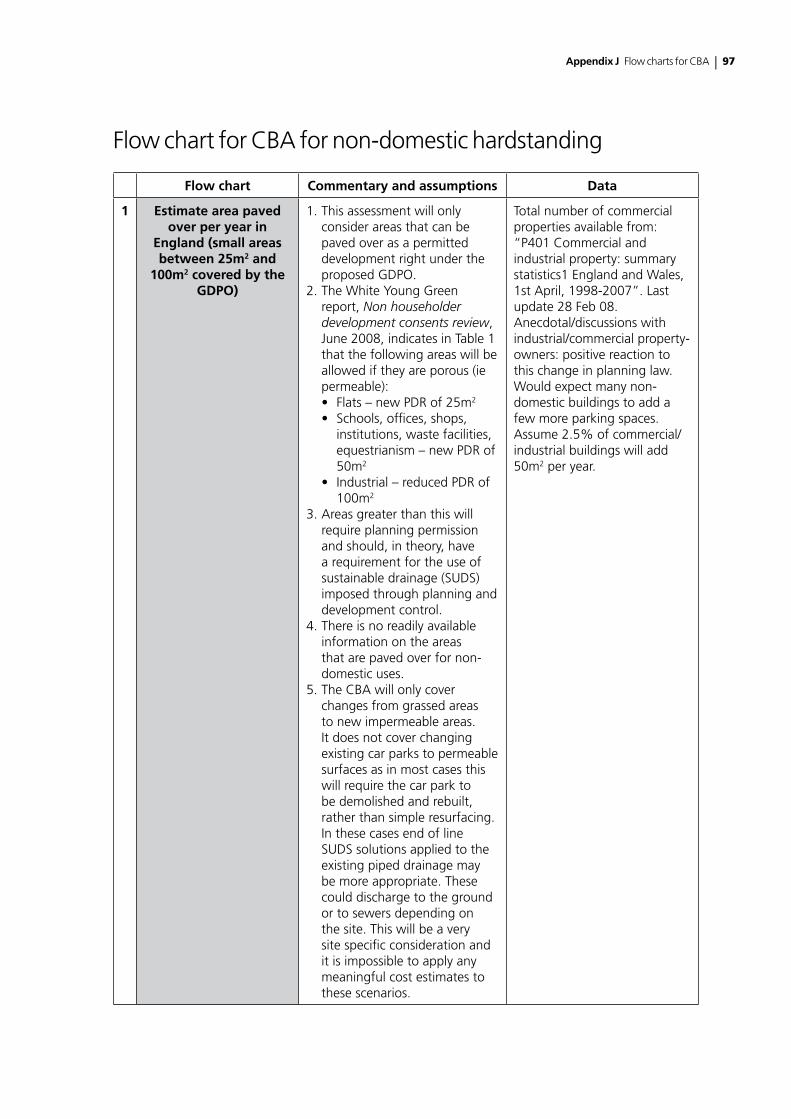
Appendix J Flow charts for CBA | 97
Flow chart for CBA for non-domestic hardstanding
Flow chart Commentary and assumptions Data
1 Estimate area paved over per year in
England (small areas between 25m2 and
100m2 covered by the GDPO)
1. This assessment will only consider areas that can be paved over as a permitted development right under the proposed GDPO.
2. The White Young Green report, Non householder development consents review, June 2008, indicates in Table 1 that the following areas will be allowed if they are porous (ie permeable):• Flats–newPDRof25m2
• Schools,offices,shops,institutions, waste facilities, equestrianism – new PDR of 50m2
• Industrial–reducedPDRof100m2
3. Areas greater than this will require planning permission and should, in theory, have a requirement for the use of sustainable drainage (SUDS) imposed through planning and development control.
4. There is no readily available information on the areas that are paved over for non-domestic uses.
5. The CBA will only cover changes from grassed areas to new impermeable areas. It does not cover changing existing car parks to permeable surfaces as in most cases this will require the car park to be demolished and rebuilt, rather than simple resurfacing. In these cases end of line SUDS solutions applied to the existing piped drainage may be more appropriate. These could discharge to the ground or to sewers depending on the site. This will be a very site specific consideration and it is impossible to apply any meaningful cost estimates to these scenarios.
Total number of commercial properties available from: “P401 Commercial and industrial property: summary statistics1 England and Wales, 1st April, 1998-2007”. Last update 28 Feb 08.Anecdotal/discussions with industrial/commercial property-owners: positive reaction to this change in planning law. Would expect many non-domestic buildings to add a few more parking spaces.Assume 2.5% of commercial/industrial buildings will add 50m2 per year.
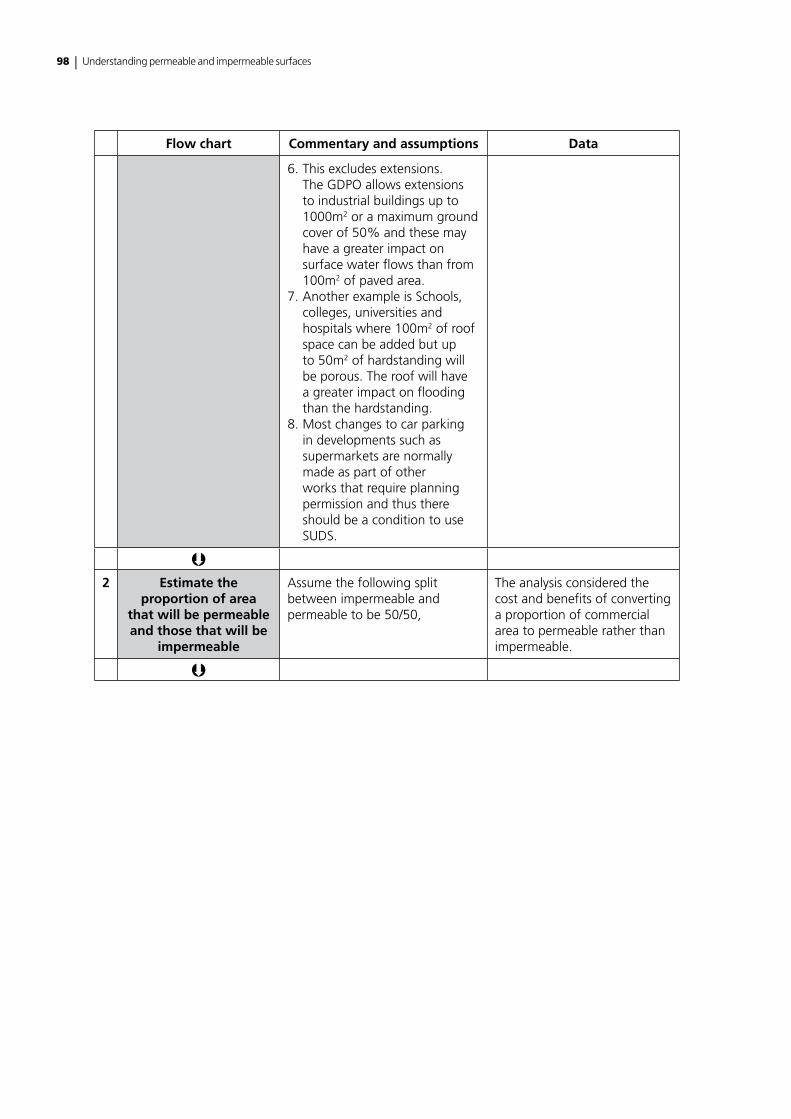
98 | Understanding permeable and impermeable surfaces
Flow chart Commentary and assumptions Data
6. This excludes extensions. The GDPO allows extensions to industrial buildings up to 1000m2 or a maximum ground cover of 50% and these may have a greater impact on surface water flows than from 100m2 of paved area.
7. Another example is Schools, colleges, universities and hospitals where 100m2 of roof space can be added but up to 50m2 of hardstanding will be porous. The roof will have a greater impact on flooding than the hardstanding.
8. Most changes to car parking in developments such as supermarkets are normally made as part of other works that require planning permission and thus there should be a condition to use SUDS.
2 Estimate the
proportion of area that will be permeable and those that will be
impermeable
Assume the following split between impermeable and permeable to be 50/50,
The analysis considered the cost and benefits of converting a proportion of commercial area to permeable rather than impermeable.
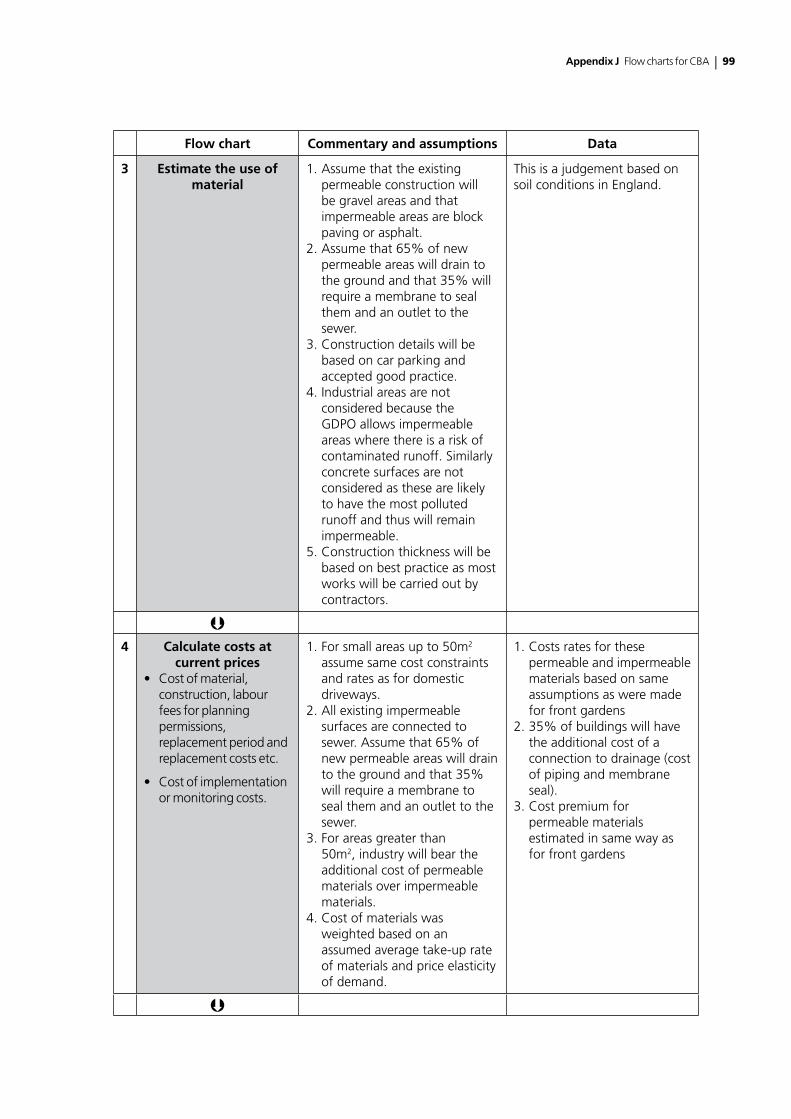
Appendix J Flow charts for CBA | 99
Flow chart Commentary and assumptions Data
3 Estimate the use of material
1. Assume that the existing permeable construction will be gravel areas and that impermeable areas are block paving or asphalt.
2. Assume that 65% of new permeable areas will drain to the ground and that 35% will require a membrane to seal them and an outlet to the sewer.
3. Construction details will be based on car parking and accepted good practice.
4. Industrial areas are not considered because the GDPO allows impermeable areas where there is a risk of contaminated runoff. Similarly concrete surfaces are not considered as these are likely to have the most polluted runoff and thus will remain impermeable.
5. Construction thickness will be based on best practice as most works will be carried out by contractors.
This is a judgement based on soil conditions in England.
4 Calculate costs at
current prices• Costofmaterial,
construction, labour fees for planning permissions, replacement period and replacement costs etc.
• Costofimplementationor monitoring costs.
1. For small areas up to 50m2 assume same cost constraints and rates as for domestic driveways.
2. All existing impermeable surfaces are connected to sewer. Assume that 65% of new permeable areas will drain to the ground and that 35% will require a membrane to seal them and an outlet to the sewer.
3. For areas greater than 50m2, industry will bear the additional cost of permeable materials over impermeable materials.
4. Cost of materials was weighted based on an assumed average take-up rate of materials and price elasticity of demand.
1. Costs rates for these permeable and impermeable materials based on same assumptions as were made for front gardens
2. 35% of buildings will have the additional cost of a connection to drainage (cost of piping and membrane seal).
3. Cost premium for permeable materials estimated in same way as for front gardens
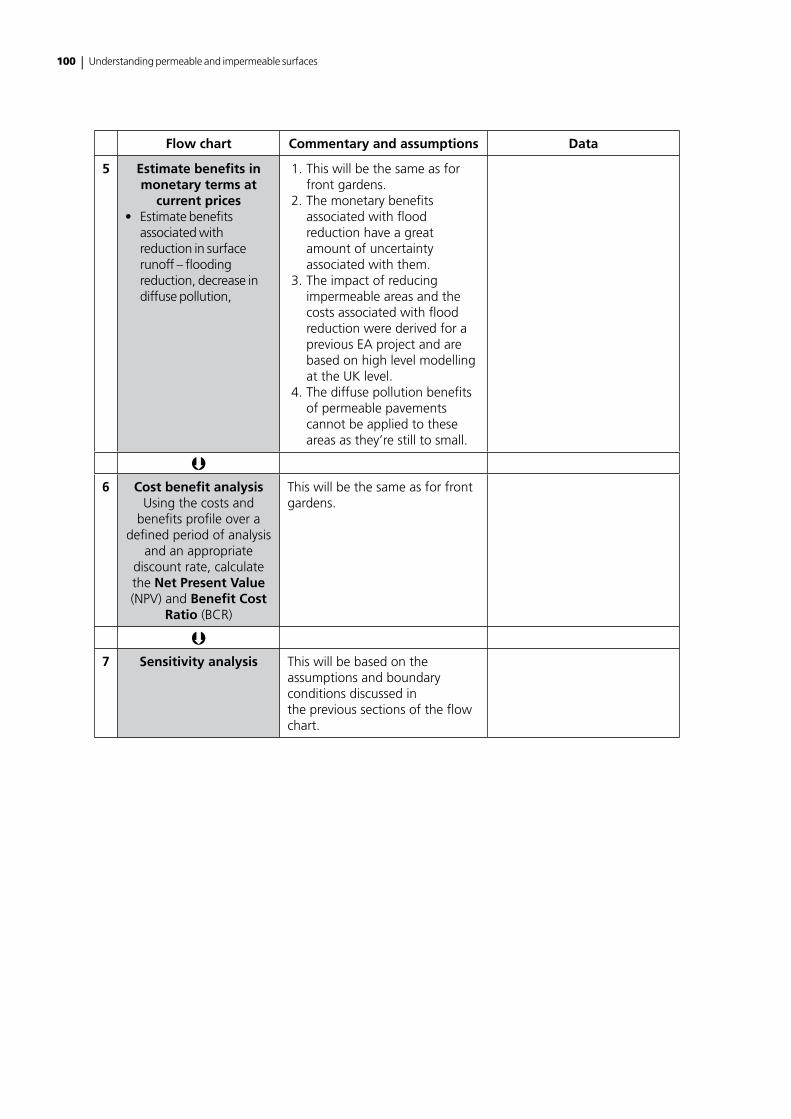
100 | Understanding permeable and impermeable surfaces
Flow chart Commentary and assumptions Data
5 Estimate benefits in monetary terms at
current prices• Estimatebenefits
associated with reduction in surface runoff – flooding reduction, decrease in diffuse pollution,
1. This will be the same as for front gardens.
2. The monetary benefits associated with flood reduction have a great amount of uncertainty associated with them.
3. The impact of reducing impermeable areas and the costs associated with flood reduction were derived for a previous EA project and are based on high level modelling at the UK level.
4. The diffuse pollution benefits of permeable pavements cannot be applied to these areas as they’re still to small.
6 Cost benefit analysis
Using the costs and benefits profile over a
defined period of analysis and an appropriate
discount rate, calculate the Net Present Value (NPV) and Benefit Cost
Ratio (BCR)
This will be the same as for front gardens.
7 Sensitivity analysis This will be based on the
assumptions and boundary conditions discussed inthe previous sections of the flow chart.
Appendix K Cost and benefits | 101
Appendix K
Cost and benefits
Costs
The following cost items were included in the analysis for front garden, back garden and non-domestic properties
• Cost of materials and construction – this includes cost of material, cost of sub base layer, etc. Data on the cost of materials and construction of the different surfacing were obtained from manufacturers and other relevant sources. For specification choice, it is assumed that there are no site specific issues or abnormalities and there is good access direct from highway, kerbs dropped and pavement crossing in place. All costs are averaged at current prices and it excludes VAT, abnormal transport costs and small plants/tools included in labour or laid prices. The cost of materials was weighted based on weighted average take-up rate and assumed price elasticity of demand of the various surfacing materials.
• Cost of maintenance –General maintenance costs were excluded, because they would be meaningless when applied to such small areas that are unlikely to have any specific maintenance regime.
• Administrative costs – These are the costs incurred by the householder in preparing the application for planning permission such as drawing up plans, completing the application forms etc. and the value of time spent by householders during this process.
• Cost of planning permissions fees – This is the fee that householders applying for permission to lay impermeable surfaces will have to pay to the local planning authority.
Non-quantifiable costsThe following cost items were not monetised and included in the analysis
• Cost of monitoring and enforcement – This includes cost local authorities will incur to monitor compliance and enforce the policy and the cost of training planning officials in the new rules. The Department is currently working on providing estimates for the cost of monitoring per year. Provision has been made to include these costs in the CBA spreadsheet when they become available.
102 | Understanding permeable and impermeable surfaces
Benefits
The main benefits considered in all the analyses include the following:
• Reduced Flooding – The main benefit is ‘prevented’ or reduced flooding as a result of reduction in surface run-off. The methodology for estimating the benefits of reduced flooding is based on the total surface area that will be paved with permeable rather than impermeable material as a result of introducing the new policy. The estimation of the total permeable surface area can then be converted into an estimate of how many flood incidents could be avoided per year. This is based on the assumption that converting 10 per cent of the total impermeable area to permeable surface would lead to a 90 per cent reduction in internal flooding incidents. The number of flood incidences per year was calculated from the numbers submitted by sewerage companies in England in their June Return reports to Ofwat for 2007. The cost per each flooding incident was estimated as £39,000. It should be noted that these benefits are based on current estimates of flood damage and do not take into consideration an expected increase in flooding incidents as a result of climate change.
• Reduced unsatisfactory Combined Sewer overflows (CSO) – Permeable paving could reduce the number of CSO spills. This is the discharge, during heavy rainfall, of untreated but diluted wastewater from a sewer system that carries both sewage and storm water into receiving watercourses. As CSO spills occur only when the system is severely overloaded, a comparatively small reduction in peak flow would greatly reduce the number of spills.
Similar assumptions and methodology used in the EA Report (2007) were used in estimating the monetary value of reduction in CSO upgrade. It was assumed that a 10 percent reduction in impermeable surfaces will result in a 90 percent reduction in number of CSOs being upgraded. However, unlike flooding incidents, it was assumed that the reduction could increase to 98 per cent if 25 per cent of the area was removed. The relationship was assumed to be linear between 0 and 25 per cent (EA 2007). Average costs of £51,000 per CSO upgrade were estimated using Ofwat’s June returns.
Other impacts of CSO discharges such as aesthetic pollution in the river, increased health risk of recreational river users and damage to the ecology of the river were not included in the analysis.
Appendix K Cost and benefits | 103
Non quantifiable benefitsThere are a number of benefits from using SUDS or permeable surfaces that are very difficult to quantify and deemed to be non quantifiable in this study (this may not be the case in future if further research is carried out). The main non quantifiable benefits are:
• Decrease in diffuse pollution – this includes pollution from oils, hydrocarbons etc causing water pollution in water bodies. Some pollution incidents in water bodies may be due to the improper disposal of used oil and/or to the flushing of oil and hydrocarbons from impermeable surfaces via surface water drains. Where rivers are abstracted for industrial or domestic purposes, oils and hydrocarbon contamination may cause difficulties in the coagulation and filtration processes and special treatment may be needed to remove or destroy unpleasant odours and taste.
Although there are some data on the extent of pollution in surface water outfalls and the costs associated with it (CIWEM 2000), the information is very generic and so the overall contribution of hard standing areas, especially domestic driveways, is difficult to quantify. Hence this impact was not included in the analysis but it could be explored for larger commercial areas like supermarket and retail car parks etc.
• Additional recharging of aquifers – where infiltration into the ground below can be achieved, there may be potential for groundwaters and aquifers to be recharged which can be particularly helpful during periods of drought.
• Enhancements in biodiversity and amenity value – Some of the more sustainable approaches to drainage provide biodiversity and amenity benefit. This is particularly the case with the use of rain gardens as an approach to facilitate the infiltration of water into the ground.
• Savings in energy costs – Reducing or limiting the volume of flow to sewage treatment works will have the potential for reducing energy costs by reducing the need for pumping. However, this was considered to have a limited impact as the main energy use associated with wastewater is the energy required to treat the sewage (EA 2008). This primarily depends on the organic loading of the effluent, which is not substantially affected by surface runoff.
• Deferred investment in sewage treatment capacity – Permeable surfaces could help in reducing the need to provide additional capacity in a number of STW that are already at the limit of their capacity. This will have a limited impact in terms of cost savings.
104 | Understanding permeable and impermeable surfaces
Appendix L
Details of CBA for each option considered
L1 Option 2 – PDR for permeable surfacing in front gardens
L1.1 MethodologyThis option assumes that permeable paving or surfaces would become a permitted development, however using impermeable hardstanding surfaces to pave over front gardens would require planning permission. It is envisaged that this option could significantly decrease the further rise of impermeable hard surfacing and encourage the use of permeable materials. The ultimate effect would be to reduce the surface water runoff and contribute an important reduction to risks of serious flooding, water pollution and public health.
The methodology to undertake the cost benefit analysis of this option is given in the section below:
L1.2 Specific assumptions• fordomesticfrontgardens,theaveragesizeofdrivewaythatwillbe
paved over for each house is assumed to be the average of the size of a small driveway and a large driveway which is estimated as 19m2 and 38m2 respectively. This is given as 28.5m2
• costsestimatesusedinthisanalysisarebasedonthecostpersquaremeterof laying permeable or impermeable surfaces for a small driveway (a size of 19.2m2)
L1.3 Estimation of number and area of front gardens paved over per yearThere is a need to apply reasonable assumptions to build up the total domestic driveway area or area of front gardens in England.
Results of the English Household Condition Survey (EHCS) have been used to estimate the stock of soft front gardens in England. This survey provides data on whether dwellings have front gardens and the proportion of these gardens that are hard (for instance paved) or soft. The results of the analysis of this survey estimated that 11.6 million houses in England have a front garden that is at least
Appendix L Details of CBA for each option considered | 105
partially soft. This was calculated by multiplying the estimate for the number of front gardens by the proportion of front gardens that were 2/10ths soft or more. The data and results in the English Household Condition Survey were provided by Department for this project.
The number of front gardens paved per year was estimated as the product of the percentage or proportion of front gardens that will potentially be paved over and the estimated number of houses with front gardens that is at least partially soft.
Two scenarios were created for the estimating the number and area of front gardens paved over per year based on two survey results. These are:
• Scenario A – It was assumed that over the period of analysis, 1 per cent of front gardens will be converted to either permeable or impermeable surfaces per year. This uses the results of the EHCS.
• Scenario B – Using results from the paving cross over survey in selected local planning authorities in England. This survey estimated the number of conversion of front gardens in England as 42776 per year. This figure was used in the initial impact assessment undertaken by the Department in February 2008.
L1.4 Estimation of the use of permeable and impermeable surfacingTo estimate this, assumptions were made about the percentage of householders who will apply for permission to use impermeable paving and therefore estimate the increase in use of permeable surfaces as a result of the introduction of policy. The Department’s impact assessment (CLG 2008) assumes 0.1-1 per cent of householders who are planning to lay a hard surface will be willing to pay for planning application to use impermeable surfacing.
The analysis initially assumes that 1 per cent of householders who are planning to pave their front gardens will be willing to pay for planning application to use impermeable surfacing. However two other scenarios were created to examine the effect of various percentages on the results in the sensitivity analysis. These are 0.5 and 1.5 per cent.
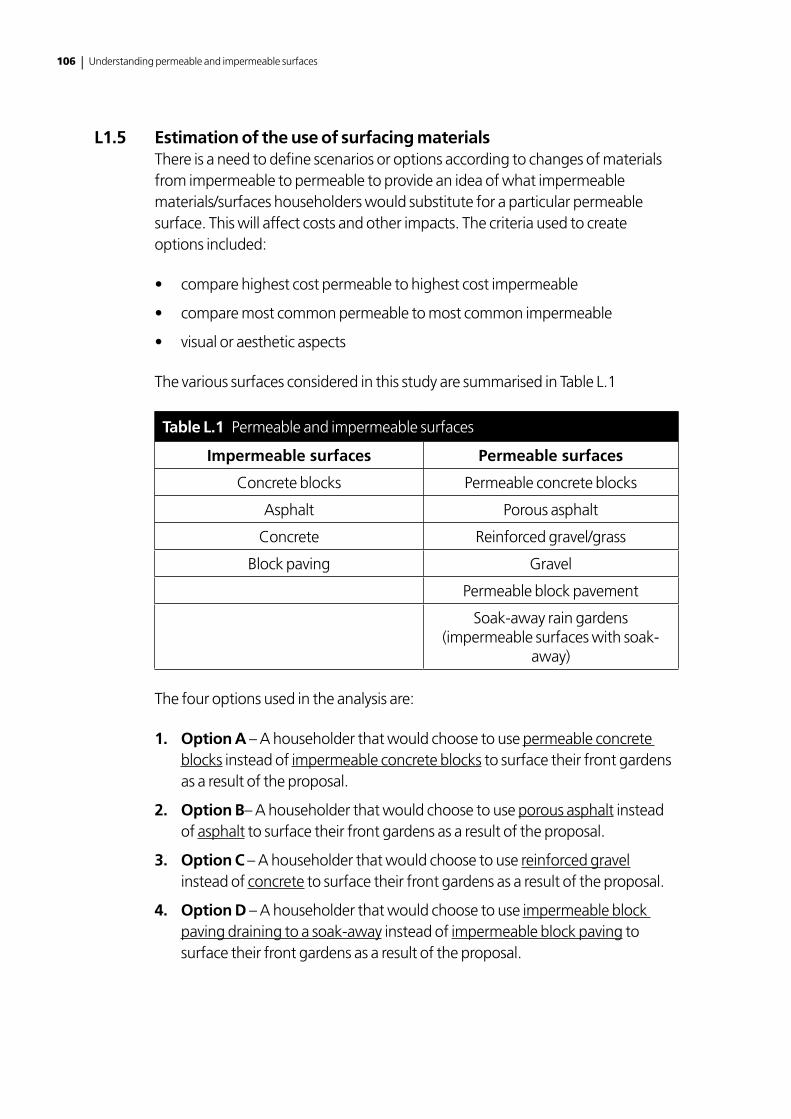
106 | Understanding permeable and impermeable surfaces
L1.5 Estimation of the use of surfacing materialsThere is a need to define scenarios or options according to changes of materials from impermeable to permeable to provide an idea of what impermeable materials/surfaces householders would substitute for a particular permeable surface. This will affect costs and other impacts. The criteria used to create options included:
• comparehighestcostpermeabletohighestcostimpermeable
• comparemostcommonpermeabletomostcommonimpermeable
• visualoraestheticaspects
The various surfaces considered in this study are summarised in Table L.1
Table L.1 Permeable and impermeable surfaces
Impermeable surfaces Permeable surfaces
Concrete blocks Permeable concrete blocks
Asphalt Porous asphalt
Concrete Reinforced gravel/grass
Block paving Gravel
Permeable block pavement
Soak-away rain gardens (impermeable surfaces with soak-
away)
The four options used in the analysis are:
1. Option A – A householder that would choose to use permeable concrete blocks instead of impermeable concrete blocks to surface their front gardens as a result of the proposal.
2. Option B– A householder that would choose to use porous asphalt instead of asphalt to surface their front gardens as a result of the proposal.
3. Option C – A householder that would choose to use reinforced gravel instead of concrete to surface their front gardens as a result of the proposal.
4. Option D – A householder that would choose to use impermeable block paving draining to a soak-away instead of impermeable block paving to surface their front gardens as a result of the proposal.
Appendix L Details of CBA for each option considered | 107
L1.6 Estimation of costs, benefits and sensitivity analysisCost elements included in the analysis are cost of material and construction, administrative costs and cost of planning permission. Costs estimates used in this analysis are based on the cost per square meter of laying permeable or impermeable surfaces for a small driveway (19.2m2). Cost data were available for a large driveway (38.4m2) but the cost differences between the small and large driveway for the permeable and impermeable surfaces were relatively small. Also in calculating the area of front garden that will be paved, it has been assumed that there will be an equal split between small and large driveways. Using costs which were an average of the large and small driveways would not have a significant impact on the NPV calculations.
Main benefits included in the analysis are reduced flooding and reduction in CSO spills. The monetary value of the benefits was assessed using assumptions given above.
For sensitivity analysis, the parameters tested in the model are
• costsandbenefitsmeasuredover40years
• proportionofhouseholderswhowillapplyforplanningpermission
• percentagereductioninsurfacewaterrunoffasaresultofa10percentreduction in impermeable or hard standing surfaces
• costperfloodingincident
L2 Option 3 – PDR for permeable surfacing in non-domestic properties
L2.1 MethodologyThis option assumes that permeable paving or surfaces would be made permitted development if less than 25m2 to 100m2 (depending on the type of development), however using impermeable hard standing surfaces to pave over areas around non-domestic properties would require planning permission.
The White Young Green report, Non householder development consents review, June 2008, indicates that the following areas will be allowed if they are porous (ie permeable): Schools, offices, shops, institutions, waste facilities, equestrianism – 50m2 and industrial – 100m2. Areas greater than this will require planning permission and should, in theory, have a requirement for the use of sustainable drainage systems (SUDS) imposed through planning and development control. The analysis will therefore consider areas that can be paved over as a permitted development right.
108 | Understanding permeable and impermeable surfaces
L2.2 AssumptionsThe following specific assumptions have been used in the CBA for non-domestic properties:
• Themaximumareathatisconsideredforconversionintheanalysisis50m2 for schools, offices, shops institutions and 100m2 for industrial sites. As stated above, under current legislation, areas greater than this will require planning permissions which will have a requirement for the use of SUDS. 50m2 is the most common value and this has been used in the CBA.
• Thereisnoreadilyavailableinformationontheareasthatarepavedoverfornon-domestic uses. Assume 2.5 percent of commercial buildings will add 50m2 per year. It is considered that extra parking spaces will be attractive to a lot of business premises.
• Costestimatesusedintheanalysisarebasedonthecostoflayingpermeableand impermeable surfaces for an area of 50m2 (with or without drain connections). (For small areas up to 50m2 assume same cost constraints and rates as for driveways, but with a thicker construction)
• Ithasbeenassumedthat65percentofnewpermeableareawilldraintothe ground and that 35 per cent will require an extra length of pipe and a membrane to seal them to the sewer ie through the construction of drain connections. This is a judgment based on soil conditions in England.
L2.3 Estimate area non-domestic extensions paved over per year in EnglandResults from Commercial and industrial properties: summary statistics 1 England and Wales have been used to estimate the number of commercial and industrial buildings in England. The report indicates that as at February 2008, there were 1,341,622 commercial and industrial buildings in England. It was assumed that every year, 2.5 percent of non-domestic buildings could potentially have an additional 50m2 of paving. This (ie 2.5 per cent) was used to estimate the number of properties that will add car parks and driveways to their existing structures as 33,541. The area of non-domestic building that is paved per year in England was estimated as 1,677,078m2; this is the product of the average size paved per year and the number of properties that will add 50m2 of car parks or driveways to existing structures.
L2.4 Estimation of the use of permeable and impermeable surfacingTo estimate this, assumptions were made about the percentage of non-domestic properties owners who will apply for permission to use impermeable paving and therefore estimate the increase in use of permeable surfaces as a result of the introduction of policy. The analysis initially assumes that 10 per cent and 90
Appendix L Details of CBA for each option considered | 109
per cent of the total area paved per year will be converted to impermeable and permeable surfaces respectively. There is sensitivity analysis on the proportional split between impermeable and permeable i.e. 50/50 percent and 90/10 per cent.
L2.5 Estimation of the use of surfacing materialsSurfacing materials were described as either impermeable or permeable: the different surfacing materials within these categories were not considered for this analysis. The costs however are based on cost of laying impermeable concrete blocks and permeable concrete blocks and porous. This is because concrete block permeable paving is the most commonly used material at the present time for permeable surfaces.
As a comparison, the cost of porous asphalt and impermeable asphalt was also used in the analysis. Two options were then created and their costs in terms of materials and construction were compared. These are:
1. Option A – Permeable concrete blocks instead of impermeable concrete blocks to surface areas around non-domestic buildings.
2. Option B – Porous asphalt instead of impermeable asphalt to surface areas around non-domestic buildings.
L2.6 Estimation of the costs and benefits; sensitivity analysisCost rates for permeable and impermeable materials were based on the same assumptions as were made for front gardens. It has been assumed that 35 per cent of buildings will have the additional cost of a connection to drainage (ie cost of piping and membrane seal). The cost items included in the analysis were cost of material and construction, administrative costs and cost of planning permission fee.
The main benefit items included in the analysis are reduced flooding and reduced unsatisfactory CSOs as a result of reduction in surface run-off. Benefits from reduced diffuse pollution have not been applied to these areas as it has been assumed that the areas with PDRs are too small to significantly reduce diffuse pollution.
For sensitivity analysis, the parameters tested in the model are:
• splitbetweenuseofpermeableandimpermeablesurfaces
• costsandbenefitsmeasuredoveraperiodof40years
110 | Understanding permeable and impermeable surfaces
L3 Option 4 – PDR for permeable surfacing in back gardens
L3.1 MethodologyThis option relates to recommendation 9 from the Pitt review of flooding and assumes that permeable paving or surfaces would remain permitted development, however using impermeable hard standing surfaces to pave over back gardens would require planning permission. The effect would be, as for the introduction of PDR in front gardens, to reduce the surface water runoff and contribute an important reduction to risks of serious flooding, water pollution and public health.
The methodology to undertake the cost benefit analysis of this option is given in the section below:
L3.2 Specific assumptions• Impermeablepavingwasassumedtocost£28/m2. This is a modal value of
costs for a range of patio materials (excluding thicker blocks used in traffic bearing situations and intricate patterns) taken from SPON’S External Works and Landscape Price Book, 2008
• Toestimatethecostofimpermeablepaving,costpremiumsof10,20and30percent were added to the base cost of permeable paving.
• Costsestimatesusedinthisanalysisarebasedonthecostpersquaremeteroflaying permeable or impermeable surfaces for a small driveway
• Ithasbeenassumedthat2.5percentoftheareapavedwithimpermeablepaving will run-off to sewers whereas none of the area paved with permeable paving will run-off to sewers. There is a great deal of uncertainty associated with this figure so a sensitivity analysis was carried out. It is also likely to vary significantly between different locations and catchments.
L3.3 Estimate area of back gardens paved over per year in EnglandResults of the English Household Condition Survey (EHCS) have been used to estimate the stock of back gardens in England (derived from 2005 year EHCS data). The survey data indicates that 18,127,000 dwellings in England have a rear garden, and that these have a mean size of 186m2, 38 percent of which is hard surfaced. Therefore, it was assumed that 62 per cent of back gardens are not currently paved. EHCS data were provided by Department for this project.
The area of back gardens that is unpaved in England was estimated as 2,090,405,640m2; this is the product of the average size of back gardens, the proportion of back gardens that is unpaved and number of back gardens in England.
Appendix L Details of CBA for each option considered | 111
It was assumed that 1 percent of the total unpaved area of back gardens in England would be paved every year; as data on this was not readily available, the rate of paving assumed for the front garden analysis was applied. Therefore area of back garden that would be paved over every year was estimated as 20,904,056m2.
L3.4 Estimation of the use of permeable and impermeable surfacingTo estimate this, an assumption was made about the percentage of householders who will apply for permission to use impermeable paving and therefore estimate the increase in use of permeable surfaces as a result of the introduction of policy. The Department’s impact assessment (CLG 2008) assumes 0.1-1 per cent of householders who are planning to lay a hard surface will be willing to pay for planning application to use impermeable surfacing.
The analysis initially assumes that 1 percent of householders who are planning to pave their front gardens will be willing to pay for planning application to use impermeable surfacing.
L3.5 Estimation of the impermeable area that is drained to the sewer systemWith existing legislation, most hard surfaced areas in back gardens will drain to unpaved areas of the garden rather than to the sewer system; this is contingent on the assumption that, in most gardens, some area of the garden will remain unpaved. A report entitled Property Creep – A Case Study (Ewans, 2007) stated that “Investigation of patios and all paved areas other than driveways has concluded that no positive water removal is connected to either foul or surface water sewage networks”. This study involved the inspection of ten sites within one sub-catchment. In the absence of any more data, an assumption has been made based on these findings. It has been assumed, pessimistically, that 2.5 per cent of the hard surfaced back garden area (including impermeable paving) will be drained to sewers.
L3.6 Estimation of the use of surfacing materialsSurfacing materials were described as either impermeable or permeable: the different surfacing materials within these categories were not considered for this analysis.
L3.7 Estimation of costs, benefits; sensitivity analysisThe estimation of costs and benefits is based on calculations of the surface areas which will be paved over with permeable surfacing as a result of the introduction of the legislation. The monetised impacts have been calculated based on the assumptions provided.

112 | Understanding permeable and impermeable surfaces
The following cost items were included in the analysis: cost of materials and construction, administrative costs and cost of planning permissions fees.
Main benefits included in the analysis are reduced flooding and reduction in CSO spills. The monetary value of the benefits was assessed using assumptions given above.
For sensitivity analysis, the following parameters tested:
• proportionofbackgardenspaved(witheitherpermeableorimpermeablesurfacing) per year
• proportionofhardstandingareasthatdraintothesewersystem
References | 113
References
Association of British Insurers (ABI), July 2004. The case for increased investment in sewer infrastructure.
Alexander DA (2006) The environmental importance of front gardens. Proc Inst Civ Eng, Municipal Engineer, 159 December 2006 pp 239-244.
Anderson J and Shiers J (2002) The green guide to specification. 3rd Edition, John Wiley and Sons, New Jersey.
Anderson J and Howard N (2007) The green guide to housing specification. Building Research Establishment, Watford. Firs published 2000, reprinted 2007.
Asphalt Information Service (2004) Construction and surfacing of parking areas for medium and heavyweight vehicles. August 2004.
Asphalt Information Service (2006) Construction and surfacing of car parking areas including private drives. June 2006.
Balades J D, Legret M and Madiec H (1995) Permeable pavements: Pollution management tools. Water Science and Technology 32, 49-56.
Beeldens A and Herrier G (2006) Water Pervious Pavement Blocks: The Belgian experience. 8th International Conference on Concrete Block Paving, November 6-8, 2006 San Francisco, California USA
Cabinet Office, 2008 The Pitt Review: Lessons learned from the 2007 floods, Final report. June 2008.
Chartered Institution of Water and Environmental Management (2000) Diffuse pollution impacts, The environmental and economic impacts of diffuse pollution in the UK. Edited by BJ D’Arcy, JB Ellis, RC Ferrier, A Jenkins and R Dils.
CIRIA (2002) Source control using constructed pervious surfaces. CIRIA Report C582.
CIRIA (2004) Sustainable drainage systems – hydraulic, structural and water quality advice. CIRIA Report C609.
Cutting J (2003) Property creep, a case study. WAPUG meeting autumn 2003, Blackpool.
114 | Understanding permeable and impermeable surfaces
Daywater (2003) Review of the use of stormwater BMPs in Europe. Adaptive Decision Support System (ADSS) for the Integration of Stormwater Source Control into Sustainable Urban Water Management Strategies Report 5.1 Project under EU RTD 5th Framework Programme. 18th August. Prepared by Middlesex University.
Defra, 2007. Impact Assessment of Surface Water Management Plans
DCLG, 2008. Impact Assessment – Permeable surfaces
DTI, 2004 Foresight Future Flooding report
Environment Agency (2006) Pollution Prevention Guideline PPG3, use and design of oil separators in surface water drainage systems.
Environment Agency (2007) A review of the cost benefit of undertaking SUDS retrofit in urban areas. Environment Agency Science Report.
Environment Agency, 2008. Less Water to Waste, Impact of reductions in water demand on wastewater collection and treatment systems, Science Project SC060066.
Ferguson B K ( 2005) Porous Pavements. Taylor and Francis Group.
FHA (2005) Context Sensitive Roadway Surfacing Selection Guide – 2005. Federal Highways Administration, US Department of Transportation. Central Federal Lands Highways Division.
Napier F, D’Arcy B and Jefferies C (2008) A review of vehicle related metals and polycyclic aromatic hydrocarbons in the UK environment. Desalination 226 (2008) pp 143 to 150
HM Treasury, 2005. The Green Book: Appraisal and Evaluation in Central Government
HM Treasury, 2005 The Stern review – The economics of climate change
Highways Agency (2004) Manual of contract documents for highway works. Volume 1 Specification for highway works. May 2004.
Interpave (2006) Initial construction costs for various pavement and drainage options. Final April 2006. Prepared by Scott Wilson on behalf of Interpave.
Interpave (2006a) Responsible rainwater management around the home using precast concrete paving.
References | 115
Interpave (2006b) Whole Life Cost Analysis for Various Pavement and Drainage Options. Report MP319, May 2006.
Interpave (2007) Permeable pavements. Guide to the design, construction and maintenance of concrete block permeable pavements. Edition 5, December 2007
Landform (2008). Sustainable drainage – getting under the surface? Seminar on permeable paving. London, 3rd December 2008
Martin I (2008) Introduction to the updated CLEA framework reports. Presentation to North West Brownfield Regeneration Forum. 7th October 2008.
Osborne JL, Martin AP, Shortall CR, Todd AD, Goulson D, Knight ME, Hale RJ and Sanderson RA (2008) Quantifying and comparing bumblebee nest densities in gardens and countryside habitats From Journal of Applied Ecology 45 , 784–792
P401 Commercial and industrial property: Summary statistics 1 England and Wales, 1st April1998-2007. Last updated 28 Feb 2008
PotashDevelopmentAssociation(200?).Potash for heavy soils. PDA leaflet no 19. Downloaded from www.pda.org.uk 05/08/08
Robinson H (2007) Asphalt reservoir pavements for surface water management. SUDSnet National SUDS Conference 14/11/07. Coventry University.
Shackel B (2008) Materials for permeable interlocking concrete paving. Presentation to members of Interpave. 14th February 2008.
UKWIR, 2005. Performance and whole life costs of best management practices and sustainable urban drainage systems
White Young Green, 2008. Non householder development consents review, June 2008

ISBN 978-978 1 409813
9 789781 409813ISBN: 978 1 4098 1714 7