Embed Size (px)
Citation preview

G3582
Understanding lake data
by Byron Shaw Christine Mechenich and Lowell Klessig

THIS GUIDE WAS WRITTENto help people understand information aboutlake water quality and to interpret lake data.Each lake possesses a unique “personality,” orset of physical and chemical characteristicswhich may change over time. Lakes exhibitchemical changes on a daily basis while otherchanges, such as plant and algae growth, occurseasonally. Year-to-year changes in a lake are commonbecause surface runoff, groundwater inflow,precipitation, temperature and sunlight vary.For example, the loss of dissolved oxygen candestroy a lake’s fish population, but mayimprove water clarity. Eliminating fish allowsalgae-eating zooplankton (microscopic animals)to increase, which might reduce algaepopulations. Because of changes like these, datafrom several years are needed to show whethera lake is experiencing significant changes inwater quality.This publication explains the physical andchemical compositions of different types oflakes. It covers lakes’ nutrient status (trophiccondition), and their susceptibility to acid rain.It discusses toxic metals that accumulate in fishand tells how to use general water chemistryprinciples to document potential changes inwater quality. A glossary of technical terms isincluded to help the reader understand thelanguage used in the study of lakes (limnology).
CONTENTSPHYSICAL CHARACTERISTICS ..................................3
Lake types............................................................3Water source........................................................3Mixing and stratification ...................................4Retention time.....................................................5Drainage basin/lake area ratio (DB:LA) .........5Lake water levels ................................................6Water clarity ........................................................6Trophic state........................................................7
CHEMICAL PROPERTIES ...........................................8Phosphorus..........................................................8Nitrogen...............................................................9Chloride ...............................................................11Sulfate...................................................................11Sodium and potassium......................................12
DISSOLVED GASES....................................................12Oxygen .................................................................12Carbon dioxide ...................................................13Nitrogen gas ........................................................14Other gases ..........................................................14
CARBONATE SYSTEMS..............................................14pH—acidity .........................................................14Alkalinity and hardness ....................................15Alkalinity—a lake's buffer against acid rain ..15Marl deposits.......................................................16
SUMMARY ................................................................16BIBLIOGRAPHY ANDADDITIONAL REFERENCES .......................................16GLOSSARY................................................................17

1
1. SEEPAGE LAKE—a natural lake fed byprecipitation, limited runoff and groundwater. Itdoes not have a stream outlet.
FIGURE 1.LAKE TYPES.MAJOR WATER INPUTS
AND OUTFLOWS OF
DIFFERENT LAKE TYPES.(LARGE ARROWS
INDICATE HEAVY
WATER FLOW.)
PHYSICAL CHARACTERISTICS
Lake typesLakes are often classified into four types based onwater source and type of outflow (see Figure 1below).
Water sourceThe source of a lake’s water supply is veryimportant in determining its water quality and in
choosing management practices to protect thatquality. If precipitation is the major water source,the lake will be acidic, low in nutrients, andsusceptible to acid rain. (This includes manyseepage lakes.)If groundwater is the major water source, the lakeis usually well buffered against acid rain andcontains low to moderate amounts of nutrients.(This includes all groundwater drainage lakesand some seepage lakes.) Local septic systems orother groundwater contamination could causeproblems. Water exchange is fairly slow.
RUNOFF
GROUNDWATER
PRECIPITATION
RUNOFF OUTFLOW
EVAPORATION
GROUNDWATER
PRECIPITATION
RUNOFFINFLOWOUTFLOW
EVAPORATION
GROUNDWATER
2. GROUNDWATER DRAINAGE LAKE—anatural lake fed by groundwater, precipitation andlimited runoff. It has a stream outlet.
4. IMPOUNDMENT—a manmade lake created bydamming a stream. An impoundment is also drained by astream.
3. DRAINAGE LAKE—a lake fed by streams,groundwater, precipitation and runoff and drained by astream.
RUNOFFINFLOW
EVAPORATION
GROUNDWATER
PRECIPITATION EVAPORATION
▼

If streams are the major source of lake water,nutrient levels are often high and water exchangetakes place more rapidly. These lakes have themost variable water quality depending on theamount of runoff and human activity in thewatershed (land that drains toward the lake).Managing the watershed to control nutrients andsoil that enter the lake is essential to protectingwater quality. Controlling water that runs fromthe land’s surface into the lake is important fordrainage lakes and impoundments, and someseepage and groundwater lakes. Protectinggroundwater quality is particularly important forseepage and groundwater drainage lakes. Watershed management becomes especiallycritical in impoundment lakes. If a stream isdammed the natural movement of water will berestricted, causing soil and nutrients to collect inthe impoundment. Lake managers measure inflow and outflow todetermine a lake’s water budget. As shown in theformula below, a water budget consists of severalelements. Precipitation in Wisconsin averages 30inches per year. Evaporation depends on thetype of summer weather, but is usually about 21inches. Groundwater flow is more difficult tomeasure, but can be estimated . The water budget can be expressed in percent orin volume. A typical water budget for a drainagelake follows:
Mixing and stratificationA lake’s water quality and ability to support fishare affected by the extent to which the watermixes. The depth, size and shape of a lake are themost important factors influencing mixing,though climate, lakeshore topography, inflowfrom streams, and vegetation also play a role.Water density peaks at 39oF. It is lighter at bothwarmer and colder temperatures. Variations indensity caused by different temperatures canprevent warm and cold water from mixing.When lake ice melts in early spring, thetemperature and density of lake water will besimilar from top to bottom. The uniform waterdensity allows the lake to mix completely,recharging the bottom water with oxygen andbringing nutrients up to the surface. This is
called spring overturn. As surface water warmsin the spring, it loses density. Wind and wavescan circulate the warmed water only 20 to 30 feetdeep, so deeper areas are not mixed. If the lake isshallow (less than 20 feet), however, the watermay stay completely mixed all summer. During the summer, lakes more than 20 feet deepusually experience a layering calledstratification. Depending on their shape, smalllakes can stratify even if they are less than 20 feetdeep. In larger lakes, the wind may continuouslymix the water to a depth of 30 feet or more. Lakeshallows do not form layers, though deeper areasmay stratify. Summer stratification, as shown in Figure 2,divides a lake into three zones: epilimnion(warm surface layer), thermocline ormetalimnion (transition zone between warm andcold water), and hypolimnion (cold bottomwater). Stratification traps nutrients releasedfrom bottom sediments in the hypolimnion. Inthe fall, the surface cools until the watertemperature evens out from top to bottom, whichagain allows mixing (fall overturn). A fall algaebloom often appears when nutrients mix and riseto the surface.Winter stratification, with a temperaturedifference of only 7oF (39o on the lake bottomversus 32o right below the ice), remains stablebecause the ice cover prevents wind from mixingthe water. The lake’s orientation to prevailing winds canaffect the amount of mixing that occurs. Somesmall, deep lakes may not undergo completemixing in the spring or fall if there is not enoughwind action. The mixing that takes place in thebays of a large lake will more closely resemblethat of a small lake because the irregularshoreline blocks the wind .Because mixing distributes oxygen throughout alake, lakes that don’t mix may have low oxygenlevels in the hypolimnion, which can harm fish.Some fish species require lake stratification. Thecold water in the hypolimnion (bottom) can holdmore oxygen than warmer water in theepilimnion (top) and thus provide a summerrefuge for cold water fish such as trout. But if thelake produces too much algae, which fall into thehypolimnion to decay, oxygen becomes depleted.The steep temperature gradient of themetalimnion prevents any surface water withdissolved atmospheric oxygen from reaching thebottom waters.
2
30% + 10% + 60% = 5% + 11% + 84%Groundwater Precipitation Surface Groundwater Evaporation Streaminflow runoff outflow outlet

SPRING OVERTURN(March-April)WIND
39°39°39°39°39°39°
SUMMER STRATIFICATION
75°68°50°46°43°43°
➞➞
➞➞
EpilimnionMetalimnionHypolimnion
50 feet
FALL OVERTURN(September- October)
39°41°46°46°43°
WIND
LATE FALL(November)
39°39°39°39°39°39°
WINTER STRATIFICATION
32°34°36°39°39°39°
ICE
Retention timeThe average length of time water remains in alake is called the retention time or flushing rate.The lake’s size, water source, and watershed sizeprimarily determine the retention time. Rapid water exchange rates allow nutrients to beflushed out of the lake quickly. Such lakesrespond best to management practices thatdecrease nutrient input. Impoundments, smalldrainage lakes, and lakes with large volumes ofgroundwater inflow and stream outlets(groundwater drainage lakes) fit this category. Longer retention times occur in seepage lakeswith no surface outlets. Average retention timesrange from several days for some smallimpoundments to many years for large seepagelakes. Lake Superior has the longest retentiontime of Wisconsin lakes—500 years!
Nutrients that accumulate over a number ofyears in lakes with long retention times can berecycled annually with spring and fall mixing.Reserve nutrients in lake sediments can continueto recirculate, even after the source of nutrients inthe watershed has been controlled. Thus, theeffects of watershed protection may not beapparent for a number of years. Nevertheless,lakes with long retention times tend to have thebest water quality as shown by the lower levelsof the plant nutrient phosphorus in Table 1.Better water quality results from both theirgreater depth and relatively smaller watersheds.
Drainage basin/lake area ratio(DB:LA)The size of the watershed (drainage basin)feeding a lake relative to the lake’s size (area) isan important factor in determining the amount of
3
FIGURE 2. Annual temperature cycles in stratified lakes.
▼

TABLE 1. Several characteristics of lakes with different retention times. (Adapted from Lillie and Mason, 1983.)
Retention time in days 0-14 15-60 61-180 181-365 366-730 >730
Mean depth (ft.) 6 8 11 11 13 23Max. depth (ft.) 16 21 25 27 35 57Mean total phosphorus (µg/l)* 94 85 56 48 33 25Mean DB:LA ratio** 1166 142 42 15 8 6
*Summer values; µg/l = micrograms per liter or parts per billion**DB:LA = Drainage basin/lake area
nutrients in a lake. Table 1 shows thisrelationship for a sample of Wisconsin lakes. Lakes with relatively large drainage basinsusually have significant surface water inflow.This inflow carries more nutrients and sedimentsinto these drainage lakes or impoundments. Bydefinition, seepage lakes have small drainagebasins, more groundwater flow, and fewernutrients from runoff. Groundwater drainagelakes typically have an intermediate-sizeddrainage basin.Table 1 shows the relationship between retentiontime and the drainage basin:lake area ratio. Lowratio lakes (small drainage basin and large lakearea) have high retention times while high-ratiolakes have short retention times. Drainagebasin:lake area ratios can be used to estimate alake’s retention time.
Lake water levelsLake levels fluctuate naturally due toprecipitation which varies widely from season toseason and year to year. While some lakes withstream inflows show the effect of rainfall almostimmediately, others, such as seepage lakes, donot reflect changes in precipitation for months.For example, heavy autumn rains often causewater levels to rise in the winter when rain entersthe lake as groundwater. Water level fluctuations significantly affect lakewater's quality. Low levels may cause stressfulconditions for fish and increase the number ofnuisance aquatic plants. High water levels canboost the amount of nutrients from runoff andflooded lakeshore soils. Older septic systems,located near lakes, may flood when groundwaterlevels are high. Yet another consequence offluctuating water levels is shoreline erosion.
Water clarityStrictly speaking, clarity is not a chemicalproperty of lake water. More accurately, it is anindicator or measure of water quality related tochemical and physical properties.Water clarity has two main components: truecolor (materials dissolved in the water) andturbidity (materials suspended in the water such asalgae and silt). The algae population is usuallythe largest and most variable component. Water clarity often indicates a lake’s overallwater quality, especially the amount of algaepresent. Algae are natural and essential, but toomuch of the wrong kind can cause problems.Table 2 shows the inverse relationship betweenSecchi disc depth (a measure of clarity) andchlorophyll a (a measure of algae) for differenttypes of lakes.Secchi disc readings are taken using an 8-inchdiameter weighted disc painted black and white.The disc is lowered over the downwind, shadedside of the boat until it just disappears from sight,then raised until it is just visible. The average ofthe two depths is recorded. Secchi disc readingsshould be taken on calm, sunny days between 10a.m. and 2 p.m. since cloud cover, waves, and thesun’s angle can affect the reading.
4
TABLE 2. Water clarity index.
Water clarity Secchi depth (ft.)Very poor 3Poor 5Fair 7Good 10Very good 20Excellent 32

Secchi disc values vary throughout the summeras algal populations increase and decrease.Measuring several sites may be useful in somelakes, depending upon the uniformity of the lake.Year to year changes result from weather andnutrient accumulation. Weekly or biweekly Secchirecords (April-November) over a number of yearsprovide an excellent and inexpensive way to documentlong-term changes in water clarity.
The color of lake water reflects the type andamount of dissolved organic chemicals itcontains. Measured and reported as standardcolor units on filtered samples, color’s mainsignificance is aesthetic. Color may also reducelight penetration, slowing weed and algaegrowth. Many lakes possess natural, tan-coloredcompounds (mainly humic and tannic acids)from decomposing plant material in thewatershed. Brown water can result from bogsdraining into a lake. Before or duringdecomposition, algae may impart a green, brownor even reddish color to the water. Color can affect the Secchi disc reading. Table 3lists color values associated with varying degreesof water color. Another measure of water clarity, turbidity iscaused by particles of matter rather thandissolved organic compounds. Suspended
particles dissipatelight, which affectsthe depth at whichplants can grow. Turbidity affects theaesthetic quality ofwater. Lakesreceiving runoff fromsilt or clay soils oftenpossess high
turbidities. These values vary widely with thenature of the seasonal runoff. Suspended plants and animals also produceturbidity. Many small organisms have a greatereffect than a few large ones. Turbidity caused byalgae is the most common reason for low Secchidisc readings.
Trophic stateTrophic state is another indicator of waterquality. Lakes can be divided into threecategories based on trophic state—oligotrophic,mesotrophic, and eutrophic. These categoriesreflect a lake’s nutrient and clarity levels. Oligotrophic lakes are generally clear, deep andfree of weeds or large algae blooms. Thoughbeautiful, they are low in nutrients and do notsupport large fish populations. However,oligotrophic lakes often develop a food chaincapable of sustaining a very desirable fishery oflarge game fish. Eutrophic lakes are high in nutrients and supporta large biomass (all the plants and animals livingin a lake). They are usually either weedy orsubject to frequent algae blooms, or both.Eutrophic lakes often support large fishpopulations, but are also susceptible to oxygendepletion. Small, shallow, eutrophic lakes areespecially vulnerable to winterkill which canreduce the number and variety of fish. Roughfish are commonly found in eutrophic lakes. Mesotrophic lakes lie between the oligotrophicand eutrophic stages. Devoid of oxygen in latesummer, their hypolimnions limit cold water fishand cause phosphorus cycling from sediments.A natural aging process occurs in all lakes,causing them to change from oligotrophic to
5
The WisconsinDepartment ofNatural Resources(DNR) operates a“Self-Help MonitoringProgram” for lakes.Local volunteers takeSecchi disc and otherreadings and theDNR providescomputer datastorage and annualreports. For moreinformation, contact adistrict DNR office orwrite to:DNR Lake Manage-ment ProgramWRM/2P.O. Box 7921Madison, WI 53707.
▼FIGURE 3. Lake aging process.
OLIGOTROPHIC
• Clear water, low productivity• Very desirable fishery of large
game fish
MESOTROPHIC
• Increased production• Accumulated organic matter • Occasional algal bloom• Good fishery
EUTROPHIC
• Very productive• May experience oxygen depletion• Rough fish common
TABLE 3. Water color.(Adapted from Lillie andMason, 1983.)
0--40 units Low40-100 units Medium
>100 units High

TABLE 4. Trophic classification of Wisconsin lakes based on chlorophyll a, water clarity measurements,and total phosphorus values. (Adapted from Lillie and Mason, 1983.)
Trophic class Total phosphorus µg/l Chlorophyll a µg/l Secchi Disc feetOligotrophic 3 2 12
10 5 8Mesotrophic 18 8 6
27 10 6Eutrophic 30 11 5
50 15 4
eutrophic over time, and eventually to fill in(Figure 3). People can accelerate theeutrophication process by allowing nutrientsfrom agriculture, lawn fertilizers, streets, septicsystems, and urban storm drains to enter lakes. In nutrient-poor areas, the aging process maylead instead to dystrophic and bog lakes whichare highly colored, acid, and not as productive aseutrophic lakes.Researchers use various methods to calculate thetrophic state of lakes. Common characteristicsused to make the determination are:
• total phosphorus concentration (important for algae growth)• chlorophyll a concentration (a measure of the amount of algae present)• Secchi disc readings (an indicator of water clarity).
The trophic states associated with these threemeasures are shown in Table 4. Clearly, lowlevels of phosphorus are associated with lowlevels of algae (chlorophyll a), which areassociated with high Secchi disc readings.
CHEMICAL PROPERTIES
PhosphorusPhosphorus promotes excessive aquatic plantgrowth. In more than 80% of Wisconsin’s lakes,phosphorus is the key nutrient affecting theamount of algae and weed growth. Phosphorus originates from a variety of sources,many of which are related to human activities.Major sources include human and animal wastes,soil erosion, detergents, septic systems and runofffrom farmland or lawns.Phosphorus provokes complex reactions in lakes.An analysis of phosphorus often includes bothsoluble reactive phosphorus and total phosphorus.
Soluble reactive phosphorus dissolves in thewater and readily aids plant growth. Itsconcentration varies widely in most lakes overshort periods of time as plants take it up andrelease it.Total phosphorus is considered a better indicatorof a lake’s nutrient status because its levelsremain more stable than soluble reactivephosphorus. Total phosphorus includes solublephosphorus and the phosphorus in plant andanimal fragments suspended in lake water.Ideally, soluble reactive phosphorusconcentrations should be 10 µg/l (micrograms
6
CONCENTRATIONUNITS express the
amount of a chemicaldissolved in water.The most common
ways chemical data isexpressed is in
milligrams per liter(mg/l) and
micrograms per liter(µg/l). One milligram
per liter is equal toone part per million
(ppm). To convertmicrograms per liter(µg/l) to milligrams
per liter (mg/l), divideby 1000 (e.g., 30
µg/l = 0.03 mg/l).To convert milligrams
per liter (mg/l) tomicrograms per liter
(µg/l), multiply by1000 (e.g., 0.5 mg/l
= 500 µg/l).Microequivalents per
liter (µeq/l) is alsosometimes used,
especially foralkalinity. It is
calculated by dividingthe equivalent weightof the compound by
1000 and thendividing that number
into the milligramsper liter.
FIGURE 4. Total phosphorus concentrations forWisconsin's natural lakes and impoundments.(Adapted from Lillie and Mason, 1983.)
Water Quality Total PhosphorusIndex (µg/l)
150140130120110100
90807060504030201001
Very poor
Poor
Fair
Good
Very good
Excellent
Average for
impoundments
Average for
natural lakes

per liter) or less at spring turnover to preventsummer algae blooms. A concentration of 10micrograms per liter is equal to 10 parts perbillion (ppb) or 0.01 milligrams per liter (mg/l).A concentration of total phosphorus below 20µg/l for lakes and 30 µg/l for impoundmentsshould be maintained to prevent nuisance algalblooms (Figure 4).Phosphorus does not dissolve easily in water. Itforms insoluble precipitates (particles) withcalcium, iron, and aluminum. In hard waterareas of Wisconsin, where limestone is dissolvedin the water, marl (calcium carbonate)precipitates and falls to the bottom. Marlformations absorb phosphorus, reducing itsoverall concentration as well as algae growth.Aquatic plants with roots in the marl bottom stillget phosphorus from sediments. Hard waterlakes often have clear water, but may be weedy.Iron also forms sediment particles that storephosphorus—but only if oxygen is present.When lakes lose oxygen in winter or when thedeep water (hypolimnion) loses oxygen insummer, iron and phosphorus again dissolve inwater. Strong summer winds or spring and fallturnover may mix iron and phosphorus withsurface water. For this reason, algae blooms maystill appear in lakes for many years even ifphosphorus inputs are controlled. Figure 5 shows the increase in totalphosphorus for stratified lakesfollowing fall turnover. Sinceshallow and windswept lakes thatstay mixed do not experienceoxygen depletion, they have thehighest total phosphorus levels insummer following spring turnoverand early summer runoff.The amount of iron that might reactwith phosphorus varies widely inWisconsin lakes. Lakes in thesouthern part of the state are oftenlow in iron due to a higher pH andmore sulfur, both of which limit ironsolubility. This in turn affectswhether phosphorus mixed intolakes during fall turnoverprecipitates or stays in solutionduring the winter.Lakes with low iron and insufficientcalcium to form marl are most likelyto retain phosphorus in solutiononce it is released from sediments orbrought in from external sources.These lakes are the most vulnerable
to naturally occurring phosphorus or tophosphorus loading from human activitiesbecause the phosphorus remains dissolved in thewater—not pulled down into the sediments.Such lakes often respond with greater algaeproblems.Figure 5 also shows that impoundments have thehighest phosphorus levels. Mixed drainage lakessustain intermediate levels, while seepage andstratified drainage lakes have the lowest. Evenwith the potential for internal phosphoruscycling caused by oxygen depletion, deepstratified lakes tend to have lower phosphoruslevels than their mixed counterparts.Phosphorus control has been attempted in somelakes by using alum (aluminum sulfate) toprecipitate phosphorus. Sewage treatment plantsuse the same process to remove phosphorus.Aluminum phosphate precipitate, unlike ironphosphate, is not redissolved when oxygen isdepleted.
NitrogenNitrogen is second only to phosphorus as animportant nutrient for plant and algae growth. Alake’s nitrogen sources vary widely. Nitrogencompounds often exceed 0.5 mg/l in rainfall, so
7
110
100
90
80
70
60
50
40
30
10
20
Stratifiedimpoundments
Mixedimpoundments
Mixeddrainage
lakes
Mixedseepage
lakes
Stratifieddrainage
lakes
Stratifiedseepage
lakes
TOTA
L PHO
SPHO
RUS (
µg/l)
Winter Spring Summer Fall
▼FIGURE 5.Seasonal totalphosphorusaverages for sixlake types byseason. (Adaptedfrom Lillie andMason, 1983).

FIGURE 6.Sources and
cycling ofnitrogen in lake.
that precipitation may be the main nitrogensource for seepage and some drainage lakes. In most cases, however, the amount of nitrogenin lake water corresponds to local land use.Nitrogen may come from fertilizer and animalwastes on agricultural lands, human waste fromsewage treatment plants or septic systems, andlawn fertilizers used on lakeshore property.Nitrogen may enter a lake from surface runoff orgroundwater sources. Nitrogen exists in lakes in several forms.Analysis usually includes nitrate (NO3
–) plusnitrite (NO2
–), ammonium (NH4+), and organic
plus ammonium (Kjeldahl nitrogen). Totalnitrogen is calculated by adding nitrate andnitrite to Kjeldahl nitrogen. Organic nitrogen isoften referred to as biomass nitrogen. Nitrogen does not occur naturally in soilminerals, but is a major component of all organic(plant and animal) matter. Decomposing organicmatter releases ammonia, which is converted tonitrate if oxygen is present. This conversionoccurs more rapidly at higher watertemperatures. All inorganic forms of nitrogen(NO3
–, NO2– and NH4
+) can be used by aquaticplants and algae. If these inorganic forms ofnitrogen exceed 0.3 mg/l (as N) in spring, there issufficient nitrogen to support summer algaeblooms.
Figure 6 shows the various ways that nitrogenenters and cycles within a lake. Sediments clearlycause nitrogen to undergo a number of changes.Nitrogen recycled back into overlying water atspring and fall turnover will often increaseammonia levels in samples taken duringturnover. Nitrogen can be lost from the lake tothe atmosphere by denitrification as shown in thefigure. This only occurs if oxygen is depleted,allowing nitrate to be converted back to nitrogengas.In about 10% of Wisconsin’s lakes, nitrogen(rather than phosphorus) limits algae growth.This occurs when the ratio of total nitrogen tototal phosphorus is less than 10:1. Valuesbetween 10:1 and 15:1 are considered transitional,while lakes with values greater than 15:1 areconsidered phosphorus limited—algae growth iscontrolled by the amount of phosphorus.Low nitrogen levels do not guarantee limitedalgae growth in the same way low phosphoruslevels do. Nuisance blue-green algae blooms areoften associated with lakes that have lownitrogen to phosphorus (N:P) ratios. These algaeuse atmospheric nitrogen gas (N2) dissolved inlake waters as a nitrogen source; other moredesirable types of algae and plants depend on theinorganic nitrate and ammonium forms ofnitrogen.
8
▼
RAIN containing NO3–, NH4
+
Runoff containing NO3–,
NH4+,Organic N
Water table
Water table
Groundwater NO3–
GroundwaterNO3
– NO3– Biomass N
Biomass N NO3
–
NH4+ NO3
–
NO2–
N2 (Denitrification)

CHLORIDE CONCENTRATIONS (mg/l)
>10 >3 - 10 <3
Larger plants also need nitrogen and maydepend on spring runoff for septic systems torecharge the sediments with nitrogen. Growth ofEurasian milfoil has been correlated with suchfertilization of the sediment.
ChlorideThe presence of chloride (Cl–) where it does notoccur naturally indicates possible waterpollution. Chloride does not affect plant andalgae growth and is not toxic to aquaticorganisms at most of the levels found inWisconsin. Chloride is not common in Wisconsinsoils, rocks or minerals, except in areas withlimestone deposits. Figure 7 shows thegeographic distribution of chloride in Wisconsinlakes. Sources of chloride include septic systems(chloride values of 50 to 100 mg/l are common inseptic tank effluent), animal waste, potashfertilizer (potash = potassium chloride), anddrainage from road-salting chemicals. Increasesin chloride, either seasonally or over time, canmean that one or more of these sources isaffecting the lake.
An increase in chloride from human or animalwaste suggests that other nutrients are alsoentering the lake. Higher chloride concentrationsfrom spring to fall may be the effect of lawnfertilizer runoff or septic systems during heavyuse by summer residents. Higher values inspring after the snow melts may signify runofffrom drainage basins or highways as a majorsource of chloride. Since lakes vary in theirnatural chloride content, it is important to havebackground data or a long term database todocument changes.
SulfateSulfate in lake water is primarily related to thetypes of minerals found in the watershed and toacid rain. Industries and utilities that burn coalrelease sulfur compounds into the atmospherethat are carried into lakes by rainfall. InWisconsin, the highest lake sulfate levels arefound in the southeast portion of the state (Figure8), where mineral sources and acid rain are morecommon.In water depleted of oxygen (anaerobic water),sulfate can be reduced to hydrogen sulfide (H2S).Hydrogen sulfide gas smells like rotten eggs and
9
DOUGLAS
BA YFIELD
ASHLAND
IRON
BURNETT
VILAS
WASHBURN SA WYER
PRICE
ONEIDA
FOREST
FLORENCE
BARRONPOLK RUSK
TAYLOR
CHIPPEWA
PEPIN
EAU CLAIRE
CLARK
LINCOLN
MARATHON
LANGLADE
MARINETTE
OCONTO
MENOMINEE
SHA WANO
DOOR
KE
WA
UN
EE
W AUPACAWOOD PORTAGE
W AUSHARA
JACKSON
JUNEAU
ADAMS
MARQUETTE
MONROE
SAUK
MIL
WA
UK
EE
IOW A
GRANT
RICHLAND
CRAWFORD
VERNON
LA CROSSE
BUFFALO
TR
EM
PE
ALE
AU
KENOSHA
RACINE
OUTAGAMIE
BROWN
MANIT OWOCWINNEBAGO
SHEBOYGANFOND DU LAC
COLUMBIADODGE
DANE JEFFERSON WAUKESHA
WASHING-TON
OZ
AU
KE
E
LAFAYETTE GREEN ROCK WALWOR TH
ST. CROIX DUNN
PIERCE
CA
LUM
ET
GREEN-LAKE
DOUGLAS
BA YFIELD
ASHLAND
IRON
BURNETT
VILAS
WASHBURN SA WYER
PRICE
ONEIDA
FOREST
FLORENCE
BARRONPOLK RUSK
TAYLOR
CHIPPEWA
PEPIN
EAU CLAIRE
CLARK
LINCOLN
MARATHON
LANGLADE
MARINETTE
OCONTO
MENOMINEE
SHA WANO
DOOR
KE
WA
UN
EE
W AUPACAWOOD PORTAGE
W AUSHARA
JACKSON
JUNEAU
ADAMS
MARQUETTE
MONROE
SAUK
MIL
WA
UK
EE
IOW A
GRANT
RICHLAND
CRAWFORD
VERNON
LA CROSSE
BUFFALO
TR
EM
PE
ALE
AU
KENOSHA
RACINE
OUTAGAMIE
BROWN
MANITOWOCWINNEBAGO
SHEBOYGANFOND DU LAC
COLUMBIADODGE
DANE JEFFERSON WAUKESHA
WASHING-TON
OZ
AU
KE
E
LAFAYETTE GREEN ROCK WALWOR TH
ST. CROIX DUNN
PIERCE
CA
LUM
ET
GREEN-LAKE
FIGURE 7. Generalized distribution gradients ofchloride in the surface waters of Wisconsin lakes.(Adapted from Lillie and Mason, 1983.)
FIGURE 8. Generalized distribution gradients ofsulfate in the surface waters of Wisconsin lakes.(Adapted from Lillie and Mason, 1983.)
SULFATE CONCENTRATIONS (mg/l)
>40 20 - 40 10 - 20 <10

is toxic to aquatic organisms. The sulfide ion (S=)produced under these conditions can also affectthe amount of metal ions in the lake since mostmetals, including iron and mercury, forminsoluble sulfide precipitates. As a result of thehigh sulfate content (Figure 8), iron often exists inlower concentrations in southern lakes because itprecipitates and settles out in sediments as ironsulfide.
Sodium and potassiumSince natural levels of sodium and potassiumions in soil and water are very low, their presencemay indicate lake pollution caused by humanactivities. Sodium is often associated withchloride. It finds its way into lakes from roadsalt, fertilizers, and human and animal waste.Potassium is the key component of commonly-used potash fertilizer, and is abundant in animalwaste. Soils retain sodium and potassium to a greaterdegree than chloride or nitrate; therefore, sodiumand potassium are not as useful as pollutionindicators. Increasing sodium and potassiumvalues over time can mean there are long-termeffects caused by pollution. Although notnormally toxic themselves, these compoundsstrongly indicate possible contamination frommore damaging compounds.
DISSOLVED GASESThree gases found in the air—oxygen, carbondioxide and nitrogen—are very important to lakeecosystems. Three main factors determine theamount of gases present in a lake: • wind mixing that brings water into contact withthe atmosphere;• the biological activity that consumes orproduces gases within a lake; and• gas composition of groundwater and surfacewater entering a lake.
OxygenOxygen (O2) is undoubtedly the most importantof the gases, since most aquatic organisms need itto survive. The solubility of oxygen and othergases depends on water temperature. The colderthe water, the more gases it can hold. Boilingwater removes all gases. Table 5 shows this effectfor oxygen in typical lake water temperatures. The values in Table 5 are found in lakes wherecontinuous mixing occurs, allowing free oxygen
exchange between water and the atmosphere.(The atmosphere contains about 21% oxygen.)However, the levels often differ greatly from thevalues found in Table 5 because mixing is seldomcomplete. Ice cover dramatically reduces mixing.In addition, biological reactions in the lakeconsume or release oxygen.Oxygen is produced whenever green plantsgrow. Plants use carbon dioxide and water toproduce simple sugars and oxygen, usingsunlight as the energy source. Chlorophyll, thegreen pigment in plants, absorbs sunlight andserves as the oxygen production site. Thisprocess is called photosynthesis (Equation 1).Photosynthesis occurs only during daylight hoursand only to the depths where sunlight penetrates.The amount of photosynthesis depends on thequantity of plants, nutrient availability, andwater temperature. Higher temperatures speedup the process. Plants and animals alsoconstantly use oxygen to break down sugar andobtain energy by a process called respiration,basically the reverse of the photosyntheticreaction as shown in Equation 2. Burning fossilfuels or other organic matter produces the samechemical reactions shown for respiration,releasing more carbon dioxide (CO2) to theatmosphere.
10
EQUATION 1. PHOTOSYNTHESIS.
6 CO2 + 6 H2O —————-> C6H12O6 + 6O2
carbon water chlorophyll sugar oxygendioxide sunlight
EQUATION 2. RESPIRATION.
C6H12O6 + 6 O2 —————-> 6 CO2 + 6 H2O
sugar oxygen carbon waterdioxide
TABLE 5. Oxygen solubility at differenttemperatures.
Temperature Oxygen solubilityoC oF (mg/l)
0 32 155 41 1310 50 1115 59 1020 68 925 77 8

The combination of these two reactions largelydetermines the amount of oxygen and carbondioxide present in lakes at different times of dayand at different depths. During daylight hours, itis not uncommon to find oxygen values insurface waters that exceed those listed in Table 5(supersaturation), while at night or earlymorning before photosynthesis begins they mayfall below those values. At lake depths below thereach of sunlight, the only reaction that occurs isoxygen-consuming respiration. The deephypolimnic waters of productive lakes oftenexperience oxygen depletion. Lakes with highbiological activity undergo greater fluctuationsthan lakes with few plants and animals.Typical oxygen levels in a productive lakefollowing summer stratification are shown inFigure 9. Low oxygen levels in the hypolimnionmean that fish must live in the epilimnion andmetalimnion. Fish (trout) that need high oxygenlevels and cool water disappear from such lakes.Winter oxygen depletion (winterkill) is acommon problem in many shallow Wisconsinlakes. It happens in years when at least fourinches of snow cover the lake, which preventssunlight from reaching the water. Allphotosynthesis stops and plants begin to die anddecompose. The extent of oxygen loss dependson the total amount of plant, algae and animalmatter that decays. Drought increases the chanceof winterkill by reducing the volume of water inthe lake.
The water quality standard for oxygen in “warmwater” lakes and streams is 5 mg/l. This is theminimum amount of oxygen needed for fish tosurvive and grow. The standard for trout watersis 7 mg/l. A smart angler would know that thelake in Figure 9 contains no trout and that itwould be silly to fish for walleye in the deepholes in late summer. (See Equation 3.)
Carbon dioxideCarbon dioxide (CO2), like oxygen, is affected byphotosynthesis, respiration and contact with theatmosphere. It is also affected by a third reactioninvolving the amount of carbonate minerals, oralkalinity, present in lake water. Alkalinity isdiscussed in another section.Carbon dioxide is essential to plant growth. It isthe basic carbon source from which plantsproduce sugar and more complex organic matter.Values often fluctuate, being highest late at nightand lowest early in the evening.
11
FIGURE 9.Typical oxygenand nutrientstatus ofmesotrophicand eutrophiclakes aftersummerstratification.
Metalimnion(thermocline)
Epilimnion
Hypolimnion
Wind
O2 mg/l75
75
65
55
45
45
45
45
Temp °F
Organic matter8
8
7
5
4
2
0
0 NH4 - Phos - Fe
Respiration and decomposition of organic matter uses oxygen and releases nutrients
Sediment nutrient release
Photosynthesis and wind add oxygen faster than used by respirationNutrients tied up in weeds, algae
EQUATION 3. CARBON DIOXIDE REACTIONS.
CO2 + H2O —> H2CO3 <=====> H+ + HCO3-
carbon water carbonic hydrogen bicarbonatedioxide acid
HCO3– <====> H+ + CO3
=
bicarbonate hydrogen carbonate
▼
As carbon dioxide changes from morning toevening, so does water’s pH, especially in low-alkaline, productive lakes.When carbon dioxide reacts with water, it formscarbonic acid. This in turn affects the pH(acidity) of water. Acidity regulates the solubilityof many minerals.
Nitrogen gasNitrogen comprises 78% of the gas in theatmosphere. Like other gases, it is more solubleat cooler temperatures. Most aquatic plants donot derive nutritional value from nitrogen gas,though blue-green algae is an exception.Nitrogen gas is important in lakes containingsuch algae.Some bacteria convert nitrate back to nitrogen gasunder anaerobic conditions when soluble organicmatter is present. This reaction, calleddenitrification, is one of the main ways nitrogenis lost from certain lakes and some soils. Thisreaction is being investigated as a means ofreducing pollution from septic systems.
Other gasesUnder anaerobic conditions, hydrogen sulfide(H2S) and methane gas (CH4) may form anddisperse into lake water from underlyingsediments. Commonly referred to as “swampgases,” hydrogen sulfide and methane can beseen bubbling out when an oar pierces shallow,mucky sediments. Hydrogen sulfide (H2S) smellslike rotten eggs and is toxic to fish.
CARBONATE SYSTEMSA lake’s carbonate system contains a number ofnaturally-occurring chemicals that affect basicbiological productivity, determine the lake’s acidbuffering capacity, and regulate the solubility ofmany toxic chemicals. The complex carbonatesystem undergoes constant change in response tobiological activity, temperature change, sunlight,and even wave action. The previous discussionon oxygen and carbon dioxide introduced someof these reactions.
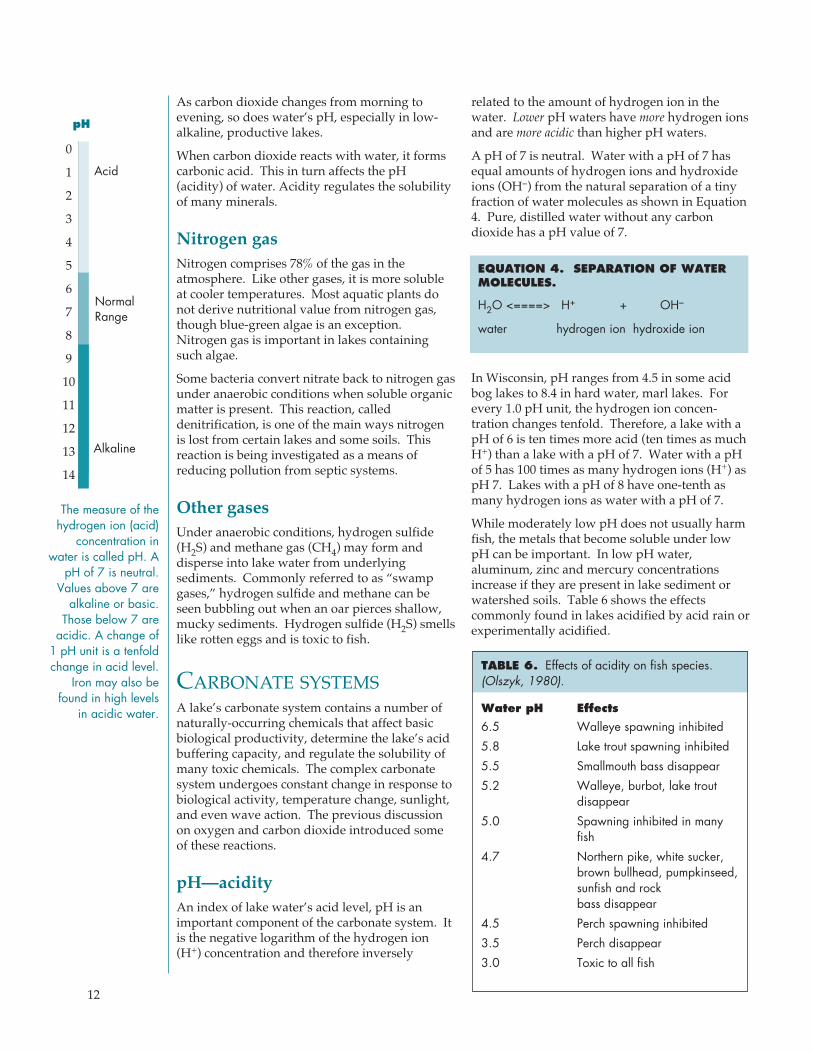
pH—acidityAn index of lake water’s acid level, pH is animportant component of the carbonate system. Itis the negative logarithm of the hydrogen ion(H+) concentration and therefore inversely
related to the amount of hydrogen ion in thewater. Lower pH waters have more hydrogen ionsand are more acidic than higher pH waters. A pH of 7 is neutral. Water with a pH of 7 hasequal amounts of hydrogen ions and hydroxideions (OH–) from the natural separation of a tinyfraction of water molecules as shown in Equation4. Pure, distilled water without any carbondioxide has a pH value of 7.
In Wisconsin, pH ranges from 4.5 in some acidbog lakes to 8.4 in hard water, marl lakes. Forevery 1.0 pH unit, the hydrogen ion concen-tration changes tenfold. Therefore, a lake with apH of 6 is ten times more acid (ten times as muchH+) than a lake with a pH of 7. Water with a pHof 5 has 100 times as many hydrogen ions (H+) aspH 7. Lakes with a pH of 8 have one-tenth asmany hydrogen ions as water with a pH of 7.While moderately low pH does not usually harmfish, the metals that become soluble under lowpH can be important. In low pH water,aluminum, zinc and mercury concentrationsincrease if they are present in lake sediment orwatershed soils. Table 6 shows the effectscommonly found in lakes acidified by acid rain orexperimentally acidified.
12
01234567891011121314
Acid
NormalRange
Alkaline
EQUATION 4. SEPARATION OF WATERMOLECULES.
H2O <====> H+ + OH–
water hydrogen ion hydroxide ion
pH
The measure of thehydrogen ion (acid)
concentration inwater is called pH. A
pH of 7 is neutral.Values above 7 are
alkaline or basic.Those below 7 are
acidic. A change of1 pH unit is a tenfoldchange in acid level.
Iron may also befound in high levels
in acidic water.
TABLE 6. Effects of acidity on fish species.(Olszyk, 1980).
Water pH Effects
6.5 Walleye spawning inhibited5.8 Lake trout spawning inhibited5.5 Smallmouth bass disappear5.2 Walleye, burbot, lake trout
disappear5.0 Spawning inhibited in many
fish4.7 Northern pike, white sucker,
brown bullhead, pumpkinseed,sunfish and rock bass disappear
4.5 Perch spawning inhibited3.5 Perch disappear3.0 Toxic to all fish

Aluminum has beenblamed for many ofthe problemsassociated withacidification of lakesand streams incertain areas ofNorth America andEurope. Mercurylevels in fish arehigh in acidifiedlakes. While notusually toxic to fish,high aluminum and
mercury levels pose a health problem for loons,eagles, osprey and humans who eat chemicallytainted fish. Some aquatic organisms appearunable to maintain calcium levels when pH islow, and consequently develop weak bones andshells.Rainfall in Wisconsin varies from a pH of 4.4 insoutheastern Wisconsin to nearly 5.0 innorthwestern Wisconsin. Natural rainfall,exposed to CO2 in the atmosphere, maintains apH of 5.6. Thus, most fish could not reproduce ineven the best rainfall if rainwater pH were notraised by the chemical buffering of the carbonatesystem in streams, lakes and the surroundingwatershed.
Alkalinity and hardnessThe carbonate system provides acid bufferingthrough two alkaline compounds: bicarbonate(HCO3
–) and carbonate (CO3=). These
compounds are usually found with two hardnessions: calcium (Ca++) and magnesium (Mg++). A lake’s hardness and alkalinity are affected bythe type of minerals in the soil and watershedbedrock, and by how much the lake water comesinto contact with these minerals. If a lake getsgroundwater from aquifers containing limestoneminerals such as calcite (CaCO3) and dolomite(CaMgCO3), hardness and alkalinity (Table 8)will be high.High levels of hardness (greater than 150 mg/l)and alkalinity can cause marl (CaCO3) toprecipitate out of the water. Hard water lakes
tend to produce more fish and aquatic plantsthan soft water lakes. Such lakes are usuallylocated in watersheds with fertile soils that addphosphorus to the lake. As a balancingmechanism, however, phosphorus precipitateswith marl, thereby controlling algae blooms.If the soils are sandy and composed of quartz orother insoluble minerals, or if direct rainfall is amajor source of lake water, hardness andalkalinity will be low. This is the case in much ofnorthern Wisconsin, where glacial depositscontain little limestone or other soluble minerals.Lakes with low amounts of alkalinity are moresusceptible to acidification by acid rain and aregenerally unproductive.
Alkalinity—a lake's buffer againstacid rain Alkalinity acts to buffer lakes from the effects ofacid rain because bicarbonate (HCO3
–) andcarbonate (CO3
=) neutralize hydrogen ions fromthe acid inputs. Buffering occurs when excesshydrogen ions are removed from the watersolution as shown in Equation 5. As thehydrogen ions are removed, pH goes up or haltsits decline.Alkalinity results are reported in two differentways: as milligrams per liter (mg/l) ormicroequivalents per liter (µeq/l). Table 9 lists
13
EQUATION 5. HARDNESS AND ALKALINITY.
CaMg(CO3)2 <====> Ca++ + Mg++ + 2CO3=
limestone (hardness) (alkalinity)
TABLE 7. Solubility ofaluminum at various pHlevels.
pH Aluminum (mg/l4 4.85 .00486 .00000487 .00000000488 .0000000000048
TABLE 9. Sensitivity of lakes to acid rain. (Adapted from Taylor,1984.)
Sensitivity to Alkalinity Valuesacid rain ppm CaCO3 µeq/l CaCO3
High 0-2 0-39Moderate 2-10 40-199Low 10-25 200-499Nonsensitive >25 >500
TABLE 8. Categorization of hardness by mg/l of calciumcarbonate (CaCO3).
Level of hardness Total hardness as mg/l CaCO3
soft 0-60 mg/lmoderately hard 61-120 mg/lhard 121-180 mg/lvery hard >180 mg/l

alkalinity values by these two methods fordifferent degrees of acid rain susceptibility basedon 1 mg/l = 20 µeq/l. As can be seen in Equation 6, alkalinity is alsoconnected to the carbon dioxide reactionsdiscussed earlier.The amount of alkalinity largely determines alake water’s pH. Water with low alkalinity haslow pH value (high acid) and all of its alkalinityin the bicarbonate (HCO3
–) form. Highly alkalinelakes have pH values above 7 and somealkalinity in the carbonate form (CO3
=). Eachbicarbonate ion can neutralize one hydrogen (H+)ion. The carbonate form is a better buffer, since itneutralizes two hydrogen ions.
Marl deposits If the amount of carbonate (CO3
=) is high enough,it will react with calcium in the water to formCaCO3 (marl). Marl precipitates out, leaving awhite substance in the sediment—sometimeseven producing elaborate underwaterformations. Marl can often be observed as awhite precipitate on plant leaves in hard waterlakes. Plants speed up marl deposition by usingcarbon dioxide (CO2), which raises the pH andconverts most alkalinity to the carbonate (CO3
=)form. By precipitating phosphorus, marlformations help control algae growth in marllakes.
SUMMARYThe primary purpose of this publication is to helppeople understand the elements affecting lakewater quality. Another goal is to show thebenefits of keeping a long-term record of waterquality data. Such a record documents changesand helps to distinguish between a lake’s naturalvariability and the impacts of human activity. Lake water quality changes over time, sointerpreting data based on one or two samples isnot enough. Data collected during spring and falloverturn represent a lake’s most uniform waterquality conditions and are most valuable forcomparing year-to-year changes. More extensivesampling provides additional information. Along-term commitment to continue a modest samplingprogram is better than an extensive program whichcannot be sustained because of a lack of funds orvolunteers.
The Environmental Task Force Program at theUniversity of Wisconsin–Stevens Point provideslaboratory analysis and long-term data storage ofspring and fall turnover sample results.If you have comments about this publication,would like to receive a free quarterly newsletter(Lake Tides), or simply want more information,contact your local University ofWisconsin–Extension or DNR office, or theExtension lake management specialists at theCollege of Natural Resources, University ofWisconsin, Stevens Point WI 54481.
14
EQUATION 6. CARBONATE BUFFERING OF pH.
CO3= + H+ <====> HCO3
–
carbonate hydrogen bicarbonate
HCO3– + H <====> H2CO3 <===> H2O + CO2
bicarbonate bicarbonate water carbondioxide

BIBLIOGRAPHY ANDADDITIONAL REFERENCESBartsch, A.F. and J. Gakstatter. 1978.Management decisions for lake systems based on asurvey of trophic status, limiting nutrients, andnutrient loading. U.S. EPA Amer.-Sov. Symp. onuse of Math. Models to Optimize Water Qual.Manage., Washington D.C., U.S. EPA Rep. 600/9-78-024, pp. 372-96.Klessig, L. L., N. W. Bouwes and D. A. Yanggen.1986. The Lake in Your Community. UW-Extension, Madison. 24 pp.Lillie, R. A. and J. W. Mason. 1983. LimnologicalCharacteristics of Wisconsin Lakes. Wis. Dept. ofNatural Resources Tech. Bull. 138, Madison.Lundquist, J. B. 1975. A Primer on Limnology.Limnological Research Center, St. Paul, Univ. ofMinnesota. 28 pp.Moore, L. and K. Thornton, eds. 1988. Lake andReservoir Restoration Guidance Manual. U.S. EPA,Washington DC. Olszyk, D. 1980. Biological Effects of Acid Rain.Testimony, Wis. Public Service CommissionDocket No. 05-EP-2. 5 pp.Sawyer, C.N. 1947. Fertilization of lakes byagricultural and urban drainage. J. New Engl.Waterworks Assoc. 61(2):109-127.Shaw, B.H. and N. Nimphius. 1985. Acid Rain inWisconsin: Understanding Measurements in AcidRain Research (#2). UW-Extension, Madison. 4pp.Stumm, W. and J. J. Morgan. 1981. AquaticChemistry: An Introduction Emphasizing ChemicalEquilibria in Natural Waters. 2nd Ed. Wiley-Interscience. 780 pp.Taylor, J. W. ed. 1984. “The Acid Test.” NaturalResources Magazine. Wis. Dept. of NaturalResources. 40 pp.Wisconsin Dept. of Natural Resources AcidDeposition Task Force. 1980. A Review of AcidDeposition in Wisconsin: Recommendations forStudying and Solving the Problem. 46 pp.
GLOSSARYAlgae: One-celled (phytoplankton) ormulticellular plants either suspended in water(plankton) or attached to rocks and othersubstrates (periphyton). Their abundance, asmeasured by the amount of chlorophyll a (greenpigment) in an open water sample, is commonlyused to classify the trophic status of a lake.Numerous species occur. Algae are an essentialpart of the lake ecosystem and provides the foodbase for most lake organisms, including fish.Phytoplankton populations vary widely fromday to day, as life cycles are short.Alkalinity: A measure of the amount ofcarbonates, bicarbonates, and hydroxide presentin water. Low alkalinity is the main indicator ofsusceptibility to acid rain. Increasing alkalinity isoften related to increased algae productivity.Expressed as milligrams per liter (mg/l) ofcalcium carbonate (CaCO3), or asmicroequivalents per liter (µeq/l). 20 µeq/l = 1 mg/l of CaCO3. Ammonia: A form of nitrogen found in organicmaterials and many fertilizers. It is the first formof nitrogen released when organic matter decays.It can be used by most aquatic plants and istherefore an important nutrient. It convertsrapidly to nitrate (NO3
–) if oxygen is present.The conversion rate is related to watertemperature. Ammonia is toxic to fish atrelatively low concentrations in pH-neutral oralkaline water. Under acid conditions, non-toxicammonium ions (NH4
+) form, but at high pHvalues the toxic ammonium hydroxide (NH4OH)occurs. The water quality standard for fish andaquatic life is 0.02 mg/l of NH4OH. At a pH of 7and a temperature of 68oF (20oC), the ratio ofammonium ions to ammonium hydroxide is250:1; at pH 8, the ratio is 26:1.Anion: Refers to the chemical ions present thatcarry a negative charge in contrast to cations,which carry a positive charge. There must beequal amounts of positive and negative chargedions in any water sample. Following are thecommon anions in their order of decreasingconcentration for most lakes: bicarbonate(HCO3
–), sulfate (SO4=), chloride (Cl–), carbonate
(CO3=), nitrate (NO3
–), nitrite (NO2–), and
phosphates (H2PO4–, HPO4=, and PO4=).
Aquatic invertebrates: Aquatic animals withoutan internal skeletal structure such as insects,mollusks, and crayfish.Bioaccumulation: see “Food chain.”
15

Biomass: The total quantity of plants andanimals in a lake. Measured as organisms or drymatter per cubic meter, biomass indicates thedegree of a lake system’s eutrophication orproductivity. Blue-green algae: Algae that are often associatedwith problem blooms in lakes. Some producechemicals toxic to other organisms, includinghumans. They often form floating scum as theydie. Many can fix nitrogen (N2) from the air toprovide their own nutrient. Calcium (Ca++): The most abundant cationfound in Wisconsin lakes. Its abundance isrelated to the presence of calcium-bearingminerals in the lake watershed. Reported asmilligrams per liter (mg/l) as calcium carbonate(CaCO3), or milligrams per liter as calcium ion(Ca++). Cation: Refers to chemical ions present that carrya positive charge. The common cations present inlakes in normal order of decreasingconcentrations follow: calcium (Ca++),magnesium (Mg++), potassium (K+), sodium(Na+), ammonium (NH4+), ferric iron (Fe+++) orferrous iron (Fe++), manganese (Mn++), andhydrogen (H+).Chloride (Cl-): Chlorine in the chloride ion (Cl–)form has very different properties from chlorinegas (Cl2), which is used for disinfecting. Thechloride ion (Cl–) in lake water is commonlyconsidered an indicator of human activity.Agricultural chemicals, human and animalwastes, and road salt are the major sources ofchloride in lake water.Chlorophyll a: Green pigment present in allplant life and necessary for photosynthesis. Theamount present in lake water depends on theamount of algae and is therefore used as acommon indicator of water quality.Clarity: see “Secchi disc.”Color: Measured in color units that relate to astandard. A yellow-brown natural color isassociated with lakes or rivers receiving wetlanddrainage. The average color value for Wisconsinlakes is 39 units, with the color of state lakesranging from zero to 320 units. Color also affectslight penetration and therefore the depth atwhich plants can grow.Concentration units express the amount of achemical dissolved in water. The most commonways chemical data is expressed is in milligramsper liter (mg/l) and micrograms per liter (µg/l).One milligram per liter is equal to one part per
million (ppm). To convert micrograms per liter(µg/l) to milligrams per liter (mg/l), divide by1000 (e.g. 30 µg/l = 0.03 mg/l). To convertmilligrams per liter (mg/l) to micrograms perliter (µg/l), multiply by 1000 (e.g. 0.5 mg/l = 500µg/l). Microequivalents per liter (µeq/l) is alsosometimes used, especially for alkalinity; it iscalculated by dividing the weight of thecompound by 1000 and then dividing thatnumber into the milligrams per liter.Conductivity (specific conductance): Measureswater’s ability to conduct an electric current.Conductivity is reported in micromhos percentimeter (µmhos/cm) and is directly related tothe total dissolved inorganic chemicals in thewater. Values are commonly two times the waterhardness unless the water is receiving highconcentrations of contaminants introduced byhumans.Drainage basin: The total land area that drainstoward the lake.Drainage lakes: Lakes fed primarily by streamsand with outlets into streams or rivers. They aremore subject to surface runoff problems butgenerally have shorter residence times thanseepage lakes. Watershed protection is usuallyneeded to manage lake water quality.Dystrophic lake: A typically brownish-coloredlake high in dissolved organic substancesassociated with bog vegetation. Does not followeutrophication’s normal pattern because ofnatural acidity or other chemical imbalances.Epilimnion: see “Stratification.”Eutrophication: The process by which lakes areenriched with nutrients, increasing theproduction of rooted aquatic plants and algae.The extent to which this process has occurred isreflected in a lake’s trophic classification:oligotrophic (nutrient poor), mesotrophic(moderately productive), and eutrophic (veryproductive and fertile).Filamentous algae: Algae that forms filaments ormats attached to sediment, weeds, piers, etc. Flushing rate: see “Retention time.”Food chain: The sequence of algae being eatenby small aquatic animals (zooplankton) which inturn are eaten by small fish which are then eatenby larger fish and eventually by people orpredators. Certain chemicals, such as PCBs,mercury, and some pesticides, can beconcentrated from very low levels in the water totoxic levels in animals through this process.
16

Groundwater drainage lake: Often referred to asspring-fed lake; has large amounts ofgroundwater as its source, and a surface outlet.Areas of high groundwater inflow may be visibleas springs or sand boils. Groundwater drainagelakes often have intermediate retention timeswith water quality dependent on groundwaterquality.Hardness: The quantity of multivalent cations(cations with more than one +), primarily calcium(Ca++) and magnesium (Mg++) in the waterexpressed as milligrams per liter of CaCO3.Amount of hardness relates to the presence ofsoluble minerals, especially limestone, in the lakewatershed. Hypolimnion: see “Stratification.”Impoundment: Manmade lake or reservoirusually characterized by stream inflow andalways by a stream outlet. Because of nutrientand soil loss from upstream land use practices,impoundments ordinarily have higher nutrientconcentrations and faster sedimentation ratesthan natural lakes. Their retention times arerelatively short.Ion: A charged atom or group of atoms that hasseparated from an ion of the opposite charge. Inwater, some chemical molecules separate intocations (positive charge) and anions (negativecharge). Thus the number of cations equals thenumber of anions. Insoluble: incapable of dissolving in water.Kjeldahl nitrogen: The most common analysisrun to determine the amount of organic nitrogenin water. The test includes ammonium andorganic nitrogen.Limiting factor: The nutrient or condition inshortest supply relative to plant growthrequirements. Plants will grow until stopped bythis limitation; for example, phosphorus insummer, temperature or light in fall or winter.Macrophytes: see “Rooted aquatic plants.”Marl: White to gray accumulation on lakebottoms caused by precipitation of calciumcarbonate (CaCO3) in hard water lakes. Marlmay contain many snail and clam shells, whichare also calcium carbonate. While it graduallyfills in lakes, marl also precipitates phosphorus,resulting in low algae populations and goodwater clarity. In the past, marl was recoveredand used to lime agricultural fields.Metalimnion: see “Stratification.”
Nitrate (NO3-): An inorganic form of nitrogen
important for plant growth. Nitrogen is in thisstable form when oxygen is present. Nitrateoften contaminates groundwater when wateroriginates from manure pits, fertilized fields,lawns or septic systems. High levels of nitrate-nitrogen (over 10 mg/l) are dangerous to infantsand expectant mothers. A concentration ofnitrate-nitrogen (NO3
–N) plus ammonium-nitrogen (NH4
–N) of 0.3 mg/l in spring willsupport summer algae blooms if enoughphosphorus is present.Nitrite (NO2
-): A form of nitrogen that rapidlyconverts to nitrate (NO3
–) and is usually includedin the NO3
– analysis. Overturn: Fall cooling and spring warming ofsurface water increases density, and graduallymakes temperature and density uniform fromtop to bottom. This allows wind and wave actionto mix the entire lake. Mixing allows bottomwaters to contact the atmosphere, raising thewater’s oxygen content. However, warming mayoccur too rapidly in the spring for mixing to beeffective, especially in small sheltered kettlelakes.Phosphorus: Key nutrient influencing plantgrowth in more than 80% of Wisconsin lakes.Soluble reactive phosphorus is the amount ofphosphorus in solution that is available to plants.Total phosphorus includes the amount ofphosphorus in solution (reactive) and inparticulate form.Photosynthesis: Process by which green plantsconvert carbon dioxide (CO2) dissolved in waterto sugar and oxygen using sunlight for energy.Photosynthesis is essential in producing a lake’sfood base, and is an important source of oxygenfor many lakes. Phytoplankton: see “Algae.”Precipitate: A solid material which forms andsettles out of water as a result of certain negativeions (anions) combining with positive ions(cations).Retention time (turnover rate or flushing rate):The average length of time water resides in alake, ranging from several days in smallimpoundments to many years in large seepagelakes. Retention time is important indetermining the impact of nutrient inputs. Longretention times result in recycling and greaternutrient retention in most lakes. Calculateretention time by dividing the volume of waterpassing through the lake per year by the lakevolume.
17

Authors: Byron Shaw is a professor emeritus of soil and water science, University of Wisconsin–Stevens Point, and awater quality specialist with the University of Wisconsin–Extension, Cooperative Extension. Lowell Klessig is a professoremeritus of resource management at the University of Wisconsin–Stevens Point and a lake management specialist withthe University of Wisconsin–Extension, Cooperative Extension. Christine Mechenich was formerly an Extensiongroundwater education specialist with the Central Wisconsin Groundwater Center, University of Wisconsin–StevensPoint.Issued in furtherance of Cooperative Extension work, Acts of May 8 and June 30, 1914, in cooperation with the U.S.Department of Agriculture, University of Wisconsin–Extension, Cooperative Extension. University ofWisconsin–Extension provides equal opportunities in employment and programming, including Title IX and ADArequirements. If you need this information in an alternative format, contact the Office of Equal Opportunity and DiversityPrograms of call Extension Publishing at 608-262-2655.© 2004 by the Board of Regents of the University of Wisconsin System. Send inquiries about copyright permission to:Cooperative Extension Publishing Operations, 103 Extension Building, 432 N. Lake St., Madison, WI 53706.To see more publications or to order copies of this publication, visit our web site at http://cecommerce.uwex.edu or call toll-free: 877-WIS-PUBS (947-7827).
Understanding Lake Data (G3582) RP-03/2004
Respiration: The process by which aquaticorganisms convert organic material to energy. Itis the reverse reaction of photosynthesis.Respiration consumes oxygen (O2) and releasescarbon dioxide (CO2). It also takes place asorganic matter decays.Rooted aquatic plants (macrophytes): Refers tohigher (multi-celled) plants growing in or nearwater. Macrophytes are beneficial to lakesbecause they produce oxygen and providesubstrate for fish habitat and aquatic insects.Overabundance of such plants, especiallyproblem species, is related to shallow waterdepth and high nutrient levels.Secchi disc: An 8-inch diameter plate withalternating quadrants painted black and whitethat is used to measure water clarity (lightpenetration). The disc is lowered into water untilit disappears from view. It is then raised untiljust visible. An average of the two depths, takenfrom the shaded side of the boat, is recorded asthe Secchi disc reading. For best results, thereadings should be taken on sunny, calm days .Sedimentation: Accumulated organic andinorganic matter on the lake bottom. Sedimentincludes decaying algae and weeds, marl, andsoil and organic matter eroded from the lake’swatershed.Seepage lakes: Lakes without a significant inletor outlet, fed by rainfall and groundwater.Seepage lakes lose water through evaporationand groundwater moving on a down gradient.Lakes with little groundwater inflow tend to benaturally acidic and most susceptible to theeffects of acid rain. Seepage lakes often have longresidence times. and lake levels fluctuate withlocal groundwater levels. Water quality isaffected by groundwater quality and the use ofland on the shoreline.
Soluble: capable of being dissolved.Stratification: The layering of water due todifferences in density. Water’s greatest densityoccurs at 39oF (4oC). As water warms during thesummer, it remains near the surface while colderwater remains near the bottom. Wind mixingdetermines the thickness of the warm surfacewater layer (epilimnion), which usually extendsto a depth of about 20 feet. The narrow transitionzone between the epilimnion and cold bottomwater (hypolimnion) is called the metalimnion orthermocline. Sulfate (SO4
=): The most common form of sulfurin natural waters. The amounts relate primarilyto soil minerals in the watershed. Sulfate (SO4)can be reduced to sulfide (S=) and hydrogensulfide (H2S) under low or zero oxygenconditions. Hydrogen sulfide smells like rotteneggs and harms fish. Sulfate (SO4
=) input fromacid rain is a major indicator of sulfur dioxide(SO2) air pollution. Sulfate concentration is usedas a chemical fingerprint to distinguish acid lakesacidified by acid rain from those acidified byorganic acids from bogs.Suspended solids: A measure of the particulatematter in a water sample, expressed inmilligrams per liter. When measured oninflowing streams, it can be used to estimate thesedimentation rate of lakes or impoundments.Thermocline: see “Stratification.”Trophic state: see “Eutrophication.”Turnover: see “Overturn.”Watershed: see “Drainage basin.”Zooplankton: Microscopic or barely visibleanimals that eat algae. These suspendedplankton are an important component of the lakefood chain and ecosystem. For many fish, theyare the primary source of food.