Embed Size (px)
Citation preview
Understanding EmergencyDepartment Wait Times
A c c e s s t o I n p a t i e n t B e d s a n d P a t i e n t F l o w

The contents of this publication may be reproduced in whole or in part, provided
the intended use is for non-commercial purposes and full acknowledgement is
given to the Canadian Institute for Health Information.
Canadian Institute for Health Information
495 Richmond Road
Suite 600
Ottawa, Ontario
K2A 4H6
Phone: 613-241-7860
Fax: 613-241-8120
www.cihi.ca
ISBN 978-1-55465-158-0 (PDF)
© 2007 Canadian Institute for Health Information
How to cite this document:
Canadian Institute for Health Information, Understanding Emergency Department
Wait Times: Access to Inpatient Beds and Patient Flow (Ottawa: CIHI, 2007).
Cette publication est aussi disponible en français sous le titre Comprendre les
temps d�attente dans les services d�urgence : L�accès aux lits d�hospitalisation
et le roulement des patients.
ISBN 978-1-55465-159-7 (PDF)
Table of Contents
About the Canadian Institute for Health Information . . . . . . . . . . . . . . . .iii
Acknowledgements . . . . . . . . . . . . . . . . . . . . . . . . . . . . . . . . . . . . . . . . . .v
Highlights . . . . . . . . . . . . . . . . . . . . . . . . . . . . . . . . . . . . . . . . . . . . . . . . .vii
About This Report . . . . . . . . . . . . . . . . . . . . . . . . . . . . . . . . . . . . . . . . . . .ix
Data Source and Interpretive Cautions . . . . . . . . . . . . . . . . . . . . . . . . . .xi
Emergency Departments as Part of the Health Care System . . . . . . . . . .1Hospital Utilization and Patient Characteristics . . . . . . . . . . . . . . . . . . . . . . .3
Waiting for Inpatient Care in the ED . . . . . . . . . . . . . . . . . . . . . . . . . . . . .7Variation in Bed Wait Times . . . . . . . . . . . . . . . . . . . . . . . . . . . . . . . . . . . . . .8Who Waits Longest for an Inpatient Bed? . . . . . . . . . . . . . . . . . . . . . . . . . . .11
How Does Patient Volume Relate to Patient Flow From the ED? . . . . . .13Characteristics of Alternate Level of Care Patients . . . . . . . . . . . . . . . . . . . .14Variation in ALC Rates by Hospital Type . . . . . . . . . . . . . . . . . . . . . . . . . . . .16Bed Wait Time and Volume of Alternative Level of Care Patients . . . . . . . . .17
Conclusion . . . . . . . . . . . . . . . . . . . . . . . . . . . . . . . . . . . . . . . . . . . . . . . .19
For More Information . . . . . . . . . . . . . . . . . . . . . . . . . . . . . . . . . . . . . . . .23What We Know . . . . . . . . . . . . . . . . . . . . . . . . . . . . . . . . . . . . . . . . . . . . . . .23What We Don�t Know . . . . . . . . . . . . . . . . . . . . . . . . . . . . . . . . . . . . . . . . . .23What�s Happening . . . . . . . . . . . . . . . . . . . . . . . . . . . . . . . . . . . . . . . . . . . . .23
Appendix A: Technical Notes . . . . . . . . . . . . . . . . . . . . . . . . . . . . . . . . . .25Data Source . . . . . . . . . . . . . . . . . . . . . . . . . . . . . . . . . . . . . . . . . . . . . . . . . .25Bed Wait Time . . . . . . . . . . . . . . . . . . . . . . . . . . . . . . . . . . . . . . . . . . . . . . . .25Hospital Selection Criteria . . . . . . . . . . . . . . . . . . . . . . . . . . . . . . . . . . . . . . .29Patient Groups . . . . . . . . . . . . . . . . . . . . . . . . . . . . . . . . . . . . . . . . . . . . . . . .31Example Calculation of Derived Variables . . . . . . . . . . . . . . . . . . . . . . . . . .34
Appendix B: Charlson Index . . . . . . . . . . . . . . . . . . . . . . . . . . . . . . . . . .37
Appendix C: Patient Service Groups . . . . . . . . . . . . . . . . . . . . . . . . . . . .39
References . . . . . . . . . . . . . . . . . . . . . . . . . . . . . . . . . . . . . . . . . . . . . . . .41


About the Canadian Institute for Health InformationThe Canadian Institute for Health Information (CIHI) collects and analyzes information on health and health care in Canada and makes it publicly available.Canada�s federal, provincial and territorial governments created CIHI as a not-for-profit, independent organization dedicated to forging a common approach to Canadian health information. CIHI�s goal: to provide timely, accurate andcomparable information. CIHI�s data and reports inform health policies, supportthe effective delivery of health services and raise awareness among Canadiansof the factors that contribute to good health.
For more information, visit our website at www.cihi.ca.
As of July 2007, the following individuals are members of CIHI�s Board of Directors:
iiiCanadian Institute for Health Information
� Mr. Graham W. S. Scott, C.M., Q.C.(Chair), Senior Partner, McMillanBinch Mendelsohn LLP
� Ms. Glenda Yeates (ex officio),President and CEO, CIHI
� Dr. Peter Barrett, Physician andFaculty, University of SaskatchewanMedical School
� Ms. Roberta Ellis, Vice President,Prevention Division, Workers�Compensation Board of British Columbia
� Mr. Kevin Empey, Executive VicePresident, Clinical Support andCorporate Services, UniversityHealth Network
� Dr. Ivan Fellegi, Chief Statistician of Canada, Statistics Canada
� Ms. Nora Kelly, Deputy Minister,New Brunswick Ministry of Health
� Ms. Alice Kennedy, COO, LongTerm Care, Eastern Health,Newfoundland and Labrador
� Mr. David Levine, President andDirector General, Agence de lasanté et des services sociaux de Montréal
� Mr. Gordon Macatee, DeputyMinister, British Columbia Ministryof Health
� Dr. Cordell Neudorf (Interim Chair,CPHI Council), Chief Medical HealthOfficer and Vice-President,Research, Saskatoon Health Region
� Mr. Roger Paquet, Deputy Minister,ministère de la Santé et desServices sociaux
� Dr. Brian Postl, Vice-Chair of theBoard, CEO, Winnipeg RegionalHealth Authority
� Mr. Morris Rosenberg, DeputyMinister, Health Canada
� Mr. Ron Sapsford, Deputy Minister,Ministry of Health and Long-TermCare, Ontario


AcknowledgementsThe Canadian Institute for Health Information (CIHI) would like to acknowledgeand thank the many individuals who have contributed to the development of thereport. Particularly, we would like to express our appreciation to the members ofthe Advisory Committee, who provided invaluable advice:
vCanadian Institute for Health Information
� Dr. Brian H. RoweProfessor and Research DirectorCanada Research Chair inEmergency Airway Diseases,Department of EmergencyMedicine, University of AlbertaEdmonton, Alberta
� Dr. Michael SchullSenior Scientist, Institute for ClinicalEvaluative Sciences, Toronto, Ontario
� Ms. Bonnie AdamsonPresident and Chief ExecutiveOfficer, North York General Hospital,North York, Ontario
� Dr. Douglas SinclairChief, Emergency Medicine, IWKHealth Centre, Halifax, Nova Scotia
� Ms. Louise LeBlancPatient Care Director, EmergencyUrgent Care, The ScarboroughHospital, Scarborough, Ontario
� Mr. Greg WebsterDirector, Research and IndicatorDevelopment, Canadian Institute forHealth Information, Toronto, Ontario
It should be noted that the interpretations in this report do not necessarily reflect those of the individual members of the Advisory Committee or their affiliated organizations.
The editorial committee for the report included Heather Dawson, Sharon Gushue,Greg Webster and Jennifer Zelmer. The Technical Notes were prepared byAudrey Boruvka. Other staff who made contributions to the report includeDebbie Gibson, Sara Grimwood and Jaya Weerasooriya.

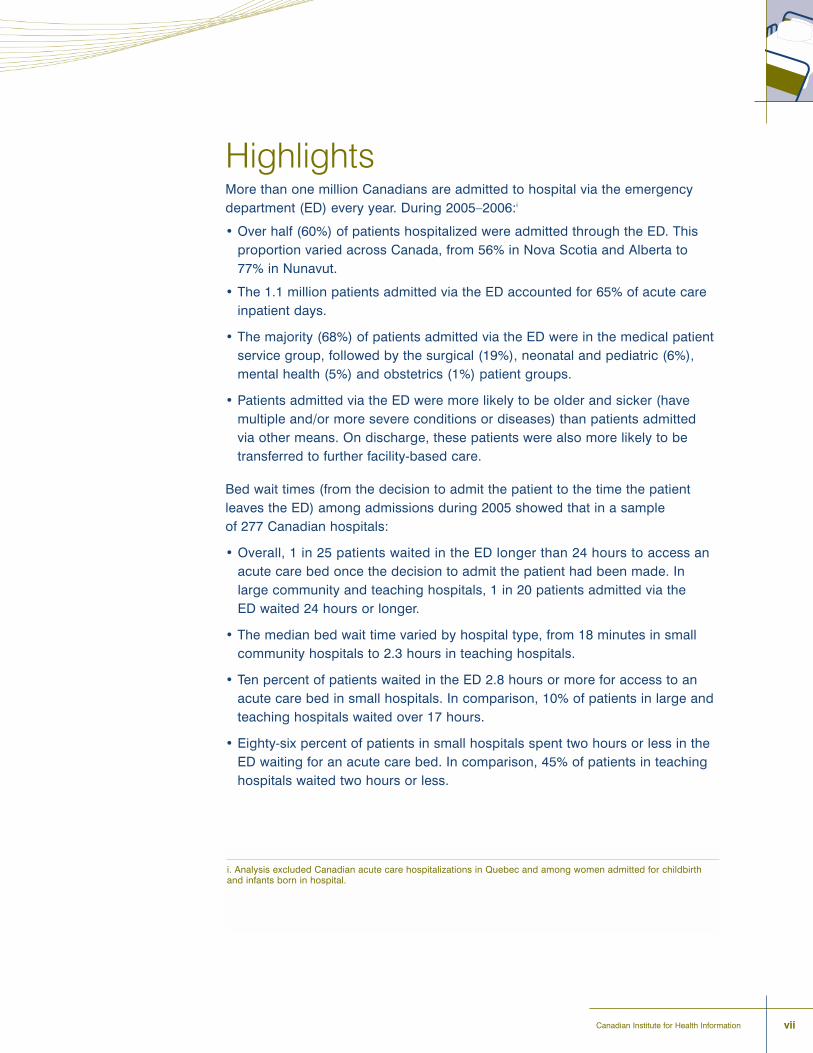
Highlights More than one million Canadians are admitted to hospital via the emergencydepartment (ED) every year. During 2005�2006:i
� Over half (60%) of patients hospitalized were admitted through the ED. Thisproportion varied across Canada, from 56% in Nova Scotia and Alberta to77% in Nunavut.
� The 1.1 million patients admitted via the ED accounted for 65% of acute careinpatient days.
� The majority (68%) of patients admitted via the ED were in the medical patientservice group, followed by the surgical (19%), neonatal and pediatric (6%),mental health (5%) and obstetrics (1%) patient groups.
� Patients admitted via the ED were more likely to be older and sicker (havemultiple and/or more severe conditions or diseases) than patients admitted via other means. On discharge, these patients were also more likely to betransferred to further facility-based care.
Bed wait times (from the decision to admit the patient to the time the patientleaves the ED) among admissions during 2005 showed that in a sample of 277 Canadian hospitals:
� Overall, 1 in 25 patients waited in the ED longer than 24 hours to access anacute care bed once the decision to admit the patient had been made. Inlarge community and teaching hospitals, 1 in 20 patients admitted via the ED waited 24 hours or longer.
� The median bed wait time varied by hospital type, from 18 minutes in smallcommunity hospitals to 2.3 hours in teaching hospitals.
� Ten percent of patients waited in the ED 2.8 hours or more for access to anacute care bed in small hospitals. In comparison, 10% of patients in large andteaching hospitals waited over 17 hours.
� Eighty-six percent of patients in small hospitals spent two hours or less in theED waiting for an acute care bed. In comparison, 45% of patients in teachinghospitals waited two hours or less.
viiCanadian Institute for Health Information
i. Analysis excluded Canadian acute care hospitalizations in Quebec and among women admitted for childbirth and infants born in hospital.

viii
Und
erst
andi
ng E
mer
genc
y D
epar
tmen
t Wai
t Tim
esA
cces
s to
Inpa
tient
Bed
s an
d P
atie
nt F
low
� Larger hospital size, older age, sicker patients and longer length of inpatientstay were associated with longer bed wait times.
� In large community and teaching hospitals, wait times tended to be shorter insome summer and winter months, on weekends and in the evening.
A number of factors may affect bed wait times and patient flow, such as thecapacity to discharge alternate level of care (ALC) patients. ALC patients areinpatients who no longer require acute care. During 2005, we found that in asample of 277 Canadian hospitals:
� Compared to large community and teaching hospitals, small and mediumhospitals were more likely to carry a larger proportion of ALC patients in theiracute care caseloads. Smaller hospitals also saw greater variation in the proportion of ALC patients day to day.
� For those patients who waited over 24 hours to access an acute care bed inlarge community hospitals at the time of decision to admit, the mediannumber of ALC patients at the time of decision to admit was 11. In teachinghospitals, the median number of ALC patients was 20.
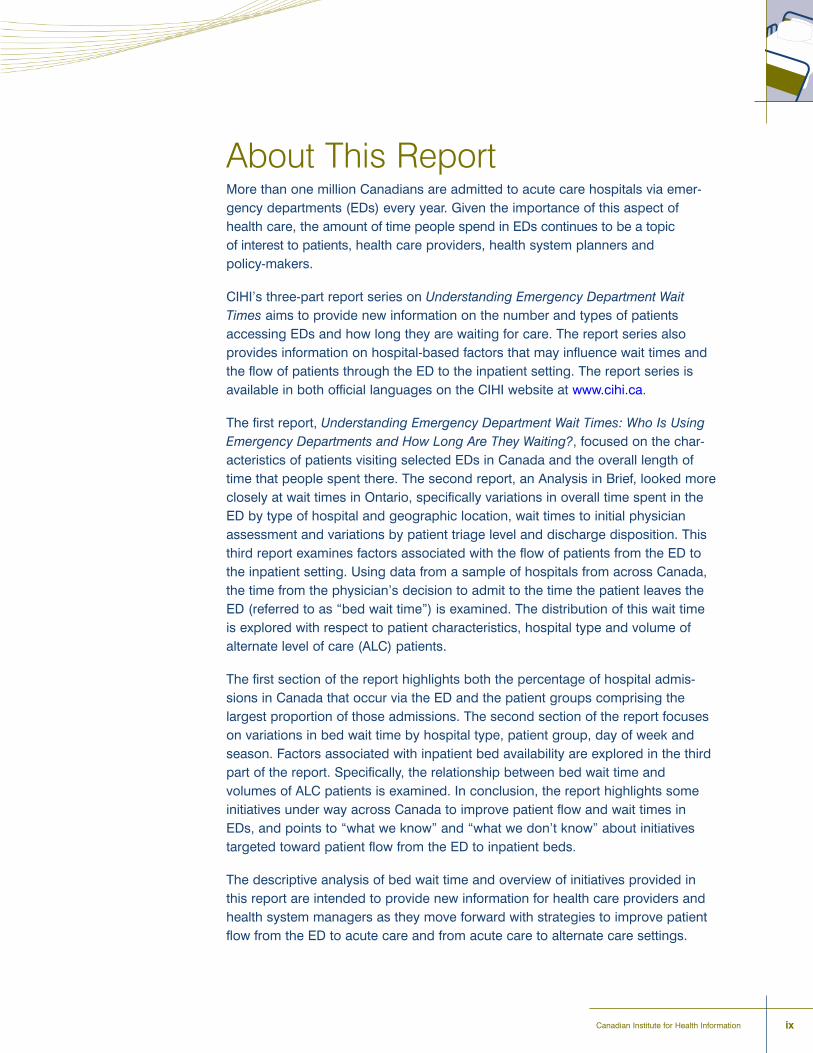
About This ReportMore than one million Canadians are admitted to acute care hospitals via emer-gency departments (EDs) every year. Given the importance of this aspect ofhealth care, the amount of time people spend in EDs continues to be a topic of interest to patients, health care providers, health system planners and policy-makers.
CIHI�s three-part report series on Understanding Emergency Department WaitTimes aims to provide new information on the number and types of patientsaccessing EDs and how long they are waiting for care. The report series also provides information on hospital-based factors that may influence wait times andthe flow of patients through the ED to the inpatient setting. The report series isavailable in both official languages on the CIHI website at www.cihi.ca.
The first report, Understanding Emergency Department Wait Times: Who Is UsingEmergency Departments and How Long Are They Waiting?, focused on the char-acteristics of patients visiting selected EDs in Canada and the overall length oftime that people spent there. The second report, an Analysis in Brief, looked moreclosely at wait times in Ontario, specifically variations in overall time spent in theED by type of hospital and geographic location, wait times to initial physicianassessment and variations by patient triage level and discharge disposition. Thisthird report examines factors associated with the flow of patients from the ED tothe inpatient setting. Using data from a sample of hospitals from across Canada,the time from the physician�s decision to admit to the time the patient leaves theED (referred to as �bed wait time�) is examined. The distribution of this wait timeis explored with respect to patient characteristics, hospital type and volume ofalternate level of care (ALC) patients.
The first section of the report highlights both the percentage of hospital admis-sions in Canada that occur via the ED and the patient groups comprising thelargest proportion of those admissions. The second section of the report focuses on variations in bed wait time by hospital type, patient group, day of week andseason. Factors associated with inpatient bed availability are explored in the thirdpart of the report. Specifically, the relationship between bed wait time andvolumes of ALC patients is examined. In conclusion, the report highlights someinitiatives under way across Canada to improve patient flow and wait times inEDs, and points to �what we know� and �what we don�t know� about initiativestargeted toward patient flow from the ED to inpatient beds.
The descriptive analysis of bed wait time and overview of initiatives provided inthis report are intended to provide new information for health care providers andhealth system managers as they move forward with strategies to improve patientflow from the ED to acute care and from acute care to alternate care settings.
ixCanadian Institute for Health Information


xiCanadian Institute for Health Information
Data Source and Interpretive CautionsThe data source for the analyses presented in this report is CIHI�s DischargeAbstract Database (DAD), which comprises demographic, administrative andclinical data for hospital discharges and day surgeries in Canada.
The objective of this report is to inform efforts to reduce ED wait times andimprove patient flow. That said, the following cautions should be consideredwhen interpreting the results:
1. While CIHI has introduced a number of procedures to check and improvedata quality, there have been no formal reabstraction studies directlyassessing the accuracy of decision-to-admit and ED-leaving date and timedata elements in the DAD. Our analysis includes a sample of acute carehospitals that met criteria based on both availability of the data elementsneeded to calculate bed wait times and the absence of suspected dataquality issues identifiable from the discharge abstracts received by CIHI.
2. Anecdotal information and patterns in coding that are identifiable in the data indicate variation across hospitals in the process used to assign timesto decision to admit and ED leaving, and accuracy in time measurement.
3. Bed wait time results aggregated by hospital type represent the �average�or �typical� scenario, but even within a given hospital type, the bed wait time distribution may vary substantially between individual hospitals.
4. Anecdotal information and patterns in coding that are identifiable in the dataindicate that there is under-reporting of alternate level of care (ALC)patients. The degree to which ALC patients are under-reported varies byprovince and territory.
Also note that Quebec hospitals do not participate in the DAD, and the Quebecdata submitted to CIHI do not contain the information required to identify acute care inpatients admitted from the ED or ALC patients. As a result, thefindings presented in this report do not include hospitalizations in Quebec.

xii
Und
erst
andi
ng E
mer
genc
y D
epar
tmen
t Wai
t Tim
esA
cces
s to
Inpa
tient
Bed
s an
d P
atie
nt F
low
The Fine Print
To put the results of this report into context, the following points are worth noting:
Data source. Results were obtained from acute care hospitalizations in the Discharge AbstractDatabase (DAD). With the exception of information on mode of admission, decision-to-admit timeand ED-leaving time, the DAD does not contain any additional data on emergency department(ED) visits prior to hospitalization. Our results, therefore, do not consider ED visit characteristicssuch as triage level or time spent in the ED prior to the decision to admit.
Bed wait time. The ED wait time examined in this report is the bed wait time, measured from thetime the physician or other authorized health professional decides to admit the patient to the timethe patient leaves the ED.
Alternate level of care (ALC). An ALC patient is a patient who has finished the acute phase ofhis or her treatment but remains in an acute care bed. The majority of patients who receive ALCare awaiting placement in some form of facility-based, follow-up care, such as long-term care,complex continuing care or physical rehabilitation.
Hospitalizations due to childbirth. Both women admitted for delivery and infants born in hospitalwere considered as having hospitalizations due to childbirth. The first section of this report compares hospital utilization between patients admitted via the ED and those admitted via othermeans. To limit the comparison primarily to patients admitted for health problems, results in thissection exclude hospitalizations due to childbirth.
Clinical Decision Units. Some hospitals have units adjacent to the ED referred to as observationor clinical decision units (CDUs). CDUs are designated for patients requiring further investigationand monitoring to inform a physician�s decision to admit or discharge from the ED. These unitsare a relatively new strategy being used by an increasing number of hospitals in an attempt toaddress ED overcrowding and extended ED wait times.1
The DAD is not always able to distinguish between CDUs and acute care wards, but patients whoreceive inpatient care exclusively through a CDU can be identified by comparing the date andtime elements available in DAD. CDUs are different from acute care wards, and for this reason weexcluded CDU-exclusive patients from the analysis of bed wait time. For further details on theidentification of these patients, refer to Appendix A.
Sample of 277 hospitals. Not all hospitals report the DAD data elements required to calculatebed wait time (decision-to-admit and ED-leaving dates and times). As a result, this report presents bed wait times for the calendar year 2005, based on a sample of 277 hospitals primarilyin provinces where submission of these data elements is mandatory (that is, Alberta, Manitoba,Ontario, Nova Scotia and Newfoundland and Labrador). This sample represents approximately58% of admissions via the ED to Canadian hospitals outside Quebec.
Appendix A provides a detailed breakdown of inclusion criteria and sample coverage of the 277-hospital data set by province and territory, plus additional information on data sources,methodology and interpretive limitations.

Every year, Canadians make over 14 million
visits to hospital emergency departments
(EDs)2 resulting in over one million admis-
sions to acute care hospitals via the ED.
Over the past five years, the proportion of hospitalizations viathe ED has remained fairly stable at around 60% of patients admit-
ted for a health-related problem. Hospitalization rates via the ED varyacross the country. In 2005�2006, the age-standardized hospitalization
rate via the ED ranged from 416 per 10,000 population in Ontario to 910 per10,000 population in the Northwest Territories.
EmergencyDepartments as Part of the HealthCare System
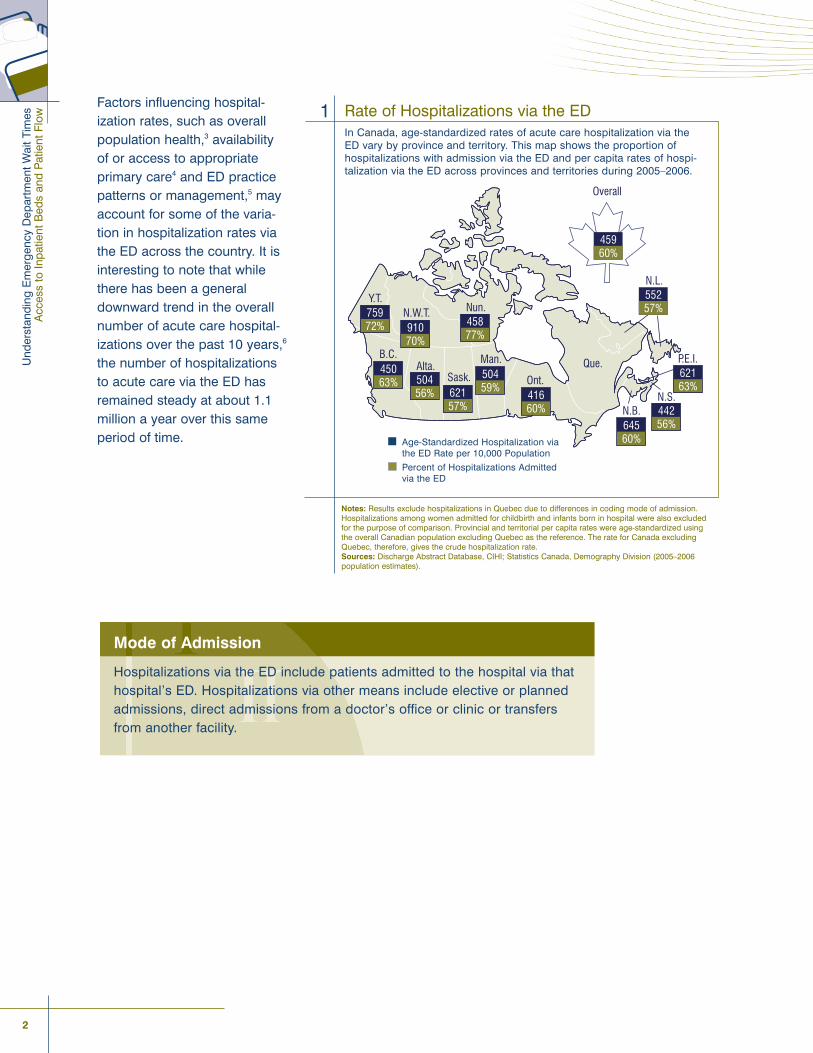
Factors influencing hospital-ization rates, such as overallpopulation health,3 availabilityof or access to appropriateprimary care4 and ED practicepatterns or management,5 mayaccount for some of the varia-tion in hospitalization rates viathe ED across the country. It isinteresting to note that whilethere has been a generaldownward trend in the overallnumber of acute care hospital-izations over the past 10 years,6
the number of hospitalizationsto acute care via the ED hasremained steady at about 1.1million a year over this sameperiod of time.
2
Und
erst
andi
ng E
mer
genc
y D
epar
tmen
t Wai
t Tim
esA
cces
s to
Inpa
tient
Bed
s an
d P
atie
nt F
low
B.C.Alta.
Sask.
Man.
Ont.
Que.
N.B.N.S.
P.E.I.
N.L.
Overall
N.W.T.Y.T.
Nun.
45960%
55257%
62163%
44256%645
60%
41660%
50459%621
57%
50456%
45063%
91070%
75972% 458
77%
Rate of Hospitalizations via the EDIn Canada, age-standardized rates of acute care hospitalization via theED vary by province and territory. This map shows the proportion ofhospitalizations with admission via the ED and per capita rates of hospi-talization via the ED across provinces and territories during 2005�2006.
1
Notes: Results exclude hospitalizations in Quebec due to differences in coding mode of admission.Hospitalizations among women admitted for childbirth and infants born in hospital were also excludedfor the purpose of comparison. Provincial and territorial per capita rates were age-standardized usingthe overall Canadian population excluding Quebec as the reference. The rate for Canada excludingQuebec, therefore, gives the crude hospitalization rate.Sources: Discharge Abstract Database, CIHI; Statistics Canada, Demography Division (2005�2006 population estimates).
Mode of Admission
Hospitalizations via the ED include patients admitted to the hospital via thathospital�s ED. Hospitalizations via other means include elective or plannedadmissions, direct admissions from a doctor�s office or clinic or transfersfrom another facility.
Age-Standardized Hospitalization viathe ED Rate per 10,000 Population
Percent of Hospitalizations Admittedvia the ED
Hospital Utilization and Patient CharacteristicsIn order to determine if patients admitted via the ED had different characteristicsthan patients admitted via other means, we examined these two groups ofpatients. For the purpose of comparison, hospitalizations were examined basedon mode of admission and were categorized into patient service groups primarilyaccording to the discipline of their main acute care service or health careprovider. An index of health problems during each hospitalization was alsomeasured using the Charlson Index.7, 8
We found that excluding hospitalizations due to childbirth, the majority (68%) of patients admitted via the ED were in the medical patient service group. In contrast, hospitalizations via other means were primarily in the surgical group(58%). Patients admitted via the ED tended to be older and sicker (have multipleand/or more severe conditions or diseases) than patients admitted via othermeans. On discharge, these patients were also more likely to be transferred to further facility-based care. E
mer
genc
y D
epar
tmen
ts a
s Pa
rt of
the
Hea
lth C
are
Sys
tem
3Canadian Institute for Health Information
Understanding Descriptive Statistics
The distribution of numeric variables, such as length of stay (LOS) and bed wait time, across asample can be summarized using a variety of descriptive statistics. Most statistics describe eitherthe centre or spread of the distribution.
Measures of centre quantify the �typical� value in the sample. One common measure of centre isthe average or mean. Although widely used, the mean can be influenced by a relatively smallnumber of very large or small observations.
The median is an alternative measure of centre that is not as sensitive to large outliers. It is calcu-lated by ordering the observed values from lowest to highest and selecting the middle value. Thisvalue corresponds to the 50th percentile of the distribution. Other percentiles are calculated in asimilar manner. For example, the 25th percentile corresponds to the value below which you willfind 25% of the ordered observations. Since we found that the distributions of LOS and bed waittime were skewed (that is, some patients had extremely long LOS or bed wait time relative to others),we used percentiles to summarize these variables.
Measures of spread quantify the amount of variation in the sample. With respect to the median, a common measure of spread is the interquartile range (IQR), equal to the interval between the25th and 75th percentiles of the distribution.
4
Und
erst
andi
ng E
mer
genc
y D
epar
tmen
t Wai
t Tim
esA
cces
s to
Inpa
tient
Bed
s an
d P
atie
nt F
low
Understanding the Charlson Index
The Charlson Index is a weighted index of health problems that takes intoaccount the number and seriousness of specific diseases.8 Charlson Indexscores are assigned so that the number and severity of diseases are greaterin patients with higher scores. To summarize scores across a group ofpatients, we translated the scores into a four-point ordinal scale, ranging fromscores equal to zero (no presence of disease) to scores of three or more.9 Inour analysis, 44% of patients admitted via the ED had a Charlson Index scoreof one or more, compared to 21% of patients admitted via other means.Further details on the Charlson Index can be found in Appendix B.
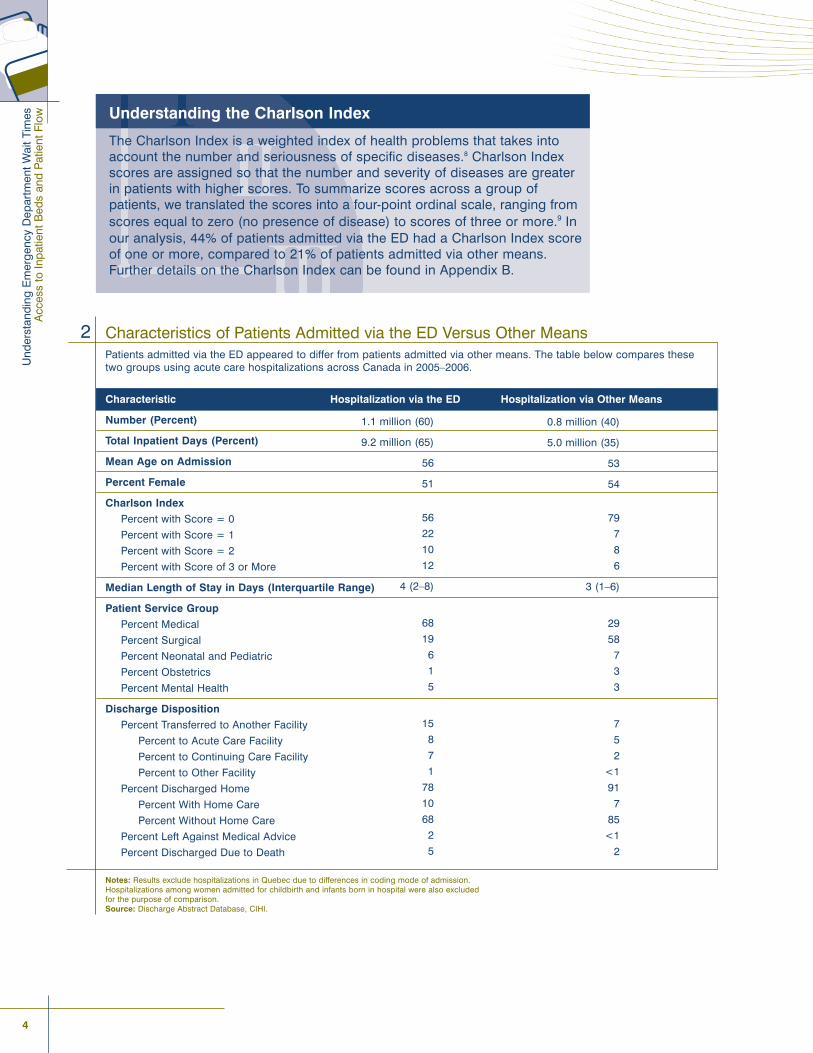
Characteristics of Patients Admitted via the ED Versus Other MeansPatients admitted via the ED appeared to differ from patients admitted via other means. The table below compares thesetwo groups using acute care hospitalizations across Canada in 2005�2006.
Characteristic Hospitalization via the ED Hospitalization via Other Means
Number (Percent)
Total Inpatient Days (Percent)
Mean Age on Admission
Percent Female
Charlson Index
Percent with Score = 0
Percent with Score = 1
Percent with Score = 2
Percent with Score of 3 or More
Median Length of Stay in Days (Interquartile Range)
Patient Service Group
Percent Medical
Percent Surgical
Percent Neonatal and Pediatric
Percent Obstetrics
Percent Mental Health
Discharge Disposition
Percent Transferred to Another Facility
Percent to Acute Care Facility
Percent to Continuing Care Facility
Percent to Other Facility
Percent Discharged Home
Percent With Home Care
Percent Without Home Care
Percent Left Against Medical Advice
Percent Discharged Due to Death
Notes: Results exclude hospitalizations in Quebec due to differences in coding mode of admission. Hospitalizations among women admitted for childbirth and infants born in hospital were also excluded for the purpose of comparison.Source: Discharge Abstract Database, CIHI.
2
1.1 million (60)
9.2 million (65)
56
51
56
22
10
12
4 (2�8)
68
19
6
1
5
15
8
7
1
78
10
68
2
5
0.8 million (40)
5.0 million (35)
53
54
79
7
8
6
3 (1�6)
29
58
7
3
3
7
5
2
<1
91
7
85
<1
2
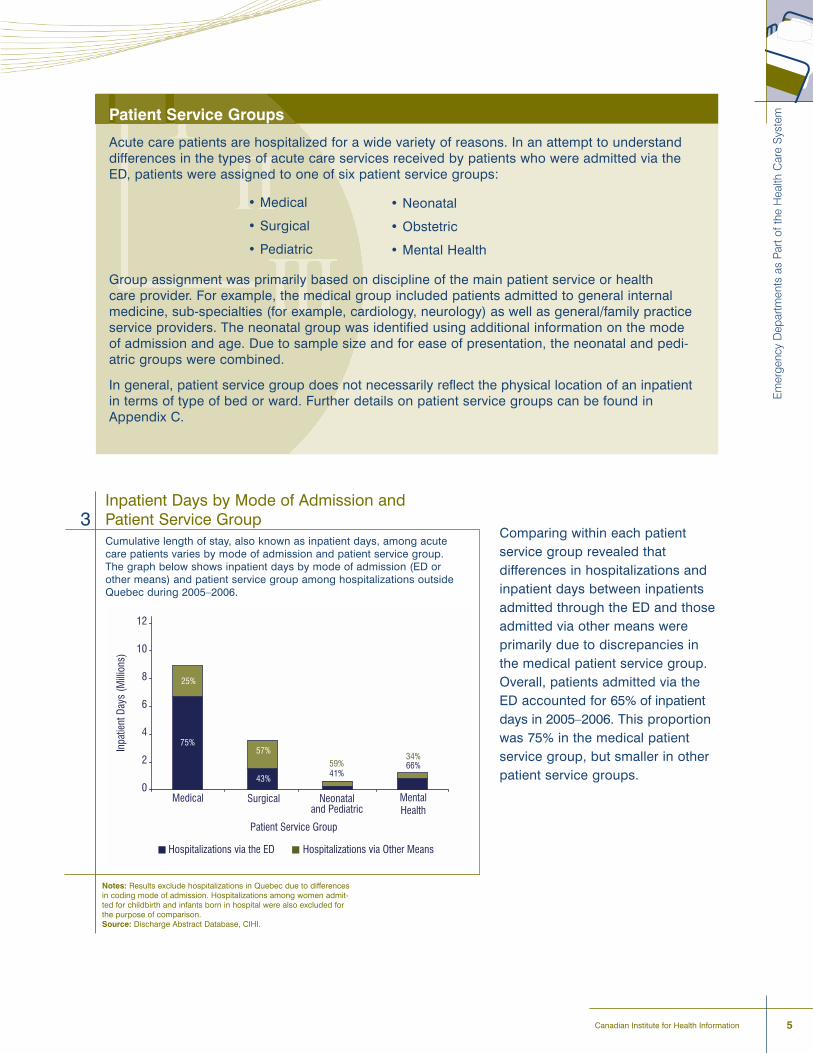
Comparing within each patientservice group revealed that differences in hospitalizations andinpatient days between inpatientsadmitted through the ED and thoseadmitted via other means were primarily due to discrepancies inthe medical patient service group.Overall, patients admitted via theED accounted for 65% of inpatientdays in 2005�2006. This proportionwas 75% in the medical patientservice group, but smaller in otherpatient service groups.
Em
erge
ncy
Dep
artm
ents
as
Part
of th
e H
ealth
Car
e S
yste
m
5Canadian Institute for Health Information
Patient Service Groups
Acute care patients are hospitalized for a wide variety of reasons. In an attempt to understanddifferences in the types of acute care services received by patients who were admitted via theED, patients were assigned to one of six patient service groups:
� Medical
� Surgical
� Pediatric
Group assignment was primarily based on discipline of the main patient service or health care provider. For example, the medical group included patients admitted to general internalmedicine, sub-specialties (for example, cardiology, neurology) as well as general/family practiceservice providers. The neonatal group was identified using additional information on the modeof admission and age. Due to sample size and for ease of presentation, the neonatal and pedi-atric groups were combined.
In general, patient service group does not necessarily reflect the physical location of an inpatientin terms of type of bed or ward. Further details on patient service groups can be found inAppendix C.
� Neonatal
� Obstetric
� Mental Health
Inpatient Days by Mode of Admission andPatient Service GroupCumulative length of stay, also known as inpatient days, among acutecare patients varies by mode of admission and patient service group.The graph below shows inpatient days by mode of admission (ED orother means) and patient service group among hospitalizations outsideQuebec during 2005�2006.
3
Notes: Results exclude hospitalizations in Quebec due to differencesin coding mode of admission. Hospitalizations among women admit-ted for childbirth and infants born in hospital were also excluded forthe purpose of comparison.Source: Discharge Abstract Database, CIHI.
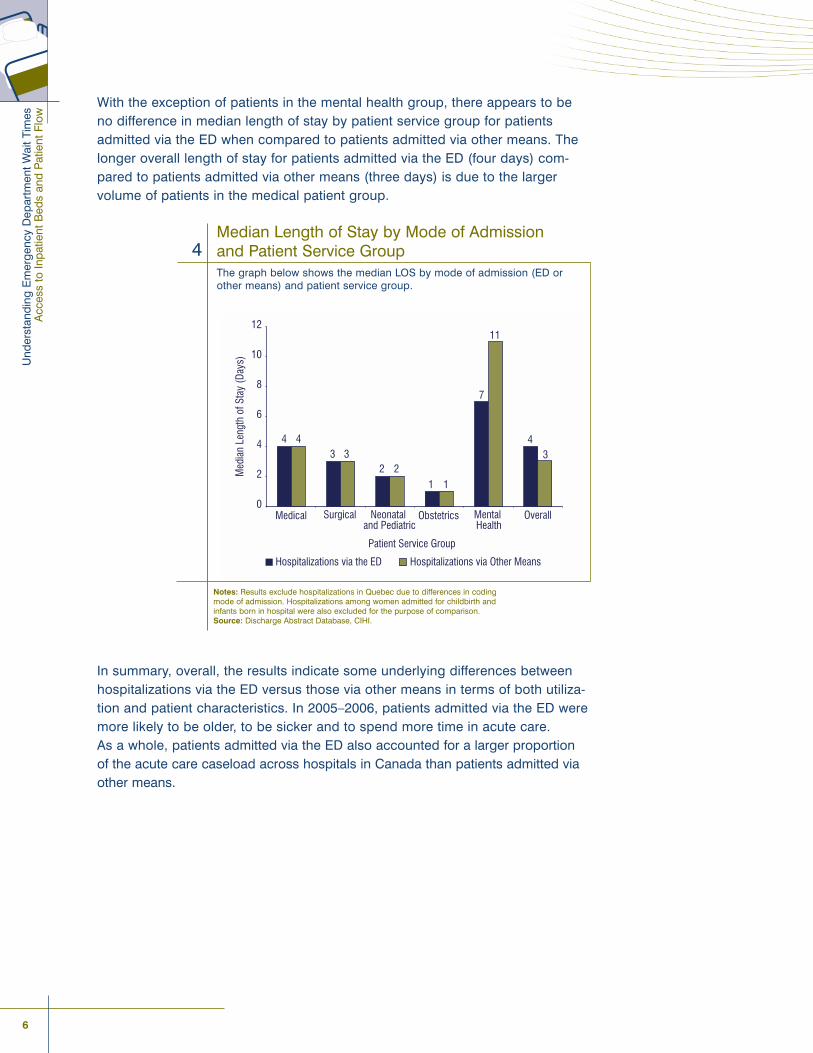
With the exception of patients in the mental health group, there appears to beno difference in median length of stay by patient service group for patientsadmitted via the ED when compared to patients admitted via other means. Thelonger overall length of stay for patients admitted via the ED (four days) com-pared to patients admitted via other means (three days) is due to the largervolume of patients in the medical patient group.
In summary, overall, the results indicate some underlying differences betweenhospitalizations via the ED versus those via other means in terms of both utiliza-tion and patient characteristics. In 2005�2006, patients admitted via the ED weremore likely to be older, to be sicker and to spend more time in acute care. As a whole, patients admitted via the ED also accounted for a larger proportionof the acute care caseload across hospitals in Canada than patients admitted viaother means.
6
Und
erst
andi
ng E
mer
genc
y D
epar
tmen
t Wai
t Tim
esA
cces
s to
Inpa
tient
Bed
s an
d P
atie
nt F
low
Median Length of Stay by Mode of Admissionand Patient Service GroupThe graph below shows the median LOS by mode of admission (ED orother means) and patient service group.
4
Notes: Results exclude hospitalizations in Quebec due to differences in codingmode of admission. Hospitalizations among women admitted for childbirth andinfants born in hospital were also excluded for the purpose of comparison.Source: Discharge Abstract Database, CIHI.

How quickly patients are admitted from
the ED to an inpatient bed is complex
and affected by many factors both within and
outside of the ED.10, 11
It is important to understand the extent to which patients arewaiting for beds in EDs in Canada�s hospitals, because waiting
for care can result in delays to treatment for individual patients andreduced efficiency in the flow of patients that require admission from the
ED onto an inpatient ward.
There is some evidence to indicate that a relationship between patient flowthrough the ED and delays in care exists. For example, delays in some door-to-treatment times have been found in recent studies to be associated with EDovercrowding or longer ED wait times.12, 13
Additionally, some experts suggest that optimized flow could potentially trans-late into better quality of care.14 For example, Canadian ED directors surveyed in2005 identified ED overcrowding to be a major or severe problem and felt thatsuch delays led to poor quality of care.15 And a 2003 survey of hospital execu-tives indicated that waiting times in EDs due to delays in discharge because oflimited availability of post-hospital care and diversion of patients to other facili-ties because of a lack of capacity was an area of much concern, particularly inCanada, the U.S. and the UK.16
In this section of the report, we provide analysis of data related to ED wait timesthat is intended to assist hospitals to achieve success in strategies to reducebed wait times and enhance patient flow. Variation in bed wait times by hospitaltype, patient group, day of the week, time of day and season is explored.
Waiting for InpatientCare in the ED
8
Und
erst
andi
ng E
mer
genc
y D
epar
tmen
t Wai
t Tim
esA
cces
s to
Inpa
tient
Bed
s an
d P
atie
nt F
low
Variation in Bed Wait TimesEarlier reports in CIHI�s Understanding Emergency Wait Times series found variation in the time to initial physician assessment and in how long, in total,patients spend in the ED by hospital type, day of week, time of day and season.The same is true for bed wait times. Variation in ED wait times reflects a combi-nation of factors, including hospital operational patterns and changes in thedemand for hospital services.17�19
Hospital Type
In order to examine variations among different kinds of hospitals, the 277 hospitals meeting selection criteriafor valid bed wait time data have been grouped intofour categories based on CIHI�s Comparison of HospitalActivity Program (CHAP) peer groups.
Small community hospitals include 155 hospitals withup to 49 acute care beds.
Medium community hospitals include 64 hospitals with50 to 199 acute care beds.
Large community hospitals include 34 hospitals with200 or more acute care beds.
Teaching hospitals include 24 hospitals. The two pedi-atric hospitals in the sample are contained in this group.
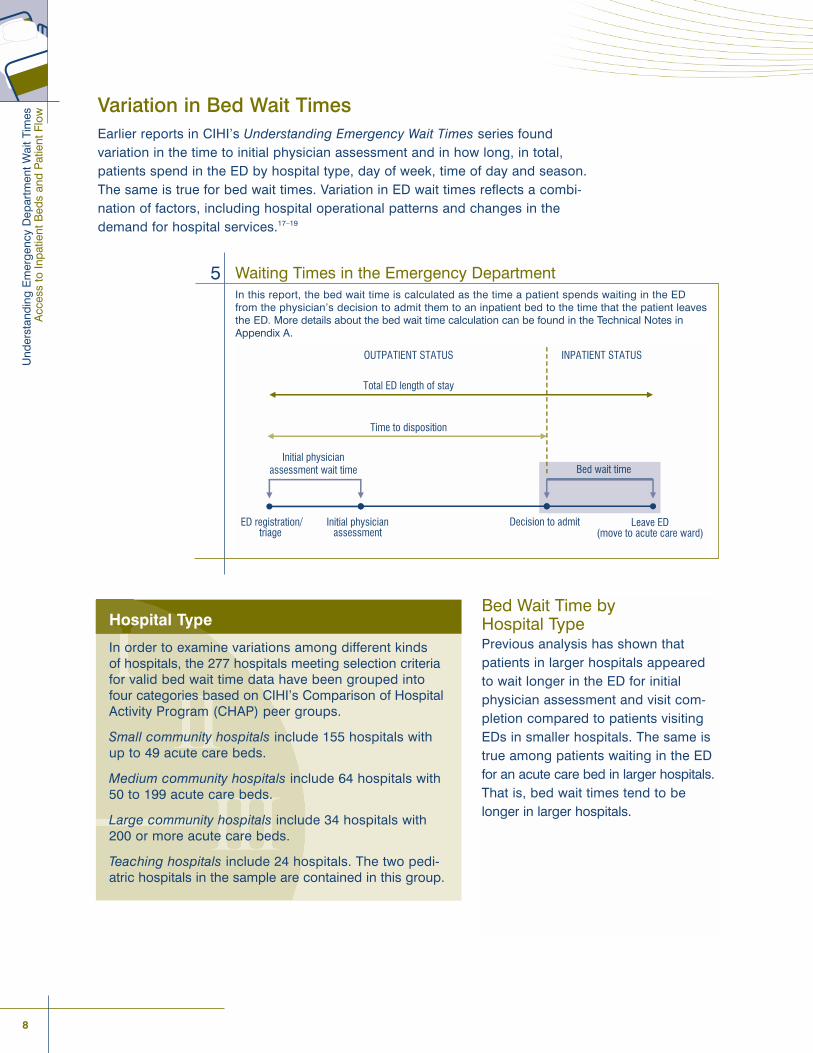
Waiting Times in the Emergency DepartmentIn this report, the bed wait time is calculated as the time a patient spends waiting in the ED from the physician�s decision to admit them to an inpatient bed to the time that the patient leavesthe ED. More details about the bed wait time calculation can be found in the Technical Notes inAppendix A.
5
ED registration/triage
Initial physician assessment
Decision to admit Leave ED (move to acute care ward)
Initial physician assessment wait time Bed wait time
Total ED length of stay
Time to disposition
OUTPATIENT STATUS INPATIENT STATUS
Bed Wait Time by Hospital TypePrevious analysis has shown thatpatients in larger hospitals appearedto wait longer in the ED for initialphysician assessment and visit com-pletion compared to patients visitingEDs in smaller hospitals. The same istrue among patients waiting in the EDfor an acute care bed in larger hospitals.That is, bed wait times tend to belonger in larger hospitals.
Wai
ting
for
Inp
atie
nt C
are
in t
he E
D
9
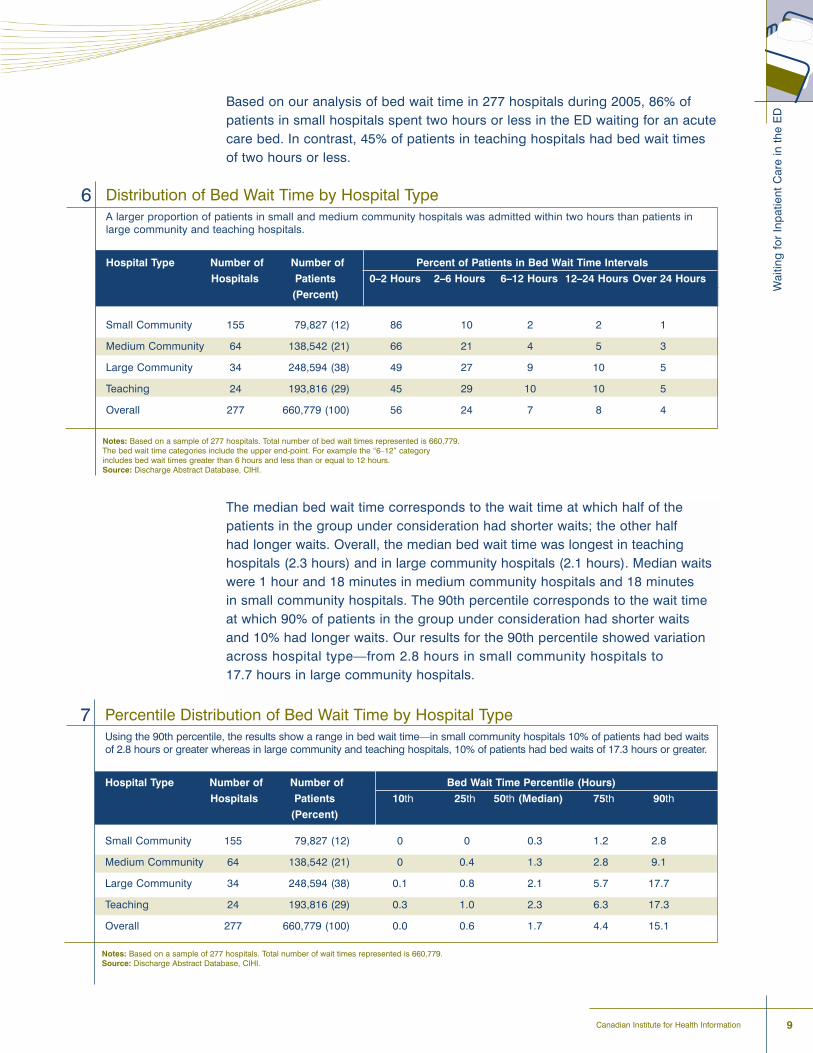
Distribution of Bed Wait Time by Hospital TypeA larger proportion of patients in small and medium community hospitals was admitted within two hours than patients inlarge community and teaching hospitals.
Hospital Type Number of Number of Percent of Patients in Bed Wait Time Intervals
Hospitals Patients 0�2 Hours 2�6 Hours 6�12 Hours 12�24 Hours Over 24 Hours
(Percent)
Small Community 155 79,827 (12) 86 10 2 2 1
Medium Community 64 138,542 (21) 66 21 4 5 3
Large Community 34 248,594 (38) 49 27 9 10 5
Teaching 24 193,816 (29) 45 29 10 10 5
Overall 277 660,779 (100) 56 24 7 8 4
6
Notes: Based on a sample of 277 hospitals. Total number of bed wait times represented is 660,779.The bed wait time categories include the upper end-point. For example the �6�12� categoryincludes bed wait times greater than 6 hours and less than or equal to 12 hours.Source: Discharge Abstract Database, CIHI.
Based on our analysis of bed wait time in 277 hospitals during 2005, 86% ofpatients in small hospitals spent two hours or less in the ED waiting for an acutecare bed. In contrast, 45% of patients in teaching hospitals had bed wait timesof two hours or less.
The median bed wait time corresponds to the wait time at which half of thepatients in the group under consideration had shorter waits; the other half had longer waits. Overall, the median bed wait time was longest in teaching hospitals (2.3 hours) and in large community hospitals (2.1 hours). Median waitswere 1 hour and 18 minutes in medium community hospitals and 18 minutes in small community hospitals. The 90th percentile corresponds to the wait timeat which 90% of patients in the group under consideration had shorter waits and 10% had longer waits. Our results for the 90th percentile showed variationacross hospital type�from 2.8 hours in small community hospitals to 17.7 hours in large community hospitals.
Percentile Distribution of Bed Wait Time by Hospital TypeUsing the 90th percentile, the results show a range in bed wait time�in small community hospitals 10% of patients had bed waitsof 2.8 hours or greater whereas in large community and teaching hospitals, 10% of patients had bed waits of 17.3 hours or greater.
Hospital Type Number of Number of Bed Wait Time Percentile (Hours)
Hospitals Patients 10th 25th 50th (Median) 75th 90th
(Percent)
Small Community 155 79,827 (12) 0 0 0.3 1.2 2.8
Medium Community 64 138,542 (21) 0 0.4 1.3 2.8 9.1
Large Community 34 248,594 (38) 0.1 0.8 2.1 5.7 17.7
Teaching 24 193,816 (29) 0.3 1.0 2.3 6.3 17.3
Overall 277 660,779 (100) 0.0 0.6 1.7 4.4 15.1
7
Notes: Based on a sample of 277 hospitals. Total number of wait times represented is 660,779.Source: Discharge Abstract Database, CIHI.
Canadian Institute for Health Information

10
Und
erst
andi
ng E
mer
genc
y D
epar
tmen
t Wai
t Tim
esA
cces
s to
Inpa
tient
Bed
s an
d P
atie
nt F
low
Bed Wait Time by Time of Day and Day of WeekStudies have shown that ED wait times and patient volume also fluctuatethroughout the week.20�24 This research suggests that these patterns may reflecta combination of:
� Hospital operational patterns, such as emergency and elective admissionspeaking on certain days of the week;
� Fewer discharges on weekends resulting in a potential backlog of patients inthe ED, particularly on Mondays; and
� ED patient volume patterns.
Similarly, in our analysis using the sample of 277 hospitals, bed wait timesduring 2005 tended to be shorter on weekends in larger hospitals. For example,in teaching hospitals the median wait times with decision to admit occurringSaturday and Sunday were 2.0 and 2.1 hours, respectively. At mid-week, themedian was 2.5 hours.
When considering staffing and bed management strategies to improve patientflow from the ED to inpatient wards, it is important to understand the day-to-dayfluctuations in ED volumes and resulting admissions.
Median Bed Wait Time by Hospital Type and Day of WeekIn a sample of large community and teaching hospitals across Canada,the median bed wait time during 2005 tended to be shorter on week-ends than weekdays. There was little difference (a range between 14 and15 minutes) in the median bed wait time by day of week for small hospitals.
Notes: Based on a sample of 277 hospitals. Total number of wait times representedis 660,779.Source: Discharge Abstract Database, CIHI.
0
30
60
90
120
150
180
Monday Tuesday Wednesday Thursday Friday Saturday Sunday
Day of Week
Med
ian
Bed
Wai
t Tim
e (M
inut
es)
Small CommunityMedium CommunityLarge CommunityTeaching
Depending on the Shift
Median bed waits also varydepending on the time of dayat which the decision to admitis made, particularly for largerhospitals. Median bed waitswere longest during the day,at 1.4 hours, 2.4 hours and2.8 hours for medium com-munity, large community andteaching hospitals, respec-tively. They tended to beshortest in the evening (4 p.m.to 11:59 p.m.) for large com-munity and teaching hospitals,potentially reflecting hospitaldischarge patterns in whichpatients are often dischargedthroughout the late afternoon.
8
Wai
ting
for
Inp
atie
nt C
are
in t
he E
D
11Canadian Institute for Health Information
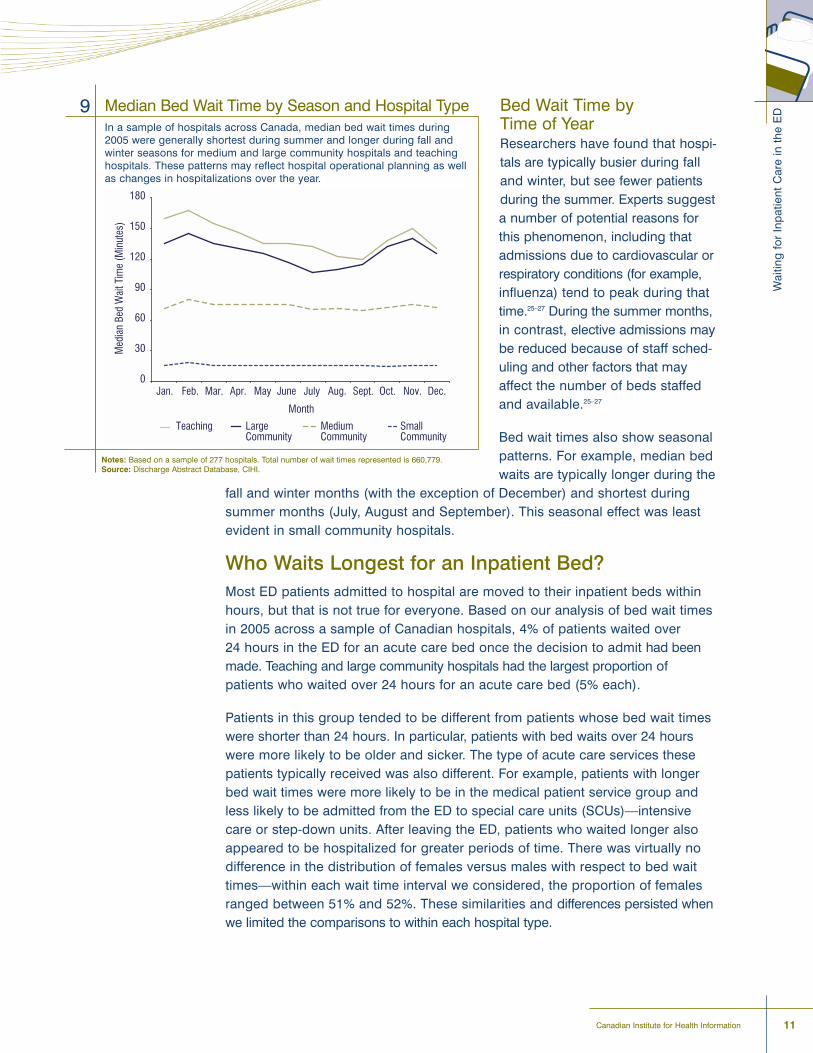
Bed Wait Time by Time of YearResearchers have found that hospi-tals are typically busier during falland winter, but see fewer patientsduring the summer. Experts suggesta number of potential reasons forthis phenomenon, including thatadmissions due to cardiovascular orrespiratory conditions (for example,influenza) tend to peak during thattime.25�27 During the summer months,in contrast, elective admissions maybe reduced because of staff sched-uling and other factors that mayaffect the number of beds staffedand available.25�27
Bed wait times also show seasonalpatterns. For example, median bedwaits are typically longer during the
fall and winter months (with the exception of December) and shortest duringsummer months (July, August and September). This seasonal effect was leastevident in small community hospitals.
Who Waits Longest for an Inpatient Bed?Most ED patients admitted to hospital are moved to their inpatient beds withinhours, but that is not true for everyone. Based on our analysis of bed wait timesin 2005 across a sample of Canadian hospitals, 4% of patients waited over 24 hours in the ED for an acute care bed once the decision to admit had beenmade. Teaching and large community hospitals had the largest proportion ofpatients who waited over 24 hours for an acute care bed (5% each).
Patients in this group tended to be different from patients whose bed wait timeswere shorter than 24 hours. In particular, patients with bed waits over 24 hourswere more likely to be older and sicker. The type of acute care services thesepatients typically received was also different. For example, patients with longerbed wait times were more likely to be in the medical patient service group andless likely to be admitted from the ED to special care units (SCUs)�intensivecare or step-down units. After leaving the ED, patients who waited longer alsoappeared to be hospitalized for greater periods of time. There was virtually nodifference in the distribution of females versus males with respect to bed waittimes�within each wait time interval we considered, the proportion of femalesranged between 51% and 52%. These similarities and differences persisted whenwe limited the comparisons to within each hospital type.
Median Bed Wait Time by Season and Hospital TypeIn a sample of hospitals across Canada, median bed wait times during2005 were generally shortest during summer and longer during fall andwinter seasons for medium and large community hospitals and teachinghospitals. These patterns may reflect hospital operational planning as wellas changes in hospitalizations over the year.
9
Notes: Based on a sample of 277 hospitals. Total number of wait times represented is 660,779.Source: Discharge Abstract Database, CIHI.
12
Und
erst
andi
ng E
mer
genc
y D
epar
tmen
t Wai
t Tim
esA
cces
s to
Inpa
tient
Bed
s an
d P
atie
nt F
low
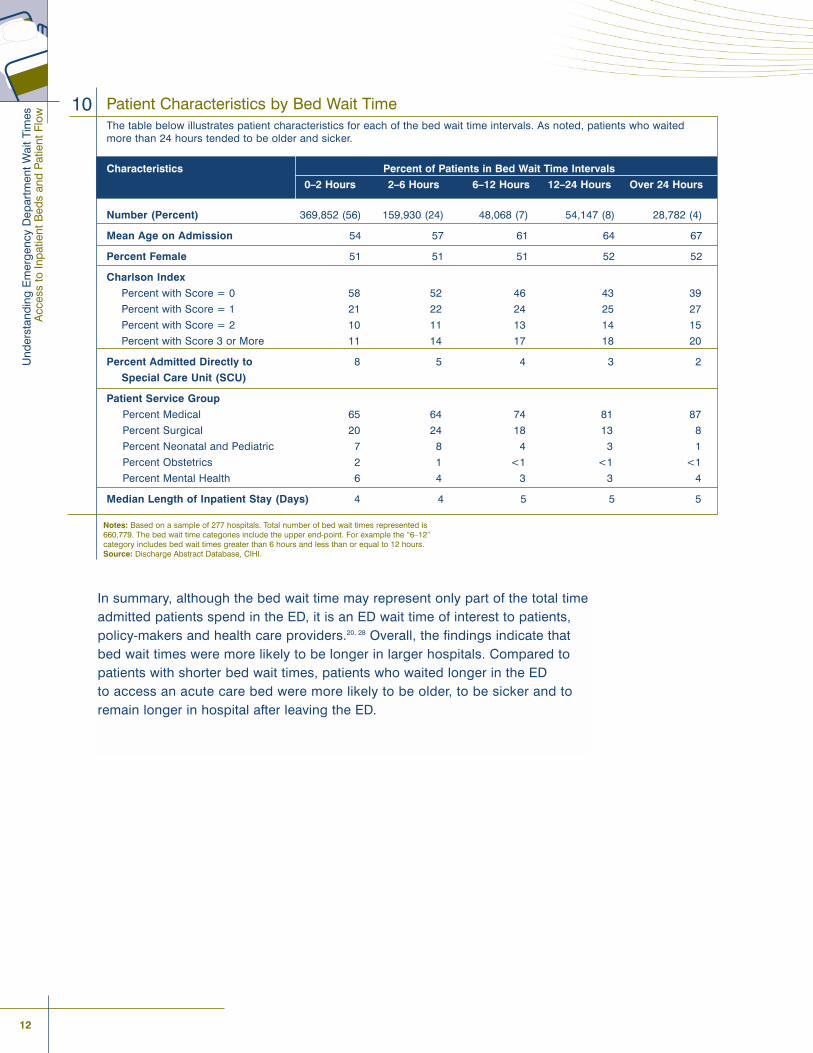
Patient Characteristics by Bed Wait TimeThe table below illustrates patient characteristics for each of the bed wait time intervals. As noted, patients who waitedmore than 24 hours tended to be older and sicker.
Characteristics Percent of Patients in Bed Wait Time Intervals
0�2 Hours 2�6 Hours 6�12 Hours 12�24 Hours Over 24 Hours
Number (Percent) 369,852 (56) 159,930 (24) 48,068 (7) 54,147 (8) 28,782 (4)
Mean Age on Admission 54 57 61 64 67
Percent Female 51 51 51 52 52
Charlson Index
Percent with Score = 0 58 52 46 43 39
Percent with Score = 1 21 22 24 25 27
Percent with Score = 2 10 11 13 14 15
Percent with Score 3 or More 11 14 17 18 20
Percent Admitted Directly to 8 5 4 3 2
Special Care Unit (SCU)
Patient Service Group
Percent Medical 65 64 74 81 87
Percent Surgical 20 24 18 13 8
Percent Neonatal and Pediatric 7 8 4 3 1
Percent Obstetrics 2 1 <1 <1 <1
Percent Mental Health 6 4 3 3 4
Median Length of Inpatient Stay (Days) 4 4 5 5 5
10
Notes: Based on a sample of 277 hospitals. Total number of bed wait times represented is660,779. The bed wait time categories include the upper end-point. For example the �6�12� category includes bed wait times greater than 6 hours and less than or equal to 12 hours.Source: Discharge Abstract Database, CIHI.
In summary, although the bed wait time may represent only part of the total timeadmitted patients spend in the ED, it is an ED wait time of interest to patients,policy-makers and health care providers.20, 28 Overall, the findings indicate thatbed wait times were more likely to be longer in larger hospitals. Compared topatients with shorter bed wait times, patients who waited longer in the ED to access an acute care bed were more likely to be older, to be sicker and toremain longer in hospital after leaving the ED.
Researchers and clinicians suggest that a
key to understanding delays in the patient
flow process requires looking beyond the walls
of the ED to other system-level factors.11, 20, 29, 30
Frequently noted factors associated with ED bed wait times include:
� Inpatient acute care bed availability within a specific hospital;15, 17�20, 25
� Scheduling of elective surgical admissions;33
� Staff availability, for example, staff-to-patient ratio;11, 29�32
� A reduction in the ED�s capacity to care for new patients�as the number ofadmitted patients waiting in the ED increases, the ability to treat new patientscoming into the ED may be limited;11 and
� Hospital process(es) for discharging inpatients to post�acute care settings.11, 33
How Does PatientVolume Relate to Patient Flow From the ED?
14
Und
erst
andi
ng E
mer
genc
y D
epar
tmen
t Wai
t Tim
esA
cces
s to
Inpa
tient
Bed
s an
d P
atie
nt F
low
Care providers and researchers from across Canada have identified high numbersof ALC patients as a key factor impeding patient flow�among other concerns�forED patients awaiting admission to inpatient care.34�36 The potential consequencesfor ALC patients occupying acute care beds can be felt on many levels�the ALCpatient not receiving care in the right place; patients being moved to post-acutebeds such as complex continuing care until the required level of care is found;and a facility�s capacity to provide acute care services being lowered, which maylead to crowding in other areas of the hospital, including the ED.37
In this section of the report, we examine some of the factors mentioned abovewith a focus on inpatients awaiting post�acute care.
Characteristics of Alternate Level of Care PatientsAlternate level of care (ALC) is designated to inpatients who no longer requireacute care, but require some form of ongoing support or follow-up. This type ofcare is often referred to as �post-acute� care, and can include specialized servicessuch as rehabilitation, complex continuing care, mental health, palliative care or long-term care. Experts suggest that for many patients these services shouldideally be provided in settings other than acute care, such as long-term carefacilities, supportive housing, home-care programs or at home, possibly withsupport by patients� families.32 That said, alternatives are not always readily available when patients need them. This can lead to extended stays in an acutecare facility.16, 38
While we feel this is a conservative estimate due to potential under-reporting of ALC patients, we found that in 2005�2006, (excluding Quebec) ALC patientsaccounted for 4% of acute care patients and 10% of inpatient acute care days. ALC patients were more likely to be older, to be sicker (have multiple and/ormore severe conditions or diseases), to stay in hospital longer and to be transferred to another facility as opposed to being discharged home.

How
Doe
s P
atie
nt V
olum
e R
elat
e to
Pat
ient
Flo
w F
rom
the
ED
?
15Canadian Institute for Health Information
Characteristics of ALC PatientsThe table below illustrates characteristics of patients who received alternative levels of care (ALC) in 2005�2006 compared to other acute care patients. ALC patients were more likely to be older, to be sicker, to stay in hospital longer and to be transferred to another facility as opposed to being discharged home.C
Characteristics Received ALC Did Not Receive ALC
Number (Percent) 74,093 (4) 1,830,393 (96)
Mean Age on Admission 76 54
Percent Female 58 52
Charlson Index
Percent with Score = 0 31 61
Percent with Score = 1 27 18
Percent with Score = 2 17 11
Percent with Score of 3 or More 25 11
Median LOS in Days 23 3
Patient Service Group
Percent Medical 81 52
Percent Surgical 16 35
Percent Neonatal or Pediatric <1 7
Percent Obstetrics <1 2
Percent Mental Health 2 5
Discharge Disposition
Percent Transferred to Another Facility 60 12
Percent Acute Care Facility 12 8
Percent Continuing Care Facility 44 4
Percent Other Facility 4 <1
Percent Discharged Home 31 84
Percent With Home Care 16 10
Percent Without Home Care 15 74
Percent Left Against Medical Advice <1 1
Percent Discharged Due to Death 9 4
11
Note: Based on hospitalizations with discharge in 2005�2006, excluding hospitalizationsin Quebec (due to differences in reporting ALC).Source: Discharge Abstract Database, CIHI.
16
Und
erst
andi
ng E
mer
genc
y D
epar
tmen
t Wai
t Tim
esA
cces
s to
Inpa
tient
Bed
s an
d P
atie
nt F
low
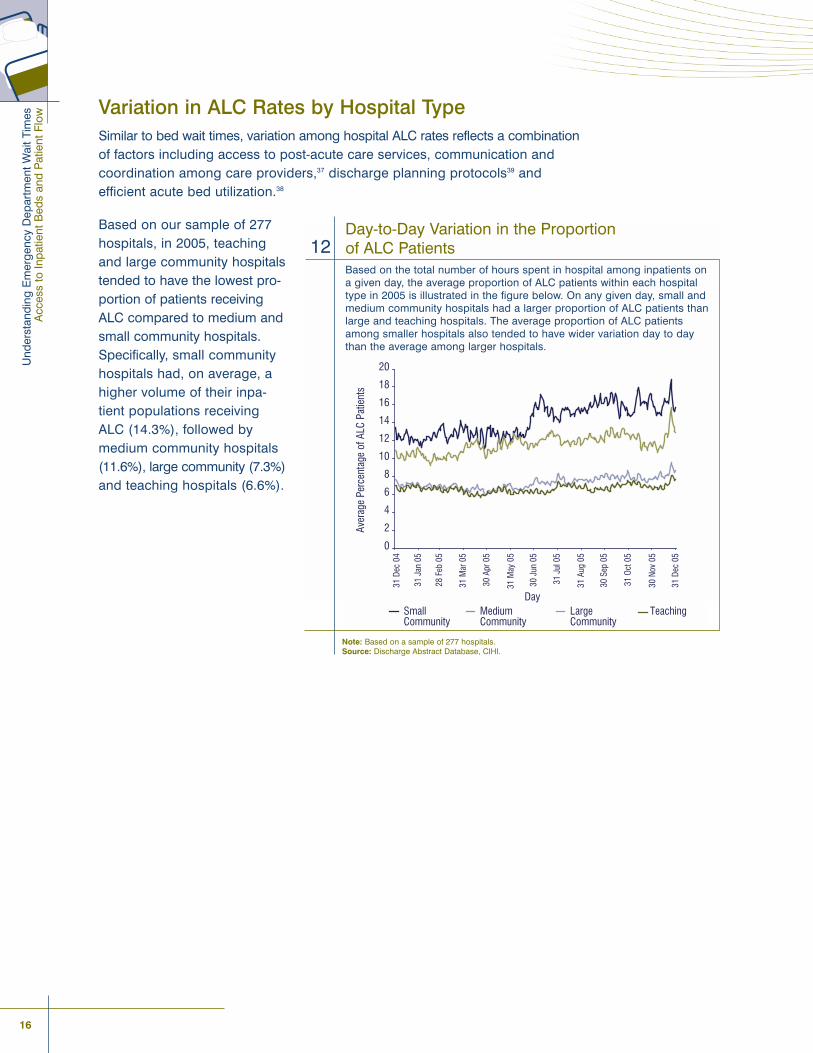
Variation in ALC Rates by Hospital TypeSimilar to bed wait times, variation among hospital ALC rates reflects a combinationof factors including access to post-acute care services, communication andcoordination among care providers,37 discharge planning protocols39 and efficient acute bed utilization.38
Based on our sample of 277hospitals, in 2005, teachingand large community hospitalstended to have the lowest pro-portion of patients receivingALC compared to medium andsmall community hospitals.Specifically, small communityhospitals had, on average, ahigher volume of their inpa-tient populations receivingALC (14.3%), followed bymedium community hospitals(11.6%), large community (7.3%)and teaching hospitals (6.6%).
Day-to-Day Variation in the Proportion of ALC PatientsBased on the total number of hours spent in hospital among inpatients on a given day, the average proportion of ALC patients within each hospitaltype in 2005 is illustrated in the figure below. On any given day, small andmedium community hospitals had a larger proportion of ALC patients thanlarge and teaching hospitals. The average proportion of ALC patientsamong smaller hospitals also tended to have wider variation day to daythan the average among larger hospitals.
12
Note: Based on a sample of 277 hospitals. Source: Discharge Abstract Database, CIHI.
How
Doe
s P
atie
nt V
olum
e R
elat
e to
Pat
ient
Flo
w F
rom
the
ED
?
17Canadian Institute for Health Information
Bed Wait Time andVolume of AlternateLevel of Care PatientsTo investigate the potentialrelationship between bed waittime and the volume of ALCpatients in acute care beds, weexamined the volume of ALCpatients at the time of decisionto admit for each patient admit-ted via the ED. Considering the differences in both bedwait times and volume of ALCpatients across patient groups, we matched the ALCpatient counts to allow for a�like-with-like� or �same-group�approach. Same-group volumewas measured using the following process:
� If the patient waiting was admitted directly to a special care unit (SCU), the ALC volume was setto zero (since, by definition, there are no ALC patients in SCU);
� Otherwise, the ALC volume was set to the number of ALC patients in the same patient servicegroup as the patient waiting. For example, if the patient waiting was in the medical patient servicegroup, the ALC volume would be the number of medical ALC patients.
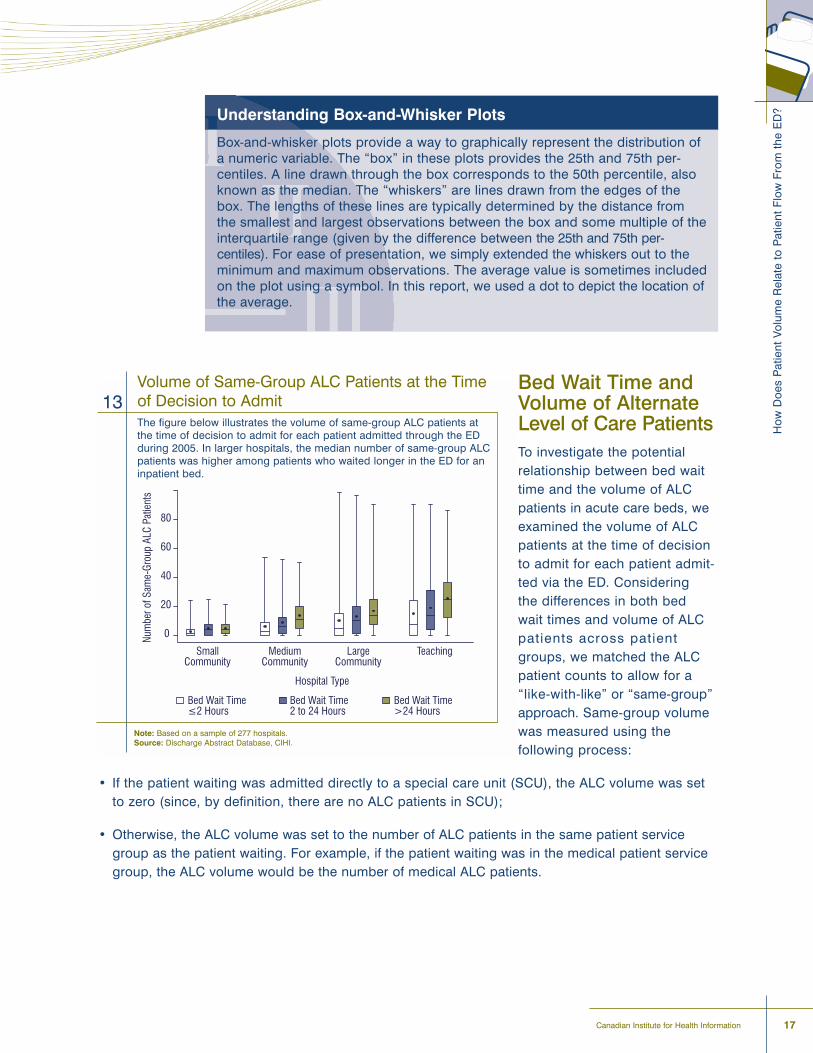
Volume of Same-Group ALC Patients at the Timeof Decision to Admit The figure below illustrates the volume of same-group ALC patients atthe time of decision to admit for each patient admitted through the EDduring 2005. In larger hospitals, the median number of same-group ALCpatients was higher among patients who waited longer in the ED for aninpatient bed.
13
Note: Based on a sample of 277 hospitals.Source: Discharge Abstract Database, CIHI.
Hospital Type
SmallCommunity
MediumCommunity
LargeCommunity
Teaching
0
20
40
60
80
Bed Wait Time≤2 Hours
Bed Wait Time2 to 24 Hours
Bed Wait Time>24 Hours
Num
ber o
f Sam
e-Gr
oup
ALC
Patie
nts
Understanding Box-and-Whisker Plots
Box-and-whisker plots provide a way to graphically represent the distribution ofa numeric variable. The �box� in these plots provides the 25th and 75th per-centiles. A line drawn through the box corresponds to the 50th percentile, alsoknown as the median. The �whiskers� are lines drawn from the edges of thebox. The lengths of these lines are typically determined by the distance from the smallest and largest observations between the box and some multiple of theinterquartile range (given by the difference between the 25th and 75th per-centiles). For ease of presentation, we simply extended the whiskers out to theminimum and maximum observations. The average value is sometimes includedon the plot using a symbol. In this report, we used a dot to depict the location ofthe average.
18
Und
erst
andi
ng E
mer
genc
y D
epar
tmen
t Wai
t Tim
esA
cces
s to
Inpa
tient
Bed
s an
d P
atie
nt F
low
Using this approach, we found that as the bed wait time increased, so did theaverage number of ALC patients. This result generally held across all hospitaltypes, but was most pronounced in medium, large and teaching hospitals. Inmedium community hospitals the median ALC volume ranged from two ALCpatients among patients who waited up to 2 hours to nine ALC patients amongthose who waited over 24 hours. In large community and teaching hospitals, the median volume ranged from 4 to 11 and 6 to 20 ALC patients, respectively.
In summary, experts point to a variety of system-level factors that may influenceED wait times. Although the analysis presented here does not definitively establisha relationship between higher ALC patient volume and longer bed wait time, it does provide some descriptive findings as a starting point for further work. Adeeper examination would likely require consideration of additional factors suchas bed occupancy, surges in admissions to hospital, staffing for both ED andacute care services, management of elective admissions and infection control.
In Canada and other countries, experts
suggest that the ability to smoothly transfer
patients to acute care beds is key to avoiding
ED crowding and ensuring appropriate care for
incoming ED patients.20, 28, 40
Awareness of the need to address patient flow issues within thehealth care system is not new. There are numerous examples from
across Canada of initiatives being undertaken by individual hospitals,groups of hospitals and other stakeholders to address patient flow issues.
Many of these processes are operating with a focus to reduce ED overcrowdingand ED length of stay through improved inpatient bed capacity.
For example:
� In Nova Scotia, at Colchester Regional Hospital, ALC patients are being physicallygrouped together in an �ALC unit� with dedicated staff trained appropriately tomeet the needs of these patients as they await placement in a long-term caresetting. The overall aim is to free up acute care beds and nursing staff with anintended result of creating a better system for patients and staff.
� The Cape Breton District Health Authority (CBDHA) addressed three keyfactors contributing to ED overcrowding by establishing the following opera-tional goals:
� To have 90% of patients admitted through EDs admitted to an inpatient bedwithin 6 hours of the decision to admit;
� To have 60% of patient discharges completed before 12:00 noon; and
� To have patients waiting for continuing care placement occupy a maximumof 47 beds in Temporary Level II units.
In order to reach these goals, the CBDHA developed a rapid assessmentteam to assess and accelerate the discharge of elderly patients with functionalmobility restrictions and to prevent unnecessary admissions; employed scheduled admission plans at inpatient nursing units for the pre-determinationof a patient admission to hospital; and increased nursing home beds.
Conclusion

20
Und
erst
andi
ng E
mer
genc
y D
epar
tmen
t Wai
t Tim
esA
cces
s to
Inpa
tient
Bed
s an
d P
atie
nt F
low
� In Saskatchewan, the Regina Qu�Appelle Health Region developed the AcuteCare Access Plan that included opening an ALC unit of the Pasqua hospital.The unit provides 24-hour supportive and personal care to patients awaitingplacement in post�acute care settings.
� In some hospitals in Edmonton, Regina and Vancouver, the full capacity protocol (FCP) is being employed in isolation or in combination with a regionalplan to reduce ED overcrowding. Originating from research in the U.S., thisprotocol is a strategy designed to move stable patients up from the ED to thehallway on inpatient units.
In addition, some provinces have recently targeted funding specifically towardstrategies to address patient flow from the ED to the inpatient acute care settingand to alternate settings once the acute episode of care is complete.
For example:
� In collaboration with the Ontario MOHLTC, a toolkit has been designed by twopilot hospitals�North York General Hospital and University Health Network�to develop a standardized set of interventions and tools aimed at enablingother hospitals to implement sustainable improvements to patient flow. Theinterventions included in this toolkit have been implemented, tested and eval-uated at the two pilot hospitals. The toolkit also includes diagnostic tools thatwill assist hospitals with their unique patient flow issues, as well as other supportive elements necessary to sustain change efforts. The toolkit is expect-ed to be launched in the fall of 2007.
� In February 2007, the Ontario government announced $13.7 million to alleviatepressures in hospitals by building capacity in community-based care. TheOntario government and the local integrated health networks made the fundingavailable to increase home care, improve access to community-based servicesthrough hospitals, implement geriatric emergency management programs and support transitional beds in select communities for patients awaitingplacement in post�acute care settings. This amount followed $15.3 million infunding announced in October 2006 to help increase the capacity of EDs and enhance care to communities with shortages in long-term care and community resources.
� In Quebec in 2006, the Agence de la santé et. des services sociaux de Montréaldedicated a total of $39.9 million to reduce ED wait times and improve performance of EDs in Montréal. Strategies to improve performance includedincreasing the capacity of intensive home care, transitional care and convalescent care.

� In August 2007, ministers from the Government of New Brunswick announcedthat the Department of Family and Community Services and the Departmentof Health had developed initiatives worth over $7 million, designed to preventand reduce unnecessary hospital admissions. The new initiatives included,among others, the licensing of special-care home beds for regions with highnursing-home placement demands, the provision of emergency-care beds inspecial-care homes and increased home support services intended to allowthose who require assistance to remain at home.
Some, but not all emerging strategies have been formally evaluated. As newstrategies are introduced, or existing ones are tried in new settings, there will beopportunity to assess to what extent they contribute to reduced ED wait timesand decreased proportions of ALC patients in acute care beds, and qualitativemeasures of success based on patient feedback.
Con
clus
ion
21Canadian Institute for Health Information


23Canadian Institute for Health Information
For More InformationWhat We Know:� Many factors come into play when addressing patient flow.
� ED overcrowding is a complex, system-wide problem, with no single factor to explain why it occurs, and no single solution.
� Factors perceived as most important in contributing to efficient patient flowand strategies to address these may vary across hospital size and location.
� Patient flow may be enhanced with coordination among hospital EDs andinpatient wards and other health care providers and settings outside of the hospital.
� Patients within the medical patient service group comprise the largest proportionof patients admitted via the ED and the largest proportion of patients receivingALC in acute care beds.
What We Don�t Know: � The extent to which ALC rates vary by province and region and why.
� The impact of initiatives under way across Canada to address patient flow and ALC occupancy rates.
� Which investments are most needed to improve patient flow and reduce EDbed wait times? What are the human resources or staffing implications?
� How long a wait in the ED for access to an inpatient bed is too long? Why?
� To what extent do factors such as bed occupancy, scheduling of elective surgical admissions, hospital staffing and infection control affect bed wait times?
What�s Happening: � In an effort to inform the public about ED use, the Agence de la santé et des
services sociaux de Montréal and the Agence de la santé et des servicessociaux de la Capitale-Nationale post up-to-date statistics related to ED utilization and wait times.
� The Ontario Hospital Association (OHA) has been conducting monthly surveyswith Ontario hospitals to obtain a provincial picture of challenges and strategiesrelated to ALC patients, analyze trends and inform the development of solutions.Results are shared with the Ministry of Health and Long-Term Care (MOHLTC)and other health care partners.

25Canadian Institute for Health Information
Appendix A: Technical Notes
Data SourceData submitted to CIHI�s Discharge Abstract Database (DAD) for 2004�2005 and 2005�2006 comprised the primary data source for this report. The DAD isan administrative database containing information on inpatient and day surgeryencounters in hospitals across Canada. As of 2004�2005, the DAD covers generalacute inpatient stays in all provinces and territories except Quebec.
Quebec submits data to the Hospital Morbidity Database (HMDB) rather thanthe DAD. We could not incorporate data from Quebec because HMDB does not contain comparable information on the admission source (that is, ED versusother means), the date and time elements needed to calculate bed wait timesand length of stay spent in an alternate level of care (ALC).
Use of DAD data represents a change from the previous reports in theUnderstanding Emergency Wait Times series. The first two reports in the seriesused data primarily from the National Ambulatory Care Reporting System(NACRS)�a database containing ambulatory care service encounters in (for the most part) Ontario hospitals. However, data on bed wait times and inpatientvolume�which are analyzed in this report�can only be derived from the DAD.
Bed Wait Time�Bed wait time,� measured from the time a physician or other authorized healthprofessional decides to admit a patient to the time the patient leaves the emer-gency department (ED), was the main outcome variable in the analysis. Currentliterature on ED wait times and hospital utilization have primarily examined thetotal ED length of stay (LOS), rather than the particular proportion of time spentin the ED (Figure 1).17, 18, 41 We initially considered using total LOS in the ED, butchose to examine the bed wait time for a number of reasons:
� Until 2007�2008, neither DAD nor NACRS captured the data elementsrequired to calculate total LOS in the ED (Figure 1). Measuring this variablebased on the years of data available to us would require linkage betweenNACRS and DAD. Findings from a linkage assessment we conducted indicatedthat among 116 hospitals submitting to both NACRS and DAD and meetingbed wait time analysis selection criteria (Figure 3), 97 (84%) achieved linkagerates of 95% or more. These linkage rates allowed for a gap or overlap betweenED and acute encounters up to six hours long. Lowering the tolerance for thegap or overlap length decreased the linkage rate substantially.
26
Und
erst
andi
ng E
mer
genc
y D
epar
tmen
t Wai
t Tim
esA
cces
s to
Inpa
tient
Bed
s an
d P
atie
nt F
low
� Using bed wait times allowed us to limit the data source to DAD, which in turnincreased the potential number of hospitals that could be included in the analysis.Any use of NACRS data would limit the sample primarily to Ontario hospitals.
� Although total LOS in the ED has been examined in the literature more frequently,bed wait time is also a key indicator of interest for both health care policy-makers and stakeholders.20, 28, 42
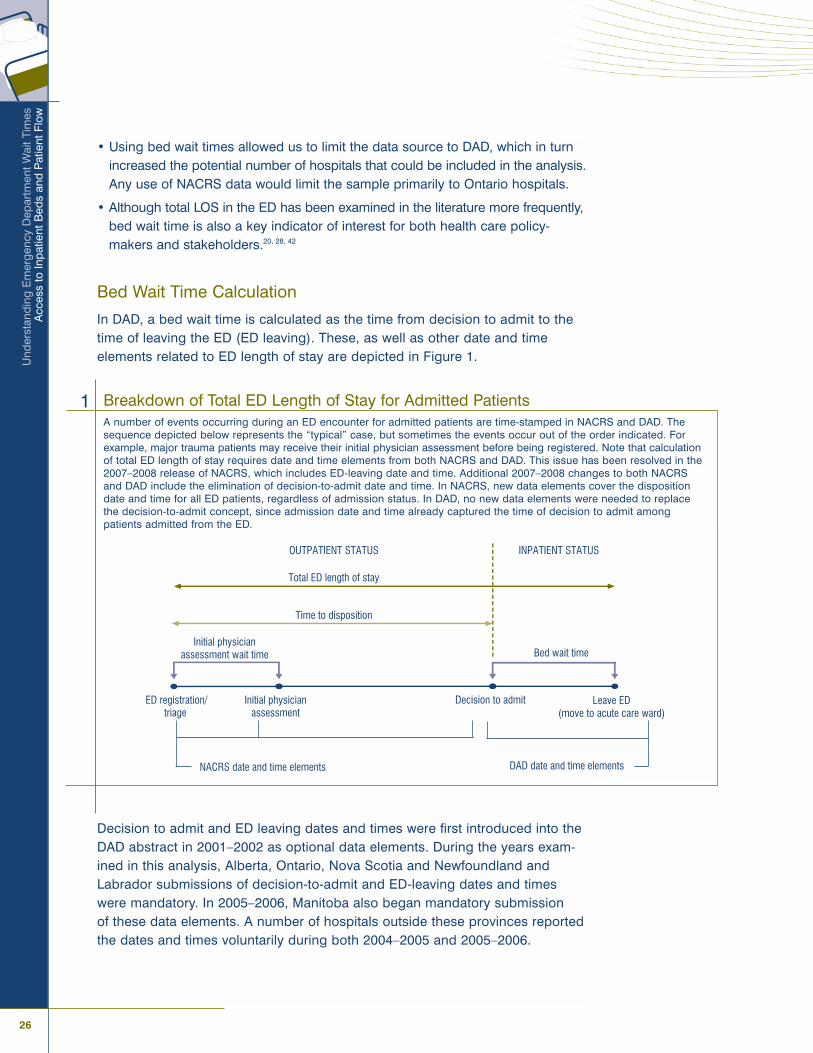
Bed Wait Time Calculation
In DAD, a bed wait time is calculated as the time from decision to admit to thetime of leaving the ED (ED leaving). These, as well as other date and time elements related to ED length of stay are depicted in Figure 1.
Decision to admit and ED leaving dates and times were first introduced into theDAD abstract in 2001�2002 as optional data elements. During the years exam-ined in this analysis, Alberta, Ontario, Nova Scotia and Newfoundland andLabrador submissions of decision-to-admit and ED-leaving dates and timeswere mandatory. In 2005�2006, Manitoba also began mandatory submission of these data elements. A number of hospitals outside these provinces reportedthe dates and times voluntarily during both 2004�2005 and 2005�2006.
Breakdown of Total ED Length of Stay for Admitted PatientsA number of events occurring during an ED encounter for admitted patients are time-stamped in NACRS and DAD. Thesequence depicted below represents the �typical� case, but sometimes the events occur out of the order indicated. Forexample, major trauma patients may receive their initial physician assessment before being registered. Note that calculationof total ED length of stay requires date and time elements from both NACRS and DAD. This issue has been resolved in the2007�2008 release of NACRS, which includes ED-leaving date and time. Additional 2007�2008 changes to both NACRSand DAD include the elimination of decision-to-admit date and time. In NACRS, new data elements cover the dispositiondate and time for all ED patients, regardless of admission status. In DAD, no new data elements were needed to replacethe decision-to-admit concept, since admission date and time already captured the time of decision to admit amongpatients admitted from the ED.
1
ED registration/triage
Initial physician assessment
Decision to admit Leave ED (move to acute care ward)
Initial physician assessment wait time Bed wait time
Total ED length of stay
Time to disposition
OUTPATIENT STATUS INPATIENT STATUS
NACRS date and time elements DAD date and time elements

Ap
pen
dix
A:
Tech
nica
l Not
es
27Canadian Institute for Health Information
Limitations of Bed Wait Times
To date, the accuracy of the decision-to-admit and ED-leaving date and time dataelements in DAD has not been formally investigated using methods such asreabstraction. As a result, bed wait times derived from these data elements shouldbe interpreted with caution.
Based on coding practices readily identifiable in the data and on anecdotalknowledge, three primary limitations should be noted:
� Limited ability of hospitals to record to the minute both the decision-to-admitand ED-leaving date and time for all admissions from the ED;
� Variation in hospital coding practices; and
� Time between decision to admit and ED leaving may not necessarily reflecttrue bed wait times for hospitals with inpatient units adjacent to the ED.
The distribution of decision-to-admit and ED-leaving times recorded by a hospitalis �granular� in the sense that the set of unique times recorded is smaller thanthe range of every possible time value between 00:00 and 23:59. This propertyis likely a result of estimating or rounding times, and indicates that we cannotnecessarily assume that two bed wait times differing by, for example, less than15 minutes, are significantly different. In recognition of the difficulty of recordingtimes for all admissions from the ED, hospitals were given the option in 2003�2004of recording the decision-to-admit time as �unknown,� using the value 99:99.The option of using the unknown value was extended to ED-leaving time in2005�2006.
In addition to missing or estimated values, we can also expect differences incoding practices across hospitals. The date and time of the decision to admitcorrespond to a physician�s order and may therefore be documented in apatient�s chart. However, methods used by hospitals to assign a time to thisorder can vary. For example, one hospital may consistently document the dateand time at which the decision to admit order was made, while other hospitalsmay approximate the decision-to-admit time using the time at which anotherprocess occurred, such as the time the hospital created an inpatient chart.
ED leaving occurs when a patient is moved from the ED to an acute care ward.Hospital personnel responsible for recording information may not know theexact time that this happened. As a result, hospitals may also use a proxy event,such as arrival in the ward, to measure this time. In any case, the processesused for time-stamping decision to admit and ED leaving are not strictly definedand are therefore subject to variation among hospitals.
The last known data limitation relates to the coding of admissions to clinicaldecision units (CDUs) adjacent to the emergency department. In the DAD, manyof these cases can be characterized by abstracts in which the ED-leaving dateand time coincide with discharge home. Among this group of patients, the timefrom decision to admit to ED leaving simply indicates their total CDU LOS, not abed wait time. Within a hospital, these cases represent anywhere from 0% toabout 20% of hospital admissions from the ED during 2005.
28
Und
erst
andi
ng E
mer
genc
y D
epar
tmen
t Wai
t Tim
esA
cces
s to
Inpa
tient
Bed
s an
d P
atie
nt F
low
Admissiondate and time
ED leavingdate and time
Discharge date and time
Special care
Alternate level of care
Acute care
(No data available)
SCU admissiondate and time
SCU discharge date and time
ALC service transferdate and time (inferred)
Patients from the ED
Patients from other sources
Given the variety of limitations related to bed wait times available from the DAD, some general rules for data extraction, variable derivation and analysiswere applied:
� In calculations related to bed wait time, exclude ED admissions in which EDleaving coincided with discharge home.
� Cross-reference the decision-to-admit and ED-leaving times with other timeelements available in DAD.
� Exclude hospitals with more than 5% of bed wait times that are missing, zeroor excessively long (that is, greater than 14 days).
� Exclude hospitals that appear to default the decision to admit, ED leaving,admission, discharge, special care unit (SCU) admission and SCU-dischargetimes to a small set of valid time values (for example, 23:59, 00:00).
� Where possible, stratify results by hospital size and teaching status.
Note that the first rule means that the bed wait time was measured only amongpatients who spent time in acute care ward, not only in a CDU. Some hospitalsmay submit data to DAD for �CDU-only� patients as an acute care abstract;however, these patients are substantially different from other patients admittedthrough the ED. In 2005, patients whose ED leaving coincided with dischargehome tended to have fewer health problems than other patients admitted fromthe ED (mean Charlson Index score 0.55 versus 1.04) and spent less time inhospital (median of 0.8 days versus 3.9 days).
The particular date and time elements used in cross-referencing are depicted in Figure 2. We elaborate further on the hospital inclusion and exclusion criteria in the next section.
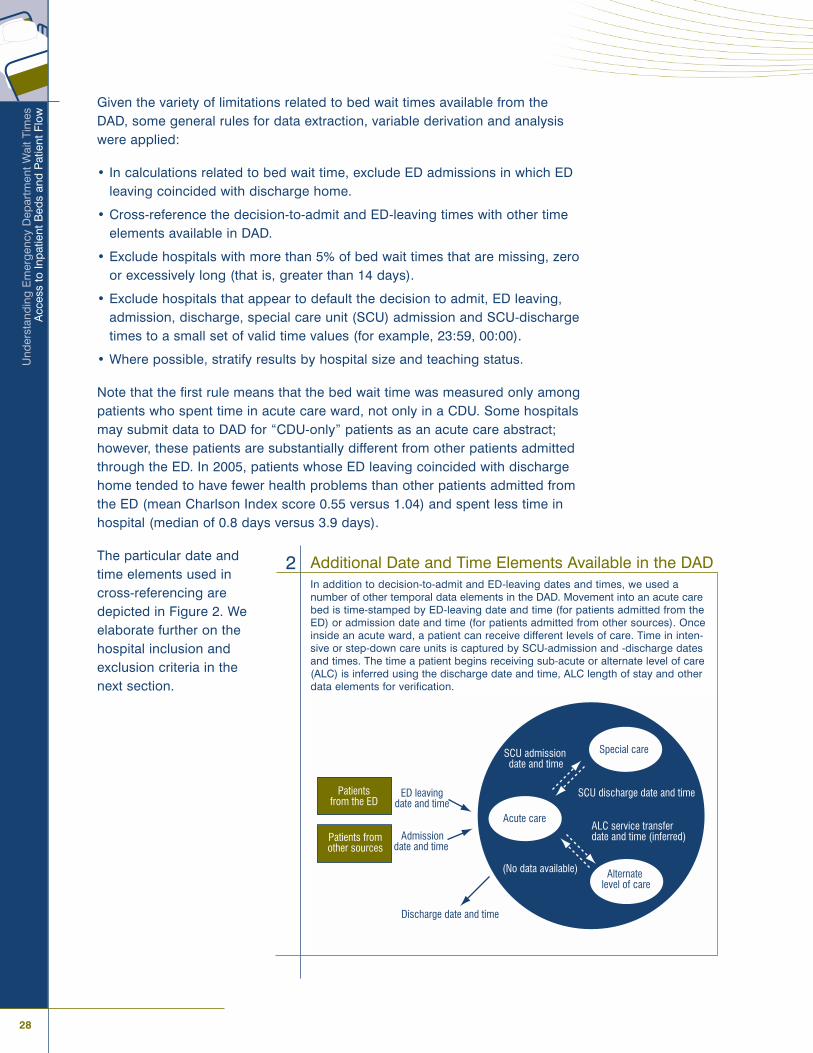
Additional Date and Time Elements Available in the DADIn addition to decision-to-admit and ED-leaving dates and times, we used anumber of other temporal data elements in the DAD. Movement into an acute carebed is time-stamped by ED-leaving date and time (for patients admitted from theED) or admission date and time (for patients admitted from other sources). Onceinside an acute ward, a patient can receive different levels of care. Time in inten-sive or step-down care units is captured by SCU-admission and -discharge datesand times. The time a patient begins receiving sub-acute or alternate level of care(ALC) is inferred using the discharge date and time, ALC length of stay and otherdata elements for verification.
2
Ap
pen
dix
A:
Tech
nica
l Not
es
29Canadian Institute for Health Information
Hospital Selection CriteriaInclusion and exclusion criteria were initially applied at the hospital level.Hospitals were identified using a submission code assigned by CIHI. For themost part, this identifier uniquely maps to a single-site hospital, but a smallnumber of submission codes refer to two or three hospitals with the same corporate affiliation. Hospital identifiers are subject to change over time. Weresolved differences between 2004�2005 and 2005�2006 identifiers using DAD documentation.
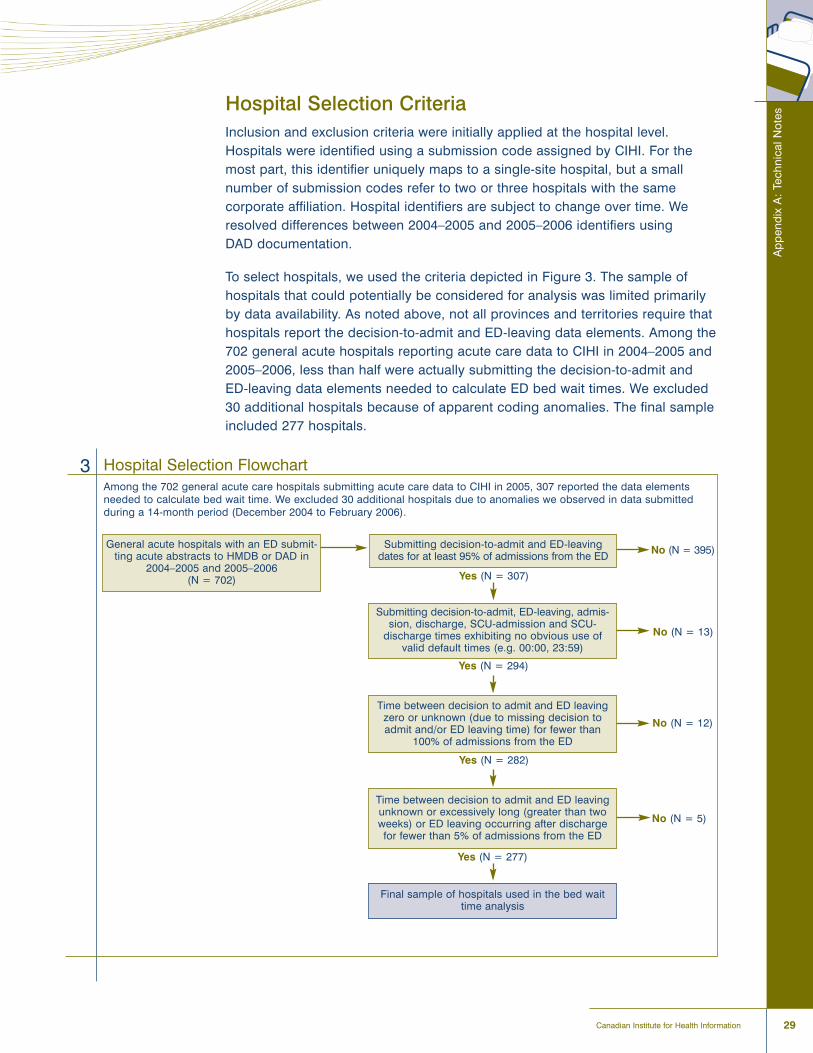
To select hospitals, we used the criteria depicted in Figure 3. The sample ofhospitals that could potentially be considered for analysis was limited primarilyby data availability. As noted above, not all provinces and territories require thathospitals report the decision-to-admit and ED-leaving data elements. Among the702 general acute hospitals reporting acute care data to CIHI in 2004�2005 and2005�2006, less than half were actually submitting the decision-to-admit andED-leaving data elements needed to calculate ED bed wait times. We excluded30 additional hospitals because of apparent coding anomalies. The final sampleincluded 277 hospitals.
Hospital Selection FlowchartAmong the 702 general acute care hospitals submitting acute care data to CIHI in 2005, 307 reported the data elementsneeded to calculate bed wait time. We excluded 30 additional hospitals due to anomalies we observed in data submitted during a 14-month period (December 2004 to February 2006).
3
General acute hospitals with an ED submit-ting acute abstracts to HMDB or DAD in
2004�2005 and 2005�2006(N = 702)
Submitting decision-to-admit and ED-leavingdates for at least 95% of admissions from the ED
Submitting decision-to-admit, ED-leaving, admis-sion, discharge, SCU-admission and SCU-
discharge times exhibiting no obvious use of valid default times (e.g. 00:00, 23:59)
Time between decision to admit and ED leavingzero or unknown (due to missing decision toadmit and/or ED leaving time) for fewer than
100% of admissions from the ED
Time between decision to admit and ED leavingunknown or excessively long (greater than twoweeks) or ED leaving occurring after discharge for fewer than 5% of admissions from the ED
Final sample of hospitals used in the bed waittime analysis
Yes (N = 307)
Yes (N = 294)
Yes (N = 282)
Yes (N = 277)
No (N = 395)
No (N = 13)
No (N = 12)
No (N = 5)

30
Und
erst
andi
ng E
mer
genc
y D
epar
tmen
t Wai
t Tim
esA
cces
s to
Inpa
tient
Bed
s an
d P
atie
nt F
low
Using data from a select group of hospitals limits the extent to which our findingscan be generalized to the entire population of acute hospitals in Canada. Interms of representation by province, the sample covered over 50% of hospitalsin Alberta, Ontario and Nova Scotia�three of the four provinces that have currentlymandated the submission of decision-to-admit and ED-leaving data elements(Figure 4). Overall, roughly 40% of general acute facilities across Canada arerepresented in our sample of 277 hospitals, with varying degrees of coverageby province and territory. Figure 5 gives a breakdown of hospital counts by hospital type. We based our hospital type definition on the peer group hospitalsreport to the Comparison of Hospital Activity Program (CHAP). CHAP incorpo-rates only DAD-submitting institutions, so we can only compare our sample hospital type distribution with what we can consider to be acute care hospitalsoutside Quebec.
Sample Coverage of 277 Hospitals by Province and TerritoryProvince/Territory Approximate Number of Acute Care Number of Hospitals Included in the
Hospitals in Canada* Bed Wait Time Analysis (Percent)
British Columbia 82 5 (6)
Alberta� 96 81 (84)
Saskatchewan 65 6 (9)
Manitoba 71 15 (21)
Ontario� 166 116 (70)
Quebec 123 0 (0)
New Brunswick 24 12 (50)
Nova Scotia� 32 28 (88)
Prince Edward Island 7 0 (0)
Newfoundland and Labrador� 30 14 (47)
Yukon Territory 1 0 (0)
Northwest Territories 4 0 (0)
Nunavut 1 0 (0)
Total 702 277 (39)
4
* Approximated by the number of hospitals submitting acute care abstracts to HMDB or DAD. The countfor Quebec gives the number of hospitals submitting acute abstracts with urgent/emergency type toHMDB in both 2004�2005 and 2005�2006. For all other provinces and territories, the number indicated is limited to general acute hospitals with an ED submitting to DAD in both 2004�2005 and 2005�2006.� Submission of the decision-to-admit and ED-leaving date and time elements was mandatory in both2004�2005 and 2005�2006.
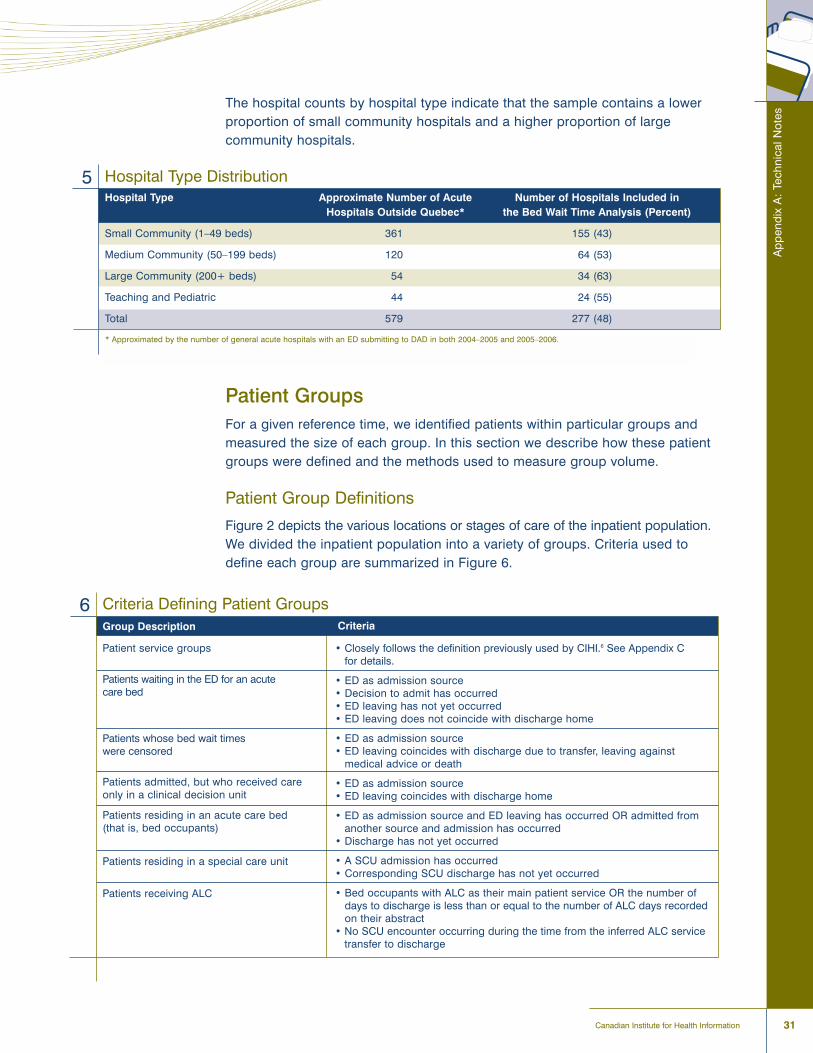
Ap
pen
dix
A:
Tech
nica
l Not
es
31Canadian Institute for Health Information
The hospital counts by hospital type indicate that the sample contains a lowerproportion of small community hospitals and a higher proportion of large community hospitals.
Patient GroupsFor a given reference time, we identified patients within particular groups andmeasured the size of each group. In this section we describe how these patientgroups were defined and the methods used to measure group volume.
Patient Group Definitions
Figure 2 depicts the various locations or stages of care of the inpatient population.We divided the inpatient population into a variety of groups. Criteria used todefine each group are summarized in Figure 6.
Hospital Type DistributionHospital Type Approximate Number of Acute Number of Hospitals Included in
Hospitals Outside Quebec* the Bed Wait Time Analysis (Percent)
Small Community (1�49 beds) 361 155 (43)
Medium Community (50�199 beds) 120 64 (53)
Large Community (200+ beds) 54 34 (63)
Teaching and Pediatric 44 24 (55)
Total 579 277 (48)
5
* Approximated by the number of general acute hospitals with an ED submitting to DAD in both 2004�2005 and 2005�2006.
Criteria Defining Patient GroupsGroup Description
Patient service groups
Patients waiting in the ED for an acute care bed
Patients whose bed wait times were censored
Patients admitted, but who received care only in a clinical decision unit
Patients residing in an acute care bed (that is, bed occupants)
Patients residing in a special care unit
Patients receiving ALC
6Criteria
� Closely follows the definition previously used by CIHI.6 See Appendix C for details.
� ED as admission source� Decision to admit has occurred� ED leaving has not yet occurred� ED leaving does not coincide with discharge home
� ED as admission source� ED leaving coincides with discharge due to transfer, leaving against
medical advice or death
� ED as admission source� ED leaving coincides with discharge home
� ED as admission source and ED leaving has occurred OR admitted fromanother source and admission has occurred
� Discharge has not yet occurred
� A SCU admission has occurred� Corresponding SCU discharge has not yet occurred
� Bed occupants with ALC as their main patient service OR the number of days to discharge is less than or equal to the number of ALC days recordedon their abstract
� No SCU encounter occurring during the time from the inferred ALC servicetransfer to discharge
32
Und
erst
andi
ng E
mer
genc
y D
epar
tmen
t Wai
t Tim
esA
cces
s to
Inpa
tient
Bed
s an
d P
atie
nt F
low
Patient Group Volume
Our analysis involved measuring the size of selected patient groups withrespect to a specific date and time or day in the calendar year. We simply usedthe number of patients currently in the group as a measure of group volume ata particular point in time.
Patient volume with respect to a specific day is an aggregate measure that canbe quantified in a variety of ways. One standard method is �total patient days,�defined as the number of inpatients in the hospital that night (also known as the�midnight census�) plus the number of same-day discharges.17, 43 Total patientdays is driven exclusively by admission and discharge time. Generalizing totalpatient days to measure volume within a specific group is therefore not astraightforward process. For example, consider a patient who waited 16 hoursfor a bed, from 22:00 to 8:00 the following day, and then spent 8 hours on aninpatient ward before being discharged at 16:00 that afternoon. This patientwould contribute one day to total patient days. If we were to divide total patientdays between patients waiting for a bed and those occupying a bed, it appearswe need to consider the number of hours this patient spent in each group.However, total patient days does not directly consider hours in its definition.
For this reason, we used an alternative measure of daily patient volume, referredto as �total patient hours.� Total patient hours has been used previously toquantify ED patient volume by level of complexity.41 Inpatient total patient hoursis equal to the total number of hours patients spent in acute care over thecourse of the day. Total patient hours specific to, for example, patients receivingALC, can be obtained by simply limiting this sum to only ALC patient hours.
One challenge involved in counting patients, patient days or patient hours isdetermining how to handle records that overlap, have missing times or havetimes that conflict. Two duplicate records submitted for the same patient is oneexample of overlap. Other forms of overlap can occur, but all of them result insome form of over-counting. We resolved cases of overlap, missing times orconflicting times by editing the abstracts using the following rules:
1. If a patient (identified using health card number/chart number, gender andyear of birth) has nearly duplicate abstracts or duplicate SCU encountersfrom the same hospital, then combine them.
2. If the admission date is missing, impute it using the earliest procedure dateor SCU-admission date. Or, if the discharge date is missing, impute it usingthe latest procedure date or SCU-discharge date. If these dates are notrecorded, exclude the abstract from analysis.
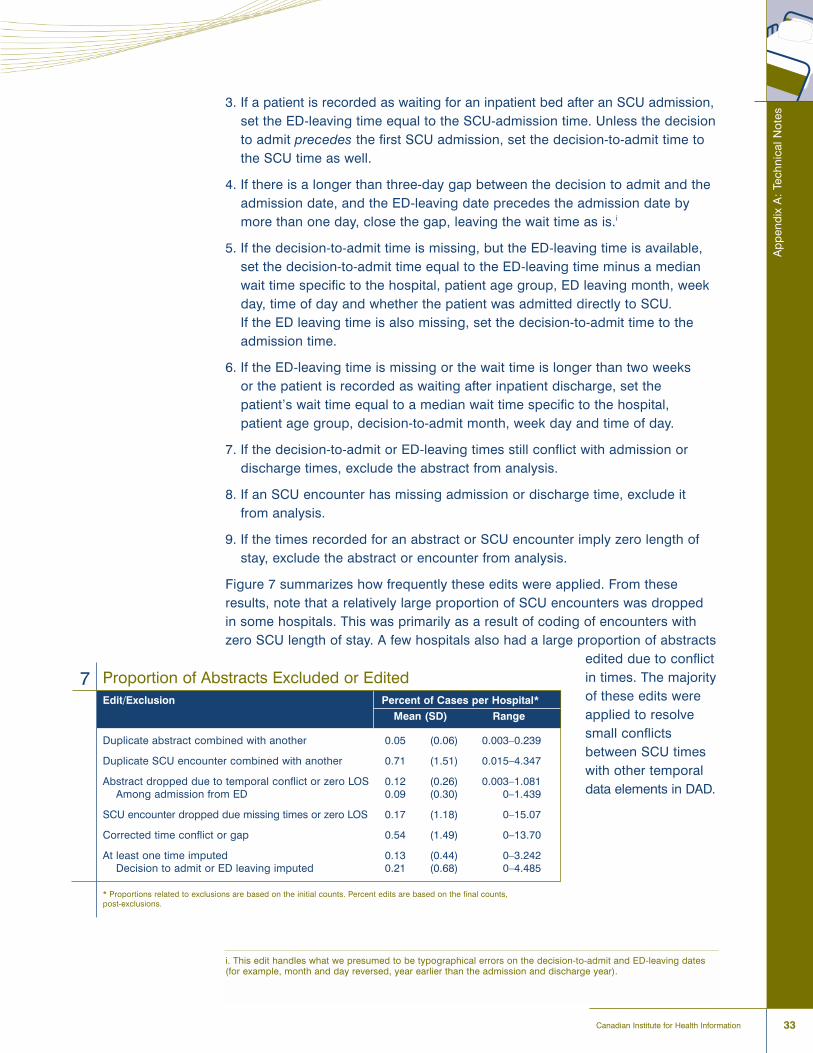
Ap
pen
dix
A:
Tech
nica
l Not
es
33Canadian Institute for Health Information
3. If a patient is recorded as waiting for an inpatient bed after an SCU admission,set the ED-leaving time equal to the SCU-admission time. Unless the decisionto admit precedes the first SCU admission, set the decision-to-admit time tothe SCU time as well.
4. If there is a longer than three-day gap between the decision to admit and theadmission date, and the ED-leaving date precedes the admission date bymore than one day, close the gap, leaving the wait time as is.i
5. If the decision-to-admit time is missing, but the ED-leaving time is available,set the decision-to-admit time equal to the ED-leaving time minus a medianwait time specific to the hospital, patient age group, ED leaving month, weekday, time of day and whether the patient was admitted directly to SCU. If the ED leaving time is also missing, set the decision-to-admit time to theadmission time.
6. If the ED-leaving time is missing or the wait time is longer than two weeks or the patient is recorded as waiting after inpatient discharge, set thepatient�s wait time equal to a median wait time specific to the hospital, patient age group, decision-to-admit month, week day and time of day.
7. If the decision-to-admit or ED-leaving times still conflict with admission or discharge times, exclude the abstract from analysis.
8. If an SCU encounter has missing admission or discharge time, exclude itfrom analysis.
9. If the times recorded for an abstract or SCU encounter imply zero length ofstay, exclude the abstract or encounter from analysis.
Figure 7 summarizes how frequently these edits were applied. From theseresults, note that a relatively large proportion of SCU encounters was droppedin some hospitals. This was primarily as a result of coding of encounters withzero SCU length of stay. A few hospitals also had a large proportion of abstracts
edited due to conflictin times. The majorityof these edits wereapplied to resolvesmall conflictsbetween SCU timeswith other temporaldata elements in DAD.
i. This edit handles what we presumed to be typographical errors on the decision-to-admit and ED-leaving dates(for example, month and day reversed, year earlier than the admission and discharge year).
Proportion of Abstracts Excluded or EditedEdit/Exclusion Percent of Cases per Hospital*
Mean (SD) Range
Duplicate abstract combined with another 0.05 (0.06) 0.003�0.239
Duplicate SCU encounter combined with another 0.71 (1.51) 0.015�4.347
Abstract dropped due to temporal conflict or zero LOS 0.12 (0.26) 0.003�1.081Among admission from ED 0.09 (0.30) 0�1.439
SCU encounter dropped due missing times or zero LOS 0.17 (1.18) 0�15.07
Corrected time conflict or gap 0.54 (1.49) 0�13.70
At least one time imputed 0.13 (0.44) 0�3.242Decision to admit or ED leaving imputed 0.21 (0.68) 0�4.485
* Proportions related to exclusions are based on the initial counts. Percent edits are based on the final counts, post-exclusions.
7
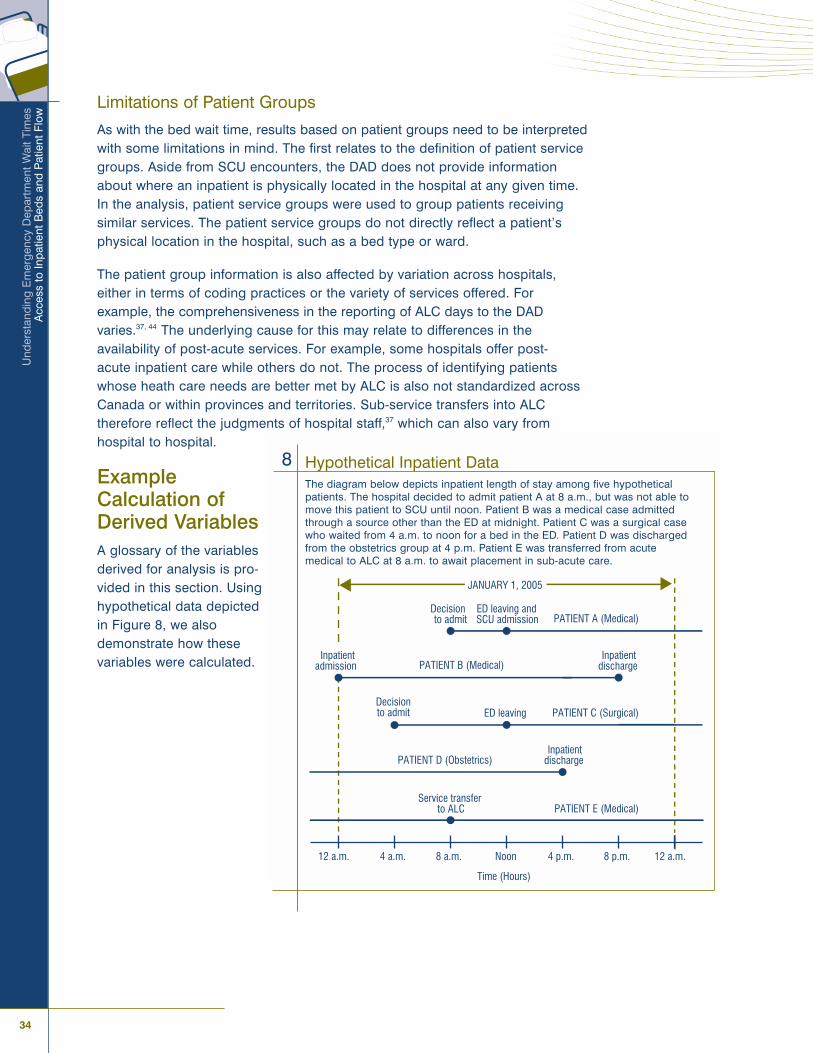
34
Und
erst
andi
ng E
mer
genc
y D
epar
tmen
t Wai
t Tim
esA
cces
s to
Inpa
tient
Bed
s an
d P
atie
nt F
low
Limitations of Patient Groups
As with the bed wait time, results based on patient groups need to be interpretedwith some limitations in mind. The first relates to the definition of patient servicegroups. Aside from SCU encounters, the DAD does not provide informationabout where an inpatient is physically located in the hospital at any given time.In the analysis, patient service groups were used to group patients receivingsimilar services. The patient service groups do not directly reflect a patient�sphysical location in the hospital, such as a bed type or ward.
The patient group information is also affected by variation across hospitals,either in terms of coding practices or the variety of services offered. Forexample, the comprehensiveness in the reporting of ALC days to the DADvaries.37, 44 The underlying cause for this may relate to differences in the availability of post-acute services. For example, some hospitals offer post-acute inpatient care while others do not. The process of identifying patientswhose heath care needs are better met by ALC is also not standardized acrossCanada or within provinces and territories. Sub-service transfers into ALC therefore reflect the judgments of hospital staff,37 which can also vary from hospital to hospital.
ExampleCalculation ofDerived VariablesA glossary of the variablesderived for analysis is pro-vided in this section. Usinghypothetical data depictedin Figure 8, we alsodemonstrate how these variables were calculated.
12 a.m. 4 a.m. 8 a.m. Noon 4 p.m. 8 p.m. 12 a.m.
Time (Hours)
JANUARY 1, 2005
Decision to admit
ED leaving and SCU admission
Inpatient discharge
ED leaving
Inpatient discharge
Service transfer to ALC
Decision to admit
PATIENT A (Medical)
PATIENT B (Medical)
PATIENT C (Surgical)
PATIENT D (Obstetrics)
PATIENT E (Medical)
Inpatient admission
Hypothetical Inpatient DataThe diagram below depicts inpatient length of stay among five hypotheticalpatients. The hospital decided to admit patient A at 8 a.m., but was not able tomove this patient to SCU until noon. Patient B was a medical case admittedthrough a source other than the ED at midnight. Patient C was a surgical casewho waited from 4 a.m. to noon for a bed in the ED. Patient D was dischargedfrom the obstetrics group at 4 p.m. Patient E was transferred from acutemedical to ALC at 8 a.m. to await placement in sub-acute care.
8

Ap
pen
dix
A:
Tech
nica
l Not
es
35Canadian Institute for Health Information
Daily median bed wait timeDefinition: The median bed wait time for a given day and hospital is equal tothe median bed wait time among patients whose decision to admit occurred onthat day and whose ED leaving did not coincide with discharge home.
Example: In Figure 8, two decisions to admit occurred on January 1, 2005(patients A and C). The wait times for patients A and C were 4 and 8 hours,respectively. Since we have only two bed wait times, the daily median bed wait time is equal to their average, which is 6 hours.
Total patient hoursDefinition: The cumulative number of hours in a given day patients spent inacute care. We limited this measure to bed occupants.
Example: In Figure 8, the total patient hours among bed occupants on January 1, 2005, is the sum of patient hours among the five patients: 12 + 20 + 12 + 16 + 24 = 84 hours.
Proportion of total patient hours among ALC patientsDefinition: Ratio between total patient hours among patients receiving ALC tototal patient hours among all bed occupants.
Example: In Figure 8, patient E spent 16 hours in ALC. The proportion of ALCtotal patient hours on January 1, 2005, is therefore 16/84 = 0.19, or 19%.
Number of ALC patients at the time of decision to admitDefinition: The number of ALC patients in acute care at the time a given patientbegan waiting for an acute care bed.
Example: In Figure 8, the decision to admit for patient A was made at 8 a.m. Atthis same time, patient E was transferred to ALC. The number of ALC patients atthe time of the decision to admit for patient A was therefore one. Patient C alsohad a decision to admit. At that time there were zero patients receiving ALC.
Number of same-group ALC patients at the time of decision to admitDefinition: The number of ALC patients in acute care at the time a given patientbegan waiting for an acute care bed, limited to the same patient group as thisreference patient.
Example: In Figure 8, there was one patient (E) receiving ALC at the time ofdecision to admit for patient A. However, patient A was eventually moved toSCU from the ED. Since no ALC patients can be in SCU, the number of same-group ALC patients for patient A was zero.

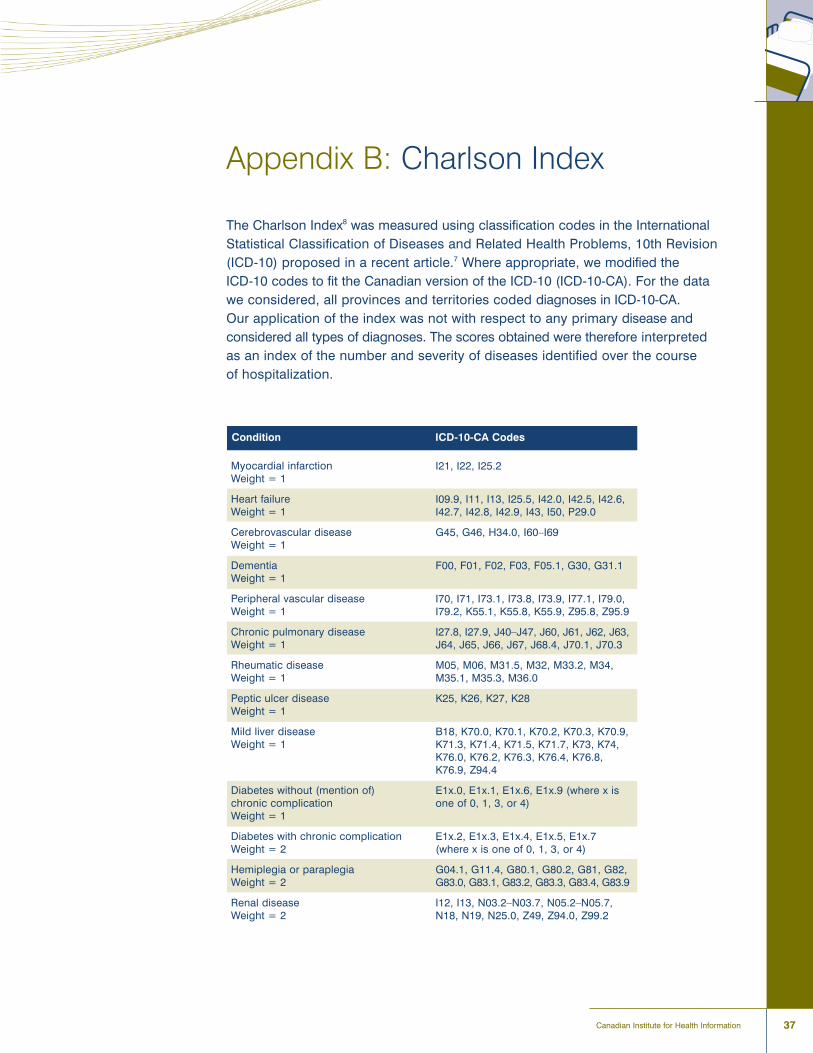
37Canadian Institute for Health Information
Appendix B: Charlson Index
The Charlson Index8 was measured using classification codes in the InternationalStatistical Classification of Diseases and Related Health Problems, 10th Revision(ICD-10) proposed in a recent article.7 Where appropriate, we modified the ICD-10 codes to fit the Canadian version of the ICD-10 (ICD-10-CA). For the datawe considered, all provinces and territories coded diagnoses in ICD-10-CA. Our application of the index was not with respect to any primary disease andconsidered all types of diagnoses. The scores obtained were therefore interpretedas an index of the number and severity of diseases identified over the course of hospitalization.
Condition ICD-10-CA Codes
Myocardial infarctionWeight = 1
Heart failureWeight = 1
Cerebrovascular diseaseWeight = 1
DementiaWeight = 1
Peripheral vascular diseaseWeight = 1
Chronic pulmonary diseaseWeight = 1
Rheumatic diseaseWeight = 1
Peptic ulcer diseaseWeight = 1
Mild liver diseaseWeight = 1
Diabetes without (mention of) chronic complicationWeight = 1
Diabetes with chronic complicationWeight = 2
Hemiplegia or paraplegiaWeight = 2
Renal diseaseWeight = 2
I21, I22, I25.2
I09.9, I11, I13, I25.5, I42.0, I42.5, I42.6, I42.7, I42.8, I42.9, I43, I50, P29.0
G45, G46, H34.0, I60�I69
F00, F01, F02, F03, F05.1, G30, G31.1
I70, I71, I73.1, I73.8, I73.9, I77.1, I79.0,I79.2, K55.1, K55.8, K55.9, Z95.8, Z95.9
I27.8, I27.9, J40�J47, J60, J61, J62, J63,J64, J65, J66, J67, J68.4, J70.1, J70.3
M05, M06, M31.5, M32, M33.2, M34,M35.1, M35.3, M36.0
K25, K26, K27, K28
B18, K70.0, K70.1, K70.2, K70.3, K70.9,K71.3, K71.4, K71.5, K71.7, K73, K74,K76.0, K76.2, K76.3, K76.4, K76.8,K76.9, Z94.4
E1x.0, E1x.1, E1x.6, E1x.9 (where x isone of 0, 1, 3, or 4)
E1x.2, E1x.3, E1x.4, E1x.5, E1x.7 (where x is one of 0, 1, 3, or 4)
G04.1, G11.4, G80.1, G80.2, G81, G82,G83.0, G83.1, G83.2, G83.3, G83.4, G83.9
I12, I13, N03.2�N03.7, N05.2�N05.7,N18, N19, N25.0, Z49, Z94.0, Z99.2
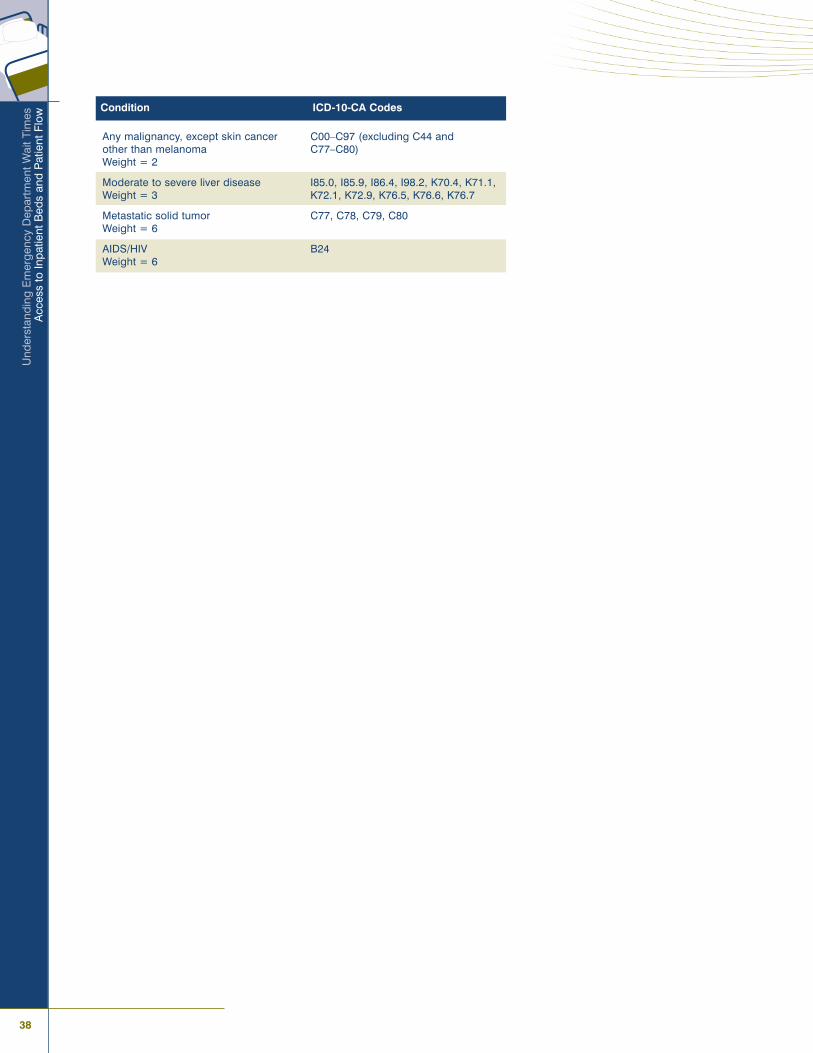
38
Und
erst
andi
ng E
mer
genc
y D
epar
tmen
t Wai
t Tim
esA
cces
s to
Inpa
tient
Bed
s an
d P
atie
nt F
low
Condition ICD-10-CA Codes
Any malignancy, except skin cancerother than melanomaWeight = 2
Moderate to severe liver diseaseWeight = 3
Metastatic solid tumorWeight = 6
AIDS/HIVWeight = 6
C00�C97 (excluding C44 and C77�C80)
I85.0, I85.9, I86.4, I98.2, K70.4, K71.1,K72.1, K72.9, K76.5, K76.6, K76.7
C77, C78, C79, C80
B24
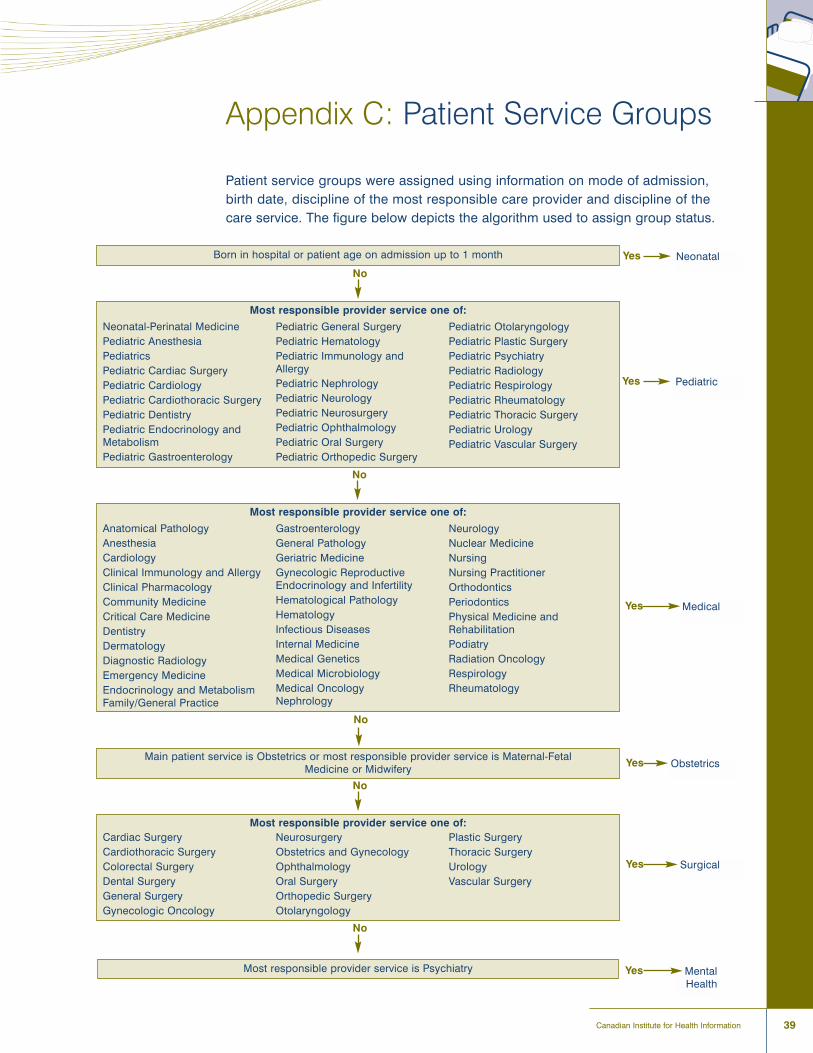
39Canadian Institute for Health Information
Appendix C: Patient Service Groups
Patient service groups were assigned using information on mode of admission,birth date, discipline of the most responsible care provider and discipline of thecare service. The figure below depicts the algorithm used to assign group status.
Born in hospital or patient age on admission up to 1 month Neonatal
Most responsible provider service one of:
No
Yes
PediatricYes
MedicalYes
ObstetricsYes
SurgicalYes
MentalHealth
Yes
Neonatal-Perinatal MedicinePediatric AnesthesiaPediatricsPediatric Cardiac SurgeryPediatric CardiologyPediatric Cardiothoracic SurgeryPediatric DentistryPediatric Endocrinology andMetabolismPediatric Gastroenterology
Pediatric General SurgeryPediatric HematologyPediatric Immunology andAllergyPediatric NephrologyPediatric NeurologyPediatric NeurosurgeryPediatric OphthalmologyPediatric Oral SurgeryPediatric Orthopedic Surgery
Pediatric OtolaryngologyPediatric Plastic SurgeryPediatric PsychiatryPediatric RadiologyPediatric RespirologyPediatric RheumatologyPediatric Thoracic SurgeryPediatric UrologyPediatric Vascular Surgery
Most responsible provider service one of:
Anatomical PathologyAnesthesiaCardiologyClinical Immunology and AllergyClinical PharmacologyCommunity MedicineCritical Care MedicineDentistryDermatologyDiagnostic RadiologyEmergency MedicineEndocrinology and MetabolismFamily/General Practice
GastroenterologyGeneral PathologyGeriatric MedicineGynecologic ReproductiveEndocrinology and InfertilityHematological PathologyHematologyInfectious DiseasesInternal MedicineMedical GeneticsMedical MicrobiologyMedical OncologyNephrology
NeurologyNuclear MedicineNursingNursing PractitionerOrthodonticsPeriodonticsPhysical Medicine andRehabilitationPodiatryRadiation OncologyRespirologyRheumatology
No
No
Main patient service is Obstetrics or most responsible provider service is Maternal-Fetal Medicine or Midwifery
No
Most responsible provider service one of:
No
Cardiac SurgeryCardiothoracic SurgeryColorectal SurgeryDental SurgeryGeneral SurgeryGynecologic Oncology
NeurosurgeryObstetrics and GynecologyOphthalmologyOral SurgeryOrthopedic SurgeryOtolaryngology
Plastic SurgeryThoracic SurgeryUrologyVascular Surgery
Most responsible provider service is Psychiatry


41Canadian Institute for Health Information
References
1. S. Daly, D. A. Campbell and P. A. Cameron, �Short-Stay Units and Observation Medicine:
A Systematic Review,� Medical Journal of Australia 178, 11 (2003): pp. 559�563.
2. Canadian Institute for Health Information, Canadian MIS Database Hospital Financial Performance
Indicators: 1999�2000 to 2003�2004 (Ottawa: CIHI, 2006).
3. Public Health Agency of Canada, Population Health: What Determines Health? (2007), [online],
from <http://www.phac-aspc.gc.ca/ph-sp/phdd/determinants/index.html>.
4. D. Cloutier-Fisher, M. J. Penning, C. Zheng and E. B. Druyts, �The Devil Is in the Details: Trends
in Avoidable Hospitalization Rates by Geography in British Columbia, 1990 to 2000,� BMC Health
Services Research 6 (2006): p. 104.
5. M. D. Lougheed, N. Garvey, K. R. Chapman, L. Cicutto, R. Dales, A. G. Day, W. M. Hopman,
M. Lam, M. R. Sears, K. Szpiro, T. To, N. A. M. Paterson and the Ontario Respiratory Outcomes
Research Network, �The Ontario Asthma Regional Variation Study: Emergency Department Visit
Rates and the Relation to Hospitalization Rates,� Chest 129 (2006): pp. 909�917.
6. Canadian Institute for Health Information, Inpatient Hospitalizations and Average Length of Stay
Trends in Canada, 2003�2004 and 2004�2005 (Ottawa: CIHI, 2005).
7. H. Quan, V. Sundararajan, P. Halfon, A. Fong, B. Burnand, J. C. Luthi, L. D. Saunders, C. A. Beck,
T. E. Feasby and W. A. Ghali, �Coding Algorithms for Defining Comorbidities in ICD-9-CM and
ICD-10 Administrative Data,� Medical Care 43, 11 (2005): pp. 1130�1139.
8. M. E. Charlson, P. Pompei, K. L. Ales and C. R. MacKenzie, �A New Method of Classifying
Prognostic Comorbidity in Longitudinal Studies: Development and Validation,� Journal of Chronic
Diseases 40, 5 (1987): pp. 373�383.
9. R. A. Deyo, D. C. Cherkin and M. A. Ciol, �Adapting a Clinical Comorbidity Index for Use With
ICD-9-CM Administrative Databases,� Journal of Clinical Epidemiology 45, 6 (1992): pp. 613�619.
10. Institute of Medicine, Hospital-Based Emergency Care: At the Breaking Point (Committee on the
Future of Emergency Care in the United States Health System Board on Health Care Services)
(Washington, D.C.: The National Academies Press, 2006), pp. 1�296.
11. B. R. Asplin, D. J. Magid, K. V. Rhodes, L. I. Solberg, N. Lurie and C. A. Camargo, Jr., �A
Conceptual Model of Emergency Department Crowding,� Annals of Emergency Medicine 42, 2
(2003): pp. 173�180.
12. M. J. Schull, M. Vermeulen, G. Slaughter, L. Morrison and P. Daly, �Emergency Department
Crowding and Thrombolysis Delays in Acute Myocardial Infarction,� Annals of Emergency Medicine
44, 6 (2004): pp. 577�585.
13. J. M. Pines, J. E. Hollander, A. R. Localio and J. P. Metlay, �The Association Between Emergency
Department Crowding and Hospital Performance on Antibiotic Timing for Pneumonia and
Percutaneous Intervention for Myocardial Infarction,� Academic Emergency Medicine 13, 8 (2006):
pp. 873�878.
14. Institute for Healthcare Improvement, Optimizing Patient Flow: Moving Patients Smoothly Through
Acute Care Settings (Boston, MA: IHI, 2003), pp. 1�8.
15. B. H. Rowe, K. Bond, M. B. Ospina, S. Blitz, M. Afilalo, S. G. Campbell and M. Schull, Frequency,
Determinants, and Impact of Overcrowding in Emergency Departments in Canada: A National
Survey of Emergency Department Directors (Ottawa: Canadian Agency for Drugs and Technologies
in Health, 2006).
16. R. J. Blendon, C. Schoen, C. M. DesRoches, R. Osborn, K. Zapert and E. Raleigh, �Confronting
Competing Demands To Improve Quality: A Five-Country Hospital Survey,� Health Affairs 23, 3
(2004): pp. 119�135.

42
Und
erst
andi
ng E
mer
genc
y D
epar
tmen
t Wai
t Tim
esA
cces
s to
Inpa
tient
Bed
s an
d P
atie
nt F
low
17. A. J. Forster, I. Stiell, G. Wells, A. J. Lee and C. van Walraven, �The Effect of Hospital Occupancy
on Emergency Department Length of Stay and Patient Disposition,� Academic Emergency
Medicine 10, 2 (2003): pp. 127�133.
18. N. K. Rathlev, J. Chessare, J. Olshaker, D. Obendorfer, S. D. Mehta, T. Rothenhaus, S. Crespo,
B. Magauran, K. Davidson, R. Shemin, K. Lewis, J. M. Becker, L. Fisher, L. Guy, A. Cooper and
E. Litvak, �Time Series Analysis of Variables Associated With Daily Mean Emergency Department
Length of Stay,� Annals of Emergency Medicine 49, 3 (2007): pp. 265�271.
19. A. Bagust, M. Place and J. W. Posnett, �Dynamics of Bed Use in Accommodating Emergency
Admissions: Stochastic Simulation Model,� British Medical Journal 319, 7203 (1999): pp. 155�158.
20. Physician Hospital Care Committee, Improving Access to Emergency Care: Addressing System
Issues (Toronto: OHA, OMA, MOHLTC, 2006).
21. M. Schull, P. M. Slaughter and D. A. Redelmeier, �Urban Emergency Department Overcrowding:
Defining the Problem and Eliminating Misconceptions,� Canadian Journal of Emergency Medicine
4, 2 (2002): pp. 76�83.
22. D. M. Fatovich, Y. Nagree and P. Sprivulis, �Access Block Causes Emergency Department
Overcrowding and Ambulance Diversion in Perth, Western Australia,� Emergency Medicine Journal
22, 5 (2005): pp. 351�354.
23. B. Chan, M. Schull and S. Schultz, Emergency Department Services in Ontario (Toronto: ICES, 2001).
24. N. C. Proudlove, K. Gordon and R. Boaden, �Can Good Bed Management Solve the Overcrowding
in Accident and Emergency Departments?,� Emergency Medicine Journal 20 (2003): pp. 149�155.
25. V. H. Menec, N. P. Roos, D. L. Nowicki, L. MacWilliam, G. Finlayson and C. Black, Seasonal
Patterns of Winnipeg Hospital Use (Winnipeg: Manitoba Centre for Health Policy and Evaluation,
1999), pp. 1�83.
26. L. Frost, S. P. Johnsen, L. Pedersen, S. Husted, G. Engholm, H. T. Sorensen and K. J. Rothman,
�Seasonal Variation in Hospital Discharge Diagnosis of Atrial Fibrilation: A Population-Based
Study,� Epidemiology 13, 2 (2002): pp. 211�215.
27. K. J. Fullerton and V. L. Crawford, �The Winter Bed Crisis�Quantifying Seasonal Effects on
Hospital Bed Usage,� QJM 92, 4 (1999): pp. 199�206.
28. Canadian Association of Emergency Physicians, Position Statement on Emergency Department
Overcrowding (Ottawa: CAEP, 2007).
29. K. Bond, M. B. Ospina, S. Blitz, C. Friesen, G. Innes, P. Yoon, G. Curry, B. Holroyd and B. Rowe,
Interventions to Reduce Overcrowding in Emergency Departments (Ottawa: CADTH, 2006).
30. United States General Accounting Office, Hospital Emergency Departments: Overcrowded
Conditions Vary Among Hospitals and Communities (2003).
31. D. Cass, �Once Upon a Time in the Emergency Department: A Cautionary Tale (Editorial),� Annals
of Emergency Medicine 46, 6 (2005): pp. 541�543.
32. A. Jokovic, A. Baibergenova, K. Baldota and K. Leeb, �Alternatives to Acute Care?,� Health Care
Quarterly 9, 2 (2006): pp. 22�24.
33. C. Haraden and R. Resar, �Patient Flow in Hospitals: Understanding and Controlling It Better,�
Frontiers of Health Services Management 20, 4 (2004): pp. 3�15.

43Canadian Institute for Health Information
Ref
eren
ces
34. Capital Health, Improving Flow in the QEII and DGH Emergency Departments: Update on Ongoing
Improvements (Nova Scotia: Capital Health District, 2005), pp. 1�10.
35. Hôpital Régional de Sudbury Regional Hospital, Alternate Level of Care: Beyond Beds
(Presentation to HRSRH Board of Directors October 2006) (2006), [online], cited February 9, 2007,
from <http://www.hrsrh.on.ca>.
36. Ottawa ALC Strategic Committee, From Alternative to Appropriate Levels of Care Ottawa
ALC Strategic Committee�Report of Recommendations (2006), pp. 1�28, [online], cited
February 19, 2007, from <http://www.ocsa.on.ca>.
37. Ontario Hospital Association, Ontario Association of Non-Profit Homes and Services for Seniors,
Ontario Association of Community Care Access Centres and Ontario Long-Term Care Association,
Alternate Level of Care�Challenges and Opportunities (Toronto: OHA, 2006).
38. C. Damba and M. Vahabi, Toronto Local Health System Monitoring Report (Toronto: Toronto District
Health Council, 2002), pp. 1�249.
39. S. Bruce, C. DeCoster, J. Trumble-Waddell and J. Burchill, �Patients Hospitalized for Medical
Conditions in Winnipeg, Canada: Appropriateness and Level of Care,� Healthcare Management
Forum Winter Supplement (2002): pp. 53�57.
40. British Columbia Medical Association, BCMA Policy Backgrounder: Emergency Department
Overcrowding (2006), [online], cited May 29, 2007, from <http://www.bcma.org/public/
news_publications/publications/policy_backgrounders/EmergencyDepartmentOvercrowding.asp>.
41. M. J. Schull, A. Kiss and J. P. Szalai, �The Effect of Low-Complexity Patients on Emergency
Department Waiting Times,� Annals of Emergency Medicine 49, 3 (2007): pp. 257�264.
42. Agency for Healthcare Research and Quality, Emergency Department Performance Measures and
Benchmarking Summit: The Consensus Statement (Rockville, MD: AHRQ Quality Indicators, 2006).
43. Ministry of Health and Long-Term Care, Finance and Information Management Branch, Daily
Census Summary Instruction Guide (Ontario: MOHLTC, 2006).
44. Canadian Institute for Health Information, Coding Variations in the Discharge Abstract Database
(DAD) Data (Ottawa: CIHI, 2003).

Taking health information further
À l�avant-garde de l�information sur la santéwww.cihi.ca
www.icis.ca