Embed Size (px)
Citation preview

7/27/2016
1
Emergency Department
(ED)
Performance Improvement
Project (PIP)
TCC Conference, August 2016
Amy Pulliam, MPH, Quality Improvement Coordinator [email protected]
Michelle Mason, LCSW, ACHP-SW, Compliance Specialist [email protected]
Objectives• Describe overall requirements of a
Quality Assessment Performance Improvement (QAPI) Program
• Describe recommended elements of Performance Improvement Projects (PIPs)
• Describe the process of designing, developing, and measuring a PIP utilizing the example of the Emergency Department (ED) PIP by Hospice and Palliative Care of Greensboro (HPCG)
What is QAPI?• QAPI is a combination of two quality management systems:
Quality Assurance (QA) and Performance Improvement (PI).
– QA focuses on standards for quality of service and outcomes, and a process throughout the organization for assuring that care is maintained at acceptable levels in relation to those standards.
– PI (also called Quality Improvement - QI)
• is the continuous study and improvement of processes with the intent to better services or outcomes,
• prevent or decrease the likelihood of problems,
• identify areas of opportunity,
• test new approaches to fix underlying causes of problems or barriers to improvement.
7/27/2016
2
Why Do We Do QAPI?
§ 418.58: Condition of Participation, added in 2008
The hospice must develop, implement, and maintain an
effective, ongoing, hospice-wide data-drive QAPI program. The
hospice’s governing body must ensure that the program: reflects
the complexity of its organization and services; involves all
hospice services (including those under contract or
arrangement); focuses on indicators related to improved
palliative outcomes; and takes action to demonstrate
improvement in hospice performance. The hospice must
maintain documentary evidence of its QAPI program and be able
to demonstrate its operation to CMS.
The 5 Elements of QAPI
Design and Scope(a) Standard: Program scope
• Show measurable improvement in indicators related
to improved palliative outcomes and hospice services
• Must measure, analyze, and track quality indicators,
including adverse patient events, in order to assess
care, services, and operations

7/27/2016
3
Feedback, Data Systems, and
Monitoring(b) Standard: Program data
Must utilize quality indicators in the design of its
program
Must use data collected to monitor service effectiveness
and safety and identify opportunities and priorities for
improvement
Frequency and detail of the data collection must be
approved by the hospice’s governing body
Systemic Analysis and
Systemic Action(c) Standard: Program activities
• The hospice’s performance improvement activities must:• Focus on high risk, high volume, problem prone areas• Consider evidence, prevalence, and severity of problems in
those areas • Affect palliative outcomes, patient safety and quality of care
• The hospice’s performance improvement activities must:
• Track adverse patient events, analyze their causes and
implement preventive actions
• Take action aimed at performance improvement
• Measure/track success of action to ensure that
improvements are sustained
Performance Improvement
Projects (PIPs)(d) Standard: Performance Improvement Projects (PIPs)
• Hospices must develop and document PIPs
• The number and scope of PIPs conducted annually must
be based on the hospice’s needs, scope, complexity, and
past performance
• The documentation must include what PIPs are being
conducted, the reasons, and the measurable progress.

7/27/2016
4
Governance and Leadership(e) Standard: Executive responsibilities
Governing body ensures:
• That an ongoing program for QI and patient safety is
defined, implemented, and maintained, and is evaluated
annually.
• The QAPI efforts address quality of care and patient safety,
and all improvement actions are evaluated for
effectiveness.
• That one or more individual(s) is designated to lead QAPI
efforts.
What is QAPI Really About?
QAPI represents a continuous process of
doing business with the expectation of
achieving optimum results by involving
all levels of the organization.
Performance Improvement Projects
(PIPs)Should contain:
• A description of the activities to be conducted
• The frequency of activities
• Person/s designated to conduct the activities
• Methods of data collection
• Acceptable limits for findings / threshold
• Plans to re-evaluate if findings fail to meet acceptable limits
• Any other activities required under state or federal laws or regulations

7/27/2016
5
PIPs• PIPs are identified areas in which improvement can be
made, specifically: high risk, high volume, and problem
prone.
(Area of improvement: costs/service/staffing)
• Involve various team members that will be directly
impacted by the change.
(Encourage honest feedback with respect to opinion
differences)
• Record and acknowledge outcomes to use as building
blocks to achieving improvement.
• Respect ‘time’ to not exhaust valuable opportunity.
• Be open to the unexpected happening…..
PIP Action Plan• HPCG utilizes Deming’s PDSA
Cycle.
• The PDSA cycle is a method for
testing change by planning, trying,
observing, and acting on what is
learned. It frequently takes
multiple PDSA cycles to achieve
desired results.
• Prioritize activities by doing PDSA
cycles.
PDSAs
Break the process down in cycles:
• Plan: Predict what will happen with the change.
(who, what, when, why, data to be collected)
• Do: Test the change on a small scale.
(Document any problems and unexpected observations.)
• Study: Compare the data to your predictions.
(Summarize what was learned, good/bad.)
• Act: Make changes, based on what was learned from
test.

7/27/2016
6
Maintaining Focus (Plan)• A key step to the planning process is establishing an Aim
Statement.
• An Aim Statement is an clear description of a team's desired
outcomes, which are expressed in a measurable and time-
specific way. It answers the question: What are we trying to
accomplish?
• Establishing an Aim is important to keep the focus.
Testing the Change (Do)Why test change before implementing it?
• It involves less time, money and risk
• Is a powerful tool for learning; from both ideas that work and
those that don't
• It is safer and less disruptive for patients and staff
• Getting people involved during the testing and developing
phase can result in less resistance at implementation
Analysis of Process (Study)
Based on the AIM statement and data gathered determine if:
•The plan resulted in an improvement? By how much/little?
•Was the action worth the investment?
•Do you see trends?
•Were there unintended side effects?

7/27/2016
7
Implementation (Act)
Standardize the improvement and begin to use it regularly
OR
Develop a new and different plan that might result in success.
What is HPCG’s ED PIP About?
Finding ways to ensure the patient
receives the right care to meet their
needs, and reduce the number of
unnecessary ED visits and
transportation costs.
What Was the Problem/Need?• High costs of transportation
• High costs of ED visits
• Many of the patients going to the hospital have goals that indicate they don’t want further hospitalizations
• HPCG tracking hospitalizations since 2011 (already had a lot of data)
• ED PIP formed in October of 2014 to address these issues

7/27/2016
8
PIP Members• Quality & Compliance
• Finance
• Clinical Staff
• Inpatient facility
• On-call
• Home Care
• Long-term Care (LTC)
• MD
• RN
• Social Worker
• Aide
What Were the Numbers?
October 2013-September 2014
• # of patients who went to ED: 320
• # of ED visits: 457 (199 were not admitted)
(4.18 visits per 1000 days)
Oct 2013-April 2014
• Transport costs: $109,736.47
($1,767 per 1000 days)
Time of Day ED Visits2014-2015

7/27/2016
9
On-Call ED Visit Hours2014-2015
Reasons for ED Visits2014-2015
Symptom Management ED Visits2014-2015
7/27/2016
10
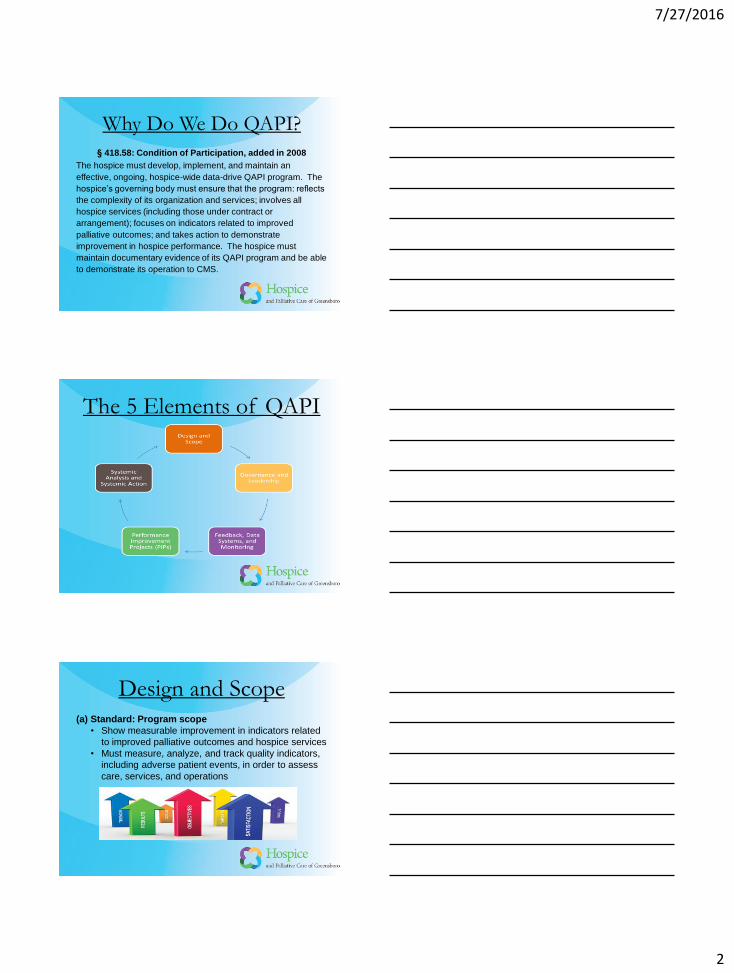
Top 3 Diagnoses of HPCG
Patients Using ED
Heart/CHF/Cardiac
Alzheimer's/Dementia
COPD/Respiratory
2014-2015
Who Sent Patient to Hospital
Patient/Family57%
Facility18%
MD Office15%
HPCG8%
Unknown2%
2014-2015
Disposition
Home (Facility or Residence)
69%
Beacon Place (Inpatient Facility)
8%
Died14%
Other9%
2014-2015

7/27/2016
11
Other Things to Consider
• A higher percentage of full or limited codes go to the hospital (8% of HPCG hospice patients are full/limited codes vs. 22% of HPCG hospitalized patients).
• There is a seasonal effect – fall and spring have more admissions than winter and summer.
• HPCG’s average length of stay continues to decrease over time.
• Falls are a big issue for Long Term Care patients.
• On average, there is <1 day contact between HPCG visit and ED visit.
• There are a number of patients that have repeat hospitalizations (“frequent flyers”)
ED PIP AIM“To Reduce Emergency
Department Visits by 10% per
patients served in a 3 month
time span.”
Timeline of ActivitiesOctober 2014
• 1st ED PIP meeting
November 2014
• Gathered feedback and increased awareness with staff
January 2015
• Met with Guilford County EMS to discuss collaboration
March 2015
• Implemented "Personal Emergency Plan form" usage in home setting
April 2015
• Piloted "Personal Emergency Plan" form in Assisted Living Facility (HG) (start date 5/1/15)
May 2015
• Surveyed facilities to get feedback on improving collaboration and communication
July 2015
• Presented at team meetings the change results to increase awareness and sustain change.
August 2015
• Met with Guilford County EMS to continue discussion of collaboration
September 2015
• Put HPCG stickers on DNR and MOST forms to help EMS identify as our patient

7/27/2016
12
Timeline of ActivitiesOctober 2015
• Met with staff at AL Facility (CH) to begin piloted "Personal Emergency Plan" forms (start date 11/1/15)
• EMS shadowed Admission Nurse to get a better understanding of our process.
November 2015
• HPCG Counselors attended EMS trainings to educate staff about hospice
January 2016
• Paramedic attended clinical staff meeting to educate about EMS
February 2016
• Sharing “frequent flyer” information with Cone Health (hospital)
April 2016
• Met with LTC to discuss including more facilities in pilots
June 2016
• Identification of LTC facilities / staff to expand program
Example of
My Personal Emergency Plan Form
Label on DNR/MOST Forms
7/27/2016
13
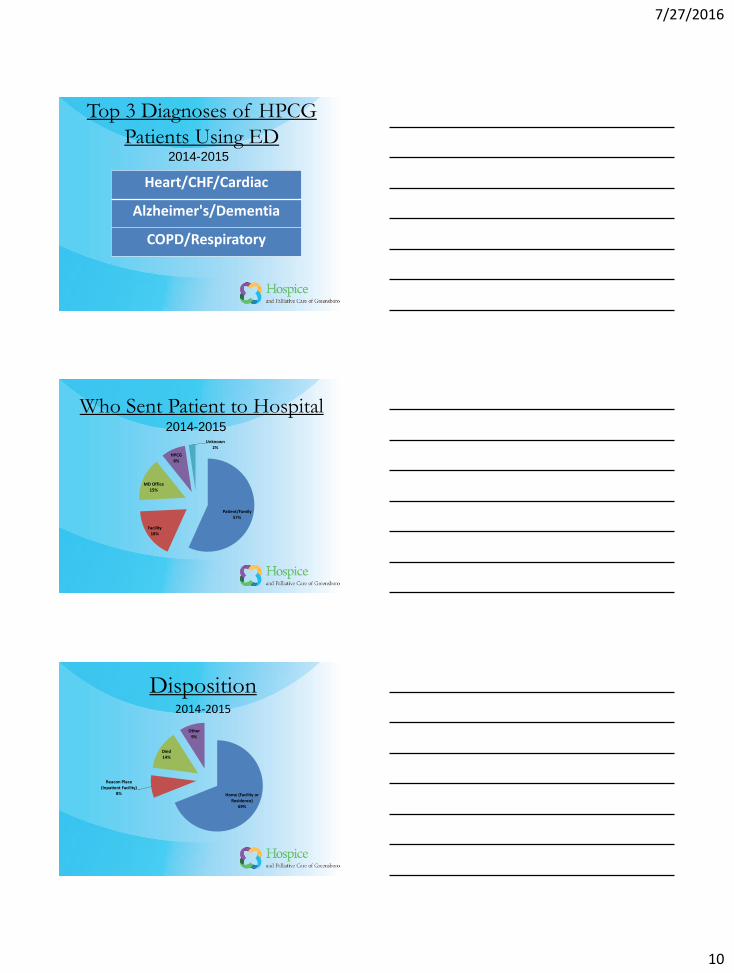
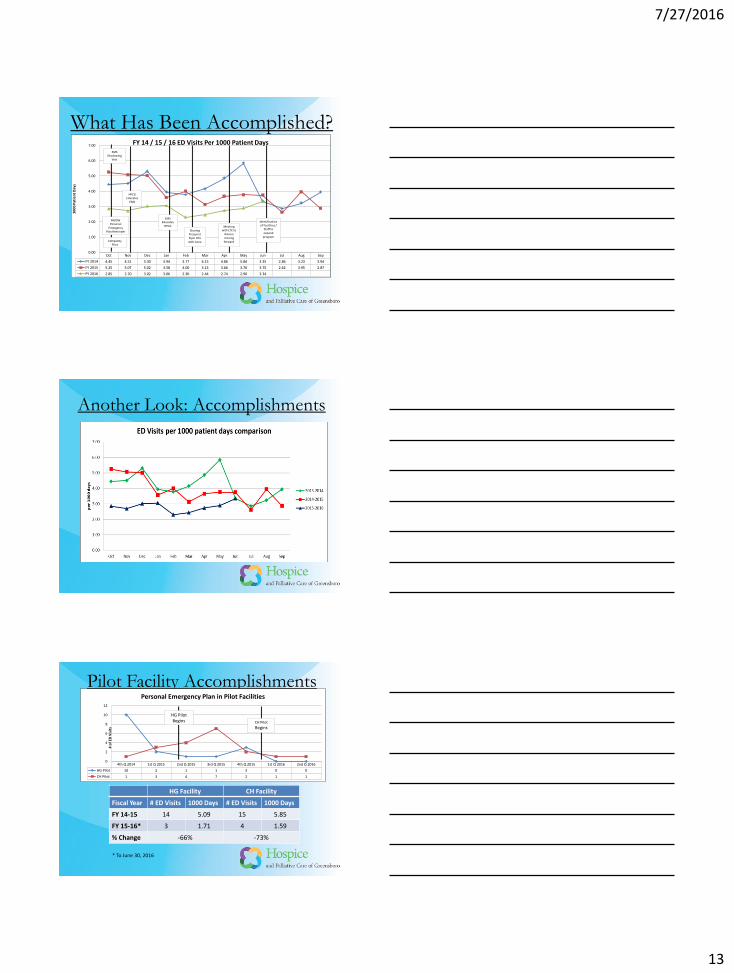
What Has Been Accomplished?
Oct Nov Dec Jan Feb Mar Apr May Jun Jul Aug Sep
FY 2014 4.45 4.51 5.30 3.94 3.77 4.15 4.86 5.84 3.35 2.86 3.23 3.94
FY 2015 5.25 5.07 5.02 3.58 4.00 3.13 3.66 3.76 3.75 2.62 3.95 2.87
FY 2016 2.85 2.70 3.02 3.06 2.30 2.44 2.74 2.90 3.34
0.00
1.00
2.00
3.00
4.00
5.00
6.00
7.00
10
00
Pat
ien
t D
ays
FY 14 / 15 / 16 ED Visits Per 1000 Patient Days
RN/SW Personal
Emergency Plan Reminder
CH Facility Pilot
EMS Shadowing
Visit
HPCG Educates
EMS
EMS Educates
HPCG
Sharing Frequent Flyer Info with Cone
Meeting with LTC to
discuss moving forward
Identification of Facilities /
Staff to expand
program
Another Look: Accomplishments
Pilot Facility Accomplishments
4th Q 2014 1st Q 2015 2nd Q 2015 3rd Q 2015 4th Q 2015 1st Q 2016 2nd Q 2016
HG Pilot 10 2 1 1 3 0 0
CH Pilot 1 3 4 7 2 1 1
0
2
4
6
8
10
12
# o
f ED
Vis
its
Personal Emergency Plan in Pilot Facilities
HG Pilot Begins CH Pilot
Begins
HG Facility CH Facility
Fiscal Year # ED Visits 1000 Days # ED Visits 1000 Days
FY 14-15 14 5.09 15 5.85
FY 15-16* 3 1.71 4 1.59
% Change -66% -73%
* To June 30, 2016

7/27/2016
14
What are the Numbers Now?The 15/16 FY thus far has resulted in a 27% decrease from
the 14/15 FY and a 33% decrease from FY 13/14.
Fiscal YearED
Visits
Visits per 1000 patient
days
Patients using ED
% Change from Previous Year
10/15 – 6/16* 242 2.82 209 -27%
10/14-9/15 460 3.88 291 -7%
10/13-9/14 457 4.18 320 NA
Transportation Cost per 1000 patient daysJan 2016-May 2016 $1,513.50
June 2015-December 2015 $1,699.61Jan 2015-May 2015 $2,293.35
* Only 9 months of data
Did We Meet Our AIM?AIM: “To Reduce Emergency Department Visits by 10% per
patients served in a 3 month time span.” Some considerations:
• While the PIP began in October, our first intervention was in
late November, so the earliest the PIP would have an impact
would be December 2014
• Thus, we compared January 2015 – March 2015 to the same
3 months the year before using the old metric, per patients
served, and calculated a 12% decrease, thus meeting our AIM
January – March 2014 January – March 2015
8.7% per patients served 7.6% per patients served
12% decrease
Other ConsiderationsIn studying the data, we also found some correlation between
Personal Emergency Plan Completion Rates and ED rates as
follows:
-60.0%
-40.0%
-20.0%
0.0%
20.0%
40.0%
60.0%
80.0%
100.0%
120.0%
Pe
rce
nta
ge
Month
PEP Completion Compared to ED Rates
% Change from Previous FY PEP Completion Rate

7/27/2016
15
What is Next?• Partnering with Guilford County EMS on coordinating
care for HPCG patients that call 911.
• Implementing Personal Emergency Plans in Assisted
Living facilities and possibly Skilled Nursing Facilities.
• Continuing to educate staff about ED PIP and the
effectiveness of the Personal Emergency Plan.
• Updating our AIM statement.
Sustaining the Change• There is a correlational relationship between reducing
patient ED visits and transportation costs.
• Continuous education is imperative to maintaining staff
involvement and their understanding of the need to
make changes.
• Highlighting the different outcomes of each small
change (numerous PDSA cycles) improves awareness
and new opportunities.
• Encouraging improved care coordination with outside
agencies (EMS and Long Term Care Facilities) will
improve quality of life outcomes for HPCG patients.
Questions?