Embed Size (px)
Citation preview

Understanding CDMA Measurements for Base Stations and Their Components
Application Note 1311
application
C D M A S o l u t i o n sW i r e l e s s

Introduction . . . . . . . . . . . . . . . . . . . . . . . . . . . . . . . . . . . . . . . . . . . . . . 3
1. Testing CDMA Base Stations and Their Components. . . . . . . 4
Where do tests come from? . . . . . . . . . . . . . . . . . . . . . . . . . . 4Test phases . . . . . . . . . . . . . . . . . . . . . . . . . . . . . . . . . . . . . . . 5Testing challenges and issues . . . . . . . . . . . . . . . . . . . . . . . . . 7
2. Test Configurations. . . . . . . . . . . . . . . . . . . . . . . . . . . . . . . . . . 8
Test sets . . . . . . . . . . . . . . . . . . . . . . . . . . . . . . . . . . . . . . . . . . 8Distributed test elements . . . . . . . . . . . . . . . . . . . . . . . . . . . . 9
CDMA signal generator . . . . . . . . . . . . . . . . . . . . . . . . . . . 9Signal analyzer . . . . . . . . . . . . . . . . . . . . . . . . . . . . . . . . . 10
Which configuration to use . . . . . . . . . . . . . . . . . . . . . . . . . . 10
3. RF Parametric Measurements in CDMA . . . . . . . . . . . . . . . . 11
Transmitter . . . . . . . . . . . . . . . . . . . . . . . . . . . . . . . . . . . . . . 11In-channel measurements . . . . . . . . . . . . . . . . . . . . . . . . 12
Channel power . . . . . . . . . . . . . . . . . . . . . . . . . . . . . . . 12Swept-frequency method . . . . . . . . . . . . . . . . . . . . 13FFT method. . . . . . . . . . . . . . . . . . . . . . . . . . . . . . . 14
Occupied bandwidth . . . . . . . . . . . . . . . . . . . . . . . . . . 15Modulation quality . . . . . . . . . . . . . . . . . . . . . . . . . . . 15
Rho . . . . . . . . . . . . . . . . . . . . . . . . . . . . . . . . . . . . . . 15Frequency error . . . . . . . . . . . . . . . . . . . . . . . . . . . 16Time offset . . . . . . . . . . . . . . . . . . . . . . . . . . . . . . . . 17Carrier feedthrough. . . . . . . . . . . . . . . . . . . . . . . . . 18
Code-domain analysis . . . . . . . . . . . . . . . . . . . . . . . . . 19Code-domain power . . . . . . . . . . . . . . . . . . . . . . . . 19Code-domain timing . . . . . . . . . . . . . . . . . . . . . . . . 22Code-domain phase. . . . . . . . . . . . . . . . . . . . . . . . . 22
In-band/out-of-channel measurements. . . . . . . . . . . . . . 24In-band spurious emissions. . . . . . . . . . . . . . . . . . . . . 24Adjacent Channel Power Ratio . . . . . . . . . . . . . . . . . . 25
Out-of-band measurements. . . . . . . . . . . . . . . . . . . . . . . 27Harmonics . . . . . . . . . . . . . . . . . . . . . . . . . . . . . . . . . . 27Out-of-band spurious, nonharmonic. . . . . . . . . . . . . . 28
Receiver . . . . . . . . . . . . . . . . . . . . . . . . . . . . . . . . . . . . . . . . . 29Metrics . . . . . . . . . . . . . . . . . . . . . . . . . . . . . . . . . . . . . . . 30
FER. . . . . . . . . . . . . . . . . . . . . . . . . . . . . . . . . . . . . . . . 30Eb/No . . . . . . . . . . . . . . . . . . . . . . . . . . . . . . . . . . . . . . 30
Measurements . . . . . . . . . . . . . . . . . . . . . . . . . . . . . . . . . 31Sensitivity. . . . . . . . . . . . . . . . . . . . . . . . . . . . . . . . . . . 31Dynamic range . . . . . . . . . . . . . . . . . . . . . . . . . . . . . . . 31Spurious immunity . . . . . . . . . . . . . . . . . . . . . . . . . . . 32Performance in AWGN . . . . . . . . . . . . . . . . . . . . . . . . 32Performance in multipath fading environment . . . . . 34
4. Summary. . . . . . . . . . . . . . . . . . . . . . . . . . . . . . . . . . . . . . . . . . 35
5. References . . . . . . . . . . . . . . . . . . . . . . . . . . . . . . . . . . . . . . . . 35
Related literature . . . . . . . . . . . . . . . . . . . . . . . . . . . . . . . . . 36
2
Table of Contents

This application note presents thefundamental measurement principlesfor the RF parametric tests performedon Code Division Multiple Access(CDMA) base stations and their components. It primarily focuses onselected tests specified for the IS-95-based systems, although other testscommonly made in the industry arealso covered. While these measure-ments are made in most phases ofthe product lifecycle, the emphasis ison those tests made in manufacturingand product development/design ver-ification. Mobiles are not coveredbecause they have unique testingchallenges.
The CDMA industry is growing rapid-ly throughout the world. The numberof CDMA base stations is expected to triple in the next 3–5 years. For avariety of technical, economic andeven political reasons, base stationsare becoming smaller, using lesspower, costing less, covering a smallerarea and providing higher capacitythan ever before.
In the product development area,designers must be aware of newtechnology trends and have in-depthknowledge of the advantages and disadvantages. Some examples oftechnology trends include:
• the use of multi-carrier linear power amplifiers for wider band-width and lower distortion
• higher-performance DAC/ADCs for increased flexibility and lower cost
• higher integration of componentsfor smaller footprint, size, weight and power
• less expensive memory • improved DSP algorithms with
dedicated chipsets • a doubling of microprocessing
capacity every two years
In manufacturing there is a completelydifferent set of issues. Manufacturingengineers are faced with needs such as:
• decreasing time-to-volume• reducing costs • increasing production flexibility
using multiple-format lines • increasing asset utilization and
re-use• exceeding quality thresholds • maintaining high test-equipment
uptime • providing coordinated global
support of all virtual manu-facturing lines
With all of these challenges facingmanufacturing and product develop-ment engineers and managers, thereis little time to study industry stan-dards for a thorough understandingof the tests they specify. This appli-cation note provides the fundamentalinformation you need to feel confidentthat you are making the measure-ments correctly.
The complexities of the IS-95-basedCDMA system have created the need for highly specialized testequipment, unique measurementsand new ways of using traditionaltests and measurement techniques.The particular characteristics ofCDMA signals also require that measurements be interpreted withCDMA properties in mind. Below you will find descriptions of the mostcommon measurements made inCDMA, along with measurementresults obtained with Hewlett-Packard test equipment.
Note: it is assumed that the reader has abasic understanding of CDMA technology(see reference #1 for CDMA basics).
3
Introduction

The definitions and methods of measurement for the tests made onCDMA base stations and their com-ponents come from several sources.Key sources are the industry stan-dards developed by standards-settingorganizations.
In the U.S., the initial standards werethe Telecommunications IndustryAssociation/ Electronic IndustryAssociation (TIA/EIA) InterimStandard 95 (IS-95) and related versions for base station and mobileperformance (IS-97 and IS-98,respectively). These defined theCDMA system at cellular frequencies.Newer standards from ANSI(American National StandardsInstitute) defined performance forPCS systems (ANSI-J STD-008). The PCS standard differs from IS-95 primarily in the frequency plan andin call processing related to mobilestation identity, such as call origina-tion and paging. The basic signalstructure (message formats, codingand modulation) are identical.
The Telecommunications IndustryAssociation adopted IS-97, which isspecific to base station tests, in Julyof 1994. The first revision, IS-97A,was released in July, 1996 andincludes changes relating to the 14.4 kb/s vocoder. The latest revision,IS-97B, to be released in 1998, com-bines the cellular and PCS perfor-mance tests. The tests described inIS-97 are used to ensure interoper-ability of the system with equipmentfrom different manufacturers. Testsmade on components are typicallydefined (in terms of method andspecifications) by the network equip-ment manufacturers (NEMs) and can differ dramatically.
This application note describes RF parametric measurements in theIS-97A standard, as well as additionaltests typically done on components.Although there are other standardsused throughout the world (forexample, ARIB in Japan), they havesimilar tests. Test set-ups andrequired equipment are discussed in Section 2. In addition to the measurement results, test challengesunique to CDMA are discussedthroughout.
4
1. Testing CDMABase Stations andTheir Components
Where do tests come from?
• TIA/EIA/IS-95A (Air Interface)• TIA/EIA/IS-97A (Base Station)• TIA/EIA/IS-98A (Mobile)
• ANSI-J STD-008 (IS-95 equivalent)• ANSI-J STD-019 (was TIA PN-3383—IS-97 equivalent)• ANSI-J STD-018 (was TIA PN-3385—IS-98 equivalent)
800MHz
Band
1900MHz
Band
Figure 1.Recommended
minimum performance standards for
CDMA.

We can divide base station testinginto four different phases, with eachlevel of testing a subset of the priorlevels. The test needs vary depend-ing on the particular level of testing.
In the early stages, when the equip-ment is being designed, rigorous test-ing is done to make sure the designsare robust and that any NEM’s basestation equipment will be compatiblewith any mobile. These most rigoroustests are called conformance tests,and are usually done in productdevelopment and design verification.The conformance tests typicallyinclude all the tests in IS-97A as well as other testing deemed necessary bythe equipment manufacturer. Thepurpose of conformance testing is toverify that the design conforms to thestandard, thereby ensuring interop-erability of the system with equip-ment from different manufacturers.
The next level in the test model ismanufacturing. The goal here is toensure that each system built match-es the original design’s specified per-formance. Once the designs moveinto production, all of the confor-mance tests may not be performed.Some tests are very time-consumingand are not done in the high-throughput world of manufacturing.Rather, testing is structured toensure the equipment is fully work-ing and to provide information usefulin controlling the manufacturingprocess.
System deployment is the next level in the test lifecycle. At thispoint, the base station is at a cell site and is connected to auxiliaryequipment such as the antennas, thebattery backup power supply and thetest couplers. At system deploymenttime, the focus is on installing thesite equipment and commissioningthe new sites. Testing ensures successful installation of the basestation and operation with the rest of the system.
The last level of testing base stationsis network operation. Once the sys-tems are turned on, service providershave to maintain and optimize thenetworks. Whenever possible, thistesting is performed while the basestation is operational, and includestroubleshooting.
5
Test phases
Figure 2.Base station test phases.

Component testing places the high-est demands on test equipment andmeasurement technique.Componentsinclude the preamplifier, combiner,high-power amplifier, and transmitterand receiver blocks. The measure-ments include several tests specifiedin IS-97A, with a required perfor-mance level higher than that of thesystem. Additional measurementsnot included in the standard are alsoperformed. For example, the distor-tion performance of an amplifier ismuch better quantified with a mea-surement of Adjacent Channel PowerRatio (ACPR), than with the spuriousemissions test described in IS-97A.
Although the focus for this applica-tion note is on tests performed during manufacturing and designverification for both base station systems and their components,Figure 4 shows if a particular test isalso typically performed at installation(Deployment) or in maintenance(Network Ops). Ultimately, test decisions are made independently bythe equipment manufacturers andthe service providers based upon theimportance of the test to system performance and the complexity ofthe test.
6
TRANSMITTERIn-channel
PowerChannel
SpectrumOccupied bandwidth
Modulation qualityRhoFrequency errorTiming offsetCarrier feedthrough
Code-domain analysisCode-domain powerCode-domain timing & phase
In-band, out-of-channelSpuriousACPR
Out-of-bandHarmonicsSpurious
RECEIVERSensitivitySelectivityDynamic rangePerf. in AWGNPerf. in multipath fading
Design
Deployment
Manufacturing
Network
Ops
Design
Manufacturing
•
•
••••
••
•
••
•••••
•
•
••••
••
•
••
••••
•
•
••••
••
•
••
•••
•
•
••••
••
•
•
•
•
•
•
BASE STATIONS COMPONENTSFigure 4.Examples of tests done ateach phase.
Phase
R & D
Manufacturing
Testing Performed
Design andconformance tests
Production tests
Components
DecreasingRigor
Figure 3.Base station componenttest phases.

CDMA is very different from othercommunication systems. CDMA putsseveral users on one frequency chan-nel, but different code channels. Thedata rate varies with voice activity(digital speech interpolation). Thedata is spread with error-correctingcodes to a chip rate of 1.2288 MHz.Also, the environment in whichCDMA operates is interference limit-ed. Only a few percent of the energyat the receive antenna port is thedesired signal for any one channel.The rest is the combined interfer-ence of other users and the back-ground noise. (For more detail, seereference #1, Concepts of CDMA.)
These conditions lead to unique testing methods and measurements.For example, we need to simulatethe interference environment justdescribed. Another challenge is simu-lating the in-channel CDMA signalitself. It has been found that differentstimulus signals (depending upontheir peak-to-average ratio) willstress units under test (UUTs) differ-ently, and therefore produce differ-ent measurement results. (For a moredetailed discussion on this topic, see“Adjacent Channel Power Ratio” inSection 3.) Another key difference intesting CDMA systems is that, sincethe signal is noise-like in nature, the testing must use statistical methods.For example, a typical receiver testspecifies that the receiver mustachieve better than 1% Frame ErrorRate (FER) with 95% confidenceunder certain test conditions.
CDMA also has unique timing issues.In order for any direct-sequencespread-spectrum radio system tooperate, all mobiles and base stationsmust be precisely synchronized. Ifthey are not synchronized, it becomesnearly impossible to recover thecodes used to identify individualradio signals. In the IS-95 system,
synchronization is based on theGlobal Positioning Satellite (GPS)system time. Each CDMA base station incorporates a GPS receiverto provide exact system timinginformation for the cell. The base station sends this information toeach mobile via a dedicated codedchannel. In this manner, all radios inthe system can maintain near-perfectsynchronization.
This precise synchronization may be part of the manufacturing testprocedure. If it is, there will be animpact on the test equipment inter-face. In this case, in addition to a“house frequency standard,” therewill be a “house timing standard,”also called the “even-second clock.”The availability of an even-secondclock to the base station and testequipment speeds up some measurements, reducing test time.Manufacturers must also be able tocontrol the base station for testingpurposes. The interface that controlsthe base station is often NEM propri-etary, which requires the NEMs tohave the programming skill, or towork closely with a test equipmentmanufacturer to provide internalcontrol of the test instruments. Indesign and manufacturing, this backbone control is often done usinga Base Station Control (BSC) simula-tor. In installation and maintenance,where a test set is typically theinstrument of choice, the test set can provide some of this control.
On top of these unique testing challenges and issues, there is theconstant challenge of reducing testtime in a manufacturing facility. Afundamental method for reducingtest time is to increase the speed ofthe measurement. Test equipmentmanufacturers are acutely aware ofthis challenge, and are continuallyimproving measurement speed intheir instruments.
7
Testing challenges and issues

There are two different test configu-rations generally used to test basestations and their components.These are: (1) a “one-box” test set,and (2) a custom combination ofsource, receiver and software(referred to as distributed test ele-ments). In general, test sets are usedin system deployment and networkoperation, whereas distributed testelements are used in manufacturingand design verification. This sectionwill explain the advantages and disadvantages of each configuration.
The shaded area in Figure 5 containsthe elements that typically comprisea test set. Both source and receiverare in the same instrument withenough internal processing power for
the combination to perform a dedicated task. The advantages areconvenience of packaging (every-thing is in one instrument), a singleuser-interface and a single connectioninterface. This type of carry-aroundtest set is ideal for installation/com-missioning and maintenance of a cell site.
The HP 8935 CDMA base station testset is an excellent solution designedto meet the needs of installationteams and service providers doingmaintenance. It features a convenientconnector section to allow out-of-the-way hook up. It also providesportability, a rugged design and auser-friendly interface. (See related literature #1 for more information.)
8
2. TestConfigurations
Source Receiver
SignalCreation
• Baseband• I-Q• IF• RF
SignalAnalysis
• PA• Conv.• Tx• Rx
UUT
• Simulation• Data import• Data export• Control
Computation
• Bits• Baseband• I-Q• IF• RF
Connectivity • HP-IB • LAN • RS-232
Figure 5. Test set versus
distributed test elements.
Test sets

Many manufacturers are adoptingdistributed test elements with soft-ware control in their manufacturingand design verification phases. Whena flexible source and receiver areused, software can be written thatnot only controls the suite of tests,but also provides the protocol neces-sary to communicate with the unitunder test (UUT). Modern manufac-turing facilities, for example, relyheavily on sophisticated ATE(Automated Test Equipment) sys-tems to maximize test efficiency. Inthese test systems, the flexible signalgeneration and analysis componentswork together via test executive software to conduct a full set of measurements that characterize theUUT. By separating the elements, wegain access to all aspects of the testinstrument I/O ports, for completeflexibility and control of the testsuite. Test engineers know exactlywhat is happening to their data andare able to customize the test routinefor a competitive advantage. This configuration, however, requiresmore software development and testing expertise.
CDMA signal generator
CDMA places unique requirementson the signal stimulus used to make measurements. A “real world” CDMAsignal is superficially noise-like, and can exhibit extreme peak-to-averageratio (or crest factor) variability. To properly test base stations and theircomponents, the test signal shouldbe able to provide these same characteristics. This is in addition to providing the correct modulation, filtering and symbol rate for the system. (A noise source is not a goodsimulation of a CDMA signal—see“Adjacent Channel Power Ratio” inSection 3 for more detail.)
When making base station componenttransmitter measurements, it isimportant that the signal generatorbe capable of simulating the forwardlink. To do this, it must generate multiple Walsh codes within the RFchannel bandwidth. Some requiredperformance parameters of the signal generator depend on whether thetest is in-channel or out-of-channel.For in-channel measurements, highwaveform quality is important. Thisensures a spectrally-correct signalwithin the 1.23 MHz channel band-width. For out-of-channel measure-ments, the signal generator musthave excellent adjacent-channel-power performance. It is importantthat the signal generator performancebe much better than the componentperformance so that it doesn't effectthe measurement results.
When making base station receivermeasurements, the signal generatormust be able to simulate the reverselink. This requires that a singleWalsh-coded channel be provided tothe receiver under test. As discussedin Section 3 under “Receiver,” thefigure of merit for receiver tests isFrame Error Rate (FER). MeasuringFER requires that the signal genera-tor also provide known frames ordata streams.
The HP ESG-D series digital signalgenerators offer an excellent sourcefor CDMA base station and base station component testing. Thesesources provide multiple Walsh codegeneration as well as excellent wave-form quality and adjacent-channel-power performance. (See related literature #2 for more information.)
9
Distributed test elements

Which configuration
to use
Signal analyzer
The CDMA signal also challenges an analyzer’s ability to measure the signal correctly and accurately. Thenature of the challenge dependsupon the type of architecture used inthe analyzer. There are currently two distinct architectures: (1) swept-frequency spectrum analyzers, and(2) FFT-based vector signal analyzers(VSAs). Although there are specificadvantages for each, they are startingto merge, providing more advantagesin one instrument. The advantages of the different architectures dependon the types of measurements being made.
When making in-channel and adja-cent-channel measurements, a vectorsignal analyzer provides excellentaccuracy for power measurements.When making in-band/out-of-channeland out-of-band measurements, aswept spectrum analyzer providesexcellent dynamic range for measur-ing harmonics and spurious emissions.
Much of the vector signal analyzerarchitecture is implemented digitallyusing Digital Signal Processing(DSP). DSP provides demodulationcapabilities for modulation quality
measurements such as code-domainpower and rho. Vector signal analyz-ers digitize an IF signal, not its ampli-tude envelope, and thus can computephase as well as amplitude with theFFT (Fast Fourier Transform)process.
Traditional swept spectrum analyzersmeasure only the amplitude of a signal, so we can refer to them as“scalar” analyzers. They have severalfrequency conversion stages, whichresults in very good dynamic range.These conversion stages do, however,introduce loss and uncertainties.Also, this type of analyzer typicallyemploys a logarithmic amplifier, and analog detection that requiresspecial settings when making powermeasurements. This is discussed inmore detail under “Channel power”in Section 3.
The recommended vector signal ana-lyzer is the HP VSA series transmittertester, which provides very fast,focused measurements for CDMAtesting. The HP spectrum analyzersof choice for out-of-band measure-ments include the HP 8590 E-serieswith HP 85725C CDMA measurementpersonality, or the higher-performanceHP 8560 E-series. (See related literature #’s 3, 4, 5, and 6 for moreinformation.)
Since most CDMA systems utilize a proprietary interface, the use ofdistributed test elements with specificNEM software for control has becomethe more common configuration indesign and manufacturing. Therefore,this application note focuses on theuse of distributed test elements. Ingeneral, test sets are used duringinstallation and maintenance becauseof their portability and ease-of-use,whereas distributed test elementsare best suited for design and mostmanufacturing environments.
10

As in the IS-95 standard, the RFparametric measurements describedin this section are divided into twoareas: those that characterize trans-mitter performance, and those thatcharacterize receiver performance.
The transmitter tests are brokendown into the different frequencyranges of interest. The basic transmitter tests are done on the signal intentionally sent to the transmitting antenna; these arecalled the in-channel measurements.These tests verify performance within the 1.23 MHz channel band-width. In-band/out-of-channel measurements verify performancewithin the system band, but outsideof the actual transmitting channelbandwidth; that is, these tests verifyhow the transmitting channel isaffecting adjacent channels. Andfinally, out-of-band measurementscharacterize the performance outsidethe system band in order to verifyminimal interference with other communication systems.
The test setup for base-station transmitter tests is shown in Figure 6.Access to the even-second clock andfrequency reference (base stationtimebase) is only required for thetime offset measurement (one of themodulation quality tests). However,somewhat faster rho measurementscan be made when there is this connection to the base station even-second clock signal.
When measuring channel power,occupied bandwidth and AdjacentChannel Power Ratio (ACPR) ofcomponents, a signal generator isrequired to provide the CDMA signal.Figure 7 shows a typical test setupfor component testing.
11
3. RF ParametricMeasurements inCDMA
Transmitter
Even-second Clock
Frequency RefSignal
Analysis
Base StationUnder Test
Tx
Figure 6.Transmitter test setup.
Even-second Clock
Frequency Ref
SignalGenerator
SignalAnalysis
ComponentUnder TestSignal In Tx Out
Figure 7.Component
test setup.

In-channel measurements
The main types of in-channel testsperformed in design and manufac-turing are:
• Channel power• Occupied bandwidth• Modulation quality (rho)• Code-domain analysis
The test instruments of choice are:(1) a signal generator with excellentwaveform quality and multipleWalsh-code channel capability, and(2) a vector signal analyzer withexcellent in-channel accuracy anddigital demodulation capability.
Channel power. CDMAtransmissions have a very high andvariable ratio of peak power to aver-age power, also known as the crestfactor. The CDMA signal from a sin-gle frequency assignment can have acrest factor in excess of 12 dB. Thismeans that a CDMA transmittercapable of 8 watts average powermust be capable of handling peak val-ues in excess of 126 watts withoutclipping or distortion. This crest fac-tor presents challenges to both thedesigners of RF signal processingcomponents such as power ampli-fiers, as well as to those who mustmake accurate measurements of power.
Traditional peak-responding powermeters that work quite well for mea-suring CW and FM signals (used inAMPS cellular networks) will notread the CDMA signal accurately. Infact, they will report higher powerthan is actually being transmitted.Average-power devices such asbroadband power meters respond toall signals present at the measure-ment input. They are highly accuratefor measuring channel power onlywhen a single signal is present. The
wide bandwidth of broadband measurements also limits them torelatively high signal levels.
Using a vector signal analyzer tomeasure power not only reduces thecomplexity of the test setup, but alsoavoids some of the limitations of apower meter. In a vector signal ana-lyzer, the power is band-limited tothe width of a single CDMA frequen-cy assignment. This limiting of thebandwidth is done using digital filter-ing techniques. In the case of CDMAsignals, the bandpass filter has abandwidth of 1.23 MHz. The channelpower measurement also offers read-ings of lower signal levels than couldbe measured with average powertechniques because of the wideramplitude measurement range(down to –70 dBm). Typical mea-surement accuracy for channelpower measurements is on the orderof ±0.5 to ±1 dB, depending upon thetype of signal analyzer used.
The measurement methods used forthe two signal analyzer architecturesdescribed in Section 2 are: (1) theswept-frequency method used by thespectrum analyzer, and (2) the FastFourier Transform (FFT) methodused by the vector signal analyzer.
12

Swept-frequency method.
Measurements are performed in thefrequency domain using a spectrumanalyzer. After the analyzer is set up properly, the power versus frequency curve is integrated overthe precise bandwidth and the poweris calculated.
Measuring the power in a CDMA signal on a spectrum analyzerinvolves several measurement considerations. Traditional spectrumanalyzers were designed to measureCW signals with known and pre-dictable amplitude distributions.However, a CDMA signal is noise-like,with a varying amplitude distributionthat depends upon the combinationsof Walsh-code channels. Therefore, itis important when using a spectrumanalyzer that a few simple rules arefollowed to produce an accurate andrepeatable result:
1. Because CDMA is noise-like, the sample detector should be used. This will ensure that the noise-like voltages of the signal are accurately captured.
2. The resolution bandwidth should be set at approximately 1% of the 1.23 MHz channel bandwidth. This will provide selectivity at the channel edge as well as a lower noise floor, for a more accurate measurement.
3. The video bandwidth must be greater than the resolution bandwidth by three times or more. This allows the noise-like voltages to vary through their full range of values.
If these rules are followed, thedetected voltages can be convertedto power, summed and averagedusing Equation 1 to provide the true absolute power in the CDMAchannel.
One common mistake is narrowingthe video bandwidth so that asmooth trace is seen on the screen.Narrowing the video filter bandwidthaverages the log of the power insidethe resolution bandwidth, ratherthan the power itself. This incorrect-ly filters the CDMA signal and causesa skewed result. (See reference #2for more detail.)
Another common mistake is usingvideo or trace averaging (not thesame as video filtering) to smoothout the trace and improve repeatabil-ity. The video-averaging feature in a spectrum analyzer is designed toaverage the logarithmic values of thetrace elements. This introducesamplitude errors with non-CW signals,where the errors can vary dependingupon the signal characteristics. It istherefore very important that thevideo-averaging feature not be used.This will avoid the classic 2.5 dB error in the measurement result.(See reference #3 for more detail.)To improve repeatability and ensurean accurate test result, true power
13
Where PT = channel power (watts)Bs = channel bandwidth (Hz)Bn= noise equivalent bandwidth (Hz)N = number of measurement cells within
channel limitPi = power in one spectrum analyzer
measurement cell (watts)
Bn N i =1
PT = Bs 1 N Pi ∑
Figure 8. Channel power
measurement usingan HP 8590 E-series
spectrum analyzerwith HP 85725C
CDMA measurementpersonality.
Equation 1.

averaging is needed. This requiresthe ability to average several powermeasurements and is done throughsoftware (either by a downloadableprogram in the spectrum analyzer oron a PC).
A third mistake is using a marker tomeasure the power in a signal dis-played on a spectrum analyzer. Thisis not an accurate method for a CDMAsignal. A spectrum analyzer markerreads the power in its resolutionbandwidth. The power in narrowbandsignals can be read directly from themarker. IS-95 CDMA power, however,is distributed over a 1.23 MHz band-width and therefore requires an integration measurement. While it is possible to correct the markerreading for the ratio of bandwidths,the ripple (about ±2 dB) caused bythe CDMA modulation filter is noteasily taken into account.
FFT method. Signals are captured inthe time domain and converted tothe frequency domain using the FFT.Measurements are then performed inthe frequency domain using a vectorsignal analyzer.
As mentioned in Section 2, vectorsignal analyzers have a differentarchitecture than spectrum analyzers.While spectrum analyzers sweep inthe frequency domain, measuringamplitude versus frequency,
the vector signal analyzer measurestime-domain information and convertsto the frequency domain via the FastFourier Transform. (See reference #3for more information.)
A vector signal analyzer must use therms detector mode when measuringCDMA signals. While viewing the signal in the frequency domain, theuser chooses the FFT window thatwill properly capture the signal ofinterest. A flat-top window is usedfor maximum amplitude accuracy. To provide the true power averagingdiscussed earlier, the signal analyzershould be set to rms averaging. TheCDMA channel power measurementin the HP VSA performs these functions automatically.
Why are power measurements important?
Power is the fundamental para-metric of any communication system. It is critical in defining asystem’s capacity, coverage andsignal quality. Accurate control ofthe transmitted power is crucial to system performance.
In CDMA, for example, one of thefundamental enabling technologiesis power control. Since the limitingfactor for CDMA system capacityis the total interference, control-ling the power of each mobile isessential to achieve maximumcapacity. Power control must befunctioning properly in both forward and reverse directions.The accuracy of the power controlsystem depends greatly on thebase station’s ability to monitorand transmit the proper values ofpower. Consequently, it is veryimportant to accurately measurethe power transmitted by the base station.
14
Figure 9. Channel
power measurementusing an HP VSAseries transmitter
tester.
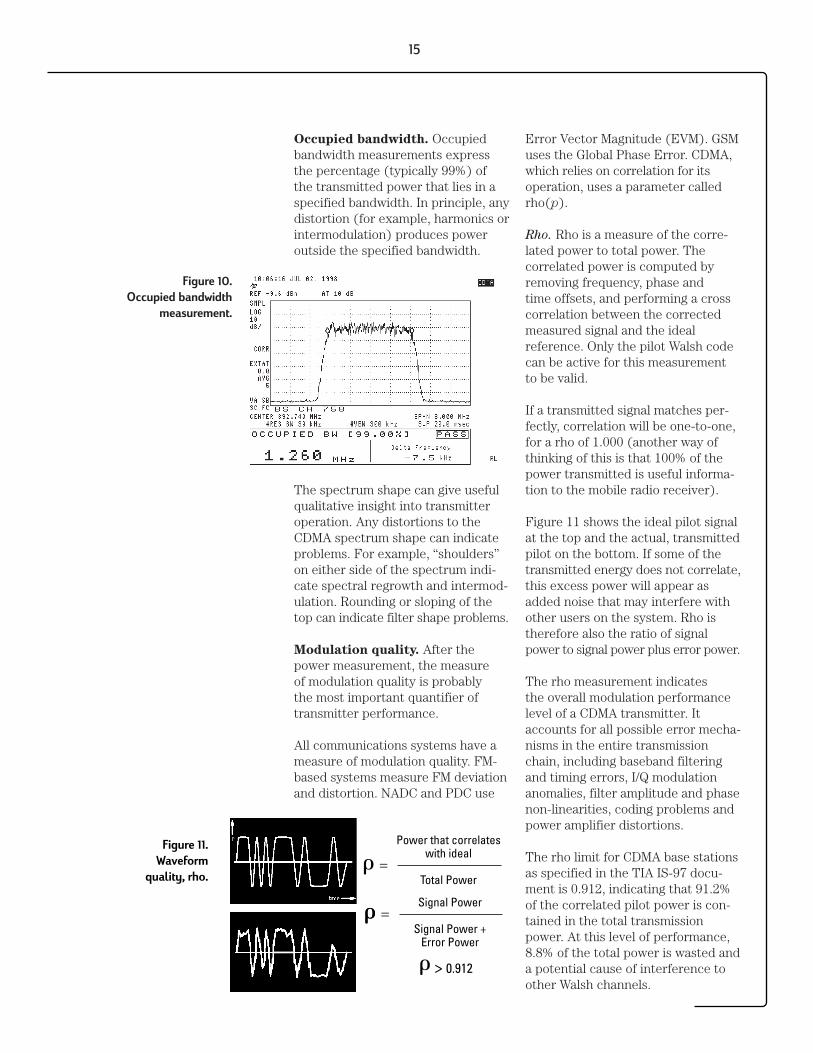
Occupied bandwidth. Occupiedbandwidth measurements expressthe percentage (typically 99%) of the transmitted power that lies in aspecified bandwidth. In principle, anydistortion (for example, harmonics orintermodulation) produces poweroutside the specified bandwidth.
The spectrum shape can give usefulqualitative insight into transmitteroperation. Any distortions to theCDMA spectrum shape can indicateproblems. For example, “shoulders”on either side of the spectrum indi-cate spectral regrowth and intermod-ulation. Rounding or sloping of thetop can indicate filter shape problems.
Modulation quality. After thepower measurement, the measure of modulation quality is probably the most important quantifier oftransmitter performance.
All communications systems have ameasure of modulation quality. FM-based systems measure FM deviationand distortion. NADC and PDC use
Error Vector Magnitude (EVM). GSMuses the Global Phase Error. CDMA,which relies on correlation for itsoperation, uses a parameter calledrho(p).
Rho. Rho is a measure of the corre-lated power to total power. The correlated power is computed byremoving frequency, phase and time offsets, and performing a cross correlation between the correctedmeasured signal and the ideal reference. Only the pilot Walsh codecan be active for this measurementto be valid.
If a transmitted signal matches per-fectly, correlation will be one-to-one,for a rho of 1.000 (another way ofthinking of this is that 100% of thepower transmitted is useful informa-tion to the mobile radio receiver).
Figure 11 shows the ideal pilot signalat the top and the actual, transmittedpilot on the bottom. If some of thetransmitted energy does not correlate,this excess power will appear asadded noise that may interfere withother users on the system. Rho istherefore also the ratio of signalpower to signal power plus error power.
The rho measurement indicates the overall modulation performancelevel of a CDMA transmitter. Itaccounts for all possible error mecha-nisms in the entire transmissionchain, including baseband filteringand timing errors, I/Q modulationanomalies, filter amplitude and phasenon-linearities, coding problems andpower amplifier distortions.
The rho limit for CDMA base stationsas specified in the TIA IS-97 docu-ment is 0.912, indicating that 91.2%of the correlated pilot power is con-tained in the total transmissionpower. At this level of performance,8.8% of the total power is wasted anda potential cause of interference toother Walsh channels.
15
Figure 10. Occupied bandwidth
measurement.
Figure 11. Waveform
quality, rho.
Power that correlateswith ideal
Total Power
Signal Power
Signal Power +Error Power
> 0.912

Why is rho important?
Poor rho performance will affectthe cell’s capacity. This is becausethe uncorrelated power appears as interference to the mobiles. Theadded interference can requirethat the signal on traffic channelsbe raised to overcome the interfer-ence. This in turn may be seen asadditional interference. At somepoint, the site will have to shedcalls in order to supply the remain-ing calls with an adequate signal-to-interference ratio.
Potential causes of poor rho per-formance are:
• Compression in linear amplifiers
• Magnitude and phase errors in the I/Q modulator
• Spurious signals in the transmission channel
• Carrier feedthrough
Frequency error, time offset and carrier feedthrough are often measured in conjunction with rho.These measurements provide insightinto the overall health of the CDMAbase station’s transmitted signal.
Frequency error. As with any communication system, we must be sure that the transmitter is oper-ating on the correct frequency. The problem is verifying this frequency.
Many communications engineers areaccustomed to using frequency coun-ters to accurately measure frequency.A frequency counter, in principle,counts the number of zero crossingsin a signal. CW, constant-envelopesignals or signals with a large carriercan be accurately counted in thisway. Digitally-modulated signals cannot. For example, CDMA signalsare broadband (1.23 MHz) and usepseudo-random sequences, andtherefore resemble band-limited
noise. In this case, the number ofzero crossings is not equal to thecenter frequency. A new measure-ment technique is therefore needed.This technique uses DSP algorithmssuch as those used in signal analyzers.
To ensure that each CDMA transmit-ter is on its frequency and not inter-fering with other CDMA channels,the standards specify very tight frequency error performance, knownas frequency tolerance. In the PCSbands, the specification is ± 0.05parts per million, which translates toonly ± 99 Hz at a carrier frequency of 1980 MHz. In the cellular bands, aCDMA transmitter must be withinabout 40 Hz of absolute frequency (± 0.05 ppm at a carrier frequency of800 MHz).
Why is frequency error important?
If a site loses its reference to GPStime, its reference signals willbegin to drift over time. Mobilesalready using the site can remainon the air because they derivetheir timing from the signals trans-mitted by the base station.However, mobiles using other sitesor sectors may be prevented fromusing the site because they areconfused by the error in frequen-cy. This creates what is known asthe “island cell” effect. By itself,the cell is still functional. To therest of the system, it’s inaccessible.
The island cell effect can becaused by a failure in the site’sGPS receiver or timebase distribu-tion network. To accurately measure the frequency, the testequipment must have access tothe reference frequency from theGPS receiver. Note that theabsolute measurement is only asgood as the reference to which it is compared.
16

Time offset. In CDMA, each sector of each base station site operates onthe same frequency channel, and isdistinguished from the others by a“short code” sequence (also knownas a PN offset). These sequences areapplied to the I and Q signals beforemodulation. The short sequences areoffset in time by 52.08 µs (64 chips)each and they repeat every 26.666ms (32768 chips). This yields 512short sequence codes (32768/64),where each has a unique offset.
The “boundary” where the codesrepeat is fifteen zeros followed by aone. The time offset (also called pilottime tolerance) measurement com-pares the time of the repeat to theoffset from the even-second clock (base station, or GPS time). Forexample, PN 0 should have its repeatoccur exactly on the rising edge ofthe even-second clock. PN 1 shouldhave the repeat occur 52.08 µs afterthe rising edge of the even-secondclock, and so forth (see Figure 12).
Any error in time from that event isreported as a time offset. The CDMAstandards specify a maximum offsetof 10 microseconds, but 3 microsec-onds is a recommended maximum.
When testing time offset, the timingof the even second to GPS must beverified independently. Time offset is reported as part of rho and code-domain measurements (relative tothe even-second clock). This is theonly transmitter test that requiresthe even-second clock signal fromthe base station. Other transmittertests can be performed without thisconnection.
Why is time offset important?
The “island cell” effect can alsooccur if the pilot time tolerancesare out of specifications.
A mobile moving outwards towardthe limit of its cell will need toacquire the adjacent cell in orderto hand off. If the time offset ofthe target cell is too far from thatof the current site, the handoff will not happen.
17
Figure 12.Pilot time tolerance
(time offset).
110... 011...101 000... 000000... 001...111... 010...011... 100...110... 011...101 000... 000PN Offset 2
32768chips
110... 011...101 000... 000000... 001...111... 010...011... 100...110... 011...101 000... 000PN Offset 1
32768chips
110... 011...101 000... 000000... 001...111... 010...011... 100...110... 011...101 000... 000PN Offset 0
32768chips
15 zeros
64 chips 64 chips 64 chips
Even Second

Carrier feedthrough (I/Q origin
offset). Excessive DC offsets in thebase station’s I/Q modulator causehigh levels of carrier feed-through.This results in degraded modulationquality (rho), and is typically reportedas part of the rho measurement. Lowresults indicate a good I/Q modulator,whereas higher values indicatepotential problems. A value ofapproximately –25 dBc or greatertells us that there is a problem withthe I/Q modulator or its input I or Qsignals.
Modulation quality example
This example shows rho, fre-quency error, pilot time offset andcarrier feedthrough for a forwardsignal containing only a pilot(Walsh code 0) channel.
In Figure 13, the display on theleft shows a signal that is wellwithin specifications. The rightdisplay shows a signal whose frequency, pilot time offset andcarrier feedthrough have beendegraded. In this case, the pilottime offset and frequency error donot degrade rho. The entire degra-dation was caused by the carrierfeedthrough.
Using the example from Figure 11,one can calculate the effect of thecarrier feedthrough as follows:
Where:Wideal = power that correlates
with ideal pilot channelWtotal = total power in pilot
channel
In the right graph, the total hasbeen further increased by a carrierfeedthrough of –20.7 dB or0.00851.
As expected, this matches the rhoresult on the right display.
18
Figure 13. Rho degradation
due to carrierfeedthrough.
left = Wideal
= 0.9884Wtotal
right = Wideal = 0.980
Wtotal (1+0.00851)

Code-domain analysis. Before theadvent of the CDMA system, mostanalysis tools used to design, test andrepair cellular telephone systemsoperated in one of two modes: time-domain analysis or frequency-domainanalysis. Familiar time-domain an-alyzers include oscilloscopes, volt-meters and power meters. The mostfamiliar frequency-domain analyzer isthe spectrum analyzer. These toolsare still very useful in working withCDMA. However, because CDMA usesdigital coding to define channels, anew mode, called code-domain analysis, is required.
A typical CDMA base station has anumber of Walsh-coded channelsthat are all active in the same 1.23 MHz bandwidth. These channelsinclude the Pilot Channel (WalshCode 0), Paging Channels (WalshCodes 1 to 7), a Sync Channel (Walshcode 32) and a number of active traffic channels (any of the remain-ing Walsh codes). To analyze such acomposite waveform, a code-domainanalyzer receives the CDMA signaland then decodes each channel usinga Walsh code correlation algorithm.The correlation algorithm searches
the waveform for a high correlationfactor for each Walsh code. Once thechannels are decoded, the analyzerdetermines the relative power ineach Walsh channel relative to thetotal power in the CDMA signal. The result of this measurement is a graphical display of the relativepower in each channel, called a code-domain-power graph (see bottomgraph of Figure 14).
By using this measurement, thehealth of a CDMA transmitter can bequickly determined. This measure-ment allows you to verify that eachWalsh channel is operating at itsproper level, and quantify the inactive traffic noise level.
Code-domain power. On a spectrumanalyzer, you can view the 1.23 MHzforward link channel; it would appearas the envelope of the top graph inFigure 14. Note that the addition of atraffic channel does not change thespectrum shape, only its magnitude.But how much of the total signal, asviewed on the spectrum analyzer, isattributed to each Walsh code? Youcannot tell using frequency-domainanalysis; code-domain analysis isrequired.
Code-domain power measures thefraction of total power transmitted ineach Walsh channel. The contributionof each Walsh channel to the totalsignal is measured and displayed as a bar indicating the relative power inthe channel. A Walsh-code-domainpower display has Walsh codes 0–63displayed horizontally, with thepower in each Walsh code displayedvertically. The measured values forall 64 Walsh codes will add to unity.
The bottom graph of Figure 14 showsa typical display of code-domainpower. Note the contribution to thetotal signal from the pilot, sync andpaging channels. In this example,there are also three users of trafficchannels on the forward link.
19
Figure 14.Code-domain
power.

Note also the noncorrelated data onthe inactive channels. The amount ofpower in the inactive codes indicatesthe amount of excess power beingtransmitted. The 64 Walsh codes areorthogonal, so they do not interferewith each other. All of the power inthe 1.23 MHz bandwidth must appearsomewhere in the 64 possible codes.Any error power will show up aspower in all the other codes, includ-ing the inactive codes. The CDMAstandards require all inactive codesto be at least 27 dB below total chan-nel power. This is a moderately tightspecification considering the wave-form quality specification. Somepower that is uncorrelated to thepilot channel is allowed. It is assumedthat the other code channels willhave similar uncorrelated power. Thesum of all the uncorrelated powerwill create a noise floor in all the codechannels. This is of no consequencefor the active channels, but sets theperformance limit for the inactivechannels.
Another code-domain-power testspecified in the IS-97 standard ispilot power ratio. It is defined as thepower attributed to the pilot channeldivided by the total power, expressedin dB. The specification is the equip-ment manufacturer’s configuredvalue ± 0.5 dB.
Why is code-domain powerimportant?
Walsh codes are the fundamentalchannelization mechanism forCDMA. Measuring code-domainpower is essential for verifying thatthe base station is transmitting the correct power in each of the channels (that is, the power in eachchannel relative to the total powerand relative to the power in each ofthe other channels is correct).
The measurement of code-domainpower is similar to measurementsmade with a spectrum analyzer onAMPS and TDMA systems. With aspectrum analyzer, you are able toview the control channels and traf-fic channels individually. You canquickly check for the presence andthe signal level of any of thesechannels. The code-domain powermeasurement provides comparableinformation for CDMA systems. Itis a quick look at all the channelelements’ contributions for a givenfrequency assignment and PN offset.
Code-domain power is especiallyimportant for the installer and service provider. The absence of apilot or sync channel will renderthe sector useless to mobiles inthat geography. In some cases,providers have been unable todetermine if a pilot signal is on orif only a pilot signal is on; code-domain power shows this instantly.These are insidious failures, asoften the “green lights” at the siteand switch will indicate that nothing is amiss.
It is also important to check thecode-domain power levels of the“inactive” channels. This is powerthat correlates to unused Walshchannels. Excess power in theinactive channels means reducedcapacity for the cell.
20

21
Figure 15. Nonlinearities
in Walsh code domain.
Interpreting code-domain power measurements
Walsh code mixing. Walsh codesshare many properties with sinewaves. One of these properties is that a nonlinear device cancause Walsh codes to mix in aprocess that behaves much likeintermodulation.
The plot on the left in Figure 15shows an IS-95 CDMA forward-linksignal in what is essentially a linearsystem. Walsh codes 0, 1, 17, and32 are active and there is someresidual error that forms the noisefloor.
The plot on the right was obtainedby taking the same signal andfeeding it through an amplifierthat was driven into compression.It can be seen that the noise floorwas degraded in a very specificway. Walsh code 1 was mixed withWalsh codes 17 and 32, causingpower to show up on Walsh codes16 and 33. Walsh code 17 mixedwith 32 to create power on Walshcode 49.
Excessive power on individualinactive Walsh codes is often anindication of nonlinear operation.
Noise. CDMA systems are oftendegraded by noise. We will consid-er an example of a Gaussian noisesource that has a flat power spec-tral density over the 1.23 MHzbandwidth of the CDMA signal,and see how this affects the code-domain.
The PN spreading and de-spreadingused in IS-95 CDMA takes theenergy in the noise interferenceand spreads it equally among allWalsh codes. Therefore, it lookslike white noise in the code-domain(see Figure 16).
To calculate the noise in the code-domain, we use the fact that 1/64thof the noise energy occupies eachWalsh Code.
If we use the fact that = signalpower/(signal power + errorpower), then for the ith Walshcode:
Each active Walsh code containsits allotted power as well as a fraction of error power that isassumed to be equally distributedamong all Walsh codes.
For unused Walsh codes wherethere is no signal power, Wi=0:
∑ (Wi + Wnoise) i =
Wi + Wnoise 64
∑ (Wi + Wnoise) j =
Wnoise
64

In this example, the noise has thesame power as the CDMA signal;therefore the total power (denomi-nator) is twice the power in theinterference.
The value of the average code-domain floor in this case is –21 dB.
All sources of uncorrelated inter-ference behave similarly in thecode-domain. The power of theinterference is spread equally overall Walsh codes, and contributes tothe code-domain noise floor.
The code-domain timing and phasemeasurements are similar to code-domain power, in that they show theperformance of individual Walshchannels.
Code-domain timing. Walsh codesare useful for distinguishing forward-link traffic channels because they areorthogonal and do not interfere witheach other. The orthogonality ofWalsh codes is lost when they are nottime aligned. With the loss of timealignment, one traffic channel caninterfere with others.
Code-domain timing, also known asthe Pilot-to-Walsh-Channel TimeTolerance, measures the time offsetor timing error between the pilot(Walsh 0) and each of the other 63Walsh codes. A Walsh-Code-DomainTiming measurement displays codes0–63 horizontally and the time offsetbetween each Walsh Channel and thePilot vertically. Typically, only thetiming for active Walsh codes isshown (see Figure 17). The noisynature of inactive codes yields rathermessy results.
The time alignment between Walshchannels is carefully determined by design. Base station ASICs have several adjustments to ensure thattiming is properly aligned when all ofthe Walsh codes reach the antenna.
Sources of timing errors can beerrors in ASIC time adjustmentparameters, actual time delays inbaseband signal paths or intermodu-lation between Walsh codes. TheCDMA standards specify a Pilot-to-Walsh-Channel Time Tolerance ofless than 50 nanoseconds.
Code-domain phase. The IS-95CDMA forward link uses separateand distinct I and Q PN spreadingsequences. The same sequences areused for the Pilot and all the WalshChannels. The mobile receiver usesthe received pilot to synchronize itsspreading sequences and phase align its local oscillator (LO). The LO is
22
Figure 17 Code-domain timing.
Figure 16. Noise in
Walsh code domain.
2Wnoise
j =
Wnoise
= –21 dB 64

then assumed to also be phasealigned with each of the differentWalsh codes. Any phase misalign-ment between the transmitted Pilotand other Walsh channels will resultin a de-spreading error and causeadditional interference at the mobilereceiver.
A phase error between the receiverLO and its Walsh channel results ininterference from I to Q and from Qto I. Phase errors are essentially aloss of orthogonality between I and Q(see Figure 18). These can resultfrom cross talk between I and Q inthe base station baseband processingsection, misaligned LOs or intermod-ulation between Walsh codes.
Code-domain phase is the phase difference between the pilot channeland each Walsh channel. The CDMAstandards call for a Pilot-to-Code-Channel Phase Tolerance of less than50 milliradians or 2.86 degrees.
Why are code-domain timing andphase important?
Orthogonality is only achieved if the codes are aligned in time. If alignment is poor, the otherWalsh channels begin to look likeadditional noise in the system, and capacity and coverage willdecrease. CDMA mobiles use synchronous detection, with thepilot’s phase as the reference.They assume there is phase coher-ence on the other channels in thesector. If there is not, the mobilemay have difficulty demodulatingdata from the traffic channel.
23
Q-to-I interference
I-to-Q interference
Figure 18.Phase error.
Figure 19. Code-domain
phase.

In-band/out-of-channel measurements
The in-band/out-of-channel measure-ments are those that measure distortion and interference withinthe system band, but outside of thetransmitting channel. They include:
• In-band spurious emissions• Adjacent Channel Power Ratio
(ACPR; also called spectral regrowth)
There are stringent regulatory con-trols on the amount of interferencethat a transmitter can cause to neighboring channels. The standardsspecify the amount of interferenceallowed by the system. This is the in-band spurious emissions measure-ment. For components, on the otherhand, the individual NEMs will typi-cally specify Adjacent Channel PowerRatio or spectral regrowth as the figure of merit. This is a better measure of the distortion performanceof the components to be used in thebase station system. The componentACPRs will always be tighter thanthe system specifications, but canvary in degree depending upon thesystem design.
The distributed test elements recom-mended here include: (1) a signalgenerator with good adjacent-channel-power performance (out-of-channel measurements) and multipleWalsh-code channel capability(transmitter tests), and (2) a vectorsignal analyzer with excellent accura-cy. If the measurement requires highdynamic range (that is, very tightACPR specifications), a swept spectrum analyzer is recommended.Both analyzers will be discussed.
In-band spurious emissions. TheIS-95-based standards specify a valuerelative to the channel output powerthat the spurious emissions must bebelow. These are defined to be thoseemissions within the base stationtransmit band which are also withinthe bands allocated to the operator’ssystem. An example is the IS-97 standard, which states:
(a) For offset frequencies greaterthan 750 kHz from the CDMA chan-nel center frequency, spurious emis-sions must be at least 45 dB belowthe channel power (≤ –45 dBc).(b) For offset frequencies greaterthan 1.98 MHz from the CDMA channel center frequency, spuriousemissions must be less than –60 dBc.
A spectrum analyzer measures the power in a 30 kHz resolution bandwidth as it sweeps across thefrequency ranges described above.Any spurious emissions measuredoutside the allowed mask limits will excessively interfere with adjacent channels and limit system performance.
24
–45 dBc
–60 dBc750kHz
fc1.98 MHz
Figure 20.IS-97 spurious
emissions test limits.

25
Figure 21.CDFs for a variety
of test signals.
Adjacent Channel Power Ratio.
As mentioned earlier, spurious emissions is a system test, and notthe test of choice for components. A better measurement of the adjacent-channel interference caused by acomponent is ACPR or spectralregrowth. ACPR is the ratio of adja-cent-channel power to the averagepower level of the channel. We willuse a high-power CDMA base stationamplifier as an example.
Traditionally, two-tone intermodula-tion measurements have been usedto assess an amplifier’s distortionperformance. For narrowband signals, the intermodulation productscaused by nonlinearities create spectral components at frequenciesgiven by:
where N and M are integers, f1 and f2
are two frequencies present at theinput of the nonlinear device and fi isthe frequency of the intermodulationproducts.
IS-95 CDMA signals can be thoughtof as many closely-spaced spectralcomponents. Intermodulation prod-ucts of these components form ashelf or “shoulders” around theexpected CDMA spectrum.
The measurement of intermodulationproducts is complicated by the factthat IS-95 signals have a large crestfactor (ratio of peak to averagepower). Therefore, the traditionaltwo-tone signal is not an appropriatestimulus. Tests made with a two-tonestimulus do not provide a useful mea-sure of the operational performanceof CDMA base station amplifiers.Network equipment manufacturersare instead requiring componentmanufacturers to provide ACPRresults as the figure of merit for distortion performance.
The stimulus chosen for ACPR measurements can greatly affect theoutcome of the test. Some com-monly-chosen signals include noisethat covers the CDMA channel bandwidth, signals with multipleWalsh-code channels activated andproprietary signals. Each of thesesignals will cause a different amountof stress to an amplifier operatingnear its maximum power level. Infact, amplifiers that pass ACPR testswith one source may fail with another.
Experimentally, it has been foundthat ACPR results can vary as muchas 17 dB depending on the stimulus.The stress of a stimulus can be characterized by a statistical methodcalled the Cumulative DistributionFunction (CDF). (See reference #4for more information.)
Figure 21 shows the CDFs for severalstimuli. It tells us the probability thatsamples of the signal are greater thanx dB above the average power levelof the signal. For example, 0.1% ofthe samples in the Additive WhiteGaussian Noise (AWGN) source are greater than 9.1 dB above theaverage power output. This willcause a certain amount of adjacentchannel interference.
ƒi = Nƒ1 ± Mƒ2 ,

The noise source was found to pro-vide the least amount of stress andtherefore give the best ACPR results.(The pilot and reverse channels areonly included for comparison pur-poses and are not considered appro-priate signals for base station tests.)A noise source does not correctlysimulate real-life operating conditions.A more realistic high-stress stimulussignal uses the 9-channel signal (sixtraffic, the pilot, sync and one pag-ing) given in the IS-97 standard. Thecombination of Walsh-code channelsselected, however, will also affect theresults of the ACPR measurements(see Figure 22).
The safest approach is to use at least one of the realistic high-stressstimulus signals, and test with various combinations of Walsh-code channels.Therefore, a signal generator with thisflexibility is highly recommended.
An additional requirement for theCDMA signal generator is that its ACPperformance be very good. This en-sures that the power measured in theadjacent channels is caused by thedevice under test, and not the signalgenerator or the signal analyzer.
The specification for measuringACPR requires a comparison of thepower in the RF channel to thepower at several offsets. This can bedone either as a power ratio or apower density.
The power-ratio method comparesthe power in the specified adjacent-channel bandwidth (for example, 30 kHz) to the total power of the carrier across the entire carrierbandwidth (1.23 MHz). From Figure23, the +885 kHz ACPR result wouldbe C dBc (relative to A).
The power density method compares the power density at theoffset frequency, in a 30 kHz band-width, to the power within an averagebandwidth of the same (30 kHz)width in the carrier-channel band-width. From Figure 23, the +885 kHzACPR results would be C/B dB. This can be calculated by normalizingthe 1.23 MHz-channel-power resultto a 30 kHz bandwidth (subtract 10 log[1.23 MHz/30 kHz] = 16.13 dB from A).
26
0 2 4 6 8 1210
100
10
1
0.1
0.01
0.001
Prob
abili
ty (%
)
dB Above Average Power
9 ch CDMA #16
9 ch CDMA #1
9 ch CDMA #7
Pseudonoise
Figure 22. CDFs for three
9-channel signalswith different traffic
channels active.
30 kHz
885kHz
1.98 MHz
885kHz
1.98 MHz
30 kHz
30 kHz
1.23 MHz
B = average power in30 kHz bandwidthA = total power across
1.23 MHz channelbandwidth
C = total power within30 kHz bandwidthat offset
Figure 23.Adjacent Channel
Power Ratiospecification.

Several signal analyzers today offeran automatic method for measuringACPR. The internal digital signal processing allows for making themeasurement according to the speci-fications and displaying the results.Figure 24a is an example of theACPR measurement made on the HP VSA series transmitter tester.
An alternate way to view ACPR isshown in Figure 24b. The ACPRresults are displayed in bar graphform, indicating the total power inthe channel bandwidth (dark centerbar) compared to the total power in each of the adjacent, or offsetbandwidths.
Out-of-band measurements
Out-of-band measurements are made on signals outside of the sys-tem band. These signals, which caninterfere with other communicationsystems, can be categorized into harmonics and unknown spuriousemissions.
The distributed test elements ofchoice for these measurementsinclude: (1) a spectrum analyzer witha wide frequency range and highdynamic range, and (2) a signal gen-erator with excellent harmonic andspurious performance.
Harmonics. Harmonic distortion is another way in which non-linear performance is specified. This is ameasure of signals present at theoutput of the device or system thatwere not present at the input.
As shown in Figure 25, non-lineari-ties will cause harmonics of the inputsignal to appear at the output alongwith the fundamental. These har-monics are integer multiples of theinput (fundamental) frequency, andare usually measured in terms of dBbelow the fundamental signal (or“carrier”) for a given input level,commonly expressed as dBc.
27
Figure 24.Adjacent Channel
Power Ratio measurement.
(a)
DUTHarmonic Distortion
f° 3f°f° 2f° ...Figure 25.
Harmonics.
(b)

Out-of-band spurious, nonhar-
monic. In design and manufacturing,measuring out-of-band spuriousemissions usually involves looking in particular frequency spans that areknown to have potential spurs. Atable-driven measurement that hasthe flexibility to set up custom parameters (for example, frequencyspan, resolution bandwidth, limits,etc.) provides the most effectivemethod for making this measurement.
The CDMA system specificationstates that the total spurious emis-sions outside the allocated systemband (including harmonics), mea-sured in a 30 kHz bandwidth, shouldnot exceed 60 dB below the meanoutput power in the channel band-width or –13 dBm, whichever issmaller.
Why are out-of-band measurements important?
In many countries, there is agovernment agency that managesairwaves. Monitoring the frequencyspectrum, and in some cases sellinglicenses to use it, is typically therole of these agencies.
The level of “policing” to ensure that one communication system isnot interfering with another variesfrom country to country. Somecountries impose heavy fines onservice providers that continue toallow spurious emissions from theirsystem to interfere with another.Therefore, it is important to accurately measure the spuriousemissions created by the base station and verify that they are notabove their allowable level.
28
Figure 26.Out-of-band
spurious table.

Receiver tests attempt to quantifythe performance of a receiver in thepresence of degradations in the sig-nal path between the transmitter andthe receiver. In the case of CDMAbase-station receivers, the figure ofmerit is the Frame Error Rate or FER(discussed below). Receiver testsconsist of measuring FER as a func-tion of various reverse-link degrada-tions. Some common receiver testsinclude:
• Sensitivity• Dynamic range• Spurious immunity• Performance in Additive White
Gaussian Noise (AWGN)• Performance in an environment
with multipath interference (fading)
Connections to the base station forreceiver tests are similar to thoseused in transmitter testing. Access to the even-second clock and base-station timebase are still required.However, instead of analyzing thesignal from the base station’s transmitantenna or coupler, we now injectsignals from the CDMA generatorinto the receiver ports of the basestation and measure FER. For diver-sity, there are typically two receiveports for each sector. The setuprequires that the forward link be free of interference, and the link isassumed to be error-free. Calibrateddegradations are applied to thereverse-link path at each of the twodiversity inputs on the base-stationreceiver.
Because we are simulating thereverse link, the signal generatorrequired for receiver tests must provide single Walsh-code channelcapability with known data streams.It must also be able to accept theeven-second clock for synchronizingthe data stream to the FER measure-ment. Since the signal generator isproviding the in-channel signal, itsmodulation quality specification isthe key performance parameter.
Before reading about the receivertests performed on base stations, it isimportant to understand the metricsused to characterize the receiver’sperformance. These are FER (as mentioned above) and Eb/No(commonly pronounced “Ebb-no”).
29
Receiver
Even-second Clock
Frequency Ref
Base StationUnder Test
Rx1Rx2
CDMAGenerator
FactoryStandard
CalibratedDegradation
Figure 27.Receiver
test setup.
Metrics
FER. In CDMA systems, the measureof receiver performance is FrameError Rate (FER), not Bit Error Rate(BER) as it is in some other digitalwireless systems. FER is the ratio ofthe number of frames of data receivedwith errors to the total number offrames transmitted.
FER is used because the coding and error-correction scheme inCDMA is applied equally to all bits.There are not classes of bits with different levels of error correction asis the case in some TDMA systems.The error-correction scheme used inCDMA consists, in part, of convolu-tional encoding and maximal likeli-hood (typically, Viterbi) decoding.This will yield either perfect errorrecovery, or numerous bit errors. Forthis reason, BER testing is not a precise measure. In addition, CDMAradios measure the quality of each20-millisecond frame and either usethe whole frame or reject it.
An important requirement, then, isfor the base station to be able tomonitor (and report) its FER for agiven input signal. The base station isresponsible for monitoring its ownFER. This capability must be “builtin” by the Network EquipmentManufacturers (NEMs) to be used by those doing testing in the field.Interference signals for receiver testing can be tones, noise or nothing.We’ll look at this in more detail in thedescriptions of individual tests.
One way of measuring FER (as calledout in IS-97A) is by sending knownframes to a test mobile station that isusing service option two, data loop-back. In this manner, the data istransmitted back to the base stationbeing tested. This method presumesthat the link from base to mobile isclose to ideal and that the link fromthe mobile to base generates the
desired test conditions. All errors areassigned to the reverse link and aremeasured as base station perfor-mance limitations. A more precisemethod uses test equipment to gen-erate a signal with known datastreams and apply it to the base sta-tion. The base station can then moni-tor its FER based on the known datastream. The test equipment must beable to accept the even-second clockfor synchronization.
Eb/No. Eb/No is a quantification ofthe signal-to-noise level of the testsignal, where Eb is the energy per bitand No is the received-noise-plus-interference power in a 1 Hz band-width. It is corrected for the codinggain of the CDMA system, which is the ratio of the bit rate to thespreading rate. For full-rate data this is approximately 21.3 dB. Anequation for this is:
Base-station receiver performance is expressed in terms of FER versus Eb/No.
30
Eb /No = Signal (dBm) – Noise (dBm) + 21.3 dB

Measurements
Sensitivity. Sensitivity is a measureof the lowest signal level that can bereceived for an acceptable FER. Thisrequires accurate level control and isbest accomplished if power control isdisabled in the mobile station simula-tor or AGC (automatic gain control)is disabled in the signal generator.Disabling of power control is neededbecause mobile power is increasedwhen the base station receives lowsignal levels.
The sensitivity of the receiver canalso be thought of as a measure ofthe noise figure of the receiver (with-out interference, the noise floor ofthe receiver sets the performancelimits). Sensitivity is the ability of thebase station to recover digital dataeven when the signal level input isquite low.
A common method of measurementis to apply equal signal levels fromthe CDMA generator to each receiverinput of the base station under test.Using a pre-defined bit pattern, thereceiver must decode the data,reporting frame errors.
The sensitivity specification for aCDMA base station receiver is thatan FER better than 1% must beachieved for a level of –117 dBm ateach receiver input. This is 4 dBbelow kTB (–113 dBm) in a 1.23 MHzbandwidth at room temperature. The base station expects to receivesignals well below thermal noisebecause of the high coding gain(approximately +20 dB) of theCDMA system. The sensitivity of thereceiver is mostly affected by itsnoise figure.
Dynamic range. Dynamic range isthe ability of the receiver to receivesignals that are very weak or verystrong. It is the ratio, expressed indB, of the highest-level signal thatcan be received to the lowest-levelsignal that can be received. As withsensitivity, dynamic range requiresaccurate level control.
Dynamic range uses the same setup as sensitivity; however, the signal is very large (–65 dBm). Thistests the overload capability of thebase station.
The highest-level signal that can bereceived for the same 1% FER mustthen be measured to determinedynamic range. In this case, the inputsignal level is increased until 1% FERis achieved. The dynamic range of areceiver is affected by its linearityand noise figure.
31
Base StationUnder Test
CDMAGenerator
CDMA Time Base
RX (A)
RX (B)
Even-Second Clock
Frequency REF
Duplex Out
Reported FER
Figure 28.Sensitivity
measurementset up.
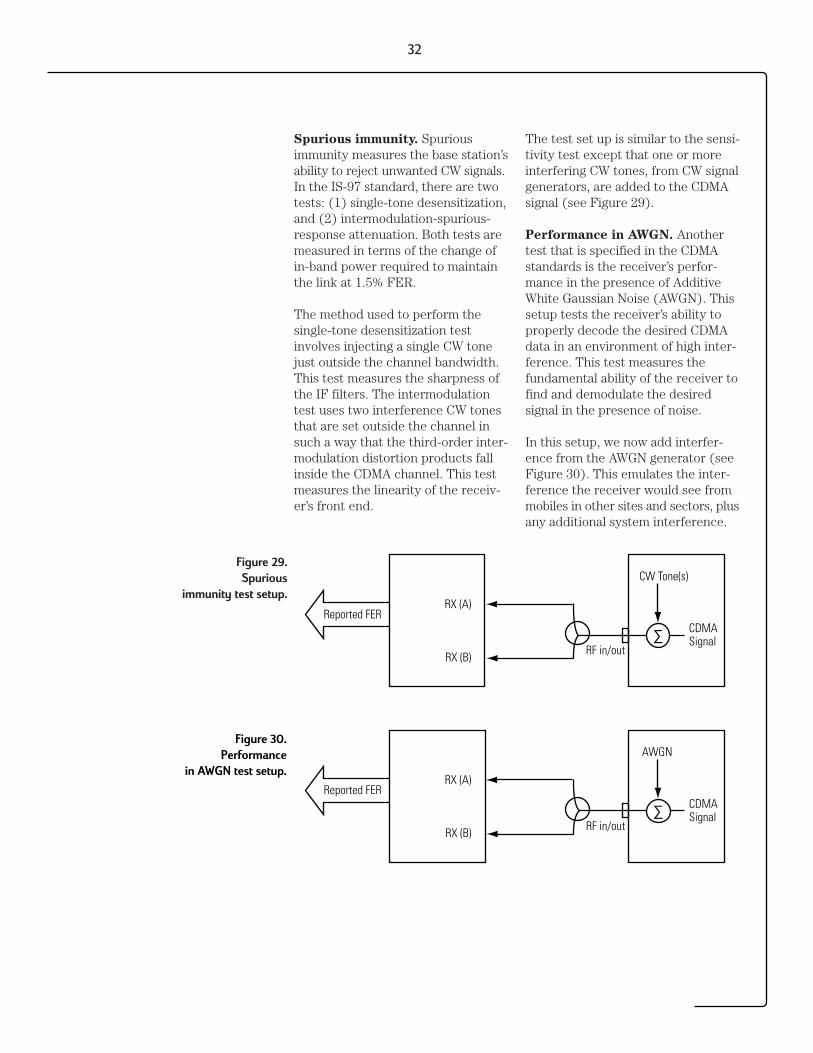
Spurious immunity. Spuriousimmunity measures the base station’sability to reject unwanted CW signals.In the IS-97 standard, there are twotests: (1) single-tone desensitization,and (2) intermodulation-spurious-response attenuation. Both tests aremeasured in terms of the change ofin-band power required to maintainthe link at 1.5% FER.
The method used to perform the single-tone desensitization testinvolves injecting a single CW tonejust outside the channel bandwidth.This test measures the sharpness ofthe IF filters. The intermodulationtest uses two interference CW tonesthat are set outside the channel insuch a way that the third-order inter-modulation distortion products fallinside the CDMA channel. This testmeasures the linearity of the receiv-er’s front end.
The test set up is similar to the sensi-tivity test except that one or moreinterfering CW tones, from CW signalgenerators, are added to the CDMAsignal (see Figure 29).
Performance in AWGN. Anothertest that is specified in the CDMAstandards is the receiver’s perfor-mance in the presence of AdditiveWhite Gaussian Noise (AWGN). Thissetup tests the receiver’s ability toproperly decode the desired CDMAdata in an environment of high inter-ference. This test measures the fundamental ability of the receiver tofind and demodulate the desired signal in the presence of noise.
In this setup, we now add interfer-ence from the AWGN generator (seeFigure 30). This emulates the inter-ference the receiver would see frommobiles in other sites and sectors, plusany additional system interference.
32
RX (A)
RX (B)
CW Tone(s)
Reported FER
RF in/out
CDMASignal∑
Figure 29.Spurious
immunity test setup.
RX (A)
RX (B)
AWGN
Reported FER
RF in/out
CDMASignal∑
Figure 30.Performance
in AWGN test setup.

AWGN tests are done at receive signal levels substantially above thesensitivity of the receiver and arelargely unaffected by noise figure orlinearity. The performance in AWGNis mostly affected by the design ofthe baseband portions of the receiver.
The table shown in Figure 31 showsthe FER values expected of thereceiver for various Eb/No settingsand data bit rates. The test signalswere set well above the noise floor of the receiver with the noise set to a value of –84 dBm. The test CDMAchannel was then set to a value thatresulted in an Eb/No of 4.1 dB and4.7 dB. This was done for severaldata rates. The performance curveshown on the right is for the 9600bps rate.
Note that at the 9600 bps rate, achange of only 0.6 dB in Eb/Noresults in a drastic change in FER.We can see that changing the level ofthe CDMA channel by 0.6 dB changesthe specified FER by a factor of morethan 10, from 0.2% to 2.5%. Thissteep slope of FER change is an indication of the effect of the system’s error-correction capability.
In design and manufacturing, the testsetup typically includes dual AWGNgenerators with individual level control. The amount of equipmentand complexity involved in settingthis up prohibits this approach infield-testing. Installation and mainte-nance therefore typically use a testset that has AWGN capability.
33
Data rate(kbps)
9.6
4.8
2.4
1.2
At 4.7 Eb/No
0.2
0.9
5.0
3.2
At 4.1 Eb/No
2.5
6.6
23.0
9.4
FER limits (%)3
2.5
2
1.5
1
0.5
04 4.1 4.2 4.3 4.4 4.5 4.6 4.7 4.8
Eb/No dB
FER%Figure 31.Performance
in AWGN limits.

34
Performance in multipath fading
environment. The test setupchanges for the fading test (seeFigure 32). A channel simulator isused to provide specified fading profiles. The AWGN source is addedafter the channel simulator. In thistest, reverse-link power control isdisabled, which is quite differentfrom actual conditions. The test wasdesigned this way to check that thefundamental receiver capabilities aremet at a specified level.
Figure 33 shows the channel modelsfor fading tests. Tests using theseprofiles are performed at all datarates. This tests the receiver’s perfor-mance separate from the system’sperformance. The receiver requireshigher average Eb/No than whenpower control is working.
These channel models were chosento best test the base-station imple-mentations, not because they repre-sent a channel condition that is likelyto occur.
Why are receiver measurements important?
The sensitivity test is basically ameasure of the receiver’s noise fig-ure performance. Poor sensitivitymeans higher FER for a given levelfrom a mobile. This forces the basestation to order the mobile toincrease its power until the FER isacceptable. Because the mobilesare at a higher level, capacity isreduced.
Because the receiver dynamicrange test measures the receiver’sability to process data with largeinput signals, it is a key test fordetermining immunity to what iscalled the “near/far” problem ofthe CDMA system: strong signalsnear a CDMA receiver can over-load the receiver section, blockingany reception of desired signals.
The performance in AWGN test is a key receiver measure, as it teststhe receiver in its normal operatingenvironment (receiving desiredsignals in the presence of systeminterference). Therefore, theAWGN generator plays an impor-tant part in receiver measurements.Performance in AWGN also affectsthe coverage and capacity in agiven sector. Calls should be handed off if the mobile is at itsmaximum power level and the linkdoes not meet FER criteria. This condition can be worsened asmore subscribers are added to the system.
CDMA TestTranscevier
Fading Simulator
NoiseGenerator
Receiver Under Test
Fading Simulator
NoiseGenerator
∑
∑
Figure 32.Performance
in fading setup.
Figure 33.Receiver
test fading profiles.
Number ofPaths
1
2
3
VehicleSpeed
30 km/hr
8 km/hr
100 km/hr
Path 2Power
(relative toPath 1)
N/A
0 dB
0 dB
Path 3Power
(relative toPath 1)
N/A
N/A
-3 dB
Path 3Delay
(relative toPath 1)
N/A
N/A
14.5 µsec
Path 2Delay
(relative toPath 1)
N/A
2.0 µsec
2.0 µsec

IS-95 CDMA signals have uniquecharacteristics. They are spread-spectrum signals that are noise-likein their behavior. CDMA signals havehigh crest factors and their power isvariable. The unique method of codechannelization used by IS-95 CDMArequires new measurements that aresystem specific. The measurement ofWalsh-code-domain power allows oneto distinguish the power in a particu-lar code channel; this is analogous tothe way spectrum analyzers measurepower in the frequency domain forconventional communications sys-tems. Many well-understood sourcesof interference, such as spurs, noise
or intermodulation behave uniquelyin a CDMA system. CDMA measure-ment results can also yield usefulcomputed results, such as calibratedEb/No measurements and rho estimation.
Understanding these complexities is important for ensuring accurateCDMA measurement results. Thisapplication note is intended to beused as a guide in this endeavor.
35
5. References
4. Summary
1. Concepts of CDMA, 1997, HP literature number 1000-1403.
2. Spectrum Analyzer Measurements and Noise, Application Note 1303, HP literature number 5966-4008E.
3. Spectrum Analysis, Application Note 150, HP literature number 5952-0292.
4. Nick Kuhn, Bob Matreci and Peter Thysell, Proper Stimulus Ensures
Accurate Tests of CDMA Power, (Article Reprint) HP literature number 5966-4786E.
5. Marcus Da Silva, CDMA Base Station Test Challenges, 1997,HP part number 1000-1480.
6. Ken Thompson, CDMA System and Base Station Test Overview, 1997, HP part number 1000-1507.
7. CDMA Base Station Test Methods, 1995, HP part number 1000-1306.
8. Marcus Da Silva, Interpreting CDMA Measurements, 1997, HP part number 1000-1510.
Title HP literature number1. HP 8935 CDMA Base Station Test Set 5966-0339E2. HP ESG Series RF Digital and
Analog Signal Generators 5966-3696E3. HP VSA Series Transmitter Tester 5966-4762E4. HP 8590 E-Series Spectrum Analyzers 5963-6908E5. HP 85725C CDMA Measurement Personality 5963-9969E6. HP 8560 E-Series Spectrum Analyzers 5966-3559E7. CDMA Solutions from HP 5966-3058E
Related literature

For more information about
Hewlett-Packard test and measurement
products, applications and services,
and for a current sales office listing,
visit our web site, http://www.tmo.hp.com.
You can also contact one of the following
centers and ask for a test and
measurement sales representative.
United States:
Hewlett-Packard CompanyTest and Measurement Call CenterP.O. Box 4026Englewood, CO 80155-40261 800 452 4844
Canada:
Hewlett-Packard Canada Ltd.5150 Spectrum WayMississauga, Ontario L4W 5G1(905) 206 4725
Europe:
Hewlett-PackardEuropean Marketing CentreP.O. Box 9991180 AZ AmstelveenThe Netherlands(31 20) 547 9900
Japan:
Hewlett-Packard Japan Ltd.Measurement Assistance Center9-1, Takakura-Cho, Hachioji-Shi,Tokyo 192, JapanTel: (81) 426-56-7832Fax: (81) 426-56-7840
Latin America:
Hewlett-PackardLatin American Region Headquarters5200 Blue Lagoon Drive, 9th FloorMiami, Florida 33126, U.S.A.(305) 267 4245/4220
Australia/New Zealand:
Hewlett-Packard Australia Ltd.31-41 Joseph StreetBlackburn, Victoria 3130, Australia1 800 629 485
Asia Pacific:
Hewlett-Packard Asia Pacific Ltd.17-21/F Shell Tower, Times Square,1 Matheson Street, Causeway Bay,Hong KongTel: (852) 2599 7777Fax: (852) 2506 9285
Data Subject to Change
Copyright© 1998
Hewlett-Packard Company
Printed in U.S.A. 11/98
5968-0953E