Embed Size (px)
Citation preview

Understanding and Improving Usability of Data Dashboards forSimplified Privacy Control of Voice Assistant Data
Vandit SharmaIndian Institute of Technology Kharagpur
Mainack MondalIndian Institute of Technology Kharagpur
Abstract
Today, intelligent voice assistant (VA) software like Ama-zon’s Alexa, Google’s Voice Assistant (GVA) and Apple’sSiri have millions of users. These VAs often collect and ana-lyze huge user data for improving their functionality. However,this collected data may contain sensitive information (e.g.,personal voice recordings) that users might not feel comfort-able sharing with others and might cause significant privacyconcerns. To counter such concerns, service providers likeGoogle present their users with a personal data dashboard(called ‘My Activity Dashboard’), allowing them to manageall voice assistant collected data. However, a real-world GVA-data driven understanding of user perceptions and preferencesregarding this data (and data dashboards) remained relativelyunexplored in prior research.
To that end, in this work we focused on Google VoiceAssistant (GVA) users and investigated the perceptions andpreferences of GVA users regarding data and dashboard whilegrounding them in real GVA-collected user data. Specifically,we conducted an 80-participant survey-based user study tocollect both generic perceptions regarding GVA usage as wellas desired privacy preferences for a stratified sample of theirGVA data. We show that most participants had superficialknowledge about the type of data collected by GVA. Worry-ingly, we found that participants felt uncomfortable sharinga non-trivial 17.7% of GVA-collected data elements withGoogle. The current My Activity dashboard, although useful,did not help long-time GVA users effectively manage theirdata privacy. Our real-data-driven study found that showingusers even one sensitive data element can significantly im-prove the usability of data dashboards. To that end, we builta classifier that can detect sensitive data for data dashboardrecommendations with a 95% F1-score and shows 76% im-provement over baseline models.
An extended version of this paper that includes the appendices is avail-able for interested readers at https://osf.io/rgk95/.
1 Introduction
Voice assistants like Google’s voice assistant (GVA), Ama-zon’s Alexa, Microsoft’s Cortana, or Apple’s Siri are ex-tremely popular today as they are well equipped to performmultiple tasks on users’ voice requests (e.g., searching theinternet, calling a friend, or playing music). However, thesevoice assistants also collect and analyze a lot of user data(e.g., timestamps, audio recordings, transcripts, etc.) to im-prove their infrastructure across multiple devices (e.g., in bothsmart speaker and smartphone). Unfortunately, this data canlead to a huge possible privacy nightmare since the voiceassistant might be used in private situations. E.g., GVA col-lects three types of potentially sensitive data—audio clips ofconversations, transcripts of conversations, and the ambientlocation of use. We refer to individual records of these threedata types as data elements in this paper.
In this study, we take Google voice assistant (GVA) as ourexperimental testbed. Previous studies on understanding userperceptions and preferences for data collection by voice as-sistants (such as [29, 40]) have mainly focused their attentionon smart speaker users. However, recent reports [23, 42] havehighlighted the significantly greater popularity of smartphone-based voice assistants over their smart speaker counterparts.Intuitively, smartphones are easier to use in more contextsthan smart speakers, multiplying potential privacy problems.To that end, the exact same GVA software runs in both Googlesmart speakers and Android smartphones, effectively aggre-gating data from both. So, we focus on GVA users and con-duct a real user-data driven study to uncover user perceptionsregarding GVA-collected data.
Specifically, to counter this problem of sensitive data collec-tion, service providers like Google often provide a dashboardto the users showcasing their GVA collected data (Google’sMy Activity dashboard). We noted that the dashboard in-cludes data from both smart speakers and smartphones with-out differentiating markers. However, the efficacy of thesedata dashboards for controlling privacy in the GVA context isnot well-understood. To that end, we unpack user perceptions

and preferences regarding data collection by GVA as well asdata dashboards through a two-part survey-based user study.Our overall goal is to assess the usefulness/efficacy of datadashboards. We specially focus on the context of data col-lected by voice assistants (in smart devices) and investigatethe efficacy of these dashboards to enable the privacy goalsof users in that context.
Our research questions (RQs), as stated below, are designedto unravel (i) whether data dashboards can indeed facilitate abetter understanding of what (possibly sensitive) data VAs col-lect, and (ii) the particular helpful (or not so helpful) aspectsof data dashboards from a user-centric view. Our RQs alsoinvestigate how to improve the usability of these data dash-boards. In this study, we particularly contextualize our RQswith our focus on GVA. We selected GVA primarily becauseof the huge user base (boosted by the inclusion of GVA in allAndroid smartphones). Even though our choice of GVA posessome limitations, (e.g., GVA userbase and dashboard mightnot necessarily represent all VA users or dashboards), our ap-proach is still useful—findings from our study answer broaderquestions about helpfulness of data dashboards in general andtake a step forward towards improving their usability.
RQ1- How frequently do Android users leverage GVA? Whatis their GVA usage context?
Most (72.5%) of our participants had been using GVA foraround two years or more. 73.75% of participants used GVAfrequently, at least a couple of times a week in home, officeand car. For the median participant, GVA collected 837.5 dataelements. The context of using GVA ranged from gettinginformation to entertainment.
RQ2- What are the user perceptions regarding the data collec-tion and storage practices of GVA? What is their ideal accesscontrol preference for Google relative to their social relationsfor accessing GVA data?
Although the majority (78.75%) of participants were awarethat Google collects and stores some form of data, around40% of users were unclear about the type of data (e.g., audioclips) being collected, signifying superficial knowledge. In-terestingly, statistical analysis shows that relative to varioussocial relations (proxemic zones [21]), participants consideredGoogle mainly as a public entity.
RQ3- Do users desire to restrict access of Google to GVAcollected specific data elements? Do these access preferencescorrelate with the data element class or the medium of thedata collection?
Participants wanted to restrict Google’s access for 121(18.08%) out of 669 audio clips and 61 (17.03%) out of 358transcripts presented in our survey, a non-trivial fraction of allcollected data. They had similar preferences for data collectedby smartphones and smart speakers but felt significantly lesscomfortable viewing data elements where they did not knowor could not recall the device through which it was collected.There were no significant differences in user privacy prefer-
ences for data elements from different control and possiblysensitive classes (prepared from previous work [7, 27, 29]),suggesting the inherent complexity of finding sensitive data.
RQ4- Do data dashboards help users to control the privacyof their GVA data? Can we further assist users by automatedmeans to improve their privacy-preserving behavior by im-proving the data dashboard? How?
50% of our participants did not know about the Google-provided My Activity data dashboard. Most participantsfound the dashboard easy to use; however, more long-timeGVA users expressed a need for assistance in using the dash-board, suggesting a lack of effectiveness for larger amountsof data. Showing users even one sensitive data element col-lected by GVA using our simple class-based sensitive contentdetection system made them highly (80%) likely to controltheir collected data. This suggests that assisting dashboardusers through automated means might improve their privacy-preserving behavior. We took the first step in this direction byexploring an Machine learning (ML)-assisted human-in-the-loop (HITL) based design for data dashboards. We show thatit is possible to create Machine learning-based systems to rec-ommend sensitive content with more than 95% F1-score show-ing a concrete, feasible direction to improve data dashboards.We note that, although we used GVA as our experimentaltestbed, our findings regarding the efficacy of data dashboardsas well on improving data dashboards could be extended tocontexts concerning other VAs. For example, our results showthat dashboards are indeed useful for tracking VA-collecteddata. However, there also is a need for automated assistancein using the dashboards, notably for long-term users to con-trol the privacy of large amounts of accumulated data. Thesefindings are potentially useful for designing improved datadashboards for any VAs.
The rest of the paper is organized as follows- The back-ground and related work in Section 2. Our methodology isexplained in Section 3. We describe the data analysis in Sec-tion 4. The survey results are presented in Section 5. In Sec-tion 6, we explore ML as a possible improvement to recom-mend sensitive data elements in data dashboards. Finally, weconclude the paper in Section 7.
2 Background and Related Work
GVA capabilities and usage: GVA is an intelligent voice-activated assistant software that Google introduced in May2016 [28]. It allows users to perform a variety of actionssuch as getting local information, playing media, perform-ing a Google search, managing tasks, and more [38] throughsimple voice-based commands. GVA supports cross-devicefunctionality and is available on a wide range of devices suchas smartphones, tablets, smartwatches, TVs, headphones, andmore [38]. As of 2020, GVA is available on more than 1 bil-lion devices, spread across 90 countries and supports over

Figure 1: GVA interface on an Android smartphone.
30 languages. It has more than 500 million monthly activeusers [9], reflecting its immense popularity. Figure 1 shows avisual of the GVA interface and some functionalities.
While most users of VAs use them on smartphones, tablets,and smart speakers [11], recent privacy studies have beenpaying increased attention to concerns surrounding the use ofsmart speakers [34], primarily because they are always listen-ing devices. However, several works point out the popularityof VA residing in smartphones which can capture more di-verse contexts and potentially private data. This work focuseson GVA, which runs on both smart speakers and smartphones.
Privacy concerns with VAs: Privacy concerns surroundingvoice assistants have been studied extensively. Several re-searchers have proposed different approaches to launch pri-vacy attacks against voice assistants [4, 10, 45, 46]. Schon-herr et al. explored the accidental triggering of voice assis-tants [39], and Edu et al. conducted a detailed literature reviewof Smart Home Personal Assistants (SPA) from a security andprivacy perspective [17]. They highlighted several key issuessuch as weak authentication, weak authorization, profiling,etc. Edu et al. also studied various attacks on SPAs, suggestedcountermeasures, and discussed open challenges in this area.Courtney further summarized various privacy concerns asso-ciated with voice assistants [15].
In recent years, there have been multiple instances of dataleaks associated with voice assistants managed by promi-nent technology companies [31, 33]. Such data leaks canbe a huge cause of privacy concern since VA collected datacan include sensitive data such as audio recordings, locationdata, etc. Specifically, one interaction with GVA can lead tomultiple data elements—audio clip, transcript, and location—depending on the controls set in Google-wide settings (e.g.,Web & App Activity control, which is turned on by default andenables Google to store transcripts, location, and other meta-data for all interactions). For instance, Kröger et al. discussedthe threat of unexpected inferences (such as obtaining the
speaker’s identity, personality, age, emotions, etc.) from audiorecordings stored by microphone-equipped devices throughvoice and speech analysis [24]. The two major classes of enti-ties that can cause privacy violations with collected VA dataare (i) the technology companies who own the voice assis-tants and store data on their servers (e.g., Google, Amazon,etc.), and (ii) external third parties with access to collected VAdata, upon which technology companies might rely to reviewcollected data. These two entities comprise our threat model.
Managing privacy of VA-collected data: A possible alter-native to prevent privacy violations is limiting and control-ling the data collected by voice assistants. Over the years,researchers have proposed several techniques for this pur-pose, involving both hardware and software. Champion et al.developed a device called the Smart2 Speaker Blocker to ad-dress the privacy and security concerns associated with smartspeaker use [12]. The device functioned by filtering and block-ing sensitive information from reaching the smart speaker’smicrophone(s). However, such an intervention cannot be usedin the case of smartphone-based voice assistants since smart-phones are portable devices. Vaidya et al. proposed anothertechnique to limit privacy concerns (such as voice spoofing)by removing certain features from a user’s voice input lo-cally on the device [41]. Qian et al. additionally presentedVoiceMask, a robust voice sanitization and anonymizationapplication that acts as an intermediate between users and thecloud [36]. Earlier work also developed a user-configurable,privacy-aware framework to defend against inference attackswith speech data.
While these techniques may be effective in checking pri-vacy concerns, a significant downside is that they modify thecollected data, rendering it unusable by developers. This de-feats the purpose of collecting data in the first place sincevoice assistant developers need user data to train better MLmodels and improve their services. Tabassum et al. presentedthis as a privacy-utility trade-off, suggesting the developmentof privacy frameworks that allow users to control the amountof data collected by the voice assistant (in exchange for possi-bly limited services) [40]. The survey conducted by Malkinet al. on understanding the privacy attitudes of smart speakerusers also highlighted a demand for effectively filtering ac-cidental recordings and sensitive topics [29]. We take a firststep in this direction by exploring a human-in-the-loop designto identify and recommend sensitive data to GVA users.
Privacy dashboards: Following up on the recommendationsmade by the Abramatic et al. for better user privacy con-trol [2], Irion et al. advocated the use of privacy dashboards asa practical solution to enhance user control for data collectedthroughout the online and mobile ecosystem, including plat-forms such as GVA [22]. They also highlighted the potentialof AI techniques and methods to users manage and enforcetheir privacy settings. In this area, Raschke et al. presentedthe design and implementation of a GDPR-compliant and

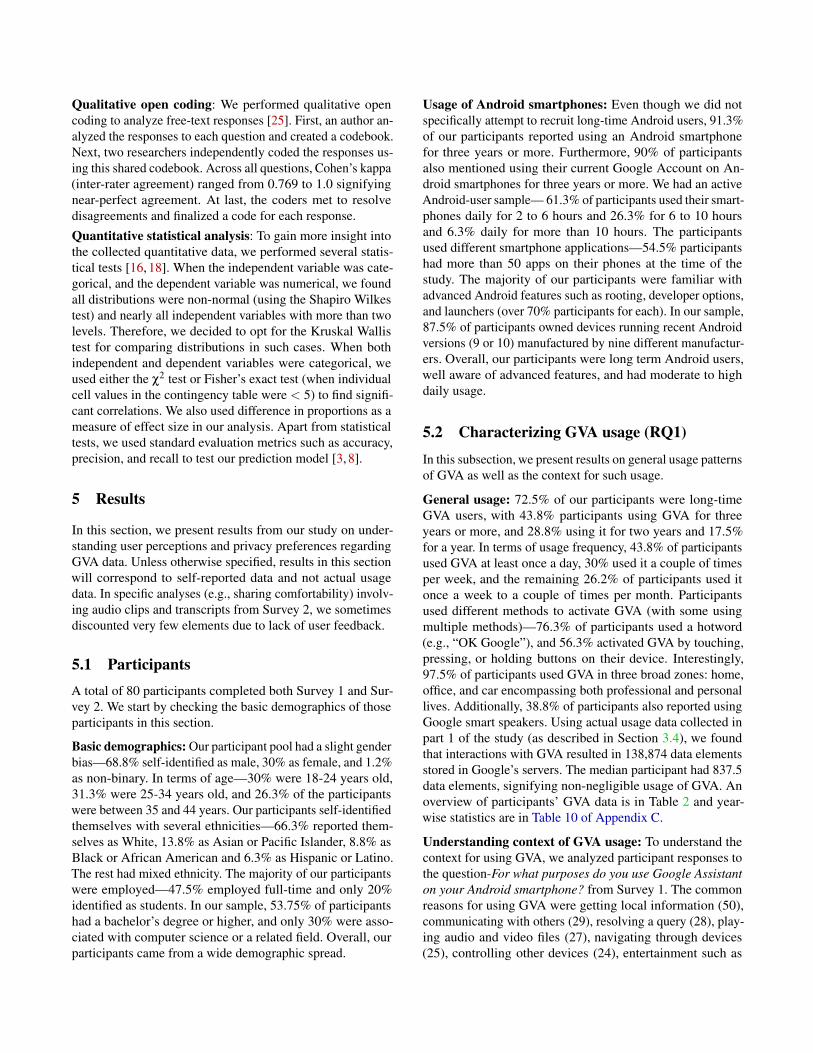
Figure 2: Three key sections of our study—generic Survey 1,ethical data collection and personalized Survey 2.
usable privacy dashboard [37]. In fact, to that end, Feth et al.proposed generic requirement and quality models to assistcompanies with developing privacy dashboards for differentdomains [20]. Our research is motivated by this prior work onthe importance of privacy dashboards—we aim to uncover theefficacy and possible improvement of today’s privacy dash-boards by specifically focusing on a deployed system in ourreal-world data-driven study.
Google My Activity data dashboard: The Google My Activ-ity dashboard is the primary data privacy control provided byGoogle for all its products and services. It is a hub where userscan see and modify all of the key information that Googlehas been collecting about them over the years [35]. Figure 13of Appendix C shows the user interface of the Google MyActivity dashboard. Since GVA’s launch in 2016, not muchwork has been done on studying user perceptions and theutility of such data dashboards to manage data privacy.
A recent and closely related study [19] investigated userperceptions and reactions to the Google My Activity dash-board. Through a survey, this study showed that viewing theMy Activity dashboard significantly decreases concern aboutGoogle’s data collection practices. However, the authors wereunsure if the dashboard actually provided valuable assistancein reviewing the collected data and enforcing user privacy. Thefirst part of our study partially revisits this work. However,we answer several additional questions about the perceptionsand preferences of GVA users. We also answer some ques-tions raised by this study, such as the effectiveness of theGoogle My Activity dashboard to enforce user privacy. Wethen present a possible solution to improve data dashboards—through recommending sensitive data elements to users. Wealso demonstrate a highly accurate proof-of-concept human-in-the-loop-based machine learning model for the same.
3 Methodology
We conducted a two-part survey-based user study to unpackperceptions and privacy preferences regarding GVA.
3.1 Recruitment and Inclusion Criteria
We deployed our study in the crowdsourcing platform Pro-lific Academic [1] during September 2020. We recruited 18+years old US nationals with >95% approval rating on Prolific.Additionally, we required that our participants primarily usedan Android smartphone, used GVA more than once per monthin the past year, and were willing to install our browser ex-tension to share their GVA-collected data. We took the helpof a short screening survey (Appendix A.1) which took lessthan a minute with Prolific-suggested compensation of $0.11to identify potential participants. Ultimately, we invited 249participants (who satisfied our inclusion criteria) for partic-ipating in our actual two-part study. Survey 1 and Survey 2of our study (seven days apart) took a total of 52 minutesand 42 minutes on average, respectively. We compensatedparticipants who completed both the parts with $12 ($5 forpart 1 and $7 for part 2). In total, 80 participants completedboth surveys (out of 119 who responded to our initial invita-tion). This drop in the number of participants was potentiallydue to the task description and eligibility in the recruitmenttext. We consider the data from only these 80 participants inthis paper as we wanted to combine data from both surveys(and, in effect, connect self-reported general perception fromSurvey 1 with the user feedback on real-world GVA-collecteddata in Survey 2).
3.2 Overview of Study Design
Figure 2 summarizes our institutional ethics committee-approved study procedure. The study consisted of three mainsections- (i) generic Survey 1, (ii) Ethical GVA data collectionand (iii) personalized Survey 2. First, participants were ex-plained the study design as well as the exact data they neededto share. The participants who gave us informed consent firsttook the generic Survey 1. This survey contained generic ques-tions (instrument in Appendix A.2) regarding user knowledgeand usage of Android smartphones as well as GVA. Aftercompleting Survey 1, participants installed a browser exten-sion developed by us for ethical GVA data collection. Ourextension worked entirely on the client-side and helped userscreate an archive of GVA data and upload it to their ownGoogle account. Then, the participants manually shared alink to the online archive with us. Next, we leveraged an end-to-end fully automated pipeline to fetch participants’ sharedGVA data and processed the data in a secure computer. Noresearcher ever manually saw or analyzed the raw data. Thisprocessing phase identified possibly sensitive data elementscollected by GVA. Then, within seven days of completingSurvey 1 and sharing data, we invited the participants to re-turn for a personalized Survey 2 (instrument in Appendix A.3)In Survey 2, we elicited user perceptions of a stratified sam-ple of these possibly sensitive data elements. Since Survey 2was generated programmatically for each participant using

elements in their own GVA-collected data, we refer to it as a“personalized survey”. We also showed each participant all oftheir possibly sensitive data elements identified by our dataprocessing pipeline in a personalized Google Drive folder(with named files and subfolders for categories) created by us.Finally, we asked the participants about the utility of automat-ically detecting sensitive GVA-collected data elements. Next,we explain each of the three sections of our study.
3.3 Survey 1Our participants provided their online informed consent be-fore starting Survey 1. In the consent form, we highlightedthe purpose of our study, the specific data we would ask toshare, and our privacy-preserving data collection and process-ing approach. Then, in Survey 1, we first asked participantssome general questions to uncover their usage of Androidsmartphones and GVA. Next, drawing from earlier studies onprivacy concerns surrounding voice assistants, we designed aset of GVA usage scenarios to ground the user and uncoverexperiences with sensitive and even privacy-violating datacollected by GVA [7, 27, 29]. These scenarios ranged from“Using inappropriate language” and “Using GVA in placeswith audible background sounds” to “Accidental activationof GVA” (complete list is in Appendix D). Then, our par-ticipants self-reported whether they recalled using GVA inthese scenarios and their comfort in such contextual GVAusage. After this, participants responded to questions abouttheir perceptions regarding GVA data collection (in generaland under different transmission principles [5]), storage, andaccess, including a few questions specifically about GoogleMy Activity dashboard. Finally, we concluded Survey 1 byasking questions related to general privacy attitudes.
3.4 Ethical Collection of GVA DataGiven the sensitive nature of the GVA-collected data elements,we wanted to collect it in the most ethical manner possible,as we will describe next. Our data collection protocol andanalysis plan were thoroughly evaluated and approved byour Institutional Ethics Committee (equivalent to an IRB).Participants were briefed about the data collection processthrough the consent form at the beginning of the study.Deciding on an ethical data collection protocol: We ex-plored several options to collect GVA data ethically fromusers along with their downsides—a client-side data-analysisapproach was infeasible due to the scale of data and com-putation, a Google password sharing approach encouragedoversharing private data, and approaching Google to ana-lyze user data and performing our study could potentially beperceived as diminishing user agency. We finally asked ourparticipants to use Google Takeout 1, create an archive of only
1A Google service that enables users to export part or all of data elementsstored in Google servers in an archive file [43].
Class Description med. #audio-noise Audio with high background noise 3audio-non-bkgd Audio with low background noise 94audio-multi-spkr
Audio with multiple speakers 36
audio-non-gend Audio with non-dominant genderspeaker
57
audio-grammar Audio with grammatical error 9audio-non-eng Audio with non-standard English word 51audio-regret Audio with regret word 25audio-neg-sent Audio with negative sentiment 32audio-rand Audio not in the above categories -transcript-typo Transcript with grammatical error 5transcript-non-eng
Transcript with non-standard Englishword
28
transcript-regret Transcript with regret word 20transcript-neg-sent
Transcript with negative sentiment 19
transcript-rand Transcript not in the above categories -location Location data (e.g., latitude-longitude) 10
Table 1: Description of fifteen classes from Survey 2 forclassifying GVA collected audio clips, transcript and locationdata. The last column signifies the median number of dataelements per user for our participants.
GVA data by selecting specific options in the Google Takeoutinterface, and share the archive file with us after reviewingthe data. We created a Firefox browser extension to facili-tate data collection—(i) The extension automatically selectedthe right options in the Google takeout interface (in clientbrowser) to create an archive with only GVA data by choosingthe right options in the Google Takeout interface). This ap-proach diminished the chances of oversharing (e.g., chancesof accidentally adding all their emails). (ii) The extensionautomatically selected the option provided in Google Takeoutto create an archive in a user’s own Google cloud storage 2
(associated with Google account). A participant shared theirunique link with us to allow processing of their archive file.Ensuring privacy of our collected data: In our protocol,participant GVA data could only be accessed using uniqueindividual links Moreover, we informed the participants thatthey could revoke access anytime, All GVA-collected datawas anonymous since it did not include any email or namesof users. On receiving a link, an automated pipeline checkedthe validity of the data (using data type and folder structure ofthe shared data) and invited only participants with valid datafor Survey 2. All data processing was automated (no manualexploration of raw GVA-data) and was done in password-protected computers accessible only to the researchers.
3.5 Survey 2Our personalized Survey 2 primarily involved eliciting userreactions regarding specific data elements collected and stored
2We took due consent to store and share this data in participants’ personalcloud storage. The consent form is in Appendix A.2.

by GVA. We start with our data processing pipeline to selectdata elements for Survey 2.
Creating a classifier to categorize data elements: We iden-tified (and leveraged in Survey 1) a set of privacy-violatingscenarios where according to earlier work, potentially sensi-tive data might be collected by GVA [7, 27, 29]. We analyzedthese scenarios to create twelve classes that encompass po-tentially sensitive GVA-collected data elements. These dataelements were broadly of two types—GVA-collected audioclips and transcripts of the commands given to GVA. Asidefrom these twelve classes, we considered three additionalclasses—a separate class “location” for location data, and twoseparate classes (“audio-rand” and “transcript-rand”) whichidentify audio clips and transcripts not belonging to any of thetwelve classes and act as a baseline for data elements. Thesetotal fifteen classes are presented in Table 1.
We then created automated classifiers to categorize dataelements in each of these classes for each user. These classi-fiers primarily relied on off-the-shelf signal processing (e.g.,measuring Signal to Noise Ratio or detecting the numberand gender of speakers) and NLP techniques (finding a gram-matical error, non-English word or negative sentiment). Wecreated one binary classifier for each of the above-mentionedtwelve classes in Table 1 (aside from “location”, “audio-rand”and “transcript-rand” classes). These classifiers categorizedGVA-collected audio clips and transcripts into one or moreof these classes. The motivation and detailed description ofeach classifier is in Appendix D.
Selecting individual data elements for Survey 2: Once weclassified each data element into one or more categories (withthe help of classifiers) from Table 1, we used a stratifiedsampling approach. In short, we randomly selected one dataelement from each category (without replacement) and usedthem to create the Survey 2 questionnaire. We also created apersonalized Google Drive folder for each participant to re-view in Survey 2. The folder contained all possibly sensitivedata elements found in their GVA data, arranged in thirteen re-spectively named files and subfolders (excluding “audio-rand”and “transcript-rand” categories). Note that our pipeline han-dled all of the above tasks automatically. Once personalizedSurvey 2 was generated, one researcher manually invited thecorresponding participant (within seven days of data upload)to participate in Survey 2 via messaging on Prolific.
Overview of Survey 2: We created a personalized Survey 2(instrument in Appendix A.3) for each participant using atmost fifteen selected data elements, depending on the pres-ence/absence of a particular class. During the survey, we firstshowed these data elements randomly to the participants andcorrespondingly asked some related questions, e.g., what arethe contents of the data element and how comfortable is theparticipant in sharing it with people in different proxemiczones [21] as well as Google. Note that participants were notprovided with any clue about the possibly sensitive nature
of these data elements at this stage of Survey 2. Next, wegave participants a brief explanation of the respective classesfrom which the data elements for their personalized surveywere selected. The participants also rated the accuracy ofthose explanations. Then, to demonstrate the possible outputof automated techniques to uncover sensitive data elements,we asked participants to review a personalized Google Drivefolder with named files and subfolders containing categorizedpossibly sensitive GVA data. Then we asked questions tomeasure user awareness about GVA after seeing this folder.We concluded by asking about the utility of an automatedsystem for detecting sensitive GVA-collected data. In the end,we gave instructions to uninstall the browser extension.
3.6 Limitations
First, our study is limited in recruitment since we recruitedonly US Prolific users who primarily use Android smart-phones and are familiar with GVA. In other words, we mighthave chosen primarily English speaking users who are alsomore frequent Android and GVA users than average. How-ever, US-based users are still an important portion of the GVAuser base and any privacy issue uncovered by exploring ex-perienced GVA users possibly also affects lesser experiencedusers. Second, we focused on GVA users who also used anAndroid device as their primary smartphone. Since GVA isalso available in iOS and third-party IoT devices, we mighthave missed those users. However, this is expected since, inthis study, we aimed to investigate the most prominent users ofGVA—Android users (GVA is installed by default in Android,unlike iOS). Consequently, some of our survey participants’perceptions about data collection might not be representativeof data collected by other voice assistants, which might beused in a different context (e.g., a voice assistant integratedinto a children’s toy Third, a few of our participants mightconsider some of our questions as probing based on both lan-guage of the question and their prior experience—introducingbias in some of our self-reported data-based results. Lastly,our results might have underestimated privacy needs as veryprivacy-sensitive individuals would be unlikely to participatein a study that aimed to investigate their GVA data. Not cov-ering such privacy-sensitive individuals is a common concernwith user studies related to privacy [30]. However, we stronglyfeel that this work is still valuable since we unpack commonprivacy perceptions of GVA users regarding their data andidentify possible avenues to improve data dashboards andsimplify privacy controls for this data.
4 Data Analysis
We performed both quantitative and qualitative analyses ofparticipants’ survey responses. In this section, we briefly elab-orate on our data analysis process.
Qualitative open coding: We performed qualitative opencoding to analyze free-text responses [25]. First, an author an-alyzed the responses to each question and created a codebook.Next, two researchers independently coded the responses us-ing this shared codebook. Across all questions, Cohen’s kappa(inter-rater agreement) ranged from 0.769 to 1.0 signifyingnear-perfect agreement. At last, the coders met to resolvedisagreements and finalized a code for each response.
Quantitative statistical analysis: To gain more insight intothe collected quantitative data, we performed several statis-tical tests [16, 18]. When the independent variable was cate-gorical, and the dependent variable was numerical, we foundall distributions were non-normal (using the Shapiro Wilkestest) and nearly all independent variables with more than twolevels. Therefore, we decided to opt for the Kruskal Wallistest for comparing distributions in such cases. When bothindependent and dependent variables were categorical, weused either the χ2 test or Fisher’s exact test (when individualcell values in the contingency table were < 5) to find signifi-cant correlations. We also used difference in proportions as ameasure of effect size in our analysis. Apart from statisticaltests, we used standard evaluation metrics such as accuracy,precision, and recall to test our prediction model [3, 8].
5 Results
In this section, we present results from our study on under-standing user perceptions and privacy preferences regardingGVA data. Unless otherwise specified, results in this sectionwill correspond to self-reported data and not actual usagedata. In specific analyses (e.g., sharing comfortability) involv-ing audio clips and transcripts from Survey 2, we sometimesdiscounted very few elements due to lack of user feedback.
5.1 ParticipantsA total of 80 participants completed both Survey 1 and Sur-vey 2. We start by checking the basic demographics of thoseparticipants in this section.
Basic demographics: Our participant pool had a slight genderbias—68.8% self-identified as male, 30% as female, and 1.2%as non-binary. In terms of age—30% were 18-24 years old,31.3% were 25-34 years old, and 26.3% of the participantswere between 35 and 44 years. Our participants self-identifiedthemselves with several ethnicities—66.3% reported them-selves as White, 13.8% as Asian or Pacific Islander, 8.8% asBlack or African American and 6.3% as Hispanic or Latino.The rest had mixed ethnicity. The majority of our participantswere employed—47.5% employed full-time and only 20%identified as students. In our sample, 53.75% of participantshad a bachelor’s degree or higher, and only 30% were asso-ciated with computer science or a related field. Overall, ourparticipants came from a wide demographic spread.
Usage of Android smartphones: Even though we did notspecifically attempt to recruit long-time Android users, 91.3%of our participants reported using an Android smartphonefor three years or more. Furthermore, 90% of participantsalso mentioned using their current Google Account on An-droid smartphones for three years or more. We had an activeAndroid-user sample— 61.3% of participants used their smart-phones daily for 2 to 6 hours and 26.3% for 6 to 10 hoursand 6.3% daily for more than 10 hours. The participantsused different smartphone applications—54.5% participantshad more than 50 apps on their phones at the time of thestudy. The majority of our participants were familiar withadvanced Android features such as rooting, developer options,and launchers (over 70% participants for each). In our sample,87.5% of participants owned devices running recent Androidversions (9 or 10) manufactured by nine different manufactur-ers. Overall, our participants were long term Android users,well aware of advanced features, and had moderate to highdaily usage.
5.2 Characterizing GVA usage (RQ1)
In this subsection, we present results on general usage patternsof GVA as well as the context for such usage.
General usage: 72.5% of our participants were long-timeGVA users, with 43.8% participants using GVA for threeyears or more, and 28.8% using it for two years and 17.5%for a year. In terms of usage frequency, 43.8% of participantsused GVA at least once a day, 30% used it a couple of timesper week, and the remaining 26.2% of participants used itonce a week to a couple of times per month. Participantsused different methods to activate GVA (with some usingmultiple methods)—76.3% of participants used a hotword(e.g., “OK Google”), and 56.3% activated GVA by touching,pressing, or holding buttons on their device. Interestingly,97.5% of participants used GVA in three broad zones: home,office, and car encompassing both professional and personallives. Additionally, 38.8% of participants also reported usingGoogle smart speakers. Using actual usage data collected inpart 1 of the study (as described in Section 3.4), we foundthat interactions with GVA resulted in 138,874 data elementsstored in Google’s servers. The median participant had 837.5data elements, signifying non-negligible usage of GVA. Anoverview of participants’ GVA data is in Table 2 and year-wise statistics are in Table 10 of Appendix C.
Understanding context of GVA usage: To understand thecontext for using GVA, we analyzed participant responses tothe question-For what purposes do you use Google Assistanton your Android smartphone? from Survey 1. The commonreasons for using GVA were getting local information (50),communicating with others (29), resolving a query (28), play-ing audio and video files (27), navigating through devices(25), controlling other devices (24), entertainment such as

Data element Total Min. Median Max.# Audio w/ transcript 83,635 12 354 19,451# Only transcripts 55,243 0 273.5 4671# Ambient location 84,309 1 407.5 12,504Total # data elements 138,878 16 837.5 22,073Age of data (yrs.) NA 1 3 8
Table 2: Overview of participants’ GVA data.
games, jokes, etc. (16), and planning their day (14). Thus,participants used GVA for a wide number of purposes.
Usage of GVA in smartphones: For each of the 1,027 dataelements (audio and transcript) presented in Survey 2, weasked participants to choose the device that, according tothem, collected each data element (GVA can run in multipledevices). Participants reported that 494 (73.9%) out of 668audio clips were collected by GVA installed on smartphones,whereas smart speakers collected only 92 clips, indicating abias towards smartphones for GVA usage. For a non-trivial 81clips, participants either did not recall or even did not know.The results are similar for transcripts where 229 (63.78%) outof 359 transcripts were collected by GVA on smartphones,and smart speakers collected 57 transcripts; the participantscould not recall or didn’t know the source for the rest. Thus,most data elements presented in Survey 2 were collected byGVA on smartphones. We note that this bias towards GVA useon Android smartphones could be because of our inclusioncriteria since we recruited users of Android, which has GVApre-built into it. Still, our finding hints at an important domainof heavy data collection by GVA on smartphones in a widevariety of contexts.
Summary: 73.8% of our participants used GVA frequently(at least a couple of times per week or more). The majorityof GVA usage happened in smartphones in multiple contexts,and our median participant contributed a total of 837.5 dataelements. The median age of GVA data was 3 years.
5.3 User Perceptions of GVA Data (RQ2)Next, we check whether participants understood how Googlehandled any GVA-related data. Specifically, we investigateuser perceptions regarding GVA data collection and storageusing data from Survey 1.
Perceptions of overall data collection: First, we identified(using the Google account of the authors) that there are sevendifferent types of data collected (at most) by GVA. We ver-ified these types in our automated data collected phase too.Table 3 shows the seven different types of data collected (atmost) by GVA. The top three are the most obviously sensitivedata types (audio, transcript, location), whereas the rest canbe considered metadata. Recall that we referred to these threeobviously sensitive data types as data elements in this work.To understand the awareness about GVA data collection, we
Data Type Descriptionaudio Audio clip of conversationtranscript Transcript of conversationlocation Ambient location at the time of use
date Date of conversationepoch Time of conversationnoti Notifications sent by GVAtrig Activation method (w/ or w/o hotword)
Table 3: Types of data collected by GVA
Figure 3: Participant awareness of collected data types andcomfort in sharing them with Google. Data types perceived tobe collected/not-collected correlated with participant comfortin sharing with Google (Fisher’s exact, p < 0.0001).
asked participants-Do you think that Google Assistant on yourAndroid smartphone collects any kind of data while you areusing it? in Survey 1. 78.8% of our participants respondedaffirmatively with “Yes”, and an additional 20% responded“Maybe”, signifying the participants are well-aware of possi-ble data collection by GVA.
Perceptions of specific data collection: However, then wedug deeper and asked -What pieces of data do you think arecollected when you use Google Assistant on your Androidsmartphone?, showing participants the list given in Table 3.Most participants expressed that GVA collected data such asthe date (89.1%) and time (85.7%) of conversations as well asthe activation method (81.5%). Interestingly, comparativelyfewer participants were aware that GVA collected sensitivedata types such as the transcripts of conversations (73.9%)and the ambient location (70.58%). Just 61.3% of participantsbelieved that GVA collected audio clips of conversations,implying that a non-trivial 38.7% of users were unaware aboutthe collection of audio clips by GVA.
Correlation between awareness of data collection and com-fort in sharing data with Google: Next, we asked partici-
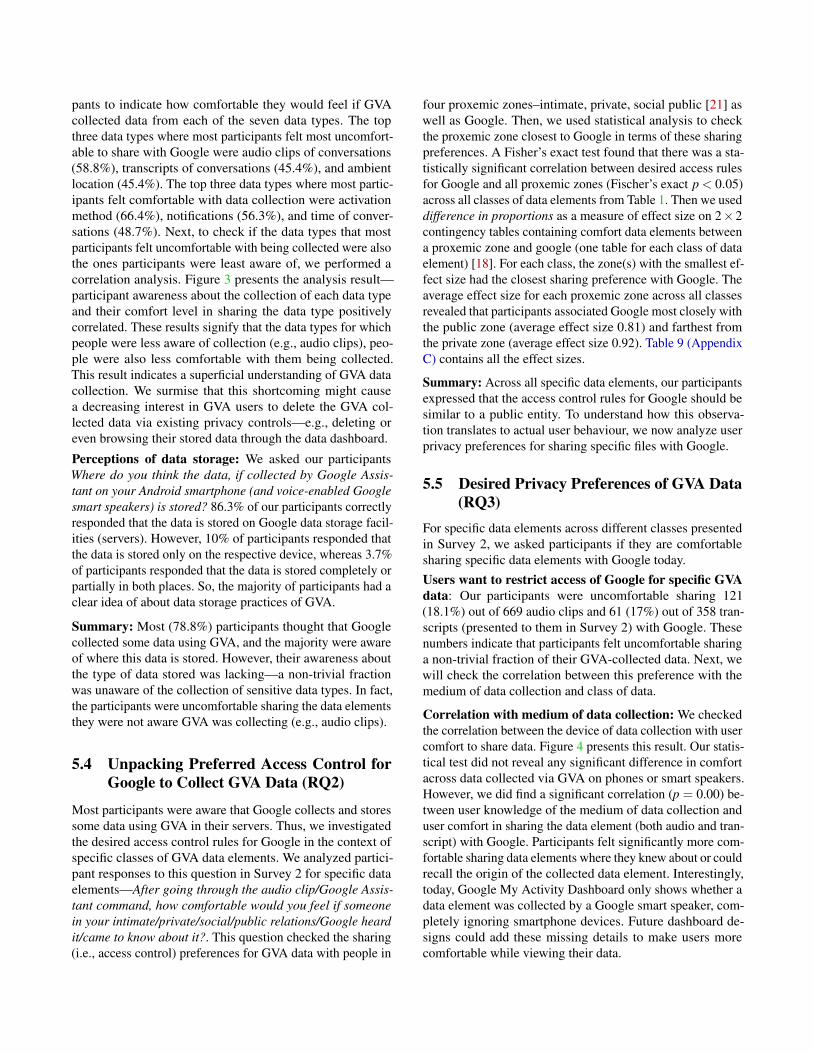
pants to indicate how comfortable they would feel if GVAcollected data from each of the seven data types. The topthree data types where most participants felt most uncomfort-able to share with Google were audio clips of conversations(58.8%), transcripts of conversations (45.4%), and ambientlocation (45.4%). The top three data types where most partic-ipants felt comfortable with data collection were activationmethod (66.4%), notifications (56.3%), and time of conver-sations (48.7%). Next, to check if the data types that mostparticipants felt uncomfortable with being collected were alsothe ones participants were least aware of, we performed acorrelation analysis. Figure 3 presents the analysis result—participant awareness about the collection of each data typeand their comfort level in sharing the data type positivelycorrelated. These results signify that the data types for whichpeople were less aware of collection (e.g., audio clips), peo-ple were also less comfortable with them being collected.This result indicates a superficial understanding of GVA datacollection. We surmise that this shortcoming might causea decreasing interest in GVA users to delete the GVA col-lected data via existing privacy controls—e.g., deleting oreven browsing their stored data through the data dashboard.
Perceptions of data storage: We asked our participantsWhere do you think the data, if collected by Google Assis-tant on your Android smartphone (and voice-enabled Googlesmart speakers) is stored? 86.3% of our participants correctlyresponded that the data is stored on Google data storage facil-ities (servers). However, 10% of participants responded thatthe data is stored only on the respective device, whereas 3.7%of participants responded that the data is stored completely orpartially in both places. So, the majority of participants had aclear idea of about data storage practices of GVA.
Summary: Most (78.8%) participants thought that Googlecollected some data using GVA, and the majority were awareof where this data is stored. However, their awareness aboutthe type of data stored was lacking—a non-trivial fractionwas unaware of the collection of sensitive data types. In fact,the participants were uncomfortable sharing the data elementsthey were not aware GVA was collecting (e.g., audio clips).
5.4 Unpacking Preferred Access Control forGoogle to Collect GVA Data (RQ2)
Most participants were aware that Google collects and storessome data using GVA in their servers. Thus, we investigatedthe desired access control rules for Google in the context ofspecific classes of GVA data elements. We analyzed partici-pant responses to this question in Survey 2 for specific dataelements—After going through the audio clip/Google Assis-tant command, how comfortable would you feel if someonein your intimate/private/social/public relations/Google heardit/came to know about it?. This question checked the sharing(i.e., access control) preferences for GVA data with people in
four proxemic zones–intimate, private, social public [21] aswell as Google. Then, we used statistical analysis to checkthe proxemic zone closest to Google in terms of these sharingpreferences. A Fisher’s exact test found that there was a sta-tistically significant correlation between desired access rulesfor Google and all proxemic zones (Fischer’s exact p < 0.05)across all classes of data elements from Table 1. Then we useddifference in proportions as a measure of effect size on 2×2contingency tables containing comfort data elements betweena proxemic zone and google (one table for each class of dataelement) [18]. For each class, the zone(s) with the smallest ef-fect size had the closest sharing preference with Google. Theaverage effect size for each proxemic zone across all classesrevealed that participants associated Google most closely withthe public zone (average effect size 0.81) and farthest fromthe private zone (average effect size 0.92). Table 9 (AppendixC) contains all the effect sizes.
Summary: Across all specific data elements, our participantsexpressed that the access control rules for Google should besimilar to a public entity. To understand how this observa-tion translates to actual user behaviour, we now analyze userprivacy preferences for sharing specific files with Google.
5.5 Desired Privacy Preferences of GVA Data(RQ3)
For specific data elements across different classes presentedin Survey 2, we asked participants if they are comfortablesharing specific data elements with Google today.Users want to restrict access of Google for specific GVAdata: Our participants were uncomfortable sharing 121(18.1%) out of 669 audio clips and 61 (17%) out of 358 tran-scripts (presented to them in Survey 2) with Google. Thesenumbers indicate that participants felt uncomfortable sharinga non-trivial fraction of their GVA-collected data. Next, wewill check the correlation between this preference with themedium of data collection and class of data.
Correlation with medium of data collection: We checkedthe correlation between the device of data collection with usercomfort to share data. Figure 4 presents this result. Our statis-tical test did not reveal any significant difference in comfortacross data collected via GVA on phones or smart speakers.However, we did find a significant correlation (p = 0.00) be-tween user knowledge of the medium of data collection anduser comfort in sharing the data element (both audio and tran-script) with Google. Participants felt significantly more com-fortable sharing data elements where they knew about or couldrecall the origin of the collected data element. Interestingly,today, Google My Activity Dashboard only shows whether adata element was collected by a Google smart speaker, com-pletely ignoring smartphone devices. Future dashboard de-signs could add these missing details to make users morecomfortable while viewing their data.

Figure 4: User preferences for sharing audio clips collectedby different devices with Google. Preferences for transcriptsfollowed a similar trend.
Correlation with auto-detected classes of data element:Participants felt most uncomfortable sharing audio clips con-taining regret words (24.4% of all elements from that class),followed by audio clips having multiple speakers (21.1%)and transcripts containing regret words (20.8%). However,a Kruskal Wallis test revealed no significant differences be-tween privacy preferences for data elements belonging todifferent classes. This result implies that perhaps these simpleclasses (often based on word matching) were insufficient toaccurately identify the GVA-collected data elements whereparticipants wanted to restrict access.
Summary: Participants want to restrict access for a non-trivial fraction of their GVA-collected data, which underlinesa need to simplify data dashboards for identifying such dataelements. Interestingly, showing users the origin of their col-lected data made them more comfortable sharing their data.Our simple NLP and signal processing based classes wereunable to capture sensitive data elements. Thus, we need morecomplex tools to identify such sensitive data elements thatusers are uncomfortable sharing.
5.6 Understanding Utility of Data Dashboardfor privacy control (RQ4)
As highlighted in the previous subsection, GVA users wantedto restrict access to 17.7% of GVA-collected data. Todaythe My Activity Dashboard is the only Google-provided way(aside from legal interventions) for the users to delete thisdata (albeit post-facto) and control privacy. Therefore, wesought to understand user perceptions regarding the utility ofthis dashboard.
Perceptions of data accessibility: First, we checked whetherparticipants were aware that they could access the data col-lected by GVA. 61.3% participants believed that the datacould be accessed, while 32.5% responded that it might beaccessed, indicating the majority are at least aware of thepossibility of a tool like the data dashboard.
Popularity and usage of data dashboard: Now, we check ifparticipants knew about the My Activity dashboard. 40 (50%)
participants responded that they had heard of it, 10% werenot sure, whereas a surprisingly high 40% of participants hadnever heard of the data dashboard. Among the 40 participantswho had heard of the My Activity dashboard, 4 participantshad never visited it, and 33 of the remaining 36 participantsvisited their dashboards less than once per month. In effect,only 3 (3.8%) out of 80 participants visited their dashboardsmore than once a month. According to the 36 participantswho had visited their respective dashboards before our study,the top reasons for visiting it were–(i) To simply check it out(30), (ii) To view collected data (18), (iii) To change activitysettings (11), and (iv) To delete some data (9). We asked 50participants who were unsure/unaware to visit the data dash-board to check their GVA-collected data before continuingwith the study.
Unpacking perceptions of data dashboard: Since all par-ticipants had explored their dashboards at least once by thispoint in the study, we asked them how comfortable they feltwhile viewing the data on their dashboard and why. On a scaleof 1 to 5 (1 being very uncomfortable), the average comforta-bility rating was 3.26 (σ = 1.06, median = 3), indicating thatmost participants felt neither comfortable nor uncomfortableviewing the data. In fact, our qualitative analysis revealed thatparticipants had mixed reactions to GVA data presented inthe dashboard. 37.5% of our participants were either botheredor surprised by the information collected. For instance, P31said, “I know that google is collecting information, but I amnot 100% comfortable to see the amount they collect. Thereis really no privacy.” 15% of participants were glad that thedata was available, and 6.25% of participants were unsure oftheir choice. The remaining 41.25% of participants were nei-ther bothered nor surprised. For example, P12 told, “I alreadyknow Google was collecting all of the information I saw.”Using a Kruskal Wallis test (p = 0.029), we found that partic-ipants who had heard of the Google My Activity dashboardbefore the study were more comfortable (N = 40, µ = 3.525)in viewing collected data, as compared to participants whohad never heard of the dashboard (N = 32, µ = 2.875). There-fore, participants grew more comfortable with the dashboardas they became more familiar with it. Our results stronglysupport the need for data dashboards since participants feelmore in control (and thus comfortable) when they can see andmanage their data.
Understanding usability of data dashboard: To check theusability of the data dashboard, we asked our participants thequestion-How easy was it to reach and find what you werelooking for?, using a 5-point scale (1 being very difficult and5 being very easy). The average rating was 4.025 (σ = 0.899,median = 4). Thus, most participants found My Activity Dash-board easy to reach. To get a better idea of any difficultiesfaced by participants during navigation, we then asked themthe question-Did you face any difficulties or problems in navi-gating through your Google My Activity Dashboard? Qualita-

tive analysis showed that 8 (10%) out of 80 participants foundit hard to navigate through the dashboard to find their data.For example, P62 said, “There is so much data it is a littleoverwhelming.” 2 participants did not check their dashboards,and 1 participant faced some problems with navigation butdid not elaborate on it. The remaining 69 participants didnot report any difficulties with navigation. 16.25% of par-ticipants said they would like some assistance in using thedashboard, and another 10% told that they might want someassistance. The remaining 73.75% of participants indicatedthat they would not like any assistance. We found a positivecorrelation (Fisher’s exact test, p = 0.048) between the dura-tion of using GVA (less or more than around 2 years) withthe need for assistance in using the dashboard, highlighting apossible cognitive overload for long-time GVA users.
Summary: We found an interesting knowledge gap withinour participants—93.8% of participants thought their GVA-collected data can or may be accessed. However, only 50% ofthe participants were aware of the data dashboard, showinga lack of actionable knowledge. Even the people who knewabout data dashboards, just 3.75% visited it regularly. In fact,more than one-third participants (37.5%) felt bothered orsurprised while viewing the collected data. Quite assuringly,most participants found the dashboard easy to use; however,10% of participants also found it difficult to access their data.We observed that more long-time GVA users expressed aneed for assistance in using the dashboard, suggesting themore they become familiar with the dashboard, the moreoverwhelmed they might get with the huge data collected byGVA over time.
5.7 Moving towards Improving Utility of DataDashboards (RQ4)
Currently, Google’s My Activity Dashboard provides twoways to delete collected data- (i) users can either inspectand delete each data element individually, or (ii) delete alldata elements stored within a specified date-time range. Theformer is particularly not useful from a privacy perspectivebecause inspecting a large number of collected data elements(most of which are non-sensitive) is quite time-consumingand laborious to be practically feasible, as seen in the previ-ous subsection. On the other hand, the latter can help enforceprivacy but is not a good option for users who might wantto retain some/all of their collected data for future reference,assisting product development, etc. To assist users with find-ing their possibly sensitive data collected by GVA, we did asimple proof-of-concept test—around the end of Survey 2,we showed them a personalized Google drive with data ele-ments divided into subfolders according to their auto-detectedclasses from Table 1 (with classes as subfolder names) andasked if a system which can show such classifications willbe useful. Recall that these classes were constructed with
privacy-violating scenarios in mind, and hence some of thedata elements were expected to be sensitive.
Recommending elements in data dashboards: After par-ticipating in the study, 56.3% of participants reported thatthey were very likely to delete some of their data collected byGoogle. 65% of participants said that our classifier providedvaluable assistance in finding sensitive data on Google servers,and 72.5% told that they would recommend others to try it outif made publicly available. This percentage was 50% higherthan the 27.5% of participants who expressed a need for as-sistance in finding sensitive data on Google servers in Survey1, indicating a strong demand for such a recommendationsystem in data dashboards.
The efficacy and challenge in providing recommendations:The primary challenge that we faced while developing oursensitive content detection system was related to the accuracyof the system in assigning classes to the data elements. On a 5-point Likert scale (1 is very inaccurate and 5 is very accurate),the average rating provided by participants to our classifierwas just 2.67 (σ = 0.96, median = 3), suggesting that mostparticipants did not find it highly accurate. Additionally, 20participants provided qualitative feedback regarding the study.9 out of these 20 participants pointed out that the system ac-curacy could be improved. For example, P60 stated: “OverallI found the sensitive content system not to be very accurate.It some cases it was correct, but in more cases it was ratherincorrect.” Despite the low perceived accuracy of the classifi-cation, we found it surprising that 65% of participants foundit useful to find sensitive content. P71 further explained theconnection between classification accuracy and helpfulnessof our recommendation system: “Perhaps try improving theaccuracy. I noticed that while it did get some things right, it’dperiodically get things wrong. I’m not expecting the system tobe perfect though but if you can improve the accuracy at allthat’d be great.”
To better understand this result, we looked at participantaccuracy scores and sharing preferences for individual dataelements presented in Survey 2. Out of 52 (65%) participantswho believed that our system provided valuable assistance infinding sensitive data (i.e. who liked our classification pre-sentation potentially irrespective of accuracy), we focused on36 participants who rated at least one encountered data ele-ment >= 3 for accuracy and also felt neutral or uncomfortablesharing it with Google. We observed that 29 (80.6%) of these36 participants found our system to be helpful (i.e. they foundour classification accurate). So, our results hinted that evenwhen our classifier was able to detect at least one possiblysensitive file, most participants found it useful, signifying aneed for such recommendations.
Summary: Accurate recommendations of possibly sensitivedata elements help users restrict access and protect the pri-vacy of their VA-collected data. Encouragingly, recommend-ing users to revisit even one accurately sensitive data element

collected by GVA made them highly (80.6%) likely to con-trol their collected data, highlighting the demand for accurate,usable dashboards. This finding strongly underlines the effi-cacy of a highly accurate sensitive-element recommendationsystem to improve the utility of data dashboards. In the nextsection, we present the feasibility of building such an auto-mated, highly accurate, sensitive content detection system.
6 Feasibility of Accurately RecommendingSensitive Data in Data Dashboards
Earlier, we saw that voice assistants like GVA collect andstore large amounts of user data. While deleting all collecteddata in bulk can help avoid privacy violations, in Survey 2,participants mentioned not deleting the shown data elementsfor 64.8% (674 out of 1040 data elements shown) of cases.Our open coding of their explanations revealed interestingthemes—the prominent reasons for not immediately deletingthese 674 data elements was that these data elements werenon-sensitive (24.0% of data elements), improving Google As-sistant or Google services in general (8.2%). For eg., P48 said,“I don’t mind Google having access to clips like this to im-prove their services.” Other reasons for not deleting collecteddata included having the choice to view or delete previouslycollected data at will (1.4%) and personalized recommenda-tions from Google (0.4%). In the case of better personalizedrecommendations, P32 explained, “I don’t mind if Googleknows hat music I listen to, especially if it improves it’s musicsuggestion service.” For 17.7% of data elements, participantsdid not mention any specific reason, but they wanted Googleto carry out their processing and delete this data within a timeframe (e.g., after 3 months).
Even though companies provide data dashboards for usersto access this data (e.g., My Activity Dashboard by Google),current dashboard designs do not offer mechanisms for usersto efficiently sift through and restrict access to specific data el-ements. To that end, our results (section 5.7) hint at a need foran improved human-in-the-loop (HITL) GVA data dashboarddesign—we envision an interface that can prioritize poten-tially sensitive content in the dashboard interface and assistusers in controlling the privacy of their GVA-collected data.However, auto-detecting and restricting access to sensitivedata elements to help users is also challenging as sensitivitycan depend on external factors (e.g., user’s age, frequencyof use, other personal reasons, etc.) aside from the contentof data elements. To that end, we explored the feasibility ofrecommending sensitive data elements in data dashboardsin a HITL scenario where the recommendation is only tohelp users find such data elements and not to take away theircontrol. Companies could leverage such recommendationsto improve their data dashboards by presenting possibly sen-sitive data to their users for review. We envision that suchdata elements can be presented either by creating a separate
review section in a dashboard or changing the default rankingof shown content.
6.1 Modelling Sensitive Content Detection asa Supervised Prediction Task
Our prediction task involved predicting whether a user willperceive a particular data element collected by GVA as sensi-tive. For classification, our training dataset consisted of tuples(Xi, Yi), where Xi represents the feature vector, and Yi repre-sents the sensitivity label of a data element i. The predictiontask involved binary classification, where Yi = 1 correspondedto the ‘Yes’ label (sensitive class) and Yi = 0 correspondedto the ‘No’ label (not sensitive class). The feature vector Xiincluded audio-based features, text-based features, and user-based features, all of which were captured through user sur-vey responses and shared GVA data. The audio-based fea-tures that we used were Mel-Frequency Cepstral Coefficients(MFCC) [44], spectral contrast, tempo, and SoundNet-basedfeatures [6]. The text-based features included LIWC-basedfeatures, sentence embedding, presence of swear words, pres-ence of regret words, sentiment-based features, emotion-basedfeatures, and presence of top 100 unigrams and bigrams. Theuser-based features consisted of age range and gender of users,age of Google Account, frequency and span of GVA usage,and association with computer science or a related field. Thesurvey responses were included either as one-hot encodingor binary indicators for multiple-choice answers. A detaileddescription of all features is in Appendix E.
To perform this classification, we explored several estab-lished supervised ML algorithms such as Support Vector Ma-chines (SVMs), Logistic Regression (LR), Random Forest(RF), Multi-layer Perceptron (MLP), each from the scikit-learn library [32], along with XGBoost (XGB) [14]. We com-pared the performance of these classifiers with two baselines.The first one was a random classifier that randomly assigned alabel to each data element, where prediction probabilities forlabels were chosen based on their prevalence in our dataset.For our second baseline, we used the preliminary categoriza-tion (Table 1) of each data element as the input feature to trainanother XGBoost model called XGB-Class. All model hy-perparameters were optimized using grid search with 10-foldcross-validation. We found the XGB model to perform thebest and thus use it to report our final performance metrics.
6.2 Our DatasetOur dataset consisted of 542 audio clips and 412 transcripts.Each data element was associated with one of three sensi-tivity labels by the users during Survey 2- ‘Yes’ (sensitiveclass), ‘No’ (not sensitive class), and ‘I am not sure’ (ambigu-ous). Since data sensitivity is subjective, we considered theseuser-assigned labels as accurate ground truth for our predic-tions. The distribution of labels in the dataset was as follows-

18.34% ‘Yes,’ 63.94% ‘No,’ and 17.72% ‘I am not sure.’ Wewere specifically interested in sensitive data elements (labeled‘Yes’) for our prediction task. Since the neutral label, ‘I amnot sure,’ constituted a non-trivial fraction of our dataset, weperformed four different experiments, treating it as a separatelabel each time. In each experiment, we trained our best per-forming XGB classifier using the ‘I am not sure’ label as aproxy for one of these four labels- ‘Yes’ (sensitive class), ‘No’(not sensitive class), ‘Removed’ (do not consider in trainingprocess), and ‘I am not sure’ (treat as a separate class). Thefirst three experiments were binary classification problems,whereas the last one was a three-class classification problem.The best results were obtained associating the ‘I am not sure’label with the not sensitive class (’No’ label), which semanti-cally also implies a conservative prediction—recommendingonly data element where the classifier is certain that its sensi-tive. Hence, we report the results of only this experiment inthe paper. The rest of the results are in Appendix B.
6.3 Experimental Setup
We performed 10-fold cross-validation and reported macro-averaged precision, recall, and F1 scores for each classifier.Here, precision is defined as the ratio, TP/(TP+FP), whereTP refers to the number of true positive predictions, andFP refers to the number of false positive predictions. Sim-ilarly, recall is defined as TP/(TP+FN), where FN refers to thenumber of false negative predictions. Since our dataset washighly skewed away from the class of our interest, we used theSynthetic Minority Oversampling TEchnique (SMOTE) [13]to balance our dataset before training the models. SMOTEaims to balance imbalanced datasets by oversampling or ran-domly replicating samples from the minority class. We usedthe implementation of SMOTE provided by the imbalanced-learn [26] Python library.
Next, we plotted precision-recall (PR) curves (averagedover 10-folds) for each classifier to analyze the trade-off be-tween showing a larger number of sensitive data elements tothe users and the accuracy in finding such elements, reflectedby recall and precision values, respectively. Maximizing bothprecision and recall is often not mathematically possible. Inpractice, a classifier with high precision and low recall re-turns fewer but relevant results, whereas a classifier with highrecall and low precision returns many but irrelevant results.Therefore, achieving a balance between precision and recallis crucial for such classifiers to recommend as many sensitivedata elements as possible to the user. A valuable heuristic tocapture this trade-off between precision and recall is precision-recall area under curve (PR-AUC). A higher value of PR-AUCfor a classifier shows its ability to achieve both good precisionand recall. We calculated the PR-AUC values for differentclassifiers from their PR curves and used it as a metric toquantify their overall performance.
Finally, we used precision@k to assess different classifiers
Model Precision Recall F1 scoreProposed Feature-based Models
SVM 0.90 0.89 0.89LR 0.92 0.91 0.91RF 0.83 0.83 0.83
MLP 0.91 0.91 0.91XGB 0.96 0.95 0.95
Baseline ModelsRandom 0.51 0.52 0.44
XGB-Class 0.54 0.54 0.54
Table 4: Macro-averaged Precision, Recall, F1-score for allmodels. The highest values in each column are boldfaced.
from a recommendation system’s perspective. In a practicalscenario, it is unlikely that a user will go over all suggestionsof sensitive data elements presented on their data dashboard.In such cases, a classifier must sort their recommendationsand minimize the number of false positives within top k rec-ommendations. We report this value using precision@k. Pre-cision@k is simply the proportion of correct classificationswithin top k recommendations. A higher value of precision@ksignifies good quality of recommendations.
6.4 Results
Our ML models tried to predict whether a particular data ele-ment will be perceived by the user as sensitive or not. Table 4shows the macro-averaged precision, recall, and F1 scores forall models. Across all models, XGB offered the best perfor-mance with an F1 score of 0.95, followed by LR and MLP,each of which achieved an F1 score of 0.91. The best per-forming baseline model was XGB-Class which achieved anF1 score of 0.54. Our XGB model outperformed the best-performing baseline model by approximately 76%.
Figure 5 shows the PR curves generated for all models.Once again, the XGB model performed the best, achieving anear-perfect PR-AUC value of 0.9894, followed by LR thatachieved a PR-AUC value of 0.9283. The XGB model showeda significant improvement over the XGB-Class baseline model(PR-AUC = 0.5452), outperforming it by approximately 81%.
Figure 6 shows the precision@k curves generated for allmodels. Looking at the top 30 predictions, the XGB and RFmodels performed the best, achieving a perfect precision@30value of 1. They were followed by MLP, which achieveda precision@30 value of 0.9. Other models such as SVMand LR had relatively poor precision@30 values compara-ble to the precision@30 value of 0.57 for the XGB-Classbaseline model. To distinguish between the performance ofXGB and RF models, we looked at their precision@k valuesfor large values of k. We observed a slight drop in perfor-mance while varying k from 1 to 500 for the RF model (pre-cision@500 = 0.954), whereas the XGB model retained itsperformance (precision@500 = 1) even for larger values of

0.2 0.4 0.6 0.8 1.0
recall
0.0
0.2
0.4
0.6
0.8
1.0
prec
isio
n
SVM (0.8416)LR (0.9283)RF (0.9144)MLP (0.8867)XGB (0.9894)Random (0.2337)XGB-Class (0.5452)
Figure 5: PR curves while classifying data elements (SVM,LR, RF, MLP, and XGB are evaluated ML models, whereasRandom and XGB-Class are baseline models)
0 5 10 15 20 25 30
k
0.0
0.2
0.4
0.6
0.8
1.0
precision
SVMLRRFMLPXGBRandomXGB-Class
Figure 6: Precision@k curves while classifying data elements(SVM, LR, RF, MLP, and XGB are evaluated ML models,whereas Random and XGB-Class are baseline models)
k, highlighting the stability of XGB model (Figure 15 of Ap-pendix C). Despite achieving a lower F1 score and PR-AUCvalue than models such as LR, the RF model offered betterperformance in the scenario where only a few data elementsshould be presented to users. Although our best-performingXGB model achieved a high F1-score of 95%, resourcefulorganisations like Google might be able to further improveaccuracy in real-world deployments with additional labeleddata.
6.5 Understanding Prediction Accuracy
Finally we analyzed the features that played the most impor-tant role in our prediction task.
Many of the important features are user-based: Table 5shows the top ten features identified by our best performingXGB classifier, in decreasing order of importance. Three outof the top five features were user-based, which highlights thatuser details are crucial in predicting the perceived sensitivityof data elements. Five out of the top ten features were text-
Rank Feature Type Name1 User-based Age of Google Account2 User-based Frequency of GVA usage3 Text-based Sentiment-based4 User-based Age range of user5 Audio-based SoundNet-based6 Text-based LIWC-based7 Text-based Presence of top 100 unigrams8 Text-based Sentence Embedding9 User-based Association with CS or a related field10 Text-based Presence of regret words
Table 5: Top 10 features as decided by the XGB model indecreasing order of importance
based, implying that the text content of data elements is alsocentral to the prediction task. This is in contrast with the resultin Section 5.5, where we did not find significant differences inuser privacy preferences across simple lexicon-based classes.We believe this contrast is because of using more involvedtextual features (e.g., LIWC, sentence embedding, sentiment).
7 Concluding Discussion
In this work, we present the first study on understanding users’privacy attitudes and preferences regarding data collection byGVA. Specifically, using a real-world data-driven approach,we unpacked users’ knowledge of the data collection prac-tices of GVA. Previous work [19] has looked into generaluser perceptions and reactions towards the Google My Ac-tivity data dashboard. However, we, in contrast, focused onusing real-world GVA-collected data elements to elicit spe-cific user responses. We seek to understand whether suchdata dashboards actually provide utility in controlling dataprivacy through an 80-participant user study grounded into ac-tual GVA-collected data. Recent studies have paid increasedattention to voice assistants on smart home speaker devices.Given the pervasiveness of smartphones, our results showthat smartphone voice assistants can collect data in a varietyof scenarios different from stationary smart speaker devices.Thus, our work sheds light on the data-centric ecosystem ofvoice assistants, with GVA as our test case. Furthermore, inspite of using GVA data dashboards as our test case, many ofour findings on assessing the efficacy of data dashboards andimproving their usability are generalizable to dashboards ofother voice assistants.A new direction towards usable data dashboards: Ourresults establish a definite need for better data dashboardswhile acknowledging the utility of the current one. As a firststep, our results hint at the fact that users have just superficialknowledge about the data collection and storage practicesof GVA. Although data dashboards help to raise awarenessabout the total collected data by GVA, the huge amount ofdata does not help. Long-term users would need automated

assistance to review more sensitive data elements. Thus, ourresults underline a need to make these data dashboards moreusable by helping users uncover sensitive data elements. Ouruser feedback and accurate classification results identify thatmachine-learning based human-in-the-loop systems mightsignificantly help the cause. To that end, we identified thetop ten most important features for this prediction task. Inaddition to text-based and audio-based features already avail-able to the VA platform, our results highlight that user-basedfeatures can also play an important role in identifying sensi-tive content. We believe that a handful of these user-basedfeatures unavailable to the VA platform could be collectedby directly asking the users as part of an initial setup process(while mentioning this will assist the users in finding their sen-sitive data elements). In fact, our second survey, which aimedto raise awareness about different types of data collected byGVA and stored by Google increased user awareness aboutGVA collected data.
However, there is much left to explore in this direction,including the presentation of these recommendations to theusers and checking the efficacy of interface nudges using theserecommendations. For instance, our HITL design to improveusability focused on assisting users in uncovering potentiallysensitive elements. A potential future work is creating andevaluating a query system in parallel to this recommendersystem. Such a system could assist users in sifting through theGVA-collected data efficiently and further improve the usabil-ity of data dashboards. Thus, we strongly feel our work pavesthe way to build more usable data dashboards for better assist-ing users and takes a step forward to bringing transparency tothe data ecosystem of voice assistants.
8 Acknowledgments
We thank the anonymous reviewers and our shepherd CamilleCobb for their valuable feedback. We also thank ShalmoliGhosh for her help with an earlier iteration of this work andNiloy Ganguly for the discussion early in the project. The ex-periments in this work were funded by Huawei TechnologiesIndia Private Limited via the ADUL project.
References
[1] Prolific. https://www.prolific.co/, 2021.
[2] J-F Abramatic, B Bellamy, ME Callahan, F Cate, P vanEecke, N van Eijk, E Guild, P de Hert, P Hustinx,C Kuner, et al. Privacy bridges: Eu and us privacy ex-perts in search of transatlantic privacy solutions. 2015.
[3] Charu C. Aggarwal. Recommender Systems: The Text-book. Springer-Verlag, 2016.
[4] E. Alepis and C. Patsakis. Monkey says, monkey does:Security and privacy on voice assistants. IEEE Access,5:17841–17851, 2017.
[5] Noah Apthorpe, Yan Shvartzshnaider, Arunesh Mathur,Dillon Reisman, and Nick Feamster. Discovering smarthome internet of things privacy norms using contextualintegrity. Proceedings of the ACM on Interactive, Mo-bile, Wearable and Ubiquitous Technologies, 2(2), July2018.
[6] Yusuf Aytar, Carl Vondrick, and Antonio Torralba.Soundnet: Learning sound representations from unla-beled video. In Advances in neural information process-ing systems, pages 892–900, 2016.
[7] Frank Bentley, Chris Luvogt, Max Silverman, RushaniWirasinghe, Brooke White, and Danielle Lottridge. Un-derstanding the long-term use of smart speaker assis-tants. Proc. ACM Interact. Mob. Wearable UbiquitousTechnol., 2(3), September 2018.
[8] Christopher M. Bishop. Pattern Recognition and Ma-chine Learning. Springer-Verlag, 2006.
[9] Manuel Bronstein. A more helpful google assistant foryour every day. https://blog.google/products/assistant/ces-2020-google-assistant/, 2020.(Last accessed on October 2021).
[10] Nicholas Carlini, Pratyush Mishra, Tavish Vaidya,Yuankai Zhang, Micah Sherr, Clay Shields, David Wag-ner, and Wenchao Zhou. Hidden voice commands. InProceedings of the 25th USENIX Security Symposium(USENIX), Sec’16, pages 513–530, August 2016.
[11] Pew Research Center. Nearly half of americans usedigital voice assistants, mostly on their smartphones.https://www.pewresearch.org/fact-tank/2017/12/12/nearly-half-of-americans-use-digital-voice-assistants-mostly-on-their-smartphones/, 2017. (Last accessed on October 2021).
[12] Christopher Champion, Ilesanmi Olade, KonstantinosPapangelis, Haining Liang, and Charles Fleming. Thesmart2 speaker blocker: An open-source privacy filterfor connected home speakers. CoRR, abs/1901.04879.
[13] Nitesh V Chawla, Kevin W Bowyer, Lawrence O Hall,and W Philip Kegelmeyer. Smote: synthetic minorityover-sampling technique. Journal of artificial intelli-gence research, 16:321–357, 2002.
[14] Tianqi Chen and Carlos Guestrin. Xgboost: A scalabletree boosting system. In Proceedings of the 22nd ACMSIGKDD International Conference on Knowledge Dis-covery and Data Mining, KDD ’16, page 785–794, NewYork, NY, USA, 2016.

[15] M. Courtney. Careless talk costs privacy [censorshipdigital assistants]. Engineering Technology, 12(10):50–53, 2017.
[16] W.J. Dixon and Jr. Massey, FJ. Introduction to statisticalanalysis. McGraw-Hill., 1951.
[17] Jide S. Edu, Jose M. Such, and Guillermo Suarez-Tangil.Smart home personal assistants: A security and privacyreview. ACM Computing Surveys, 53(6), 2020.
[18] Paul D. Ellis. The Essential Guide to Effect Sizes. Cam-bridge University Press, 2010.
[19] Florian Farke, David G. Balash, Maximilian Golla,Markus Dürmuth, and Adam J. Aviv. Are privacy dash-boards good for end users? evaluating user perceptionsand reactions to google’s my activity. In Proceedings ofthe 30th USENIX Security Symposium, Sec’21, August2021.
[20] Denis Feth and Hartmut Schmitt. Requirement andquality models for privacy dashboards. In 2020 IEEE 7thInternational Workshop on Evolving Security PrivacyRequirements Engineering (ESPRE), 2020.
[21] Edward Twitchell Hall. The hidden dimension, volume609. Garden City, NY: Doubleday, 1966.
[22] Kristina Irion, Svetlana Yakovleva, Joris van Hoboken,and Marcelo Thomson. A roadmap to enhancing usercontrol via privacy dashboards, 2017. https://hdl.handle.net/11245.1/aec2f33f-5c89-492e-b45c-8b953351754e.
[23] Bret Kinsella. Voice assistant use on smartphones rise,siri maintains top spot for total users in the u.s. https://voicebot.ai/2020/11/05/voice-assistant-use-on-smartphones-rise-siri-maintains-top-spot-for-total-users-in-the-u-s/, 2020. (Lastaccessed on October 2021).
[24] Jacob Leon Kröger, Otto Hans-Martin Lutz, and PhilipRaschke. Privacy implications of voice and speech anal-ysis – information disclosure by inference. In MichaelFriedewald, Melek Önen, Eva Lievens, Stephan Krenn,and Samuel Fricker, editors, Privacy and Identity Man-agement, pages 242–258. Springer, 2020.
[25] Jonathan Lazar, Jinjuan Feng, and Harry Hochheiser. Re-search Methods in Human-Computer Interaction. Mor-gan Kaufmann, 2017.
[26] Guillaume Lemaître, Fernando Nogueira, and Christos KAridas. Imbalanced-learn: A python toolbox to tacklethe curse of imbalanced datasets in machine learning.The Journal of Machine Learning Research, 18(1):559–563, 2017.
[27] Yuting Liao, Jessica Vitak, Priya Kumar, Michael Zim-mer, and Katherine Kritikos. Understanding the role ofprivacy and trust in intelligent personal assistant adop-tion. In Proceedings of Information in ContemporarySociety, iConference 2019, pages 102–113. Springer,2019.
[28] Matthew Lynley. Google unveils google assistant, avirtual assistant that’s a big upgrade to google now. https://techcrunch.com/2016/05/18/google-unveils-google-assistant-a-big-upgrade-to-google-now/, 2016. (Last accessed on October 2021).
[29] Nathan Malkin, Joe Deatrick, Allen Tong, Primal Wi-jesekera, Serge Egelman, and David Wagner. Privacyattitudes of smart speaker users. Proceedings on Pri-vacy Enhancing Technologies, 2019(4):250 – 271, 01Oct. 2019.
[30] Mainack Mondal, Günce Su Yilmaz, Noah Hirsch, Mo-hammad Taha Khan, Michael Tang, Christopher Tran,Chris Kanich, Blase Ur, and Elena Zheleva. MovingBeyond Set-It-And-Forget-It Privacy Settings on So-cial Media. In Proceedings of the 2019 ACM SIGSACConference on Computer and Communications Security,CCS ’19, New York, NY, USA, November 2019.
[31] Lily Hay Newman. An alexa bug could have exposedyour voice history to hackers. https://www.wired.com/story/amazon-alexa-bug-exposed-voice-history-hackers/, 2020. (Last accessed on October2021).
[32] Fabian Pedregosa, Gaël Varoquaux, Alexandre Gram-fort, Vincent Michel, Bertrand Thirion, Olivier Grisel,Mathieu Blondel, Peter Prettenhofer, Ron Weiss, Vin-cent Dubourg, et al. Scikit-learn: Machine learningin python. the Journal of machine Learning research,12:2825–2830, 2011.
[33] Sarah Perez. Google is investigating the source of voicedata leak, plans to update its privacy policies. https://techcrunch.com/2019/07/11/google-is-investigating-the-source-of-voice-data-leak-plans-to-update-its-privacy-policies/, 2019.(Last accessed on October 2021).
[34] PRWeb. Over Half of U.S. Adults Are Now UsingVoice Assistants Like Siri and Alexa on Smartphones- New Market Data from Voicebot Research. https://www.prweb.com/releases/over_half_of_u_s_adults_are_now_using_voice_assistants_like_siri_and_alexa_on_smartphones_new_market_data_from_voicebot_research/prweb17536545.htm,2020. (Last accessed on October 2021).
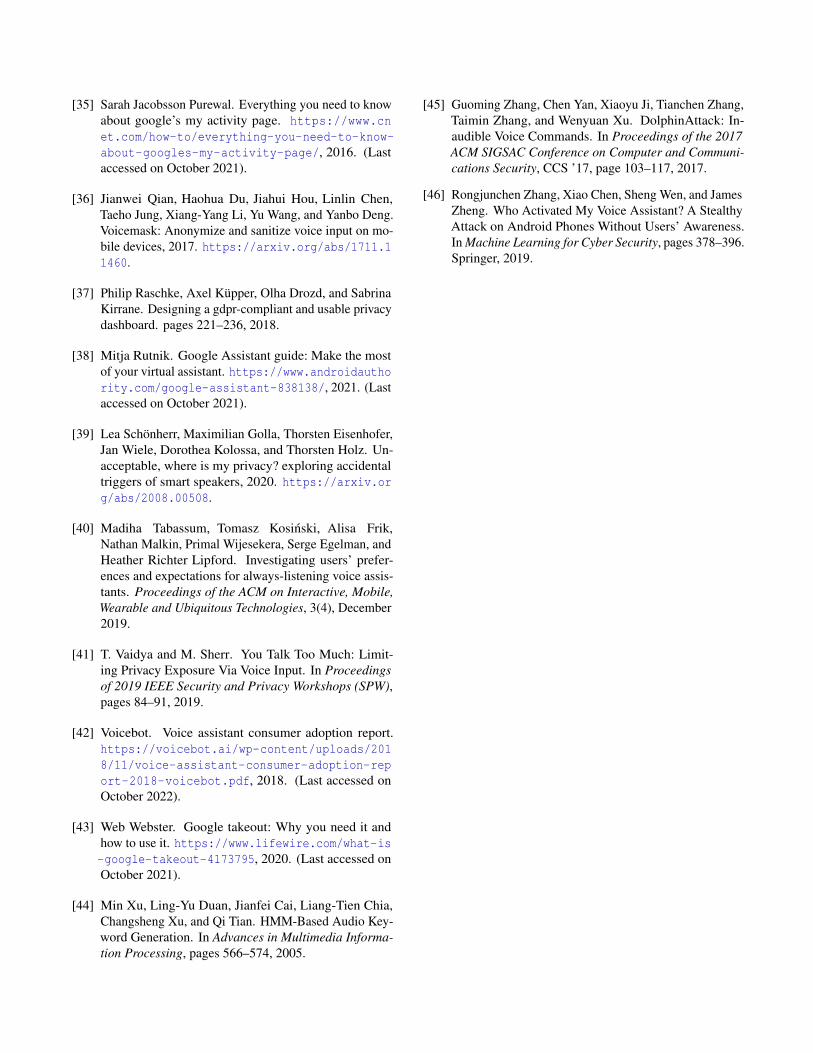
[35] Sarah Jacobsson Purewal. Everything you need to knowabout google’s my activity page. https://www.cnet.com/how-to/everything-you-need-to-know-about-googles-my-activity-page/, 2016. (Lastaccessed on October 2021).
[36] Jianwei Qian, Haohua Du, Jiahui Hou, Linlin Chen,Taeho Jung, Xiang-Yang Li, Yu Wang, and Yanbo Deng.Voicemask: Anonymize and sanitize voice input on mo-bile devices, 2017. https://arxiv.org/abs/1711.11460.
[37] Philip Raschke, Axel Küpper, Olha Drozd, and SabrinaKirrane. Designing a gdpr-compliant and usable privacydashboard. pages 221–236, 2018.
[38] Mitja Rutnik. Google Assistant guide: Make the mostof your virtual assistant. https://www.androidauthority.com/google-assistant-838138/, 2021. (Lastaccessed on October 2021).
[39] Lea Schönherr, Maximilian Golla, Thorsten Eisenhofer,Jan Wiele, Dorothea Kolossa, and Thorsten Holz. Un-acceptable, where is my privacy? exploring accidentaltriggers of smart speakers, 2020. https://arxiv.org/abs/2008.00508.
[40] Madiha Tabassum, Tomasz Kosinski, Alisa Frik,Nathan Malkin, Primal Wijesekera, Serge Egelman, andHeather Richter Lipford. Investigating users’ prefer-ences and expectations for always-listening voice assis-tants. Proceedings of the ACM on Interactive, Mobile,Wearable and Ubiquitous Technologies, 3(4), December2019.
[41] T. Vaidya and M. Sherr. You Talk Too Much: Limit-ing Privacy Exposure Via Voice Input. In Proceedingsof 2019 IEEE Security and Privacy Workshops (SPW),pages 84–91, 2019.
[42] Voicebot. Voice assistant consumer adoption report.https://voicebot.ai/wp-content/uploads/2018/11/voice-assistant-consumer-adoption-report-2018-voicebot.pdf, 2018. (Last accessed onOctober 2022).
[43] Web Webster. Google takeout: Why you need it andhow to use it. https://www.lifewire.com/what-is-google-takeout-4173795, 2020. (Last accessed onOctober 2021).
[44] Min Xu, Ling-Yu Duan, Jianfei Cai, Liang-Tien Chia,Changsheng Xu, and Qi Tian. HMM-Based Audio Key-word Generation. In Advances in Multimedia Informa-tion Processing, pages 566–574, 2005.
[45] Guoming Zhang, Chen Yan, Xiaoyu Ji, Tianchen Zhang,Taimin Zhang, and Wenyuan Xu. DolphinAttack: In-audible Voice Commands. In Proceedings of the 2017ACM SIGSAC Conference on Computer and Communi-cations Security, CCS ’17, page 103–117, 2017.
[46] Rongjunchen Zhang, Xiao Chen, Sheng Wen, and JamesZheng. Who Activated My Voice Assistant? A StealthyAttack on Android Phones Without Users’ Awareness.In Machine Learning for Cyber Security, pages 378–396.Springer, 2019.