Embed Size (px)
Citation preview

THE JOURNAL OF CHEMICAL PHYSICS 137, 184702 (2012)
Understanding adsorption-induced structural transitions in metal-organicframeworks: From the unit cell to the crystal
Carles Triguero,1 François-Xavier Coudert,1,a) Anne Boutin,2 Alain H. Fuchs,1
and Alexander V. Neimark1,3,a)
1CNRS & Chimie ParisTech, 11 rue Pierre et Marie Curie, 75005 Paris, France2PASTEUR, ENS-UPMC-CNRS, 24 rue Lhomond, 75005 Paris, France3Department of Chemical and Biochemical Engineering, Rutgers University, New Jersey 08854, USA
(Received 17 July 2012; accepted 11 October 2012; published online 9 November 2012)
Breathing transitions represent recently discovered adsorption-induced structural transformationsbetween large-pore and narrow-pore conformations in bi-stable metal-organic frameworks such asMIL-53. We present a multiscale physical mechanism of the dynamics of breathing transitions. Weshow that due to interplay between host framework elasticity and guest molecule adsorption, thesetransformations on the crystal level occur via layer-by-layer shear. We construct a simple Hamil-tonian that describes the physics of host-host and host-guest interactions on the level of unit cellsand reduces to one effective dimension due to the long-range elastic cell-cell interactions. We thenuse this Hamiltonian in Monte Carlo simulations of adsorption-desorption cycles to study how thebehavior of unit cells is linked to the transition mechanism at the crystal level through three keyphysical parameters: the transition energy barrier, the cell-cell elastic coupling, and the system size.© 2012 American Institute of Physics. [http://dx.doi.org/10.1063/1.4765369]
I. INTRODUCTION
There has been growing interest in porous coordinationpolymers or metal-organic frameworks (MOFs) as a newfamily of nanoporous materials built from organic ligandsand metal centers.1 In particular, much attention has recentlybeen focused on a fascinating subclass of metal-organicframeworks that behave in a remarkable stimuli-responsivefashion.2, 3 These soft porous crystals feature dynamiccrystalline frameworks displaying reversible, large-amplitudestructural deformations induced by various external stimulisuch as temperature, mechanical pressure, or guest adsorp-tion. When we focus on adsorption, an intriguing physicalphenomenon called “breathing” has been discovered in asubclass of flexible MOFs. Solids of the MIL-53 family4 areprototypical materials displaying breathing transitions. Thisphenomenon is displayed in abrupt changes of the frameworkvolume triggered by adsorption of guest molecules thatis explored to devise advanced adsorbents, drug deliverysystems, sensors, and actuators.5, 6 This phenomenon involvesa complex interplay of adsorption and elastic interactions inthe solid, giving rise to structural phase transitions betweenwhat have been called large pore (lp) phase and narrow pore(np) phase.
In Fig. 1 is shown the adsorption-desorption isotherm ofXenon at 220 K on a MIL-53(Al) sample,7 which displays atypical double breathing transition. The MIL-53 framework ismade of parallel one-dimensional M(OH) chains (M = Al3+,Cr3+, Ga3+, . . . ) linked together by 1,4-benzenedicarboxylate(BDC) ligands to form linear diamond-shaped channels thatare wide enough to accommodate small guest molecules. This
a)Authors to whom correspondence should be addressed. Electronicaddresses: [email protected] and [email protected].
structure may oscillate between lp and np phases, which havea remarkable difference in unit cell volume of up to 40%8, 9
(see schematics in Fig. 1). What is striking is that the transi-tion from the larger volume lp phase to the smaller volume npphase is not necessarily accompanied with the release of guestmolecules that would be expected for the normal “exhaling.”For example, the equilibrium state of the MIL-53 crystal at220 K in the absence of guest molecules is in the lp phase, andupon Xe adsorption, there first occurs the transition from theunloaded lp phase to the loaded np phase.7 This transition isassociated with a sharp uptake of Xe from a loading of 0.2to 2.5 molecules per unit cell and a decrease of the crystalvolume by 25%. Upon further increase of the gas pressure,adsorption gradually proceeds in the np phase up to a certainpoint when the second, now “normal,” breathing transiting oc-curs from the np phase to the lp phase. The sample abruptly“inhales,” increasing the loading from 2.7 to 6.5 moleculesper cell, and expands, compensating for the volume lost uponthe first lp → np transition. On the desorption pass, the re-verse normal lp → np and abnormal np → lp exhaling transi-tions take place with a prominent hysteresis. This breathingphenomenon is engendered by guest-host adsorption inter-actions mediated by the elasticity of three-dimensional hostframework, which are currently poorly understood. The spe-cific variations of the linker conformations in the lp and npphases during breathing transitions have been studied at themolecular level by Férey and co-authors, both experimen-tally (in situ x-ray diffraction)8 and using molecular simula-tion (single point density functional theory calculations andforce-field-based dynamics).10 These works provide useful in-sight into the chemistry of the transformation of linker bondsassociated with the framework deformation. However, aknowledge gap exists between this molecular understandingand the question of how the adsorption of guest molecules
0021-9606/2012/137(18)/184702/9/$30.00 © 2012 American Institute of Physics137, 184702-1

184702-2 Triguero et al. J. Chem. Phys. 137, 184702 (2012)
lp form
np form
lp form
FIG. 1. Adsorption (red) and desorption (blue) isotherms archetypical of the“breathing” double structural transition in materials of the MIL-53 material:experimental data for Xenon in MIL-53(Al) at 220 K.7
induces the physical forces responsible for macroscopic struc-tural transformations on the sample level.
In this work, we develop a model of the dynamics ofadsorption-induced deformation and structural transformationin MIL-53 type porous crystals based on the coupling of thehost-guest adsorption interactions with the elastic response ofthe three-dimensional framework of a given geometry. Thefirst results obtained using this model were showcased in anearlier letter,11 and we aim here at giving its full descriptionas well as more recent results we obtained from it. The struc-ture of the paper is as follows. In Sec. II A, we analyze thebasic equations of the elasticity theory in three-dimensionalframeworks. Special attention is paid to the compatibility con-ditions implied by the Saint-Venant principle. We conclude inSec. II B that the deformation in MIL-53 type crystals occursas concerted shear motion of 2D layers of cells. As such, thetransition can be described with one principal order parame-ter related to the cell volume. This reduces the initial three-dimensional model to a one-dimensional model with long-range elastic interactions. In Sec. II C, we show how to build aminimalistic model Hamiltonian coupling local elastic defor-mations, long-range elastic interactions, and guest adsorption.The latter is described by the adsorption energy and adsorp-tion stress. This system dynamics is analyzed by performinggrand canonical Monte Carlo (MC) simulations (Secs. II Dand II E) modified to account for the energy barrier of thelp ↔ np transition. The specifics of the transition dynam-ics are studied in Sec. III by varying the energy barrier andthe parameter responsible for elastic interactions. We also ex-plore the influence of the crystal size on the transition dy-namics. In Sec. IV, summarizing the results, we conclude thatthe suggested model explains the mechanisms of breathingtransition and reproduces its experimental features includingstructural changes, hysteretic nature of transitions, and phasecoexistence.
II. MODEL DESCRIPTION
A. General treatment of deformation and elasticcompatibility equations
In order to introduce the elastic forces within the three-dimensional lattice of a certain crystallographic symmetry,
we will follow below a rigorous approach of the theory ofelasticity based on the deformation strain tensor ε defined onthe level of individual unit cells. This tensor characterizes thestates associated to lp and np phases as well as the interme-diate structural configurations along the path of the transitionphase between them. In general, the deformation strain tensorε between the two states 1 and 2 is defined through the dif-ference of the metric tensors, g1 and g2, associated with thesestates:
ε = 1
2(g2 − g1). (1)
The metric tensor is a rank 2 tensor which can be calculatedfrom scalar products of the generating Bravais lattice vectors{�vi , i = 1, 2, 3} as such
gij = �vi · �vj . (2)
The components of the deformation strain tensor are notindependent. In three dimensions, the displacement field has3 independent components at any point, and the symmetricstrain tensor nominally has 6 independent components. Be-cause the strain tensor is composed of the derivatives of thelocal displacement vector field, there exist inherent relation-ships or constraints among its components. These constraintsare imposed by the compatibility equations:12–16
∑�
ε = 0, (3)
ε being the deformation strain summed along a closed path� over the crystal lattice. These equations preserve the celllattice integrity and reduce the number of parameters neededfor the quantitative description.17–21 The non-locality of theseconstrains gives rise to the long-range elastic interactions inthe lattice. Thus, even in the case of near-neighbor interac-tions, Eq. (3) implies non-local interactions on the level of thelattice.
B. Framework geometry and elasticcompatibility conditions
Parametrization of the deformation strain tensor involvesthe selection of primary and secondary order parameters (OP).The primary OP quantifies the path along the phase transi-tion, while secondary OP describes other modes of the elasticresponse of the material. We will show later that these OPsare the suitable variables for the description of the frameworkfree energy. This free energy is a function of the scalar prod-ucts of the lattice basis vectors, or elements of the lattice met-ric tensor. In general, the free energy is expressed througha certain polynomial of these variables,13, 19, 22, 23 that can befurther approximated by (i) keeping the terms involving onlythe primary OP; (ii) approximating the dependence on sec-ondary OPs by quadratic terms, complying with the standardlinear elastic behavior; and (iii) neglecting all other terms. Inthis section, we adopt this approach to the particular problemconsidered here.
From the geometrical standpoint, the lp and np phasesof MIL-53 differ mainly by the shape of cells, which can becharacterized by the angle θ of its rhombus cross section; in lp
184702-3 Triguero et al. J. Chem. Phys. 137, 184702 (2012)
FIG. 2. Schematic diagram of the cell cross section for the structural phasecharacterization. The green and red frames correspond to the lp (e = −1) andnp (e = +1) phases, respectively. The linker length a is constant.
phase θ ∼ 79◦, while in np phase, θ ∼ 40◦ (Fig. 2). This meansthat the primary OP can be described by a scalar related to thisangle. At the same time, the variation in the linker length a be-tween the two phases is of the order of 0.4 Å (3.8%), makingthe length of the rhombus sides essentially invariant upon de-formation of the structure. In the model presented here, wewill make the assumption that the linker length, a, as well asthe unit cell length in the orthogonal direction, b, are con-stant and thus we do not consider any secondary OP. Thisassumption implies that the deformation of a single cell canbe quantified by just one degree of freedom represented bythe rhombus angle θ , which imposes a strong constraint onthe framework geometry. This conclusion can be formally de-rived from elastic compatibility conditions, Eq. (3), linkingthe deformation strain in neighboring cells.24 Indeed, the nor-malized lattice vectors are �v1 = �ex , �v2 = cos θ �ex + sin θ �ey ,and �v3 = �ez. Thus, the only variable components of the met-ric tensor are g2
12 = cos θ and g112 = cos θlp. Thus according
to Eq. (1), the only non-zero strain tensor component is theshear component ε12,
ε12 = 1
2(cos θ − cos θlp), (4)
which represents the primary and unique scalar OP.25 Theundistorted phase in this representation corresponds to the lpphase characterized by ε12 = 0.
It is convenient to define a symmetrized strain e as
ei = −1 + 2cos θi − cos θlp
cos θnp − cos θlp(5)
in order to have a symmetric and normalized represen-tation for the equilibrium values of the strain, that is,e = −1 for the reference lp phase and e = +1 forthe reference np phase. The cell volume can be ex-pressed in terms of the symmetrized deformation strain as
Vi = a2b
√1 − ( cos θnp+cos θlp
2 + cos θnp−cos θlp
2 ei)2, where a is thelinker length and b is the length of the unit cell vector alongthe channel (orthogonal to the channel cross section).
Elastic compatibility equations imply that the sum of de-formations along any close trajectory (loop) in the cell net-work should be null (Eq. (3)). As such, the compatibilityequations for the three independent loops � in the XZ and ZY
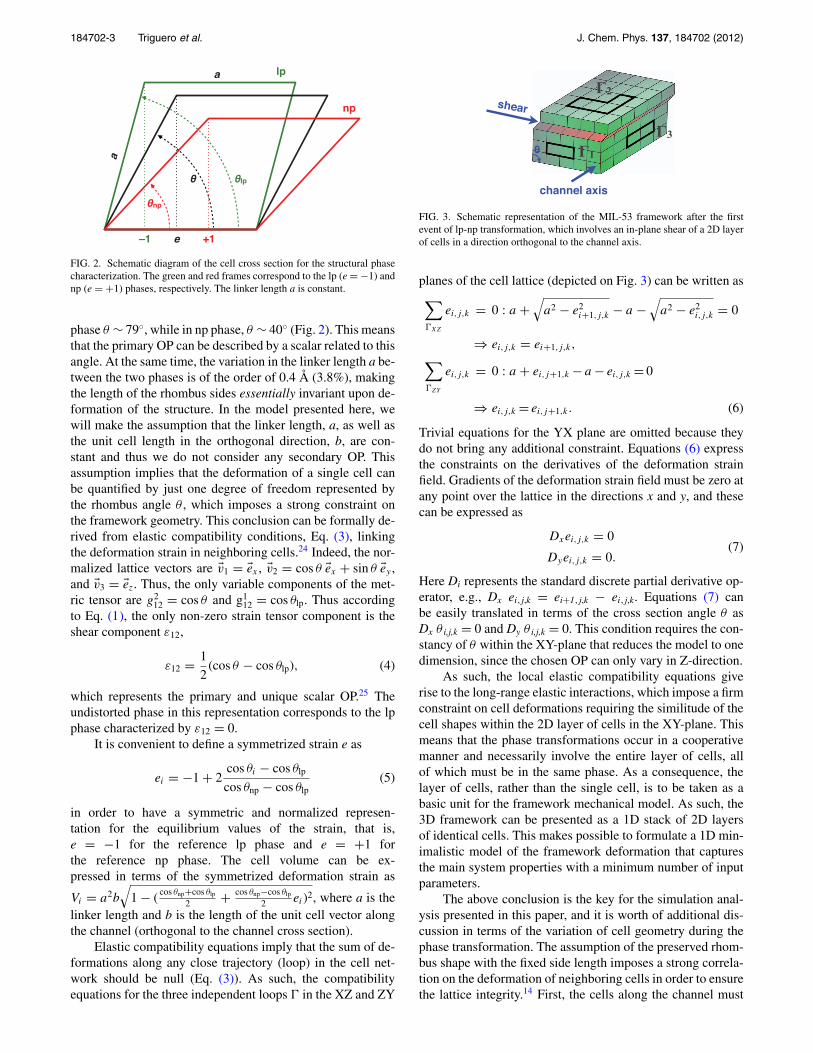
FIG. 3. Schematic representation of the MIL-53 framework after the firstevent of lp-np transformation, which involves an in-plane shear of a 2D layerof cells in a direction orthogonal to the channel axis.
planes of the cell lattice (depicted on Fig. 3) can be written as∑�XZ
ei,j,k = 0 : a +√
a2 − e2i+1,j,k − a −
√a2 − e2
i,j,k = 0
⇒ ei,j,k = ei+1,j,k,∑�ZY
ei,j,k = 0 : a + ei,j+1,k − a − ei,j,k = 0
⇒ ei,j,k = ei,j+1,k. (6)
Trivial equations for the YX plane are omitted because theydo not bring any additional constraint. Equations (6) expressthe constraints on the derivatives of the deformation strainfield. Gradients of the deformation strain field must be zero atany point over the lattice in the directions x and y, and thesecan be expressed as
Dxei,j,k = 0
Dyei,j,k = 0.(7)
Here Di represents the standard discrete partial derivative op-erator, e.g., Dx ei, j,k = ei+1, j,k − ei, j,k. Equations (7) canbe easily translated in terms of the cross section angle θ asDx θ i,j,k = 0 and Dy θ i,j,k = 0. This condition requires the con-stancy of θ within the XY-plane that reduces the model to onedimension, since the chosen OP can only vary in Z-direction.
As such, the local elastic compatibility equations giverise to the long-range elastic interactions, which impose a firmconstraint on cell deformations requiring the similitude of thecell shapes within the 2D layer of cells in the XY-plane. Thismeans that the phase transformations occur in a cooperativemanner and necessarily involve the entire layer of cells, allof which must be in the same phase. As a consequence, thelayer of cells, rather than the single cell, is to be taken as abasic unit for the framework mechanical model. As such, the3D framework can be presented as a 1D stack of 2D layersof identical cells. This makes possible to formulate a 1D min-imalistic model of the framework deformation that capturesthe main system properties with a minimum number of inputparameters.
The above conclusion is the key for the simulation anal-ysis presented in this paper, and it is worth of additional dis-cussion in terms of the variation of cell geometry during thephase transformation. The assumption of the preserved rhom-bus shape with the fixed side length imposes a strong correla-tion on the deformation of neighboring cells in order to ensurethe lattice integrity.14 First, the cells along the channel must

184702-4 Triguero et al. J. Chem. Phys. 137, 184702 (2012)
coherently deform as two stacked cells of rhombus shape can-not match unless they have the same angle θ . Second, thechannels connected by sides of fixed length must possessequal θ along the shear direction. This defines a 2D layer ofcells, inside which all the channels have the same cross sec-tion. Mismatch in the rhombus angle can exist along the direc-tion perpendicular to the shear plane. Thus, the only possiblemechanism of framework deformation is the layer-by-layershear and the elementary deformation consists of the shear ofthe layer of cells in the direction perpendicular to the channelaxis represented in Fig. 3.
C. 1D model of adsorption in bi-stable framework
Within the proposed 1D model, the two main variablesdescribe the state of each cell layer at given external thermo-dynamic conditions. First is the deformation state of the ma-terial given by the strain field e. The second variable is theadsorption loading n or the mean number of guest moleculesper unit cell in the layer. By averaging the loading over thewhole framework as a function of the external gas pressure (orchemical potential), one obtains the adsorption isotherm. Thisquantity is the key observable of the system as it is measuredin isothermal adsorption experiments. The experimental ad-sorption isotherms typically display two sharp yet continuoustransitions from almost empty lp phase to almost fully loadednp phase and from loaded np phase to loaded lp phase, asshown in Fig. 1. The loading capacities of both the phases dif-fer significantly and represent the main quantitative parame-ters determining the adsorption isotherm behavior. In the pro-posed minimalistic model, we assume that the loading is dis-crete and allows for adsorption of either, 0, 1, or 2 moleculesin the cell that correspond to empty cell, the np cell capacity,and the lp cell capacity, respectively. This simplification canbe easily generalized by introducing additional loading levels,or by considering adsorption loading as a continuous variable.
The proposed model describes the interplay betweenguest adsorption and host framework deformation in terms ofa Hamiltonian that depends on the loading n and strain e fieldsand is expressed per unit cell. The Hamiltonian contains twomain terms. The first term accounts for the host energy, whilethe second expresses the interaction energy between the hostand the guest particles,
H (n, e) = Hhost(e) + Hhost−guest(n, e). (8)
The explicit form of the host energy is
Hhost(e) =∑
i
[c0
2(ei − si)
2 + �F
2si + ci
2(Dei)
2
]. (9)
The first term on the right-hand side accounts for elasticdeformation of individual cells where the local elastic energyis modeled as by two parabolic potentials around the undis-torted np and lp states,26 see Fig. 4; variable si is discrete anddenotes the phase state of the cell (si = −1 in lp phase and si
= +1 in np phase), and (ei − si) is the local deformation fromthe reference undistorted state of the respective phase. Theparabolic elastic potential wells are effectively cut to avoidthe unrealistically high energies of intermediate states by in-
-1 0 1Symmetrized strain (e)
Ho
st f
ree
ener
gy
ΔFhost
EB
FIG. 4. Schematics of the host free energy landscape for the “dry” bi-stableframework, as a function of symmetrized strain, e. Two regions of elastic de-formation around the equilibrium lp and np structures (e = ±1) are approxi-mated by parabolas. The non-elastic region in-between is taken into accountby introducing a free energy barrier EB in the dynamic model.
troducing the free energy barrier EB that should be crossed inthe course of the phase transformation as discussed in moredetail in Sec. II E. The effective elastic constant c0 is assumedequal for both phases just for the sake of simplicity. The dif-ferences in the elastic constants of np and lp phases27 canbe introduced in a more complex version of the model. Thesecond term �F represents the difference in the free energybetween empty np and empty lp phases, which is positive, re-flecting the fact that the initial “dry” state corresponds to thestable lp phase. This energy was estimated within the ther-modynamic model developed in Ref. 7. The third term cor-responds to the non-local cell-cell elastic energy proportionalto the strain gradient squared; it penalizes the formation of in-terfaces between layers of lp and np phases (c1 > 0) by theinterfacial energy of 2c1 and also levels elastic deformationsin neighboring cells of the same phase.
The host-guest energy is expressed as a sum of two terms:
Hhost−guest(n, e) = εa(ni, si) − σa(ni, si) (ei − si) , (10)
which determine the host-guest interactions as the energyof adsorption εa(ni,si) at given loading ni and deformationei expanded around the adsorption energy εa(ni,ei) in non-deformed reference lp or np state, ei = si. This expressiongives rise to a quantity of prominent physical significance:the adsorption stress induced on the host framework due to itsinteractions with the guest molecules, which is defined as
σa(ni, si) = ∂εa(ni, ei)
∂ei
∣∣∣∣ei=si ,ni
(11)
in line with the thermodynamic definition of the adsorptionstress. The adsorption stress couples the host-guest interac-tions with the elastic deformation and accounts for the forcesexerted by the guest molecules on the host framework. It canbe either negative or positive depending on the loading andthus cause either elastic contraction or expansion. As such,the number of input parameters characterizing adsorption inour model is reduced to 8: 4 adsorption energies εa(ni,si) and4 adsorption stresses σ a(ni,si), ni = 1 or 2, si = ±1.

184702-5 Triguero et al. J. Chem. Phys. 137, 184702 (2012)
D. Discretization of the model
Modeling the dynamics of the coupled adsorption and de-formation in the process of incremental stepwise variation ofthe chemical potential of the adsorbate, we make a furtherassumption that the local elastic relaxation of the frameworkoccurs on a much smaller time scale than the establishment ofadsorption equilibrium. Under this assumption of fast relax-ation of the elastic degrees of freedom, the total energy shouldbe at its minimum with respect to the strain field e. As such,the quasi-equilibrium strain field can be found from the min-imization of the Hamiltonian at the given discrete state andloading fields, s and n,
∂H ({ni}, {ei})∂ek
∣∣∣∣{ni },{si }
= 0 ∀k. (12)
Since the second derivative is always positive and equal toc0 > 0,
∂2H ({ni}, {ei})∂e2
k
∣∣∣∣{ni },{si }
= c0 ∀k, (13)
the condition of the minimum is trivially satisfied, and thus,defined strain field would correspond to a mechanically stablestate.
Equation (12) implies zero total stress within the frame-work while the adsorption stress, Eq. (11), can be differentfrom zero. The frame must deform in order to satisfy this con-dition. The assumption of the local elastic equilibrium allowsus to determine the continuous elastic strain field e as a func-tion of the discrete fields, s and n. That is, the dynamics ofthe system is governed by the evolution of the discrete field sand n that allows for the further simplification of the model.Due to the quadratic nature of the elastic potential, the mini-mization, Eq. (12), yields a system of linear equations, whichcan be solved in a matrix form to determine the strain field atgiven distribution of phases {si} and loadings {ni},
ei =L∑
k=1
Mik (c0sk − σa(nk, sk)), (14)
where Mik ≡ (c0Iik + c1Hik)−1, where Iik is the identity ma-trix and Hik is a suitable matrix representation of the straingradient term in Eq. (9), i.e., Hik ≡ Ii,k − Ii+1,k − Ii,k+1.
Equation (14) allows one to express the Hamiltoniangiven in Eq. (9) and Eq. (10) in terms of the discrete fieldsn and s,
H ∗(n, s) = 1
2
L∑i,j=1
[c2
0Jij sisj − Mijσa(ni, si)σa(nj , sj )
− 2c0Jij siσa(nj , sj )]
+L∑
i=1
[�F
2si + εa(ni, si)
]+ c0L
2, (15)
where Jij = Iij/c0 − Mij. As such, within the discretized model,Eq. (15), each cell layer is characterized by its state variables,si = ±1 and loading ni = 0, 1, or 2. Note that Eq. (15) explic-itly accounts for the long-range coupling between adsorptionstates of different loading in Mij σ a(ni,si) σ a(nj,sj) term; such
coupling term was not present directly in the initial Hamilto-nian, Eq. (10), but it arises from the elastic interactions due toadsorption-induced stress and compatibility conditions.
E. Dynamics of the system
In modeling the adsorption process, we performed grandcanonical MC simulations of the 1D array of cell layers withopen (non-periodic) boundary conditions. The external vari-ables are the size of the system L, the temperature T, andthe chemical potential μ of the adsorbate. Two types of MCmoves, which lead to the change of the cell state are con-sidered: adsorption or desorption of one particle (ni → ni
± 1) and the phase switch between lp and np structures(si → −si). The acceptance probabilities W for particle in-sertions and deletions are standard for the Metropolis MCscheme:
W (ni → ni ± 1) = min{1, exp[−β(�H ∗ ∓ μ]}, (16)
where β = 1/kBT, and the energy difference �H* has thefollowing explicit form:
�H ∗ = −�σi
⎛⎝ L∑
i,j=1;i �=j
Mij
(σa
j + c0sj
) + c0Jiisi
⎞⎠
− 1
2Mii
(�σa
i
)2 + �εi. (17)
The phase switch attempt implies the transition from oneelastic potential well to the other across the energy barrierEB, see Fig. 3. The probability of barrier crossing is describedby the following scheme employed by Kang and Weinberg28
in studies of activated diffusion. As such, we introduce theenergy barrier directly in the acceptance probabilities of thephase change:
W (si → − si) =⎧⎨⎩
min(1, exp[−β�H ∗]) if |�H ∗/2| > EB
exp
[−β
(�H ∗ + EB
2
)]if |�H ∗/2| < EB.
(18)
The energy difference associated to the phase change move isgiven by
�H ∗ = −c0�si
⎛⎝ L∑
i,j=1;i �=j
Mij
(σa
j − c0sj
)+Jiiσi
⎞⎠
+�εi − si�F. (19)
The probability of phase transition is the same as inthe standard MC scheme presented in Eq. (16) provided|�H*/2| > EB. Otherwise, Eq. (18) introduces a possibil-ity for metastable states in the system and, as a conse-quence, for hysteretic behavior. This statement is visualized inFig. 5 where we schematically show all the different possibil-ities of the transition probability.
Left panels in Fig. 5 correspond to low barriers that donot affect the transition. Right panels illustrate the possibilityof the metastable states separated by the barrier provided thelatter is high enough. In this case, even when the transition isassociated with the energy reduction, the move is accepted not

184702-6 Triguero et al. J. Chem. Phys. 137, 184702 (2012)
ΔH
∗>
0Δ
H∗<
0
EB < |ΔH∗/2| EB > |ΔH∗/2|
A
B
A
B
A
B
A
B
FIG. 5. Schematics representation of the transition between the states and theeffect of the energy barrier. When the barrier is low, the transition probabilityis determined from the standard Metropolis scheme (left panels). When thebarrier is high, the transition probability is modified according to Eq. (18)(right panels).
with a probability equal to one, as in the Metropolis scheme,but with the probability that accounts for the barrier crossing.
III. RESULTS AND DISCUSSION
A. Obtaining main features of breathing transitions
The minimalistic model reproduces on a qualitative levelthe main features of breathing transitions presented above inFig. 1, namely the double transition upon adsorption, firstfrom lp to np and then from np to lp phases. In the exam-ples of calculations presented below, the adsorption energiesand stresses are chosen to qualitatively reproduce adsorptionisotherms in each phase, taking as a reference 200 K Xe ad-sorption data.7 As such, each individual adsorption isothermis of the IUPAC type I and shows a Langmuir-like behav-ior. The transitions imply gradual transformation of the sam-ple from one phase to the other, mechanisms of which arediscussed below. As shown in Ref. 29, the stress developedin individual phases upon adsorption and desorption is non-monotonic, featuring contraction and expansion in the courseof adsorption.
Choosing the model parameters, we grouped them in twocategories. The first group of parameters is based on the ex-perimentally measurable properties, such as elastic constantc0 (i.e., bulk modulus), adsorption energies (adjusted to re-produce semi-quantitatively the experimental isotherms), ad-sorption stress (their sign is known but not their value; how-ever, their exact values are not crucial to the conclusions of themodel). These parameters are necessarily correlated in orderto reproduce the phenomenology (adsorption energy is largerin np phase than that in lp phase, etc.). These parameters arepresented in Table I and they are fixed in all the followingcalculations.
TABLE I. Values of the fixed parameters in units of kBT.
c0 = 100 �F = 5.0
ε(1,lp) = 0 ε(1,np) = −10 ε(2,lp) = −2 ε(1,np) = 3σ a(1,lp) = −10 σ a(1,np) = −10 σ a(2,lp) = 10 σ a(1,np) = 10
FIG. 6. Principal features of breathing transitions: adsorption isotherm (redline), desorption isotherm (blue line), and reversible isotherm obtained byignoring the energy barrier EB in simulation (gray). Model parameters fromTable I, coupling parameter c1 = 1.
The parameters given in Table I ensure that at the con-dition of thermodynamic equilibrium, the adsorption processwill possess a double breathing transition. The equilibriumisotherm can be calculated on the level of one cell layer ig-noring the dynamic effects related to the inter-layer couplingand to the energy barrier of phase transitions. The model pa-rameters responsible for the dynamics and hysteretic behaviorrepresent the second group. They include the layer-layer elas-tic coupling c1, free energy barrier EB, as well as boundaryconditions and system size. These parameters are not directlyrelated to the experimental observations and are varied inSecs. II B and II C to demonstrate their impact on the mecha-nism of breathing transitions.
In Fig. 6, we present typical results of simulation forL = 2000, EB = 10.5, and c1 = 1 in comparison with theequilibrium isotherm determined at EB = 0 and c1 = 0. Theadsorption isotherms are given as the average loading 〈n〉vs the chemical potential μ. The adsorption and desorptionisotherms (top panel) display a prominent hysteresis similarto the experimentally observed, see Fig. 1. The hysteresis isalso apparent for the stress isotherms 〈σ a〉 (not shown here),and the evolution of the sample composition characterized bythe fraction of layers in lp phase xlp.11
B. Effect of elastic coupling and free energy barrierof phase transition
We first consider the system of large size, i.e., in the ther-modynamic limit. In practice, this is achieved at the lengthL = 1000, which was determined by comparison of the re-sults for systems of increasing size.
The hysteretic behavior is not observed for all values ofthe layer-layer elastic interaction parameter c1 and the energybarrier EB. We performed a systematic study of the region ofhysteresis by varying parameters EB and c1 and constructinga “phase diagram” separating the equilibrium and hystereticregions in parameter space, Fig. 7. In the absence of bothbarrier and elastic coupling, the breathing is fully reversible.By introducing either a large enough layer-layer coupling, ora large enough energy barrier, or both, the structural transi-tions become hysteretic. It can be seen that the boundariesof nonreversible behavior for the two structural transitions(low-pressure, represented as a dotted line, and high-pressure,represented as a dashed line) are quite close to each other.As such, it is possible yet unlikely that in the case of two

184702-7 Triguero et al. J. Chem. Phys. 137, 184702 (2012)
0 1 2 3 4 5 6 7c1
0
2
4
6
8
10E
B
Hysteresis
Reversible
FIG. 7. Presence of hysteresis in breathing transitions depending on modelparameters EB and c1 at the thermodynamic limit. Dotted and dashed linesrepresent the limits of the reversible and hysteretic regimes for the low-pressure and high-pressure transitions, respectively.
breathing transitions, the low-pressure transition would be re-versible and the high-pressure one hysteretic.
The main conclusion we can draw from Fig. 7 is thatboth the free energy barrier and the layer-layer elastic cou-pling can cause hysteretic structural transformations, whichare observed in all known experimental occurrences of breath-ing transitions. While it is clear that the energy barrier stabi-lizes the presence of metastable states, the effect of the elasticcoupling is less straightforward. However, the interlayer cou-pling (stemming from the cell-cell elastic interactions) penal-izes the transformation of a single layer of cells in the mate-rial, and thus plays in the system dynamics a similar role tothe free energy barrier.
In order to characterize the nature of the mechanism ofthe hysteretic transition, we present in Fig. 8 the adsorptionand desorption behavior for three characteristic sets of pa-rameters: top panel (a) no layer-layer coupling and no energybarrier, (b) with only layer-layer coupling, no energy barrier,and (c) with only a free energy barrier, no coupling. In eachcase, a graphical representation of the system upon adsorp-tion and desorption is plotted below and above the isotherm.Our “reference” case here will be the reversible simulationwith c1 = 0 and EB = 0. In this case, the reversible isothermstems from a smooth transition of layers from one state to an-other; the phase distribution in the regions corresponding tothe structural transitions appears as random intermittent do-mains of lp and np layers. From this no-coupling no-barriercase, the introduction of a high enough barrier (EB ≥ 9) slowsdown the dynamics of the system and allows the creation of“metastable” states in which domains of the new phase nu-cleate and grow (panel b of Fig. 8). This is reflected in thehysteretic nature of the transition. Below this panel we showzooms on five characteristic distributions of phases, obtainedat labeled points 1–5 along the adsorption isotherm: the firstone shows an empty system in lp phase, with a fluctuation ofa single cluster of np phases; the second one corresponds tolp-np coexistence; the third one is located between the twoadsorption steps, where the np phase predominates but someinclusions of empty lp phase and full lp phase are seen; the
0.0
0.5
1.0
1.5
2.0
xlp,
n
-10 -8 -6 -4 -2 0 +2 +4 +6 +8 +10
µ
(c)
0.0
0.5
1.0
1.5
2.0
xlp,
n
-10 -8 -6 -4 -2 0 +2 +4 +6 +8 +10
µ
(b)
1
2
3
4
5
1 2 3 4 5
0.0
0.5
1.0
1.5
2.0
xlp,
n
-10 -8 -6 -4 -2 0 +2 +4 +6 +8 +10
µ
(a)
FIG. 8. Adsorption isotherms, 〈n〉 (red curves); phase fraction, xlp (bluecurves) as a function of chemical potential μ. On top and bottom are rep-resented spatial distribution of phases and loadings, for adsorption (bottom)and desorption (top), at corresponding μ. Each vertical bar represents the 1Dsuccession of 2000 layers colored with respect to their states: blue—emptylp phase; grey - empty np phase; green—np phase with one particle; white—lp phase with one particle; red—lp phase with two particles; and black—npphase with two particles (not observed in these simulations). (a) c1 = 0, EB= 0; (b) c1 = 0, EB = 9; (c) c1 = 8, EB = 0. Panel (b) includes a zoom oncharacteristic phase distributions in the system for five labeled points alongthe adsorption isotherm.

184702-8 Triguero et al. J. Chem. Phys. 137, 184702 (2012)
0.0
0.5
1.0
1.5
2.0n
-10 -8 -6 -4 -2 0 +2 +4 +6 +8 +10µ
L = 25L = 50L = 100L = 2000
0.0
0.5
1.0
1.5
2.0
n
-10 -8 -6 -4 -2 0 +2 +4 +6 +8 +10µ
L = 25L = 50L = 100L = 2000
FIG. 9. Influence of system size (L = 25, 50, 100, and 2000) on the dynamics of breathing transitions for two dynamic regimes. (Left) Strong elastic coupling.(Right) Weak elastic coupling. Hysteresis increases with the system size.
fourth case is np-lp coexistence in the region of the secondtransition, and the last distribution shows the final state of ad-sorption, a system of fully loaded lp layers. In the presence oflarge elastic layer-layer correlation, and to some extent in thecase of high-energy barriers, hysteresis loops widen as the nu-cleation rate for the phase transition is reduced. For example,in the case of EB = 0 and c1 = 8 (lower panel of Fig. 8), wesee that only a few nucleation events occur in the entire sys-tem (3 events upon adsorption, 4 upon desorption), yieldingfairly steep steps in both the loading and phase compositionisotherms (avalanche effect).
C. Effect of crystalline domain sizeon breathing dynamics
The examples discussed above were calculated for a largesystem comprised of L = 2000 layers. For such a large sys-tem, no difference in adsorption hysteretic behavior was ob-served with periodic and free boundary conditions. Exceptfor the very last example of the strongest elastic coupling,Fig. 8(c), the distribution of the new phase nucleation eventswas uniform along the system with free boundary conditions.However, for the adsorption np-lp transition, the influence ofthe boundaries is apparent: one may see only three nucleationevents, two at the boundaries and one in the center, and anavalanche phase growth between them. As the system size de-creases, the effect of system boundaries becomes stronger. Tostudy the influence of the system size on the transformationdynamics, we performed simulations of the systems of vari-ous sizes L with free boundary conditions.
In Fig. 9, we demonstrate the adsorption isotherms inthe systems of different sizes for two typical cases of strong(c1 = 6, left panel) and weak (c1 = 2, right panel) interlayerelastic coupling. The energy barrier, EB = 9, is chosen highenough to secure the hysteretic behavior in the thermody-namic limit even in the absence of elastic interaction penalty.For small size system, the boundary effect is important. In-deed, the nucleation of the new phase at the boundary impliesa smaller overall free energy penalty, which is a cumulative
effect of the energy barrier and interlayer coupling. The lattereffect is approximately twice as small for the boundary layerthan for the internal one. As such, the phase transformationtends to start from the boundary and propagates to the centerof the system, as shown in Fig. 10 for np-lp transition in thestrong coupling case. With the decrease in the system size, thehysteresis progressively shrinks. For the low coupling case,this effect is more pronounced. The hysteretic behavior is ob-served in the thermodynamic limit only. For all system sizesincluding and below 100, the isotherm is reversible.
Finally, we studied the finite size effects on the positionof breathing transitions (indicated by the chemical potential μ
at which each transition happens) by varying the elastic cou-pling parameter c1 (here in the range from 1 to 13). This isdone for two different system sizes, L = 25 and L = 100, us-ing a free energy barrier of EB = 9 and averaging over 500realizations of the adsorption-desorption cycle. As shown inFig. 11, for all values of the elastic coupling except the low-est one (c1 = 1), the adsorption-desorption isotherms formtwo clear hysteresis loops, whose width is characterized bythe difference in the chemical potentials corresponding to theadsorption and desorption transitions. As described above inthe case of our “thermodynamic limit” (L = 2000), this widthincreases with coupling. We also observe that the size ef-fect is greater for wider hysteresis loops, i.e., for systemswith larger elastic coupling c1. In this case, the larger thesystem, the wider the adsorption-desorption hysteresis loop.
FIG. 10. Phase distribution upon adsorption at L = 100 for the strong cou-pling case. Colors are the same as in Fig. 8. Snapshots averaged over 500 re-alizations. Np-lp transition (near μ = +6) proceeds as an avalanche startingfrom the boundaries, while lp-np transition (near μ = −7) proceeds throughintermittent formation and coalescence of lp phase clusters.
184702-9 Triguero et al. J. Chem. Phys. 137, 184702 (2012)
-15
-10
-5
0
5
10
Tra
nsit
ion
µ
0 2 4 6 8 10 12c1
L = 25LT-UPLT-DWUT-UPUT-DWL = 100LT-UPLT-DWUT-UPUT-DW
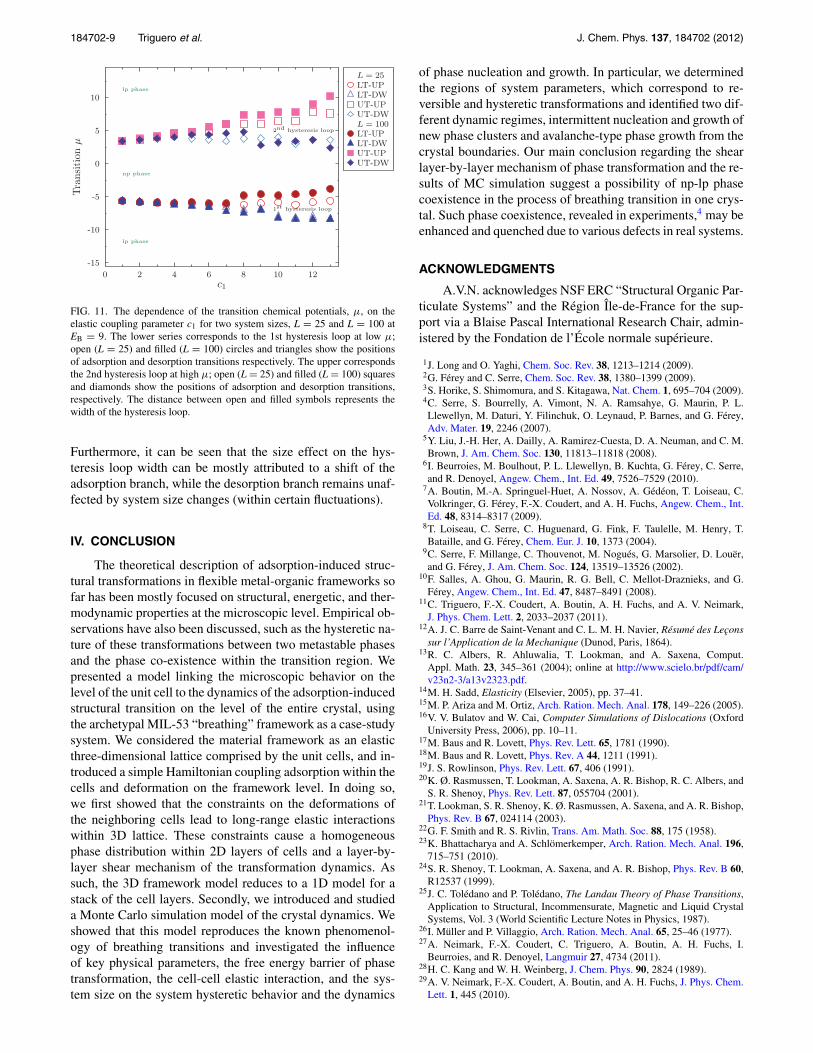
FIG. 11. The dependence of the transition chemical potentials, μ, on theelastic coupling parameter c1 for two system sizes, L = 25 and L = 100 atEB = 9. The lower series corresponds to the 1st hysteresis loop at low μ;open (L = 25) and filled (L = 100) circles and triangles show the positionsof adsorption and desorption transitions respectively. The upper correspondsthe 2nd hysteresis loop at high μ; open (L = 25) and filled (L = 100) squaresand diamonds show the positions of adsorption and desorption transitions,respectively. The distance between open and filled symbols represents thewidth of the hysteresis loop.
Furthermore, it can be seen that the size effect on the hys-teresis loop width can be mostly attributed to a shift of theadsorption branch, while the desorption branch remains unaf-fected by system size changes (within certain fluctuations).
IV. CONCLUSION
The theoretical description of adsorption-induced struc-tural transformations in flexible metal-organic frameworks sofar has been mostly focused on structural, energetic, and ther-modynamic properties at the microscopic level. Empirical ob-servations have also been discussed, such as the hysteretic na-ture of these transformations between two metastable phasesand the phase co-existence within the transition region. Wepresented a model linking the microscopic behavior on thelevel of the unit cell to the dynamics of the adsorption-inducedstructural transition on the level of the entire crystal, usingthe archetypal MIL-53 “breathing” framework as a case-studysystem. We considered the material framework as an elasticthree-dimensional lattice comprised by the unit cells, and in-troduced a simple Hamiltonian coupling adsorption within thecells and deformation on the framework level. In doing so,we first showed that the constraints on the deformations ofthe neighboring cells lead to long-range elastic interactionswithin 3D lattice. These constraints cause a homogeneousphase distribution within 2D layers of cells and a layer-by-layer shear mechanism of the transformation dynamics. Assuch, the 3D framework model reduces to a 1D model for astack of the cell layers. Secondly, we introduced and studieda Monte Carlo simulation model of the crystal dynamics. Weshowed that this model reproduces the known phenomenol-ogy of breathing transitions and investigated the influenceof key physical parameters, the free energy barrier of phasetransformation, the cell-cell elastic interaction, and the sys-tem size on the system hysteretic behavior and the dynamics
of phase nucleation and growth. In particular, we determinedthe regions of system parameters, which correspond to re-versible and hysteretic transformations and identified two dif-ferent dynamic regimes, intermittent nucleation and growth ofnew phase clusters and avalanche-type phase growth from thecrystal boundaries. Our main conclusion regarding the shearlayer-by-layer mechanism of phase transformation and the re-sults of MC simulation suggest a possibility of np-lp phasecoexistence in the process of breathing transition in one crys-tal. Such phase coexistence, revealed in experiments,4 may beenhanced and quenched due to various defects in real systems.
ACKNOWLEDGMENTS
A.V.N. acknowledges NSF ERC “Structural Organic Par-ticulate Systems” and the Région Île-de-France for the sup-port via a Blaise Pascal International Research Chair, admin-istered by the Fondation de l’École normale supérieure.
1J. Long and O. Yaghi, Chem. Soc. Rev. 38, 1213–1214 (2009).2G. Férey and C. Serre, Chem. Soc. Rev. 38, 1380–1399 (2009).3S. Horike, S. Shimomura, and S. Kitagawa, Nat. Chem. 1, 695–704 (2009).4C. Serre, S. Bourrelly, A. Vimont, N. A. Ramsahye, G. Maurin, P. L.Llewellyn, M. Daturi, Y. Filinchuk, O. Leynaud, P. Barnes, and G. Férey,Adv. Mater. 19, 2246 (2007).
5Y. Liu, J.-H. Her, A. Dailly, A. Ramirez-Cuesta, D. A. Neuman, and C. M.Brown, J. Am. Chem. Soc. 130, 11813–11818 (2008).
6I. Beurroies, M. Boulhout, P. L. Llewellyn, B. Kuchta, G. Férey, C. Serre,and R. Denoyel, Angew. Chem., Int. Ed. 49, 7526–7529 (2010).
7A. Boutin, M.-A. Springuel-Huet, A. Nossov, A. Gédéon, T. Loiseau, C.Volkringer, G. Férey, F.-X. Coudert, and A. H. Fuchs, Angew. Chem., Int.Ed. 48, 8314–8317 (2009).
8T. Loiseau, C. Serre, C. Huguenard, G. Fink, F. Taulelle, M. Henry, T.Bataille, and G. Férey, Chem. Eur. J. 10, 1373 (2004).
9C. Serre, F. Millange, C. Thouvenot, M. Nogués, G. Marsolier, D. Louër,and G. Férey, J. Am. Chem. Soc. 124, 13519–13526 (2002).
10F. Salles, A. Ghou, G. Maurin, R. G. Bell, C. Mellot-Draznieks, and G.Férey, Angew. Chem., Int. Ed. 47, 8487–8491 (2008).
11C. Triguero, F.-X. Coudert, A. Boutin, A. H. Fuchs, and A. V. Neimark,J. Phys. Chem. Lett. 2, 2033–2037 (2011).
12A. J. C. Barre de Saint-Venant and C. L. M. H. Navier, Résumé des Leçonssur l’Application de la Mechanique (Dunod, Paris, 1864).
13R. C. Albers, R. Ahluwalia, T. Lookman, and A. Saxena, Comput.Appl. Math. 23, 345–361 (2004); online at http://www.scielo.br/pdf/cam/v23n2-3/a13v2323.pdf.
14M. H. Sadd, Elasticity (Elsevier, 2005), pp. 37–41.15M. P. Ariza and M. Ortiz, Arch. Ration. Mech. Anal. 178, 149–226 (2005).16V. V. Bulatov and W. Cai, Computer Simulations of Dislocations (Oxford
University Press, 2006), pp. 10–11.17M. Baus and R. Lovett, Phys. Rev. Lett. 65, 1781 (1990).18M. Baus and R. Lovett, Phys. Rev. A 44, 1211 (1991).19J. S. Rowlinson, Phys. Rev. Lett. 67, 406 (1991).20K. Ø. Rasmussen, T. Lookman, A. Saxena, A. R. Bishop, R. C. Albers, and
S. R. Shenoy, Phys. Rev. Lett. 87, 055704 (2001).21T. Lookman, S. R. Shenoy, K. Ø. Rasmussen, A. Saxena, and A. R. Bishop,
Phys. Rev. B 67, 024114 (2003).22G. F. Smith and R. S. Rivlin, Trans. Am. Math. Soc. 88, 175 (1958).23K. Bhattacharya and A. Schlömerkemper, Arch. Ration. Mech. Anal. 196,
715–751 (2010).24S. R. Shenoy, T. Lookman, A. Saxena, and A. R. Bishop, Phys. Rev. B 60,
R12537 (1999).25J. C. Tolédano and P. Tolédano, The Landau Theory of Phase Transitions,
Application to Structural, Incommensurate, Magnetic and Liquid CrystalSystems, Vol. 3 (World Scientific Lecture Notes in Physics, 1987).
26I. Müller and P. Villaggio, Arch. Ration. Mech. Anal. 65, 25–46 (1977).27A. Neimark, F.-X. Coudert, C. Triguero, A. Boutin, A. H. Fuchs, I.
Beurroies, and R. Denoyel, Langmuir 27, 4734 (2011).28H. C. Kang and W. H. Weinberg, J. Chem. Phys. 90, 2824 (1989).29A. V. Neimark, F.-X. Coudert, A. Boutin, and A. H. Fuchs, J. Phys. Chem.
Lett. 1, 445 (2010).


![Identifying transitions in finite systems by means of ... · of structural transitions in macromolecular systems such as folding [1,20–22], aggregation [23], and adsorption processes](https://img.dokumen.tips/doc/110x75/5fcaeddbd0cdc926a67c90e3/identifying-transitions-in-inite-systems-by-means-of-of-structural-transitions.jpg)