Embed Size (px)
Citation preview
Electric Field- and Temperature-Induced Phase Transitions in High-Strain Relaxor-Based Ferroelectric Pb(Mg1 /3Nb2/3)1 -
xTixO3 Single Crystals
Authors: R. R. Chien , V. Hugo Schmidt , C.-S. Tu , F.-T. Wang , I.-C. Shih , L.-W. Hung & H. Luo
This is an Accepted Manuscript of an article published in Ferroelectrics on December 7, 2007, available online: http://www.tandfonline.com/10.1080/00150190701515055.
R. R. Chien , V. Hugo Schmidt , C.-S. Tu , F.-T. Wang , I.-C. Shih , L.-W. Hung & H. Luo (2007) Electric Field- and Temperature-Induced Phase Transitions in High-Strain Relaxor-Based Ferroelectric Pb(Mg1 /3Nb2/3)1 - xTixO3 Single Crystals, Ferroelectrics, 359:1, 99-110, DOI: 10.1080/00150190701515055
Made available through Montana State University’s ScholarWorks scholarworks.montana.edu
Electric Field- and Temperature-Induced PhaseTransitions in High-Strain Relaxor-Based
Ferroelectric Pb(Mg1/3Nb2/3)1−xTixO3 SingleCrystals
R. R. CHIEN,1,∗ V. HUGO SCHMIDT,1 C.-S. TU,2 F.-T. WANG,2
I.-C. SHIH,3 L.-W. HUNG,3 AND H. LUO4
1Department of Physics, Montana State University, Bozeman, MT 59717, USA2Graduate Institute of Applied Science and Engineering, Catholic Univ., Taipei242, Taiwan, R.O.C.3Department of Physics, Fu Jen Catholic Univ., Taipei 242, Taiwan, R.O.C.4Shanghai Institute of Ceramics, Chinese Academy of Sciences, Shanghai201800, People’s Republic of China
As a review, we compare results in electric-field- and temperature-induced phase tran-sitions for four Pb(Mg1/3Nb2/3)1−xTixO3(PMNT-x) single crystals, namely (001)-cutPMNT-x (x = 24%, 33%, and 40%) and (111)-cut PMNT-33%. Dielectric propertiesand domain states were measured as functions of temperature and electric field. Thehysteresis loops of polarization versus electric field at room temperature were also mea-sured. The intermediate monoclinic phases are essential in bridging higher symmetrieswhile the electric-field- or temperature-induced transitions are taking place. Whetheror not a monodomain state can be induced by a dc electric field strongly depends oncrystallographic orientation, PbTiO3 content, and temperature.
Keywords PMNT single crystal; dielectric permittivity; domain structure; phasetransition
Introduction
Relaxor-based ferroelectric single crystals Pb(Mg1/3Nb2/3)1−xTixO3 (PMNT-x) andPb(Zn1/3Nb2/3)1−xTixO3 (PZNT-x) have attracted much attention due to their high per-formance in piezoelectric related applications. These crystals with compounds near a mor-photropic phase boundary (MPB) between rhombohedral (R) and tetragonal (T) phasesexhibit piezoelectric properties about ten times better than the ceramics that are generallyused, such as extremely large electromechanical coupling factor k33 (>94%), ultrahighpiezoelectric coefficients (>2500 pC/N), a large strain level (up to ∼1.7%), and low hys-teresis [1–4].
The relaxor ferroelectric PMNT-x is a solid solution between a complex perovskitePb(Mg1/3Nb2/3)O3 (PMN), namely relaxor, and a simple perovskite PbTiO3 (PT), namely
ferroelectric. Relaxors are characterized by a diffuse phase transition with frequency dis-persion of the temperature giving maximum permittivity. Relaxors have disordered polar-ization, with small ordered polar nanoregions (PNRs) that begin to develop locally belowBurns temperature (∼ 620 K in PMN). In PMN, the volume fraction of the PNRs increasesas the temperature decreases and reaches the three-dimensional percolation threshold be-low T∼ 200 K [5]. The PT crystal exhibits a normal ferroelectric phase transition at 490◦C.Ferroelectrics have a net spontaneous polarization due to the average off-centered dis-placements of the atoms. The polarization can be switched in direction by an externalelectric (E) field, which is displayed in a hysteresis loop measurement of polarizationversus E .
The piezoelectric performance of ferroelectrics arises from the interaction of the po-larization and E field, i.e. the coupling of the polarization and strain. Therefore, an E fieldpoling is usually performed on these materials to enhance piezoelectric performance beforeapplication. The very large electromechanical coupling is attributed to polarization rotationeffect induced by an external dc E field between T and R phases through intermediatemonoclinic (M) or orthorhombic (O) symmetries [6]. This has generated a great interest ininvestigating phase (structural) transitions near the MPB under the application of thermal, Efield, and stress for understanding the underlying mechanism of the piezoelectric properties[7, 8].
Physical properties of PMNT-x depend strongly on titanium content, crystallographicorientation, strength of external poling E field, and temperature [7–9]. In order to under-stand the physical origin of the E field- and temperature-induced phase transitions, herewe compare results for four PMNT-x single crystals with various titanium content andcrystallographic orientation, i.e. (001)-cut PMNT-x (x = 24%, 33%, 40%) and (111)-cutPMNT-33% crystals. Hereafter, (001) PMNT-x stands for (001)-cut PMNT-x. The E field-and temperature-induced phase transitions in the single crystals are investigated by dielectricpermittivity, domain observations with polarizing light microscopy, and the hysteresis loopsof polarization vs. E field at room temperature (RT). By using relations of crystallographicsymmetry and optical extinction, polarizing light microscopy provides a real-time directobservation of the polarization orientations in ferroelectric domains and their correspondingcrystal phases.
Experimental Procedure
The four lead magnesium niobate-lead titanate crystals PMNT-x were grown using a mod-ified Bridgman method and are cut perpendicular to a <001> direction for the three (001)-cut crystals, and a 〈111〉 direction for the (111)PMNT-33% crystal after aligning by x-raydiffraction. The samples were cut in rectangular shape as shown in Figure 1a. The Ti concen-tration (x%) was determined by x = [Tm(◦C)+10]/5, where Tm is the dielectric maximumtemperature obtained upon heating at measuring frequency f = 10 kHz without E fieldpoling. Before any measurement described below, the samples were annealed in the cu-bic (C) phase. For dielectric measurements, a Wayne-Kerr Precision Analyzer PMA3260Awith four-lead connections was used to obtain real (ε′) and imaginary (ε′′) parts of dielectricpermittivity. A Janis CCS-450 cold-head was used with a Lakeshore 340 temperature con-troller. Gold film electrodes were deposited by dc sputtering on sample surfaces as shown inFigure 1a. Several different processes were used in the dielectric measurements. The first iscalled “zero-field-heated” (ZFH) and “zero-field-cooled” (ZFC), in which the data are takenupon heating and cooling respectively without any Efield poling. The second process is
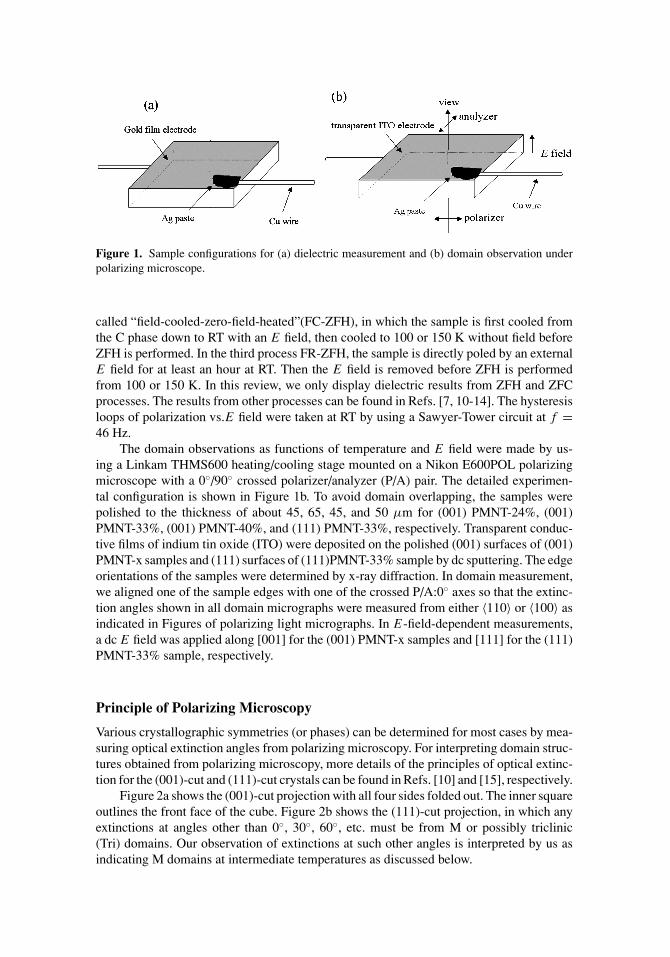
Figure 1. Sample configurations for (a) dielectric measurement and (b) domain observation underpolarizing microscope.
called “field-cooled-zero-field-heated”(FC-ZFH), in which the sample is first cooled fromthe C phase down to RT with an E field, then cooled to 100 or 150 K without field beforeZFH is performed. In the third process FR-ZFH, the sample is directly poled by an externalE field for at least an hour at RT. Then the E field is removed before ZFH is performedfrom 100 or 150 K. In this review, we only display dielectric results from ZFH and ZFCprocesses. The results from other processes can be found in Refs. [7, 10-14]. The hysteresisloops of polarization vs.E field were taken at RT by using a Sawyer-Tower circuit at f =46 Hz.
The domain observations as functions of temperature and E field were made by us-ing a Linkam THMS600 heating/cooling stage mounted on a Nikon E600POL polarizingmicroscope with a 0◦/90◦ crossed polarizer/analyzer (P/A) pair. The detailed experimen-tal configuration is shown in Figure 1b. To avoid domain overlapping, the samples werepolished to the thickness of about 45, 65, 45, and 50 µm for (001) PMNT-24%, (001)PMNT-33%, (001) PMNT-40%, and (111) PMNT-33%, respectively. Transparent conduc-tive films of indium tin oxide (ITO) were deposited on the polished (001) surfaces of (001)PMNT-x samples and (111) surfaces of (111)PMNT-33% sample by dc sputtering. The edgeorientations of the samples were determined by x-ray diffraction. In domain measurement,we aligned one of the sample edges with one of the crossed P/A:0◦ axes so that the extinc-tion angles shown in all domain micrographs were measured from either 〈110〉 or 〈100〉 asindicated in Figures of polarizing light micrographs. In E-field-dependent measurements,a dc E field was applied along [001] for the (001) PMNT-x samples and [111] for the (111)PMNT-33% sample, respectively.
Principle of Polarizing Microscopy
Various crystallographic symmetries (or phases) can be determined for most cases by mea-suring optical extinction angles from polarizing microscopy. For interpreting domain struc-tures obtained from polarizing microscopy, more details of the principles of optical extinc-tion for the (001)-cut and (111)-cut crystals can be found in Refs. [10] and [15], respectively.
Figure 2a shows the (001)-cut projection with all four sides folded out. The inner squareoutlines the front face of the cube. Figure 2b shows the (111)-cut projection, in which anyextinctions at angles other than 0◦, 30◦, 60◦, etc. must be from M or possibly triclinic(Tri) domains. Our observation of extinctions at such other angles is interpreted by us asindicating M domains at intermediate temperatures as discussed below.
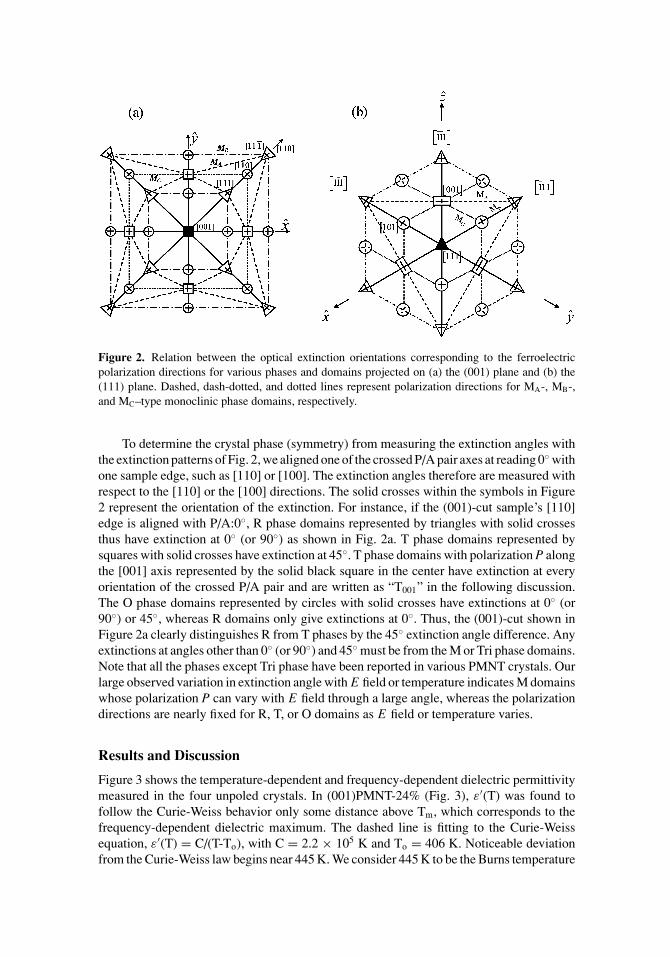
Figure 2. Relation between the optical extinction orientations corresponding to the ferroelectricpolarization directions for various phases and domains projected on (a) the (001) plane and (b) the(111) plane. Dashed, dash-dotted, and dotted lines represent polarization directions for MA-, MB-,and MC–type monoclinic phase domains, respectively.
To determine the crystal phase (symmetry) from measuring the extinction angles withthe extinction patterns of Fig. 2, we aligned one of the crossed P/A pair axes at reading 0◦ withone sample edge, such as [110] or [100]. The extinction angles therefore are measured withrespect to the [110] or the [100] directions. The solid crosses within the symbols in Figure2 represent the orientation of the extinction. For instance, if the (001)-cut sample’s [110]edge is aligned with P/A:0◦, R phase domains represented by triangles with solid crossesthus have extinction at 0◦ (or 90◦) as shown in Fig. 2a. T phase domains represented bysquares with solid crosses have extinction at 45◦. T phase domains with polarization P alongthe [001] axis represented by the solid black square in the center have extinction at everyorientation of the crossed P/A pair and are written as “T001” in the following discussion.The O phase domains represented by circles with solid crosses have extinctions at 0◦ (or90◦) or 45◦, whereas R domains only give extinctions at 0◦. Thus, the (001)-cut shown inFigure 2a clearly distinguishes R from T phases by the 45◦ extinction angle difference. Anyextinctions at angles other than 0◦ (or 90◦) and 45◦ must be from the M or Tri phase domains.Note that all the phases except Tri phase have been reported in various PMNT crystals. Ourlarge observed variation in extinction angle with E field or temperature indicates M domainswhose polarization P can vary with E field through a large angle, whereas the polarizationdirections are nearly fixed for R, T, or O domains as E field or temperature varies.
Results and Discussion
Figure 3 shows the temperature-dependent and frequency-dependent dielectric permittivitymeasured in the four unpoled crystals. In (001)PMNT-24% (Fig. 3), ε′(T) was found tofollow the Curie-Weiss behavior only some distance above Tm, which corresponds to thefrequency-dependent dielectric maximum. The dashed line is fitting to the Curie-Weissequation, ε′(T) = C/(T-To), with C = 2.2 × 10⁵ K and To = 406 K. Noticeable deviationfrom the Curie-Weiss law begins near 445 K. We consider 445 K to be the Burns temperature
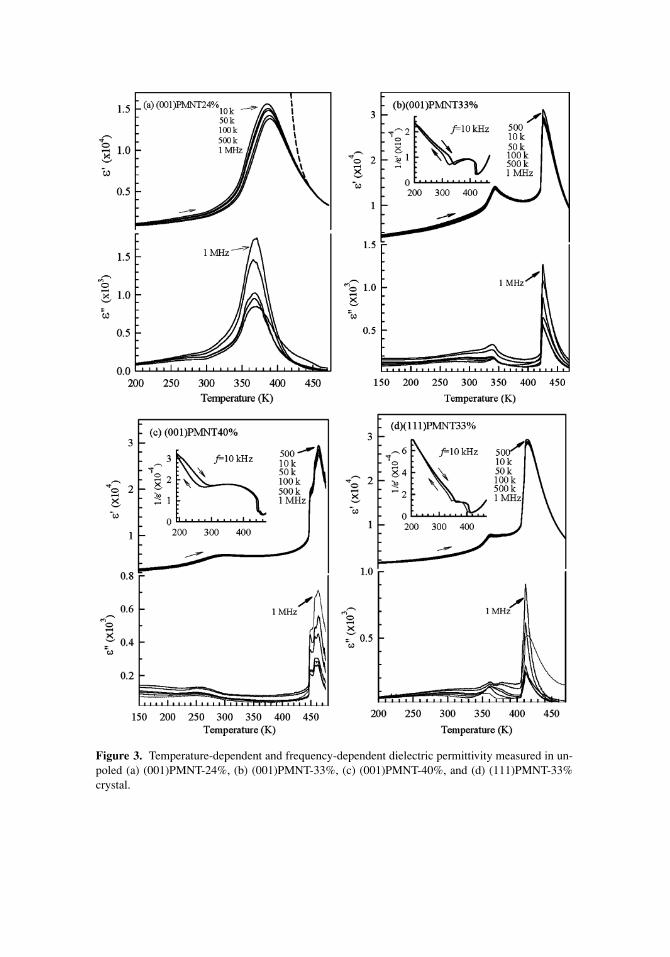
Figure 3. Temperature-dependent and frequency-dependent dielectric permittivity measured in un-poled (a) (001)PMNT-24%, (b) (001)PMNT-33%, (c) (001)PMNT-40%, and (d) (111)PMNT-33%crystal.
(TB), below which polar nanoclusters start to develop. Their weaker dielectric responsecauses deviations from the Curie-Weiss behavior and their dynamics is responsible for thebroad dielectric relaxation behavior [16].
Figure 3b shows the temperature-dependent real part ε′and imaginary part ε′′of di-electric permittivity at measuring frequency f = 10 kHz from ZFH for (001)PMNT-33%.Obvious thermal hysteresis is observed near 250–400 K and 415–430 K, respectively. Twosteep dips in the reciprocal of ε′ are seen at 340 (320 K) and 425 (420 K) for ZFH (ZFC),as shown in the inset of Fig. 3b. Both steep phenomena and thermal hysteresis imply twofirst-order-type transitions near 340 K (320 K) and 425 K (420 K) respectively upon heating(cooling) [17]. The temperature (Tm), which corresponds to dielectric maximum in ZFHand ZFC occurs at 425 and 420 K, respectively. The Tm doesn’t show apparent frequency-dependent behavior. Compared with (001) PMNT-24%, (001) PMNT-33% doesn’t exhibitclear frequency-dependent relaxation behavior even in the low temperature region, indicat-ing that (001) PMNT-33% has a longer range ordered state.
Figure 3c shows temperature-dependent ε′ and ε′′ at several frequencies obtained fromZFH for (001) PMNT-40%. Two thermal hysteresises are observed in the temperatureregions of ∼200–280 K and ∼420–460 K, indicating two first-order-type phase transitions.As shown in the reciprocal of ε′, one steep dip near 460 K also confirms a first-order-typetransition. The shoulder seen near 450 K most likely is due to phase segregation.
Figure 3d shows temperature-dependent ε′and ε′′at several frequencies obtained fromZFH for (111) PMNT-33%. Two thermal hysteresises are observed in the temperatureregions near 240–360 K and 380–420 K, indicating two first-order-type phase transitions. Asshown in the reciprocal of ε′, two steep dips near 360 (340 K) and 420 (415 K) upon heating(cooling) also confirm two first-order-type transitions. Compared with (001) PMNT-24%,both (111) and (001) PMNT33% do not exhibit apparent frequency-dependent relaxationbehavior.
What are the temperature-dependent phase transitions in the PMNT-x crystals? Howare the crystal phases determined? The details of results and discussion regarding phase(structural) transitions determined by the methods of dielectric and polarizing microscopymeasurements for the four crystals can be found in Refs. [10, 11], [7, 12], [13], and [14]for (111) PMNT-33%, (001) PMNT-24%, (001) PMNT-40%, and (001) PMNT-33%, re-spectively. Here, we present the results and discussion of polarizing microscopy for the(001)PMNT-33% crystal, which is the compound near the MPB, as an example to illus-trate the methods we have employed to investigate phase (structural) transitions in all fourcrystals. In addition, we show comparisons for the four crystals.
Thermally Induced Phase Transitions
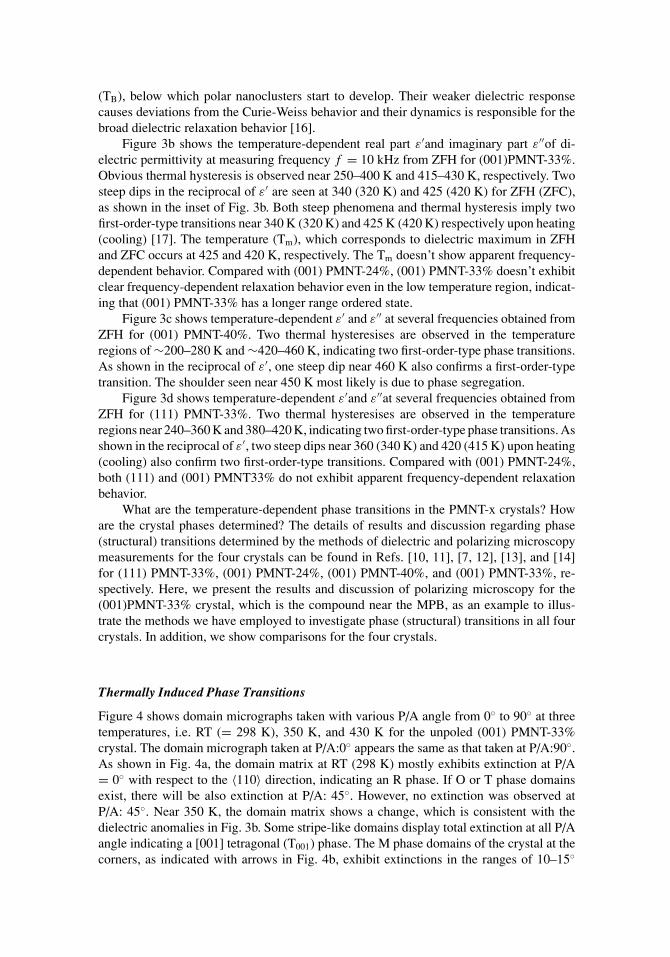
Figure 4 shows domain micrographs taken with various P/A angle from 0◦ to 90◦ at threetemperatures, i.e. RT (= 298 K), 350 K, and 430 K for the unpoled (001) PMNT-33%crystal. The domain micrograph taken at P/A:0◦ appears the same as that taken at P/A:90◦.As shown in Fig. 4a, the domain matrix at RT (298 K) mostly exhibits extinction at P/A= 0◦ with respect to the 〈110〉 direction, indicating an R phase. If O or T phase domainsexist, there will be also extinction at P/A: 45◦. However, no extinction was observed atP/A: 45◦. Near 350 K, the domain matrix shows a change, which is consistent with thedielectric anomalies in Fig. 3b. Some stripe-like domains display total extinction at all P/Aangle indicating a [001] tetragonal (T001) phase. The M phase domains of the crystal at thecorners, as indicated with arrows in Fig. 4b, exhibit extinctions in the ranges of 10–15◦
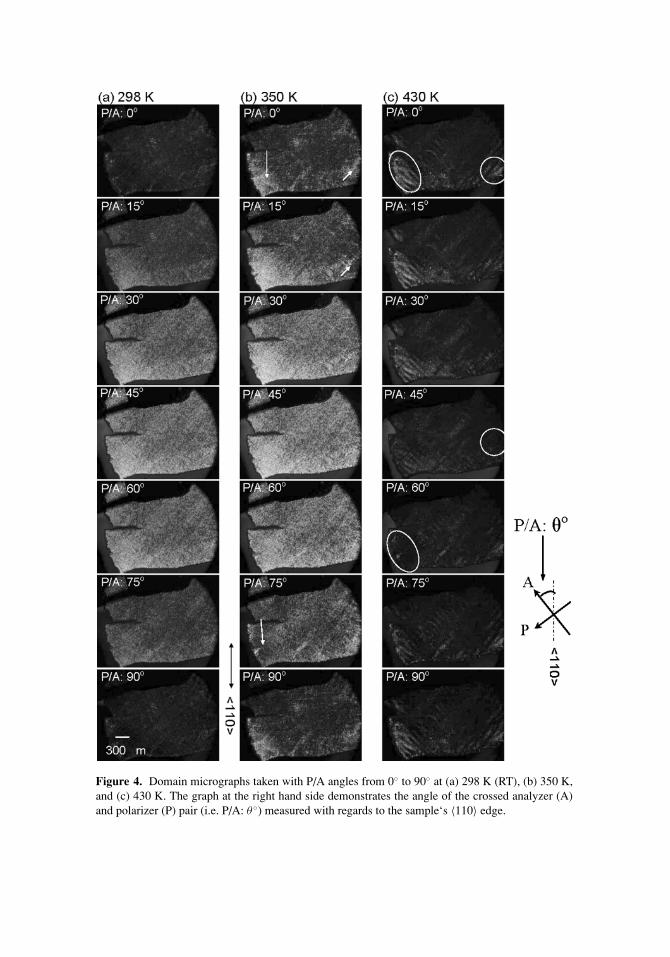
Figure 4. Domain micrographs taken with P/A angles from 0◦ to 90◦ at (a) 298 K (RT), (b) 350 K,and (c) 430 K. The graph at the right hand side demonstrates the angle of the crossed analyzer (A)and polarizer (P) pair (i.e. P/A: θ ◦) measured with regards to the sample‘s 〈110〉 edge.
and 75–80◦. The crystal has coexistence of a dominant R and minor M phase domains, i.e.R(M). As temperature increases further, the domain area and the range of extinction anglefor the M phase expand, and the T001 phase domains also expand. Near 430 K, the C phasebegins to appear as stripes with a total extinction at every P/A angle besides the T001 phasedomains. In addition, a small portion of the domain matrix exhibits extinction angles of55–75◦ and 30-50◦ as circled in Fig. 4c, indicating the M phase. Near 433 K, the wholecrystal becomes C phase. In brief, an R→R(M)→R/M/T001 →C phase transition sequencetakes place near 343, 350 and 430 K upon heating, respectively. R/M/T001 indicates thecoexistence of R, M, and T001 phase domains.
E Field-Induced Phase Transition
Figure 5 shows the E field-dependent domain structures taken at RT for three E fieldstrengths while a dc E field was applied along [001]. At E = 0 kV/cm, the domain matrixexhibits an R phase with extinction at P/A:0◦ as shown in Fig. 4a. The domain matrix doesnot change apparently until 4.1–4.8 kV/cm as shown in Fig. 5a. The domain matrix mostlystill retains R phase, but T001and M/T phases are induced near the cracking area, as indicatedby an arrow in Fig. 5a, and exhibit extinctions at every P/A angle and in the range of 15–65◦,respectively. M/T represents the coexistence of M and T phases with more M phase than Tphase domains. Note that the coercive field EC for the (001) PMNT-33% crystal is about3 kV/cm as given in Fig. 5d. As the field increases to 11 kV/cm (Fig. 5b), the T001 phasedomain significantly expands as crossed stripes along [100] and [010] from the crackingarea. Some of the R phase domains have also transformed to M and T phase with variousnonzero-degree extinction angles, such as 5–15◦, 20–50◦, and 50–75◦. But small portionof the domain matrix circled in Fig. 5b still remains in the R phase. With increasing Efield, this E field-induced transition is continuously evidenced by the expansion of the T001
phase domain shown as black area of the domain matrix. At E = 34 kV/cm, most of thedomain matrix becomes macroscopic T001 phase domain except for some small R, T, andM phase domains with extinction angles of 0◦, 45◦, and ∼15–45◦ as shown in Fig. 5c. Inaddition, a few domains exhibiting no extinction at any P/A angle are embedded in the T001
domain matrix, perhaps due to crystal defects and local strain caused by underlying M phasedistortions with various different orientations. In brief, the E field-induced phase transitionsequences at RT in (001) PMNT-33% include R→T001, R→M→T001, R→T→T001, andR→M→T→T001.
As shown in Fig. 6b, the (001) PMNT-33% crystal cannot completely reach a T001
monodomain at E = 34 kV/cm applied along [001] at RT [14]. However, the (111) PMNT-33% crystal (Fig. 6d) gradually reaches an R111 monodomain at E = 12 kV/cm appliedalong [111] at RT [11]. The (001) PMNT-40% crystal shown in Fig. 6c becomes entirelyT001 monodomain under E = 33 kV/cm applied along [001] [13]. But the (001) PMNT-24%crystal (Fig. 6a) cannot reach a T001 monodomain under E = 44 kV/cm applied along [001]at RT [12]. Therefore, a monodomain with the orientation along the poling field was notalways obtained under the maximum E-field strength in every crystal at RT as expected,such as the (001) PMNT-24% and (001) PMNT-33% with E field applied along [001][12, 14]. The E field-induced monodomain can be achieved in the PMNT crystals if thedc poling field is along the polar axes of the phase favored by the temperature, such asthe (111)PMNT-33% and (001)PMNT-40%crystals [11, 13]. As shown in Fig. 6c, T polardirections are favored at RT in the (001) PMNT-40% so that less E-field poling strengthis needed to induce the T phase domains with the field applied along [001]. On the other
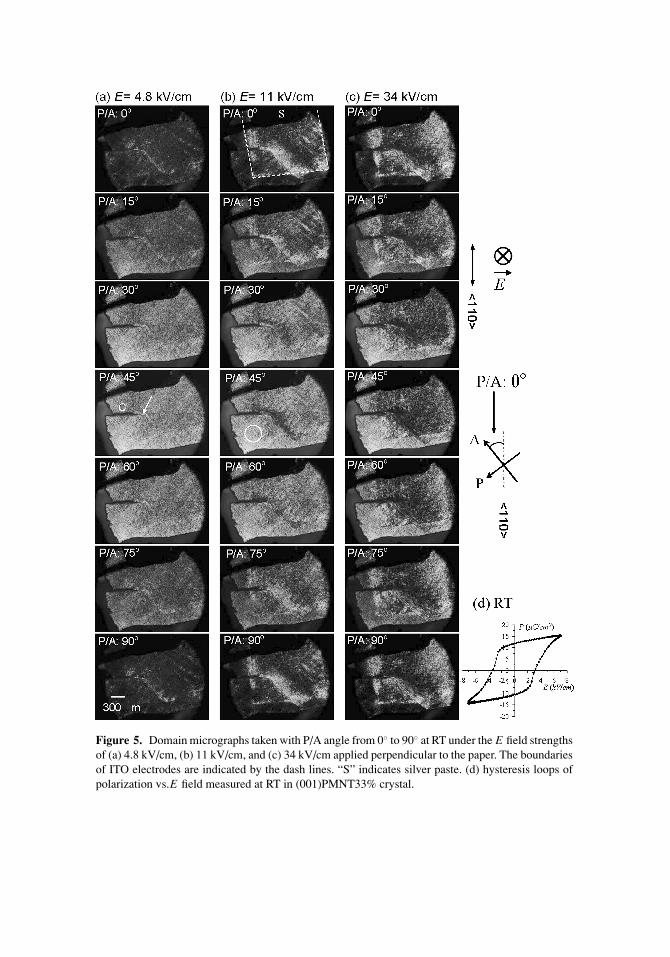
Figure 5. Domain micrographs taken with P/A angle from 0◦ to 90◦ at RT under the E field strengthsof (a) 4.8 kV/cm, (b) 11 kV/cm, and (c) 34 kV/cm applied perpendicular to the paper. The boundariesof ITO electrodes are indicated by the dash lines. “S” indicates silver paste. (d) hysteresis loops ofpolarization vs.E field measured at RT in (001)PMNT33% crystal.
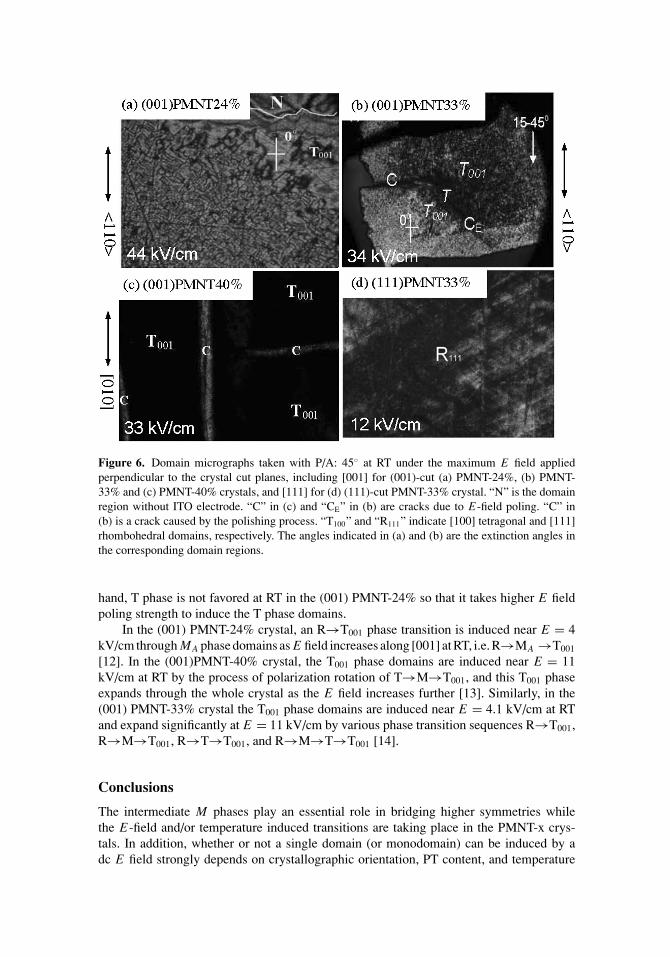
Figure 6. Domain micrographs taken with P/A: 45◦ at RT under the maximum E field appliedperpendicular to the crystal cut planes, including [001] for (001)-cut (a) PMNT-24%, (b) PMNT-33% and (c) PMNT-40% crystals, and [111] for (d) (111)-cut PMNT-33% crystal. “N” is the domainregion without ITO electrode. “C” in (c) and “CE” in (b) are cracks due to E-field poling. “C” in(b) is a crack caused by the polishing process. “T100” and “R111” indicate [100] tetragonal and [111]rhombohedral domains, respectively. The angles indicated in (a) and (b) are the extinction angles inthe corresponding domain regions.
hand, T phase is not favored at RT in the (001) PMNT-24% so that it takes higher E fieldpoling strength to induce the T phase domains.
In the (001) PMNT-24% crystal, an R→T001 phase transition is induced near E = 4kV/cm through MA phase domains as E field increases along [001] at RT, i.e. R→MA →T001
[12]. In the (001)PMNT-40% crystal, the T001 phase domains are induced near E = 11kV/cm at RT by the process of polarization rotation of T→M→T001, and this T001 phaseexpands through the whole crystal as the E field increases further [13]. Similarly, in the(001) PMNT-33% crystal the T001 phase domains are induced near E = 4.1 kV/cm at RTand expand significantly at E = 11 kV/cm by various phase transition sequences R→T001,R→M→T001, R→T→T001, and R→M→T→T001 [14].
Conclusions
The intermediate M phases play an essential role in bridging higher symmetries whilethe E-field and/or temperature induced transitions are taking place in the PMNT-x crys-tals. In addition, whether or not a single domain (or monodomain) can be induced by adc E field strongly depends on crystallographic orientation, PT content, and temperature
region where an external dc E field was applied. A monodomain was achieved in the(111) PMNT-33% and (001) PMNT40% while a dc E-field was applied along [001] and[111], respectively. Compared with PMNT-33% and 40%, the (001) PMNT-24% crystalexhibits frequency-dependent relaxation behavior in a wide temperature region and itshigh-temperature dielectric permittivity shows deviation from the Curie-Weiss law, indicat-ing that dynamics of polar nanoclusters plays an important role in its temperature-dependentphenomena.
Acknowledgments
The authors would like to express sincere thanks to Dr. H. Luo for the crystals. This workwas supported by DoD EPSCoR Grant No. N00014-02-1-0657 and NSC Grant No. 94-2112-M-030-004.
References
1. S.-E. Park and T. R. Shrout, Ultrahigh strain and piezoelectric behavior in relaxor based ferro-electric single crystals. J. Appl. Phys. 82, 1804–1811 (1997).
2. S.-E. Park and E. Hackenberger, High performance single crystal piezoelectrics applications andissues. Curr. Opin. Solid State Mater. Sci. 6, 11–18 (2002).
3. P. Han, W. Yan, J. Tian, H. Huang, and H. Pan, Cut directions for the optimization of piezoelectriccoefficients of lead magnesium niobate-lead titanate ferroelectric crystals. Appl. Phys. Lett. 86,052902 (2005) (3 pages).
4. B. Noheda, Structure and high-piezoelectricity in lead oxide solid solutions. Curr. Opin. SolidState Mater. Sci. 6, 27–34 (2002).
5. I.-K. Jeong, T. W. Darling, J. K. Lee, Th. Proffen, R. H. Heffner, J. S. Park, K. S. Hong,W. Dmowski, and T. Egami, Direct Observation of the formation of polar nanoregions inPb(Mg1/3Nb2/3)O3 using neutron pair distribution function analysis. Phys. Rev. Lett. 94, 147602(2005) (3 pages).
6. H. Fu and R. E. Cohen, Polarization rotation mechanism for ultrahigh electromechanical responsein single-crystal piezoelectrics. Nature 403, 281–283 (2000).
7. C.-S. Tu, R. R. Chien, F.-T. Wang, V. H. Schmidt, and P. Han, Phase stability after an electric-fieldpoling in Pb(Mg1/3Nb2/3)1−xTixO3 crystals. Phys. Rev. B. 70, 220103 (2004) (4 pages).
8. Z. Feng, X. Zhao, and H. Luo, Composition and orientation dependence of phase configurationand dielectric constant tunability in poled Pb(Mg1/3Nb2/3)O3-PbTiO3 single crystals. J. Physics:Condens. Matt. 16, 6771–6778 (2004).
9. M. Davis, D. Damjanovic, and N. Setter, Electric-field-, temperature-, and stress-induced phasetransitions in relaxor ferroelectric single crystals. Phys. Rev. B. 73, 014115 (2006) (16 pages).
10. C.-S. Tu, V. H. Schmidt, I.-C. Shih, and R. Chien, Phase transformation via a monoclinic phase inrelaxor-based ferroelectric crystal (PbMg1/3Nb2/3O3)1−x(PbTiO3)x. Phys. Rev. B. 67 (R), 020102(2003) (4 pages).
11. C.-S. Tu, V. H. Schmidt, R. Chien, and I.-C. Shih, E-field-induced polarization rotation in(PbMg1/3Nb2/3O3)1−x (PbTiO3)x crystal. Appl. Phys. Lett. 83, 1833–1835 (2003).
12. R. R.Chien, V. H. Schmidt, C.-S. Tu, L.-W. Hung, and H. Luo, Field-induced polarization rotationin (001)-cut Pb(Mg1/3Nb2/3)0.76Ti0.24O3. Phys. Rev. B. 69, 172101 (2004).
13. R. R. Chien, V. H. Schmidt, L.-W. Hung, and C.-S. Tu, Temperature- and electric-field-dependentdomain structures and phase transformations in (001)-cut tetragonal Pb(Mg1/3Nb2/3)1−xTixO3
(x = 0.40) single crystal. J. Appl. Phys. 97, 114112 (2005) (4 pages).14. R. R. Chien, C.-S. Tu, V. H. Schmidt, and F.-T. Wang, Electric-field- and temperature-induced
phase transitions in high-strain ferroelectric Pb(Mg1/3Nb2/3)0.67Ti0.33O3 single crystal. J. Phys.Condens. Matter. 18, 8337–8344 (2006).

15. V. H. Schmidt, R. Chien, I.-C. Shih, and C.-S. Tu, Polarization rotation and monoclinic phase inrelaxor ferroelectric PMN-PT crystal. AIP Conference Proceedings 677, 160–167 (2003).
16. D. Viehland, S. J. Jang, L. E. Cross, and M. Wuttig, Deviation from Curie-Weiss behavior inrelaxor ferroelectrics. Phys. Rev. B. 46, 8003–8005 (1992).
17. K. Uchino, Ferroelectric Devices. New York: Marcel Dekker, Inc. (1962) pp. 38–41.


![Using the DVS to Investigate Note 42 Moisture-Induced ......glass transition temperature below the storage temperature and cause phase transitions and lyophile collapse [11]. Additionally,](https://img.dokumen.tips/doc/110x75/5f109eac7e708231d449fffc/using-the-dvs-to-investigate-note-42-moisture-induced-glass-transition-temperature.jpg)
![Salt-Induced Swelling and Volume Phase Transition of ...ruihuang/papers/JAM08.pdf · Volume phase transitions in gels induced by temperature and pH have been studied extensively [5,12]](https://img.dokumen.tips/doc/110x75/5f0d24ab7e708231d438e3ba/salt-induced-swelling-and-volume-phase-transition-of-ruihuangpapersjam08pdf.jpg)