Embed Size (px)
Citation preview
UNCLASSIFIED
AD NUMBER
AD839274
NEW LIMITATION CHANGE
TOApproved for public release, distributionunlimited
FROMDistribution authorized to DoD only;Administrative/Operational Use; AUG 1968.Other requests shall be referred to AirForce Rocket Propulsion Lab., Edwards AFB,CA 93523.
AUTHORITY
AFRPL ltr 27 Oct 1971
THIS PAGE IS UNCLASSIFIED
AFRPL-TR -63-124-Vol 11 Copy o. 32
FLEXI BLE EXIT CONENOZZLE DEVELOPMENT PROGRAM
PHASE II REPORT
VOLUME IICOLD FLOW TESTS
August 1968
HTED"LI, Pre _ed for
h t rt Tore
Def..~ U-' L~)rGtp j f-----------------------Rocket Propulsion Laboratory
Research and Technology Division
Air Force Systems Command
Edwards, California 9 j3,dTi ; p2-i 'c
CHEMICAL CORPORATIONWASATCH DIVISION
SEP 17 1968G L :- - ; U

DISCLAIMER NOTICE
THIS DOCUMENT IS BEST
QUALITY AVAILABLE. THE COPY
FURNISHED TO DTIC CONTAINEDA SIGNIFICANT NUMBER OF
PAGES WHICH DO NOT
REPRODUCE LEGIBLY.

'TWR-3050
FINAL REPORT
COLD FLOW lESTSFLEX-X NOZZLE
August 1968
Prepared by
R. Lavery
Aero-Thermo Analy Section
L il o
AFRP TR-68-124-Vol-2. Q
I .I 44(
FLEXIBLE EXIT CONENOZZLE DEVELOPMENT PROGRAM#
VOLUMEr.COLD FLOW TESTS.
ii. - P~ ~VeAt
Preparedby
THIOKOL CHEMICAL CORPORATIONWASATCH DIVISIONBrigham City, Utah
Publications W- 79523 .

j ..
TABLE OF CONTENTS
I INTRODUCTION AND SUMMARY ................... 1
A. Introduction .............................. 1, B. Summary ................................. 2
II TEST OBJECTIVES ......................... . 3
III TECHNICAL APPROACH ........................ 4
A. Scope ................................... 4B. Test Plan ................................ 5C. Nomenclature u.......................... 5
-IV FACILITY ............................... . 9
V TEST PROCEDURE .. ......................... 17
A. Calibration ................ ... 17B. Test Models . . .............. ............. 26C. Instrumentation......................... 32
..... Testing . . o.. . . . . . . . . . . . .. 35
VI TEST RESULTS . .................. ....... o ...... 37
A. Data Presentation ........ ........ o .... 37B. Discussion of Test Data .......... . ........ 40
1. Side Force and Torque ................... 40
2. Axial Force Data ........... ............ 613. Pressure Data and Flow Vfsualization Data ...... 66
VII CONCLUSIONS ............................... 73
VIII RECOMMENDATIONS........
[i
LIST OF ILLUSTRATIONS
Figure Pag
1 Basic Flex-X Cold Flow Nozzle Nomenclature ............... 7
2 Cold Flow Laboratory Layout (T.LL 11175) ................. 10
3 Arrangement of Test Tank ......................... 11
4 Ejector System for Thrust Stand Cold Flow ................ .12
5 Thrust Stand and Piping ........................... 13
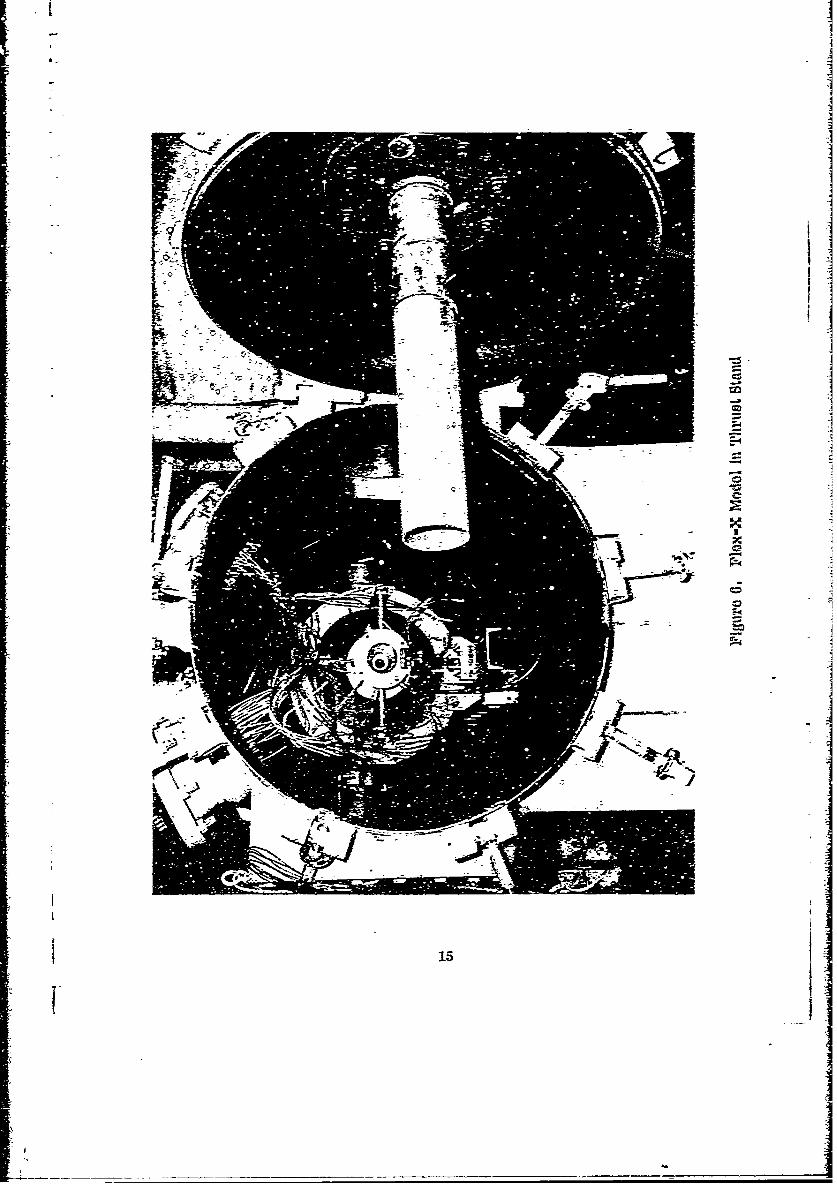
6 Flex-X Model in Thrust Stand .... .................. 15
7 Flexible Joint Thrust Stand ........................ 16
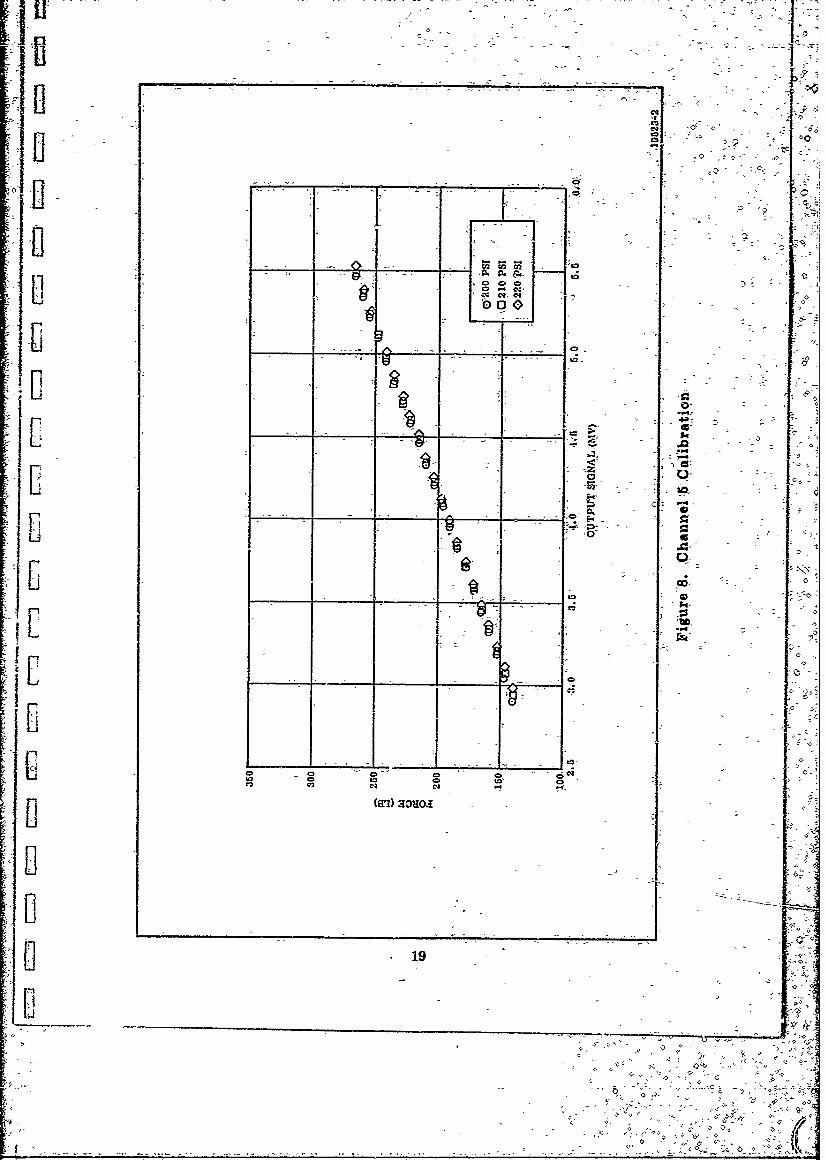
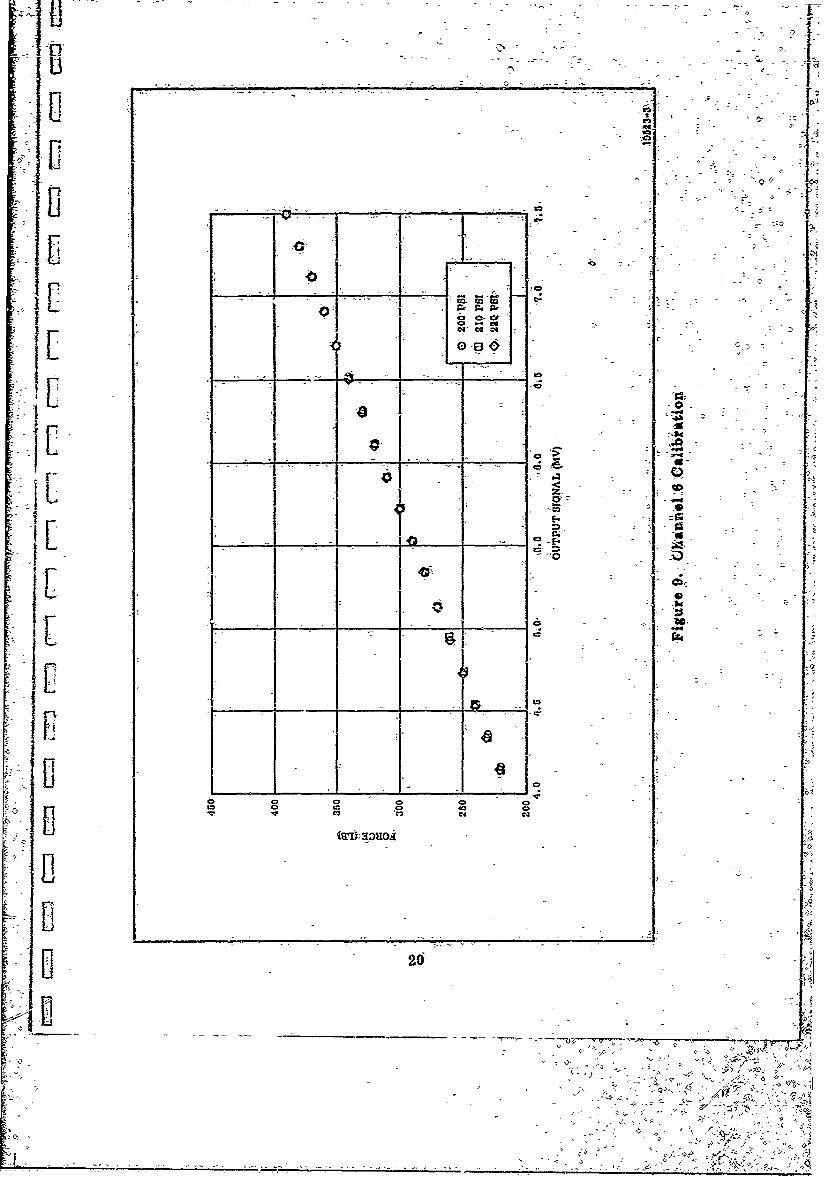
8 Channel 5 Calibration ............................ 19
9 Channel 6 Calibration ............................ 20
10 Chanel 7 Calibration ............................. 21
11 Channel 5, Second Calibration ...................... 23
12 Channel 6, Second Calibration ........................ 24
13 Channel 7, Second Calibration ...................... 25
14 Flex-X Cold Flow Model Details ..................... 27
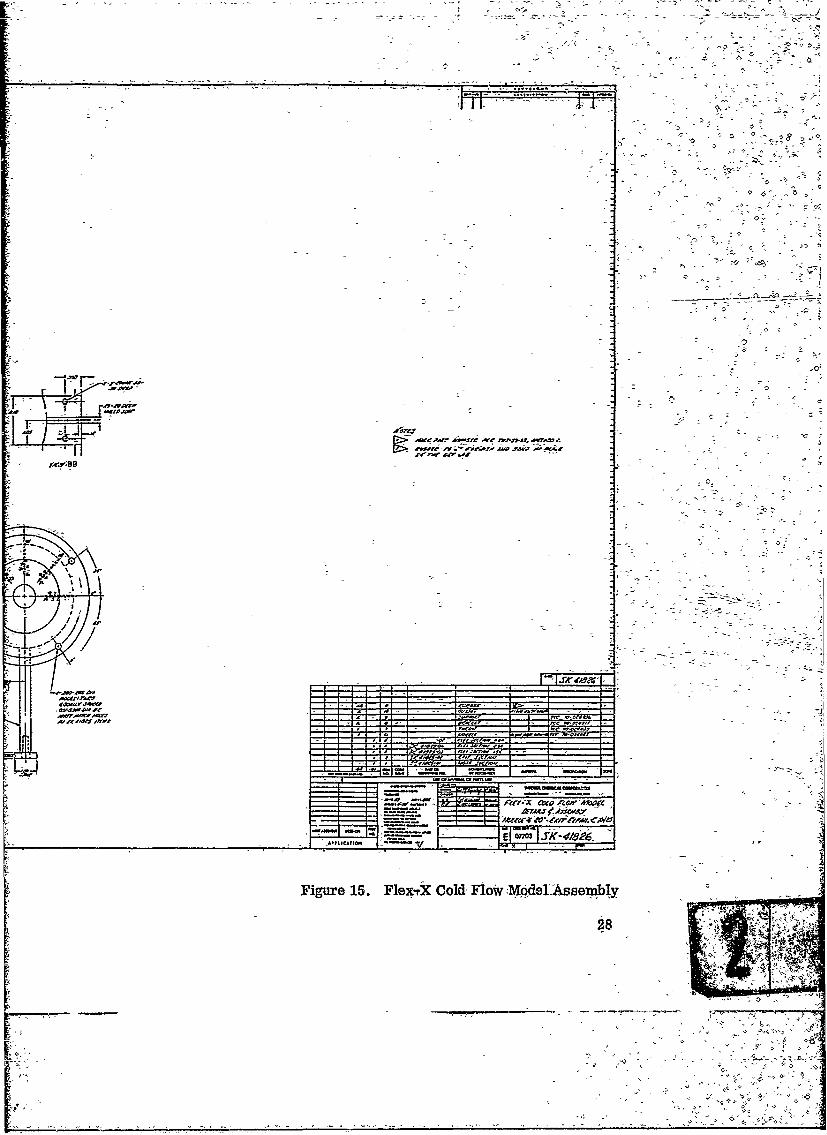
15 Flex-X Cold Flow Model Assembly .................... 28
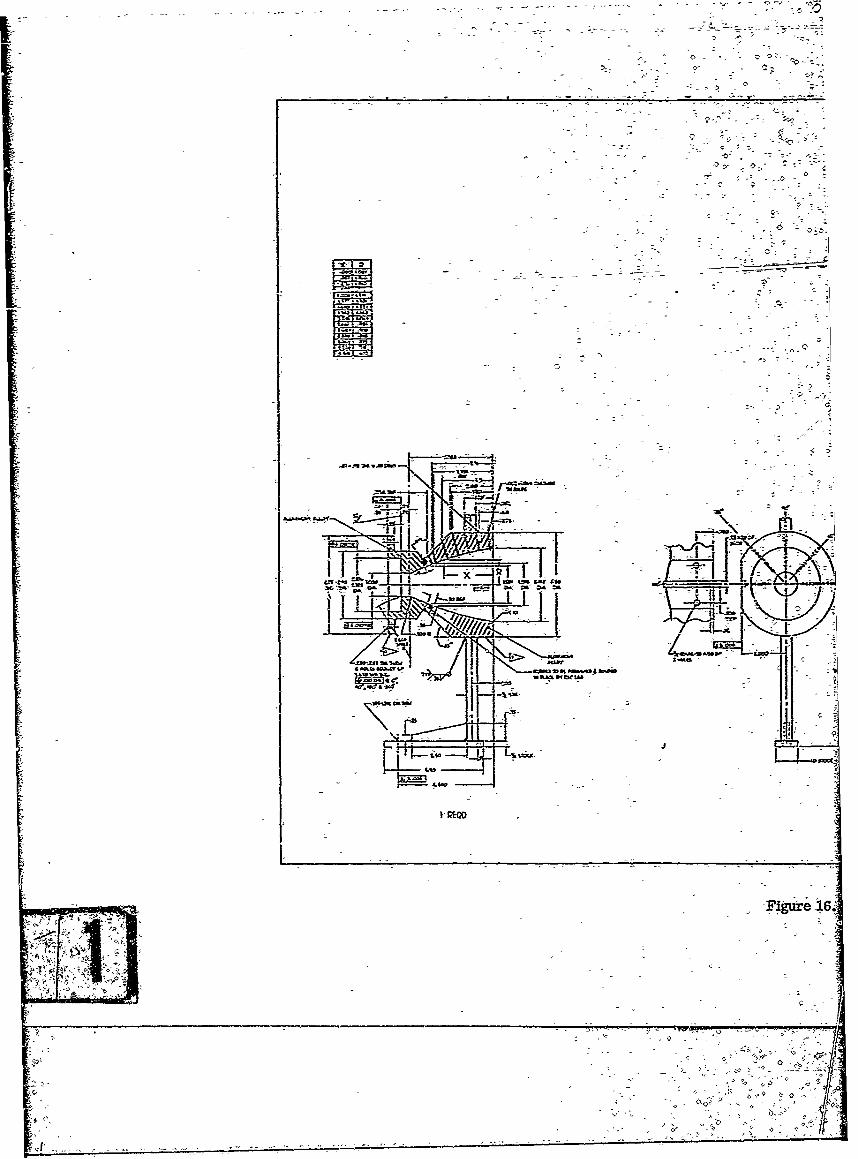
16 Flex-X Cold Flow Model Details at Exit Expansion C 10 ..... 29
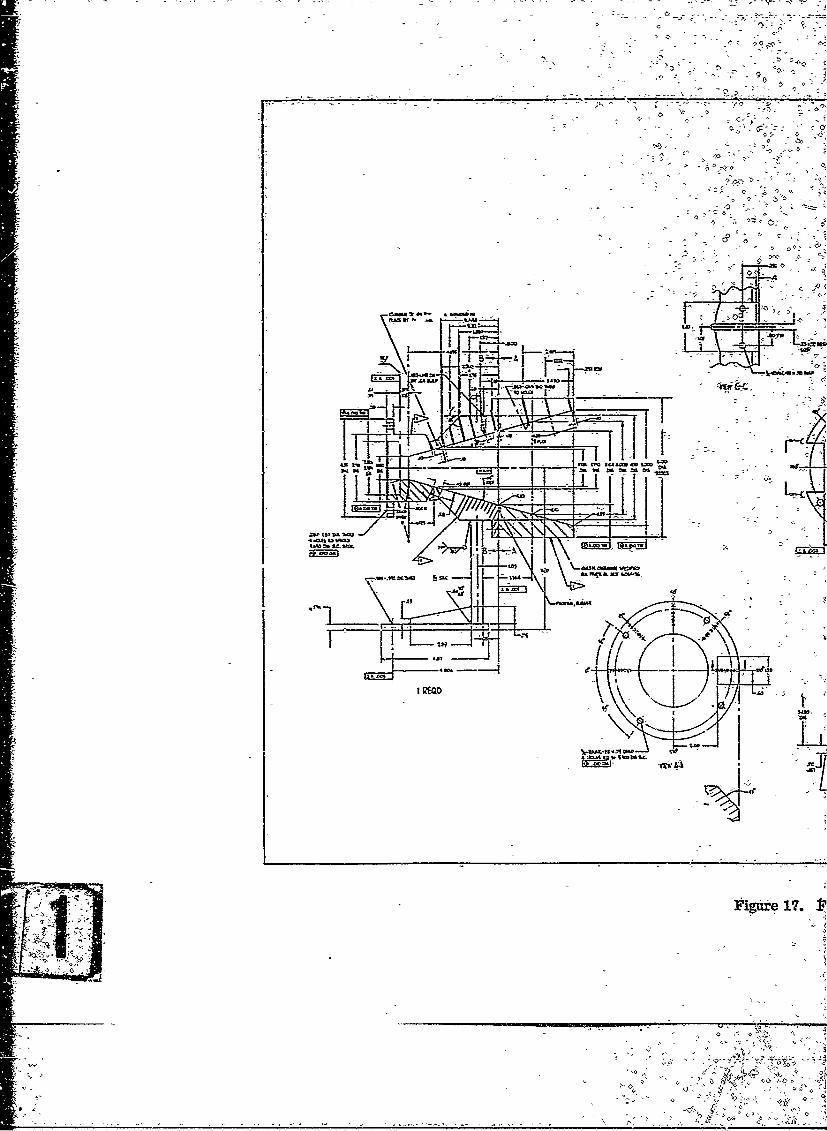
17 Flex-X Cold Flow Model Details, 15 Degree Nozzle Angle,Exit Expansion c 10, 16, and 25 ..................... 30
iii

-~-~ ---. ...- '=-.- -.- .- -
I~I~ LIST OF ILLUSTRATONS (Cont)
-AFigure -
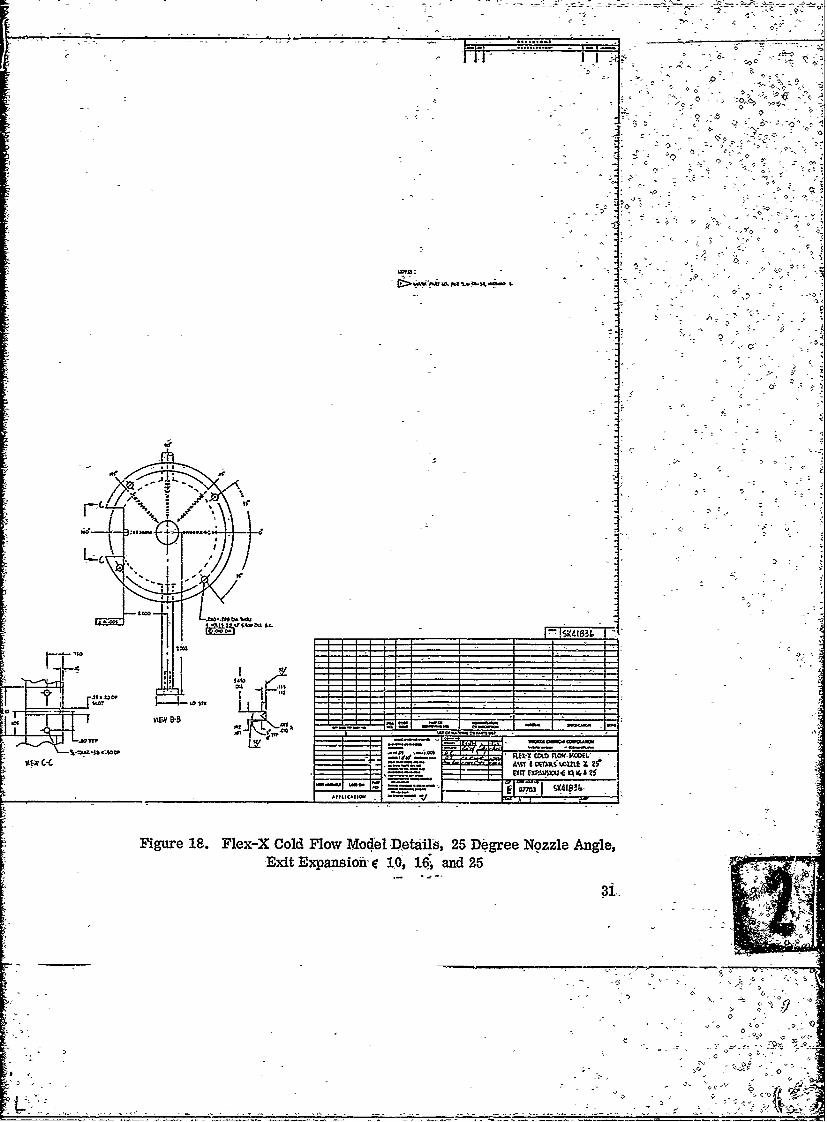
18 Flex-X Cold Flow ModbeiDetails, 25 Degree W6=A !e, -EtExpansion io, ,nd25.........
19. Sketch 6PEroded K6zzles (30 Rnd 60 .......... ) . 33[ 20 Three Component Balance.System- Gage Installationn. 34 -J
21- Photograph of -the Mercury Manometer BoaiddThm No. 1. 5Degree Vector, H25.71 ...... 36 "
22 Effect of-Pivot -Location on.Side Force and Torque A-l a~ip - L0 s.)e ............... . . 42:Amplificaton ( = , s -. .
23 Effect of Pivot Location on Side Force andTorqueAmplification'(C = 10, C -2.5)..5 ..................... 43
s
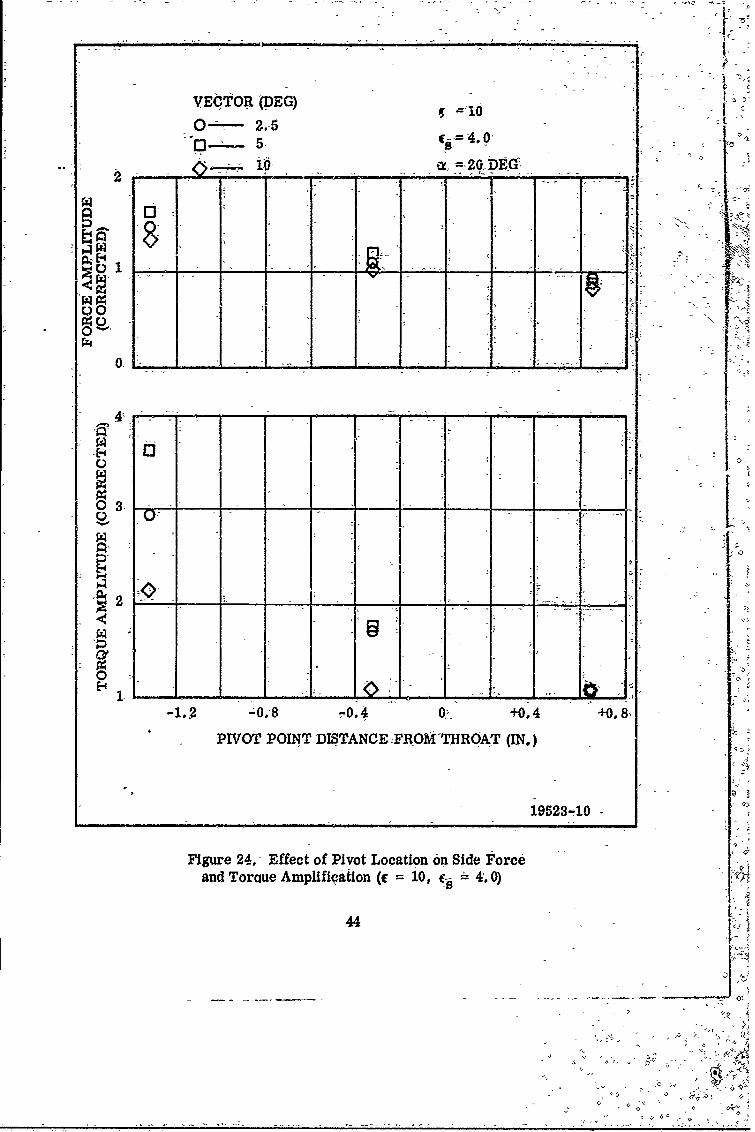
r 24 'Effect Of Pivot-Location. on Side Force and'TorqueT ~AxphiCatin IE=10, IES =0)..................... 4
25 Effect of Pivot Location on Side Force and Toque
Amplification (C- 25, c 1.5) 45....
26 Effect of Pivot Lodation on Side Force and TorqueAmpl"fication (c =25, c= 2.5) ....................... 46
27 Effect of-Pivot Location on Side Force and Torquek j Amplification.(c = 25, s = 4.0) ....... o ....... . 47K
f 28 Effect of Joint Location-on Side Force and'TorqueAmplification-( c = 10j Pivot i) ................ .. 49
129 Effect of Joint Lodation on Side Force and Torque
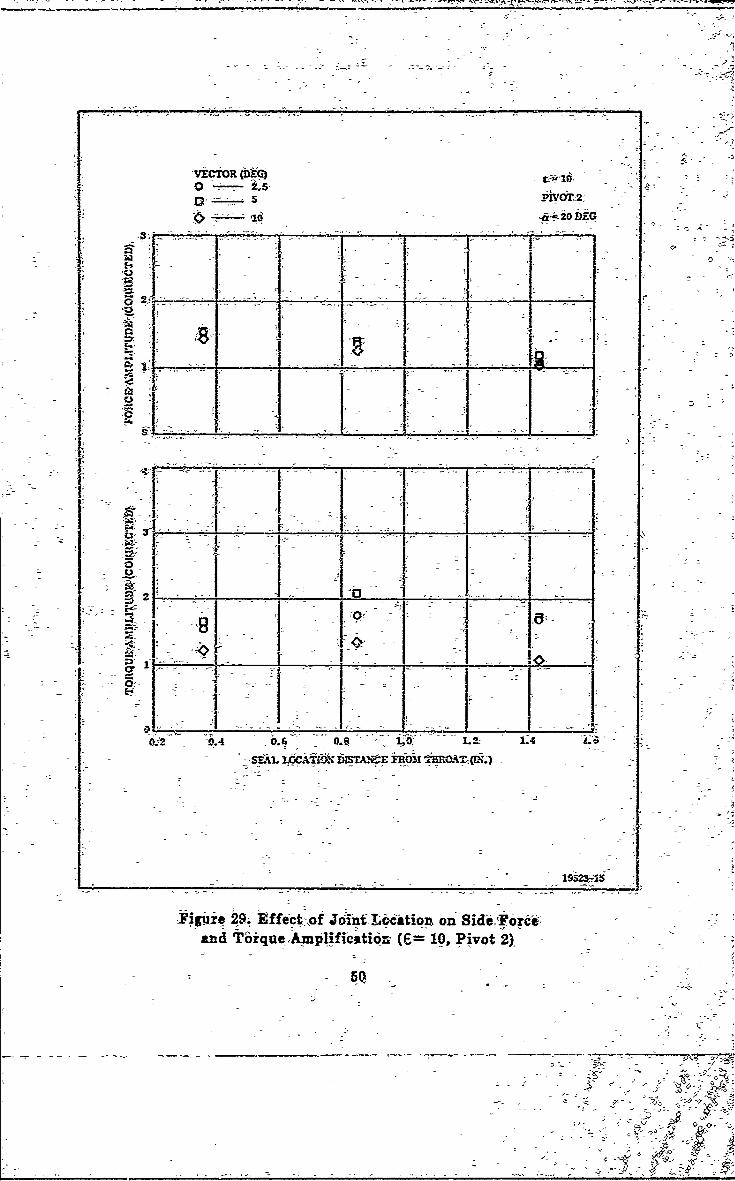
Amplification-( =0, Pivot 2) ................ 50
30 Effect of Joint Location on Side Force and TorcueAmplification (- = 10, Pivot-3) ......................... 51
31 Effecbtof Joint Location on Side Force and-Torque
Amplification (= 2 5 , Pivot 1) ......... ........ . 52:
iv
-7
-. Z.4

-_- - ISTOF LASTAIS -(Co~t) -
32 ffet o Jont o~.i~non ide, Foi-de and'Toi-quehAmplification (C =-25, PI ot 2) . ........ 53
- 33 EffectOfTbiftLocatonon-Side Force and'Tor-queAmpliqct~i(t =,25, Pivot ...)..... 54
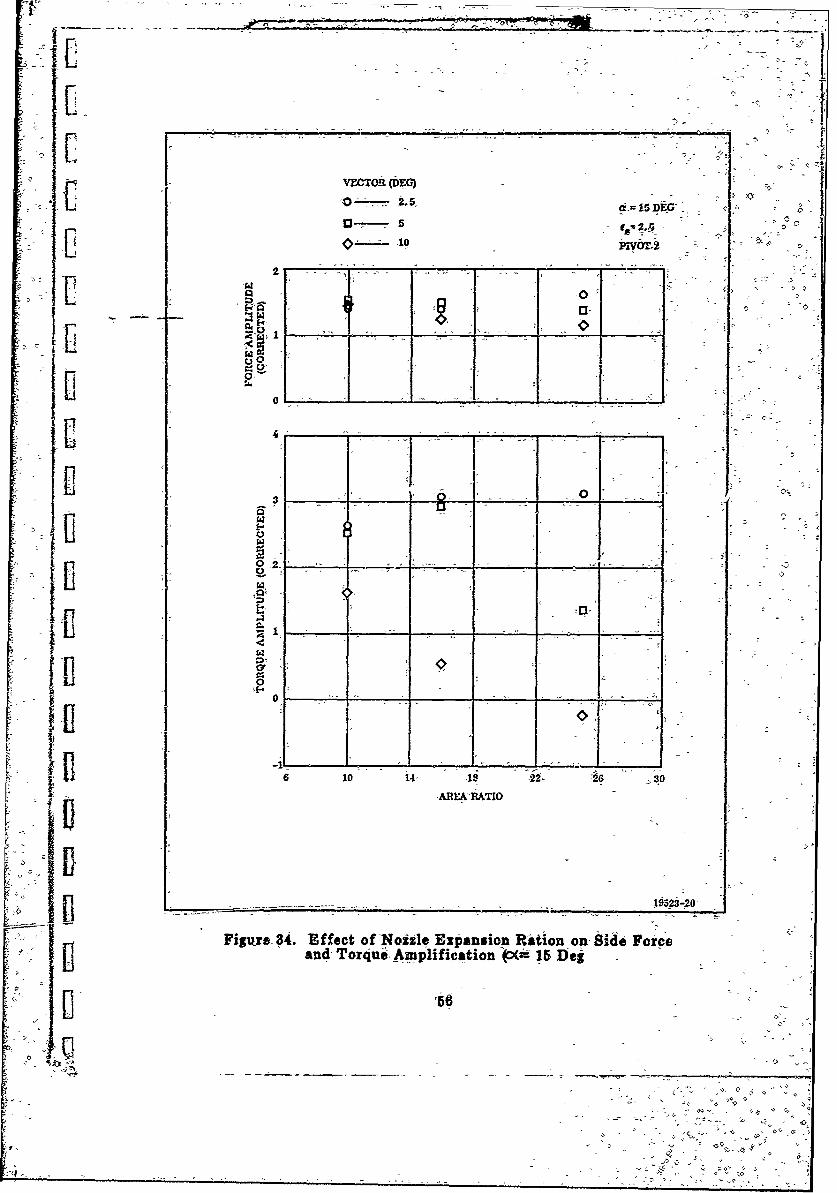
34 Effect of-Nozzle Expansion-Ration on Side Force-and,Torqiie Amplification (a=x 15 Deg).. ......... .- 6
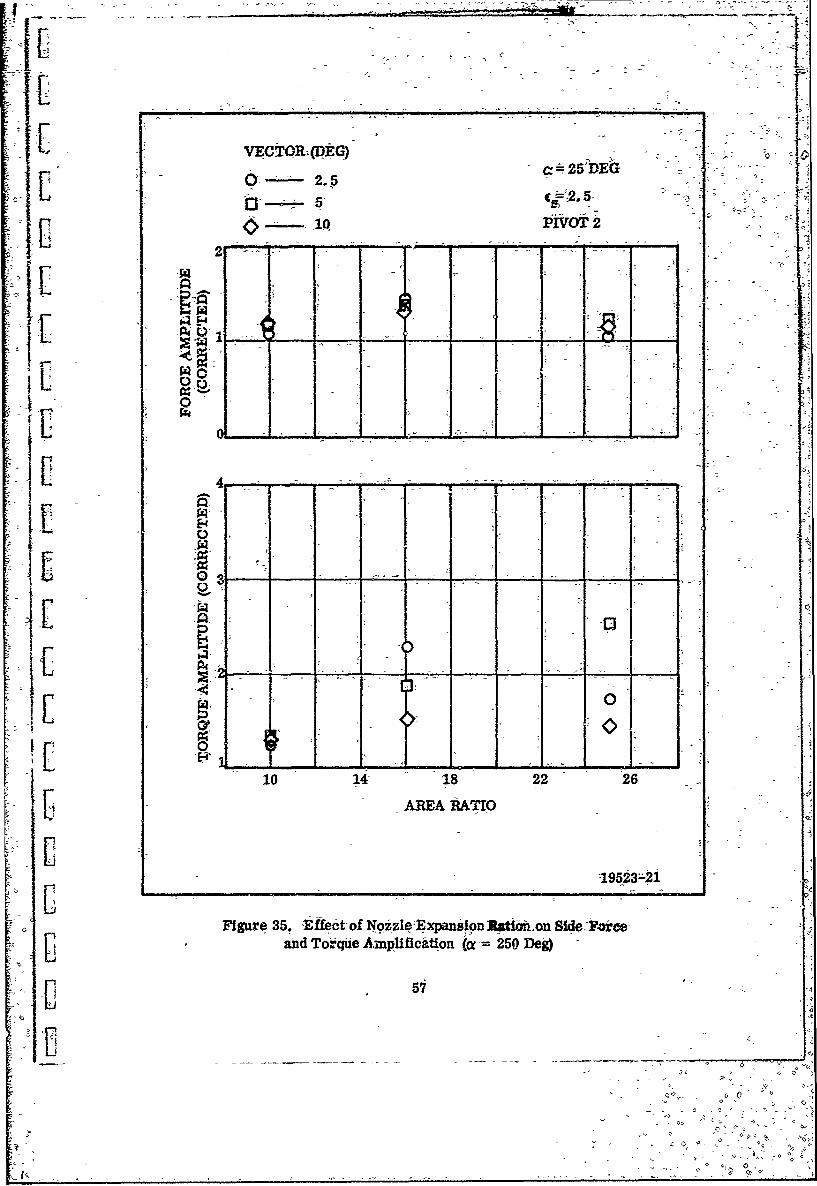
~ I35 Effect of Nozzle Expansion Ration on Side jForce andTorque Amplification (ce = 25Dbeg).,.................57
36 Effect of Nozei Cone Angle on Side Force Lnd Torque
Amplifidation................... .......... 59-
37 jEffebt of Nozzle-LErcsion on Side Force and Tor4ue......6Aniplification.................. 6
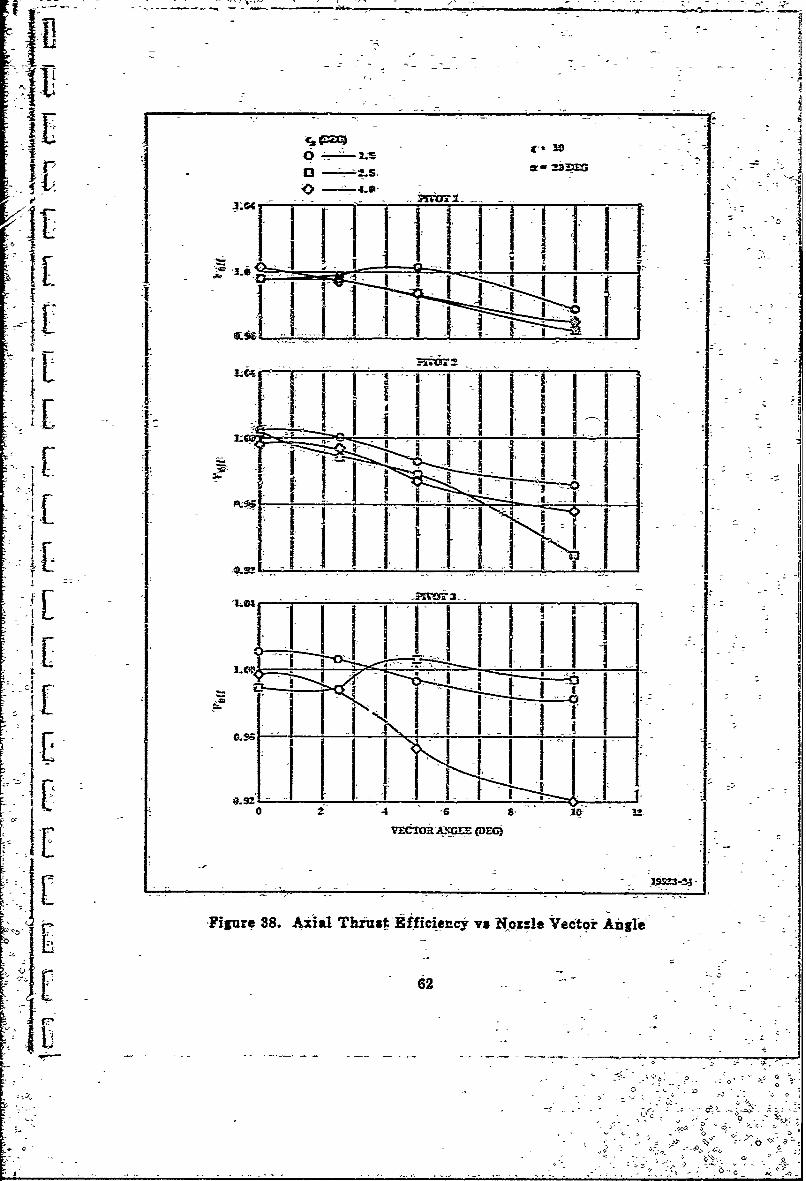
t8 kxa'Thrust Efficiency vs Nozzle Vector Angle._.. ..... 62
39 -A Thrudst Efficiency vs Noz, Ee Vector Angle,.............63: dI . ~i~4a Thrust jEfficiency vs Nozzle Vector Angle..........64
41 Axial Thrast Efficiency vs Nozzle Vector Angle.........65 -
42 Comparison ol Test Data with Tireory, do'i'pression Sideof Nozzle.................................... 3
43 Comparison of Test.Data with Theory, Expansion -Side;: Uof Nozzle..................................... 68
Al 4 Flow Visualization Showing Separation Upstreamf oftheJoint-(Test 19) ................. .. .. .. .. .... . 69-
45 Flow Visualization Showing Separatibn Upstream ofthe Joinit(Test 20)............................. *** r 0
Ii46 Flow Visualization Showing Separation Upstre.Am ofthe Joint(Test 21)................ ........ .. . .. 71.'3v
7 707

LIST___ OYAB4p HlI Cod -~iowTds hl~rik......2H -albatbnDaa Te PondTzcr~p~npH1
~~1J Iii -Cafbrationflata -Ten Pound lncrements). 2.2*..... ~1
Lvi
-~~ iNTRODUCTIONSU AR
The flexible e.-dt.cone nozzle, is a new cbndept-being developed by -Thiokol,
- Chemical Corporation to provide improvred rocket motdr-systemn erformance. an4-
reliability. This concept- consists of replacing a section of the- exiteone With aflex-
ible joint which -will permit *ectoring -of 'the superso6nic section -of the exit cone.This document is -a eprt of the cold flow teiting andanysseromdt
Thiokol to establish nozzle des!&i and performanbe criteriaL.
'the Flex-X- conep t provides; thrustvetr control- (TVC) by tduig the, exhamsi
-gases in the supiersonic portion of-the nozzle, resulting in comiplek flow patterns which
are dix2icult !-,)evaluate aniiiyffcally. these flow conditioia -are similar to those- of,
~ Ithe supersonic splitline.nozzle. Therefore the data acquired in this program is appli-cable to both the supersonic splitline and the flexible exit cone designs,
This rep~rt supersedes results _presented in the Phase I report. -f Analysis
krevealed some faulty data and It wLas therefore -necessary to z-.,peat some runs to
obtain consistent- reliable results.
ID *AFRPL-TR-68-.66 Flexble Exit Cone Nozzle Developmpent Prograh .Phase I Report
dae Arl 98

B. SUIDURIY
This xeport documents the cold flow testing cciducted;on the flexible exit
cone nozzle. The cold flow program was conducted-to establish the-performance
Vcharacteristics- of th lx.nzl.Teinfludnce-
on-nozzle side force, actuation torque,, and ax*ial thrust:Were-investigate..-
I The -fleible exit cone nozzle thins the -gas in the suporBoiCportidn of-the,
I -nozzle. With proper desigil this concept can produce side forces -greater tban those
2*aized with conventi onal--vector nozzle systems.
~1gThe maximumn side force amplification achieved -in. this program- was approxi-
-mately 1. 65 on the 10:1 i6xpenbioni ratio -nozzle -and 1. 95 on the 25:1 e!pansion rati
f ~ nozzle. Torque amplifications were 3.6 and 2.9 tespetvblk. Aial thrust losses
C for these conifigurations3 were from one to two percent.. The iriiximuffi thrustloss
measurd -was approximately eight percent.
Betw~een five and ten degrees ~noizle vector, the -compresiioni sideshockiuAter-
I L sected the expansion. wall and mioved into the nozzle far enough -io.-cause a decrease in
side force amplification. Where high vector angles-are xeq~ired, the seal' could be
moved aft to prevent this shock intersection.
-4 4
-i-C

s4o ztt3 be,6 &-1FT1eext
in~Prod &-t~fas~pot~e gzaC4 OGwm ind

Ai -- I;PF.11~1 a- => 1
3. dmeOPE -l
Ch NDozzle tEzis id c ean ciaontrqewee16e=
5. Vrector Ai~ae
A caifnri~d bnozze als-b 3s tesf for cqmpn ism with -the doanieal'noz#Ie
TWo eroded caqflUpwams were teated to evaluate thi, efect of~flrlng time on
nozzle eromance. AS "7 -a- 60 second Biring- time -configiration were -tested-.
Thesecomfigaaiimns *ere pradicte usng measured erosiM ibi from fiefixecinozzle~materialiB evaluaiona tests.

thetest progr-am. was conducted- in.,accordance with the test--matix preisented
ih'ilI. A-total of 27 tests-were-conducdted.. Each- test consisted of-four runs at;
~~<il ~~Nozzle thrust, side force, -and-torqeer inaaured on al~~i~ Ed
cone pressures ,were_ measured at- everal-aial-locations-in th e 0-, 45i §0, i35, -and
ii80 deg radial planes.
11The cold-,flow program wa.,s coniducted-in Iduir-partis. Part'1-consisted o-.f nine
tests in, which the, effect-of joint locaton, pivot lodation, and-vector angle were
evaluated for a.20 deg half angle exit cone-having a, 10: expansion ratio. -Part 2 waUidenticil, to Part I except that a._25:1 expanion ratio. nozzle was-tested. -Part 3 2ofi-sis-te of seven tests in which the effect of exit; cone divedrge-nce--angle and expansio'n
- ratio r valuated. The conitburedLnozzle was tested in-fhis-~portion of the test. In,,-Part 4, -the effects of'e.xit-con-e erosion are investigated.
IIJ C.- NOMENCLATURE'
11] the basic Flex-X cold flow model'is show~n in Mfi~e 1. Pertinent nomen-
clatiire to be-referenced in this report are shiownf in this figure.
All axial locations are measured along the centeiline of-the uzmveetored nozzle-,
~-I1 Pressure data measured on the vectored nozzle are presented at the respective.
unvectored axial locations to ease data. presentation.
The joint location is presented- as the-axial coordinate of- the upstrea sieOf'
[1 the joint-in this report. Joint thickness- is heldzconstanit-throughout the test.,
13 All -force data are presented nondimenslonally for c-onvenience in scalig.
Ut 5-
8

11c3jI~~S )k ~
Cc 00
a. qg
00
o ~& 00
- a .V
0.
[d :4 124 C 2 4 co -IC~2, .44 - -- tC 4 11-ft
OR] 1222L c-tc v o )a D c C.- tc i o - r- ~ ~ ~ ~ ~ ~ V V.C. re Si cc cc 122211 1222201111 122 q4-.

'E-4
0 pq
ICIt Ea,
P4 Pq
1 '4
(.44
or.
- --- - -- - - ;

[1 the folloving Bymbola and defirdlts-are-used in this report.
~fl ~yinb61Defintion -
op0- or-P~ tail Ptsure
P, and-Pi Sttlc PressureJoit Ekpansion-Ratio -n -
13 ExitExpanision Ratio- -
13 V-- Specfic,,eat~atiio
Cf Tb rust-,Coefficient -
[1 8 Vector Angt6e-(deg),
a,.pBack Presgare
ep Exit Static Pres~qre
At throatArea
liiF 5 Side Force -
Tamip Torquie Arnplificati6fi
AF Fofce Ampolification
Ii X - igence Angle Corredtion
L Factor
Th iillo-etPoga-w-codltda th -iqlWal viio
ii~~efeeredosffliFigure-2 shows the basic-laboratoy layout. The-air supply i's gdn-e~ateA.'bj
a 3,000 psig cofunpressor having a 20-cfimflow rate. The compressor eibants
directly -into- twb -3, 000. psi air receiVers having a cobifned volumne of-SO -cubic feet
These tanks serve as surge tanks for the compesr the zainlstrage~olune, isprovided by four 'StageI Minuteman t~gitteship Moptor-cases. the volume ~of each
tankis500 cubiefeet. hus tind total system capa~city is,2,,00Ocu ft pfaii~ at
ii[400 psig (4,076 Ib) and.50 en ft at 3i,000 psig:(764Thb).
The air is piped from the lare iair receiver to a 10 in. JliW control und
shi#toff valve located immedat&ly upstre= of the -test cell.
f [ The test- cell consists of a three component thruststand, an-orifice m -etering
tube, a plentum chamber with flexibk -ueal coiueeion to the aire supply, a vacuum.
-IIchamber enclosing the plenumi chamber, anexhaust diffuserj,and Ain- e-eto systemi.
F igure 3 shows the-generalzarrangement of the test cell and Figidre-4 shows the-
ejector systein.
,ig The orifice meter accurately measures-the-weight-flow delivered to the thrust'
stand-by mneasuring the pressure loss across thezorifice plate.-
The air supply from the -metering tubddtis split throug a tee Aftto ayoe n
[jthen to-Ahe plenum chamber (Figure 5). Thbis conifigation eiiniies-the inlet air
momentum fromi the plane of tte, force measurement and baiarpce--the pressure aria
-force of the air inlets.
13 9.
C- ,

(2
3~. I I
2
-. -~
-Ii __
II - UIjI h0- -<~
I: 0
CI iiii
'H Itii Lf!IL'U2II: - I.Ai9I~I
I: Ic4~~~~,l!J~A~
~
I -. -,
A
3 ------
45ki1I~~7~if:1 F
0
-0
It -
-~ -~ NN.

iir
ir -m
1 7:0

- 6- ~---~--- - - - ~ - ~ A - -' -~
-~ - --
4 1- a--I-D
I - -'
S
V 2
I- -- - -5
C - -
*
-C
I- 21
- -. ~
0~'
3 - - -.I c--~
I - -1
- I2.
SECTION A-A
A
a. -. "A0... CLJ - - -
-~ __ --
4 I 3
S
:--~ -
S~------

D
,S C IN C-
SECTION C-C3
L.A
1-1-m m - M K
-~~ -I U6N ~ NC
2
FIgure-3. Afran~rement-af test-'rink,

lob=
in *4Ma 0
"Cw
--. - *AI
Xam Is7I IL Itc.W- - VWU.-
-.ru -. .- -i-
ta0

-- %a
E--2JQ=WMI= =IIc
___1;_W_3 -K4
-
Fiur4 -Eeco Sytm-fihpt tn^Cl'l
12.

Iw- -I
V 82-
[ Figure 5. Thrust Stand and Piping
U 13

El 2he plenum cliamber-suports the test-,mhdel and .§iippzes,,higipressur 1 e-, V7.eloclty -air to-the te-t nozzle (Figure 6) . Te- surrounding vacuum chambe allowsLthe test niozzle to ex.haust,,ntoi 1 low ptessire quiescent a~nmzsphere for-altituxi tsimulAtio6n. 07
'The exhaust diffuser, serves to~reduce thiepressure in the vacuum chamnber
to thedesired level to assuid, a- f 'IQ fo in ozzle. The high expansioa~ratio nozz
* [1require a lower back pressure such that theejector! system is-necessary to adbieve
the desired- cofiditiofis,
U The, vacuum chamiber suppots-the instrumentaLtioni flanges aiid-the air supl
Piping. The multicomponent force balance sujfports the 'penum chamhber and measures-
- LI-the three components d- forc& iii the'verticatl,- ane
The flexible, duc ts, replce the flexible. seals-dsci& di 7Rf6rne1 h
flexible ducts are constructed of alter~nate layer~s of rubber, amid ste *(iueI).
U-The force exerted-on the plenium byrthe,fle~dble dudts is very simall and rejea'ie.
p The nmagnitude of'force is proportional-to the thrust load and is-appro~ipatly
U ~ ~ O; 1.percent of-the axial thrust., balibration of the-force balande-rernoves the-error-
induced'by the ducts since -the -_6rbtr is linear and repeaitAble..-
114
IkI
& ~1I-1
II -
-a *1-1
-a
- I
d
x
Co -
- A
15 1
I
_ _ _ __ _ _ ___I

17 S
F t -i* :1
IiI
- r12 I$4
0
_ o0$4
I
~uI;~j'15
- I

AerL
aa Io~e 1
£6p eguefc
r "k-0

.0.'7
A A
i, -e.5A0'Z
L= v4~ cr M.jML cm PAM~ '
I~~~/4 -IAJeX- X/A
2 iI . - -14l JX1-
I - ~ ~ -a '~.- - -110Imc
-To -"PLICATION p
Figir 7 FlsiWejoit-Mw tn

'SECT-ION V
TEST PROCEDURE
A. CALIBRATIION
The force balance-was calibrated electrealy prior to each of-the'first nine,
tests. The deviation- in these calibrations was 6o slight that'the procedure was ddemed
-unnecessary. It was therefore abandoned for the remainder of- the programi.
The force balance was calibrated using.a-dead-weight. A cable on a pulley w ars
attached to the upstream end of the plenum chamber. The system-first was exercised
by loadiig the:.cable in 50 lb increments up to 500 pounds. The readout zdnwa's
zeroed and the plenum chamber waspressurized to -the expected test pressure. The
cable then was loaded in 10lb increments over the -expected raige of test thrust.
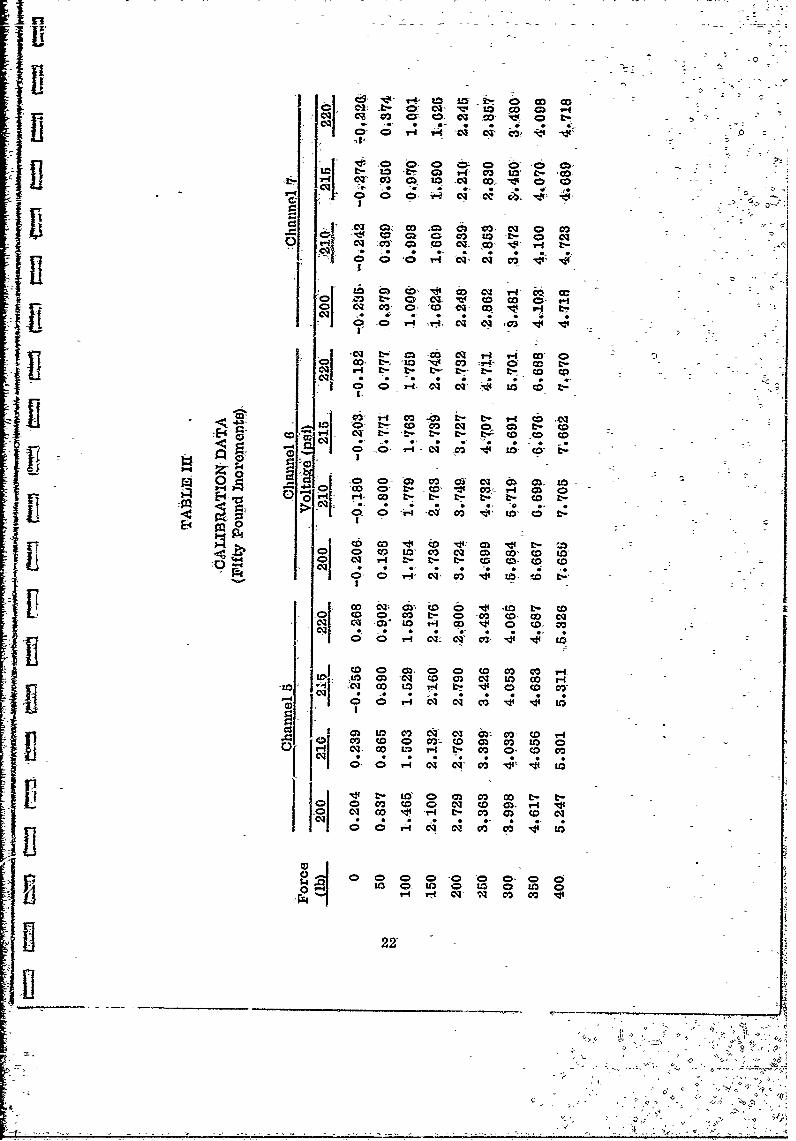
This procedure was repeated to establish the system repeatability. Calibration datawere acquired in this manner for pressures of 10 and 20;psi above and below the:
expectedtest pressure. These data then were-curve fit for Use in reduction of test
data. The calibration data are presented in Table Ii. These data are shown plotted
in Figures 8 thru 10.
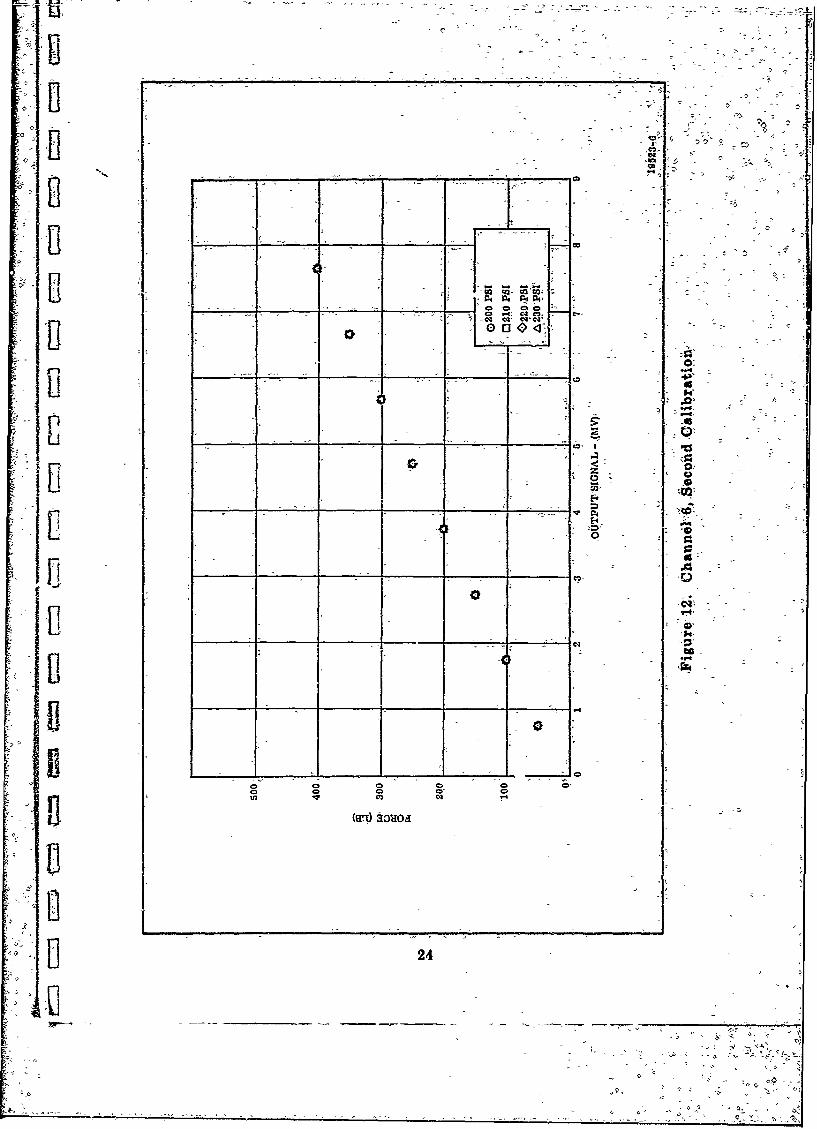
After completion of test 9, it became necessary to modify the power supply
system in the Thiokol Aerodynamic Laboratory. It then was determined that the
modifications produced a change in the calibration -requiring recalibration of the force-
balance. This was accomplished in a manner similar to that discussed previously.
The loading, however, was applied in 50 lb rather than 10 1b increments. The cali-
1]bration data for all runs 10 thru 27 are presented in Table I and are shown plotted
in Figures 11 thru 13.
711711 17
60i
x N

T-
dCALIBRATIO N DATA-(Ten PoundlIncreitents) - -
, Chtamei 5 Chrnnel 6 Channil7Force . ..... .
(lb) 200 210 220 200 210 220,, 200 -210 720- -
- - U 210 3493-220 2.901 2.945 2.980 4.166 4.149 4.146
-230 3.041 3.083 3.109 4357 4.334 4.336 2.668 2.631240 3.181 3.204 3.227 4.541 4.527 4.531 2.182 2752250 3.317 3338 3.347 4.747 4.740 4.727 2.895 2.886 2.876
260 3.442 3.465- 3482 44930 4.949 4.921 3.027 3.015 3.002-270 3.572 Z- 580 3.598 5.141 5.135 5.12 3.143 3.147 3.132I [ 280 3.695 3.708- 3728 5.330 5.336 5.321 3.263 3;258. 3.251290 3.821 3.837 3.847 5.521 5.526 5.521 3.393 3.388- 3:*382
300- 2.951 3.973 3.991 5.721 5.725 5.717 3.5i 3.509 3508310 4.082 4.i03 4.118 5.911 5.915. 5.910" 3.632 3.623 3.622320 4.202 4.225 4.247 6.115 :6.110 6.110 3.152 3.742 "3746330 4.332 4.349 4362 6.321 6.303 6.298 3878 3.868 3.872o340 4.459 4.477 4491 6.517 6.513 6.494 4.017 3.998 4.0 2350 4i581 4.595 4.622 6;707 6.701 6.697 4.143 4.134 4.127360 4.711 4.693 4°7.45 6.907 6.925 6.890 4.258 4.291 4.247370 4.831 4.827 4.871 7.117 7.121 7.090 4.-387 4.395 4.362
380 4.951 4.963 5.)10 7.300 7.306 7.300 4.508 4.512 4.493B 390 5.087 5.099 5.132 7.500 7.505 7.487 4632 4.632 4,618400 5.216 5.237 5.251 7.691 7.696 7.697 4;752 4.752 4438
410 5.337 5.355 5.381 -4.872 4.877 4.868420 5.465 5.484 5.627 5.002 5.008 5.002430 5-.133 5.I12E 440 5.258 5.242
18
- o
'C#
ICI
litq
1]t
40y
"19
ILI -___I--I__
w U'
C2.C
26s-

A Ai111 cmq.
-4
104
IIIm
00 0-4Oq
210
C~~~JP C) 0) 0 g f'0~co_ v4p4 C) C t-'~
101 D -- 0
totiol_ rl 0 M, 000o
- r "6 CO Q, U g OV 0 CD'
00-9 C CQ 4 Z O~
* .t 00 m 4z* t 3
CQ vw o= 'c t o To- t-
CD 004 - 0 C02 O'ID t-17 0 ~ ~G~ to 0' 410 3
c L..; cm t o C-1 T- r4 o- C) 'j0 .o L. *3 CSco.
C.~ 0) o (0
S.11! LIDI to co c
E-4- ~ ~ GD L L - - o to C ; . _. l -0 - -a 0>o I co Q0 to 0
E E4 0
W~~~~, CO iD V m qvL

CC tolo
c4i MC4 N~
0co
040
clio
to _ _ _O Q1t
230
A P I
ii 'C1 *"-3. iji
-' 2 C4 , C4 CQ. t
- CD'
,- ) - -. z8
400
V)j 5.13 03S
v 244

250
< _I
0r 12 1 1 5S
I.-
215 1151
-F-
-OTP]UTSIGNAJJ (M,
Figure 3, Chafl nll t; Second C alibration 1 52 -
25
U ______________________
______

IP 1The dzia crespwt the eezweig~t force abmg 3;4th the r~cp'oedC
fd~zax7.21CPY only.Tese tw O foes az-t 9 a-cocole reaetiEg against -them inieni
fiI :prod--ced b he deed weig it Tbe force recore on Channels 5 2Ad.7 1s 0, 62614, offhe dfead welght 'The scaled i-alces are shown onihe fgnres-
The aq=kL f the data is -as -olltows.
Full cae -
____________tperceeit)-
A~di~r: -0.32
Side Force .
TOz1que -65
B.TES? MODEIS
um hiellex~z e~dtcone. CoGce:It such as joint !ocatimn2d~toa!n i
addition, variables-sach as cone aidge and nozzle expanson-ratio. wich- uniquely
infuecethe performance of flexbl -ext eone nozzle,_ were coisiderW-d. The inlet
2i~ thoatdesign are not critical t6-perforniance of a supersonic flext itzle' there-joe [ complon geometry was used for a1l nozzles.
The range of -cone angle aed-expansion ratio to-be-considered-was-sel&cte to-
bliat-Iet the values- most -commonly requiredifor fltst-stage and upper--stuge-moqtors.
the location- of the joint was selected to avoid intersection of a-shdck-m wve with-thei-~~opposite wall for al models. However, 'a more detailed analysis conducteafter
completion. of, model design indicates that this plienomeno-h can beexp eibed to occur
on the higher expansion ratio nozzlf-s. The pivot point '~as allowed to vaiy from-the
point source t& the farthest aft point structurally fj~asible on the, flexible-joint
design. To reduce the test matrix, the joint leiit was not-considered as. a test variable
[ The test model designs are shown in Fiues1thru -18.1 ~ 25

, 0.
1r-~_"r c-
II Id
A A'
CR2 IVf(CY/o'I

I -
'Re Z
Fiur 14 FlxXCid-iWMddIea97,
0%

l--Z
Rs~~ijj
olA
- -- --- --- --
AN ~~Ae- A,-A~l --
jrC
l f l r-4.&
rZ
*.- -w'
- -- *E
Fiue1. lxrCCo i*-Kqe;sm
~ J~7 _ _
28
160

-4-4
_79 Imn 14
Figulz.Fle-X oldFlowModl Dtais a-Exi Exanscd-_g4
Fr29
-, -' c Ta
in9
OF0
as:.=-
.. Mug'
tmmsc~ft
-. tc= I &A --,%
ni 0l
Pid 17
FJ7o,
oi o'

INI
-e-
16-~
~- -
AW I V~L LVV-, I
'W EE -. ' /X.
Fiue1*_Pe.±Cl Mwboe, eal,1rLgeI2bzl AgeExt9ka~o 0c 1,16.d2
~ I.L.0

-k
v4L3 .00.C V of J
*.~4iJLPfltoII 1W
ill L1.
ObOOCII V-IF
I RQD VIEW C-C-
- Figurwe
71;X
Fm-C
irA
Fure 18 i i.Cl Fo oe Att,2 ere ozeAgeRd Exanin-c19 1 nd2

two eroded nozzle configurations- also were tested to-examnine, he effect of
erosion on nozzle peiformance. The test modelinhatg a 10:1 exp ion ratio
a 2.5:1 joint and pivot point was machined to simulate-the 30 and 6Q see eroded con- -
figuiations. Sketches-of the oroded iozzles are showhoi f ti6e 19.
. NSThUMENTATION
the.instrumentation consisted' of the faoi-. -
I. Force balance.
2. Two force links-for measuring nozzle torque.
3 Manometer boards. - -
4. Pressure transducers.
5. Precision-gages usedfor pressure -+ -
measurement.
The three parallelogram flexures of the force balance wereoQriented so that
the flexures on each end read vertical loads in either tension or compression whil6
the center flexure measured the axial force. The plenum chamber Was- supported-on
the upper balance platform, which was connected to the flex-cell blocks by three thin
straps, each as wide as the block (Figure 20). Forces generated by the test-model
were carried through these straps to the flex-cell units-. The+thin straps further
acted to reduce interaction between the three flex-cells to a minimum.
Two 2,000 lb Baldwin force links were initially used to measure torque.
After tests 1, 4, and 7, it was determined that the range of these force links was
too great, thus the accuracy was-poor. They were, therefore,. replaced with two
300 lb Transducer, Inc force links. The accurai;y of these links, as measured -in
the Thiokol Metrology Laboratbry, was within u.46 and-0. 6 percent of full scale.
A Tabor 5)0 psi pressure transducer was used to measure plenum chamber
pressure. The accuracy of this transducer was within- 0. 17 percent of full scale.
32
- -- - - - - -- -- - - :1 -. .+ +. ++ + ,

________________ _ 7]III ~ -f**- I~i -
~i, *# -C,
11.1~ - 11
'~~: -~--'~
-~ ,II3..Ilii
It in; i!,tgl!111 __
liti~lHIillaJ gqIII .... I..,...I -
02LI0U
7
* 0Iii .- ~
U -0
C)
0
ci'0 .0-
12 -
. -~
712 j ii.12 - I .1U113 I.
1213
33I] _
- - ________________ ---------.----- - .4
0~. ~ lip ]* ,.-%-~____________________I
-- -c~- ~' ~C' -V

* 1
't T. 4,. r 0
VI 4 4-L c~
F - P
vz1.,.

......... _7, .. . . .. . ,-3i~ + +
/ -..7,L- -
ItI
441 T-34-
_
II
t2,m~ma ++ . .. .i - --Figure O 20 he omoetBl6i SstmGaeI o ,.i t " -... 0
--.
-,-,.a.-...cj+a.cnt -_. o .. + ,i.
I + I____ - Li+j -+' -**I
j 4 4.. -- / ** +,,, <*>*,
• ,*- - .-. >/?( W "

Daalomth fr-ebalance). force lins,. and pressure-transduder wvere
tIoi& don an-Electro-Instruments digtal data systepm. The errorilnduced by-tis_
system -is less than 0. 05 percent. -Most- of the pressure rneas' remxits.in- theDozbzla
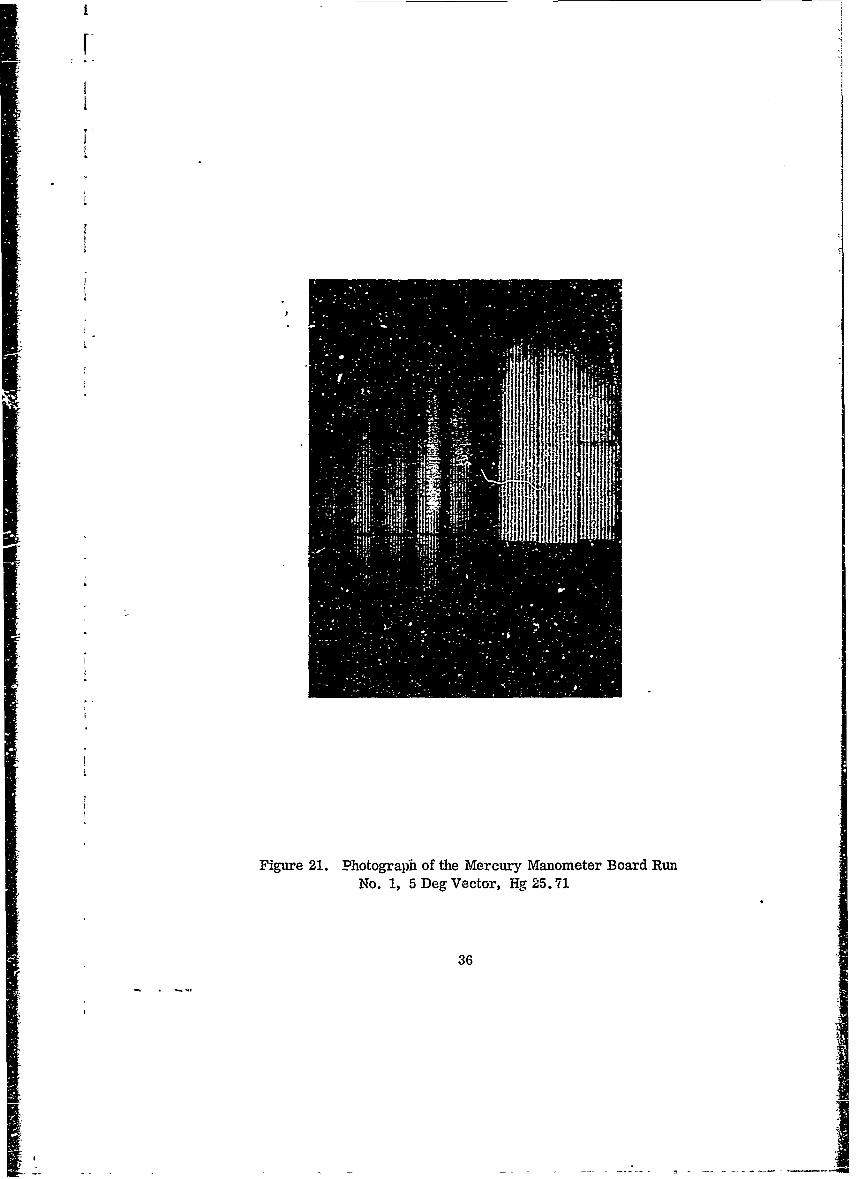
exit cone were riead on mercury manomter boatrds., The-boards weretkotogaki M-'
(igure 1 during the test-azd-readings waee 4hen. taken iiom-the photograh rs-
LI ~ ~ures cdan be reMAn this~nanfier to 0; 04 in. ofimercury or005pi Iaddlt 67ito te mrcuy mnomterboard, preision Bourdon tube pressure gaes~re -usedf
U ~~to measure highpressures recorded fiar the, seal onthe vectored-nzls hs
gaeswerecalibrbted at-706F. The accurac was Aeemn~o be 0._15~pin Qf
C1 L ~ ,full scale, which-wis 500psi.
[j D.. TESTINGV
'inConisideiable effort was expended to establish a test proctddr&4hichwould'yield the best possibe accuracy from-the available test-equipment. The poeure
[then was utilized throughout the-test program; the foll~wifigparagrap~h describesI -this procL_2uke.
The-force-baldnce first-was exdeised by--flowing air through theznozzle at a
[total p ressuire greater than the test -pressure, The air flowthen was shut--6ffanidthe
data. acquisition syrtem wab zeroed. This procedure- was done twice at the start of
I ieach test day. The test was then conducted by gradually increasing the, air flow v-to
P he required total pressure through the nozzle. Flow conditions -were-then lweto reach steady state before tqst reaits were recorded. -A mini MiimT-Offive, digia
[3 eadings-were recorded while ma.Intaining a constafit-tottal presure. 'A.ph~to6graphof the -manometer boards was eaken simultaneous with thir ~6 rdigofhdgta
output. A zero reading was recorded after the test.F-. "ID5
in;
L
Figure 21. Photograpfn of the Mercury Manometer Board RunNo. 1, 5 Deg Vector, Hgr 25. '71
36

T-EST 1AtSULTs
U ~A'. DATAIRflSENTA'flON
11All;test data-are- pesented in tbulaqtedfof- iii Appe6iki I., The fis page
fJ of -dativfor each-run contains thefd~foig iniformaton:1. Run-number,
~112. Nozzle vector angle,.
3. Area ratio of the-nozzle at-the iipstream edge
of-the joint,
4. Pivot point number,
5. Expansion ratio of-the -nozzle,
6. Ambient pressure,
7. 'test date,8. Digital~dutput channels,
9. Pressure- data.
- II The pivot point number designation is-as-follows: (1)- downstream pivot,
-; point, (2) middle pivot point-(4alf-Way between (1) and (3),. and (3))'is the pivot
point located at the,point source.
The digital data includes a zero readingbefore the test, five readings
recorded while testing, and a post-test zero reading. The five 'force
readings were averaged 40d then converted to proper units. This valul Is pre-
U sented for each channel in the load column. Channel 2 is- the -nozzle, Inet total
pressure in psig. Channels 3 and 4 are the force link-readlings3 in pounds.
37
- - - - -j
- --- I
Channels L5 and ?Tare -the- vertical'force mbeasuremnents d adChane .6 isthe ga..lij fo~Arcemasrmet These measuremenhts all liavae Anits-of poundfore
The fIrst cobnunndr pressure daaisthetan~ber as d-hi'n-j
Fgure 14. Tas 1,1,2,adlrcr eepot levels oA he maomter,
board. tap-30 wras the vacuumceliporessure. The sqpcopd-0 ,oumw"s the ~hdrci~ry,
7-heighit ininiches. The-third coluimn presented the -difference -between the apot leyel,and he masued mrcuy level-. The fourth column-was thia tappresented in p
units-and columni 5. shows the ratio of- static pressure to total pressuree.
LThe second -page of data ainceludes the thr-ust coef'ficienit, side force -side
-force- amphficatlon, torquie, -toriqueamplificati, axial OThru flcioyv AJ4d
thrust vector age
[ The equiations-usedto comtpute -the abaoVe prameters- ae-pr eited below.
ThZ'st.Coefficient.(CF
_F
pt~t
f Where
F Axial force-(Channiel 6),
P Total zessure, (psia)
At - Thr t ea(q n)
Side Force
F Channel-7 - Channel 5
Side Force Amplifcation _ _ _1] AF
AFcorr CFTP A Sin Delta
S8
J1 oz__ __ __ _ __ _ _ _

Mheret
IiCF Theoretical Thrust Coefficient
Where:L n ,aeterse2iemmn rso te loa
3 ~4 -
amp tt
,qqo (Q Cosflelta(
Thrr+st Vector4 A (LO
41 The i~orque-and'., aride repfctiomanth aial o'thutfenc lore
essetialytell atiou fmesued niozzl pefraaetxdelnzipromsc.
rpeet the i~aidaolin tetru n iefreapiiaincluin
Hoevrexmiatonofth dtareeaedtht orseerl un, hevaiaio
L~pp" nozzle/ wa in the vetoedpoitoa
Or9 4}1
Axia Thus Efficienc
Cos Det
eff CF/4
ILFb
-
I rThe back pressure variation produced a change ia thrust coefficient which
was not indicative of nozzle performance. It was therefore necessary to calculate-theoretical thrust coefficients for each- run-using the measured back pressure in
each calculation.
1 The axial-thrust efficiency also. was calculated using the theoretical thrust
coefficient. These values have been added to the second page of each data sheet.
The plotted pressure data are presented in Appendix H. The pressure" ratio-versus axial location for each test run is plotted. In additioz, these data
are plotted circumferentialy at each axial station for Runs 1 thrn 9. These
plots were used to study the pressure variation for developirint of an analytical
program.
[ B. DiSCUSSION 6F TEST DATA
fI
The force data provide a measure of the performance characteristics of
the nozzle. Three parameters have been devised for comparing the performance
of the Flex-X nozzle with that of an ideal nozzle. These parameters are side forceC amplification, torque amplification, and axial thrust efficiency. Each of these
parameters are the ratio of the measured to the ideal force value.
1. SIDE FORCE AND TORQUE
The side force and torque amplification are of primary concern in this
test program. These parameters are, therefore, considered first in this report.
The effects of various geometric changes in the nozzle configuration on these
parameters are discussed in the following paragraphs.
JL 40
It0
_ _ _ __ _ _ __ _ _ __.,t

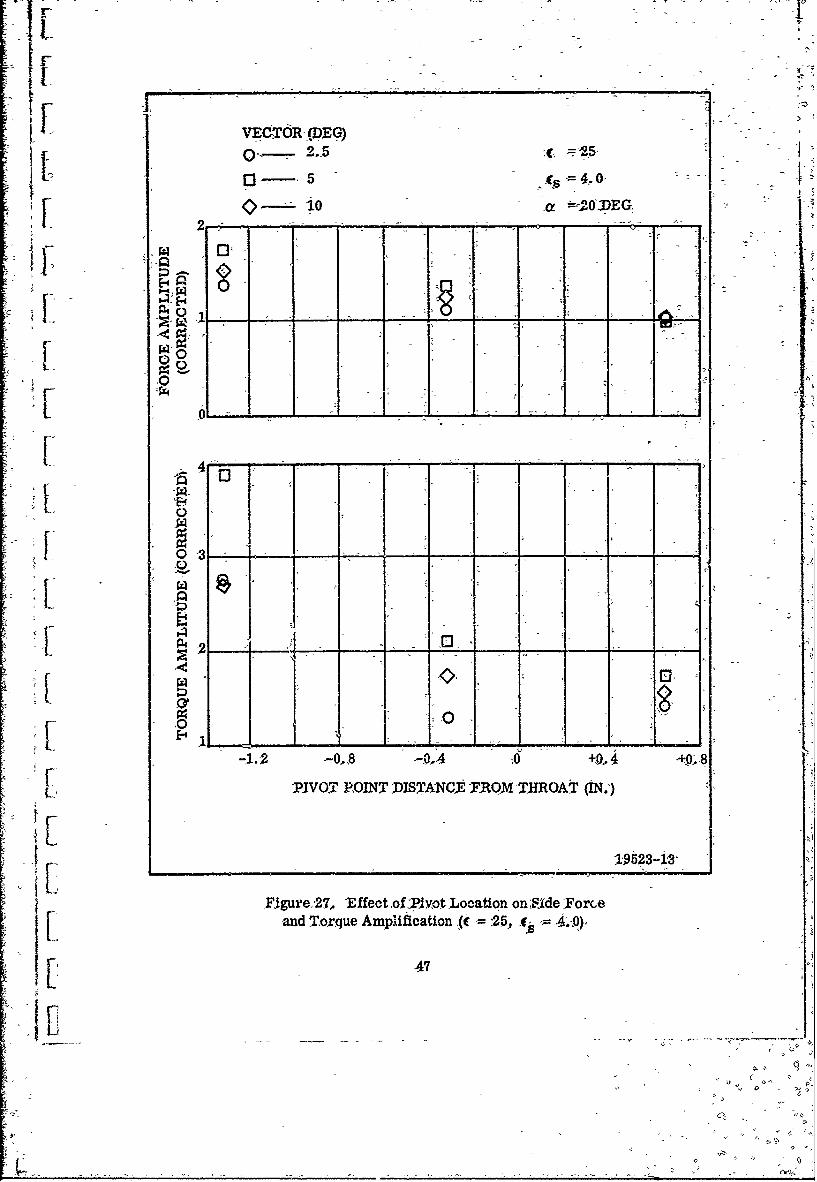
a. Effect of Pivot Location-The effect of varying the nozzle pivot location is
shown in Figures 22 thru 24 for the 10:1 expansion ratio nozzles and in Figures 25
thru 27 for the 25:1 expansion ratio nozzles. Data 2re shown for three vector
'V angles, 2.5, 5.0, And 10.0 degrees.
The force amplification is greatest for the upstream pivot (Pivot 3) and
decreases in an almost linear manner with pivot axial location. The upstream
F pivot produces nearly the same side force amplification-on all conigurations.
However, moving the pivot aft resulted in considerably larger reduction n-side
force on the configurations having the downstream joint location. In fact, a force
amplification of less than 1.0 resultedwith the downstream pivot and joint expansion
ratio of 4.0 on the 10:1 expansion ratio nozzle.
* . The upstream pivot produces the largest side force because the larger
radius of the joint results in increased travel of the movable portion of the nozzle
during vectoring. A stronger shock is-thus generated providing additional ft:rning
j [of the flow within the nozzle.
The combination of a downstream joint anda downstream pivot results in
1 a minimal change in the wall slope which produces onl; a slight pressure differential
in the plane of vector. This, coupled with the fact that only a small portion of the
nozzle is affected, results in a side force degradation rather than amplification.
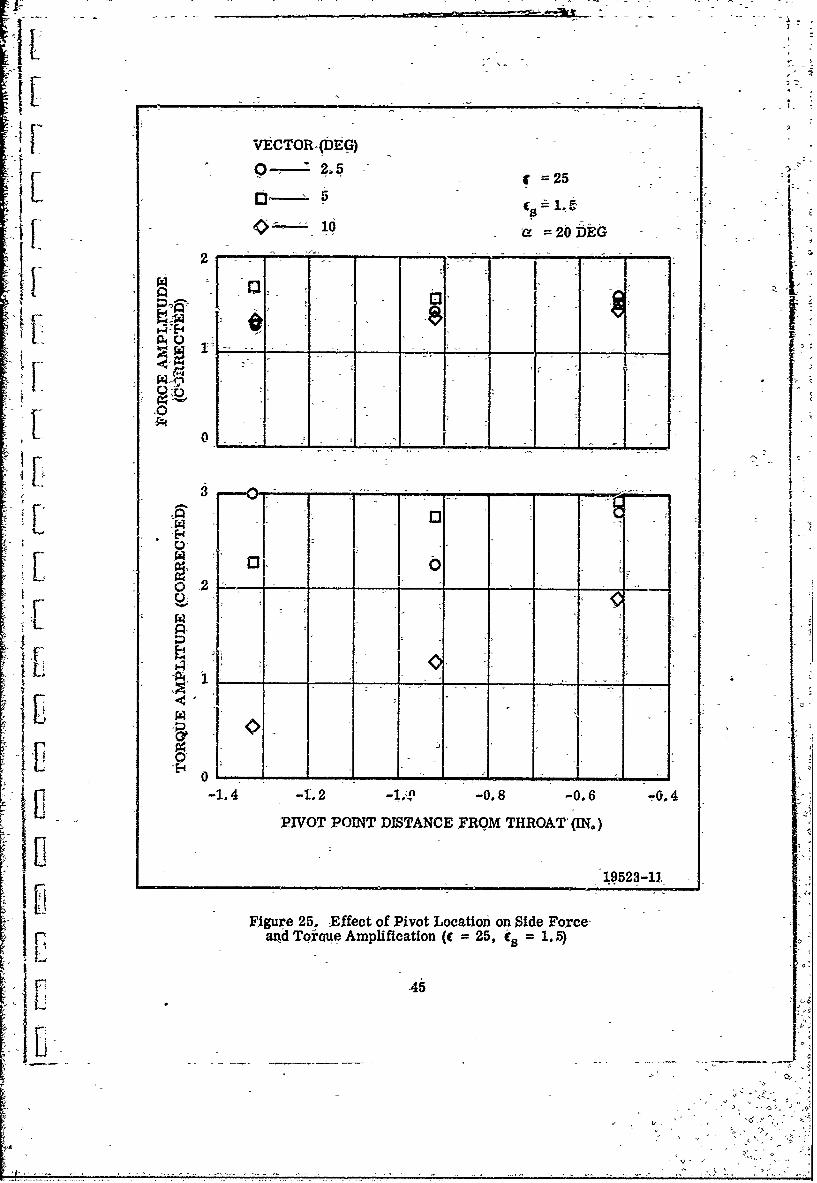
I The side force amplification varies with pivot point on the 25:1 expansion
ratio nozzle in a manner very similar to that experienced with the 10:1 expansion
1. ratio nozzle. The 25:1 expansion ratio nozzle produces a slightly higher side force
on most configurations. This is to be expected since the surface area affected by
vectoring Is appreciably larger on the high expansion ratio nozzle.
4 The torque amplification data exhibits considerably more scatter due to
vector angle Indicating that aerodynamic torque will not vary linearly with vector
angle. However, the general trend is for torque amplification to decrease as the
pivot is moved downstream. This is primarily due to the reduced moment arm.
[i 41
[1.. i
10-G 20 =1o-s-3
-1-1 1 -- -0-6 -.
442
S i- - -0 -
:r:4
0 <
L! [ -1.4 -1.2 -1.0 -0.8 -0.6 -0.4
. ' PIVOT POINT DISTANCE FROM THROAT (IN.)
' Figure 22. Effect of Pivot Location on Side Force~and Torque Amplification (~1 0, cs =1. 5)
[ 42
[ 0,
'p.
VECTOR (DEG) ,=104O0- 2..5 =2.50-5
: it3- 5
0-2 -~DEG
[ 0 2TII
~C
o 0cf 0
'__
-2.2 -0.8 -0.4 0 +.4
, PIVOT POINT DISTANC E PROM THROAT (IN.)
~Figure 23, Effect of Pivot Location on Side Force193-
and Torque Amplification (=10, €s 2.5)
C43
I-J1
~~.4
---- 2---
VECTOR (DEG) 0
0 - 2.5
0------------------ - - - -
0 3Q
PIVOT POINT DISTANCE FROM'THROAT (IN.)
19523-40
Figure 24. Effect of Pivot Location on Side Forceand Toraue Amplific ation (c =10, C~ =40)
44
' VECTOR (DG)U~~ 25 I4 - 10 a = 20 DEG
22
iffuV°[V- o -E
-1.4 -1,2 -!,UP 018 -0.6 -0, 4
PIVOT POINT DISTANCE F'ROM THROAT' (IN.)
U -I
Figur~e25 -Effect of Pivot Location on Side Force-d Torqe Amplification (c 25, t a 1. 5)
0 - - -

4 VECTOR (DEG) 1
I 'Z~~-Q az20-DEG2 ,.
- -
r0
-1.2 -0.4- 0 -0-4
PWO POW -~-AC FRMIHOT
aIL Toqu AmA~to c2,cs 2 )
-vTCT6R (D.EG)It -~~2_5 c -25 -
-5 c 4 4.O
01
17 5
C
'f ---------------------
1.2 -0,YI05 PIN _IT~ 0 3d-HOT(N-
[ 19523-3'
FYigure:,27, 'Effect~o ioLv Location on ,Rde Forceand Worque Amplification#(- 2.5, 5..O
-47

upstxeam -sealthan-with th.herjitc~tt~n.T~jpoal*cue
-by the -shock brom I.he -compression side of ,tie nozzle iinfluenicingiolwn-,h
-I1?vector nge, -and pfvotiocationavs-well;as psverall2esserw,.aribles, Bince the
kMach, o. is :lowex at the .upstream ieal, ,a large hbock ,al t
-.allows Ih6 shock Iodffecftthe ppisite hlff5of the -nozzle farther- upaream jh the
nozzle. 'The upstreamjoint .locpation-Aas results !nA-a rer poztion zf T e-nz:belng ififluenddby 'ectoring. JNoievor, the 'rsu-xtn~crs h hc i
redued dueto~te~Jw~e Maci Nd. At~the joint. AU ~of.thesei,,variables,,bonpic
F the-yariation §fl toxrgue suclr.thata-consistent ptter-n is ,uniikely,.
[ the pressure ddt,show-,eidence 4f the Asock jntortectingtht oppkte
-wallinthf- glaneoqfyecgtox on ,the ihigh-expansion-xtatio nozzle. 'Thesffects.9of
L this ~ , ~curig uite Appar~eit in-the-.toricuedata-. -Vectorinlg the n6zzle :10 deg
p rodufces a large -reduction in -torque due -Io Ihe influenceo -,the Ahock.-Some
gmeidefice of -this phenomenontsa4so apsizent-in-the side Iorc6 4ata.
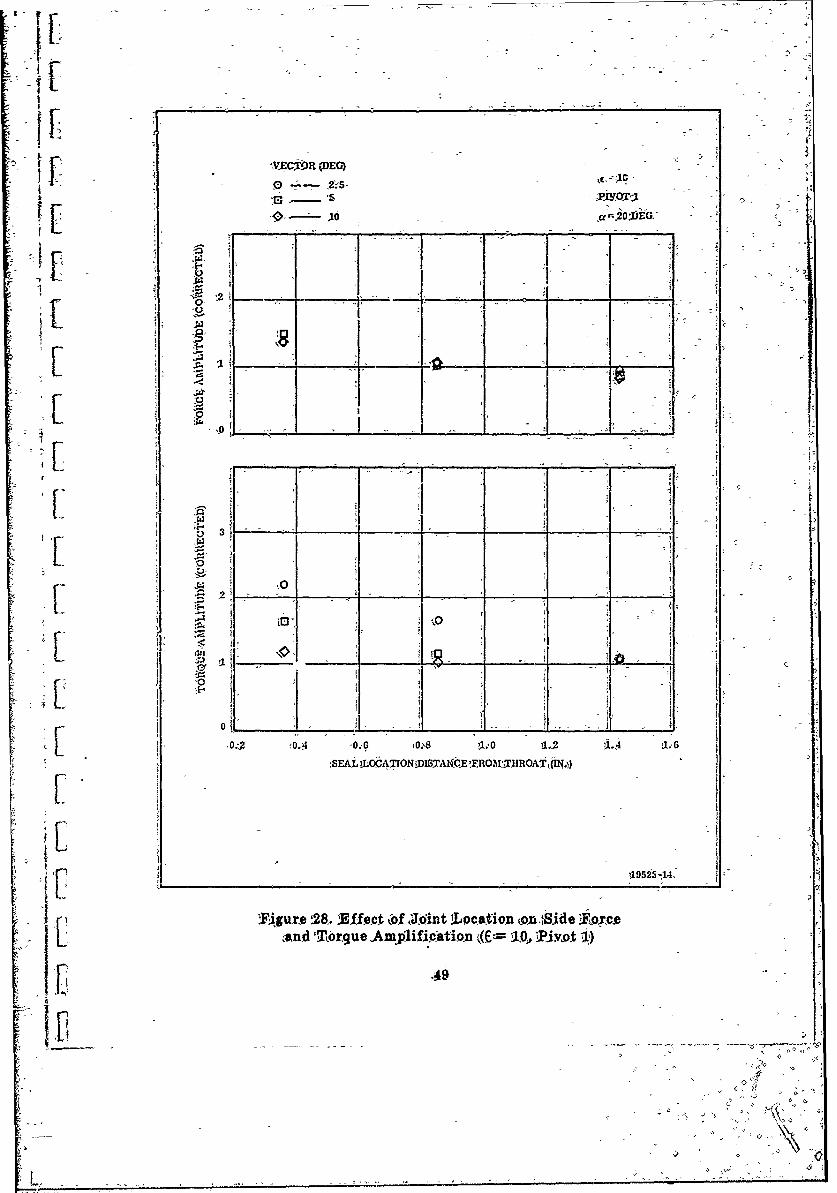
[ b, Effect ,of Joint- 1,ation--The ,effects ,of joint location on ide Ioirce- ampUi--
cation ;and -,torxque anm pifidtioii~are illustrated -for the.:l1,L 1eixpansI64 xatio :no=z6
:in)Flgures 28 thru 20'#,The same tdata arpe presente~foxthe :25,-Iexjahninatio
nozze :11 Fguregs 31 thru 2.V
-The side forcp =piification js generally xaeduced., as -Ihe joitbation is
=oved downstream. This is primarly due to the -xeduced ~srfade areacdownstreaii
~of the joint.
The inf luenc e o f j oint Ioc ation. on -force aanplification is inuch less ppOnced
vwith.the uptream piyot ~onftguration. is is thie xesulto a stronger shock
j generatedm~ith the ,upstreiam pivot increasing4;the pressure dfferential do,.vstream[ ~ [ ~ of the Joint which tends to xeduce the _effectp~f indvig t4e joint doNmstream,
VXEC"R (DEG)
oI F
0, 04 ..Gi[ 1 l- a -SEA I -O:ISTICIROI'T RA.tI.
11o 5I I
[~ur !2. -Efe ____ A_____xio to____jd Yor_ 2,anE IT__qu ___ iildtio ___E ___ O -I-)
VicimR (D)~ 1
10 .a..20DEG
VLIC
f -F-~T
i0. OI 14A ~ ~ ~ Ma 35SAt il_____ f_____ I i aT _______ ._____
-Fguipg9 Efi of i- L&ito onSd
and ___e~njf'ctd 1 C= 10__ ___ I___
19' 1

Ia-10illor
Illi K>- - -W1mmr()
'U V1

VECT R (DEG)(25
o 2.5 2
U---1 T ___ -20DfE(
3~
4
II _ _ _ _ _
0 ______e__
0-
'U 0.2 - .4081.0- l~ 1.4 ..9EAL CAT0iON DISTANCE jFROM THROAT (IN.)
-. .,199523-17 -
oFigure 31. E ffect- of-Joint location on Side Forceand Torque Amplification (C= 26 Piot1
252'vtl

VETP (DG C7
25U 0-2.5
0-5 PIVbT 2
IODEG i=ozbwo
0 L
3,Ic. 1 - - -b
0'0 f. 0.0.0 1. .2 .'XAL DCA-16N ______FRO TiI 0 -----
1623-1
'Fidr-,2, biec ofJontIodtin n SdiF~r00A o~eAmlfcfo
-a t1.- t P_ vbi I.

v-c<oCp r ) -2 5 ,
0 -2;5
0- 10 bf=2O0EG - .
;0'0'
0 2K _______I__
III 0
L154
4~~0 __ z__ _

4I
4 [ the- torque amplifcation tends--to decreaise as the joint Is moved downstream 4<on the aft ;piivot-cohfigturation. 'The opposite 'is true for the forward pivot configura-
t16m The lnteract-icanof the-effects .of pivot and .Joint location on torque should be
L similar to that of the force data; H owever, the maomjent arm variation-Introduces <an additional variable- which further complicates, the, influence -of these two p-araMe-
L 'ters on nozZle torque.
a. Effect of-NozleExpansion Riatio)-The-effect ofvarying the ~expansion ratio of.
the no1zzle was istigated on the, 15. deg and 25-deg cone conflguratons. 'The - -
plVo 2, -.oi6wsue x 'i?pivo 2, = 2Snozlewsuse 0 Epanin -ratibs of 10:1, 16:1, and:25:1 wereI ~-examIhed. Force ,and torque amplificati are shoWn as afunction-of-expansioni
Lratio in-FIgres 34 and'35.
'Increasing the nozzle exp.-nsion-ratio-wile 6holdlng alL other piikameters-
} contantnormlly ouldbe epeete toproduce'an increase in. side force6 due to
I [the inreas ed area down~tream- of the joint. On the nozzle having a 25 deg exi
cone, the 16:1 -expansion ratio does~pr6duce aft increase over the 10:1 expansion
ratio nozzle. However, -the side-4oice drops -appreciably onthe 25-,1 excpansion-
ratio nozzle. Pressure data- indicate that thigsftde to the, intersection-of the
shock wi.ve from the compregsioi-side -of. nozzle with-the opposite wall.
COA the 15 deg exit-cone,. 16:1 expansion riatio nozzle, the shock wa -
intersectionWith the 6pposite-wall Was apparent iii the pressire-data. This
ut:Iex lains the general decrease in side force *1th increasing expansion ratio on
the 15 deg eit cone-nozzle. The 2 1/2 deg-vectorangle data vary in the oposite,manner on this nozzle-because the -smaller shock-angle (due to reduced turning of
VI[ the gas) did not result in the shock -intersecting with the opposite wall. This also
is verified by the pressure data.
The influence of the shock intersection was-much mnore pronounced in the
torque data. At- the higher expansion ratios, the vector angle induced-a wide
-I) spread In torque amplfcation. This-was due to the larger vector angles increasingFl 7.7
- -- : ,e
"4. .VECTOR (-EG)
--,
Li -1 OPivr:0-- 0
lfl
-~ 0
0 __ ____ _ _ __ __I_3 ,0-
02It 10 _ _ ' ' _22 16 _ _0
Nigtte,34. E tfect of Noftle Expansion Ration on-Side Force" and, Torque Amplification (Xi= 15- De'
hi6
-1 1~si_
2.55
5'-
'10 PVOT2~
- 0-25051-2iL
Figuei35 - - oi- -
l

I the.Ahockangle:suh that-the shock tersection pointinoved Upstream. bwi aqt, V~ [I on the -15 deg oe 25:1 exasoztonzlthe 2r Adffcted*b thelnter-i
sbqting, sbockVwas large endoughl-to roduce a monrestoxIng, -hile to~rdue
f d. 'Effect of Cone AIW61--the effect wbich vayin the code angle #piom 154o 25
C -eg had on side-force and-torque is Mlustratec' Inhigukje 36. Btihlb~e sirde- fo6rce
[.ad oque increased apprediably -as- the cone ankle decreaso6d. In rasing the
I r coie angle while holding'the expansion ratio cosatrsle nashorter nozzlei
thereby -reducing-the length of the movable poirtion of the nozzle. The surfade
area affected by vectoring being deereased, reduces. the side force and-Iorqdue,
T 1he effect of cone angle was-examined on the 10:1 expinsion xatto mioniy. This trend w~ud d-not be, expeceot high epai-ndonzzles, dueto-
cr-ossover of 'the -shock wave.
-e. -Effect of Nozzle Eroioin-Two erodied nozdzleis w~re #,etW tc)eValuqate theJ
3JIeffect of burn~timi on nozzle performhance. For-ce--data -are -presenited-,for these
nozzles jirFigure-37. Tor que -and side force indrease withbt burn-m.
A58

P ~VEC-tOR(DG
O-~--2.5 ~~2O
2 'V- - -I - - -
1131->* .--------- ~.
-o>
0~
14 5 1, 17 18 9- 2 '2 22 23 :2CONE NGL-E(DXG
Figut3.ZfI tfNie ~eAil~nS&F
and ToaeAnD'tainV
V2....44'I...........- - -

4
Illo
010 20 Co40 'J0 - -7
460

:2, AX[ALYRCE DATA -
'The -aa1lurast eafficiency dsveetd o.ec ituoihdtsetTpresentedin,41ppendixl. ~ieLaarel-~otdnFgrgSd~u3
j 'TheaxWa thmut,,eificieny lIs he:3 -Atic;-d-,meaur~ed itlhxstto rthe ide;Al iit
of a ,vR7Origno;7da 1q hi casnwetr Ant~edie- ~ ~ tod~ossep lncftrxed mhean tunn a rBeo2i gsstem
~og~hepivxt upetream .r h .intdwsramttedsioci~i
* ~~effb.iencq. Moving -the pottupzti'eam incieaseg tihe ishock istreqgth, duae to ihe-1 ar-e
Jmgtthe f1ow Jn rZhe wiciity oDf the--3J tilnwxeaing heBse n hniz.
SThe ioses ,.,1so ,tre -increaised ~with- be dow treamjinttdue-to-,the ~trA~ner~k
[ ase3,iatfrJ,,fth thigherachN6.of h o."eq A
~higeran~on xationo zz 1es i A re =o-._ effi cien tthan ithe A 0,: ~xpanon
If x~~atio iiozzleipdicating :thaton o f temoss r eo~edwt tebgr~bze
:,he thi~ust efflicienic J 9 zts sornaiat:more itrre gar ton *i'e Aiit:Al 26h.- Ao Ok~e-
L paflsiofl atiomiiz~. '.~sipia tu-tteetirdb~,ir~si :f~Vu
1~~ iheiderilmozzle thrust rather ffiin-iriegulaxities---=Ihe:,xmeasuied 'ihxst. 7,ouilpre-7
L ~surf. taLps xecorded badck~pxessuk'e on the f25,-- e~ansion Trat.o nozzIq, -,whereas'a
_sig~e .tapwas ~iused ,i te i.1 -I-exJansion ratio ~nozzle. 6I 2, 4h~ich-meapftred
;bak :presbure ton both :nozzles -=S oundttQ be tetrratic during itesting ;an(uring
I: edy-nton cf tdata kdnthe '2E5AO fliit1Thtio mflO e.
'The .ffet ~f.erosion ton .azia1 lhxust efficiencqy is illustxated iin- iYigtitre Alj-. 0,he
Refficiency xof the 0Osecond iconigftrcation is inear th fl ame as fox stli tueoded icon-Aguration. JHoW6eze, the losse gerienctd ',ecame .significant',with the t osecon n-
iguration. 'T7he- modilefl ecdteaNh1y erodableflexiblejoint.
-ITILI1
El -
,c? 4-P- - __2
~~~1~7 7 iIi I1

9 - 4o
,O 7z
I 1 1Ile
17 I IzJ ~ I 4
Tigif 0.. ii T =i , tc'e y-v gozeV IAKi
-r4$iI
.JiT.LL±~ I ir A

io - -
~R .
I23-
E .1,
1.04- - - - -
1 30 SEC PIV6T 2
0 '4 6 8 v O 2
KVECTOR ANGLE- (DEG)
Figure 40. Axial Thrust Efficiency vas Nozzle'Vector Angle,
CI
12 ~6%

TIVOT2
oESEI1-0
1
0- 2 4810-
VEC tOR AN-GLE (DEG)-
u 1L9523-27
'Flgure 41. Axial ThYUttEffiieyvs 1Noz2ieN"Vectcr Augie -
T0

jU2 I
3. PRESSURE DATA AND FLOWNVIUALIATION DATA
All pressure data are preselted'in.Appendixil. ForkRuns 1in 9.ihe data:
1 are plotted axially and circumfereatially. Only -the axial plots are presented-for -the
liThe cdircumferentlal. plots -were used to suipport dvelopment of the anlqa
~ L flow model and to perform-a pressure-area Integrationto obtain laide -force-and torc-iefor ppoes of ipcking with the mneasured test data..
Integration of pressure data prFoduced torque and side force values signifiantly~ -less ftan the measured data. Investigation- showed this to, be due to -insufficient pres-
- i Lsure datad i heviicinity of the joint. Figuies 42-anid43 show a comparison of -tes~t
dat&-with presimres calcula-!ted using the-analytical flow model being deveodunr
this.-program. Fro m these plots it is appareOnt that biressuredata are-not adequate
to deifie the flow field in -the joint regin Thdrdore,. side force and- toqe-could
j not be accurately determined in. this bann er.,
I Frigure 42 shows -a point of separation occurrink-upstreaba of ~e fbrward,
edge-Wf ffejoint. Theory- indicates- that thls phenomena' occurs when the turn angie
at the wall is g3rbater than the angle which the flow can negotiate throug4 an attached
oblic:e shock This resultsin tbicks being-generated atthe point-of ,separaton anld
at th e- xeattachment point.
tilEvidence of separation occurring ahead- onl the Vectored seal -was obtained fromi
flow-visualization. Stipples of-iunpbladk ahd glycerin-*erebedi temdlt
K ~ x~nie te separation phenomena and-also to assure that sepiation didn not occur
near the nozzlep)xit.
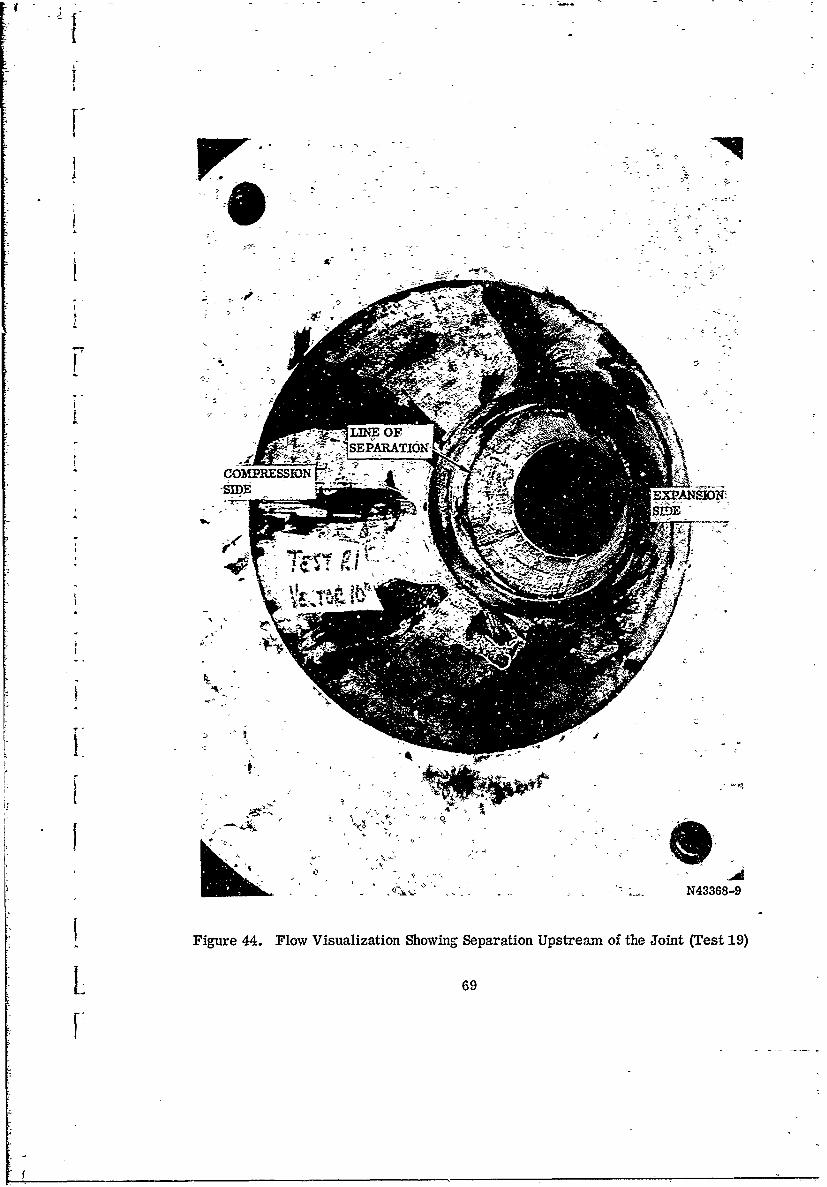
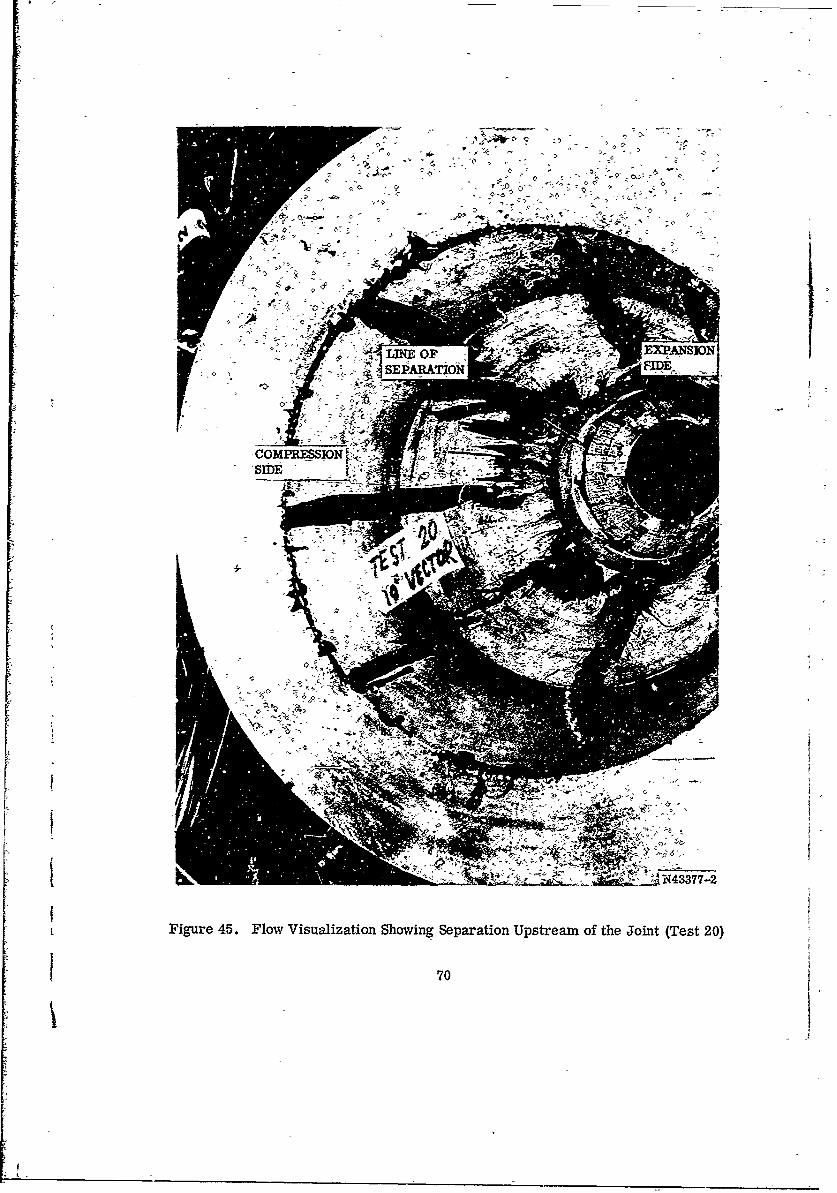
Figures,44 tU=n46 are photographs of floW visualiiation dataobtained-in'thisi
manner.. The line of r~eparation is clearly, evident in each of these photographs. 7
[ Separaton distances were measured ofi various runs to assist in eigtabishing 4,
separation critekia to be usled-in the analytical moddeL
6d
2' [A,

-THZOUE CAi-
"0' TEST RUN Ii, 10j DEG VIECTOR
0.28 -*-
0.24' _
-V ~ ~EXPANbSIOCRE(DOWSTRE-6EDE OF SEALt)U ~ ~~~~0.20: ,1- *I *--
~O.1
r SEPARATION POINTS
0.12 f
REATTAdiI POINT
0.8NOTE: ANAL- COORDINATES[ ARE -FOR, VECTORED
0.04
0~0
£3 -AYGAL DXSTANCEAFR63.tTHROAT (N.)
- - - -' - 195237;8
F~igure 42. ConaidokT0t at ith Theory,Compreuu'6in Side of Noxzle
zifl ~ ~67 ____

- -E
40.4Lo
1~ .-0
A0 1 ,A=AtOTE A~AL COOROM THROATA1EM)
1§52-29
li~~~~re-TORECTFE CaOZZLEo of TetDt it--q
Exaso id .1el
IM O
0 4
N436-Fiue4.Fo iulzto hwn eprto ptemo h on Ts 9
I6
070

J7N [Fse
SID
N143368-1
Figure 46. Flow Visualization Showing Separation Upstream of the Joint (Test 21) s
1 71
Flow separation near the nozzle exit also was discovered using smear data.
Pressure datt were used to verify this occurrence, in which event, a repeat run was
performed.
On the high expansion ratio nozzle, the 10 deg vector angle resulted in the shock
wave from the compression side of the nozzle intersecting with the wall on the expan-
sion side of the nozzle. This caused pressure on the expansion side of the nozzle
to be appreciably higher than that of the compression side which results in a re-
duction in torque and side force. This pheuomenon can be seen in the pressure plots
of Appendix II. The 10 deg vector configuration of Run 10 is a good example of this
occurrence.
72

SECTION VII
CONCLUSIONS
The performance parameters considered in this program were:
1. Side fcrce
2. Axial thrust
3. Actuation torque
The influences of nozzle expansion ratio, nozzle vector angle, joint location,
pivot location, exit cone half angle and nozzle erosion on each of the performance
oarameters were evaluated. Performance data are presented as a function of each
of these geometric parameters. These data show that with proper design, appreciable
amplification of side force can be achieved with a relatively small loss in axial thrust.
Nozzle internal pressures were recorded for each of the test runs. These
data are plotted versus axial station at five circumferential locations around the
nozzle. Flow visualization data were also taken to further investigate the flow field.
It was determined that a separated region exists ahead of the joint on the large
vector angle configurations. The pressure data are not adequate to properly define
flR' conditions in this region.
The pressure data as well as flow visualization data are used extensively in the
development of an analytical model. A comparison of analytical results with test
data is presented in this report.
Data from tests 1 thru 9 were utilized in establishing the design for the
demons tratio: n ...
Data from the Cold Flow Test Program will be used for refining ic TVC
Computer Program. These data will be supplemented with analytical results so that
a matrix defining the interagtion of various geometries can be developed. The effects
of hot gas will also be computed. A regression analysis then will be run so that
expressions for each of the performance parameters as a function of the variables
mentioned can be included in the TVC Computer Program.73

SECTION VIII
RECOMMENDATIONS
The data obtained in this study should be used to evaluate optimum designs
for various application. These data should then be verified In cold flow and hot firing
tests.
The effect of joint length was not considered in this program. The effects of
the parameter should be investigated analytically and verified in cold flow.
A cold flow program in which pressures in the separated area ahead of the
joint can be measured should be accomplished. The effects of separation on heat
transfer and erosion in this region also should be investigated.
The analytical model presently being developed aL-meg an ideal gas. Future
development should include consideration of real gas effects.
74