Embed Size (px)
Citation preview

ENST 698—Environmental Capstone
Spring 2011
UNC Cistern Water Quality
Final report ENST Capstone Class Spring 2011
Bleaking, Kelly
Bucher, Kyle
Fernando, Naomi
Ghodasara, Janki
McGee, Matthew
Pearce, Emily
Rhodes, Benjamin
Ruigrok, Andrew
Webb, Kathryn
Capstone advisors
Elizabeth Shay, PhD, Institute for the Environment (contact for questions: [email protected])
Jeff Muehlbauer, Graduate Research Consultant
Clients:
UNC-CH Energy Services Sally Hoyt, P.E., Stormwater Systems Engineer
UNC-CH Environment, Health & Safety
Sharon Myers, Environmental and Stormwater Compliance Officer
Conor Keeney, Environmental Specialist
This paper represents work done by a UNC-Chapel Hill undergraduate student team. It is not a
formal report of the Institute for the Environment, nor is it the work of UNC-Chapel Hill faculty.

2
Table of Contents
Project Purpose ................................................................................................................................3
Materials and Methods ......................................................................................................................4
Literature Review ..............................................................................................................................6
US Water Quality Legislation .........................................................................................................................6
The UNC Reclaimed Water System ................................................................................................................6
UNC Regulations ............................................................................................................................................7
Human and Environmental Health ................................................................................................................7
Human Health Implications............................................................................................................................8
Environmental Impacts ..................................................................................................................................9
Sampling ...................................................................................................................................................... 10
What to Test For ......................................................................................................................................... 10
Sampling Protocol ....................................................................................................................................... 10
Acceptable Levels of Water Quality Parameters ........................................................................................ 11
Sampling Equipment, Materials and Process ...............................................................................14
Results ...............................................................................................................................................14
Laboratory data ........................................................................................................................................... 16
Sonde Data .................................................................................................................................................. 18
Rainwater Harvester Model............................................................................................................20
Jordan Nutrient Accounting Tool ..................................................................................................23
Recommendations ............................................................................................................................25
References .........................................................................................................................................26
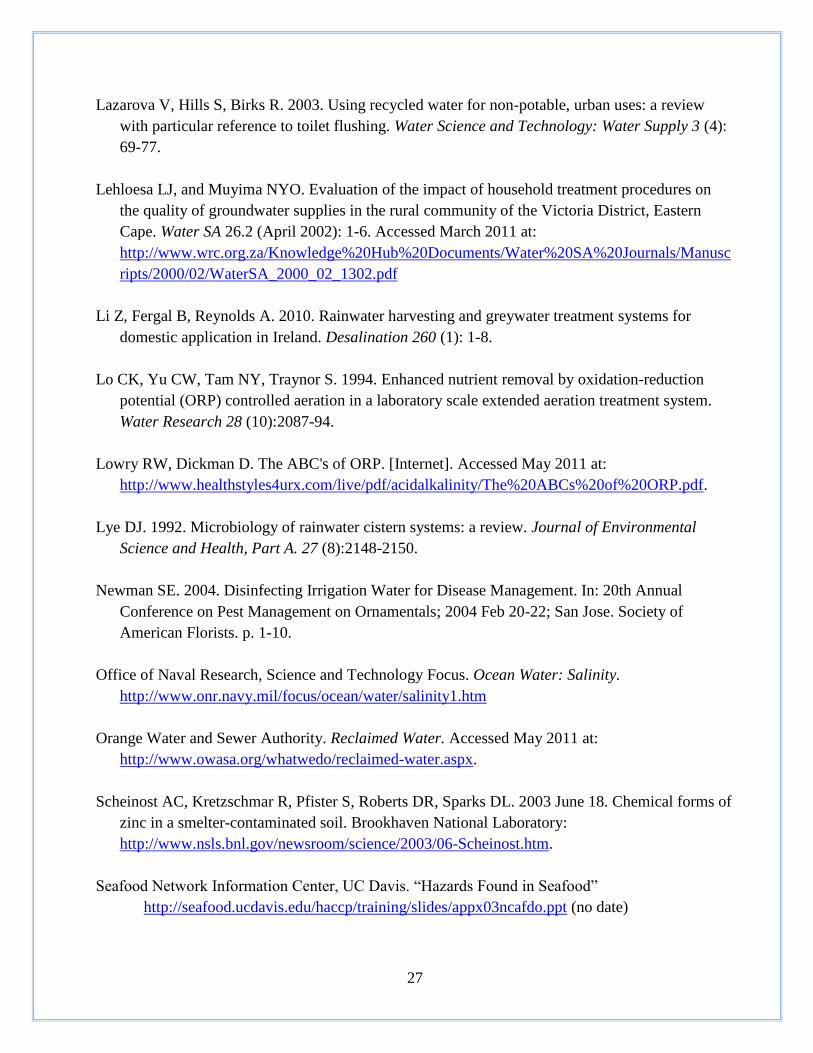
Appendix A: Work Plan ..................................................................................................................29
Appendix B: Structural Aspects of the Cisterns ...........................................................................30
Appendix C: Sampling Protocol .....................................................................................................32
Appendix D: Safety Protocol...........................................................................................................35

3
Purpose
In an effort to reduce the use of potable water, the University of North Carolina at Chapel Hill
(UNC-CH) harvests rainwater that is collected and stored in several underground cisterns. There is
limited existing information regarding guidelines, best management practices, water quality
standards and treatment methods for large-scale rainwater harvesting systems. The cistern water
quality capstone team (referred to as the “cistern capstone team”) took on the challenge of
identifying water quality parameters, testing these parameters through sampling, and analyzing
these results to make recommendations to the UNC Department of Environment, Health and
Safety. It is the hope of the cistern capstone team that the project findings and recommendations
contained in this report will assist UNC Environment, Health and Safety in identifying
contaminants and in future monitoring and management of all campus cisterns.

4
Materials and Methods
The semester-long project drew material from a variety of sources and generated several products.
Work Plan
This document served as a rough timeline outlining the cistern capstone team’s concrete goals. It
was supplemented by logistical information like sampling parameters, procedure and group
scheduling. This can be found in Appendix A.
Literature Review
The literature review is a comprehensive review of relevant literature meant to help the team
interpret sampling results and to generate recommendations based on the data in the results and
analysis. The literature on non-potable water quality measures was reviewed with regard to policy
regulating environmental and health implications, and acceptable water quality standards for
potable and non-potable water.
Structural Aspects of Cisterns
Structural features of each cistern, including an aerial photograph of each cistern location, can be
found in Appendix B.
Sampling Protocol
The sampling protocol the team developed for this project, and followed during sampling, is
designed to be used for any future sampling events at UNC. This document, found in Appendix C,
outlines a sampling procedure specific to the UNC cisterns at the FedEx Global Education Center
(“FedEx”), Boshamer Stadium, Rams Head, and Hooker Fields.
Safety Protocol
Like the sampling protocol, is the safety protocol developed for this project was designed to be
used for any future sampling events at UNC. This document, found in Appendix D, outlines
specific measures to promote safety during sampling at specific sites.
Results and Analysis
This section reports laboratory and sonde results graphically, detailing dates, locations and weather
conditions at each sampling event. It also includes an analysis of results based on acceptable levels
studied in the literature review and recommendations to EHS based on this analysis. Supplementary
Excel files reporting sonde data are included with this section.

5
Rainwater Harvester Model
The rainwater harvester model was produced by North Carolina State University to help determine
whether a cistern size is appropriate for a given setting. The model generates graphs and data that
show key features such as cistern water level and water savings.
Jordan Nutrient Accounting Tool
This is a tool produced by North Carolina State University and the North Carolina Department of
Environment and Natural Resources to assess the reduction in nutrient loading caused by the
implementation of best management practices. It uses the land cover totals of both the pre-
development and post-development of a watershed and is used primarily for nitrogen and
phosphorous.

6
Literature Review
Water Quality Management In 1948, Congress passed the Federal Water Pollution Control Act, which was the first
comprehensive legislation for water pollution control. Though there was limited federal
enforcement and financial assistance, the act adopted principles of program development that were
later continued in the Federal Water Pollution Act in 1956 and the Water Quality Act of 1965
(EPA, 2011). Under the Water Quality Act, States developed water quality standards that
established water quality goals for interstate waters. In 1972 the Clean Water Act (CWA) was
passed, which provided more enforcement and regulation. The CWA enforced laws with stiff
penalties such as fines. It created water-quality standards for discharged wastewaters, set pre-
treatment standards for industrial wastewaters before discharge and most importantly, provided
federal funding to build wastewater treatment plants (EPA, 2011; Knotts 1999).
In 1974, the Safe Water Drinking Act (SWDA) was passed by Congress after many efforts to
launch a national program to ensure good drinking water quality in the US. The SWDA authorized
the U.S Environmental Protection Agency to set standards for any contaminant in public water
systems that can adversely affect public health (Knotts, 1999).
UNC-Chapel Hill Reclaimed Water System
While federal regulations provide an important foundation for water quality, standards are upheld at
the state level. While the North Carolina Administrative Code regulates for reclaimed water
projects, it is the North Carolina Plumbing Code that contains regulations for rainwater harvesting.
The Orange Water and Sewer Authority (OWASA), which regulates infrastructure and provides
water, sewer, and water treatment services to Chapel Hill, and Carrboro and UNC—Chapel Hill,
works in conjunction with the North Carolina Department of Environmental and Natural Resources
(NCDENR) and Department of Environmental Health (DEH) Public Water Supply to ensure proper
regulation of all lines (OWASA, 2011).
In 2001, following a record drought, OWASA and UNC-Chapel Hill partnered to build a reclaimed
water (RCW) system that could provide the university with water for non-drinking demands such
as irrigation, toilet flushing and chilled water for buildings. Using RCW offers both conservation
and economic benefits by deferring the need for costly water supply and treatment facilities while
still meeting non-drinking water demands, and reducing the risk of a water shortage in case of
future droughts (OWASA, 2011). As part of UNC-Chapel Hill’s non-potable water program,
rainwater harvesting further supports OWASA and the community in conserving water resources
and reducing costs.

7
UNC Regulations
As with any facility operating both a potable system and a non-potable water system, UNC has
specific regulations that are in compliance with OWASA’s Rainwater System Requirements
regulation to keep the systems separated and make sure no contamination occurs to the potable
water pipes and water supply.
For restrooms, UNC requires that all new toilet and urinal systems be designed with dual plumbing
to use non‐potable water (UNC Energy Services, 2010, pg. 2). Irrigation systems using reclaimed
water must meet NC Administrative Code Reclaimed Water Regulations (Section 15A NCAC 02T
.0900).
Connections between potable and non‐potable water systems are not permitted. The OWASA
ordinance and State regulations require an air gap (of an unspecified amount) between potable and
non‐potable water distribution lines. To further safeguard against cross-connections with potable
water and provide greater corrosion resistance, specific pipe material is required. A potable back‐up
without an air gap requires an application for a site‐specific alternative cross-connection measure
submitted to NCDENR DEH Public Water Supply.
Condensate also is considered non-potable and may be blended with rainwater in the system as
long as provisions of the NC Plumbing Code and UNC‐CH requirements are followed. Only
condensate from UV-treated air handling units is acceptable. A valve on the condensate drain line
must be provided to divert coil-cleaning wastewater to a sanitary sewer drain. To prevent accidental
collection of any wastewater, a raised drain to the storm/roof drainage system must be used with
signage indicating “No Biocide – Drains to Storm” (UNC Energy Services 2010, p 5).
For accurate billing, the OWASA Rainwater System Requirements and Charges Policy requires
measurement of all non-potable water (NPW) entering a building. An OWASA reclaimed water
meter serves where the building uses reclaimed water only; a NPW meter is used if the building
uses rainwater only or a combination of reclaimed water with other non‐potable water sources. The
UNC‐Chapel Hill NPW meters conform to OWASA meter standards unless otherwise approved by
the UNC‐CH Energy Services Non‐Potable Water Manager.
Human and Environmental Health Rainwater harvesting systems have the potential to transmit pathogenic microorganisms that can
cause gastrointestinal illness in humans. Leaf litter and algae accumulated in gutters can contribute
to elevated microbial concentrations in roof runoff. In addition, rainwater is susceptible to
contamination by microbial aerosols; urban aerosols recently have been shown to contain 1,800
different types of bacteria (Brodie et al. 2006). Deposition of fecal microorganisms on rooftops
from animals such as birds, lizards, and squirrels also is a problematic source of contamination

8
(Ahmed et al. 2008; Crabtree et al. 1996). In other studies, researchers have detected bacteria such
as total coliform (TC), fecal coliform, Salmonella spp., Campylobacter, E. coli, Legionella
pneumophila, and protozoan parasites such as Cryptosporidium and Giardia in rainwater collection
and storage tanks. Though all of these bacteria are harmful, the most important are fecal coliform
and Legionella. Fecal coliform is an indicator for other bacteria, while Legionella is a disease-
causing agent that can become airborne through aerosolization and cannot be found by testing for
fecal coliform (Sobsey 2010).
Human Health Implications
Little in-depth research has been done concerning the human health implications of using harvested
rainwater for non-potable purposes. Reasons for this are that non-potable water is not meant for
consumption, human interaction with it is minimal, and the intended use of non-potable water for
irrigation and greywater systems is a relatively new concept.
In terms of human health, pathogens and toxins in water can enter humans and cause infection in
several ways: through dermal contact, inhalation, or ingestion (fecal or oral). Although there are
many pathogens and toxins in rainwater stored in cisterns (e.g., salmonella) that could cause harm
in human gastrointestinal tracts if ingested, non-potable water is not intended for drinking and
gastrointestinal toxins, and thus will not be discussed in this review.
A concern arises pertaining to pathogens that could be aerosolized and taken up through the
respiratory tract. The sources of these pathogens are greywater toilet flushing systems and irrigation
systems with sprinklers. Legionella, a genus of pathogens typically found in rainwater, causes
concern because it can exist in mist droplets, subject to inhalation. The bacteria in the air can travel
up to 6 km from the distribution source. Common sources of Legionella are freshwater ponds and
creeks, swimming pools, cooling towers, large stores of water, domestic heating systems, etc.
(Zhang 2008). Upon infection, Legionella can cause flu or pneumonia-like symptoms. Usually,
Legionella is not lethal to healthy people, but it can harm immune-compromised hosts like children
and the elderly. The infectious dose of Legionella can be as low as a single bacterium inhaled. In
Legionella infections in hospitals, water distribution systems are cited as the pathogen source, and
the resulting case fatality rate is 28% (Zhang 2007). Periodic thermal or chemical disinfection of
water sources can kill the bacteria and act as a source control method.
As for dermal entry, Methicillin-resistant Staphylococcus aureus (MRSA) has been found to exist
in rainwater. The infectious dose for Staph is 100,000 cells/grams in humans (Bloomfield 2006).
This is particularly a concern for campus fields irrigated with cistern water. On the athletic fields,
athletes are subject to a high risk of infection, especially if an athlete has wounds exposed to the
contaminated grounds. Staph symptoms range from intense dermatitis to toxic shock syndrome.
Unlike Legionella, Staph can be spread via human-to-human contact. If one case occurs, many
more are likely to follow. Another concern that Staph presents is antibiotic resistance; Staph is
rapidly becoming resistant to many broad-spectrum antibiotics. In fact, rainwater washes away

9
many antibacterial chemicals used in pesticides or for agricultural purposes (Bloomfield 2006).
When bacteria become exposed to these waters, they become resistant to even more chemicals.
Other irritants and toxins that are found in rainwater include (but are not limited to) fungal and
bacterial spores, acid water, heavy metals and mold that if inhaled can lead to bronchitis and
asthma events in immune-compromised individuals. To prevent this, rain water should be filtered
before use.
Environmental Impacts
Levels of pH, zinc concentrations and sodium absorption rates in rainwater used for irrigation
should be monitored closely because of their environmental impacts on the plants and soil that
come in contact with the harvested rainwater.
Water that has a pH below the minimum standard for non-potable water use (in this case, 6.0) can
cause acidification of soil. This has adverse effects on plant growth. First, nutrients like calcium,
magnesium, and potassium begin to leach out of the soil, which creates nutrient deficiency and
stunts plant growth (Singh and Agrawal 2008). Second, low pH makes heavy metals in the
environment more available for plant uptake. For example, with more acidic water, more free metal
ions are taken up by plants through their root systems. When the pH falls below 5.5, plant growth is
limited by aluminum toxicity (Foy et al. 1978) as aluminum ions take the place of nutrients that
have been leached out of the soil (Girard 2010). Similarly, runoff from roofs (especially metal roofs
like galvanized iron) may contain large amounts of additional heavy metals such as zinc (Yaziz et
al. 1989), which may also poison plants and stunt growth (Foy et al. 1978). Sensitive root hairs can
be damaged and microorganisms that benefit plants can be killed by this process (Girard 2010). The
severity of the effects of acidic water depends on environmental factors like the type of soil and
underlying rock. Since the process of soil acidification is slow, effects may go unnoticed for a long
time (Singh and Agrawal 2008).
Oxidation-reduction potential (ORP) is another potential factor to consider. The ORP measures the
ability of a given body of water to oxidize contaminants (Lowry and Dickman 2010). While higher
ORP levels leach out more nutrients, including nitrogen and phosphorous (Lo et al. 1994), and the
change in electron balance could kill plants (Lowry and Dickman 2010), its role in irrigation seems
purely speculative at this point. On the positive side, high ORP also can kill pathogens that would
spread disease (Newman 2004). The ORP would change with the amount of oxidizers or reducers
added to the water, so the levels of oxidizing agents like hypochlorous acid (HClO) present in a
water sample likely would change before the same water source is used in irrigation (Lowry and
Dickman 2010). The baseline for anti-bacterial activity is 650 mV (Newman 2004).
It should be noted that metal toxicity is complicated and depends on numerous factors. The amount
of free metal ions in the soil depends on environmental conditions, local variation, sensitive
10
chemical reactions, and functional responses that are not completely understood (Foy et al. 1978).
For all of these metals, pH (with a target safe range of 6-9) is seen as the crucial factor, and should
be monitored closely.
Sodium absorption ratios higher than 8 are considered above the maximum limit for rainwater used
for irrigation, although if the same water source is being used for long-term irrigation, then having
a SAR higher than 4 could have negative effects on the soil properties (Gross et al. 2005). The
same study also found that the greywater tested would not be suitable for unlimited irrigation
practices because of boron levels and the amount of surfactants. They found that some plants had
retarded growth rates in plots treated with greywater rather than with regular freshwater.
Sampling
A consistent sampling procedure is vital for standardization of testing methods. Information on best
practices was reviewed and compiled as it applies to campus cistern circumstances.
What to Test For
A thorough sampling program should investigate the following categories of water pollutants:
disease-causing agents (pathogens), oxygen-consuming wastes, plant nutrients (nitrogen,
phosphorous, potassium, calcium, and magnesium), suspended solids and sediments, dissolved
solids (salt), thermal pollution, toxic materials, radioactive substances, hydrocarbons and acids
(Gerard 2010). Samples sent to the lab therefore should be tested for the following: total coliform,
an indicator of overall microbial activity; fecal coliform, an indicator of harmful bacteria; zinc,
which can build up to toxic levels in plants; nitrates and phosphates, nutrients that can cause
eutrophication in streams; calcium and magnesium, which cause buildup in pipes in addition to
being plant nutrients; copper, a source of corrosion in galvanized pipes; hydrocarbons, a common
urban pollutant; and Legionella pneumophilia, the bacterium that causes Legionnaire’s disease.
(Surendran and Wheatley 1998; Scheinost et al. 2003; Al-Salaymeh et al. 2011). See Appendix C
for more detailed information on lab testing parameters.
On-site sampling using the sonde should test for pH, dissolved oxygen, temperature, salinity,
conductivity, resistivity, dissolved solids and outside air pressure (useful for gauging weather
conditions). The WHO and EPA state that pH should fall between 6 and 9 for all non-potable uses;
it can cause a variety of problems if it falls outside this range (Surendran and Wheatley 1998). The
other parameters can be good indicators of the conditions listed above (from Gerard 2010). In the
absence of extensive laboratory testing, sonde data would be crucial in determining water quality in
the cisterns.
Sampling protocol
The EPA recommends that at least 50 samples be collected to minimize error and make data as
statistically significant as possible. Time, day of the week, and other conditions surrounding

11
sampling should be consistent. For samples that are going to a lab, it is important to pick a time that
will allow time for shipment to the lab on the same day. The lab should be notified beforehand to
prepare them to receive the samples (Al-Salaymeh et al. 2011). Ideally, four samples will be sent in
for analysis. Two of these should have been taken during “dry” conditions (no less than 3 days
since the last precipitation) and two during “wet” conditions (within 2 days of precipitation).
(Characklis et al. 2005). This will shed light onto some possible changes brought on by rainfall. If
budget constraints prevent four lab-analyzed samples, a mix of wet and dry should be maintained
(e.g., two dry and one wet, or one dry and one wet).
The review of best practices in sampling suggested that samples being sent to a professional
laboratory should be stored in a cooler at or around 4°C to preserve the microbial community as
much as possible (Al-Salaymeh et al. 2011). Because the lab may need to run multiple types of
tests, a large volume—around 1L for each replicate—should be sent from each cistern (Chang et al.
2004). If separate bottles are used as storage during shipment, they must first be rinsed with cistern
water. Samples not sent to the lab should be returned to the cistern, either by directly pouring them
back in or by emptying them into a nearby drain.
Handlers must take extra care with Legionella pneumophilia—a very hazardous pathogen. L.
pneumophilia samples must be cultured by USEPA-approved methods. Legionella in 100ml water
samples are cultured on buffered charcoal extract (BCYE) culture media with incubation at 37
degrees Celsius. Selective isolation processes recover and detect Legionella in 100ml of water, and
employ centrifugation to pelletize bacterial cells from the water. Treatment of the pelleted cells
with acid and heat eliminates other microbial overgrowth and improves L. pneumophilia detection.
Detected presumptive Legionella colonies on BCYE will then be confirmed by PCR to detect
specific portions of genomic DNA unique to L. pneumophila in as little as 1 day.
Acceptable Levels of Water Quality Parameters In order to properly interpret the results of the water samples, acceptable water quality standards
from previous non-potable water studies are especially beneficial to use as a comparison. There are
two primary groups of water quality parameters in this study, including the parameters that are
obtained from the sonde and those obtained through lab testing. According to WHO and EPA
guidelines, the pH should fall between 6 and 9 for all non-potable uses (Surendran and Wheatley
1998). In terms of dissolved oxygen, a level less than 30% creates hypoxic conditions, while a level
above 80% is considered “healthy”. As for temperature, a level below 0 degrees Celsius would be
problematic for plumbing due to freezing. Furthermore, temperature above 100 degrees Celsius is
boiling and useful for sterilizing water. Because we did not expect to be dealing with either
extreme, we considered the fact that, in general, warmer water encourages more bacteria growth, so
the cooler the water the better. A relationship that is relevant for analysis then will be between E.
coli growth and measured temperature. As for salinity, less than 0.5 ppt is considered freshwater,
0.5-30 ppt is brackish, and greater than 30 ppt is saltwater. In relation to this study, conditions

12
above 0.5 ppt will prevent the growth of plants via irrigation. Conductivity is a measure similar to
salinity. Because salinity is easier to interpret, conductivity was disregarded for our purposes.
Lastly, a positive number for ORP indicates that the water is oxidizing. So, for example, this water
could rust a pipe. Higher values of ORP make this more likely. An issue of more concern is how
ORP may lead to fluctuations in other water quality elements sampled. For the purposes of our
study, we ultimately focused on pH, temperature, salinity, and dissolved oxygen because of the
direct relevance of these parameters to bacterial growth, irrigation, and pipe corrosion.
We also gathered samples to be sent to a laboratory to undergo more rigorous testing. These
samples included tests for total coliform, fecal coliform, Legionella, zinc, total nitrogen and total
phosphorous, calcium and magnesium, copper, chloride, and hydrocarbons. In the specific case of
toilet flushing, the EPA and the WHO suggest that no more than 500 cfu/100 mL of total coliform
and no more than 14 cfu/100 mL of fecal coliform be present. Furthermore, a maximum level of
200 cfu/100mL fecal coliform is recommended for irrigation, while a limit of 100 cfu/100 mL for
all other non-potable uses is suggested (Surendran and Wheatley, 1998). Legionella pneumophilia
has been found at an average density of 266 cells/mL in rainwater cistern systems common to the
U. S. Virgin Islands. A measure of low microbial counts includes those below 100 cfu/mL (Lye
1992), but the existence of any Legionella organisms should be an area of concern. In terms of zinc,
the level at which this substance becomes harmful to plants varies based on plant type and soil
conditions, so this merits careful consideration based on location where irrigation occurs (Scheinost
et al. 2003). The amount of dissolved calcium and magnesium in water determines the hardness of
the water. In terms of damage to the cistern or plumbing structures, a hardness of above 200 mg/L
can result in scale deposition, particularly with heating, while soft waters with a hardness of less
than 100 mg/L have a low buffering capacity (Lehloesa and Muyima 2011). It may be important to
note that in the case of the parameters determined in the lab, there was limited literature about
acceptable thresholds of these contaminants in non-potable rainwater and we simply have missing
information for some levels of our parameters. The following tables compare acceptable levels of
water contaminants for non-potable water uses.
Table 1: USEPA requirements for urban reclaimed water (including toilets and irrigation)
Parameter value
Fecal coliform No detectable fecal coliform/100 ml
BOD (biochemical oxygen demand) <10 mg/liter
Turbidity <2 NTU
pH 6 - 9
Chlorine 1 mg/liter Cl2 residual
Source: Guidelines for Water Reuse. U.S. Environmental Protection Agency, Sep. 2004. Web. Accessed 22
February 2011 http://www.epa.gov/ord/NRMRL/pubs/625r04108/625r04108.pdf

13
Table 2: Water-quality criteria for toilet flushing and other urban uses in various countries
g = guideline, m = mandatory 1 Surendran and Wheatley, 1998 2 Ministry of Environment, Lands and Parks, British Columbia (enacted July 15, 1999) 3 US.EPA, South Australia, 1999 4 suggested as appropriate for domestic water recycling 5Building Services Research and Information Association, 2001
Criteria FC
(CFU/100 ml)
TC
(CFU/100ml)
E. coli
CFU/100ml)
BOD5
(mg/L)
Turbidity
(NTU)
TSS
(mg/L)
DO (%
saturation) pH
Cl2 residual
( mg/L)
US.EPA1 (g) 14 for any sample
0 for 90% samples 1 10 2 6–9 1 CT = 30
Florida1 (m) 25 for any sample
0 for 75% samples 20 5
1
Texas1 (m) 75 (m)
5 3
Canada, BC2
(m)
2.2 median
14 any sample 10 5 10
Germany1
(g) 100 (g) 500 (g) 20(g) 1–2 (m) 30 80–120 6–9
Japan1 (m) 10 for any sample 10 10 5 6–9
South
Australia3 <10 <20 <2
WHO1 lawn
irrigation 200 (g) 1000 (m)
EC bathing
water 1, 4 100 (g) 2000 (m)
500 (g)
10,000 (m)
2 (g) 1
(m)
80–120
(g) 6–9
UK BSRIA5
proposed (g)
14 for any sample
0 for 90% samples

14
Sampling Equipment, Materials and Process
Sampling (Laboratory)
Eight bottles were provided by the lab for each cistern:
1 x 100 mL poly bottle with sodium thio for total coliform
1 x 100 mL poly bottle with sodium thio for fecal coliform
1 x 1 L sterile poly bottle with no preservative for Legionella pneumophilia
1 x 500 mL HDPE bottle with nitric for zinc, copper, manganese, calcium
1 x 500 mL HDPE bottle with sulfuric for nitrate-nitrite
1 x 250 mL HDPE bottle with no preservative for chloride
2 x 1 L amber glass bottle with HCL for oil and grease
A secondary bottle (500 mL) or bucket (5 gallon) was used to collect water from each cistern; this
water was used to fill each test bottle provided by the lab. Acid as preservative was applied to the
relevant bottles and filled bottles were packed on ice in a cooler. Chain-of-custody procedures were
followed for the samples, which were transported to the EPA-regulated lab Cameron Testing
Services Inc. immediately.
Sampling (Sonde)
The cistern capstone team took advantage of having an involved client with resources and
equipment provided by EHS such as a vehicle, supervision and funds sufficient for two rounds of
lab sampling. A sonde (YSI 556 Multiprobe by YSI Inc., Yellow Springs, Ohio), made available to
EHS and cistern capstone team members by the Ecology and Geography departments, was used to
collect data multiple times a week at each cistern from February 8 to April 14, 2011. The sonde
recorded temperature, specific conductivity, dissolved oxygen concentration, pH, oxidation
reduction potential, dissolved oxygen, resistivity, salinity, total dissolved solids and barometric
pressure. See Appendix C for definitions and explanations of these parameters.
To collect samples using the sonde, EHS staff removed cistern covers and placed a cone near the
manhole to prevent an accidental fall. The sampler unscrewed the clear plastic calibration cup on
the sonde and screwed the probe protective cage over the multiprobe assembly. The cable was
connected to the YSI handheld portion of the device and the multiprobe was held in the cistern
water, fully submerged. When the data points on the sonde’s screen stabilized, it was removed
from the water and the data logged within the internal computer of the sonde and files labeled
appropriately. Time, place and weather conditions also were noted for consideration in analysis.
After the last sample, the multiprobe was rinsed with clean water. This process was repeated for

15
each cistern location. Because the sonde was so readily available, we were able to get samples
under rainy and dry conditions, which contributed to the comprehensiveness of our data.
In total, we collected 14 samples at FedEx, 13 samples at Boshamer, 13 samples at Rams Head and
12 samples at Hooker Fields. Because we started each sample day by meeting at FedEx, we had
time to sample there every session. Due to time constraints of cistern capstone team members, the
cistern at Hooker Fields was sampled 12 times.

16
Results and Analysis
Laboratory data
The following table summarizes the lab results from each cistern. Blue cells are below the
detectable level, green are detectable but below the acceptable limit, and orange are above the limit
and could be problematic.
Table 3: Summary of Laboratory Data
FedEx Rams Head Boshamer Hooker Limit units
Coliform, fecal <1 <2 18 13 14 col/100ml
Coliform, total 10 <1 400 20 500 col/100ml
Legionella 0 0 0 0 -
Nitrate-Nitrite 0.92 0.63 1.2 0.55 10 mg/l
Nitrogen, total 0.75 0.22 0.72 0.14 -
Phosphorus, total 0.18 <0.10 0.62 <0.10 0.1 mg/l
Calcium 10 18 22 45 1800 mg/l
Copper 0.022 0.53 <0.020 <0.020 1.3 mg/l
Manganese 0.012 0.015 0.04 0.068 0.05 mg/l
Zinc 0.17 0.32 <0.030 0.073 5 mg/l
Chloride 5.6 74 19 110 250 mg/l
Oil & Grease <5.0 <5.0 <5.0 <5.0 -
Orange cells and key data trends are addressed in the graphs below.
0
2
4
6
8
10
12
14
16
18
20
Fed Ex Rams Head Boshamer Hooker
Co
lifo
rm p
er
10
0m
L
Cistern
Fecal Coliform
EPA non-potable limit
Figure 1: Fecal coliform
FedEx and Rams Head cisterns
both were below the detectable
level; however, the Boshamer
Field cistern was significantly
above the non-potable limit, and
the Hooker Field cistern was
fairly close to the limit as well.
This may be because of the
large amount of pavement in
these cisterns’ drainage areas;
very little of the water that
enters the cistern has been
filtered through soil or any other
material.

17
0
0.01
0.02
0.03
0.04
0.05
0.06
0.07
0.08
Fed Ex Rams Head Boshamer Hooker
Man
gan
ese
(m
g/L)
Cistern
Manganese
Potable limit
0
0.1
0.2
0.3
0.4
0.5
0.6
0.7
Fed Ex Rams Head Boshamer Hooker
Tota
l P (
mg/
L)
Cistern
Total Phosphorus
EPA phosphate limit
0
0.1
0.2
0.3
0.4
0.5
0.6
0.7
0.8
Fed Ex Rams Head
Boshamer Hooker
TKN
(m
g/L)
Cistern
Total Nitrogen
Figure 2: Manganese
Hooker Field cistern was above
the acceptable limit for potable
water. Manganese is found in
gasoline, so the large amounts
of pavement draining to the
cistern would explain this
trend. This is not a huge
concern since the water is not
being consumed; however,
extended exposure to these
levels of manganese can affect
the nervous system and
eventually lead to neurological
disorders, so caution is
advised.
Figure 3: Nitrogen and phosphorus
Boshamer and FedEx cisterns were significantly higher than Rams Head and Hooker Field.
This is likely because Boshamer is fertilized heavily and the FedEx building’s roof garden
drains to the cistern. Nitrogen is not a problem because of the low nitrate-nitrite levels.
However, phosphorus levels, especially in Boshamer, are above the EPA’s maximum
phosphate limit for water entering streams. Phosphate levels may therefore be over the
acceptable limit, so water from these cisterns could cause environmental problems if it were to
enter streams in significant quantities.

18
Water from Rams Head and FedEx had the highest concentrations of copper and zinc, most likely
due to roof runoff. However, calcium, manganese, and chloride were by far the highest in the
Hooker Fields cistern, probably because of runoff from the surrounding high-traffic roads. Only
manganese exceeded drinking water standards; non-potable limits were not found.
Sonde Data
See attached Excel Workbook files for sonde data on each cistern.
Analysis of Sonde Data
The most important parameters measured by the sonde, for the purposes of this project, are water
temperature, pH, DO%, and salinity. In terms of cistern longevity, pH is the most important for the
structural integrity of the cistern. A low pH would slowly wear down pipes due to the acidity of the
water. Low pH values can also lead to soil acidification, which could inhibit plant growth. Salinity
is important when accounting for irrigation use. Higher values of salinity are not ideal for plant
growth and could lead to negative effects on the soil.
Water temperature for each cistern was reflective of weather conditions. Most of the drops in
cistern water temperature correspond to a drop in air temperature, most notably on March 31st. The
measurement taken in early February was considerably lower than all other measurements, a sign
of colder temperatures due to seasonal change. From March to April, all cisterns exhibited a slight
warming trend, with no cistern changing more than 4 degrees Celsius through the time span. One
exception, the Rams Head cistern, was more variable than the other cisterns. This is most likely
due to its higher location to the ground surface and smaller volume. It is also worth noting that the
Hooker cistern was consistently higher in temperature. We do not have an exact reason why the
Hooker cistern was consistently higher in water temperature than the others. One possible
explanation is that the cistern has artificial turf that covers the field and has a lower albedo than
natural soil, due to the materials used in the turf. This could result in more absorption of sunlight
and therefore raise the temperature of the water underneath.
The pH values for each cistern location were all within acceptable levels for plant irrigation. Only
one recorded value had a pH below 6: 5.77 at Rams Head on March 1st, which is the cutoff for soil
acidification. If values had consistently been below 6, soil acidification could occur. This would be
detrimental to plant growth since soil acidification causes nutrients in the soil to leach out and not
be absorbed by the plants (Singh and Agrawal 2008). Neither the Boshamer cistern nor the Hooker
cisterns were strongly variable, with average ranges close to a neutral pH of 7. Rams Head cistern
had the lowest average pH value, around 6.5, and exhibited a largely variable signal from February
to mid-March. Afterwards, its signal flattened out and averaged slightly above 6.5. FedEx cistern

19
was clearly the most variable, with pH values ranging from a minimum of 6.2 to a maximum of 7.6.
When comparing the pH time series for each location to the precipitation events over the time span,
it does not appear that any rain event had an effect on the pH values of the cisterns. Because
rainfall does not appear to have any direct influence on pH variation, these differences over time
likely are negligible.
The DO% values for each cistern location have similar signals, with the exception of the Hooker
cistern. They all had higher values in February, and continually dropped through April. This is
again most likely a product of seasonal change. Both Boshamer and FedEx cisterns had DO%
values over 200% in February, which are the highest values recorded for any cistern during this
time span. As for the Hooker cistern, it is worth noting that it never recorded a value over 100%,
and remained relatively constant throughout the time span. While the exact values of the DO%
may not be entirely accurate due to the age of the probe, the relative trends observed should still
provide an idea of how the DO% changes over time.
The salinity patterns were dramatically different for each cistern. Both the Boshamer and FedEx
cisterns were relatively flat, with Boshamer averaging around 0.125 ppt and FedEx averaging
around 0.05 ppt. Rams Head constantly dropped throughout the time span, starting at 0.35 ppt in
February and ending at 0.075 ppt in April. This pattern can most likely be explained by salting of
the sidewalks during winter, with the salty runoff entering the cistern. As temperatures increased,
there was no longer a need for salting the sidewalks. Also, after a few weeks of different rain
events, the cistern would slowly flush out the salty runoff. The Hooker cistern exhibited the most
interesting pattern. The salinity levels increased though the end of March, and dropped drastically
within 2 days until slowly increasing over the last two weeks. One possible explanation for this
pattern could be a manual flushing of the cistern, resulting in lower salinity as newer rainwater
filled the cistern. Because anything less than 0.5 ppt is considered freshwater, all the values we
recorded are safe for irrigation purposes. For comparison, ocean water is typically around 35 ppt,
nearly 100 times the highest salinity value recorded in the cisterns (Office of Naval Research).

20
Rainwater Harvester Model
The Rainwater Harvester Model produced by North Carolina State University utilizes several
inputs to simulate the cistern water level. The inputs include the known rainfall for the area, the
drainage area, cistern volume, cistern cost, and water usage. The outputs can be seen in the table
below. The cistern costs are unknown because most cisterns were built along with other structures
and the actual cistern costs were not separated from total cost. Therefore, the cistern costs inputs
were estimates based on the volume of the cistern, not based on the actual cost and could be
drastically different than those estimated. For that reason, no estimated payback period is listed
below.
Table 4: Summary of Outputs
Cistern Boshamer Rams Head FedEx Hooker
Total Volume Capacity, % 22 44 17 33
Usage Replaced, % 60 64 100 93
Annual Water Usage, gallons 1321980 504674 109376 3035671
Annual Water Savings, $ 6,676 2,549 552 15,330
Overflow Frequency, % 73 52 72 63
Dry Cistern Frequency, % 51 46 0 9
Water Quality Volume Capacity, % 25 48 20 36
Annual Nitrogen Removed pounds 13.24 5.05 1.1 30.4
The figures below graphically show the output of the Rainwater Harvester Model (RWHM). These
graphs show the cistern water level as a percentage of the total on a time scale. The model can
simulate backwards as far back as 1974 but can simulate only up to 2003. This is why a two-year
time scale was chosen (2001 to 2003) in order to show the two most recent seasonal cycles. The
graphs show what one would expect, varying between empty and full for various times of years,
except for the FedEx cistern. This graph shows that the cistern is never empty and a significant
portion of the water is not being utilized. The water usage rate was based on the recorded water
usage, which varied from 2 to 16 kgal per month. This great variation could have led to an
inaccurate estimate of the average water usage and therefore skewed the data to show that the water
is not being utilized.

21
Figure 4: Hooker Fields RWHM Simulation
Figure 5: FedEx RWHM Simulation

22
Figure 6: Rams Head RWHM Simulation
Figure 7: Boshamer RWHM Simulation

23
Jordan Nutrient Accounting Tool
In 2009, the Jordan Lake Rules were established to reduce upstream pollution. The Jordan Nutrient
Accounting Tool was developed in accordance with these rules and can be used to calculate
nutrient reduction for cistern sites, both pre-development and post-development of the cistern,
which includes other changes made to the land during cistern construction, e.g., construction of the
FedEx Global Center. This model was developed by NC State University in partnership with the
North Carolina Department of Environment and Natural Resources (NCDENR) and is intended to
be used with new developments in order to determine necessary best management practices
(BMPs). It is being used in this instance to assess how the cisterns are reducing nutrient loading
because this information was either not done or not updated when construction of the cisterns took
place.
The model requires some geographic information as well as total drainage area. The drainage area
is broken down by land cover area, with land covers used in the model including forest, unmanaged
pervious, managed pervious, open/landscaped, parking lot, roof, road, sidewalk, and water. Each
area is managed with a water harvesting BMP (the cistern), which has a defined percent water
reduction. These numbers were generated in the Rainwater Harvester Model as total volume
captured. Models were run for three of the four cisterns. There were no pre-development statistics
available for Boshamer and thus it was not included. The model produced catchment outflows for
the BMPs, as well as outflows for the entire watershed. The final results of the Jordan Nutrient
Accounting Tool are seen in Table 5.
Table 5: Results of the Jordan Nutrient Accounting Tool for Nitrogen and Phosphorus in
Pounds per Acre per Year
Parameter
Metric (lb/ac/yr)
Rams
Head
FedEx
Hooker
Total nitrogen loading Pre-Development Conditions 15.25 11.52 5.12
Post-Development Conditions 7.84 9.19 5.12
Post-Development Conditions with BMPs 7.42 8.41 3.42
Catchment Outflow 4.23 8.93 3.42
Total phosphorus loading Pre-Development Conditions 2.33 1.31 1.13
Post-Development Conditions 1.43 3.73 1.13
Post-Development Conditions with BMPs 1.19 3.63 0.76
Catchment Outflow 2.4 1.24 0.76

24
Nutrient loading is essentially the passing of nutrients through the drainage area into a body of
water. An abundance of nutrients in a stream or lake can cause eutrophication, which can lead to
algal blooms. Eutrophication causes severe environmental effects, including hypoxia, which has
been documented as a reason for fish kills on the Neuse River. The desired result of a BMP is to
reduce the nutrient loading of a drainage area. For Rams Head and FedEx, the nitrogen loading was
reduced in the post-development phase, and in every case modeled here, the nitrogen loading was
reduced again after the BMPs were considered. Even though the Jordan Lake Rules were created
after the implementation of the cisterns, the new nitrogen totals still fall into the acceptable range
for commercial areas (8 to 10 lb/ac/yr). Interestingly, this is achieved without the use of the BMPs,
although they slightly improved the totals. It remains unclear whether the difference caused by the
BMPs is enough to declare them beneficial in this regard. In addition, the post-development
phosphorus totals with BMPs for FedEx are much higher than the pre-development conditions. This
may be due to the addition of landscaped area.
The difficulty in running this model was caused by incorrect or incomplete data. Only FedEx and
Rams Head had pre-development and post-development land cover charts for the drainage area, and
Rams Head had an error (likely caused by rounding) in that the total square feet was one more than
the additive square feet of the land cover breakdown. The extra square foot was added to the forest
section and should have a negligible impact. Hooker, on the other hand, had drastically different
drainage area totals between the pre-development and post-development totals (395,208 square feet
before development of the cistern and 467,010 square feet after development). The model requires
that pre-development and post-development total drainage areas be the same, so much of the post-
development managed pervious was reduced in order to make the model work. Managed pervious
was chosen because other areas in the drainage area remained constant, while managed pervious
changed. There was also 10,000 square feet of additional land for which cover was not specified.
This is why Hooker’s nutrient loading totals did not change between pre-development and post-
development.

25
Recommendations
Based on the data we collected, we do not believe that FedEx and Rams Head cisterns show any
cause for concern. Phosphate levels at FedEx should be tested, but because the water is being used
indoors the chances of it entering a stream are extremely slim.
For Boshamer and Hooker Fields, minor changes may be necessary. Boshamer Field showed
potentially hazardous levels of fecal coliform, indicating that the water there could cause illness if it
enters the body even in small amounts. It also had very high phosphorus levels, meaning that it
could cause environmental problems as outlined above. Hooker Fields had high manganese levels
and a fairly high fecal coliform count. If water at either of these sites is to be used for irrigation,
care should be taken to minimize the amount of contact people have with it. This might mean
irrigating at night or during other low-traffic times. Any personnel handling the water should wear
gloves as a precaution. In addition, the Boshamer cistern should be tested specifically for
phosphate, and precautions should be taken to prevent it from entering the nearby stream in
significant amounts. As long as runoff can be prevented, using this water for irrigation may
provide a short-term benefit for the field because of its high nutrient content. This means that the
amount of fertilizer used could be reduced as long as nitrogen and phosphorus levels remain fairly
high.
In the long term, it might be advisable to install a better filtration system at Boshamer and Hooker
Fields. This could be done either before the water enters the cistern (via a porous concrete overlay
or a similar method) or before it is used. Doing this would certainly reduce the amount of bacteria
present in the water, and could improve the other parameters depending on the method used.
Another recommendation for improving the quality of this project would be to increase the number
of measurements taken in order to observe seasonal trends. More measurements would make it
possible to see how the cisterns change with various weather conditions.
Also, it would be helpful to regularly test the pH levels of the cisterns. While the pH levels we
measured were completely acceptable for irrigation and pipe usage, it is possible that levels could
drop enough to be a concern. Consistently low pH levels could wear down pipes and also
negatively affect soils and plants.
Dissolved Oxygen % would be useful to test for on a regular basis, especially in times of warmer
temperature. DO% drops when the temperature of the water increases. If DO% levels are low
enough, anaerobic respiration can occur, which promotes the growth of bacteria. This is something
that would be of particular concern in summer, which is not a time that we were able to take
measurements.

26
References
Al-Salaymeh A, Al-Katib I, Arafat H. 2011. Towards sustainable water quality: management of
rainwater harvesting cisterns in southern Palestine. Water Resources Management, 25 (6):
1721-1736.
Begum S, Rasul MG. 2009. Reuse of stormwater for watering gardens and plants using green gully:
a new stormwater quality improvement device (SQID). Water, Air & Soil Pollution: Focus 9:
371-380.
Bloomfield A, Cookson B. 2006. Methicillin-resistant Staphylococcus aureus (MRSA),
Clostridium difficile and ESBL-producing Escherichia coli in the home and community:
Assessing the problem, controlling the spread. International Scientific Forum on Home
Hygiene. Accessed May 2011 at: http://www.ifh-
homehygiene.org/IntegratedCRD.nsf/9c1b88071913b860802575070007d2f3/8a052abf95f8b3e
a8025752400579220?OpenDocument
Chang M, McBroom MW, Beasley SR. 2004. Roofing as a source of nonpoint water pollution.
Journal of Environmental Management 73 (4): 307-315.
Characklis GW, Mackenzie JD, Simmons III OD, Likirdopulos CA, Krometis LAH, Sobsey MD.
2005. Microbial partitioning to settleable particles in stormwater. Water Research 39: 1773-
1782.
Foy CD, Chaney RL, White MC. 1978. The physiology of metal toxicity in plants. Annual Review
of Plant Physiology 29:511-66.
Girard JE. 2010. Principles of Environmental Chemistry. Sudbury, Massachusetts: Jones and
Bartlett Publishers, LLC.
Gross A, Azulai N, Oron G, Arnold M. 2005. Environmental impact and health risks associated
with greywater irrigation: A case study. Water Science and Technology 52 (8):161-9.
Guidelines for Water Reuse. U.S. Environmental Protection Agency, Sep. 2004. Accessed February
2011 at http://www.epa.gov/ord/NRMRL/pubs/625r04108/625r04108.pdf.
Helmreich B, Horn H. 2009. Opportunities in rainwater harvesting. Desalination 248 (1): 118-124.
Knotts J. 1999. A Brief History of Drinking Water Regulations. National Drinking Water Clearing
House 8 (4): 1-23. http://www.nesc.wvu.edu/ndwc/pdf/OT/OTw99.pdf.
27
Lazarova V, Hills S, Birks R. 2003. Using recycled water for non-potable, urban uses: a review
with particular reference to toilet flushing. Water Science and Technology: Water Supply 3 (4):
69-77.
Lehloesa LJ, and Muyima NYO. Evaluation of the impact of household treatment procedures on
the quality of groundwater supplies in the rural community of the Victoria District, Eastern
Cape. Water SA 26.2 (April 2002): 1-6. Accessed March 2011 at:
http://www.wrc.org.za/Knowledge%20Hub%20Documents/Water%20SA%20Journals/Manusc
ripts/2000/02/WaterSA_2000_02_1302.pdf
Li Z, Fergal B, Reynolds A. 2010. Rainwater harvesting and greywater treatment systems for
domestic application in Ireland. Desalination 260 (1): 1-8.
Lo CK, Yu CW, Tam NY, Traynor S. 1994. Enhanced nutrient removal by oxidation-reduction
potential (ORP) controlled aeration in a laboratory scale extended aeration treatment system.
Water Research 28 (10):2087-94.
Lowry RW, Dickman D. The ABC's of ORP. [Internet]. Accessed May 2011 at:
http://www.healthstyles4urx.com/live/pdf/acidalkalinity/The%20ABCs%20of%20ORP.pdf.
Lye DJ. 1992. Microbiology of rainwater cistern systems: a review. Journal of Environmental
Science and Health, Part A. 27 (8):2148-2150.
Newman SE. 2004. Disinfecting Irrigation Water for Disease Management. In: 20th Annual
Conference on Pest Management on Ornamentals; 2004 Feb 20-22; San Jose. Society of
American Florists. p. 1-10.
Office of Naval Research, Science and Technology Focus. Ocean Water: Salinity.
http://www.onr.navy.mil/focus/ocean/water/salinity1.htm
Orange Water and Sewer Authority. Reclaimed Water. Accessed May 2011 at:
http://www.owasa.org/whatwedo/reclaimed-water.aspx.
Scheinost AC, Kretzschmar R, Pfister S, Roberts DR, Sparks DL. 2003 June 18. Chemical forms of
zinc in a smelter-contaminated soil. Brookhaven National Laboratory:
http://www.nsls.bnl.gov/newsroom/science/2003/06-Scheinost.htm.
Seafood Network Information Center, UC Davis. “Hazards Found in Seafood”
http://seafood.ucdavis.edu/haccp/training/slides/appx03ncafdo.ppt (no date)

28
Singh A, Agrawal M. 2008. Acid rain and its ecological consequences. Journal of Environmental
Biology 29 (1):15-24.
Surendran S, Wheatley AD. 1998. Grey-water reclamation for non-potable re-use. Journal of the
Chartered Institution of Water and Environmental Management 12 (6): 406-413.
Texas Rainwater Harvesting Manual, Texas Guide to Rainwater Harvesting, Second Edition, Texas
Water Development Board, 1997.
UNC‐CH Non‐Potable Water Design Guidelines 4 & 5, 8/10/2010 version. Accessed May 2011 at:
http://www.energy.unc.edu/water-wastewater-and-storm-water-systems-documents/NPW-
Design-Guidelines.pdf,
US. North Carolina Department of Insurance. North Carolina Building Code Council. North
Carolina Plumbing Code. By North Carolina Building Code Council. 2009. Print.
U.S Environmental Protection Agency, What are Water Quality Standards. Accessed May 2011 at :
http://water.epa.gov/scitech/swguidance/standards/history.cfm
World Health Organization. Water, Sanitation and Health. Access May 2011 at:
http://www.who.int/water_sanitation_health/dwq/admicrob4.pdf
Yaziz MI, Gunting H, Sapari N, Ghazali AW. 1989. Variations in rainwater quality from roof
catchments. Water Resources 23 (6):761-5.
Zhan Z, McCann C, Stout J. 2007. Safety and Efficacy of Chlorine Dioxide for Legionella Control
in a Hospital Water System. Infection Control and Hospital Epidemiology 28 (8):1009-1012.
29
Appendix A: Work Plan
Phase Task Date Details
1
Work Plan Jan. 28th
Literature Review
Sampling Protocol
Safety Protocol
Draft Feb. 4th
Final March 3rd
Literature Review
Current Legislation
Health Implications
Environmental Impacts
Sampling Procedure Methods
Safety Protocol
Testing Parameters (what we’re testing for in this study)
Acceptable Levels of Parameters being tested
Recommendations and Treatment Options
Safety Protocol
Safety measures to be taken during sampling
Sampling Procedure
Methods
Dates and Times
Testing Parameters
Legionella Memo
To justify Legionella testing (see Work Plan, Materials)
Legionella Memo Draft: March 3rd
Final: TBD
Sampling**
Starting March
1st and
occurring twice
a week based on
schedule
attached
On site testing with Conor and Jeff using sonde for:
- pH
- Dissolved Oxygen
- Temperature
- Salinity
- Conductivity
- Resistivity
- Dissolved Solids
- Outside air pressure (useful for gauging weather conditions)
Note: Weather conditions will be observed and recorded. Some samples
will be sent to lab; special precautions to be taken for these samples (see
Sampling Protocol for details of testing parameters suggested)
2 Analysis Starting March
1st
Keeping records of information from sonde to include in final
analysis report
Integrating results from the lab as they arrive
3 Results, Report,
Presentation Mid-April TBD
Written report containing:
· Guidelines for cisterns
· Relevant Policy
· Assessment of water quality from sampling and experiments
· Environmental Impact (including vegetation and campus)
· Campus irrigation
· Implications of current conditions; recommendations for future
Rainwater harvesting model
Final comprehensive report containing:
Findings, results and graphs from sampling; implications for UNC
Presentation on the study

30
Appendix B: Structural Features of the Cisterns
The four cisterns have a variety of different volumes and drainage areas. The largest of the cisterns
is the Hooker Fields cistern, both in drainage area and in volume. The next largest is Boshamer,
followed by Rams Head, and finally FedEx. Table 6 lists the volume for the four cisterns that are
being studied. Table 7 lists the drainage areas for the four cisterns.
Table 6: Cistern Volume
Location Volume, cubic feet Gallons
Boshamer 10694.4 80000
FedEx 7218.72 54000
Hooker 66840 500000
Rams Head 7486.08 56000
Grand Total 92239.2 690000

31
Table 7: Drainage Area
Location Drainage area, square feet Acres
Boshamer 255896 5.9
FedEx 27305.6 0.63
Hooker 392052.9 9.02
Rams Head 47583.9 1.1
Grand Total 722838.4 16.65
Table 8: Water Usage
Location Water Usage
Boshamer 92,200 sq. ft. (irrigated area)
FedEx 33,200 area sq. ft. (irrigated area)
Hooker 136,100 area sq. ft. (irrigated area)
Rams Head 300 gal/day
Grand Total 261,500 sq. ft. (irrigated area), 300 gal/day
Beneath the Rams Head cistern, the stormwater management system consists of two 42-inch
diameter reinforced concrete pipes (RCP) that run from beneath Kenan Stadium and are combined
into a single 72-inch diameter corrugated metal pipe (CMP) that crosses under Ridge Road. The
pipe continues through Ehringhaus Field as a 72-inch RCP. Several smaller pipes allow runoff
from the north and south of the Rams Head area to flow into the larger pipe system that crosses
Ridge Road. The 72-inch pipe ultimately discharges to the east of Boshamer Field.
Before Kenan Stadium, Rams Head, and Ehringhaus Fields were built, there was a stream that ran
through the area. The design of the piping below these structures is designed to mimic the original
tributary and springs. A zoning ordinance requires that new construction does not increase the
volume of runoff for a 2-year storm event nor increase peak flow rates for larger storm events.

32
Appendix C: Sampling Protocol
Sampling procedure
Samples will be collected from the surface layer of the cistern using a plastic bottle on an
extendable rod.
- The same bottle, or at least the same type of bottle, should be used for each
collection.
- The bottle should be rinsed with the cistern water before the sample itself is taken.
- Ideally, samples would be taken from multiple depths, but we do not have the
equipment to do so.
Once the cistern water has been collected, the bottle will be removed from the pole, and
data will be taken on site using a sonde as detailed below.
Select samples will immediately be stored at or around 4°C in a cooler and sent to a
professional laboratory for analysis (see below).
Samples not sent to the lab are to be returned to the cistern, either by directly pouring them
back in or by emptying them into a nearby drain.
All sampling must be carried out in accordance with the safety protocol below.
Dates and times
Date and time of sample collection will depend on the availability of class members and
EHS personnel. Ideally, this will be 2-3 times a week for 4-6 weeks.
- The EPA recommends that at least 50 samples be collected to minimize error, single
out outliers, and make the data as statistically reliable as possible. This was not
possible for this project because of time and budget constraints, but the team still
will attempt to collect 10-20 samples for analysis using the sonde.
To the extent that it is possible, the time of day when samples are taken should be kept
constant.
Samples being sent to the lab must all be taken in the morning to allow time for shipment to
the lab. The lab will be notified by the client of when they will receive the samples.
- Ideally, four samples will be sent in for analysis. Two of these should have been
taken during “dry” conditions (no less than 3 days since the last precipitation) and
two during “wet” conditions (within 2 days of precipitation). This will give some
idea of the changes brought on by rainfall.
- If four samples cannot be sent to the lab due to budget constraints, a mix of wet and
dry should still be maintained (2 dry and 1 wet, or 1 dry and 1 wet).

33
Testing Parameters
On-site testing using the sonde will test for the water properties below. These are indicators of
overall water quality rather than specific health or environmental concerns.
Date
Time
Water Temperature, in Celsius
Specific Conductivity- The reciprocal of specific resistance. Measures the water’s ability
to conduct an electric current. Measured in millisiemens per centimeters.
Dissolved Oxygen (DO)- Amount of oxygen dissolved in water. Measured in milligrams
per liter. Affected by water temperature, salinity and atmospheric pressure. Dissolved
Oxygen % (DO%) is simply the total amount of oxygen the water can hold under the given
conditions of the water, i.e. temperature, pressure, salinity.
1.) DO concentration increases with decreasing water temperature
2.) DO concentration increases with decreasing salinity
3.) DO concentration increases with increasing atmospheric pressure
pH- Measures acidity of water
Oxidation-Reduction Potential (ORP)- Measures the tendency of the water to gain
electrons, and therefore, become reduced. Measured in millivolts.
Salinity- the amount of salt in solution. Measured in parts per thousand (ppt).
Total Dissolved Solids - Total amount of organic and inorganic substances in the water.
Measured in grams per liter.
Barometric Pressure (BP)- A measure of the atmospheric pressure on the water.
Measured in pounds per square inch (psi).
Samples sent to the lab are to be tested for the following:
Total coliform – Indicator of overall microbial activity. EPA suggests that no more than
500 cfu/100mL be present.
Fecal coliform – Indicator of the presence of harmful bacteria. EPA and WHO guidelines
are <14 cfu/100mL for toilet flushing, <200 cfu/100mL for irrigation, and <100 cfu/100mL
for all other non-potable uses. Only the Fed-Ex Cistern should comply with 100 cfu/100ml
standard.
Legionella – Group of bacteria that can cause severe illnesses, including Legionnaire’s
disease. One organism per 100 ml sample of Legionella is considered a threat.
Zinc – Can cause toxic buildup in plants; more literature review is needed to determine safe
levels. This is not a concern in the FedEx center.
Total Nitrogen and Total Phosphorous – Nutrients essential to primary productivity; can
cause eutrophication if they enter streams in large quantities. EPA standard for nitrates is
10mg/L for Maximum Contaminant Level Goal (MCLG) and .01mg/L for Phosphorous
MCLG in streams.

34
Calcium and magnesium – Can build up in pipes over time, leading to plumbing problems.
Copper – Causes corrosion in galvanized pipes.
Chloride – Can damage turf above a certain concentration; also has the potential to cause
corrosion in pipes. The cisterns near parking lots and roads may have higher chloride levels
because of the salts put on the roads during the winter or from other manmade chemicals
containing salts/minerals.
Hydrocarbons – Pollutants such as oil that are associated with runoff from roads and
parking lots. Oil can disrupt plant processes like transpiration, respiration, and
photosynthesis and damage plant cell membranes by blocking soil pores, which is a concern
for non-potable water used for irrigation as with Hooker and Boshamer Field. Oil and
grease can also block irrigation systems.
Sampling Schedule
As a safety precaution, an employee from the Department of Health, Environment and Safety every
time will supervise each sampling event (see Safety Protocol).
Sampling will begin on Tuesday March 1st at 8:30am in front of the manhole covering in the Global
FedEx building. From that date, the Team will decide at each sampling event when the next event
will occur for the 6-8 weeks. This system will ensure that everyone on the team can have the
experience of sampling and also gives sampling Supervisors a sense of flexibility to work around.
Availability of team members
Monday Tuesday Wednesday Thursday Friday
8am-10am KB KB, MM,
AR, NF
KB AE NF KB
10am-12pm JG, MM KW, KBu,
MM, AR
MM KW, KBu,
KB, AR
AR
12pm-2pm JG, EP KW, KB, AR MM, EP, BR KW, KB, AR JG, EP, AR
2pm-4pm JG, EP, AR KB, EP,
AR, NaF
BR, EP, AR KB, AR, NF JG, AR, NF
4pm-6pm KW, KBu,
KB, AR
KW, KBu,
KB, AR
AR, NF KW, KB

35
Appendix D: Safety Protocol
Site Control
1. Only a member of Environmental Health and Safety should remove the manhole covers.
The remover must wear steel toed boots and ensure that no other persons are in the
immediate area where the cover could potentially injure them if dropped.
2. When the lid is removed, place orange cones around the exposed hole to warn others off the
potential fall hazard.
3. When the cistern cover is removed, one person from the sampling team must remain next to
the cover to insure that no unaware passersby or cars are injured.
4. No one is allowed to enter the manhole for any reason, as it is a confined space.
Equipment
1. Gloves
a. To be provided by a member of EHS
b. Should be worn at all times by anyone handling the water sample, either collecting the
water sample or assisting
c. Note: While wearing the gloves, be sure not to touch one’s face because the gloves
could have been contaminated by the water
2. Closed toe shoes
a. To be worn to protect the samplers from contamination
3. Water sample
a. The water sample is to be taken in an approved bottle provided by EHS
b. Ensure that the water does not splash anyone or come in contact with anyone not
wearing gloves
c. If too much water is taken, the water should be poured somewhere safe (ideally back
into the drain, but at least not near anyone else)
d. After attaining the sample, ensure the bottle lid is properly secured
4. Water sample pole
a. To be provided by a member of EHS
b. Used to collect the water sample
c. Ensure the sampling bottle is properly secured before attempting to attain a sample. If a
bottle falls off the pole, contact a member of EHS to have the bottle removed, do not try
to remove the bottle by oneself.
d. Only extend the pole when necessary and be aware of people and objects when handling
the sampling pole so as to not damage persons or equipment

36
5. Flashlight
a. To be provided by a member of EHS
b. Used to see into dark areas of cisterns
6. Sonde
a. To be provided by a member of the sampling team or EHS
b. Used to take basic measurements such as: Temperature, Specific Conductivity,
Dissolved Oxygen concentration, pH, ORP, Conductivity, DO%, Resistivity, Salinity,
Total Dissolved Solids, and BP.
7. Cooler
a. To be provided by a member of the sampling team or EHS
b. Used to control the sample at 4°C until the sample can be sent to a testing facility
Contingency Plan
1. If someone falls into the manhole while sampling the local fire department should be
immediately contacted via 911. The caller will indicate to the fire department that this is a
“confined space rescue”
2. One person will be designated as the “emergency caller” before the sampling takes place
3. The other members of the team should attempt to contact the person inside the cistern and
assess the situation as necessary and take the appropriate emergency actions
4. Contact EHS at 919-962-5507
5. Anyone who comes into contact with the water will wash their hands or wash the affected
area as soon as practical
Notifications
1. A member of EHS must be present when the sampling is to take place
2. Before the work is performed, EHS must be notified
*A member of the sampling team will be notified of these safety procedures prior to performing the
work by having a brief field safety meeting to make sure everyone is aware of the safety
requirements.