Embed Size (px)
Citation preview

Ultraviolet Light inWater and Wastewater
Sanitation

L1603_frame_FM Page ii Tuesday, March 19, 2002 10:52 AM
LEWIS PUBLISHERS
A CRC Press CompanyBoca Raton London New York Washington, D.C.
Ultraviolet Light inWater and Wastewater
Sanitationby
Willy J. Masschelein, Ph.D.
Edited for English byRip G. Rice, Ph.D.
This book contains information obtained from authentic and highly regarded sources. Reprinted materialis quoted with permission, and sources are indicated. A wide variety of references are listed. Reasonableefforts have been made to publish reliable data and information, but the author and the publisher cannotassume responsibility for the validity of all materials or for the consequences of their use.
Neither this book nor any part may be reproduced or transmitted in any form or by any means, electronicor mechanical, including photocopying, microfilming, and recording, or by any information storage orretrieval system, without prior permission in writing from the publisher.
The consent of CRC Press LLC does not extend to copying for general distribution, for promotion, forcreating new works, or for resale. Specific permission must be obtained in writing from CRC Press LLCfor such copying.
Direct all inquiries to CRC Press LLC, 2000 N.W. Corporate Blvd., Boca Raton, Florida 33431.
Trademark Notice:
Product or corporate names may be trademarks or registered trademarks, and areused only for identification and explanation, without intent to infringe.
Visit the CRC Press Web site at www.crcpress.com
© 2002 by CRC Press LLC Lewis Publishers is an imprint of CRC Press LLC
No claim to original U.S. Government worksInternational Standard Book Number 1-56670-603-3
Library of Congress Card Number 2002016078Printed in the United States of America 1 2 3 4 5 6 7 8 9 0
Printed on acid-free paper
Library of Congress Cataloging-in-Publication Data
Masschelein, W.[Utilisation des U.V. dans le traitement des eaux. English]Ultraviolet light in water and wastewater sanitation / Willy J. Masschelein, Rip G. Rice.
p. cm.Includes bibliographical references and index.ISBN 1-56670-603-3 (alk. paper)1. Water--Purification--Ultraviolet treatment. 2. Sewage--Purification--Ultraviolet
treatment. I. Rice, Rip G. II. Title.
TD460 .M4 2002628.1
′
662--dc21 2002016078
L1603_frame_FM Page iv Tuesday, March 19, 2002 10:52 AM
Preface
Only a few books are available on the subjects of ultraviolet (UV) radiation and itsindustrial applications in water treatment and sanitation, or on general aspects thatmay be related to these applications. Refer to books by: [Ellis, 1941; Jagger, 1967;Guillerme, 1974; Kiefer, 1977; Phillips, 1983; Braun, 1986]; and some overview papersexist on UV application to water sanitation; refer to [Gelzhäuser, 1985; Masschelein,1991, 1996].
A few overview documents also exist [Jepson, 1973; U.S. Department of Com-merce, 1979; Scheible, 1985; Gelzhäuser, 1985; Masschelein, 1991, 1996;
J. WaterSupply—AQUA
, 1992]. In 1997, the Water Environmental Federation (WEF) pub-lished a digest on disinfection in which UV (mainly for wastewater treatment) isreported extensively.
Using animal infectivity as a method of evaluation has indicated that
Cryptospo-ridium parvum
oocysts may be inactivated significantly by UV irradiation in watertreatment. (For further details, see Chapter 3, Table 9.) This finding has thrust UVtreatment into the forefront of potable water treatment.
In 1999, the U.S. Environmental Protection Agency (EPA) organized a workshopon UV disinfection of drinking water [U.S. EPA, 1999]. In December 2000, theNational Water Research Institute (NWRI), in collaboration with the American WaterWorks Association Research Foundation (AWWARF) published
Ultraviolet Disin-fection Guidelines for Drinking Water and Water Reuse
[NWRI, 2000]. In June 2001, the International Ultraviolet Association (IUVA) held its first
International Congress on Ultraviolet Technologies, and the proceedings of thatconference [IUVA, 2001] contain many papers on the subject of drinking water dis-infection with UV radiation. Furthermore, numerous papers, often also more or lesscommercially oriented presentations, are available on particular aspects of the appli-cation of UV in water treatment.
This text includes discussions of not only disinfection but also removal ofrecalcitrant micropollutants. On the other hand, no recent monograph is currentlyavailable integrating fundamental knowledge, recommendations for design, evalua-tion of performances, and outlooks for this application. Therefore, the goal of thisbook is to integrate fundamental knowledge and operational issues.
For some readers who operate systems in the field, certain chapters may be alittle lengthy and theoretical. In such cases, I invite them to consult the detailed listof key words in the Glossary. The goal also is to specify the underlying principlesof an interesting application that often is still considered as a little empirical in watersanitation practices.
L1603_frame_FM Page v Tuesday, March 19, 2002 10:52 AM

L1603_frame_FM Page vi Tuesday, March 19, 2002 10:52 AM
Acknowledgments
The production of the original monograph in French and published by Techniquede l’Eau was encouraged by BERSON-UV Technology (the Netherlands). I thankthat company for assistance in making an updated monograph available for the purposeof promoting new progress.
The enclosed material is produced privately by the author, who assumes respon-sibility for the opinions or statements of fact expressed on this emerging technology.
Finally, I am deeply grateful to my long-time and very good friend, Dr. Rip G.Rice, for the editorial assistance with this English version.
Willy J. Masschelein
Brussels, Belgium
L1603_frame_FM Page vii Tuesday, March 19, 2002 10:52 AM

L1603_frame_FM Page viii Tuesday, March 19, 2002 10:52 AM
Table of Contents
Chapter 1
Introduction ..........................................................................................1
1.1 Historical: Use of Ultraviolet Light in Drinking Water Treatment ................11.2 Present State of Standards and Regulations ....................................................31.3 Definition of Ultraviolet Light: Range and Natural Sources ..........................4
1.3.1 Definition of Ultraviolet Light.............................................................41.3.2 Ultraviolet Light Ranges......................................................................51.3.3 Disinfection of Water with Ultraviolet Light ......................................7
1.4 Solar Radiant Energy .......................................................................................7
Chapter 2
Available Lamp (or Burner) Technologies ..........................................9
2.1 General .............................................................................................................92.2 Mercury Emission Lamps................................................................................9
2.2.1 Effect of Filler Gas: Penning Mixtures .............................................102.3 Currently Available Commercial Lamp Technologies ..................................13
2.3.1 Low-Pressure Mercury Lamp Technologies......................................132.3.2 Medium-Pressure Lamp Technologies ..............................................132.3.3 High-Pressure Mercury Lamps..........................................................14
2.4 Available Lamp Technologies........................................................................142.4.1 Low Pressure Mercury Lamp Technologies......................................14
2.4.1.1 General Principles...............................................................142.4.1.2 Electrical Feed System .......................................................162.4.1.3 Factors Influencing Emitted Intensity ................................17
2.4.1.3.1 Voltage ..............................................................172.4.1.3.2 Temperature ......................................................172.4.1.3.3 Aging of Lamps................................................19
2.4.1.4 Typical Emission Spectrum................................................192.4.1.5 Photochemical Yield ...........................................................20
2.4.2 Medium- and High-Pressure Mercury Lamp Technologies..............222.4.2.1 General ................................................................................222.4.2.2 Emission of UV Light ........................................................232.4.2.3 Voltage Input vs. UV Output..............................................242.4.2.4 Aging...................................................................................27
2.5 Special Lamp Technologies ...........................................................................282.5.1 Flat Lamp Technologies.....................................................................282.5.2 Indium- and Yttrium-Doped Lamps ..................................................312.5.3 Carrier Gas Doped Lamps .................................................................32
2.5.3.1 Xenon Discharge Lamps ....................................................32
L1603_frame_FM Page ix Tuesday, March 19, 2002 10:52 AM
2.5.3.2 Deuterium Carrier Gas Discharge ......................................332.5.3.3 Metal Halide Lamps ...........................................................342.5.3.4 Xenon Flash-Output Lamps ...............................................342.5.3.5 Broadband Pulsed UV Systems .........................................362.5.3.6 Excimer Lamps...................................................................36
2.5.3.6.1 Excimer Technology in the UV-C Range ........362.5.3.6.2 Excimer Technology in the Vacuum
UV Range .........................................................372.6 Preliminary Guidelines for Choice of Lamp Technology.............................38
2.6.1 Low-Pressure Mercury Lamps...........................................................382.6.2 Medium-Pressure Mercury Lamps ....................................................392.6.3 Particular Lamp Technologies ...........................................................39
2.7 Ultraviolet Emission Yields and Mode of Control........................................392.7.1 Materials of Lamp Walls and Enclosures..........................................392.7.2 Transmission–Reflection Yields of Optical Materials .......................402.7.3 Precipitation of Deposits (Slimes).....................................................422.7.4 Transmission–Reflectance by Water ..................................................442.7.5 Radiometry .........................................................................................442.7.6 Optical Filters.....................................................................................452.7.7 Spectral Radiometry (Photocells) ......................................................46
2.7.7.1 Specific Photocells..............................................................462.7.7.2 Nonspecific Photocells........................................................47
2.7.8 Actinometry........................................................................................472.7.8.1 Mineral Salt Actinometers..................................................512.7.8.2 Iodide-Iodate UV Actinometer ...........................................522.7.8.3 Persulfate
tert
-Butanol UV Actinometer............................532.7.8.4 Uridine Actinometry ...........................................................542.7.8.5 Hydrogen Peroxide Decomposition as an
Actinometric Check-Control Method.................................542.8 Zonal Distribution of Emitted Light..............................................................54
Chapter 3
Use of Ultraviolet Light for Disinfection of Drinking Water ..............................................................................59
3.1 Introduction ....................................................................................................593.2 Germicidal Action ..........................................................................................60
3.2.1 Germicidal Action Curves .................................................................603.2.2 Mechanism of Disinfection................................................................603.2.3 Potential Effects on Proteins and Amino Acids ................................64
3.2.3.1 What Can Represent UV Absorbance of Bacterial Proteins? .........................................................65
3.2.3.2 What Can Represent Cellular DNA (RNA)Concentration in Terms of QuantitativeAbsorption of UV? .............................................................66
3.2.3.3 Conclusions.........................................................................663.2.4 Evaluation of Germicidal Efficiency of Lamps.................................67
L1603_frame_FM Page x Tuesday, March 19, 2002 10:52 AM

3.3 Dose-Efficiency Concept ...............................................................................683.3.1 Basic Equations..................................................................................683.3.2 Methods of Determination of Lethal Dose .......................................69
3.3.2.1 Collimator Method..............................................................693.3.2.2 Correction for UV Exposure Cup Size ..............................713.3.2.3 Shallow-Bed Reactor ..........................................................71
3.3.3 Reported Values of D
10
......................................................................723.3.4 Effect of Water Temperature..............................................................763.3.5 Effect of pH........................................................................................76
3.4 Representative Test Organisms ......................................................................763.5 Competitive Effects in Disinfection with Ultraviolet Light..........................76
3.5.1 Competitive Absorption by Components of Drinking Water ..............................................................................76
3.5.2 Steering Parameters............................................................................773.5.3 Importance of Dissolved Compounds ...............................................783.5.4 Use of Artificial Optical Interferences in Investigations...................79
3.6 Multihit, Multisite, and Step-by-Step Killing Concepts ...............................813.7 Design Factors for Reactor Geometry...........................................................85
3.7.1 General ...............................................................................................853.7.2 Single-Lamp Reactors........................................................................863.7.3 Multiple-Lamp Reactors ....................................................................90
3.8 Mixing Conditions in Ultraviolet Water Treatment ......................................983.8.1 Basic Principles..................................................................................983.8.2 General Hydraulic Conditions ...........................................................993.8.3 Testing of Flow-Through Patterns .....................................................993.8.4 Longitudinal or Transverse Mounting of Lamps ............................100
3.9 Operational Control of Efficiency ...............................................................1003.9.1 Direct Control ..................................................................................1003.9.2 Permanent Monitoring .....................................................................1013.9.3 Extended Control .............................................................................104
3.10 Tentative Design Questionnaire for Ultraviolet-Based Disinfection Units for Drinking Water .............................................................................1053.10.1 General ...........................................................................................1053.10.2 Definition of Performance Required .............................................1063.10.3 Elements of Qualification and Tendering......................................106
3.10.3.1 General Presentation of the Offer ..................................1063.10.3.2 Operational Guarantee ....................................................1073.10.3.3 Cost Parameters ..............................................................1073.10.3.4 References.......................................................................1073.10.3.5 Other Aspects..................................................................107
3.11 Examples ......................................................................................................1083.11.1 Source du Pavillon at Spontin, Belgium .......................................1083.11.2 Imperia, Italy..................................................................................1103.11.3 Zwijndrecht, the Netherlands ........................................................1103.11.4 Roosteren, the Netherlands............................................................1103.11.5 Méry-sur-Oise, France ...................................................................112
L1603_frame_FM Page xi Tuesday, March 19, 2002 10:52 AM
Chapter 4
Use of Ultraviolet in Photochemical Synergistic Oxidation Processes in Water Sanitation ..........................................................113
4.1 Basic Principles............................................................................................1134.1.1 General .............................................................................................1134.1.2 Characteristics of •OH Radicals Related
to Water Treatment...........................................................................1164.1.3 Analytical Evidence of •OH Radicals
in Water Treatment...........................................................................1184.1.4 Reactions of Hydroxyl Radicals with Organic
Compounds in Aqueous Solution ....................................................1194.1.4.1 Recombination to Hydrogen Peroxide .............................1194.1.4.2 Hydrogen Abstraction.......................................................1194.1.4.3 Electrophilic Addition.......................................................1194.1.4.4 Electron Transfer Reactions .............................................119
4.2 Combinations of Hydrogen Peroxide and Ultraviolet Light.......................1204.2.1 General Aspects................................................................................1204.2.2 Effects of Nitrate Ion Concentration ...............................................1224.2.3 Reported Data on Ultraviolet Synergistic Oxidation
with Hydrogen Peroxide ..................................................................1254.3 Synergism of Ozone and Ultraviolet Light in Water Sanitation.................126
4.3.1 Decomposition of Ozone by Ultraviolet Irradiation .......................1264.3.2 Practical Evidence............................................................................127
4.3.2.1 Mixed-Phase Systems.......................................................1274.3.2.2 Homogeneous-Phase Systems ..........................................128
4.3.3 Costs .................................................................................................1294.3.4 Technological Generation of Ozone by Ultraviolet
Irradiation of Oxygen (or Air) .........................................................1294.4 Ultraviolet Catalytic Processes ....................................................................1304.5 Tentative Design Rules for Ultraviolet Synergistic
Oxidation Processes .....................................................................................132
Chapter 5
Use of Ultraviolet Light for Sanitation of Wastewater ...................135
5.1 Regulations and Guidelines for Disinfection of Treated Wastewater..................................................................................135
5.2 General Characteristics of Effluents in Relation to Disinfection by Ultraviolet Light .....................................................................................137
5.3 Aftergrowth and Photorepair after Exposure to Ultraviolet Disinfection of Wastewater ..........................................................................140
5.4 Applied Ultraviolet Doses in Wastewater Disinfection...............................1425.5 Choice of Lamp Technology in Wastewater Disinfection ..........................1455.6 Toxicity and Formation of By-Products ......................................................1465.7 Preliminary Conclusions on Wastewater Disinfection
with Ultraviolet ............................................................................................1465.8 Example........................................................................................................147
L1603_frame_FM Page xii Tuesday, March 19, 2002 10:52 AM

Chapter 6
General Conclusions ........................................................................149
Glossary
................................................................................................................151
References
.............................................................................................................155
Index
......................................................................................................................163
L1603_frame_FM Page xiii Tuesday, March 19, 2002 10:52 AM

L1603_frame_FM Page xiv Tuesday, March 19, 2002 10:52 AM
1
Introduction
Critical aspects for the wider application of ultraviolet (UV) light in drinking watertreatment sometimes have been described, in spite of the success of the method asestablished in the field:
• Absence of well-established and generally accepted design rules• Absence of a permanently active residual agent in the treated water• Suspicions of the possible photochemical formation of by-products• Possibility of revival–reactivation by repair mechanisms of irradiated
organisms• Need for operational control of the permanent reliability of the technique
The purpose of this publication is to analyze these concerns and to presentextensive information (integrating both fundamental aspects and applications) onthe currently available UV technologies applicable to water treatment. These tech-nologies include:
• Lamp technologies available, criteria of evaluation, and choice of tech-nology
• Fundamental principles applicable• Performance criteria for disinfection• Design criteria and methods• Outlook to synergistic use of UV
+
oxidants• Functional requirements and potential advantages and drawbacks of the
technique
1.1 HISTORICAL: USE OF ULTRAVIOLET LIGHT IN DRINKING WATER TREATMENT
UV radiation can be used for the improvement of drinking water quality. Presently,disinfection is the primary purpose of applying UV irradiation in water treatment.The technical method was introduced by drinking water facilities in the beginningof the twentieth century.
1
L1603_Frame_C01 Page 1 Tuesday, March 5, 2002 5:21 PM
2
Ultraviolet Light in Water and Wastewater Sanitation
The bactericidal effect of sunlight radiant energy was first reported by Downesand Blunt [1877]. However, the UV part of the sunlight that reaches the earth surfaceis merely confined to wavelengths higher than 290 nm. The so-called “Boston sunlighton a cloudy day,” has a total intensity of 340 W/m
2
. However, the instant irradiationthat depends on the height of the sun can vary by a factor of 2 to 100. At 30
°
the totalintensity is about 50% higher in high mountains than on flat lands at sea level [Kiefer,1977]. In addition, only less than 10% of the total sunlight intensity that reaches thesurface of the earth is UV light, with little active radiation for water disinfection availablefrom this percentage. Therefore, UV disinfection is essentially a technological processfor use in water treatment.
The first large-scale application of UV light, at 200 m
3
/day, for drinking waterdisinfection was in Marseille, France from 1906 to 1909 [Anon., 1910; Clemence,1911]. This application was followed by a UV disinfection of groundwater for thecity of Rouen, France. However, considerable discussions and controversy occurredon the comparative benefit of UV vs. filtration [Anon., 1911]. The applications ofUV for water sanitation were delayed in Europe during World War I.
In the United States, the first full-scale application of UV light in 1916 wasreported for 12,000 inhabitants of Henderson, Kentucky [Smith, 1917]. Other appli-cations began in Berea, Ohio (1923); Horton, Kansas (1923); and Perrysburg, Ohio(1928). The application of UV in the United States are referenced in early publica-tions of Walden and Powell [1911], von Recklinghausen [1914], Spencer [1917],Fair [1920], and Perkins and Welch [1930].
All these applications were abandoned in the late 1930s. The reasons wereunknown but presumably costs, maintenance of the equipment, and aging of thelamps (which at that time, were not fully assessed) were determinants. Disinfectionwith chlorine probably was preferred for more easy operation and for lower cost atthat time. During the 1950s, the UV technique moved into full development again.Kawabata and Harada [1959] reported on necessary disinfecting doses.
In Europe today, over 3000 drinking water facilities use disinfection based onUV irradiation. In Belgium, the first full-scale application was installed and operatedin Spontin for the village of Sovet in 1957 and 1958. It is still in operation (seeChapter 3). New applications and technologies are continuously examined anddeveloped. Most of the applications in Europe concerned drinking water or clearwater systems, including ultrapure water for pharmaceutical and medical applica-tions. Contrary to those in the United States and Canada, the application to waste-water remained rare, but innovations are under way.
As far as drinking water is concerned, up to 1980 the information on the useof UV in the United States was anecdotal [Malley, 1999]. The EPA Surface WaterTreatment Rule (SWTR) of 1989 did not indicate UV as the best availabletechnology for inactivation of
Giardia lamblia
. The proposed Groundwater Dis-infection Rule (GWDR) [U.S. EPA, 2000], however, includes UV as a possibletechnology.
Since 1990, joint research efforts have been made by American Water WorksAssociation (AWWA) and the AWWA Research Foundation (AWWARF). In 1998,it was demonstrated that UV could be appropriate for inactivation of oocysts of
Cryptosporidium parvum
.
L1603_Frame_C01 Page 2 Tuesday, March 5, 2002 5:21 PM

Introduction
3
In 1986 and 1996, the European Committee of the International Ozone Associ-ation organized a symposium [Masschelein, 1986, 1996] on the use of ozone, UV,and also potential synergisms of ozone and UV for water sanitation. The same topicswere on the agenda of the IOA Conference at Wasser, Berlin in 2000. At present,the use of these techniques is a major development, perhaps more in the field ofwastewater treatment than directly for drinking water, although direct treatment ofraw water sources becomes attractive.
Following the developments of ozone–UV, the possibilities of UV in conjunctionwith hydrogen peroxide and catalysts with UV are actively under examination.Although the applications of these new technologies still remain limited as far asdrinking water is concerned, their areas of development include removal of difficultmicropollutants (such as herbicides, organochlorine compounds, and polycyclicaromatic hydrocarbons), disinfection, and less formation of by-products.
1.2 PRESENT STATE OF STANDARDS AND REGULATIONS
Only a limited number of official regulations exist for performance-related criteriaapplicable to UV units for drinking water treatment. At present, in Europe, onlyAustria officially requires 450 J/m
2
of UV-C irradiation for the disinfection ofpublicly supplied drinking water [Austria Önorm, 2001].
In Germany, the German Association of Manufacturers of Equipment for WaterTreatment (FIGAWA) has published recommendations [FIGAWA, 1987]. Besidesgiving technical descriptions, these guidelines also recommend applying a minimumappropriate UV dose of 250 J/m
2
. The Deutsches Verein von Gas and Wasserfachmännern (DVGW) has issued
recommendations (Arbeitsblatt W 29-4-1997), formulating technical guidelines, par-ticularly concerning the monitoring, and also stipulating a minimum dose of 400 J/m
2
.The different recommendations are the basis of some point-of-use applications, forexample, for railway trains transporting passengers. Further work is ongoing at DVGWand also at the German Standardization Institute (DIN). It is likely that the Germanstandard will conform with the requirements in Austria.
No DIN standard exists (yet) on the application of UV in water treatment. Forgeneral photochemical purposes, refer to the standard DIN-5031-10-1996: Strahl-ungsphysik im optischen Bereich und Lichttechnik. Other national recommendedrequirements are Norway, 160 J/m
2
; and France, 250 J/m
2
. Also the KIWA in theNetherlands has recommended 250 J/m
2
as a minimum dose. At present no project is under way for a Comité Européen de Normalization
(CEN) standard on application of UV in drinking water treatment. However, the issueis under evaluation in different national groups (e.g., DVGW in Germany). An oldergeneral recommendation in the United States was an irradiation dose of 240 J/m
2
[Huff, 1965]. Most European countries (including Belgium) rely on this value as arecommendation.
Similar requirements have been formulated for the application of UV disinfectionof drinking water onboard ships. In 1966, the U.S. Department of Health, Education
L1603_Frame_C01 Page 3 Tuesday, March 5, 2002 5:21 PM
4
Ultraviolet Light in Water and Wastewater Sanitation
and Welfare (DHEW) (now the Department of Health and Human Services) proposeda minimum guideline of 160 J/m
2
for this application, at all points within the disin-fection chamber (see also, UK Regulation 29(6) [1973]; and Germany [1973] Vol. 2,Kap.4 [1973]). The application is supposed to be carried out on clear water, pre-treated for turbidity and color if required.
The U.S. National Sanitation Foundation (NSF) and American National Stan-dards Institute (ANSI) and NSF Standard 55-1991 define two criteria:
Point-of-use
—A dose of 380 J/m
2
is considered safe for disinfection of virusesand bacteria; and 4 log removal of viruses. (The standard also requires thatthe reactor is validated by the disinfection of challenging bacteria: either
Saccharomyces cerevisiae
or
Bacillus subtilis
.)
Point-of-entry
—A dose of 160 J/m
2
is required for supplemental disinfectionof municipally treated and disinfected water.
The U.S. EPA SWTR requires a UV dose of 210 and 360 J/m
2
to achieve anabatement of hepatitis virus A (HAV) of 2 and 3 logs, respectively. Most of thestates in the United States require compliance with the ANSI and NSF standardrequirements mentioned earlier. Exceptions are New Jersey, Pennsylvania, and Utah,which specify a dose of 160 J/m
2
. Sometimes a filtration step is required prior tothe UV disinfection. AWWA recommends an irradiation dose of 400 J/m
2
for thedirect use of UV by small municipal systems.
The Council Directive 91/271/European Economic Community (EEC) concern-ing urban wastewater treatment does not explicitly require disinfection to be part ofthe treatment. The requirements are to be defined by local authorities consideringthe local reuse of the water. Some details are further indicated in Chapter 4.
1.3 DEFINITION OF ULTRAVIOLET LIGHT: RANGE AND NATURAL SOURCES
1.3.1 D
EFINITION
OF
U
LTRAVIOLET
L
IGHT
UV is part of electromagnetic waves. Historically, the nature of light has been thesubject of considerable discussion. Newton (1642 to 1727) formulated the corpus-cular theory of light, whereas Huyghens (1629 to 1695) promoted the wave theory.The differences in concepts led to considerable analyses in the nineteenth century.The wave theory was supported by the concepts of Maxwell (1831 to 1879), whodeveloped the electromagnetic theory of light, stating that light is composed ofelectric and magnetic field vectors, orthogonal to each other and constantly traversethe direction of undulary propagation.
The whole discussion came to an end in 1900 when Planck (1858 to 1947)associated and quantified the concept that the photon was associated with the lightwaves. Newton had shown that white light could be decomposed into visible con-stituent colors by a prism. However, the visible part of the electromagnetic wavespectrum is only a very small part of the total (Figure 1).
In 1801, using experiments blending sunlight with filters to eliminate the visiblecomponents (and also infrared [IR] and higher wavelengths), Ritter was able to show
L1603_Frame_C01 Page 4 Tuesday, March 5, 2002 5:21 PM

Introduction
5
that reduced silver could be produced on irradiation of silver chloride with invisiblelight of a shorter wavelength than the visible part of the electromagnetic spectrum.One way of blending is by the glass of Wood, which is a glass containing oxides ofnickel and cobalt, opaque to visible radiations but transmitting part of the UV rays.This part is called UV-A (Figure 1).
In 1804, Young established the principle of interference with invisible light asdetected by paper impregnated with silver chloride. The similar nature of UV lightand visible light (interferences of Newton) was therefore established. This alsoprovided an early way of characterizing the wavelengths involved.
1.3.2 U
LTRAVIOLET
L
IGHT
R
ANGES
Ultraviolet light electromagnetic radiation ranges between 400 and 10 nm, and issubdivided into several regions. The range of invisible UV light is establisheddownward from 400-nm wavelengths. As a first stage of evidence, existence couldbe produced only down to 320 nm, because no optical glass was available to transmitphotons of lower wavelengths.
In 1862, Stokes was able to use quartz to extend the perception to 183 nm. Fromthis wavelength downward, oxygen and nitrogen were known to absorb the light.However, Schumann extended the range of observation to 120 nm by using fluorineoptics and placing the spectrograph under vacuum. At the beginning of this century,Lyman (1906, 1916, cited in Gladstone, 1955, p. 39) could analyze the solar spectrumdown to 5.1 nm when using gratings.
The following classification is more or less empirical but integrates the historyof discovery of different UV ranges with the chemical and physiological effects of UV:
FIGURE 1
Range of electromagnetic waves.
Type Range Comment
UV-A From 400 to 315 nm Between 400 and 300 nm, sometimes called near UV UV-B From 315 to 280 nm Sometimes called medium UV UV-C From 280 to 200 nm Range to be considered in more detail in water disinfection
FARULTRAVIOLET
ULTRAVIOLET
VISIBLE
VISIBLE
VIOLET
VIO
LET
RED
COSMICRAYS
GAMMARAYS
X-RAYS
INFRA-RED
RADIOWAVES
X-RAYSSCHUMANN
ZONESHORTWAVES
LONGWAVES
NANOMETERS (Extended portion of UV)0.1 100 200
220 280315
VIDE C B A
300 400
BROWNING
L1603_Frame_C01 Page 5 Tuesday, March 5, 2002 5:21 PM
6
Ultraviolet Light in Water and Wastewater Sanitation
From 300 to 200 nm the light is also called far UV. From 200 to 185 nm there issome kind of “no man’s land” in the definitions. In the vacuum UV light range,several zones are named for their discoverers, as follows:
Range of Schumann, from 185 to 120 nm Range of Lyman, from 120 to 50 nmRange of Millikan, from 50 to 10 nm
Under 10 nm, the region of x-rays starts; and at lower wavelengths (under 0.1 nm),the
γ
-ray region begins. The whole range of UV light wavelengths is called
actinic waves
, also knownas
chemical waves
, in opposition to the
thermic waves
of a higher frequency. Actinicwavelengths involve energies that are able to provoke direct chemical changes inthe irradiated molecules (activation, ionization, dissociation, etc.), and to promotebiological changes in the systems accordingly.
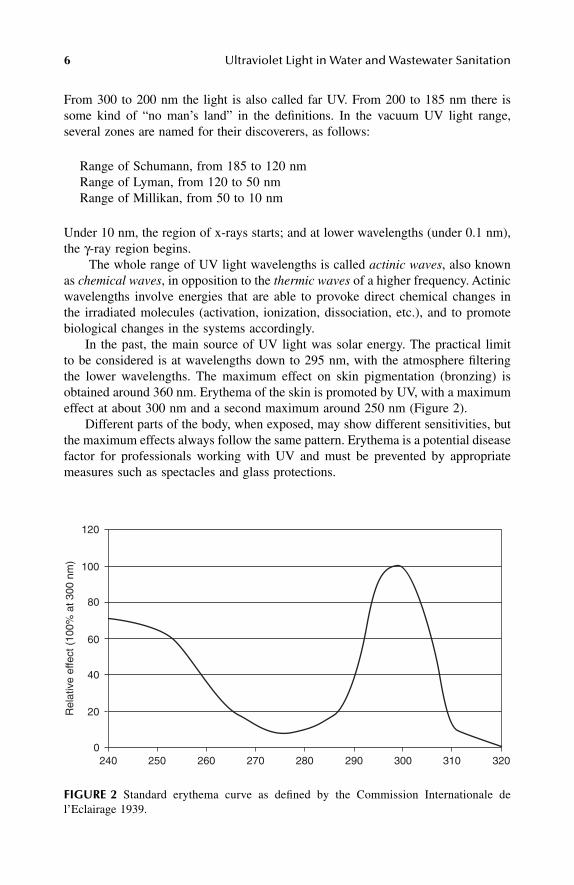
In the past, the main source of UV light was solar energy. The practical limitto be considered is at wavelengths down to 295 nm, with the atmosphere filteringthe lower wavelengths. The maximum effect on skin pigmentation (bronzing) isobtained around 360 nm. Erythema of the skin is promoted by UV, with a maximumeffect at about 300 nm and a second maximum around 250 nm (Figure 2).
Different parts of the body, when exposed, may show different sensitivities, butthe maximum effects always follow the same pattern. Erythema is a potential diseasefactor for professionals working with UV and must be prevented by appropriatemeasures such as spectacles and glass protections.
FIGURE 2
Standard erythema curve as defined by the Commission Internationale del’Eclairage 1939.
Rel
ativ
e ef
fect
(10
0% a
t 300
nm
)
0240 250 260 270 280 290 300 310 320
20
40
60
80
100
120
L1603_Frame_C01 Page 6 Tuesday, March 5, 2002 5:21 PM
Introduction
7
1.3.3 D
ISINFECTION
OF
W
ATER
WITH
U
LTRAVIOLET
L
IGHT
The practice of water disinfection with UV light is mainly concerned with theUV-C range, which means that the optical equipment needs to be as transparent aspossible. Quartz remains the best option. Interest is growing in the UV-B range thatis able to photolyze proteic and other cellular material (see Chapter 3, Table 7 andChapter 4).
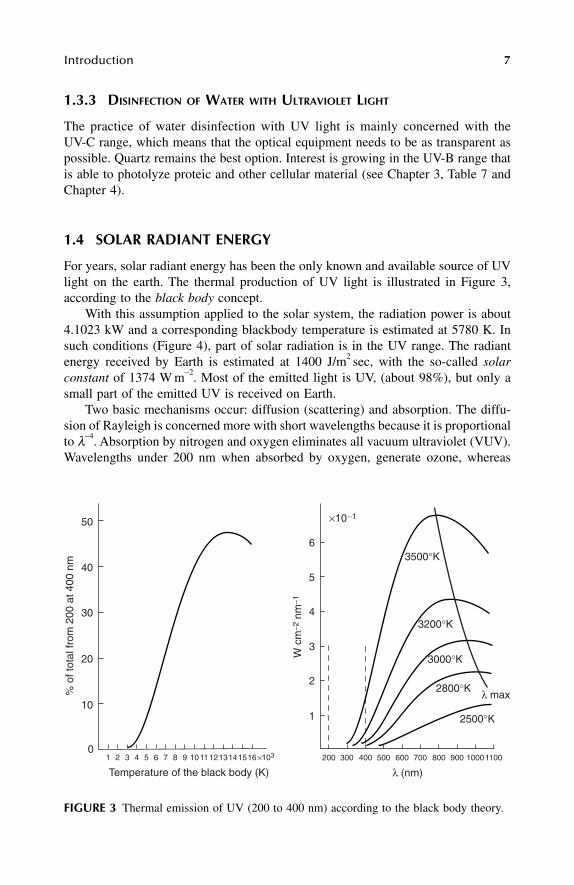
1.4 SOLAR RADIANT ENERGY
For years, solar radiant energy has been the only known and available source of UVlight on the earth. The thermal production of UV light is illustrated in Figure 3,according to the
black body
concept. With this assumption applied to the solar system, the radiation power is about
4.1023 kW and a corresponding blackbody temperature is estimated at 5780 K. Insuch conditions (Figure 4), part of solar radiation is in the UV range. The radiantenergy received by Earth is estimated at 1400 J/m
2
sec, with the so-called
solarconstant
of 1374 W m
−
2
. Most of the emitted light is UV, (about 98%), but only asmall part of the emitted UV is received on Earth.
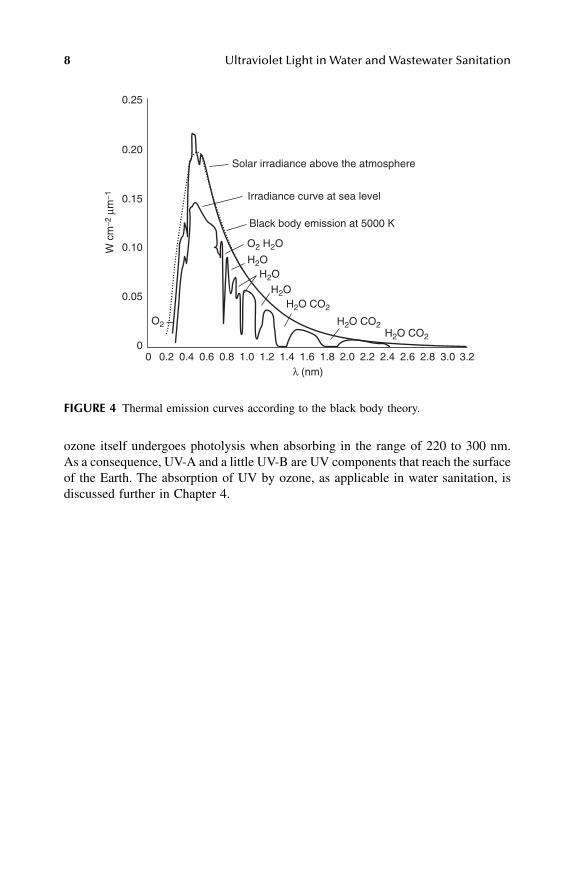
Two basic mechanisms occur: diffusion (scattering) and absorption. The diffu-sion of Rayleigh is concerned more with short wavelengths because it is proportionalto
λ
−
4
. Absorption by nitrogen and oxygen eliminates all vacuum ultraviolet (VUV).Wavelengths under 200 nm when absorbed by oxygen, generate ozone, whereas
FIGURE 3
Thermal emission of UV (200 to 400 nm) according to the black body theory.
1 200 300 400 500 600 700 800 900 100011002 3 4 5 6 7 8 9 10111213141516×103
×10−1
0
101
2
3
4
5
63500°K
3200°K
3000°K
2800°K
2500°K
% o
f tot
al fr
om 2
00 a
t 400
nm
20
30
40
50
λ (nm)
λ max
Temperature of the black body (K)
W c
m−2
nm
−1
L1603_Frame_C01 Page 7 Tuesday, March 5, 2002 5:21 PM
8
Ultraviolet Light in Water and Wastewater Sanitation
ozone itself undergoes photolysis when absorbing in the range of 220 to 300 nm.As a consequence, UV-A and a little UV-B are UV components that reach the surfaceof the Earth. The absorption of UV by ozone, as applicable in water sanitation, isdiscussed further in Chapter 4.
FIGURE 4
Thermal emission curves according to the black body theory.
Solar irradiance above the atmosphere
Irradiance curve at sea level
Black body emission at 5000 K
O2 H2O
O2
H2OH2O
H2OH2O CO2
H2O CO2H2O CO2
00
0.2 0.4 0.6 0.8 1.0 1.2 1.4 1.6 1.8 2.0 2.2 2.4 2.6 2.8 3.0 3.2λ (nm)
0.05
0.10
0.15
0.20
0.25W
cm
−2 µ
m−1
L1603_Frame_C01 Page 8 Tuesday, March 5, 2002 5:21 PM
9
Available Lamp (or Burner) Technologies
2.1 GENERAL
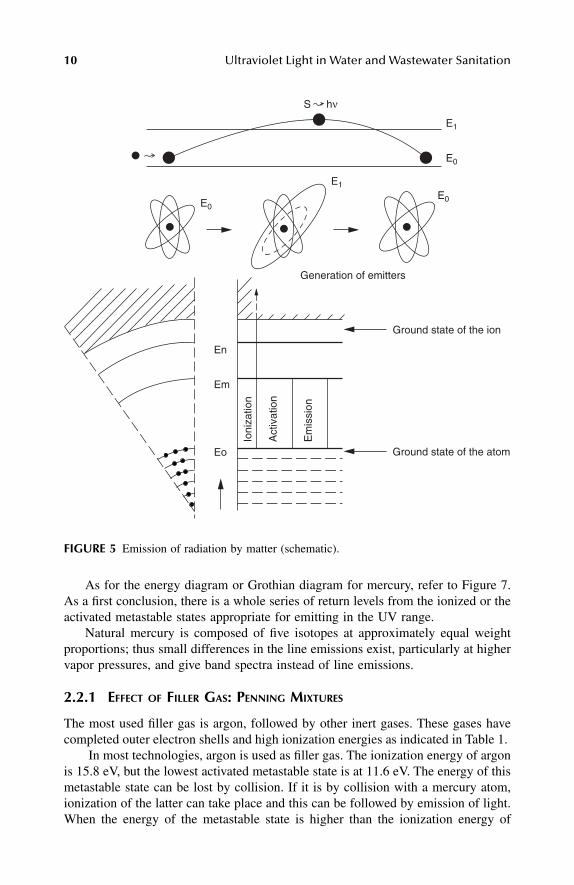
Light can be generated by activating electrons to a higher orbital state of an element;the return of that activated species to lower energy states is accompanied by theemission of light. The process is schematically illustrated in Figure 5.
The quantitative aspects are expressed as
E
1
−
E
0
=
h
ν
. In other words, wave-lengths obtained depend on the energy difference between the activated state andthe return state.
Thermal activation of matter provides a means of production of light. Accordingto the black body concept, the
total
radiant power depends on the temperature of thematter and is quantified by the Stefan–Boltzmann law:
P
(
T
)
=
sT
4
, where
P
(
T
) is thetotal radiant power in watts, radiated into one hemisphere (2
π
-solid angle) by unitsurface at
T
Kelvin. The Stefan–Boltzmann constant (
s
) equals 5.6703
×
10
−
12
W cm
−
2
.However, the emissivity obtained depends on the wavelengths of interest. Black bodyradiation is not a major source of technological generation of ultraviolet (UV) light,but cannot be entirely neglected in existing lamps either.
2.2 MERCURY EMISSION LAMPS
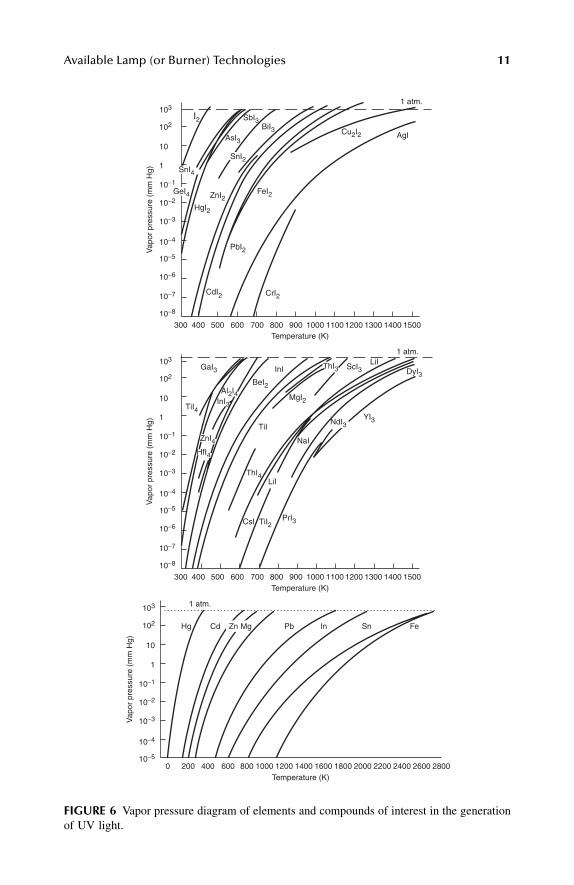
Activation (or ionization) of mercury atoms by electrons (i.e., electrical discharges) atpresent is by far the most important technology in generating ultraviolet (UV) lightas applicable to water disinfection. The reasons for the prevalence of mercury are thatit is the most volatile metal element for which activation in the gas phase can beobtained at temperatures compatible with the structures of the lamps. Moreover, it hasan ionization energy low enough to enable the so-called “avalanche effect,” which isa chain reaction underlying the electrical discharge. A vapor pressure diagram is givenin Figure 6.
Activation–ionization by collision with electrons and return to a lower energystate (e.g., the ground state) is the principle of production of light in the system (seeFigure 5).
2
L1603_frame_C02 Page 9 Tuesday, March 5, 2002 5:23 PM
10
Ultraviolet Light in Water and Wastewater Sanitation
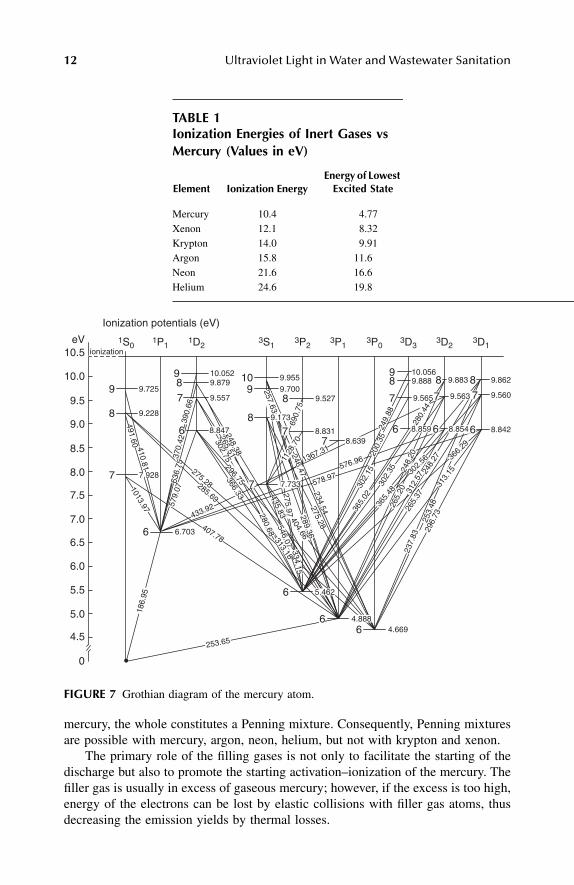
As for the energy diagram or Grothian diagram for mercury, refer to Figure 7.As a first conclusion, there is a whole series of return levels from the ionized or theactivated metastable states appropriate for emitting in the UV range.
Natural mercury is composed of five isotopes at approximately equal weightproportions; thus small differences in the line emissions exist, particularly at highervapor pressures, and give band spectra instead of line emissions.
2.2.1 E
FFECT
OF
F
ILLER
G
AS
: P
ENNING
M
IXTURES
The most used filler gas is argon, followed by other inert gases. These gases havecompleted outer electron shells and high ionization energies as indicated in Table 1.
In most technologies, argon is used as filler gas. The ionization energy of argonis 15.8 eV, but the lowest activated metastable state is at 11.6 eV. The energy of thismetastable state can be lost by collision. If it is by collision with a mercury atom,ionization of the latter can take place and this can be followed by emission of light.When the energy of the metastable state is higher than the ionization energy of
FIGURE 5
Emission of radiation by matter (schematic).
Ground state of the ion
Generation of emitters
Ground state of the atom
Ioni
zatio
n
Act
ivat
ion
Em
issi
on
Eo
E0E0
E0
E1
E1
S hν
Em
En
L1603_frame_C02 Page 10 Tuesday, March 5, 2002 5:23 PM
Available Lamp (or Burner) Technologies
11
FIGURE 6
Vapor pressure diagram of elements and compounds of interest in the generationof UV light.
30010−8
10−7
10−6
10−5
10−4
10−3
10−2
10−1
1
10
102
103
400 500 600 700 800 900 1000 1100 1200 1300 1400 1500
Vap
or p
ress
ure
(mm
Hg)
30010−8
10−7
10−6
10−5
10−4
10−3
10−2
10−1
1
10
102
103
400 500 600 700 800 900 1000 1100 1200 1300 1400 1500
Vap
or p
ress
ure
(mm
Hg)
Temperature (K)
Temperature (K)
0 200 400 600 800 1000 1200 1400 1600 1800 2000 2200 2400 2600 2800Temperature (K)
1 atm.
1 atm.
1 atm.
DyI3
YI3
PrI3
BiI3
SbI3
AsI3
ZnI2
10−5
10−4
10−3
10−2
10−1
1
10
102
103
HgI2
I2
ThI3 ScI3LiI
TiI2
CrI2
Hg Cd Zn Mg Pb
CdI2
PbI2
FeI2
BeI2
MgI2
ThI4LiI
InI
CsI
TiI
GaI3
Al2I4
Cu2I2
TiI4InI3
NaI
AgIV
apor
pre
ssur
e (m
m H
g)
In Sn Fe
GeI4
SnI4
SnI2
HfI4
NdI3
ZnI4
L1603_frame_C02 Page 11 Tuesday, March 5, 2002 5:23 PM
12
Ultraviolet Light in Water and Wastewater Sanitation
mercury, the whole constitutes a Penning mixture. Consequently, Penning mixturesare possible with mercury, argon, neon, helium, but not with krypton and xenon.
The primary role of the filling gases is not only to facilitate the starting of thedischarge but also to promote the starting activation–ionization of the mercury. Thefiller gas is usually in excess of gaseous mercury; however, if the excess is too high,energy of the electrons can be lost by elastic collisions with filler gas atoms, thusdecreasing the emission yields by thermal losses.
TABLE 1Ionization Energies of Inert Gases vs Mercury (Values in eV)
Element Ionization EnergyEnergy of Lowest
Excited State
Mercury 10.4 4.77Xenon 12.1 8.32Krypton 14.0 9.91Argon 15.8 11.6Neon 21.6 16.6Helium 24.6 19.8
FIGURE 7
Grothian diagram of the mercury atom.
987
10.0529.879
8 9.228
7 7.928
9 9.7259.557
10
89
9.9559.700
9 10.0568 9.888
7 9.565
7
7
8.639
7.733
7 9.563
6 8.8546 8.859
9.527
8 9.173
690.
75
7 8.831 6 8.842
8 9.8628 9.883
7 9.560
8.847
6 6.703
6
66 4.669
Ionization potentials (eV)
ionizationeV 1S0
1P11D2
3S13P2
3P13P0
3D33D2
3D110.5
10.0
9.5
9.0
8.5
8.0
7.5
7.0
6.5
6.0
5.5
5.0
4.5
0
275.28285.69
407.78
433.92579.
071013.97
491.60 410.8129
6.73
237.
83
253.65
186.
95
253.
4831
3.15
312.
57
302.
35
302.
15
265.
37
365.
48
365.
02
265.
20234.54275.28
275.97280.68313.18
334.15
546.07404.66
289.36
435.83
366.33
296.75
302.75265.51
248.38
257.63
248.
27
248.
2028
0.44
249.
88
200.
35
576.961367.31
1128
.70
246.47
370.
4239
0.66
636.
75
578.97
366.2
9
302.5
6
4.888
5.462
6
L1603_frame_C02 Page 12 Tuesday, March 5, 2002 5:23 PM
Available Lamp (or Burner) Technologies
13
2.3 CURRENTLY AVAILABLE COMMERCIAL LAMP TECHNOLOGIES
2.3.1 L
OW
-P
RESSURE
M
ERCURY
L
AMP
T
ECHNOLOGIES
Mercury lamps are operated at different mercury-gas pressures. The low-pressuremercury lamp for the generation of UV normally is operated at a nominal
total gaspressure
in the range of 10
2
to 10
3
Pa (0.01 to 0.001 mbar), the carrier gas is inexcess in a proportion of 10 to 100. In low-pressure Hg lamps, liquid mercury alwaysremains present in excess at the thermic equilibrium conditions installed.
2.3.2 M
EDIUM
-P
RESSURE
L
AMP
T
ECHNOLOGIES
The medium-pressure mercury lamp operates at a total gas pressure range of 10 to30 MPa (1 to 3 bar). Normally, in medium-pressure mercury lamps, no liquidmercury is permanently present in excess at nominal operating conditions.
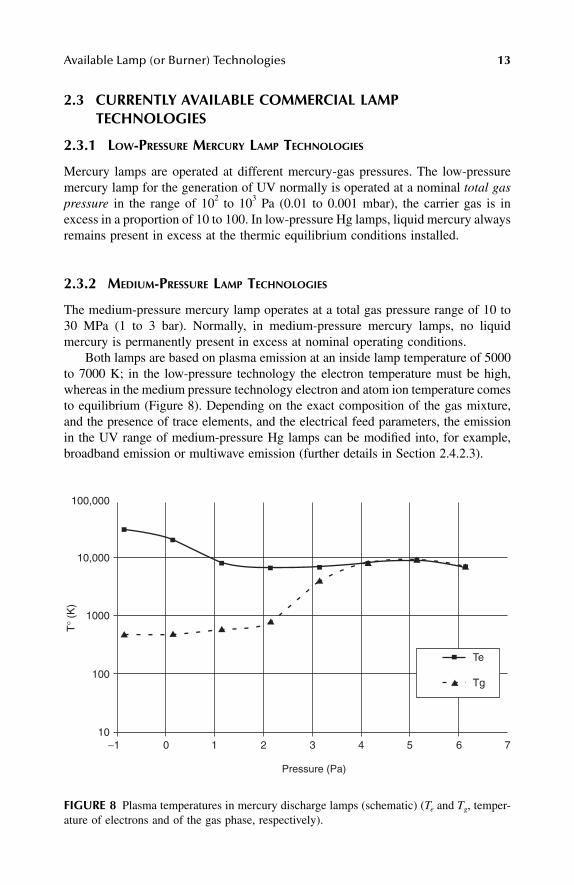
Both lamps are based on plasma emission at an inside lamp temperature of 5000to 7000 K; in the low-pressure technology the electron temperature must be high,whereas in the medium pressure technology electron and atom ion temperature comesto equilibrium (Figure 8). Depending on the exact composition of the gas mixture,and the presence of trace elements, and the electrical feed parameters, the emissionin the UV range of medium-pressure Hg lamps can be modified into, for example,broadband emission or multiwave emission (further details in Section 2.4.2.3).
FIGURE 8
Plasma temperatures in mercury discharge lamps (schematic) (
T
e
and
T
g
, temper-ature of electrons and of the gas phase, respectively).
Te
Tg
10−1 0 1 2 3 4 5 6 7
100
1000
10,000
100,000
Pressure (Pa)
T° (
K)
L1603_frame_C02 Page 13 Tuesday, March 5, 2002 5:23 PM
14
Ultraviolet Light in Water and Wastewater Sanitation
2.3.3 H
IGH
-P
RESSURE
M
ERCURY
L
AMPS
High-pressure mercury lamps are used less in water treatment. Such lamps operateat pressures (total), up to 10
6
Pa (10 atm), emitting continuous spectra less appro-priate for specific applications like water disinfection or specific photochemicalreactions.
2.4 AVAILABLE LAMP TECHNOLOGIES
The next sections specifically report on the low- and medium-pressure mercurylamps and secondarily on special lamp technologies. Flash-output lamps and excimerlamps are interesting developments, but no significant applications have been foundyet for large-scale water treatment.
Note:
Some confusion exists in the literature in the pressure terminology of UVlamps. In actinic applications, a field to which water treatment also belongs,the classification is low-pressure; medium-pressure, and eventually high-pressure. When illumination is concerned, one finds low-pressure, high-pressure, and less termed as very high-pressure as corresponding labels.That is why in the practical field of application in water treatment, medium-pressure and high-pressure mercury lamps correspond to the same concept.
2.4.1 L
OW
-P
RESSURE
M
ERCURY
L
AMP
T
ECHNOLOGIES
2.4.1.1 General Principles
In low-pressure technology, the partial pressure of mercury inside the lamp is about1 Pa (10
−
5
atm). This corresponds to the vapor pressure of liquid mercury at anoptimum temperature of 40
°
C at the lamp wall. The most simple way to representthe process of generation is to consider the ionization of atomic mercury by transferof kinetic energy from electrons upon inelastic collisions with the mercury atoms:
Hg
+
e
=
2e
+
Hg
+
In theory, the proportion of ionized mercury atoms is proportional to the electrondensity in the discharge current. However, electron–ion recombinations can occuras well, thus reconstituting the atomic mercury. The whole of the ionization processinvolves a series of steps in which the Penning effect of the filler gas is important,particularly during the starting or ignition period of the lamp:
e
+
Ar
=
Ar
∗
(
+
e)
Ar
∗
(
+
e)
+
Hg
=
Hg
+
+
e
+
Ar
At a permanent regime of discharge, the electrons in the low-pressure mercuryplasma do not have enough kinetic energy to provoke direct ionization in one singlestep, and several collisions are necessary with formation of intermediate excited
L1603_frame_C02 Page 14 Tuesday, March 5, 2002 5:23 PM
Available Lamp (or Burner) Technologies
15
mercury atoms:
e
+
Hg
=
Hg
∗
(e)
Hg
∗
(e)
+
e
=
2e
+
Hg
+
The reaction by which a photon is emitted corresponds to:
Hg
∗
(excited state)
→
Hg (ground state)
+
h
ν
or
Hg
∗
(excited state)
→
Hg
∗
(less excited state)
+
h
ν
The permissible quanta are those indicated in the Grothian diagram for mercury(see Figure 7). The emission of a photon by an atom in an excited electronic stateis reversible; this means that before escaping from the plasma contained in the lampenclosure the emitted photons can be reabsorbed by another mercury atom. Thisphenomenon is called
self-absorption
, and becomes naturally more important whenthe concentration of ions in the gas phase is increased and the pathway of the photonsis longer (higher lamp diameters). For mercury lamps, self-absorption is most impor-tant for the 185- and 253.7-nm lines. Overall, the reversibility in emission–absorptionis translated in the low-Hg pressure technology, by a higher emission rate near thewalls of the lamp than from the inside parts of the plasma.
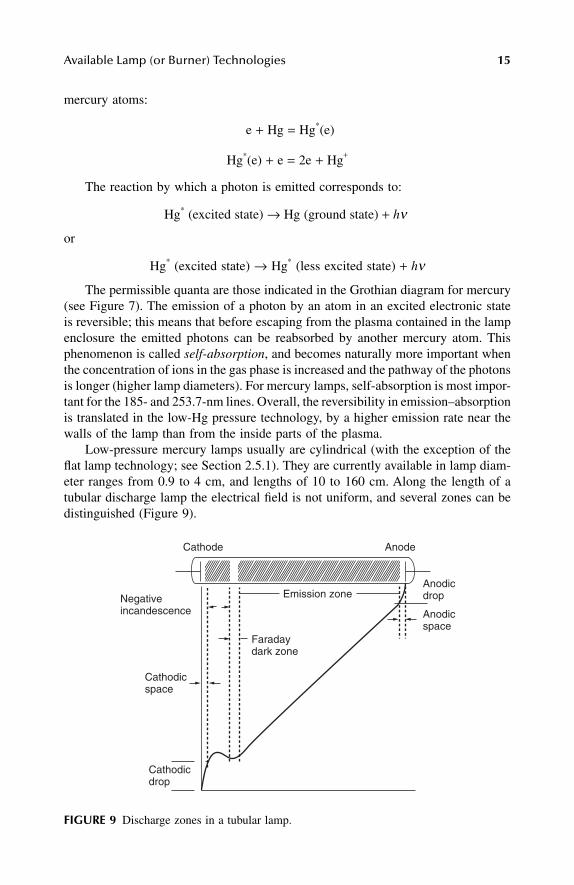
Low-pressure mercury lamps usually are cylindrical (with the exception of theflat lamp technology; see Section 2.5.1). They are currently available in lamp diam-eter ranges from 0.9 to 4 cm, and lengths of 10 to 160 cm. Along the length of atubular discharge lamp the electrical field is not uniform, and several zones can bedistinguished (Figure 9).
FIGURE 9
Discharge zones in a tubular lamp.
Emission zone
Faradaydark zone
Negativeincandescence
Cathodicspace
Cathodicdrop
Anodicdrop
Anodicspace
AnodeCathode
L1603_frame_C02 Page 15 Tuesday, March 5, 2002 5:23 PM
16
Ultraviolet Light in Water and Wastewater Sanitation
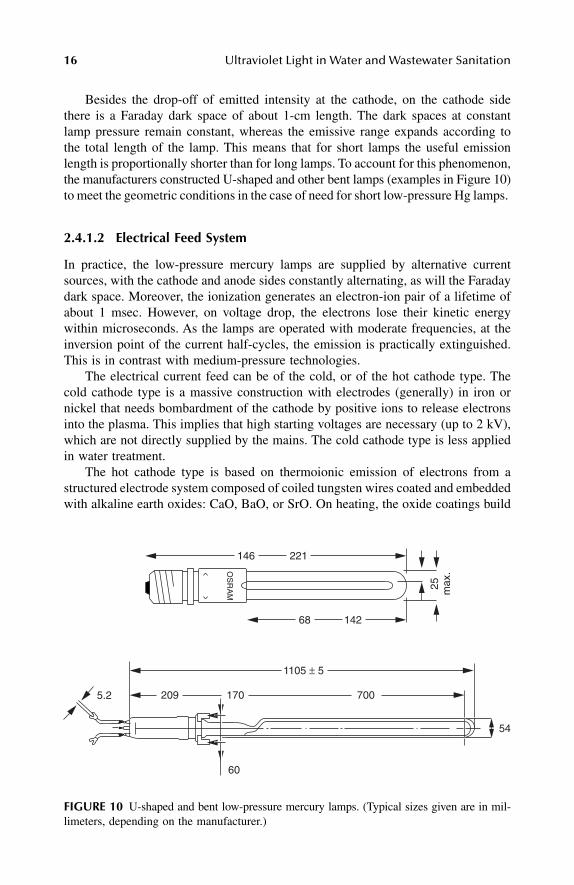
Besides the drop-off of emitted intensity at the cathode, on the cathode sidethere is a Faraday dark space of about 1-cm length. The dark spaces at constantlamp pressure remain constant, whereas the emissive range expands according tothe total length of the lamp. This means that for short lamps the useful emissionlength is proportionally shorter than for long lamps. To account for this phenomenon,the manufacturers constructed U-shaped and other bent lamps (examples in Figure 10)to meet the geometric conditions in the case of need for short low-pressure Hg lamps.
2.4.1.2 Electrical Feed System
In practice, the low-pressure mercury lamps are supplied by alternative currentsources, with the cathode and anode sides constantly alternating, as will the Faradaydark space. Moreover, the ionization generates an electron-ion pair of a lifetime ofabout 1 msec. However, on voltage drop, the electrons lose their kinetic energywithin microseconds. As the lamps are operated with moderate frequencies, at theinversion point of the current half-cycles, the emission is practically extinguished.This is in contrast with medium-pressure technologies.
The electrical current feed can be of the cold, or of the hot cathode type. Thecold cathode type is a massive construction with electrodes (generally) in iron ornickel that needs bombardment of the cathode by positive ions to release electronsinto the plasma. This implies that high starting voltages are necessary (up to 2 kV),which are not directly supplied by the mains. The cold cathode type is less appliedin water treatment.
The hot cathode type is based on thermoionic emission of electrons from astructured electrode system composed of coiled tungsten wires coated and embeddedwith alkaline earth oxides: CaO, BaO, or SrO. On heating, the oxide coatings build
FIGURE 10
U-shaped and bent low-pressure mercury lamps. (Typical sizes given are in mil-limeters, depending on the manufacturer.)
68 142
25 max
.
146 221
1105 ± 5
209 170 700
60
5.2
54
OS
RA
M
L1603_frame_C02 Page 16 Tuesday, March 5, 2002 5:23 PM
Available Lamp (or Burner) Technologies 17
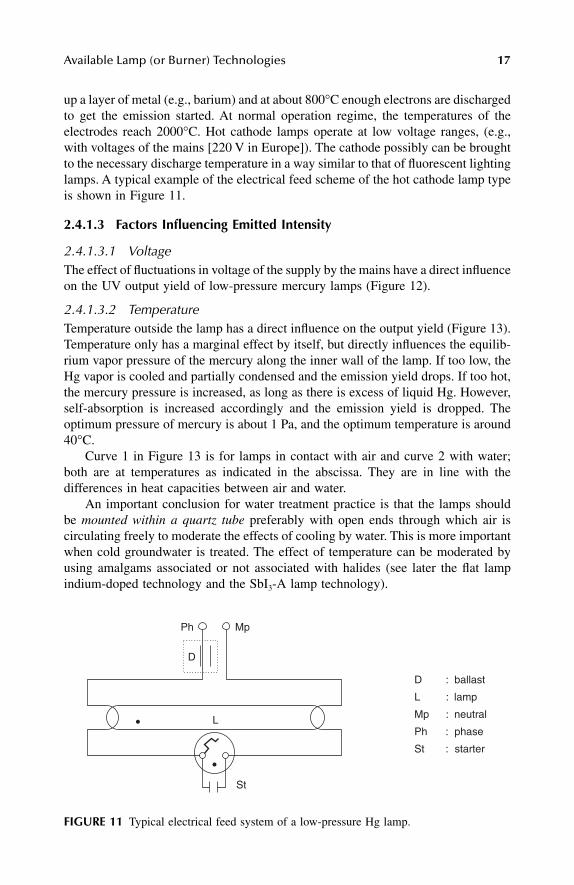
up a layer of metal (e.g., barium) and at about 800°C enough electrons are dischargedto get the emission started. At normal operation regime, the temperatures of theelectrodes reach 2000°C. Hot cathode lamps operate at low voltage ranges, (e.g.,with voltages of the mains [220 V in Europe]). The cathode possibly can be broughtto the necessary discharge temperature in a way similar to that of fluorescent lightinglamps. A typical example of the electrical feed scheme of the hot cathode lamp typeis shown in Figure 11.
2.4.1.3 Factors Influencing Emitted Intensity
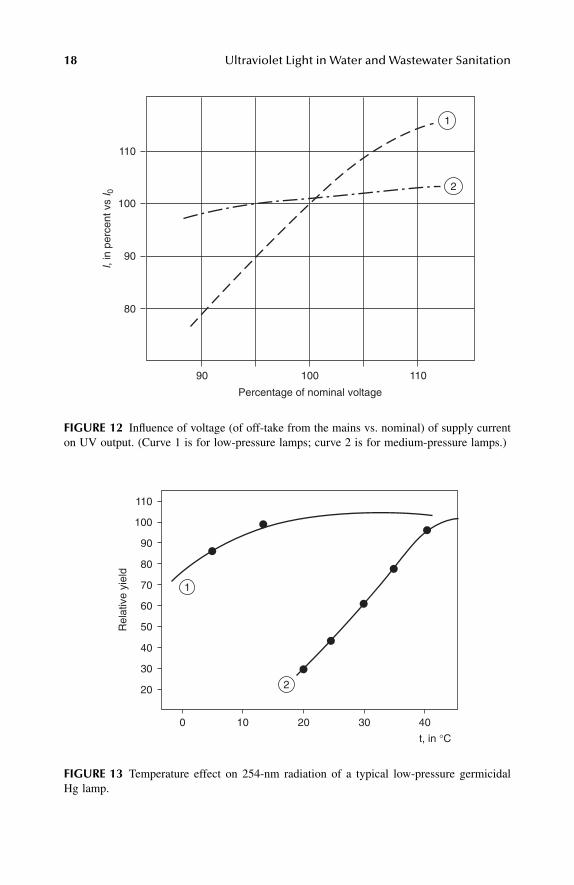
2.4.1.3.1 VoltageThe effect of fluctuations in voltage of the supply by the mains have a direct influenceon the UV output yield of low-pressure mercury lamps (Figure 12).
2.4.1.3.2 TemperatureTemperature outside the lamp has a direct influence on the output yield (Figure 13).Temperature only has a marginal effect by itself, but directly influences the equilib-rium vapor pressure of the mercury along the inner wall of the lamp. If too low, theHg vapor is cooled and partially condensed and the emission yield drops. If too hot,the mercury pressure is increased, as long as there is excess of liquid Hg. However,self-absorption is increased accordingly and the emission yield is dropped. Theoptimum pressure of mercury is about 1 Pa, and the optimum temperature is around40°C.
Curve 1 in Figure 13 is for lamps in contact with air and curve 2 with water;both are at temperatures as indicated in the abscissa. They are in line with thedifferences in heat capacities between air and water.
An important conclusion for water treatment practice is that the lamps shouldbe mounted within a quartz tube preferably with open ends through which air iscirculating freely to moderate the effects of cooling by water. This is more importantwhen cold groundwater is treated. The effect of temperature can be moderated byusing amalgams associated or not associated with halides (see later the flat lampindium-doped technology and the SbI3-A lamp technology).
FIGURE 11 Typical electrical feed system of a low-pressure Hg lamp.
D
D : ballast
L : lamp
Mp : neutral
Ph : phase
St : starter
Ph Mp
St
L
L1603_frame_C02 Page 17 Tuesday, March 5, 2002 5:23 PM
18 Ultraviolet Light in Water and Wastewater Sanitation
FIGURE 12 Influence of voltage (of off-take from the mains vs. nominal) of supply currenton UV output. (Curve 1 is for low-pressure lamps; curve 2 is for medium-pressure lamps.)
FIGURE 13 Temperature effect on 254-nm radiation of a typical low-pressure germicidalHg lamp.
110
110
100
100
Percentage of nominal voltage
I, in
per
cent
vs
I 0
90
90
80
2
1
110
100
90
80
70
60
50
40
40
t, in °C
30
30
20
20100
1
2
Rel
ativ
e yi
eld
L1603_frame_C02 Page 18 Tuesday, March 5, 2002 5:23 PM
Available Lamp (or Burner) Technologies 19
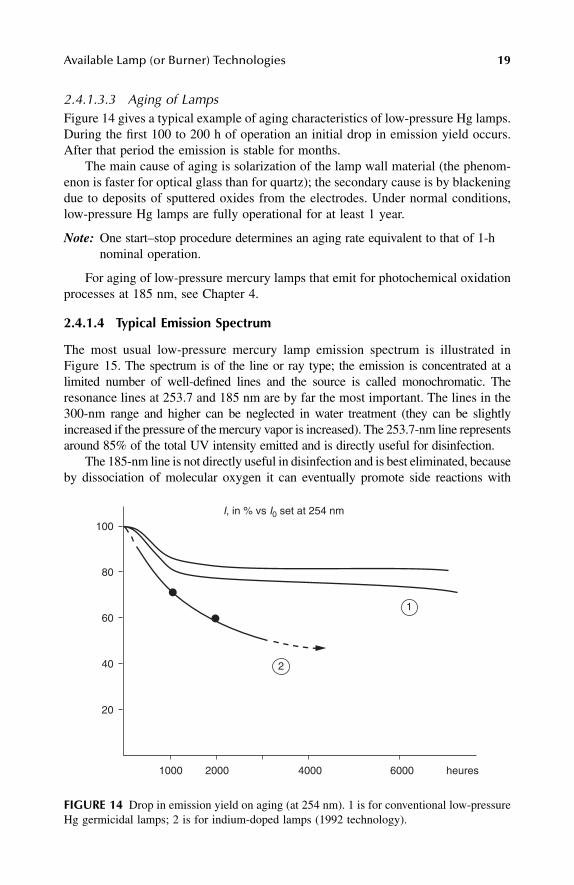
2.4.1.3.3 Aging of Lamps Figure 14 gives a typical example of aging characteristics of low-pressure Hg lamps.During the first 100 to 200 h of operation an initial drop in emission yield occurs.After that period the emission is stable for months.
The main cause of aging is solarization of the lamp wall material (the phenom-enon is faster for optical glass than for quartz); the secondary cause is by blackeningdue to deposits of sputtered oxides from the electrodes. Under normal conditions,low-pressure Hg lamps are fully operational for at least 1 year.
Note: One start–stop procedure determines an aging rate equivalent to that of 1-hnominal operation.
For aging of low-pressure mercury lamps that emit for photochemical oxidationprocesses at 185 nm, see Chapter 4.
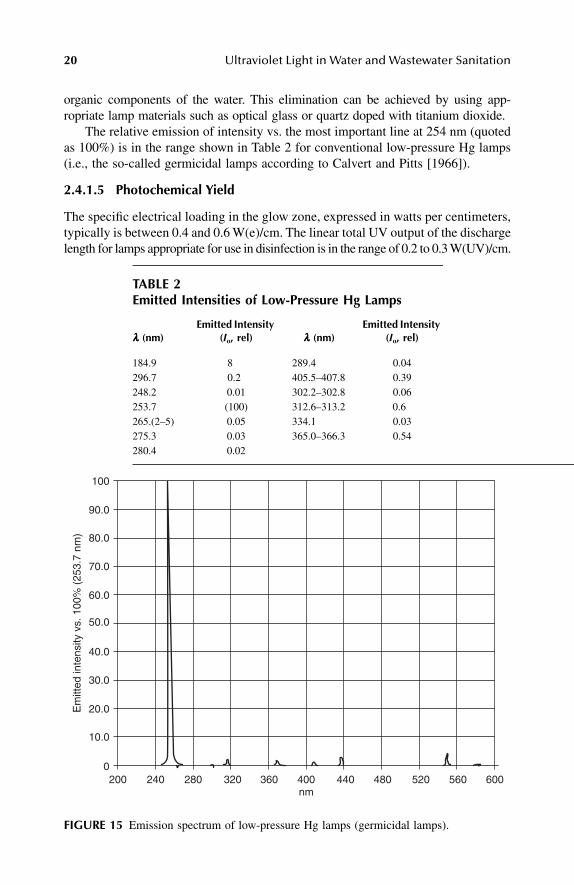
2.4.1.4 Typical Emission Spectrum
The most usual low-pressure mercury lamp emission spectrum is illustrated inFigure 15. The spectrum is of the line or ray type; the emission is concentrated at alimited number of well-defined lines and the source is called monochromatic. Theresonance lines at 253.7 and 185 nm are by far the most important. The lines in the300-nm range and higher can be neglected in water treatment (they can be slightlyincreased if the pressure of the mercury vapor is increased). The 253.7-nm line representsaround 85% of the total UV intensity emitted and is directly useful for disinfection.
The 185-nm line is not directly useful in disinfection and is best eliminated, becauseby dissociation of molecular oxygen it can eventually promote side reactions with
FIGURE 14 Drop in emission yield on aging (at 254 nm). 1 is for conventional low-pressureHg germicidal lamps; 2 is for indium-doped lamps (1992 technology).
1000
20
40
60
80
100
2000 4000 6000 heures
2
1
I, in % vs I0 set at 254 nm
L1603_frame_C02 Page 19 Tuesday, March 5, 2002 5:23 PM
20 Ultraviolet Light in Water and Wastewater Sanitation
organic components of the water. This elimination can be achieved by using app-ropriate lamp materials such as optical glass or quartz doped with titanium dioxide.
The relative emission of intensity vs. the most important line at 254 nm (quotedas 100%) is in the range shown in Table 2 for conventional low-pressure Hg lamps(i.e., the so-called germicidal lamps according to Calvert and Pitts [1966]).
2.4.1.5 Photochemical Yield
The specific electrical loading in the glow zone, expressed in watts per centimeters,typically is between 0.4 and 0.6 W(e)/cm. The linear total UV output of the dischargelength for lamps appropriate for use in disinfection is in the range of 0.2 to 0.3 W(UV)/cm.
TABLE 2Emitted Intensities of Low-Pressure Hg Lamps
λλλλ (nm)Emitted Intensity
(Io, rel) λλλλ (nm)Emitted Intensity
(Io, rel)
184.9 8 289.4 0.04296.7 0.2 405.5–407.8 0.39248.2 0.01 302.2–302.8 0.06253.7 (100) 312.6–313.2 0.6265.(2–5) 0.05 334.1 0.03275.3 0.03 365.0–366.3 0.54280.4 0.02
FIGURE 15 Emission spectrum of low-pressure Hg lamps (germicidal lamps).
0200 240 280 320 360 400 440 480 520 560 600
10.0
20.0
30.0
40.0
50.0
60.0
70.0
80.0
90.0
100
Em
itted
inte
nsity
vs.
100
% (
253.
7 nm
)
nm
L1603_frame_C02 Page 20 Tuesday, March 5, 2002 5:23 PM
Available Lamp (or Burner) Technologies 21
This means that the UV efficiency generally designed by total W(UV) output vs.W(e) input is between 0.25 and 0.45. The energy losses are mainly in the form ofheat (about 90% of them), and emission in the visible (and infrared [IR]) range.
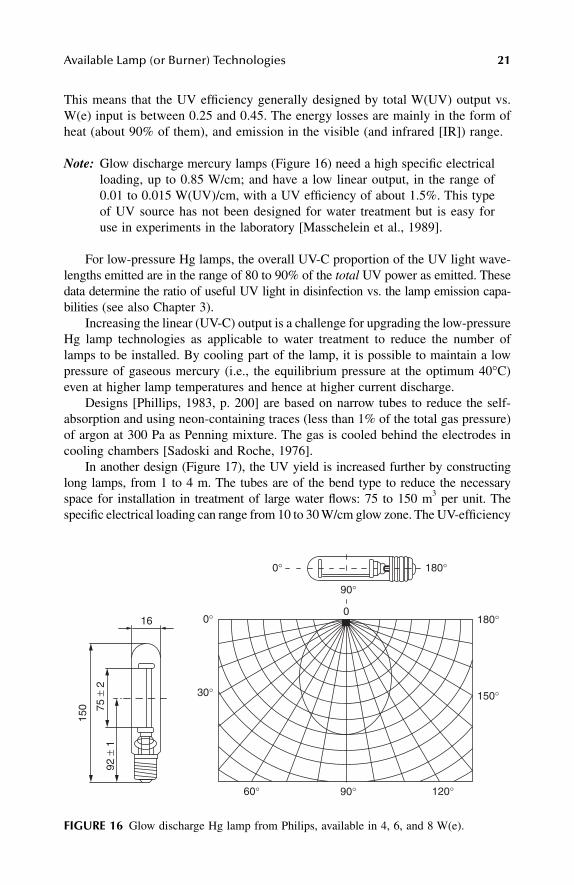
Note: Glow discharge mercury lamps (Figure 16) need a high specific electricalloading, up to 0.85 W/cm; and have a low linear output, in the range of0.01 to 0.015 W(UV)/cm, with a UV efficiency of about 1.5%. This typeof UV source has not been designed for water treatment but is easy foruse in experiments in the laboratory [Masschelein et al., 1989].
For low-pressure Hg lamps, the overall UV-C proportion of the UV light wave-lengths emitted are in the range of 80 to 90% of the total UV power as emitted. Thesedata determine the ratio of useful UV light in disinfection vs. the lamp emission capa-bilities (see also Chapter 3).
Increasing the linear (UV-C) output is a challenge for upgrading the low-pressureHg lamp technologies as applicable to water treatment to reduce the number oflamps to be installed. By cooling part of the lamp, it is possible to maintain a lowpressure of gaseous mercury (i.e., the equilibrium pressure at the optimum 40°C)even at higher lamp temperatures and hence at higher current discharge.
Designs [Phillips, 1983, p. 200] are based on narrow tubes to reduce the self-absorption and using neon-containing traces (less than 1% of the total gas pressure)of argon at 300 Pa as Penning mixture. The gas is cooled behind the electrodes incooling chambers [Sadoski and Roche, 1976].
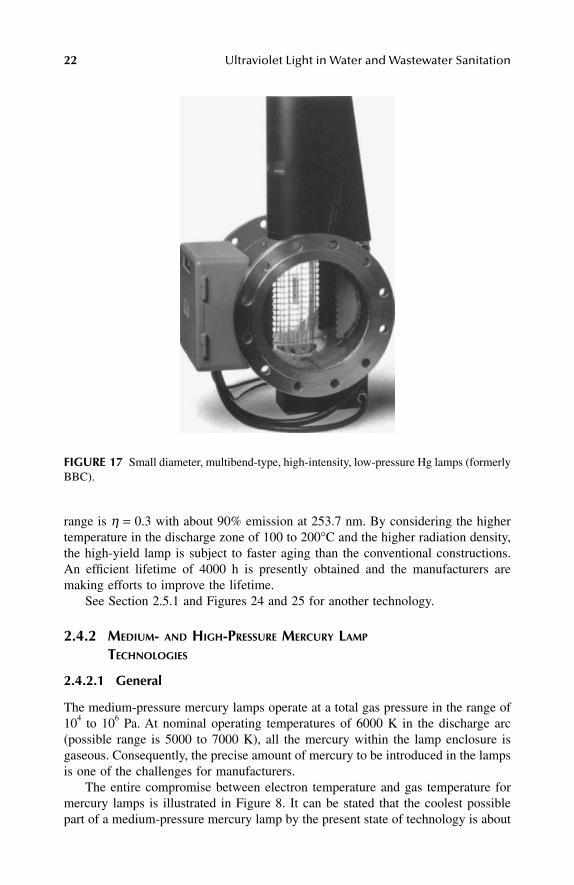
In another design (Figure 17), the UV yield is increased further by constructinglong lamps, from 1 to 4 m. The tubes are of the bend type to reduce the necessaryspace for installation in treatment of large water flows: 75 to 150 m3 per unit. Thespecific electrical loading can range from 10 to 30 W/cm glow zone. The UV-efficiency
FIGURE 16 Glow discharge Hg lamp from Philips, available in 4, 6, and 8 W(e).
16
150
92 ±
175
± 2
0°
0°
30°
60° 90° 120°
150°
180°
180°
90°
0
L1603_frame_C02 Page 21 Tuesday, March 5, 2002 5:23 PM
22 Ultraviolet Light in Water and Wastewater Sanitation
range is η = 0.3 with about 90% emission at 253.7 nm. By considering the highertemperature in the discharge zone of 100 to 200°C and the higher radiation density,the high-yield lamp is subject to faster aging than the conventional constructions.An efficient lifetime of 4000 h is presently obtained and the manufacturers aremaking efforts to improve the lifetime.
See Section 2.5.1 and Figures 24 and 25 for another technology.
2.4.2 MEDIUM- AND HIGH-PRESSURE MERCURY LAMP TECHNOLOGIES
2.4.2.1 General
The medium-pressure mercury lamps operate at a total gas pressure in the range of104 to 106 Pa. At nominal operating temperatures of 6000 K in the discharge arc(possible range is 5000 to 7000 K), all the mercury within the lamp enclosure isgaseous. Consequently, the precise amount of mercury to be introduced in the lampsis one of the challenges for manufacturers.
The entire compromise between electron temperature and gas temperature formercury lamps is illustrated in Figure 8. It can be stated that the coolest possiblepart of a medium-pressure mercury lamp by the present state of technology is about
FIGURE 17 Small diameter, multibend-type, high-intensity, low-pressure Hg lamps (formerlyBBC).
L1603_frame_C02 Page 22 Tuesday, March 5, 2002 5:23 PM
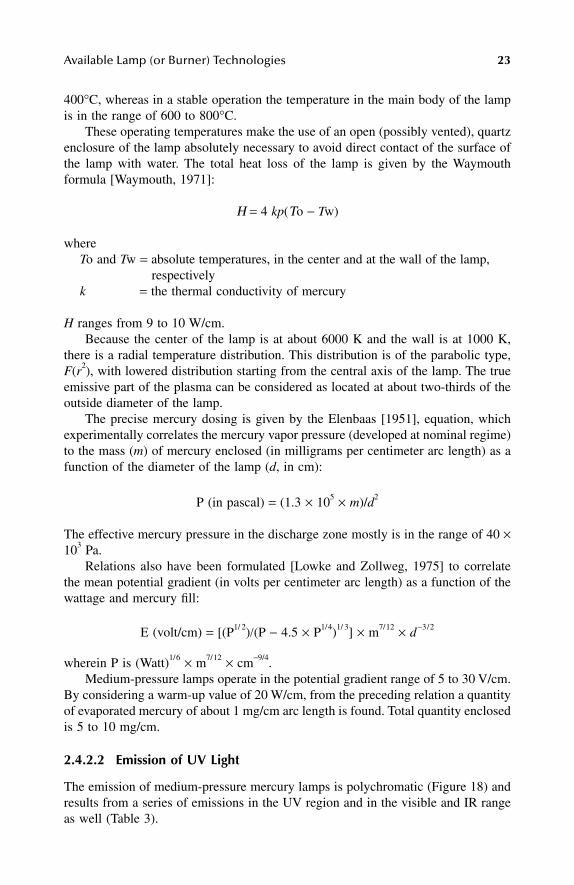
Available Lamp (or Burner) Technologies 23
400°C, whereas in a stable operation the temperature in the main body of the lampis in the range of 600 to 800°C.
These operating temperatures make the use of an open (possibly vented), quartzenclosure of the lamp absolutely necessary to avoid direct contact of the surface ofthe lamp with water. The total heat loss of the lamp is given by the Waymouthformula [Waymouth, 1971]:
Η = 4 kp(Τo − Tw)
whereTo and Tw = absolute temperatures, in the center and at the wall of the lamp,
respectivelyk = the thermal conductivity of mercury
H ranges from 9 to 10 W/cm. Because the center of the lamp is at about 6000 K and the wall is at 1000 K,
there is a radial temperature distribution. This distribution is of the parabolic type,F(r2), with lowered distribution starting from the central axis of the lamp. The trueemissive part of the plasma can be considered as located at about two-thirds of theoutside diameter of the lamp.
The precise mercury dosing is given by the Elenbaas [1951], equation, whichexperimentally correlates the mercury vapor pressure (developed at nominal regime)to the mass (m) of mercury enclosed (in milligrams per centimeter arc length) as afunction of the diameter of the lamp (d, in cm):
P (in pascal) = (1.3 × 10⁵ × m)/d2
The effective mercury pressure in the discharge zone mostly is in the range of 40 ×103 Pa.
Relations also have been formulated [Lowke and Zollweg, 1975] to correlatethe mean potential gradient (in volts per centimeter arc length) as a function of thewattage and mercury fill:
E (volt/cm) = [(P1/ 2)/(P − 4.5 × P1/4)1/ 3] × m7/12 × d−3/2
wherein P is (Watt)1/6 × m7/12 × cm−9/4.Medium-pressure lamps operate in the potential gradient range of 5 to 30 V/cm.
By considering a warm-up value of 20 W/cm, from the preceding relation a quantityof evaporated mercury of about 1 mg/cm arc length is found. Total quantity enclosedis 5 to 10 mg/cm.
2.4.2.2 Emission of UV Light
The emission of medium-pressure mercury lamps is polychromatic (Figure 18) andresults from a series of emissions in the UV region and in the visible and IR rangeas well (Table 3).
L1603_frame_C02 Page 23 Tuesday, March 5, 2002 5:23 PM

24 Ultraviolet Light in Water and Wastewater Sanitation
Note: To optimize the emission in the UV-C range, and consequently the reactionand disinfection capabilities, broadband and multiwave medium-pressurelamps have been developed by Berson. An example of emission in thistechnology is indicated later in Figure 22.
One can also observe a continuum of emission at 200 to 240 nm. This is usuallycut off by the lamp wall material, except if used in the application.
Elenbaas [1951] has measured the total radiant power emitted as a function ofthe electrical power input and proposed two correlations:
P(rad) = 0.72(Pe − 10)
and:
P(rad) = 0.75(Pe − 4.5 Pe(1/4))
The relations confirm the total intensity of irradiance yield of 65%. However, only partof the intensity is in the specific UV range necessary and potentially useful for disinfection.
2.4.2.3 Voltage Input vs. UV Output
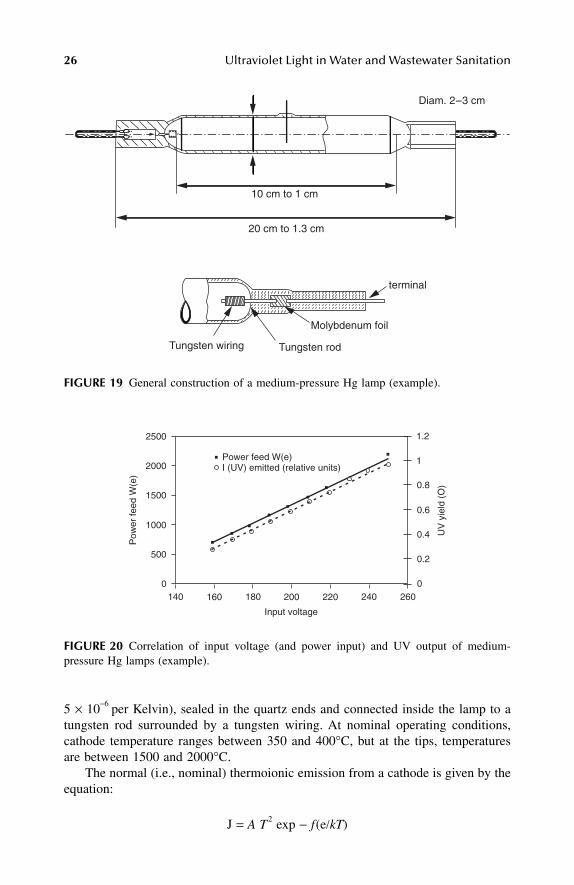
The electrode structure and materials of medium-pressure Hg lamps must meetsevere conditions. The temperature of the cathodes is about 2000°C. The thicknessof the vitreous silica walls is 1 to 2 mm. A schematic diagram of a medium-pressureUV lamp is given in Figure 19.
FIGURE 18 Typical emission spectrum of a medium-pressure Hg lamp (100% emissiondefined at 313 nm).
0200 240 280 320 360 400 440 480 520 560 600
λ (nm)
10.0
20.0
30.0
40.0
50.0
60.0
70.0
80.0
90.0
100
Rel
ativ
e in
tens
ity in
rel
atio
n to
λ (3
13 n
m)
L1603_frame_C02 Page 24 Tuesday, March 5, 2002 5:23 PM

Available Lamp (or Burner) Technologies 25
The UV output is approximately directly proportional to the input voltage thatalso determines (the high voltage) the average power input to the lamps. The cor-relation holds between 160 and 250 V (voltage of the mains). The precise correlation,I vs. W(e), also depends on the ballast and the transformer, but it is important tonote that for a given condition of the hardware, the correlation is about linear.
Small lamps (i.e., up to 4 kW) can be operated on regime by connection to themain current of 220/380 V. A pulse start is necessary with pulse at 3 to 5 kV. Forhigher lamp power, a high potential transformer is necessary. The latter is recom-mended anyway, because it is a method of automatically monitoring the lamp output.On increasing the lamp feed high potential, the UV output is increased accordingly(Figure 20).
In addition, the lamp material must have a low thermal expansion coefficient(5 × 10⁻⁷ per Kelvin). In present technologies, electrode connections consist of thinsheets of molybdenum (thickness less than 75 µm; thermal expansion coefficient
TABLE 3Main Spectral Bands Emitted by a Medium-Pressure Hg Lamp
Relative Intensity
λλλλ (nm) Hg Activated State (eV) a b c
248.3 9.879–9.882 46 28 21253–260 4.888 5 43 32265.3 9.557–9.560 10 43 32269.9 10.056 10 12 9280.3 9.888 10 24 18296.7 8.847 20 30 23302.3 9.560–9.565 40 48 36313 8.847–8.854 100 75 56365 8.847–8.859 71–90 100 75404.7 7.733 39 36 27407.8 7.928 6 8 6435.8 7.733 68 71 53546.1 7.733 80 88 65577 8.854 82 — —579 8.847 83 78 59
Note: Transitions according the Grothius diagram.
a Setting 100% at the 313-nm line (typical lamp Philips HTQ-14); 100% corresponds to200 W (UV) output in a 5-nm range 310 to 315 nm.b Setting 100% at the 365-nm line (Original-Hanau Mitteldruckstrahler). (In this tech-nology a continuum emission of about 10% vs. the 365-nm line exists in the range of200 to 240 nm.)c For comparison of the yield of b vs. the earlier reference a, one must apply a correctionfactor of 0.75.
L1603_frame_C02 Page 25 Tuesday, March 5, 2002 5:23 PM
26 Ultraviolet Light in Water and Wastewater Sanitation
5 × 10⁻⁶ per Kelvin), sealed in the quartz ends and connected inside the lamp to atungsten rod surrounded by a tungsten wiring. At nominal operating conditions,cathode temperature ranges between 350 and 400°C, but at the tips, temperaturesare between 1500 and 2000°C.
The normal (i.e., nominal) thermoionic emission from a cathode is given by theequation:
J = A T2 exp − f(e/kT)
FIGURE 19 General construction of a medium-pressure Hg lamp (example).
FIGURE 20 Correlation of input voltage (and power input) and UV output of medium-pressure Hg lamps (example).
10 cm to 1 cm
20 cm to 1.3 cm
terminal
Molybdenum foil
Tungsten rodTungsten wiring
Diam. 2–3 cm
Power feed W(e)I (UV) emitted (relative units)
Pow
er fe
ed W
(e)
2500
2000
1500
1000
500
0140 160 180 200 220 240 260
Input voltage
UV
yie
ld (
O)
0
0.2
0.4
0.6
0.8
1
1.2
L1603_frame_C02 Page 26 Tuesday, March 5, 2002 5:23 PM
Available Lamp (or Burner) Technologies 27
whereJ = current density (ampere per square centimeter) T = Kelvin temperaturee = charge of an electron (1.6 × 10⁻¹⁹ C)k = the Boltzmann constant (1.372 × 10²³ J/K)A = emission coefficient of the electrode material, which for pure metals is
in the range of 120 A-cm−2 K−2 f (in eV) = practical work function correlating the thermoionic emission rate for
a given electrode surface. Values for f are 4.5 eV for tungsten. To reduce this high value, oxide-coating is made between the windings of the electrode wires with alkaline earth oxides or thorium oxide. During operation, the oxide is reduced by tungsten conducting to the formation of the native metal [Waymouth, 1971], which moves to the ends of the electrode rod. The work function is diminished accordingly to 3.4 eV for pure thorium, and 2.1 eV for pure barium. However, monolayers of barium on tungsten have a work function of 1.56 eV and thorium on tungsten of 2.63 eV [Smithells, 1976]. This makes the emis-sion coefficients for Ba/W and Th/W ranges 1.5 and 3.0 A cm−2 K−2, respectively. These coefficients enable favorable electrical start con-ditions of the lamps.
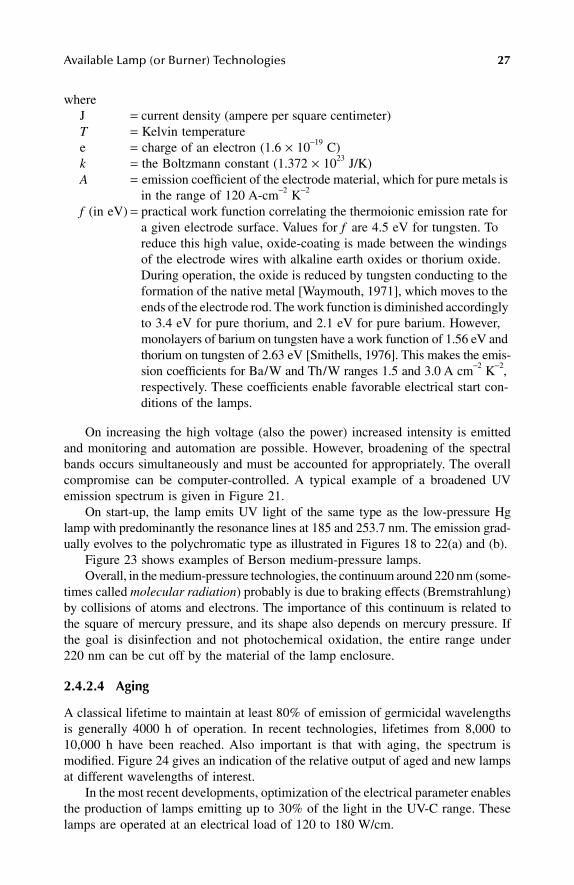
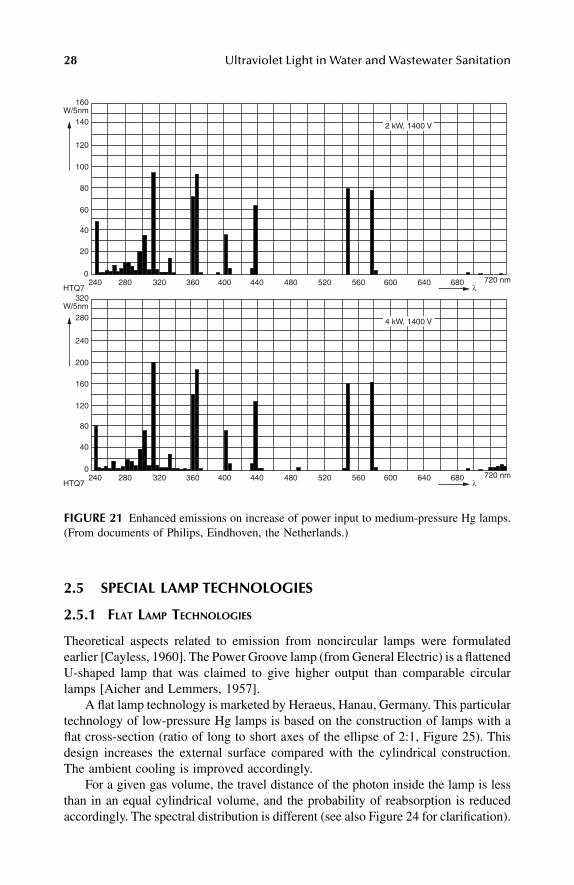
On increasing the high voltage (also the power) increased intensity is emittedand monitoring and automation are possible. However, broadening of the spectralbands occurs simultaneously and must be accounted for appropriately. The overallcompromise can be computer-controlled. A typical example of a broadened UVemission spectrum is given in Figure 21.
On start-up, the lamp emits UV light of the same type as the low-pressure Hglamp with predominantly the resonance lines at 185 and 253.7 nm. The emission grad-ually evolves to the polychromatic type as illustrated in Figures 18 to 22(a) and (b).
Figure 23 shows examples of Berson medium-pressure lamps. Overall, in the medium-pressure technologies, the continuum around 220 nm (some-
times called molecular radiation) probably is due to braking effects (Bremstrahlung)by collisions of atoms and electrons. The importance of this continuum is related tothe square of mercury pressure, and its shape also depends on mercury pressure. Ifthe goal is disinfection and not photochemical oxidation, the entire range under220 nm can be cut off by the material of the lamp enclosure.
2.4.2.4 Aging
A classical lifetime to maintain at least 80% of emission of germicidal wavelengthsis generally 4000 h of operation. In recent technologies, lifetimes from 8,000 to10,000 h have been reached. Also important is that with aging, the spectrum ismodified. Figure 24 gives an indication of the relative output of aged and new lampsat different wavelengths of interest.
In the most recent developments, optimization of the electrical parameter enablesthe production of lamps emitting up to 30% of the light in the UV-C range. Theselamps are operated at an electrical load of 120 to 180 W/cm.
L1603_frame_C02 Page 27 Tuesday, March 5, 2002 5:23 PM
28 Ultraviolet Light in Water and Wastewater Sanitation
2.5 SPECIAL LAMP TECHNOLOGIES
2.5.1 FLAT LAMP TECHNOLOGIES
Theoretical aspects related to emission from noncircular lamps were formulatedearlier [Cayless, 1960]. The Power Groove lamp (from General Electric) is a flattenedU-shaped lamp that was claimed to give higher output than comparable circularlamps [Aicher and Lemmers, 1957].
A flat lamp technology is marketed by Heraeus, Hanau, Germany. This particulartechnology of low-pressure Hg lamps is based on the construction of lamps with aflat cross-section (ratio of long to short axes of the ellipse of 2:1, Figure 25). Thisdesign increases the external surface compared with the cylindrical construction.The ambient cooling is improved accordingly.
For a given gas volume, the travel distance of the photon inside the lamp is lessthan in an equal cylindrical volume, and the probability of reabsorption is reducedaccordingly. The spectral distribution is different (see also Figure 24 for clarification).
FIGURE 21 Enhanced emissions on increase of power input to medium-pressure Hg lamps.(From documents of Philips, Eindhoven, the Netherlands.)
160
140W/5nm
120
100
80
60
40
20
0
2 kW, 1400 V
320
280W/5nm
HTQ7
HTQ7
240
200
160
120
80
40
0240 280 320 360 400 440 480 520 560 600 640 680 720 nm
4 kW, 1400 V
λ
240 280 320 360 400 440 480 520 560 600 640 680 720 nmλ
L1603_frame_C02 Page 28 Tuesday, March 5, 2002 5:23 PM
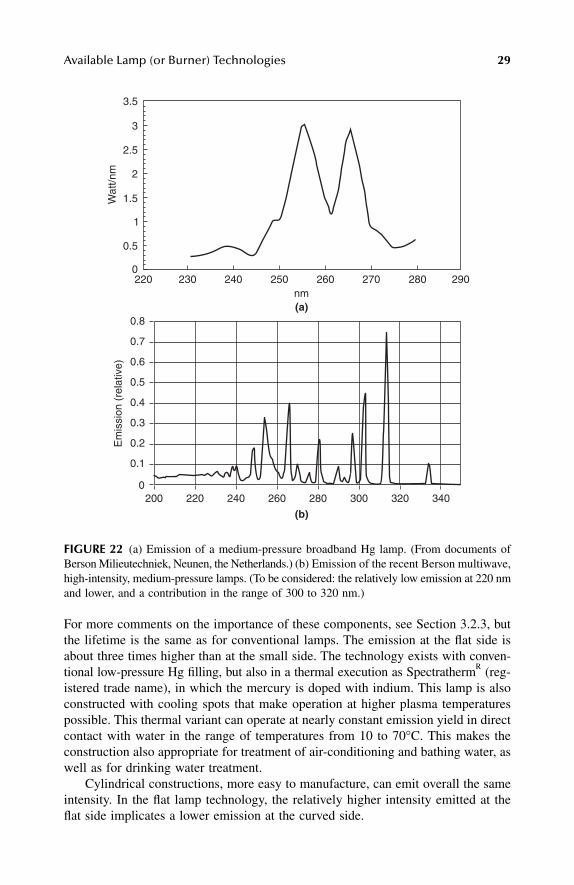
Available Lamp (or Burner) Technologies 29
For more comments on the importance of these components, see Section 3.2.3, butthe lifetime is the same as for conventional lamps. The emission at the flat side isabout three times higher than at the small side. The technology exists with conven-tional low-pressure Hg filling, but also in a thermal execution as SpectrathermR (reg-istered trade name), in which the mercury is doped with indium. This lamp is alsoconstructed with cooling spots that make operation at higher plasma temperaturespossible. This thermal variant can operate at nearly constant emission yield in directcontact with water in the range of temperatures from 10 to 70°C. This makes theconstruction also appropriate for treatment of air-conditioning and bathing water, aswell as for drinking water treatment.
Cylindrical constructions, more easy to manufacture, can emit overall the sameintensity. In the flat lamp technology, the relatively higher intensity emitted at theflat side implicates a lower emission at the curved side.
FIGURE 22 (a) Emission of a medium-pressure broadband Hg lamp. (From documents ofBerson Milieutechniek, Neunen, the Netherlands.) (b) Emission of the recent Berson multiwave,high-intensity, medium-pressure lamps. (To be considered: the relatively low emission at 220 nmand lower, and a contribution in the range of 300 to 320 nm.)
3.5
3
2.5
2
1.5
0.5
0
1
Wat
t/nm
nm220 230 240 250 260 270 280 290
(a)
(b)
0.8
0.7
0.6
0.5
0.4
0.3
0.2
0.1
0200 220 240 260 280 300 320 340
Em
issi
on (
rela
tive)
L1603_frame_C02 Page 29 Tuesday, March 5, 2002 5:23 PM
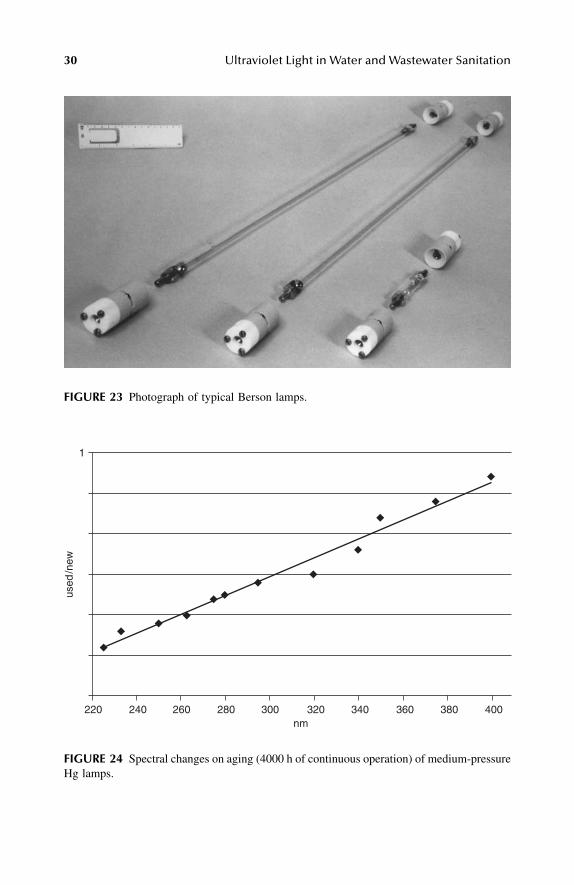
30 Ultraviolet Light in Water and Wastewater Sanitation
FIGURE 23 Photograph of typical Berson lamps.
FIGURE 24 Spectral changes on aging (4000 h of continuous operation) of medium-pressureHg lamps.
1
used
/new
220 240 260 280 300 320 340 360 380 400nm
L1603_frame_C02 Page 30 Tuesday, March 5, 2002 5:23 PM
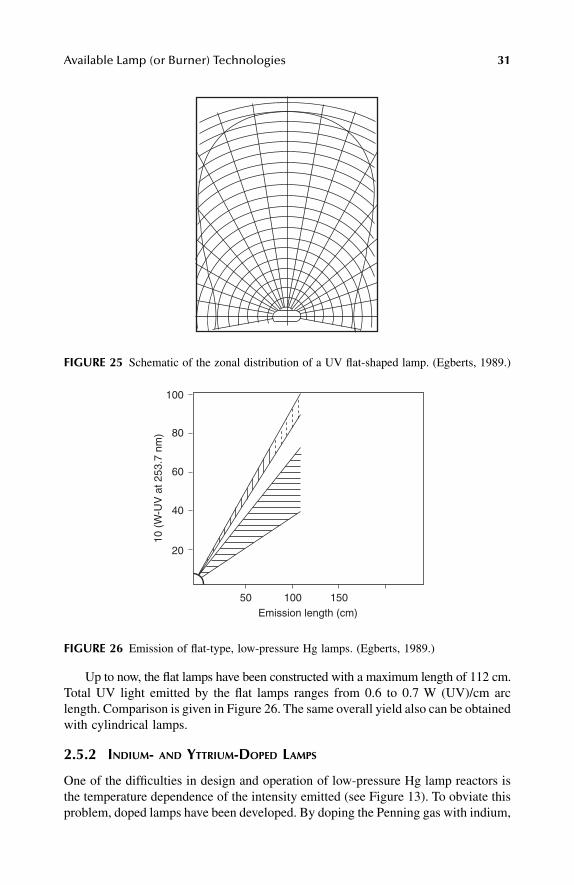
Available Lamp (or Burner) Technologies 31
Up to now, the flat lamps have been constructed with a maximum length of 112 cm.Total UV light emitted by the flat lamps ranges from 0.6 to 0.7 W (UV)/cm arclength. Comparison is given in Figure 26. The same overall yield also can be obtainedwith cylindrical lamps.
2.5.2 INDIUM- AND YTTRIUM-DOPED LAMPS
One of the difficulties in design and operation of low-pressure Hg lamp reactors isthe temperature dependence of the intensity emitted (see Figure 13). To obviate thisproblem, doped lamps have been developed. By doping the Penning gas with indium,
FIGURE 25 Schematic of the zonal distribution of a UV flat-shaped lamp. (Egberts, 1989.)
FIGURE 26 Emission of flat-type, low-pressure Hg lamps. (Egberts, 1989.)
100
80
60
40
20
10 (
W-U
V a
t 253
.7 n
m)
50 100 150Emission length (cm)
L1603_frame_C02 Page 31 Tuesday, March 5, 2002 5:23 PM
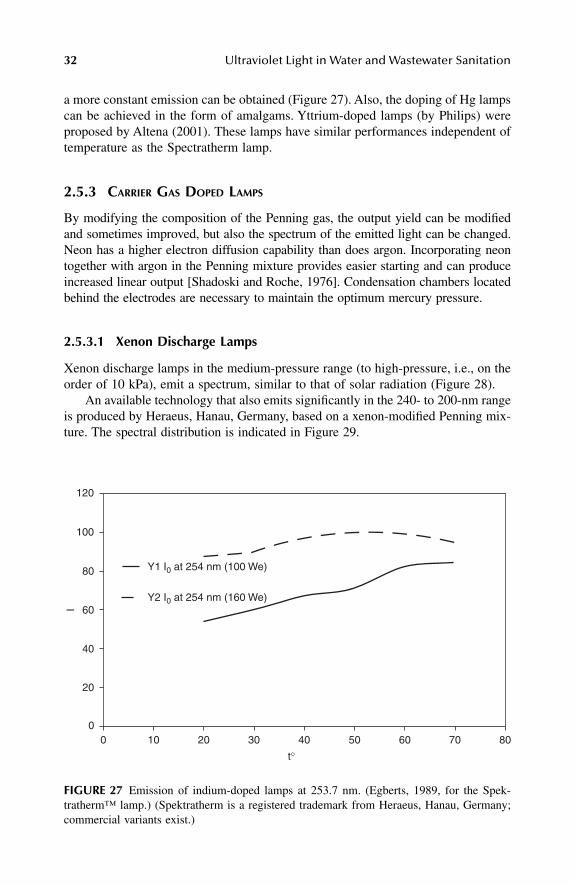
32 Ultraviolet Light in Water and Wastewater Sanitation
a more constant emission can be obtained (Figure 27). Also, the doping of Hg lampscan be achieved in the form of amalgams. Yttrium-doped lamps (by Philips) wereproposed by Altena (2001). These lamps have similar performances independent oftemperature as the Spectratherm lamp.
2.5.3 CARRIER GAS DOPED LAMPS
By modifying the composition of the Penning gas, the output yield can be modifiedand sometimes improved, but also the spectrum of the emitted light can be changed.Neon has a higher electron diffusion capability than does argon. Incorporating neontogether with argon in the Penning mixture provides easier starting and can produceincreased linear output [Shadoski and Roche, 1976]. Condensation chambers locatedbehind the electrodes are necessary to maintain the optimum mercury pressure.
2.5.3.1 Xenon Discharge Lamps
Xenon discharge lamps in the medium-pressure range (to high-pressure, i.e., on theorder of 10 kPa), emit a spectrum, similar to that of solar radiation (Figure 28).
An available technology that also emits significantly in the 240- to 200-nm rangeis produced by Heraeus, Hanau, Germany, based on a xenon-modified Penning mix-ture. The spectral distribution is indicated in Figure 29.
FIGURE 27 Emission of indium-doped lamps at 253.7 nm. (Egberts, 1989, for the Spek-tratherm™ lamp.) (Spektratherm is a registered trademark from Heraeus, Hanau, Germany;commercial variants exist.)
Y1 I0 at 254 nm (100 We)
Y2 I0 at 254 nm (160 We)
I
120
100
80
60
40
20
00 10 20 30 40 50 60 70 80
t°
L1603_frame_C02 Page 32 Tuesday, March 5, 2002 5:23 PM

Available Lamp (or Burner) Technologies 33
2.5.3.2 Deuterium Carrier Gas Discharge
Deuterium carrier gas discharge (medium- to high-pressure) lamps have increasedemission in the UV-C range, particularly below 250 nm (Figure 30). Lamps basedon discharges in carrier gases have not yet been found useful in water treatment,
FIGURE 28 Relative light power distribution of xenon discharge lamps. (According to doc-uments of Philips, Eindhoven, the Netherlands.)
FIGURE 29 Spectral distribution of Xenon-doped, low-pressure Hg lamps. (From documentsof Heraeus, Hanau, Germany.)
100
50
0
I 0 (
Rel
ativ
e %
)
λ (nm)
200 400 600 800 1000 1200 1400 1600
1.60
1.40
1.20
1.00
0.80
0.60
0.40
0.20
0200 210 220 230 240 250 260 270 280 290 300
W/n
m (
1 =
2.8
8 W
, UV
)
λ (nm)
L1603_frame_C02 Page 33 Tuesday, March 5, 2002 5:23 PM
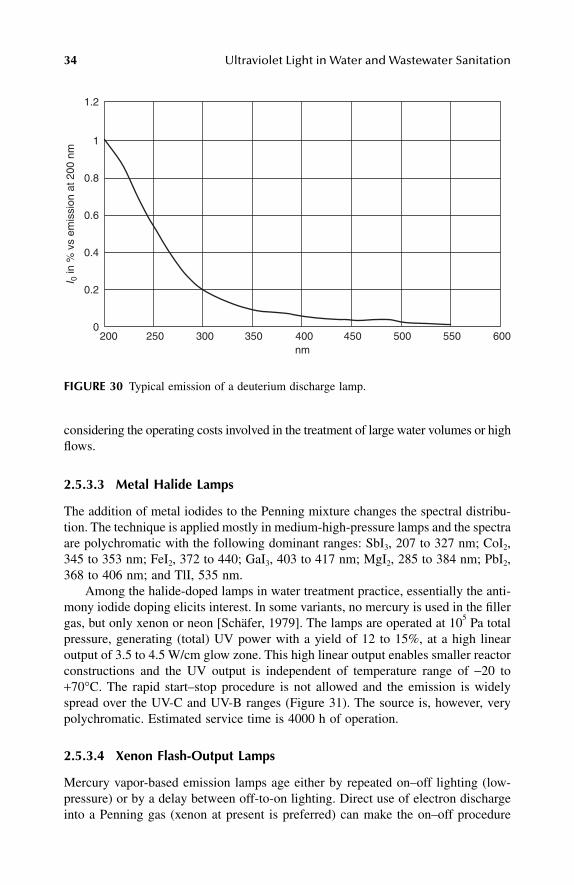
34 Ultraviolet Light in Water and Wastewater Sanitation
considering the operating costs involved in the treatment of large water volumes or highflows.
2.5.3.3 Metal Halide Lamps
The addition of metal iodides to the Penning mixture changes the spectral distribu-tion. The technique is applied mostly in medium-high-pressure lamps and the spectraare polychromatic with the following dominant ranges: SbI3, 207 to 327 nm; CoI2,345 to 353 nm; FeI2, 372 to 440; GaI3, 403 to 417 nm; MgI2, 285 to 384 nm; PbI2,368 to 406 nm; and TlI, 535 nm.
Among the halide-doped lamps in water treatment practice, essentially the anti-mony iodide doping elicits interest. In some variants, no mercury is used in the fillergas, but only xenon or neon [Schäfer, 1979]. The lamps are operated at 105 Pa totalpressure, generating (total) UV power with a yield of 12 to 15%, at a high linearoutput of 3.5 to 4.5 W/cm glow zone. This high linear output enables smaller reactorconstructions and the UV output is independent of temperature range of −20 to+70°C. The rapid start–stop procedure is not allowed and the emission is widelyspread over the UV-C and UV-B ranges (Figure 31). The source is, however, verypolychromatic. Estimated service time is 4000 h of operation.
2.5.3.4 Xenon Flash-Output Lamps
Mercury vapor-based emission lamps age either by repeated on–off lighting (low-pressure) or by a delay between off-to-on lighting. Direct use of electron dischargeinto a Penning gas (xenon at present is preferred) can make the on–off procedure
FIGURE 30 Typical emission of a deuterium discharge lamp.
1.2
1
0.8
0.6
0.4
0.2
0200 250 300 350 400 450 500 550 600
I 0 in
% v
s em
issi
on a
t 200
nm
nm
L1603_frame_C02 Page 34 Tuesday, March 5, 2002 5:23 PM
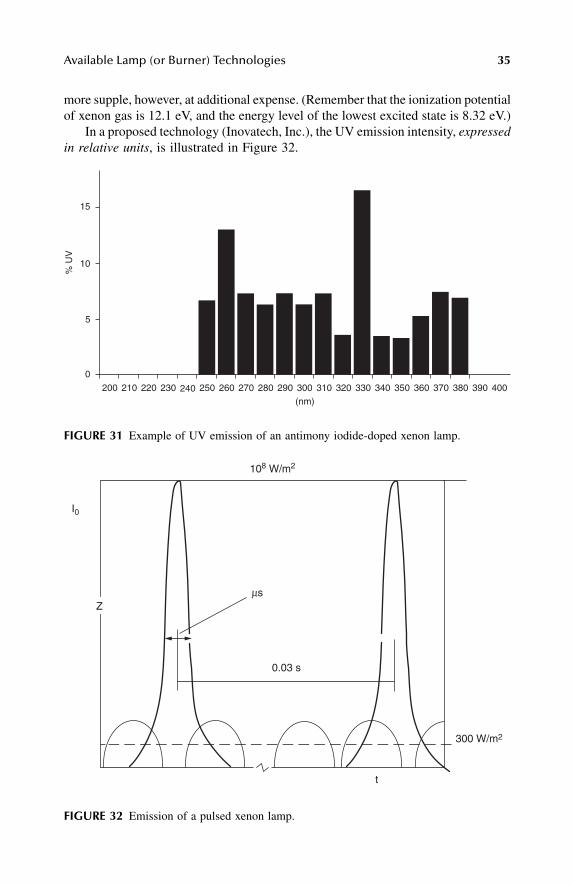
Available Lamp (or Burner) Technologies 35
more supple, however, at additional expense. (Remember that the ionization potentialof xenon gas is 12.1 eV, and the energy level of the lowest excited state is 8.32 eV.)
In a proposed technology (Inovatech, Inc.), the UV emission intensity, expressedin relative units, is illustrated in Figure 32.
FIGURE 31 Example of UV emission of an antimony iodide-doped xenon lamp.
FIGURE 32 Emission of a pulsed xenon lamp.
15
10
5
0
% U
V
200 210 220 230 240 250 260 270 280 290 300 310 320 330 340 350 360 370 380 390 400
(nm)
Z
t
300 W/m2
108 W/m2
0.03 s
s
I0
µ
L1603_frame_C02 Page 35 Tuesday, March 5, 2002 5:23 PM
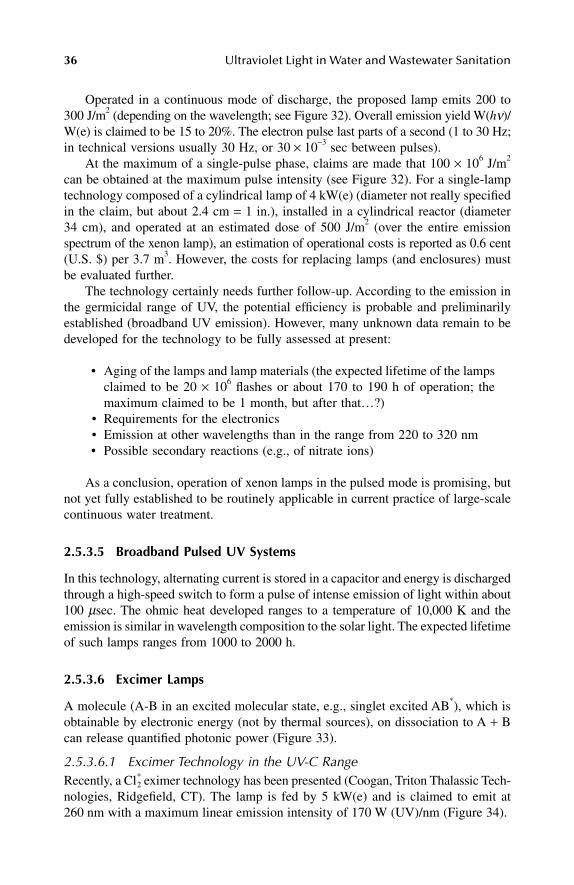
36 Ultraviolet Light in Water and Wastewater Sanitation
Operated in a continuous mode of discharge, the proposed lamp emits 200 to300 J/m2 (depending on the wavelength; see Figure 32). Overall emission yield W(hν)/W(e) is claimed to be 15 to 20%. The electron pulse last parts of a second (1 to 30 Hz;in technical versions usually 30 Hz, or 30 × 10−3 sec between pulses).
At the maximum of a single-pulse phase, claims are made that 100 × 106 J/m2
can be obtained at the maximum pulse intensity (see Figure 32). For a single-lamptechnology composed of a cylindrical lamp of 4 kW(e) (diameter not really specifiedin the claim, but about 2.4 cm = 1 in.), installed in a cylindrical reactor (diameter34 cm), and operated at an estimated dose of 500 J/m2 (over the entire emissionspectrum of the xenon lamp), an estimation of operational costs is reported as 0.6 cent(U.S. $) per 3.7 m3. However, the costs for replacing lamps (and enclosures) mustbe evaluated further.
The technology certainly needs further follow-up. According to the emission inthe germicidal range of UV, the potential efficiency is probable and preliminarilyestablished (broadband UV emission). However, many unknown data remain to bedeveloped for the technology to be fully assessed at present:
• Aging of the lamps and lamp materials (the expected lifetime of the lampsclaimed to be 20 × 106 flashes or about 170 to 190 h of operation; themaximum claimed to be 1 month, but after that…?)
• Requirements for the electronics• Emission at other wavelengths than in the range from 220 to 320 nm• Possible secondary reactions (e.g., of nitrate ions)
As a conclusion, operation of xenon lamps in the pulsed mode is promising, butnot yet fully established to be routinely applicable in current practice of large-scalecontinuous water treatment.
2.5.3.5 Broadband Pulsed UV Systems
In this technology, alternating current is stored in a capacitor and energy is dischargedthrough a high-speed switch to form a pulse of intense emission of light within about100 µsec. The ohmic heat developed ranges to a temperature of 10,000 K and theemission is similar in wavelength composition to the solar light. The expected lifetimeof such lamps ranges from 1000 to 2000 h.
2.5.3.6 Excimer Lamps
A molecule (A-B in an excited molecular state, e.g., singlet excited AB*), which isobtainable by electronic energy (not by thermal sources), on dissociation to A + Bcan release quantified photonic power (Figure 33).
2.5.3.6.1 Excimer Technology in the UV-C RangeRecently, a eximer technology has been presented (Coogan, Triton Thalassic Tech-nologies, Ridgefield, CT). The lamp is fed by 5 kW(e) and is claimed to emit at260 nm with a maximum linear emission intensity of 170 W (UV)/nm (Figure 34).
Cl2∗
L1603_frame_C02 Page 36 Tuesday, March 5, 2002 5:23 PM
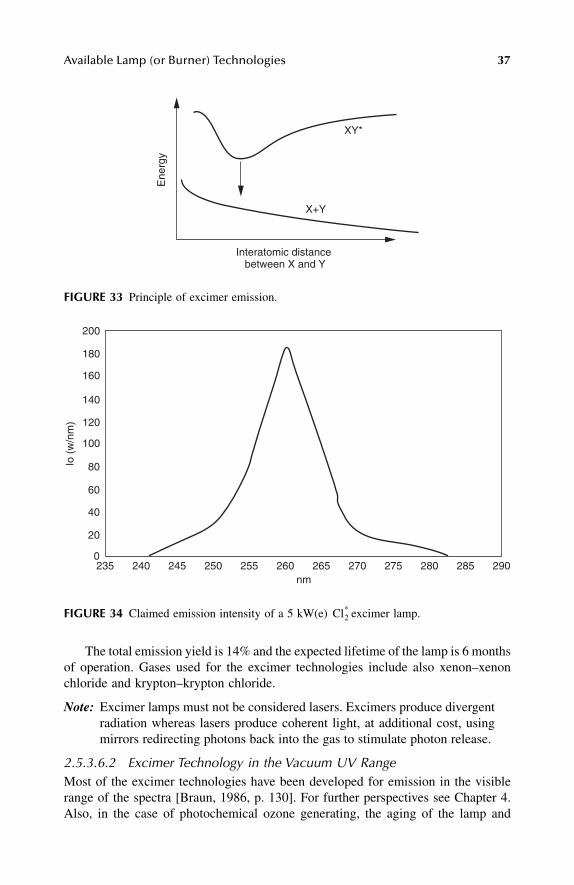
Available Lamp (or Burner) Technologies 37
The total emission yield is 14% and the expected lifetime of the lamp is 6 monthsof operation. Gases used for the excimer technologies include also xenon–xenonchloride and krypton–krypton chloride.
Note: Excimer lamps must not be considered lasers. Excimers produce divergentradiation whereas lasers produce coherent light, at additional cost, usingmirrors redirecting photons back into the gas to stimulate photon release.
2.5.3.6.2 Excimer Technology in the Vacuum UV RangeMost of the excimer technologies have been developed for emission in the visiblerange of the spectra [Braun, 1986, p. 130]. For further perspectives see Chapter 4.Also, in the case of photochemical ozone generating, the aging of the lamp and
FIGURE 33 Principle of excimer emission.
FIGURE 34 Claimed emission intensity of a 5 kW(e) excimer lamp.
Ene
rgy
Interatomic distance between X and Y
X+Y
XY*
0
20
235 240 245 250 255 260 265 270 275 280 285 290
40
60
80
100
Io (
w/n
m) 120
140
160
180
200
nm
Cl2∗
L1603_frame_C02 Page 37 Tuesday, March 5, 2002 5:23 PM
38 Ultraviolet Light in Water and Wastewater Sanitation
reactor materials need to be evaluated. Particularly promising are excimer technologiesemitting at short wavelengths (Heraeus Noblelight Kleinostheim; also Bischof [1994]):
Xe , 172 nm; ArCl*, 175 nm; ArF
*, 193 nm;
KrCl*, 222 nm; XeCl
*, 308 nm
In general, an overview report is available from the U.S. Electric Power ResearchInstitute (EPRI), titled “Ultraviolet Disinfection for Water and Wastewater” [1995],reporting particularly on new lamp technologies.
2.6 PRELIMINARY GUIDELINES FOR CHOICE OF LAMP TECHNOLOGY
2.6.1 LOW-PRESSURE MERCURY LAMPS
• Low-pressure Hg lamps are easy to install and operate (normal take-offvoltage from the mains; emission intensity can change with fluctuationsin voltage of the mains).
• UV output is about monochromatic (at 254 nm) in the germicidal range(the emission at 185 nm usually is filtered by the material of the lamp).
• The relative monochromatism is not always able to initiate photochemicalsynergistic processes (see Chapter 4).
• No benefit is obtained by exposure of germs to other wavelengths (absorp-tion by proteins, e.g., enzymes; see Chapter 3).
• Aging of the lamps and their materials of construction is slow. Lifetimeis about 1 year.
• The lamps (plus lamp enclosures) operate at low temperatures, optimumat 40 to 42°C. At lower water temperatures, efficiency can be decreased.
• Start–stop procedure is easy. Each on–off lighting corresponds to an addi-tional aging of 1 h.
• However, the linear emission intensity is low—ranging from 0.2 to 0.3 W(UV)/cm; consequently, the lamps are suited for germicidal action for lowwater flows. Treatment of high flows requires multiplication of the numberof lamps installed, and as a consequence large reactor hardware.
• Doped low-pressure Hg lamps can emit at higher linear intensity (e.g.,indium or yttrium doping), but at the expense of shortened lifetime (byabout 50%).
• Some variants of doped low-pressure Hg lamps can emit in the range of200 to 240 nm, which can be interesting for synergistic action (e.g., withhydrogen peroxide; see Chapter 4).
• Low-pressure lamps are emitting at nominal regime that cannot be mod-ulated as a function of the power applied. This characteristic is not directlysuited for automation of the intensity for significantly variable needs intime (e.g., variation in the flow of water to be treated).
• Low-pressure Hg lamps are readily available, with their emission spectrawell established and quantified at comparatively low cost. Their moresimple technology can be preferred in remote areas.
• Variants using solar energy batteries now are available.
2*
L1603_frame_C02 Page 38 Tuesday, March 5, 2002 5:23 PM
Available Lamp (or Burner) Technologies 39
2.6.2 MEDIUM-PRESSURE MERCURY LAMPS
• Medium-pressure lamps that have a high linear emission intensity in theUV-C range exist (classically 10 to 15 W UV-C per centimeter; 30 WUV-C per centimeter are now possible).
• The source is polychromatic (i.e., emitting at several wavelengths), andpart of the light—at least 40 to 50%—is directly useful for disinfection(see Chapter 3).
• The lamp source is operated at high temperatures (outside temperature400 to 800°C), with lamp enclosure being of the utmost importance.
• At the same potential disinfection efficiency, medium-pressure lamps areof much smaller construction than the low-pressure Hg lamps; hence reactordesign is much smaller, especially for treatment of high water flows.
• The lamps are operated at higher electrical potential (3 to 5 kV), requiringa transformer, which in turn enables modulation of the emitted intensityas a function of variable parameters of demand (e.g., water flow). Thismeans that medium-pressure Hg lamps have much more capabilities ofautomation compared with low-pressure Hg lamps. (In currently availabletechnologies of medium-pressure Hg lamps, the power input can be mod-ulated in the range of 60 to 100% of nominal.)
• Aging of lamp material and enclosures of medium-pressure Hg lamps isfaster than for the low-pressure lamps (about 4,000 vs. 10,000 h); however,improved technologies are available.
• Medium-pressure lamps can be designed as broad spectrum, emitting ina wide range of increased potential efficiency, both for disinfection andfor synergistic oxidation processes.
2.6.3 PARTICULAR LAMP TECHNOLOGIES
To be complete, indicative data on special lamp technologies are reported in thischapter. Some of these technologies are claimed to be promising, but not yet thor-oughly established in the field.
2.7 ULTRAVIOLET EMISSION YIELDS AND MODE OF CONTROL
2.7.1 MATERIALS OF LAMP WALLS AND ENCLOSURES
Generally, UV lamps for water treatment are constructed of quartz, which is fragileand subject to lowered transmission by formation of deposits and slimes. Cleaningwith ultrasonic techniques fails. A 1972 patent [Landry, 1972, noted in Legan, 1982]claims that certain fluorocarbons could transmit UV light. Teflon™, which is chemicallyinert or resistant to many products and has a refractive index close to that of water(Teflon 1.34; water 1.33 vs. air 1), has been described as having potential advantagescompared with quartz [Legan, 1982]. Lamps were constructed with Teflon walls orwith Teflon coatings on quartz lamps. However, the transmittance of the material,
L1603_frame_C02 Page 39 Tuesday, March 5, 2002 5:23 PM
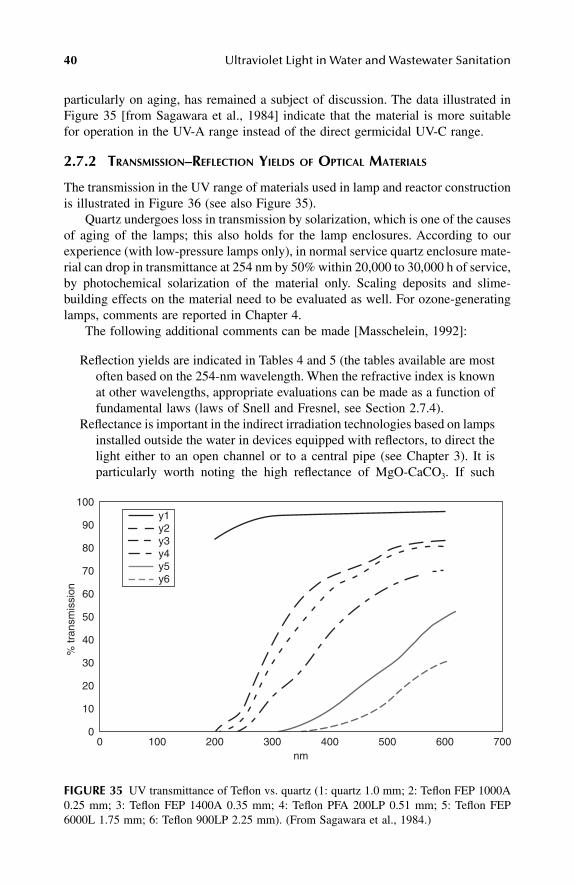
40 Ultraviolet Light in Water and Wastewater Sanitation
particularly on aging, has remained a subject of discussion. The data illustrated inFigure 35 [from Sagawara et al., 1984] indicate that the material is more suitablefor operation in the UV-A range instead of the direct germicidal UV-C range.
2.7.2 TRANSMISSION–REFLECTION YIELDS OF OPTICAL MATERIALS
The transmission in the UV range of materials used in lamp and reactor constructionis illustrated in Figure 36 (see also Figure 35).
Quartz undergoes loss in transmission by solarization, which is one of the causesof aging of the lamps; this also holds for the lamp enclosures. According to ourexperience (with low-pressure lamps only), in normal service quartz enclosure mate-rial can drop in transmittance at 254 nm by 50% within 20,000 to 30,000 h of service,by photochemical solarization of the material only. Scaling deposits and slime-building effects on the material need to be evaluated as well. For ozone-generatinglamps, comments are reported in Chapter 4.
The following additional comments can be made [Masschelein, 1992]:
Reflection yields are indicated in Tables 4 and 5 (the tables available are mostoften based on the 254-nm wavelength. When the refractive index is knownat other wavelengths, appropriate evaluations can be made as a function offundamental laws (laws of Snell and Fresnel, see Section 2.7.4).
Reflectance is important in the indirect irradiation technologies based on lampsinstalled outside the water in devices equipped with reflectors, to direct thelight either to an open channel or to a central pipe (see Chapter 3). It isparticularly worth noting the high reflectance of MgO-CaCO3. If such
FIGURE 35 UV transmittance of Teflon vs. quartz (1: quartz 1.0 mm; 2: Teflon FEP 1000A0.25 mm; 3: Teflon FEP 1400A 0.35 mm; 4: Teflon PFA 200LP 0.51 mm; 5: Teflon FEP6000L 1.75 mm; 6: Teflon 900LP 2.25 mm). (From Sagawara et al., 1984.)
00
10
20
30
40
50
60
70
80
90
100
100 200 300 400 500 600 700nm
y1y2y3y4y5y6
% tr
ansm
issi
on
L1603_frame_C02 Page 40 Tuesday, March 5, 2002 5:23 PM
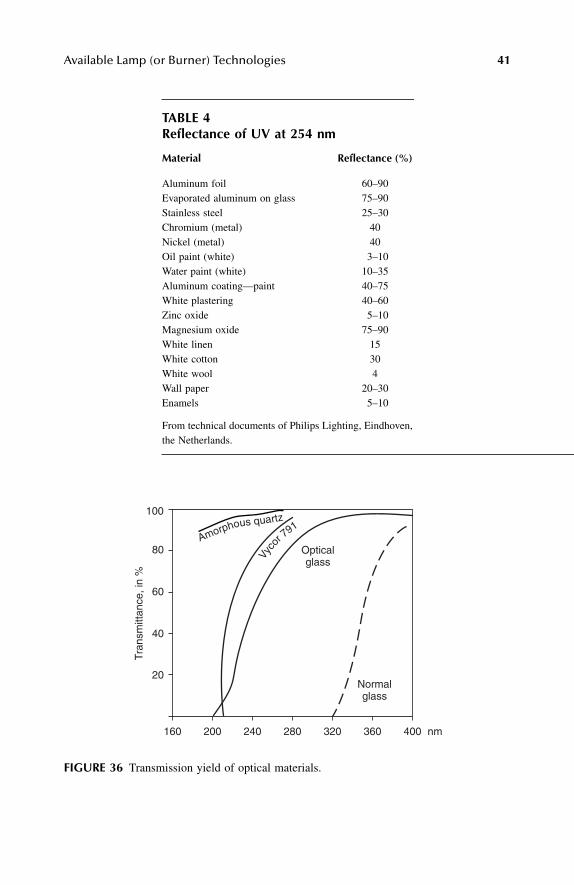
Available Lamp (or Burner) Technologies 41
TABLE 4Reflectance of UV at 254 nm
Material Reflectance (%)
Aluminum foil 60–90Evaporated aluminum on glass 75–90Stainless steel 25–30Chromium (metal) 40Nickel (metal) 40Oil paint (white) 3–10Water paint (white) 10–35Aluminum coating—paint 40–75White plastering 40–60Zinc oxide 5–10Magnesium oxide 75–90White linen 15White cotton 30White wool 4Wall paper 20–30Enamels 5–10
From technical documents of Philips Lighting, Eindhoven,the Netherlands.
FIGURE 36 Transmission yield of optical materials.
160
20
40
60
80
100
200 240 280 320 360 400 nm
Tran
smitt
ance
, in
%
Amorphous quartz
Vyco
r 791
Normalglass
Opticalglass
L1603_frame_C02 Page 41 Tuesday, March 5, 2002 5:23 PM
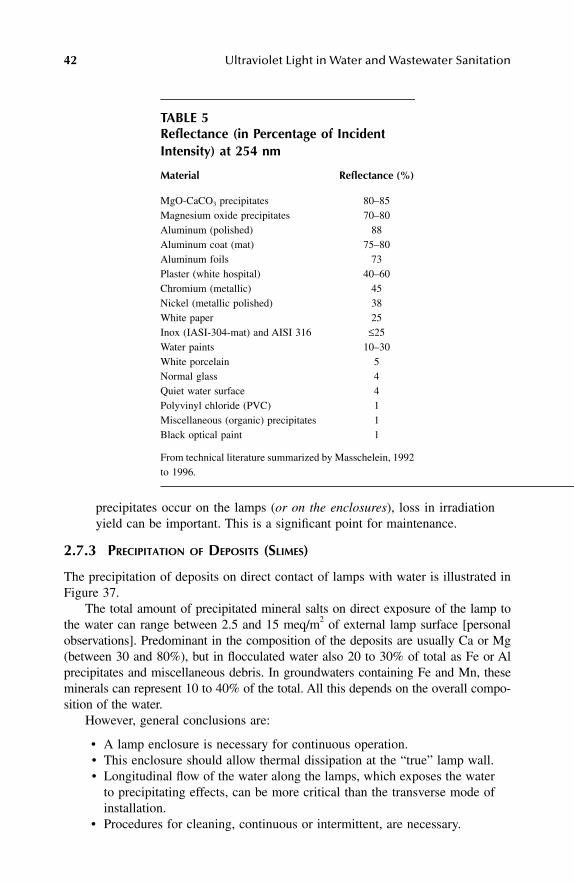
42 Ultraviolet Light in Water and Wastewater Sanitation
precipitates occur on the lamps (or on the enclosures), loss in irradiationyield can be important. This is a significant point for maintenance.
2.7.3 PRECIPITATION OF DEPOSITS (SLIMES)
The precipitation of deposits on direct contact of lamps with water is illustrated inFigure 37.
The total amount of precipitated mineral salts on direct exposure of the lamp tothe water can range between 2.5 and 15 meq/m2 of external lamp surface [personalobservations]. Predominant in the composition of the deposits are usually Ca or Mg(between 30 and 80%), but in flocculated water also 20 to 30% of total as Fe or Alprecipitates and miscellaneous debris. In groundwaters containing Fe and Mn, theseminerals can represent 10 to 40% of the total. All this depends on the overall compo-sition of the water.
However, general conclusions are:
• A lamp enclosure is necessary for continuous operation.• This enclosure should allow thermal dissipation at the “true” lamp wall.• Longitudinal flow of the water along the lamps, which exposes the water
to precipitating effects, can be more critical than the transverse mode ofinstallation.
• Procedures for cleaning, continuous or intermittent, are necessary.
TABLE 5Reflectance (in Percentage of Incident Intensity) at 254 nm
Material Reflectance (%)
MgO-CaCO3 precipitates 80–85Magnesium oxide precipitates 70–80Aluminum (polished) 88Aluminum coat (mat) 75–80Aluminum foils 73Plaster (white hospital) 40–60Chromium (metallic) 45Nickel (metallic polished) 38White paper 25Inox (IASI-304-mat) and AISI 316 ≤25Water paints 10–30White porcelain 5Normal glass 4Quiet water surface 4Polyvinyl chloride (PVC) 1Miscellaneous (organic) precipitates 1Black optical paint 1
From technical literature summarized by Masschelein, 1992to 1996.
L1603_frame_C02 Page 42 Tuesday, March 5, 2002 5:23 PM
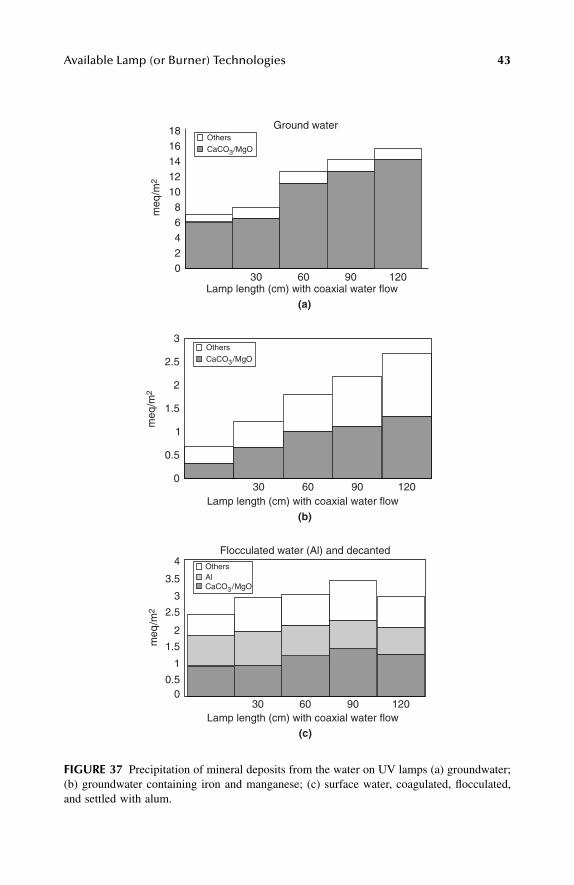
Available Lamp (or Burner) Technologies 43
FIGURE 37 Precipitation of mineral deposits from the water on UV lamps (a) groundwater;(b) groundwater containing iron and manganese; (c) surface water, coagulated, flocculated,and settled with alum.
Lamp length (cm) with coaxial water flow
meq
/m2
030 60 90 120
0.5
1
1.5
2
2.5
3Others
CaCO3/MgO
Lamp length (cm) with coaxial water flow
(a)
(b)
Lamp length (cm) with coaxial water flow
(c)
meq
/m2
030 60 90 120
2468
1012141618
OthersGround water
CaCO3/MgO
Flocculated water (Al) and decanted
meq
/m2
030 60 90 120
0.5
1
1.5
2
2.5
3
3.5
4 OthersAlCaCO3/MgO
L1603_frame_C02 Page 43 Tuesday, March 5, 2002 5:23 PM
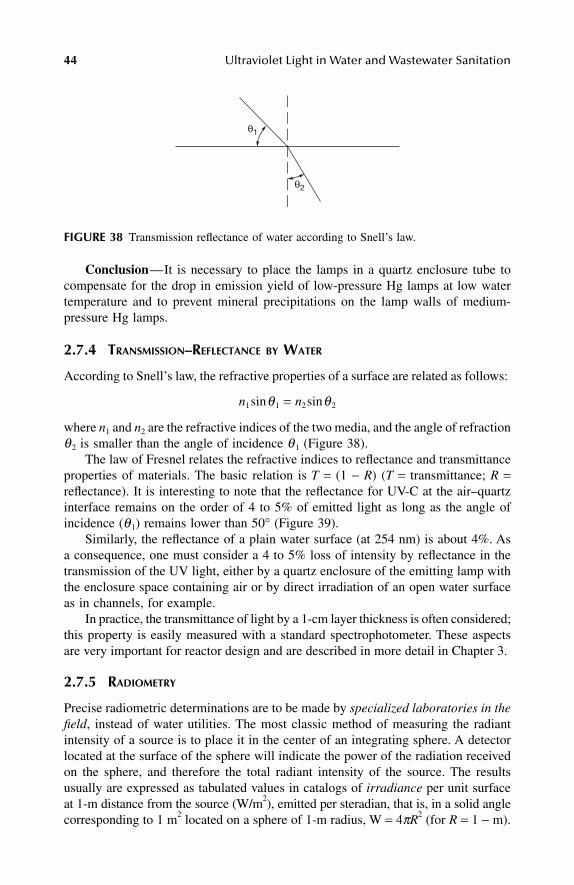
44 Ultraviolet Light in Water and Wastewater Sanitation
Conclusion—It is necessary to place the lamps in a quartz enclosure tube tocompensate for the drop in emission yield of low-pressure Hg lamps at low watertemperature and to prevent mineral precipitations on the lamp walls of medium-pressure Hg lamps.
2.7.4 TRANSMISSION–REFLECTANCE BY WATER
According to Snell’s law, the refractive properties of a surface are related as follows:
n1sinθ1 = n2sinθ2
where n1 and n2 are the refractive indices of the two media, and the angle of refractionθ2 is smaller than the angle of incidence θ1 (Figure 38).
The law of Fresnel relates the refractive indices to reflectance and transmittanceproperties of materials. The basic relation is T = (1 − R) (T = transmittance; R =reflectance). It is interesting to note that the reflectance for UV-C at the air–quartzinterface remains on the order of 4 to 5% of emitted light as long as the angle ofincidence (θ1) remains lower than 50° (Figure 39).
Similarly, the reflectance of a plain water surface (at 254 nm) is about 4%. Asa consequence, one must consider a 4 to 5% loss of intensity by reflectance in thetransmission of the UV light, either by a quartz enclosure of the emitting lamp withthe enclosure space containing air or by direct irradiation of an open water surfaceas in channels, for example.
In practice, the transmittance of light by a 1-cm layer thickness is often considered;this property is easily measured with a standard spectrophotometer. These aspectsare very important for reactor design and are described in more detail in Chapter 3.
2.7.5 RADIOMETRY
Precise radiometric determinations are to be made by specialized laboratories in thefield, instead of water utilities. The most classic method of measuring the radiantintensity of a source is to place it in the center of an integrating sphere. A detectorlocated at the surface of the sphere will indicate the power of the radiation receivedon the sphere, and therefore the total radiant intensity of the source. The resultsusually are expressed as tabulated values in catalogs of irradiance per unit surfaceat 1-m distance from the source (W/m2), emitted per steradian, that is, in a solid anglecorresponding to 1 m2 located on a sphere of 1-m radius, W = 4πR2 (for R = 1 − m).
FIGURE 38 Transmission reflectance of water according to Snell’s law.
θ1
θ2
L1603_frame_C02 Page 44 Tuesday, March 5, 2002 5:23 PM
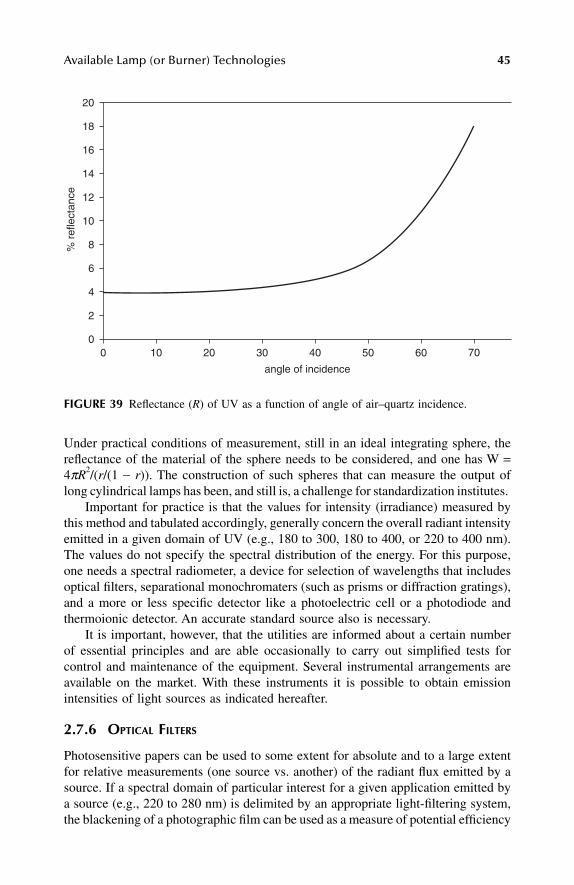
Available Lamp (or Burner) Technologies 45
Under practical conditions of measurement, still in an ideal integrating sphere, thereflectance of the material of the sphere needs to be considered, and one has W =4πR2/(r/(1 − r)). The construction of such spheres that can measure the output oflong cylindrical lamps has been, and still is, a challenge for standardization institutes.
Important for practice is that the values for intensity (irradiance) measured bythis method and tabulated accordingly, generally concern the overall radiant intensityemitted in a given domain of UV (e.g., 180 to 300, 180 to 400, or 220 to 400 nm).The values do not specify the spectral distribution of the energy. For this purpose,one needs a spectral radiometer, a device for selection of wavelengths that includesoptical filters, separational monochromaters (such as prisms or diffraction gratings),and a more or less specific detector like a photoelectric cell or a photodiode andthermoionic detector. An accurate standard source also is necessary.
It is important, however, that the utilities are informed about a certain numberof essential principles and are able occasionally to carry out simplified tests forcontrol and maintenance of the equipment. Several instrumental arrangements areavailable on the market. With these instruments it is possible to obtain emissionintensities of light sources as indicated hereafter.
2.7.6 OPTICAL FILTERS
Photosensitive papers can be used to some extent for absolute and to a large extentfor relative measurements (one source vs. another) of the radiant flux emitted by asource. If a spectral domain of particular interest for a given application emitted bya source (e.g., 220 to 280 nm) is delimited by an appropriate light-filtering system,the blackening of a photographic film can be used as a measure of potential efficiency
FIGURE 39 Reflectance (R) of UV as a function of angle of air–quartz incidence.
7060504030
angle of incidence
% r
efle
ctan
ce
201000
2
4
6
8
10
12
14
16
18
20
L1603_frame_C02 Page 45 Tuesday, March 5, 2002 5:23 PM
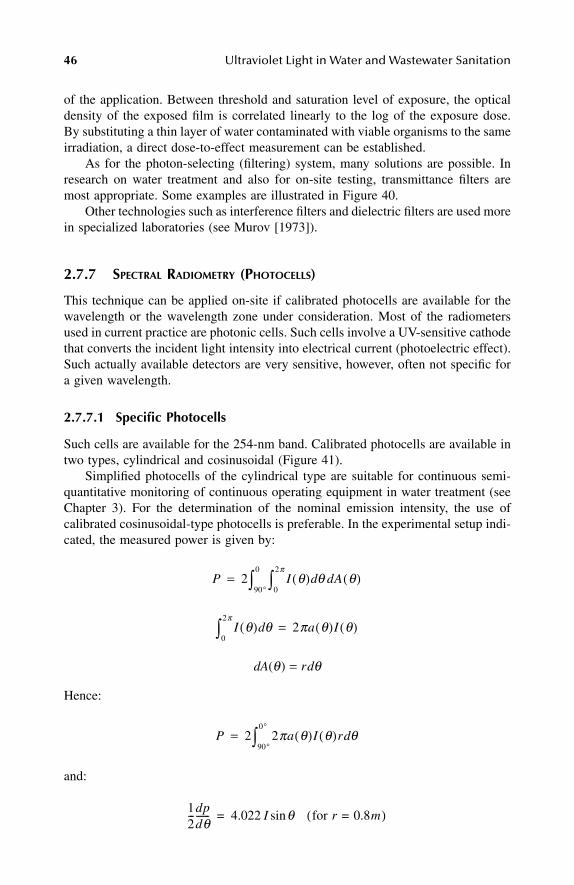
46 Ultraviolet Light in Water and Wastewater Sanitation
of the application. Between threshold and saturation level of exposure, the opticaldensity of the exposed film is correlated linearly to the log of the exposure dose.By substituting a thin layer of water contaminated with viable organisms to the sameirradiation, a direct dose-to-effect measurement can be established.
As for the photon-selecting (filtering) system, many solutions are possible. Inresearch on water treatment and also for on-site testing, transmittance filters aremost appropriate. Some examples are illustrated in Figure 40.
Other technologies such as interference filters and dielectric filters are used morein specialized laboratories (see Murov [1973]).
2.7.7 SPECTRAL RADIOMETRY (PHOTOCELLS)
This technique can be applied on-site if calibrated photocells are available for thewavelength or the wavelength zone under consideration. Most of the radiometersused in current practice are photonic cells. Such cells involve a UV-sensitive cathodethat converts the incident light intensity into electrical current (photoelectric effect).Such actually available detectors are very sensitive, however, often not specific fora given wavelength.
2.7.7.1 Specific Photocells
Such cells are available for the 254-nm band. Calibrated photocells are available intwo types, cylindrical and cosinusoidal (Figure 41).
Simplified photocells of the cylindrical type are suitable for continuous semi-quantitative monitoring of continuous operating equipment in water treatment (seeChapter 3). For the determination of the nominal emission intensity, the use ofcalibrated cosinusoidal-type photocells is preferable. In the experimental setup indi-cated, the measured power is given by:
dA(θ) = rdθ
Hence:
and:
P 2 I θ( ) θd A θ( )d0
2π
∫90°
0
∫=
I θ( ) θd0
2π
∫ 2πa θ( )I θ( )=
P 2 2πa θ( )I θ( )r θd90°
0°
∫=
12---dp
dθ------ 4.022 I θ for r 0.8m=( )sin=
L1603_frame_C02 Page 46 Tuesday, March 5, 2002 5:23 PM
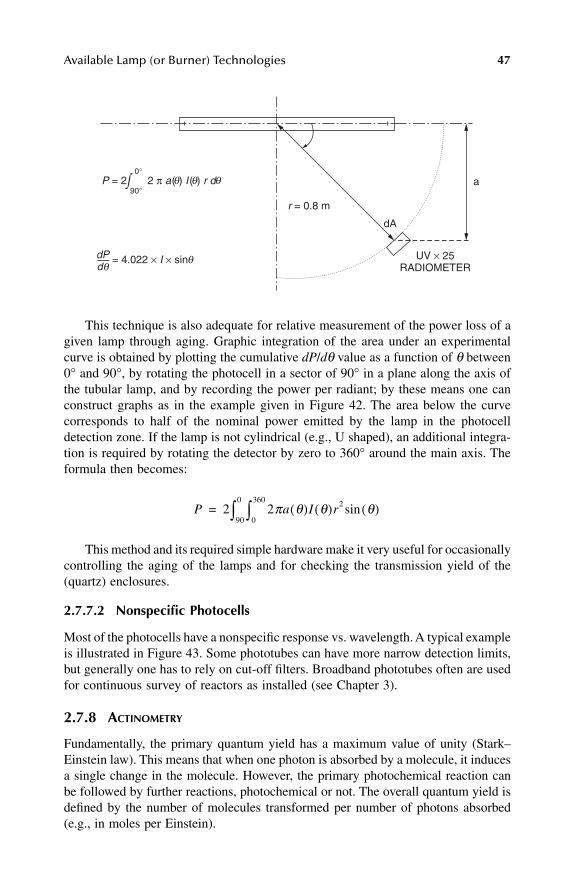
Available Lamp (or Burner) Technologies 47
This technique is also adequate for relative measurement of the power loss of agiven lamp through aging. Graphic integration of the area under an experimentalcurve is obtained by plotting the cumulative dP/dθ value as a function of θ between0° and 90°, by rotating the photocell in a sector of 90° in a plane along the axis ofthe tubular lamp, and by recording the power per radiant; by these means one canconstruct graphs as in the example given in Figure 42. The area below the curvecorresponds to half of the nominal power emitted by the lamp in the photocelldetection zone. If the lamp is not cylindrical (e.g., U shaped), an additional integra-tion is required by rotating the detector by zero to 360° around the main axis. Theformula then becomes:
This method and its required simple hardware make it very useful for occasionallycontrolling the aging of the lamps and for checking the transmission yield of the(quartz) enclosures.
2.7.7.2 Nonspecific Photocells
Most of the photocells have a nonspecific response vs. wavelength. A typical exampleis illustrated in Figure 43. Some phototubes can have more narrow detection limits,but generally one has to rely on cut-off filters. Broadband phototubes often are usedfor continuous survey of reactors as installed (see Chapter 3).
2.7.8 ACTINOMETRY
Fundamentally, the primary quantum yield has a maximum value of unity (Stark–Einstein law). This means that when one photon is absorbed by a molecule, it inducesa single change in the molecule. However, the primary photochemical reaction canbe followed by further reactions, photochemical or not. The overall quantum yield isdefined by the number of molecules transformed per number of photons absorbed(e.g., in moles per Einstein).
a
dPd θ
θ
θθ θ
= 4.022 × I × sin
r = 0.8 m
dA
UV × 25RADIOMETER
P = 2 2 π a( ) I ( ) r d ∫0°
90°
P 2 2πa θ( )I θ( )r2 θ( )sin0
360
∫90
0
∫=
L1603_frame_C02 Page 47 Tuesday, March 5, 2002 5:23 PM
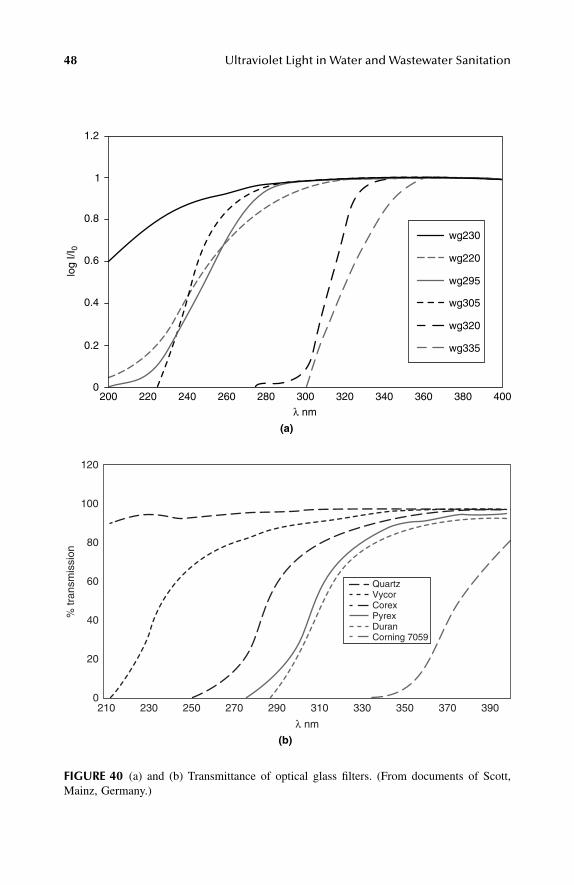
48 Ultraviolet Light in Water and Wastewater Sanitation
FIGURE 40 (a) and (b) Transmittance of optical glass filters. (From documents of Scott,Mainz, Germany.)
0200 220 240 260 280
(a)
(b)
300 320 340 360 380 400
0.2
0.4
0.6
0.8
1
1.2
λ nm
log
I/I0
wg230
wg220
wg295
wg305
wg320
wg335
QuartzVycorCorexPyrexDuranCorning 7059
120
100
80
60
40
20
210 230 250 270 290 310 330 350 370 3900
% tr
ansm
issi
on
λ nm
L1603_frame_C02 Page 48 Tuesday, March 5, 2002 5:23 PM
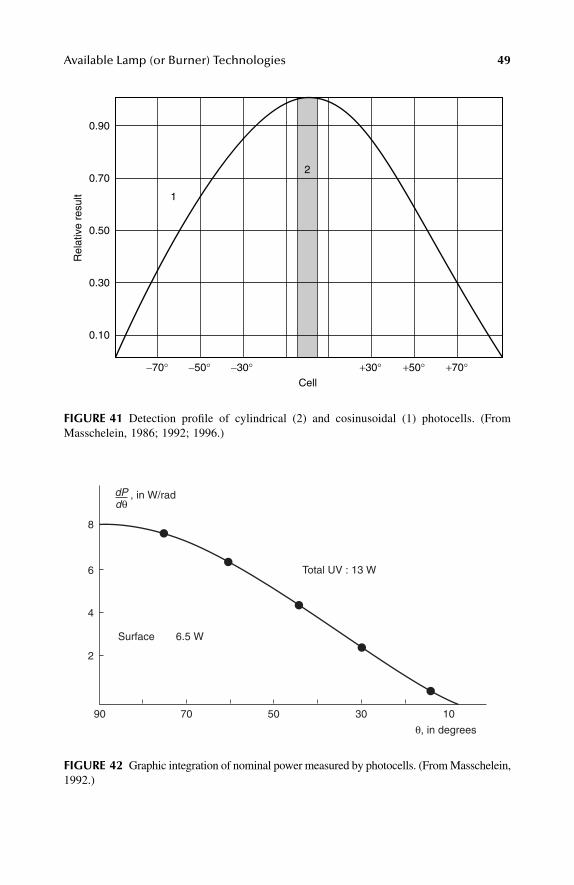
Available Lamp (or Burner) Technologies 49
FIGURE 41 Detection profile of cylindrical (2) and cosinusoidal (1) photocells. (FromMasschelein, 1986; 1992; 1996.)
FIGURE 42 Graphic integration of nominal power measured by photocells. (From Masschelein,1992.)
2
1
0.10
0.30
0.50
0.70
0.90
−70° −50° −30° +30° +50° +70°Cell
Rel
ativ
e re
sult
8
6
4
2
90 70 50 30 10
Surface
Total UV : 13 W
θ, in degrees
6.5 W
dPdθ
, in W/rad
L1603_frame_C02 Page 49 Tuesday, March 5, 2002 5:23 PM
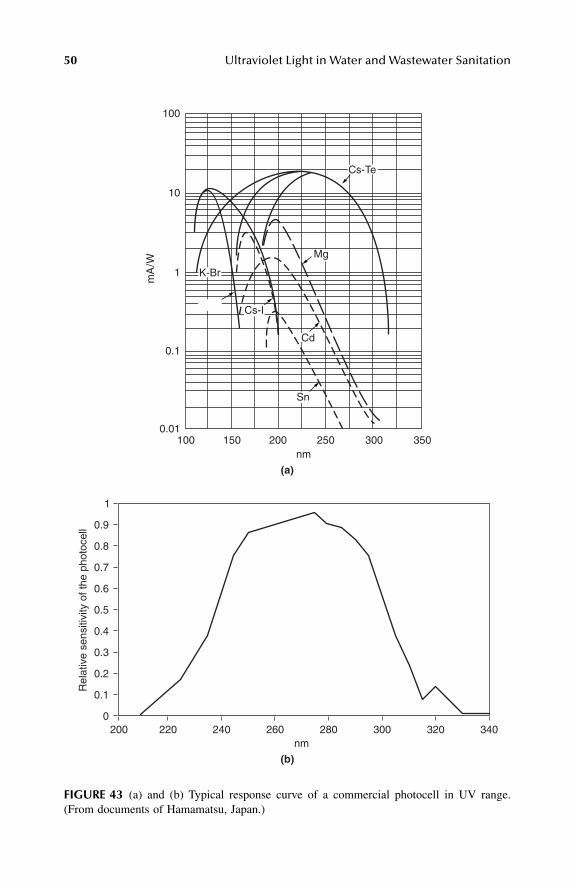
50 Ultraviolet Light in Water and Wastewater Sanitation
FIGURE 43 (a) and (b) Typical response curve of a commercial photocell in UV range.(From documents of Hamamatsu, Japan.)
0.1
0.2
0.3
0.4
0.5
0.6
0.7
0.8
0.9
1
0200 220 240 260 280 300 320 340
nm
Rel
ativ
e se
nsiti
vity
of t
he p
hoto
cell
0.01100 150 200
Sn
nm250 300 350
0.1
mA
/W
1
10
100
Cs-Te
Mg
Cs-I
K-Br
Cd
(a)
(b)
L1603_frame_C02 Page 50 Tuesday, March 5, 2002 5:23 PM
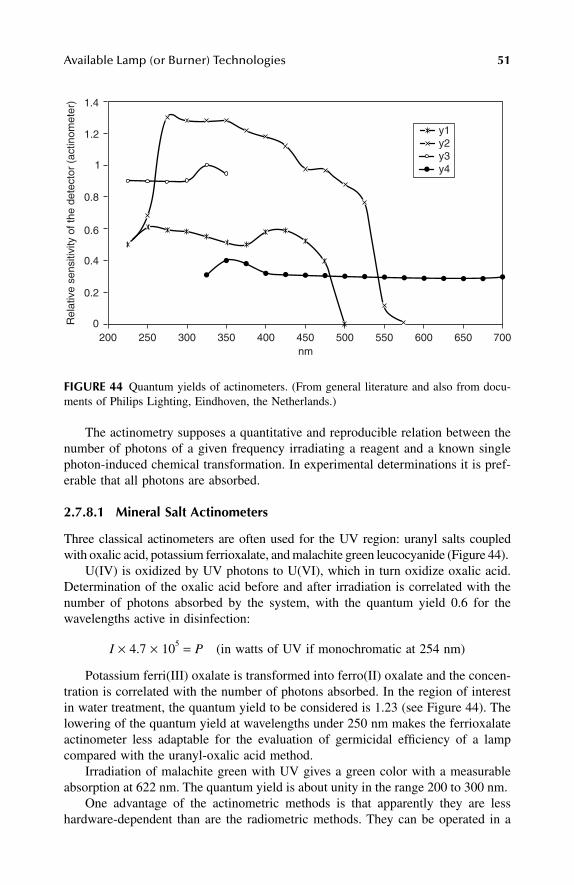
Available Lamp (or Burner) Technologies 51
The actinometry supposes a quantitative and reproducible relation between thenumber of photons of a given frequency irradiating a reagent and a known singlephoton-induced chemical transformation. In experimental determinations it is pref-erable that all photons are absorbed.
2.7.8.1 Mineral Salt Actinometers
Three classical actinometers are often used for the UV region: uranyl salts coupledwith oxalic acid, potassium ferrioxalate, and malachite green leucocyanide (Figure 44).
U(IV) is oxidized by UV photons to U(VI), which in turn oxidize oxalic acid.Determination of the oxalic acid before and after irradiation is correlated with thenumber of photons absorbed by the system, with the quantum yield 0.6 for thewavelengths active in disinfection:
I × 4.7 × 105 = P (in watts of UV if monochromatic at 254 nm)
Potassium ferri(III) oxalate is transformed into ferro(II) oxalate and the concen-tration is correlated with the number of photons absorbed. In the region of interestin water treatment, the quantum yield to be considered is 1.23 (see Figure 44). Thelowering of the quantum yield at wavelengths under 250 nm makes the ferrioxalateactinometer less adaptable for the evaluation of germicidal efficiency of a lampcompared with the uranyl-oxalic acid method.
Irradiation of malachite green with UV gives a green color with a measurableabsorption at 622 nm. The quantum yield is about unity in the range 200 to 300 nm.
One advantage of the actinometric methods is that apparently they are lesshardware-dependent than are the radiometric methods. They can be operated in a
FIGURE 44 Quantum yields of actinometers. (From general literature and also from docu-ments of Philips Lighting, Eindhoven, the Netherlands.)
y1y2y3y4
Rel
ativ
e se
nsiti
vity
of t
he d
etec
tor
(act
inom
eter
)
0200 250 300 350 400 450 500 550 600 650 700
0.2
0.4
0.6
0.8
1.2
1.4
1
nm
L1603_frame_C02 Page 51 Tuesday, March 5, 2002 5:23 PM
52 Ultraviolet Light in Water and Wastewater Sanitation
laboratory with standard equipment available and even applied to reactors on realscale. Drawbacks are:
• Lack of specificity vs. wavelength• Possible inner effects, (i.e., the secondary absorption of photons by the
reaction products of a first reaction)• Very strict requirements for observing the experimental conditions con-
cerning pH, concentration ranges, etc.
Recommended are the experimental procedures described originally and, whennecessary, adapted to the reactor volumes applied:
• For the uranyl oxalate method [Leighton and Forbes, 1930]• For the potassium ferrioxalate method the original procedures described
by Hatchard and Parker [1956]• For the malachite green leucocyanide method by Harris and Kaminsky
[1935]; potential effects of light in the visible range that must be consid-ered; therefore, the operations to be conducted in the “visible dark”
2.7.8.2 Iodide-Iodate UV Actinometer
In the iodide-iodate actinometer [Rahn, 1997] the photolysis of iodide ion in thepresence of iodate ion, which acts as an electron acceptor, corresponds to followingoverall reaction:
8I− + I + 3H2O + (x) hν = 3(I3)− + 6OH− + 6H+
The reaction is considered by hypothesis to proceed through different interme-diates (I°; e-aq.; OH−; H2O2, etc.); however, the overall stoichiometric result is asindicated earlier.
The concentrations utilized are 0.6 mol/l KI and 0.1 mol/l KIO3. The solutionabsorbs in the region of 200 to 300 nm and the reaction is not directly influencedby visible light. The concentration of the triiodide anion can be measured at 352 nm(A = 26,400 l/mol ⋅cm). The quantum yield distributed over the entire range is 0.75.The response depends on the concentration of the reactants.
Recommended preparation of the actinometer solution is as follows: in 10 mLultrapure water (e.g., ISO Nr 3686, 1987) dissolve in sequential order: 1 g KI, 0.214 gKIO3, and 0.038 g borax (to make the solution 0.01 molar in Na2B4O7). Freshpreparation before use is required. The actinometer solution can be controlled asfollows: pH about 9.25; A (l/mol ⋅cm) 0.6 ± 0.03 at 300 nm and 0.04 at 352 nm.The absorbance of the actinometer without UV exposure is negligible at wavelengthshigher than 330 nm. However, the absorbance increases with temperature, aboutlinearly (at least between +10°C and +45°C) by a factor of +14% per increment of10°C; hence, a correction for temperature may be required.
The absorbance (base10) at 20°C of the triiodide ion in water is summarized inTable 6.
O3−
L1603_frame_C02 Page 52 Tuesday, March 5, 2002 5:23 PM
Available Lamp (or Burner) Technologies 53
2.7.8.3 Persulfate tert-Butanol UV Actinometer
Persulfate ion in aqueous solution is decomposed by UV light of wavelengths lowerthan 300 nm [Mark et al., 1990]. Visible light does not interfere. The basic reactionsare:
In the absence of dissolved oxygen, the tertiary-butyl radicals dimerize, and thedimers are not able to act as supporters of chain reactions. In the absence of dissolvedoxygen, the quantum yield Φ is 1.4. In the presence of dissolved oxygen, secondaryreactions can occur:
•CH2C(CH3)2OH + O2 → •O2CH2C(CH3)2OH
These pseudoradicals are not directly chain carriers in the reduction of peroxy-disulfate, but they can further build up oxygen radical ions [Buck et al., 1954], whichare able to promote further reductions of peroxydisulfate ions according to: +S2 → O2 + S + S . The sulfate anion radical is able to further oxidize tert-butanol radicals. In such a case, the quantum yield can be in the range of 1.8 [Becker,1983]. Consequently, control of dissolved oxygen is important to apply this method.
Recommended concentrations are [Winter, 1993]:
• Potassium peroxydisulfate: 0.01 mol/L (2.7 g)• Tertiary butanol: 0.1 mol/L (7.4 g)• Dissolved in 1 L distilled water• Saturated with dissolved oxygen vs. air by bubbling for 30 min
The use of freshly (daily) prepared actinometer solution is recommended.
TABLE 6Absorbance (Base10) at 20°°°°C of the Triiodide Ion in Water
λλλλ (nm) A (l/mol ⋅⋅⋅⋅cm)
330 15,500340 29,500345 23,000352 24,600375 16,751400 6,196425 2,773450 1,388
S2O82− hν 2SO4
•–→+
SO4−• CH3( )3COH H+ SO4
2− •CH2C CH3( )2+ +→ OH+
(O2•–
O82− O4
2− O4−•
L1603_frame_C02 Page 53 Tuesday, March 5, 2002 5:23 PM
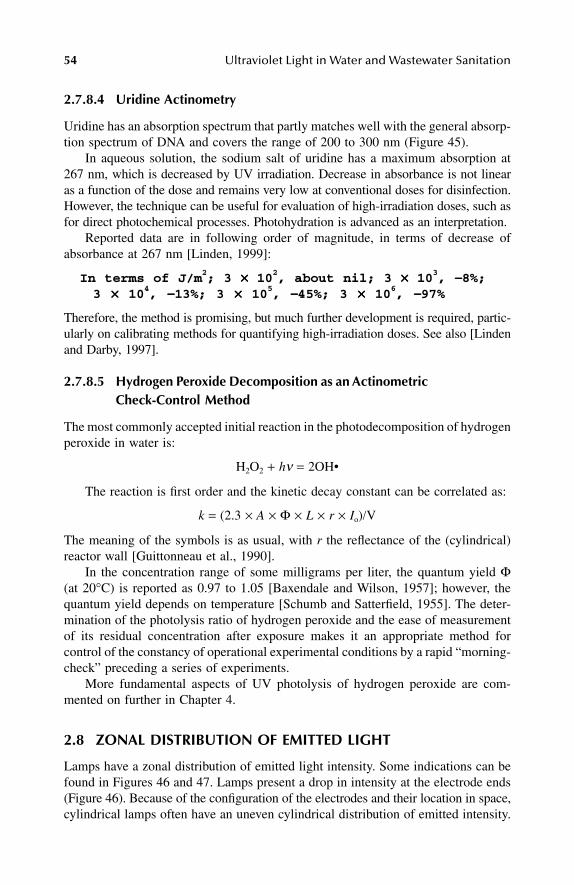
54 Ultraviolet Light in Water and Wastewater Sanitation
2.7.8.4 Uridine Actinometry
Uridine has an absorption spectrum that partly matches well with the general absorp-tion spectrum of DNA and covers the range of 200 to 300 nm (Figure 45).
In aqueous solution, the sodium salt of uridine has a maximum absorption at267 nm, which is decreased by UV irradiation. Decrease in absorbance is not linearas a function of the dose and remains very low at conventional doses for disinfection.However, the technique can be useful for evaluation of high-irradiation doses, such asfor direct photochemical processes. Photohydration is advanced as an interpretation.
Reported data are in following order of magnitude, in terms of decrease ofabsorbance at 267 nm [Linden, 1999]:
In terms of J/m2; 3 ×××× 102, about nil; 3 ×××× 103, −−−−8%;
3 ×××× 104, −−−−13%; 3 ×××× 105, −−−−45%; 3 ×××× 106, −−−−97%
Therefore, the method is promising, but much further development is required, partic-ularly on calibrating methods for quantifying high-irradiation doses. See also [Lindenand Darby, 1997].
2.7.8.5 Hydrogen Peroxide Decomposition as an Actinometric Check-Control Method
The most commonly accepted initial reaction in the photodecomposition of hydrogenperoxide in water is:
H2O2 + hν = 2OH•
The reaction is first order and the kinetic decay constant can be correlated as:
k = (2.3 × A × Φ × L × r × Io)/V
The meaning of the symbols is as usual, with r the reflectance of the (cylindrical)reactor wall [Guittonneau et al., 1990].
In the concentration range of some milligrams per liter, the quantum yield Φ(at 20°C) is reported as 0.97 to 1.05 [Baxendale and Wilson, 1957]; however, thequantum yield depends on temperature [Schumb and Satterfield, 1955]. The deter-mination of the photolysis ratio of hydrogen peroxide and the ease of measurementof its residual concentration after exposure makes it an appropriate method forcontrol of the constancy of operational experimental conditions by a rapid “morning-check” preceding a series of experiments.
More fundamental aspects of UV photolysis of hydrogen peroxide are com-mented on further in Chapter 4.
2.8 ZONAL DISTRIBUTION OF EMITTED LIGHT
Lamps have a zonal distribution of emitted light intensity. Some indications can befound in Figures 46 and 47. Lamps present a drop in intensity at the electrode ends(Figure 46). Because of the configuration of the electrodes and their location in space,cylindrical lamps often have an uneven cylindrical distribution of emitted intensity.
L1603_frame_C02 Page 54 Tuesday, March 5, 2002 5:23 PM
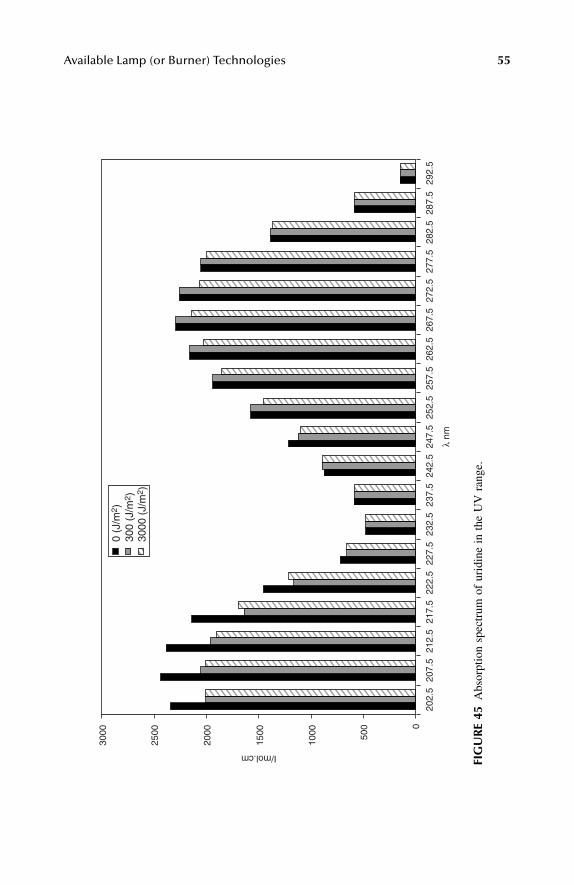
Available Lamp (or Burner) Technologies 55
FIG
UR
E 45
Abs
orpt
ion
spec
trum
of
urid
ine
in t
he U
V r
ange
.
0 (J
/m2 )
300
(J/m
2 )30
00 (
J/m
2 )
0
500
202.
520
7.5
212.
521
7.5
222.
522
7.5
232.
523
7.5
242.
5
λ nm
247.
525
2.5
257.
526
2.5
267.
527
2.5
277.
528
2.5
287.
529
2.5
1000
1500
2000
2500
3000
I/mol.cm
L1603_frame_C02 Page 55 Tuesday, March 5, 2002 5:23 PM
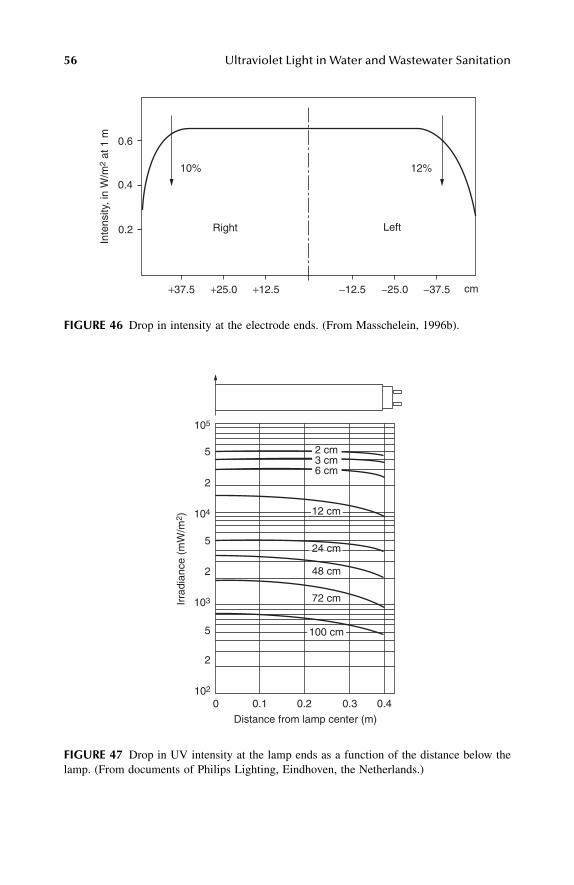
56 Ultraviolet Light in Water and Wastewater Sanitation
FIGURE 46 Drop in intensity at the electrode ends. (From Masschelein, 1996b).
FIGURE 47 Drop in UV intensity at the lamp ends as a function of the distance below thelamp. (From documents of Philips Lighting, Eindhoven, the Netherlands.)
10% 12%
Right Left0.2
0.4
0.6
+37.5 −37.5 cm+25.0 −25.0+12.5 −12.5
Inte
nsity
, in
W/m
2 at
1 m
105
5
2
104
5
2
103
5
2
0 0.1 0.2 0.3 0.4102
Distance from lamp center (m)
12 cm
24 cm
48 cm
72 cm
100 cm
2 cm3 cm6 cm
Irra
dian
ce (
mW
/m2 )
L1603_frame_C02 Page 56 Tuesday, March 5, 2002 5:23 PM
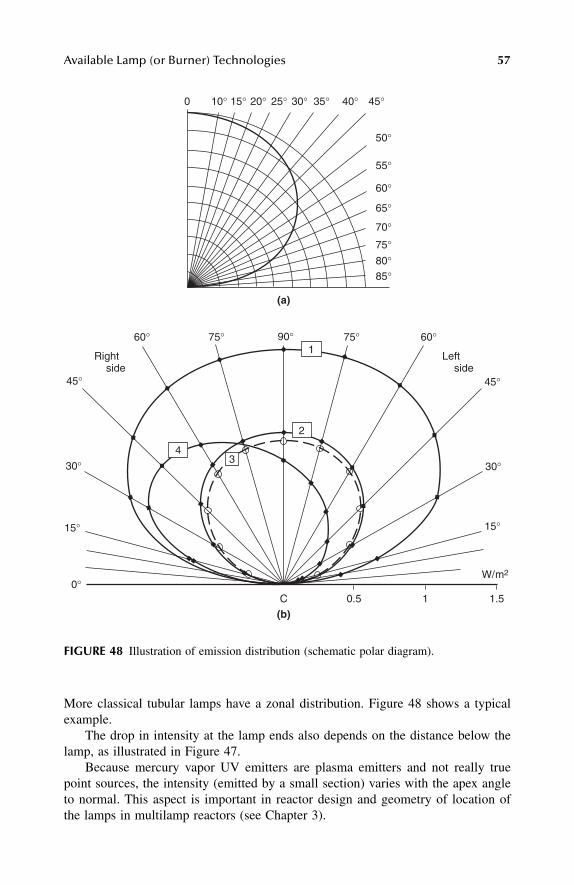
Available Lamp (or Burner) Technologies 57
More classical tubular lamps have a zonal distribution. Figure 48 shows a typicalexample.
The drop in intensity at the lamp ends also depends on the distance below thelamp, as illustrated in Figure 47.
Because mercury vapor UV emitters are plasma emitters and not really truepoint sources, the intensity (emitted by a small section) varies with the apex angleto normal. This aspect is important in reactor design and geometry of location ofthe lamps in multilamp reactors (see Chapter 3).
FIGURE 48 Illustration of emission distribution (schematic polar diagram).
0 10° 15° 20° 25° 30° 35° 40° 45°
45°
60° 75°75° 90° 60°
30°
15°
0°
45°
30°
15°
C
(a)
(b)0.5 1 1.5
W/m2
50°
55°
60°
65°
70°
75°80°85°
1
4
2
3
Left side
Right side
L1603_frame_C02 Page 57 Tuesday, March 5, 2002 5:23 PM
58 Ultraviolet Light in Water and Wastewater Sanitation
For longer and perfectly cylindrical lamps, the radial model (i.e., in which theintensity is emitted identically and orthogonally in all directions from the lampsurface) often ends in good approximations, although it is obviously erroneous from thefundamental point of view [Phillips, 1983, p. 368]. Flat-shaped lamps (see Figure 25)are claimed to emit about two-thirds of the total intensity on the flat side of the lampwall. This is significant for the design of the reactors using this lamp technology.U-shaped lamps as illustrated in Figure 10 and bend-type lamps as illustrated inFigure 17 integrate a compromise solution between cylindrical and flat-shaped lamptechnologies exploiting the zonal distribution of emission, also called polar distri-bution. Information on all these very fundamental aspects should be made availablefor the user.
L1603_frame_C02 Page 58 Tuesday, March 5, 2002 5:23 PM
59
Use of Ultraviolet Light for Disinfection of Drinking Water
3.1 INTRODUCTION
The number of drinking water systems relying on ultraviolet (UV) irradiation fordisinfection of the water, at present, is estimated to be about 3000 to 5000. The useof the technique is probably much higher in number, because these applications areoften not completely recorded:
• Point-of-use of the system on household scale, camp grounds• Recreational and body health applications• Applications in risk zones such as hospitals, nurseries, and schools in
remote areas• Use in food processing industries such as breweries and soft drinks industries• Use on boats, ships, and railway trains
Bactericidal effects of radiant energy from sunlight were first reported in 1877[Downes and Blunt, 1877]. However, thanks to the absorption by atmospheric ozone,the part of UV from sunlight that reaches the surface of the earth is merely confinedto wavelengths higher than 290 nm. The technical use of UV made progress by thediscovery of the mercury vapor lamp by Hewitt [1901] and the drinking water ofthe city of Marseille in France was disinfected with UV light as early as 1910.
The reliable operation and functioning of 5000 plants cannot be ignored in spiteof some suspicions or objections that have been formulated (to be commented onin this chapter). Among them is the absence of active residual concentration in thetreated water [Bott, 1983]. This point has pros and cons, but because no on-sitestorage of chemicals is required, the risk for the operators is eliminated and thesafety measures and equipment for handling chemicals are not needed. In remoteareas, transportation problems may be solved as well. Versions operated on the basisof solar photoelectric generators are developed now and are available.
Since late 1979 in the area of Berlin, Germany, the treated water has not beenpostchlorinated.
3
L1603_Frame_C03 Page 59 Tuesday, March 5, 2002 5:37 PM
60
Ultraviolet Light in Water and Wastewater Sanitation
The question of maintaining an active residual in the water in the distributionsystem certainly remains a subject of option, debate and, local circumstances (i.e.,overall water quality). Although not a central point of present information, this mattershould not be ignored.
3.2 GERMICIDAL ACTION
3.2.1 G
ERMICIDAL
A
CTION
C
URVES
According to the Grothius–Draper law, only absorbed photons are active. Consideringdisinfection with UV light fundamentally to be a photochemical process, the UVphotons must be absorbed to be active. This absorption by cellular material resultsfrom absorption by proteins and by nucleic acids (DNA and RNA). The respectiveabsorbances are indicated in Figure 49.
The overall potential disinfection efficiency of UV-C is illustrated in Figure 50.
3.2.2 M
ECHANISM
OF
D
ISINFECTION
The germicidal efficiency curve closely matches the UV absorbance curve of majorpyrimidine components of nucleic acids, as illustrated in Figure 51.
The absorption in the UV-C range of nucleic acids roughly corresponds to theUV absorption by the pyrimidine bases constituting part of the nucleic acids. Fromphotochemical irradiation of the different pyrimidine bases of nucleic acids, theisolated products are principally dimers, mainly from thymine and secondarily fromcytosine. The relative germicidal action curve as a function of the absorbance isreported in Figure 52.
Bacterial decay is considered to occur by lack of capability of further multipli-cation of organisms, for example, with damaged nucleic acids. Possible repair mech-anisms have been taken into consideration as well. Various mechanisms of repair ofdamaged nucleic acids can occur (Figure 53 [Jagger, 1967]).
The thymine dimer absorbs light (e.g., in the visible range [blue light]), acharacteristic that is supposed to restore the original structure of the damaged nucleicacids. (The question remains open as to whether modified DNA cannot induce[plasmids] modified multiplications if the general protein structure of the cell is notdestroyed as well; see Figures 50(b) and 54.)
Enzymatic repair mechanisms are described involving a UV-exonulease enzymeand a nucleic acid polymerase: [Kiefer, 1977; Gelzhäuser, 1985]. The process supposesan excision of the dimer followed by a shift in one of the wraps of the nucleic acid.
The repair of bacteria after exposure to UV-light is not universal. Some organ-isms seem not to have the capability of repair (
Haemophilus influenzae,
Diplococcuspneumoniae, Bacillus subtilis, Micrococcus radiodurans,
viruses); others haveshown the capability of photorepair (
Streptomyces
spp.,
E. coli
and related entero-bacteria
, Saccharomyces
spp.,
Aerobacter
spp.,
Erwinia
spp.,
Proteus
spp.) [U.S.EPA, 1986]. Similar data have been reported (Bernhardt, 1986)]. The conclusion ofthe latter contribution was that to avoid photorepair, an additional dose was requiredvs. the strict Bunsen–Roscoe law concept. Viruses as such, when damaged by UVirradiation, have no repair mechanisms.
L1603_Frame_C03 Page 60 Tuesday, March 5, 2002 5:37 PM
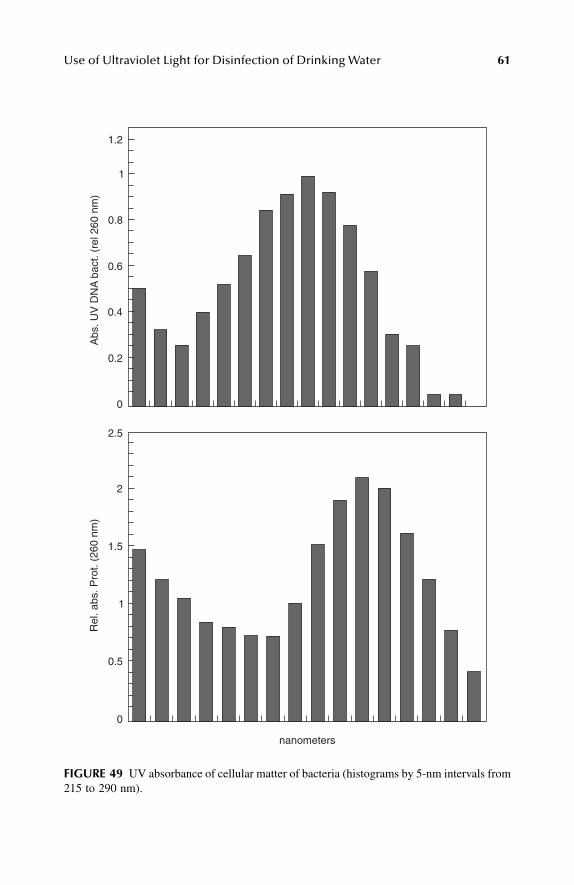
Use of Ultraviolet Light for Disinfection of Drinking Water
61
FIGURE 49
UV absorbance of cellular matter of bacteria (histograms by 5-nm intervals from215 to 290 nm).
1.2
1
0.8
0.6
0.4
0.2
0
2.5
2
1.5
1
0.5
0
nanometers
Rel
. abs
. Pro
t. (2
60 n
m)
Abs
. UV
DN
A b
act.
(rel
260
nm
)
L1603_Frame_C03 Page 61 Tuesday, March 5, 2002 5:37 PM
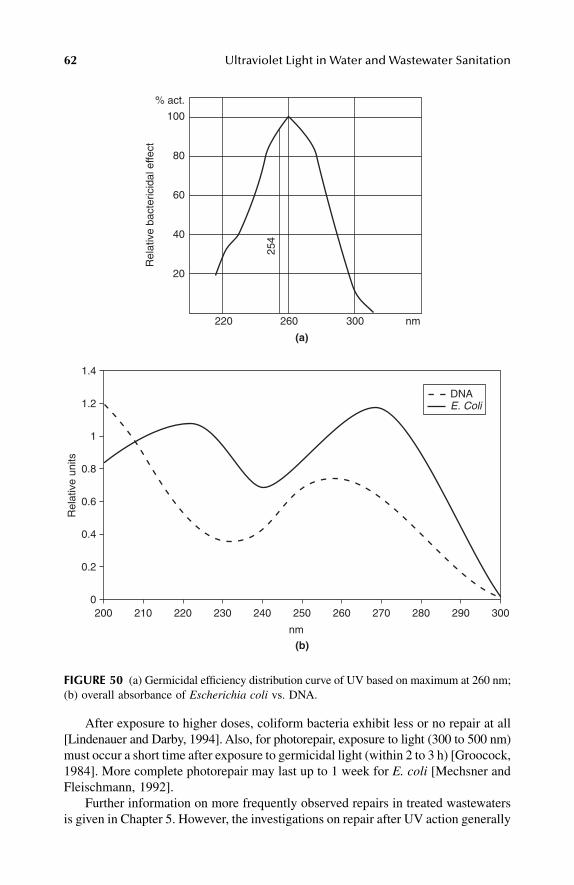
62
Ultraviolet Light in Water and Wastewater Sanitation
After exposure to higher doses, coliform bacteria exhibit less or no repair at all[Lindenauer and Darby, 1994]. Also, for photorepair, exposure to light (300 to 500 nm)must occur a short time after exposure to germicidal light (within 2 to 3 h) [Groocock,1984]. More complete photorepair may last up to 1 week for
E. coli
[Mechsner andFleischmann, 1992].
Further information on more frequently observed repairs in treated wastewatersis given in Chapter 5. However, the investigations on repair after UV action generally
FIGURE 50
(a) Germicidal efficiency distribution curve of UV based on maximum at 260 nm;(b) overall absorbance of
Escherichia coli
vs. DNA.
2000
0.2
0.4
0.6
0.8
1
1.2
1.4
210 220 230 240 250 260 270 280 290 300
Rel
ativ
e un
its
nm
DNAE. Coli
20
40
254
60
80
100
% act.
220 260
(a)
(b)
300 nm
Rel
ativ
e ba
cter
icid
al e
ffect
L1603_Frame_C03 Page 62 Tuesday, March 5, 2002 5:37 PM
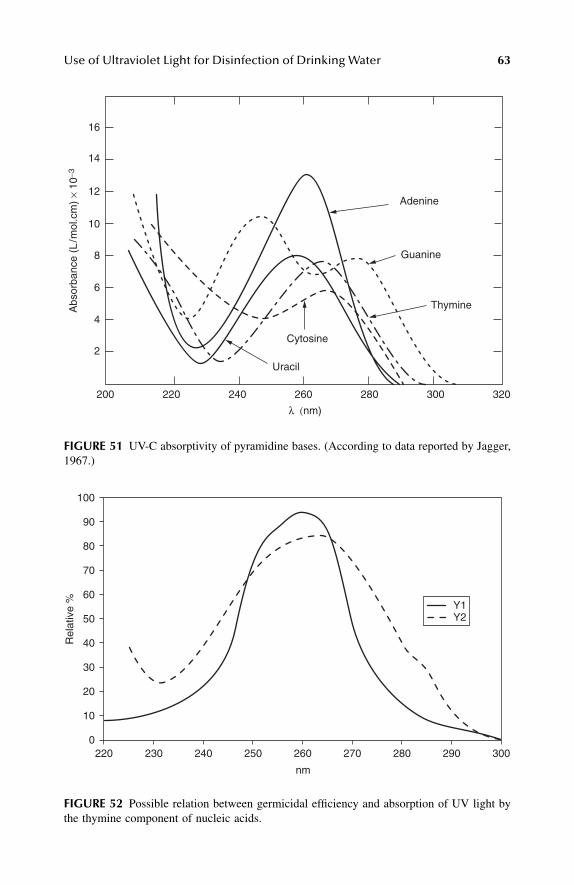
Use of Ultraviolet Light for Disinfection of Drinking Water
63
FIGURE 51
UV-C absorptivity of pyramidine bases. (According to data reported by Jagger,1967.)
FIGURE 52
Possible relation between germicidal efficiency and absorption of UV light bythe thymine component of nucleic acids.
200
16
14
12
10
8
6
4
2
220 240 260 280 300 320
Abs
orba
nce
(L/m
ol.c
m)
× 10
−3
λ (nm)
Cytosine
Adenine
Guanine
Thymine
Uracil
220
100
90
80
70
60
50
40
30
20
10
0230 240 250 260 270 280 290 300
Rel
ativ
e %
nm
Y1Y2
L1603_Frame_C03 Page 63 Tuesday, March 5, 2002 5:37 PM
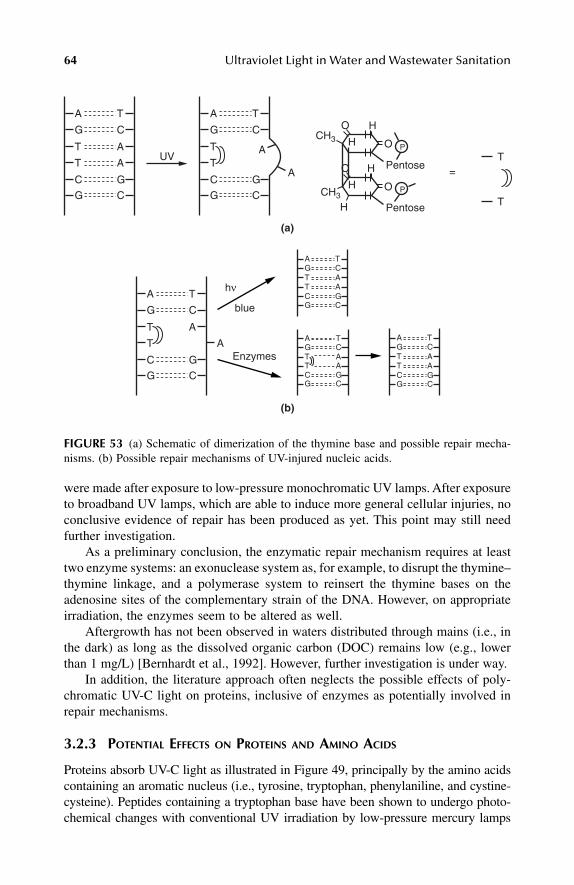
64
Ultraviolet Light in Water and Wastewater Sanitation
were made after exposure to low-pressure monochromatic UV lamps. After exposureto broadband UV lamps, which are able to induce more general cellular injuries, noconclusive evidence of repair has been produced as yet. This point may still needfurther investigation.
As a preliminary conclusion, the enzymatic repair mechanism requires at leasttwo enzyme systems: an exonuclease system as, for example, to disrupt the thymine–thymine linkage, and a polymerase system to reinsert the thymine bases on theadenosine sites of the complementary strain of the DNA. However, on appropriateirradiation, the enzymes seem to be altered as well.
Aftergrowth has not been observed in waters distributed through mains (i.e., inthe dark) as long as the dissolved organic carbon (DOC) remains low (e.g., lowerthan 1 mg/L) [Bernhardt et al., 1992]. However, further investigation is under way.
In addition, the literature approach often neglects the possible effects of poly-chromatic UV-C light on proteins, inclusive of enzymes as potentially involved inrepair mechanisms.
3.2.3 P
OTENTIAL
E
FFECTS
ON
P
ROTEINS
AND
A
MINO
A
CIDS
Proteins absorb UV-C light as illustrated in Figure 49, principally by the amino acidscontaining an aromatic nucleus (i.e., tyrosine, tryptophan, phenylaniline, and cystine-cysteine). Peptides containing a tryptophan base have been shown to undergo photo-chemical changes with conventional UV irradiation by low-pressure mercury lamps
FIGURE 53
(a) Schematic of dimerization of the thymine base and possible repair mecha-nisms. (b) Possible repair mechanisms of UV-injured nucleic acids.
A
G
T
T
C
C
G
A
A
C
T
G
AGTTC
CGAACT
G
AGTTC
CGAACT
G
A
G
T
T
C
C
G
A
A
C
T
G
A
G
T
T
C
C
GA
A
C
T
G
AGTTC
CGAACT
G
H
H
H
O
OCH3
H
H
O
OCH3
P
Pentose
P
Pentose
=T
T
hν
blue
Enzymes
UV
(a)
(b)
L1603_Frame_C03 Page 64 Tuesday, March 5, 2002 5:37 PM
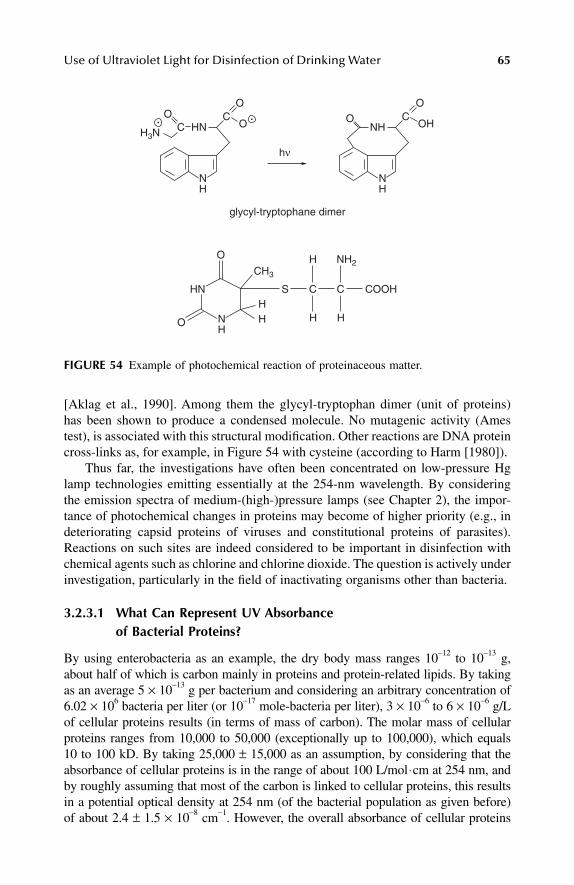
Use of Ultraviolet Light for Disinfection of Drinking Water
65
[Aklag et al., 1990]. Among them the glycyl-tryptophan dimer (unit of proteins)has been shown to produce a condensed molecule. No mutagenic activity (Amestest), is associated with this structural modification. Other reactions are DNA proteincross-links as, for example, in Figure 54 with cysteine (according to Harm [1980]).
Thus far, the investigations have often been concentrated on low-pressure Hglamp technologies emitting essentially at the 254-nm wavelength. By consideringthe emission spectra of medium-(high-)pressure lamps (see Chapter 2), the impor-tance of photochemical changes in proteins may become of higher priority (e.g., indeteriorating capsid proteins of viruses and constitutional proteins of parasites).Reactions on such sites are indeed considered to be important in disinfection withchemical agents such as chlorine and chlorine dioxide. The question is actively underinvestigation, particularly in the field of inactivating organisms other than bacteria.
3.2.3.1 What Can Represent UV Absorbance of Bacterial Proteins?
By using enterobacteria as an example, the dry body mass ranges 10
−
12
to 10
−
13
g,about half of which is carbon mainly in proteins and protein-related lipids. By takingas an average 5
×
10
−
13
g per bacterium and considering an arbitrary concentration of6.02
×
10
6
bacteria per liter (or 10
−
17
mole-bacteria per liter), 3
×
10
−
6
to 6
×
10
−
6
g/Lof cellular proteins results (in terms of mass of carbon). The molar mass of cellularproteins ranges from 10,000 to 50,000 (exceptionally up to 100,000), which equals10 to 100 kD. By taking 25,000
±
15,000 as an assumption, by considering that theabsorbance of cellular proteins is in the range of about 100 L/mol
⋅
cm at 254 nm, andby roughly assuming that most of the carbon is linked to cellular proteins, this resultsin a potential optical density at 254 nm (of the bacterial population as given before)of about 2.4
±
1.5
×
10
−
8
cm
−
1
. However, the overall absorbance of cellular proteins
FIGURE 54
Example of photochemical reaction of proteinaceous matter.
NH
NH
CCO O
O
OH3N HN NH
NH
CO
OH
hν
HN
O NH2CH3
H
HHHO H
S CC COOH
glycyl-tryptophane dimer
L1603_Frame_C03 Page 65 Tuesday, March 5, 2002 5:37 PM
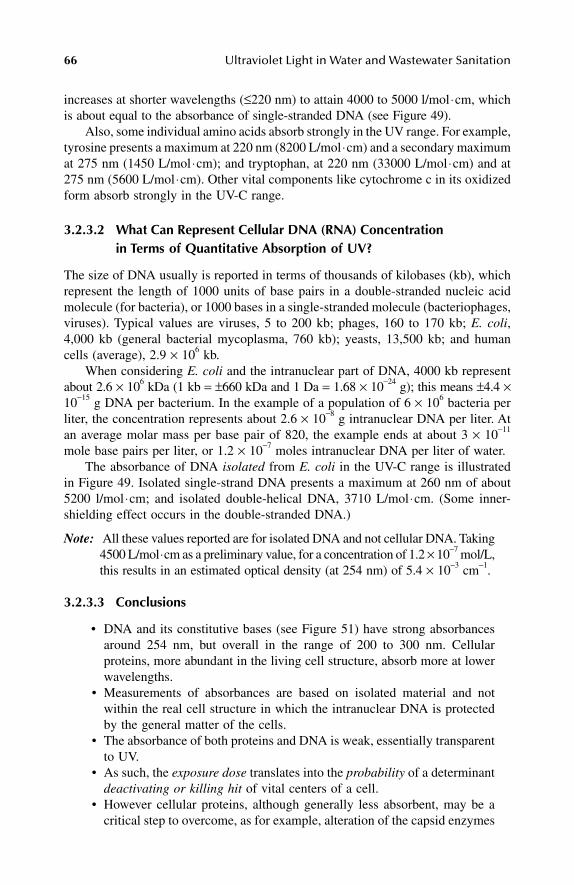
66
Ultraviolet Light in Water and Wastewater Sanitation
increases at shorter wavelengths (
≤
220 nm) to attain 4000 to 5000 l/mol
⋅
cm, whichis about equal to the absorbance of single-stranded DNA (see Figure 49).
Also, some individual amino acids absorb strongly in the UV range. For example,tyrosine presents a maximum at 220 nm (8200 L/mol
⋅
cm) and a secondary maximumat 275 nm (1450 L/mol
⋅
cm); and tryptophan, at 220 nm (33000 L/mol
⋅
cm) and at275 nm (5600 L/mol
⋅
cm). Other vital components like cytochrome c in its oxidizedform absorb strongly in the UV-C range.
3.2.3.2 What Can Represent Cellular DNA (RNA) Concentration in Terms of Quantitative Absorption of UV?
The size of DNA usually is reported in terms of thousands of kilobases (kb), whichrepresent the length of 1000 units of base pairs in a double-stranded nucleic acidmolecule (for bacteria), or 1000 bases in a single-stranded molecule (bacteriophages,viruses). Typical values are viruses, 5 to 200 kb; phages, 160 to 170 kb;
E. coli
,4,000 kb (general bacterial mycoplasma, 760 kb); yeasts, 13,500 kb; and humancells (average), 2.9
×
10
6
kb.When considering
E. coli
and the intranuclear part of DNA, 4000 kb representabout 2.6
×
10
6
kDa (1 kb
=
±
660 kDa and 1 Da
=
1.68
×
10
−
24
g); this means
±
4.4
×
10
−
15
g DNA per bacterium. In the example of a population of 6
×
10
6
bacteria perliter, the concentration represents about 2.6
×
10
−
8
g intranuclear DNA per liter. Atan average molar mass per base pair of 820, the example ends at about 3
×
10
−
11
mole base pairs per liter, or 1.2
×
10
−
7
moles intranuclear DNA per liter of water. The absorbance of DNA
isolated
from
E. coli
in the UV-C range is illustratedin Figure 49. Isolated single-strand DNA presents a maximum at 260 nm of about5200 l/mol
⋅
cm; and isolated double-helical DNA, 3710 L/mol
⋅
cm. (Some inner-shielding effect occurs in the double-stranded DNA.)
Note:
All these values reported are for isolated DNA and not cellular DNA. Taking4500 L/mol
⋅
cm as a preliminary value, for a concentration of 1.2
×
10
−
7
mol/L,this results in an estimated optical density (at 254 nm) of 5.4
×
10
−
3
cm
−
1
.
3.2.3.3 Conclusions
• DNA and its constitutive bases (see Figure 51) have strong absorbancesaround 254 nm, but overall in the range of 200 to 300 nm. Cellularproteins, more abundant in the living cell structure, absorb more at lowerwavelengths.
• Measurements of absorbances are based on isolated material and notwithin the real cell structure in which the intranuclear DNA is protectedby the general matter of the cells.
• The absorbance of both proteins and DNA is weak, essentially transparentto UV.
• As such, the
exposure dose
translates into the
probability
of a determinant
deactivating or killing hit
of vital centers of a cell. • However cellular proteins, although generally less absorbent, may be a
critical step to overcome, as for example, alteration of the capsid enzymes
L1603_Frame_C03 Page 66 Tuesday, March 5, 2002 5:37 PM
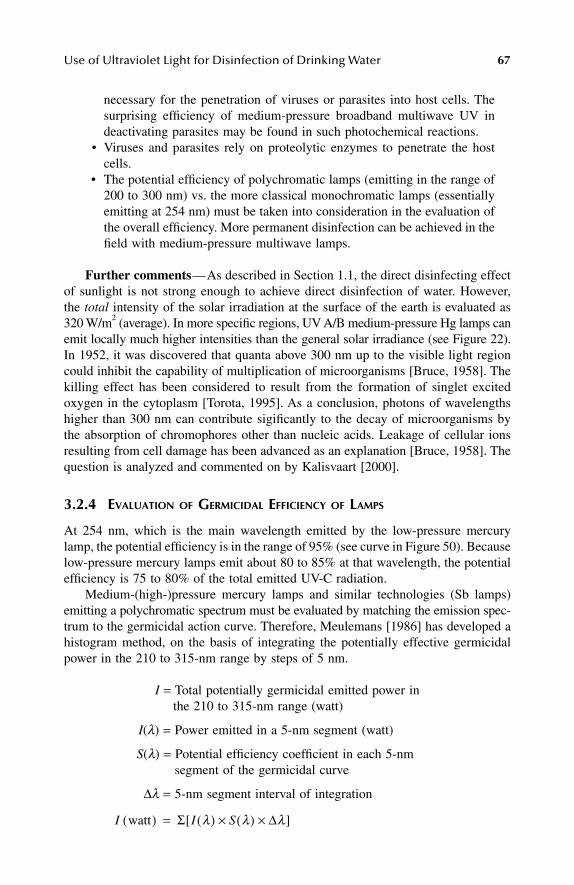
Use of Ultraviolet Light for Disinfection of Drinking Water
67
necessary for the penetration of viruses or parasites into host cells. Thesurprising efficiency of medium-pressure broadband multiwave UV indeactivating parasites may be found in such photochemical reactions.
• Viruses and parasites rely on proteolytic enzymes to penetrate the hostcells.
• The potential efficiency of polychromatic lamps (emitting in the range of200 to 300 nm) vs. the more classical monochromatic lamps (essentiallyemitting at 254 nm) must be taken into consideration in the evaluation ofthe overall efficiency. More permanent disinfection can be achieved in thefield with medium-pressure multiwave lamps.
Further comments
—As described in Section 1.1, the direct disinfecting effectof sunlight is not strong enough to achieve direct disinfection of water. However,the
total
intensity of the solar irradiation at the surface of the earth is evaluated as320 W/m
2
(average). In more specific regions, UV A/B medium-pressure Hg lamps canemit locally much higher intensities than the general solar irradiance (see Figure 22).In 1952, it was discovered that quanta above 300 nm up to the visible light regioncould inhibit the capability of multiplication of microorganisms [Bruce, 1958]. Thekilling effect has been considered to result from the formation of singlet excitedoxygen in the cytoplasm [Torota, 1995]. As a conclusion, photons of wavelengthshigher than 300 nm can contribute sigificantly to the decay of microorganisms bythe absorption of chromophores other than nucleic acids. Leakage of cellular ionsresulting from cell damage has been advanced as an explanation [Bruce, 1958]. Thequestion is analyzed and commented on by Kalisvaart [2000].
3.2.4 E
VALUATION OF GERMICIDAL EFFICIENCY OF LAMPS
At 254 nm, which is the main wavelength emitted by the low-pressure mercurylamp, the potential efficiency is in the range of 95% (see curve in Figure 50). Becauselow-pressure mercury lamps emit about 80 to 85% at that wavelength, the potentialefficiency is 75 to 80% of the total emitted UV-C radiation.
Medium-(high-)pressure mercury lamps and similar technologies (Sb lamps)emitting a polychromatic spectrum must be evaluated by matching the emission spec-trum to the germicidal action curve. Therefore, Meulemans [1986] has developed ahistogram method, on the basis of integrating the potentially effective germicidalpower in the 210 to 315-nm range by steps of 5 nm.
I = Total potentially germicidal emitted power inthe 210 to 315-nm range (watt)
I(λ) = Power emitted in a 5-nm segment (watt)
S(λ) = Potential efficiency coefficient in each 5-nmsegment of the germicidal curve
∆λ = 5-nm segment interval of integration
I watt( ) Σ I λ( ) S λ( ) ∆λ××[ ]=
L1603_Frame_C03 Page 67 Tuesday, March 5, 2002 5:37 PM
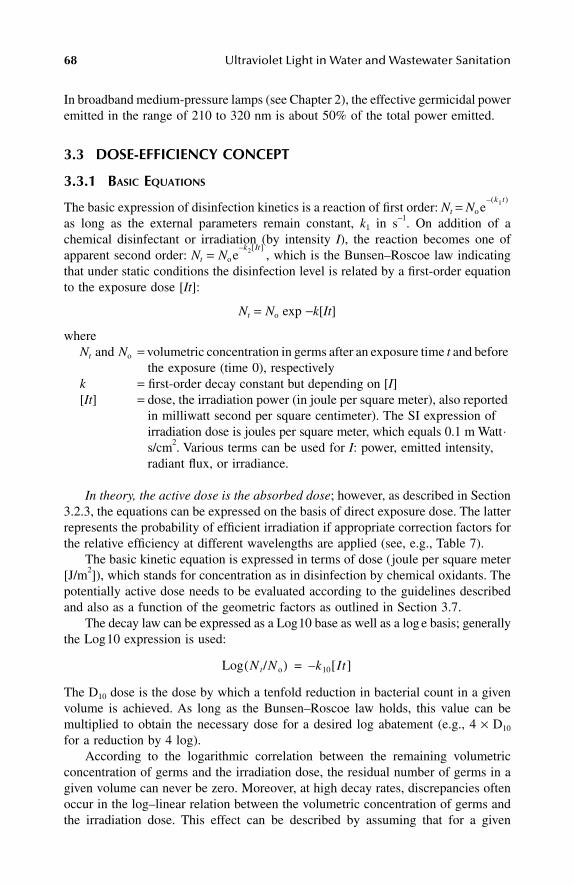
68 Ultraviolet Light in Water and Wastewater Sanitation
In broadband medium-pressure lamps (see Chapter 2), the effective germicidal poweremitted in the range of 210 to 320 nm is about 50% of the total power emitted.
3.3 DOSE-EFFICIENCY CONCEPT
3.3.1 BASIC EQUATIONS
The basic expression of disinfection kinetics is a reaction of first order: Nt = No
as long as the external parameters remain constant, k1 in s−1. On addition of achemical disinfectant or irradiation (by intensity I), the reaction becomes one ofapparent second order: Nt = No , which is the Bunsen–Roscoe law indicatingthat under static conditions the disinfection level is related by a first-order equationto the exposure dose [It]:
Nt = No exp −k[It]
whereNt and No = volumetric concentration in germs after an exposure time t and before
the exposure (time 0), respectively k = first-order decay constant but depending on [I] [It] = dose, the irradiation power (in joule per square meter), also reported
in milliwatt second per square centimeter). The SI expression of irradiation dose is joules per square meter, which equals 0.1 m Watt⋅ s/cm2. Various terms can be used for I: power, emitted intensity, radiant flux, or irradiance.
In theory, the active dose is the absorbed dose; however, as described in Section3.2.3, the equations can be expressed on the basis of direct exposure dose. The latterrepresents the probability of efficient irradiation if appropriate correction factors forthe relative efficiency at different wavelengths are applied (see, e.g., Table 7).
The basic kinetic equation is expressed in terms of dose (joule per square meter[J/m2]), which stands for concentration as in disinfection by chemical oxidants. Thepotentially active dose needs to be evaluated according to the guidelines describedand also as a function of the geometric factors as outlined in Section 3.7.
The decay law can be expressed as a Log10 base as well as a log e basis; generallythe Log10 expression is used:
The D10 dose is the dose by which a tenfold reduction in bacterial count in a givenvolume is achieved. As long as the Bunsen–Roscoe law holds, this value can bemultiplied to obtain the necessary dose for a desired log abatement (e.g., 4 × D10
for a reduction by 4 log). According to the logarithmic correlation between the remaining volumetric
concentration of germs and the irradiation dose, the residual number of germs in agiven volume can never be zero. Moreover, at high decay rates, discrepancies oftenoccur in the log–linear relation between the volumetric concentration of germs andthe irradiation dose. This effect can be described by assuming that for a given
ek1t( )–
ek2 It[ ]–
Log Nt/N o( ) k10 It[ ]–=
L1603_Frame_C03 Page 68 Tuesday, March 5, 2002 5:37 PM
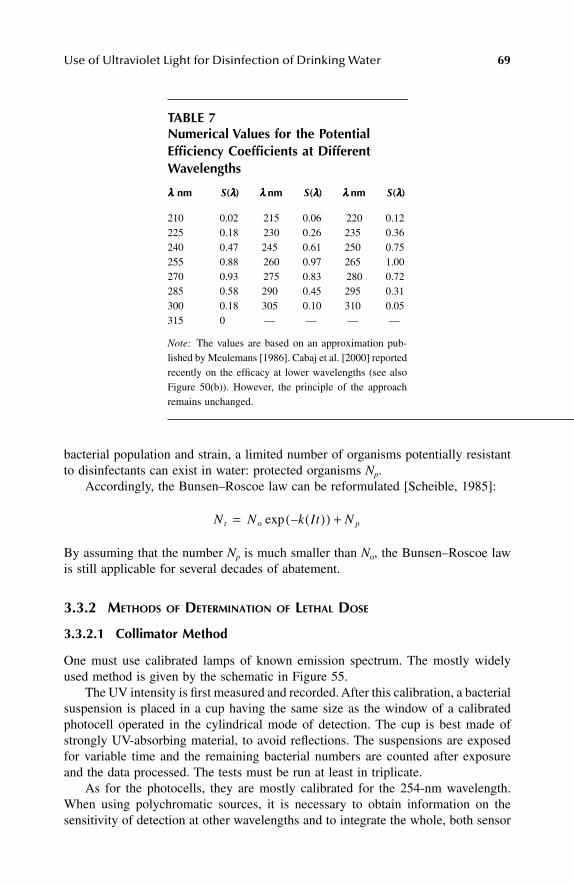
Use of Ultraviolet Light for Disinfection of Drinking Water 69
bacterial population and strain, a limited number of organisms potentially resistantto disinfectants can exist in water: protected organisms Np.
Accordingly, the Bunsen–Roscoe law can be reformulated [Scheible, 1985]:
By assuming that the number Np is much smaller than No, the Bunsen–Roscoe lawis still applicable for several decades of abatement.
3.3.2 METHODS OF DETERMINATION OF LETHAL DOSE
3.3.2.1 Collimator Method
One must use calibrated lamps of known emission spectrum. The mostly widelyused method is given by the schematic in Figure 55.
The UV intensity is first measured and recorded. After this calibration, a bacterialsuspension is placed in a cup having the same size as the window of a calibratedphotocell operated in the cylindrical mode of detection. The cup is best made ofstrongly UV-absorbing material, to avoid reflections. The suspensions are exposedfor variable time and the remaining bacterial numbers are counted after exposureand the data processed. The tests must be run at least in triplicate.
As for the photocells, they are mostly calibrated for the 254-nm wavelength.When using polychromatic sources, it is necessary to obtain information on thesensitivity of detection at other wavelengths and to integrate the whole, both sensor
TABLE 7 Numerical Values for the Potential Efficiency Coefficients at Different Wavelengths
λλλλ nm S(λλλλ) λλλλ nm S(λλλλ) λλλλ nm S(λλλλ)
210 0.02 215 0.06 220 0.12225 0.18 230 0.26 235 0.36240 0.47 245 0.61 250 0.75255 0.88 260 0.97 265 1.00270 0.93 275 0.83 280 0.72285 0.58 290 0.45 295 0.31300 0.18 305 0.10 310 0.05315 0 — — — —
Note: The values are based on an approximation pub-lished by Meulemans [1986]. Cabaj et al. [2000] reportedrecently on the efficacy at lower wavelengths (see alsoFigure 50(b)). However, the principle of the approachremains unchanged.
Nt N o k It( )–( ) N p+exp=
L1603_Frame_C03 Page 69 Tuesday, March 5, 2002 5:37 PM
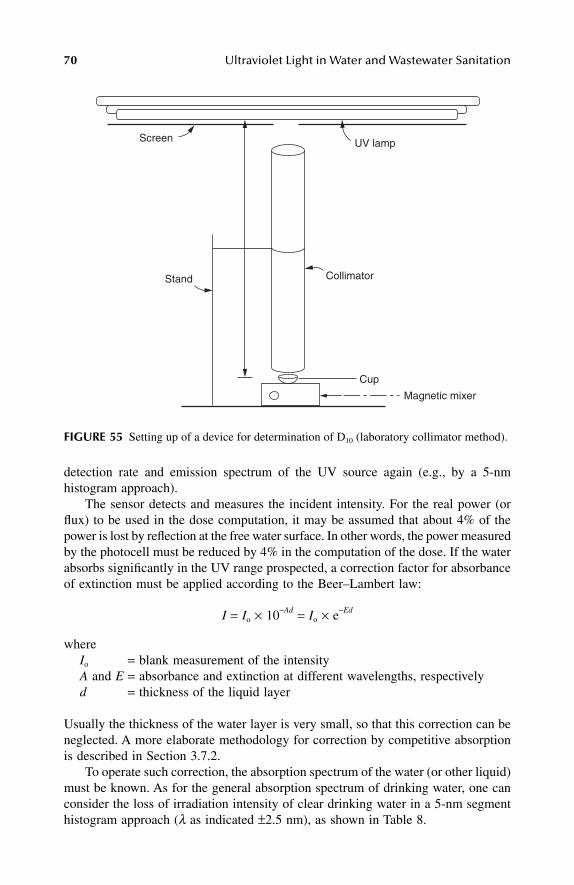
70 Ultraviolet Light in Water and Wastewater Sanitation
detection rate and emission spectrum of the UV source again (e.g., by a 5-nmhistogram approach).
The sensor detects and measures the incident intensity. For the real power (orflux) to be used in the dose computation, it may be assumed that about 4% of thepower is lost by reflection at the free water surface. In other words, the power measuredby the photocell must be reduced by 4% in the computation of the dose. If the waterabsorbs significantly in the UV range prospected, a correction factor for absorbanceof extinction must be applied according to the Beer–Lambert law:
I = Io × 10−Ad = Io × e−Ed
whereIo = blank measurement of the intensityA and E = absorbance and extinction at different wavelengths, respectivelyd = thickness of the liquid layer
Usually the thickness of the water layer is very small, so that this correction can beneglected. A more elaborate methodology for correction by competitive absorptionis described in Section 3.7.2.
To operate such correction, the absorption spectrum of the water (or other liquid)must be known. As for the general absorption spectrum of drinking water, one canconsider the loss of irradiation intensity of clear drinking water in a 5-nm segmenthistogram approach (λ as indicated ±2.5 nm), as shown in Table 8.
FIGURE 55 Setting up of a device for determination of D10 (laboratory collimator method).
UV lampScreen
CollimatorStand
Cup
Magnetic mixer
L1603_Frame_C03 Page 70 Tuesday, March 5, 2002 5:37 PM
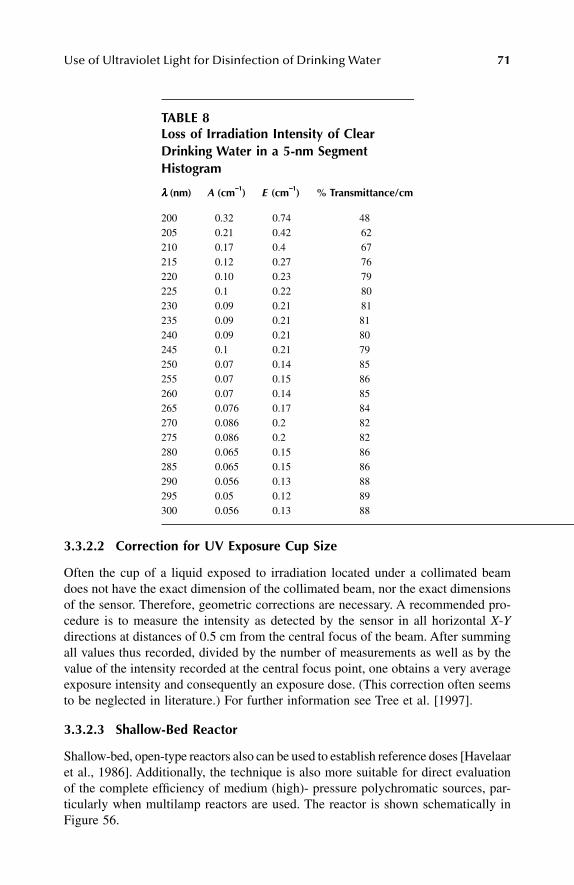
Use of Ultraviolet Light for Disinfection of Drinking Water 71
3.3.2.2 Correction for UV Exposure Cup Size
Often the cup of a liquid exposed to irradiation located under a collimated beamdoes not have the exact dimension of the collimated beam, nor the exact dimensionsof the sensor. Therefore, geometric corrections are necessary. A recommended pro-cedure is to measure the intensity as detected by the sensor in all horizontal X-Ydirections at distances of 0.5 cm from the central focus of the beam. After summingall values thus recorded, divided by the number of measurements as well as by thevalue of the intensity recorded at the central focus point, one obtains a very averageexposure intensity and consequently an exposure dose. (This correction often seemsto be neglected in literature.) For further information see Tree et al. [1997].
3.3.2.3 Shallow-Bed Reactor
Shallow-bed, open-type reactors also can be used to establish reference doses [Havelaaret al., 1986]. Additionally, the technique is also more suitable for direct evaluationof the complete efficiency of medium (high)- pressure polychromatic sources, par-ticularly when multilamp reactors are used. The reactor is shown schematically inFigure 56.
TABLE 8Loss of Irradiation Intensity of Clear Drinking Water in a 5-nm Segment Histogram
λλλλ (nm) A (cm−−−−1) E (cm−−−−1) % Transmittance/cm
200 0.32 0.74 48205 0.21 0.42 62210 0.17 0.4 67215 0.12 0.27 76220 0.10 0.23 79225 0.1 0.22 80230 0.09 0.21 81235 0.09 0.21 81240 0.09 0.21 80245 0.1 0.21 79250 0.07 0.14 85255 0.07 0.15 86260 0.07 0.14 85265 0.076 0.17 84270 0.086 0.2 82275 0.086 0.2 82280 0.065 0.15 86285 0.065 0.15 86290 0.056 0.13 88295 0.05 0.12 89300 0.056 0.13 88
L1603_Frame_C03 Page 71 Tuesday, March 5, 2002 5:37 PM
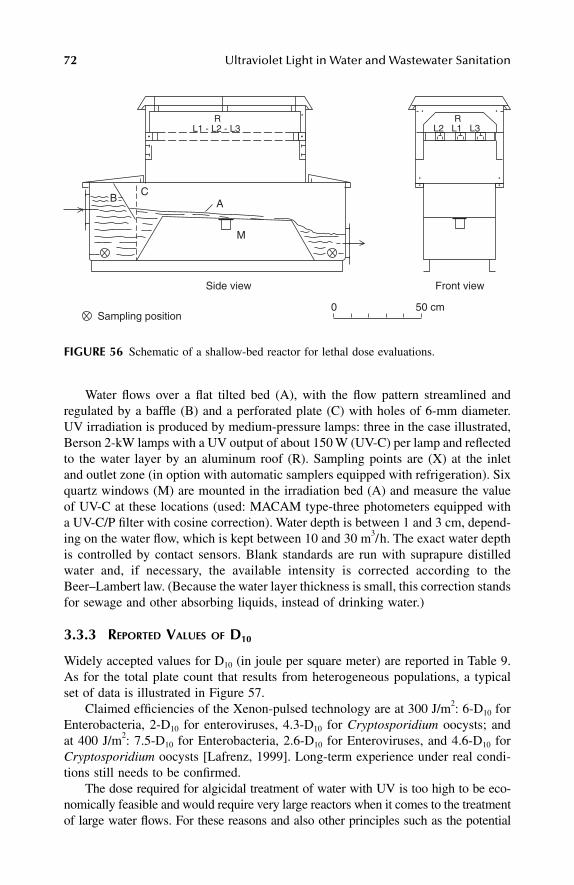
72 Ultraviolet Light in Water and Wastewater Sanitation
Water flows over a flat tilted bed (A), with the flow pattern streamlined andregulated by a baffle (B) and a perforated plate (C) with holes of 6-mm diameter.UV irradiation is produced by medium-pressure lamps: three in the case illustrated,Berson 2-kW lamps with a UV output of about 150 W (UV-C) per lamp and reflectedto the water layer by an aluminum roof (R). Sampling points are (X) at the inletand outlet zone (in option with automatic samplers equipped with refrigeration). Sixquartz windows (M) are mounted in the irradiation bed (A) and measure the valueof UV-C at these locations (used: MACAM type-three photometers equipped witha UV-C/P filter with cosine correction). Water depth is between 1 and 3 cm, depend-ing on the water flow, which is kept between 10 and 30 m3/h. The exact water depthis controlled by contact sensors. Blank standards are run with suprapure distilledwater and, if necessary, the available intensity is corrected according to theBeer–Lambert law. (Because the water layer thickness is small, this correction standsfor sewage and other absorbing liquids, instead of drinking water.)
3.3.3 REPORTED VALUES OF D10
Widely accepted values for D10 (in joule per square meter) are reported in Table 9.As for the total plate count that results from heterogeneous populations, a typicalset of data is illustrated in Figure 57.
Claimed efficiencies of the Xenon-pulsed technology are at 300 J/m2: 6-D10 forEnterobacteria, 2-D10 for enteroviruses, 4.3-D10 for Cryptosporidium oocysts; andat 400 J/m2: 7.5-D10 for Enterobacteria, 2.6-D10 for Enteroviruses, and 4.6-D10 forCryptosporidium oocysts [Lafrenz, 1999]. Long-term experience under real condi-tions still needs to be confirmed.
The dose required for algicidal treatment of water with UV is too high to be eco-nomically feasible and would require very large reactors when it comes to the treatmentof large water flows. For these reasons and also other principles such as the potential
FIGURE 56 Schematic of a shallow-bed reactor for lethal dose evaluations.
RL1 - L2 - L3 L2 L1 L3
R
BC
A
M
Side view Front view
Sampling position0 50 cm
L1603_Frame_C03 Page 72 Tuesday, March 5, 2002 5:37 PM
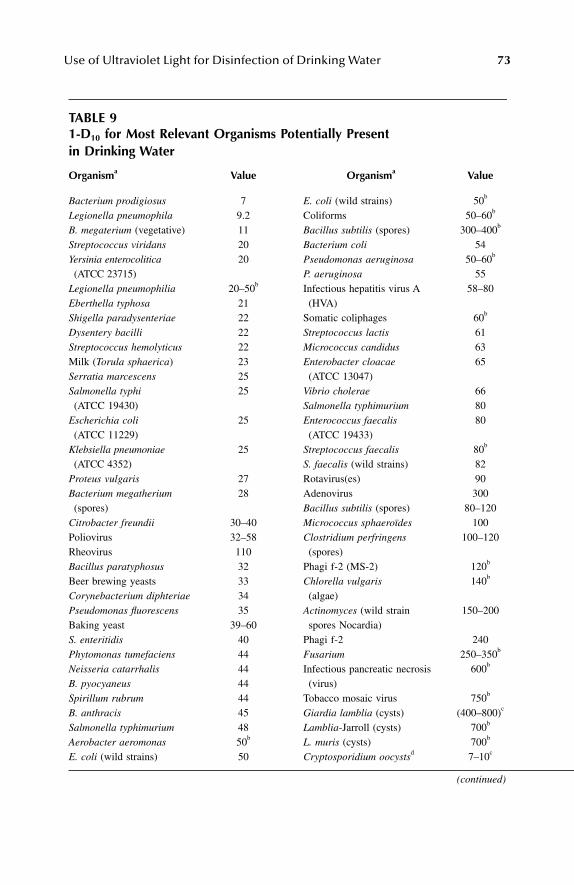
Use of Ultraviolet Light for Disinfection of Drinking Water 73
TABLE 91-D10 for Most Relevant Organisms Potentially Present in Drinking Water
Organisma Value Organisma Value
Bacterium prodigiosusLegionella pneumophilaB. megaterium (vegetative)Streptococcus viridansYersinia enterocolitica
(ATCC 23715)Legionella pneumophiliaEberthella typhosaShigella paradysenteriaeDysentery bacilliStreptococcus hemolyticusMilk (Torula sphaerica)Serratia marcescensSalmonella typhi (ATCC 19430)
Escherichia coli (ATCC 11229)
Klebsiella pneumoniae (ATCC 4352)
Proteus vulgarisBacterium megatherium (spores)
Citrobacter freundiiPoliovirusRheovirusBacillus paratyphosusBeer brewing yeastsCorynebacterium diphteriaePseudomonas fluorescensBaking yeastS. enteritidisPhytomonas tumefaciensNeisseria catarrhalisB. pyocyaneusSpirillum rubrumB. anthracisSalmonella typhimuriumAerobacter aeromonasE. coli (wild strains)
79.2112020
20–50b
21222222232525
25
25
2728
30–4032–5811032333435
39–604044444444454850b
50
E. coli (wild strains)ColiformsBacillus subtilis (spores)Bacterium coliPseudomonas aeruginosaP. aeruginosaInfectious hepatitis virus A (HVA)
Somatic coliphagesStreptococcus lactisMicrococcus candidusEnterobacter cloacae (ATCC 13047)
Vibrio choleraeSalmonella typhimuriumEnterococcus faecalis (ATCC 19433)
Streptococcus faecalisS. faecalis (wild strains)Rotavirus(es)AdenovirusBacillus subtilis (spores)Micrococcus sphaeroïdesClostridium perfringens (spores)
Phagi f-2 (MS-2)Chlorella vulgaris (algae)
Actinomyces (wild strain spores Nocardia)
Phagi f-2FusariumInfectious pancreatic necrosis (virus)
Tobacco mosaic virusGiardia lamblia (cysts)Lamblia-Jarroll (cysts)L. muris (cysts)Cryptosporidium oocystsd
50b
50–60b
300–400b
5450–60b
5558–80
60b
616365
668080
80b
8290300
80–120100
100–120
120b
140b
150–200
240250–350b
600b
750b
(400–800)c 700b
700b
7–10c
(continued)
L1603_Frame_C03 Page 73 Tuesday, March 5, 2002 5:37 PM
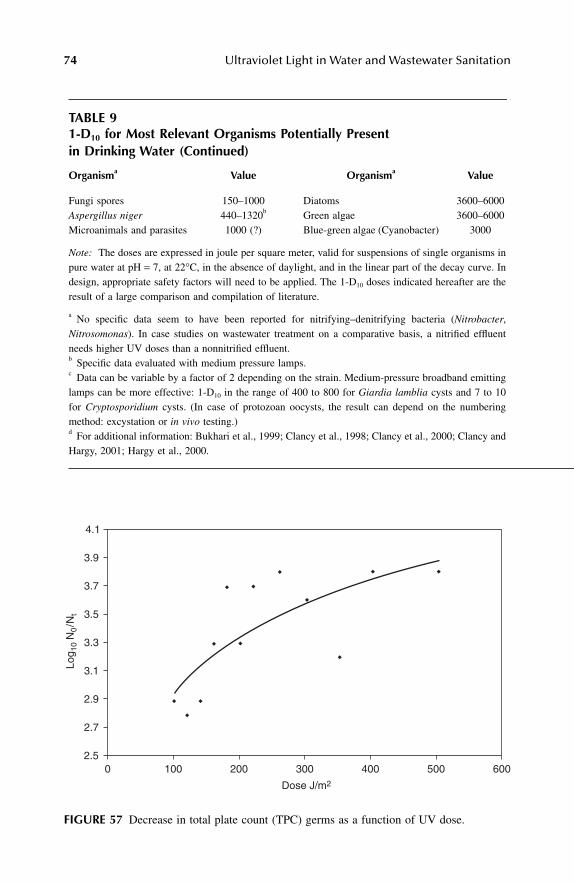
74 Ultraviolet Light in Water and Wastewater Sanitation
TABLE 91-D10 for Most Relevant Organisms Potentially Present in Drinking Water (Continued)
Organisma Value Organisma Value
Fungi spores 150–1000 Diatoms 3600–6000Aspergillus niger 440–1320b Green algae 3600–6000Microanimals and parasites 1000 (?) Blue-green algae (Cyanobacter) 3000
Note: The doses are expressed in joule per square meter, valid for suspensions of single organisms inpure water at pH = 7, at 22°C, in the absence of daylight, and in the linear part of the decay curve. Indesign, appropriate safety factors will need to be applied. The 1-D10 doses indicated hereafter are theresult of a large comparison and compilation of literature.
a No specific data seem to have been reported for nitrifying–denitrifying bacteria (Nitrobacter,Nitrosomonas). In case studies on wastewater treatment on a comparative basis, a nitrified effluentneeds higher UV doses than a nonnitrified effluent.b Specific data evaluated with medium pressure lamps.c Data can be variable by a factor of 2 depending on the strain. Medium-pressure broadband emittinglamps can be more effective: 1-D10 in the range of 400 to 800 for Giardia lamblia cysts and 7 to 10for Cryptosporidium cysts. (In case of protozoan oocysts, the result can depend on the numberingmethod: excystation or in vivo testing.)d For additional information: Bukhari et al., 1999; Clancy et al., 1998; Clancy et al., 2000; Clancy andHargy, 2001; Hargy et al., 2000.
FIGURE 57 Decrease in total plate count (TPC) germs as a function of UV dose.
0
4.1
3.9
3.7
3.5
3.3
3.1
2.9
2.7
2.5100 200 300 400 500 600
Log 1
0 N
0/N
t
Dose J/m2
L1603_Frame_C03 Page 74 Tuesday, March 5, 2002 5:37 PM
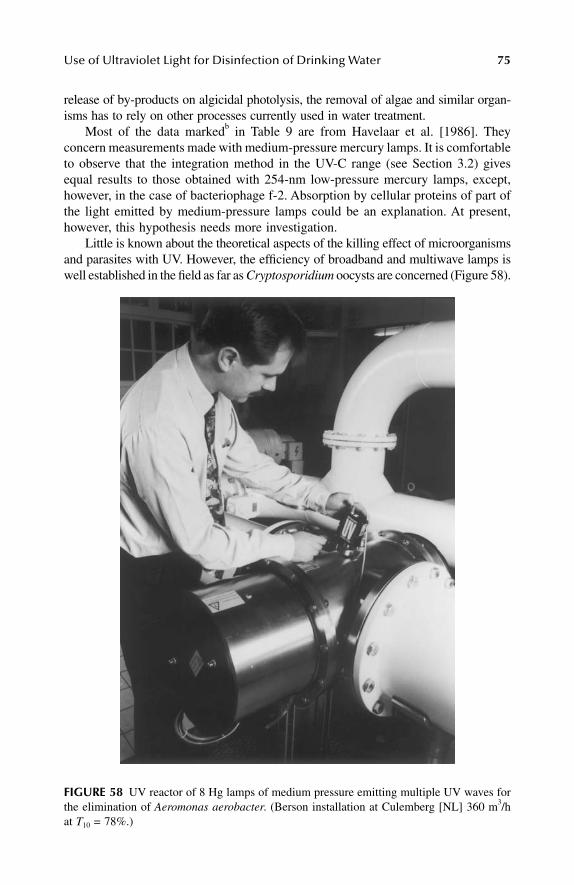
Use of Ultraviolet Light for Disinfection of Drinking Water 75
release of by-products on algicidal photolysis, the removal of algae and similar organ-isms has to rely on other processes currently used in water treatment.
Most of the data markedb in Table 9 are from Havelaar et al. [1986]. Theyconcern measurements made with medium-pressure mercury lamps. It is comfortableto observe that the integration method in the UV-C range (see Section 3.2) givesequal results to those obtained with 254-nm low-pressure mercury lamps, except,however, in the case of bacteriophage f-2. Absorption by cellular proteins of part ofthe light emitted by medium-pressure lamps could be an explanation. At present,however, this hypothesis needs more investigation.
Little is known about the theoretical aspects of the killing effect of microorganismsand parasites with UV. However, the efficiency of broadband and multiwave lamps iswell established in the field as far as Cryptosporidium oocysts are concerned (Figure 58).
FIGURE 58 UV reactor of 8 Hg lamps of medium pressure emitting multiple UV waves forthe elimination of Aeromonas aerobacter. (Berson installation at Culemberg [NL] 360 m3/hat T10 = 78%.)
L1603_Frame_C03 Page 75 Tuesday, March 5, 2002 5:37 PM
76 Ultraviolet Light in Water and Wastewater Sanitation
3.3.4 EFFECT OF WATER TEMPERATURE
The effect of the lamp temperature has been commented on in Chapter 2. The directeffect of the water temperature on the lethal dose for 22°C is negligible in drinkingwater treatment—less than 5 to 10% acceleration or slowing down, by either anincrease or a decrease of 10°C [Meulemans, 1986].
3.3.5 EFFECT OF pH
The complementary effect of the pH of the water has not been investigated much.In experiments on distilled water, the pH generally has been maintained at 7. Ininvestigations on drinking water, the pH was as such (i.e., between 7 and 8).
3.4 REPRESENTATIVE TEST ORGANISMS
From the table of D10 values, it can be considered that Enterococcus faecalis is arepresentative test organism for the group of Enterobacteria, and spores of Clostrid-ium perfringens or phagi f-2 (MS-2) are more resistent than Enteroviruses. Sporesoften show a lethal-lag phase (see Section 3.6). Phagi f-2 is a more easy andrepresentative criterion to check virucidal efficiency [Severin et al., 1984; Havelaarand Hogeboom, 1984; Havelaar et al., 1986; Masschelein et al., 1989]. See alsoMaier et al. [1995] and ISO-DIS 10705 [1993] Part 1.
A safety factor of 1.3 has been suggested for 4-D10 inactivation of viruses vs.the observed value for 4-D10 for phagi f-2 (MS-2). In some experimental conditionsa biphasic decay curve can be observed, [Martiny et al., 1988] (tailing-off) after 2to 3 logs of decay. In such a case an empirical correlation with the dose has beenproposed: dose = a [Log(N/No)]
2 − b Log(N/No) − c [Wright et al., 1999].As for parasites, particularly Cryptosporidium oocysts, it appears that a lethal-
tail phase also exists [Finch and Belosevic, 1999]. The investigations require highlyconcentrated suspensions of oocysts, which do not correspond to real concentrationsof parasites in the field.
3.5 COMPETITIVE EFFECTS IN DISINFECTION WITH ULTRAVIOLET LIGHT
3.5.1 COMPETITIVE ABSORPTION BY COMPONENTS OF DRINKING WATER
The absorbance (log base 10) has been measured for the 254-nm Hg emission line.For evaluation in technical design, the transparency in percentage of a 10-cm layeris appropriate as well. Data for usual components potentially present in drinkingwater are listed in Table 10.
Multiwave lamps having a more diversified emission can remain active by theemissions that are less absorbed than at 254 nm.
L1603_Frame_C03 Page 76 Tuesday, March 5, 2002 5:37 PM
Use of Ultraviolet Light for Disinfection of Drinking Water 77
3.5.2 STEERING PARAMETERS
From practical experience, the UV disinfection method requires specific evaluationin the design phase and special attention in operation if one of following parametersexceeds the very limiting values indicated:
Turbidity often is the critical parameter considered. However, thanks to scatteringof the light, the pathway is increased; and in some instances, turbidity can have apromotional effect on the disinfection efficiency [Masschelein et al., 1989]. In fact,general UV-C absorbance is an important overall parameter to be considered.
Note: Preformed chloramines do not lower the disinfection power of UV-C underconditions currently occurring in drinking water. In addition, under suchconditions, no trihalomethanes (THMs) are formed in the presence or absence
TABLE 10Absorbance at 254 nm of Potential Constituents of Drinking Water
Constituent A (in cm−1) %T (1 cm−1)
Suprapure distilled water 10−6 99.999…Good quality groundwater 0.005–0.01 89–79Good quality distribution water 0.02–0.11 63–78Bicarbonate ion (315 mg/l) 35 × 10−6 99.92Carbonate ion (50 mg/l) 4 × 10⁻⁶ 99.99Sulfate ion (120 mg/l) 48 × 10−6 99.9Nitrate ion (50 mg/l) 0.0025 99a
Fe3+ − Fe(OH)3 (200 mg/l as Fe) 0.04 91Aluminum hydroxide (hydrated 0.2 mg/l as Al) Transparent at 254 nmNatural humic acids in water (according to Wuhrmann-Berichte EAWAG, Switzerland)
0.07–0.16 85–70
For comparative informationSecondary clarified effluentGroundwater with high-concentration humic acidsb
0.17–0.20.11–0.5
68–6378–32
a The absorbance of the nitrate ion and the possible formation of nitrite is discussedin more detail in Chapter 4. Humic acids can be a major optical interferent in theabsorption of the 254-nm wavelength light. If present in natural sources, they arebest removed before the application.b See Eaton [1995].
Turbidity >40 ppm SiO2; or 16 NTUColor >10° Hazen Iron content >4 mg/lBOD-5 >10 mg/lSuspended solids >15 mg/lAmino acids and proteins >3 mg/l
L1603_Frame_C03 Page 77 Tuesday, March 5, 2002 5:37 PM
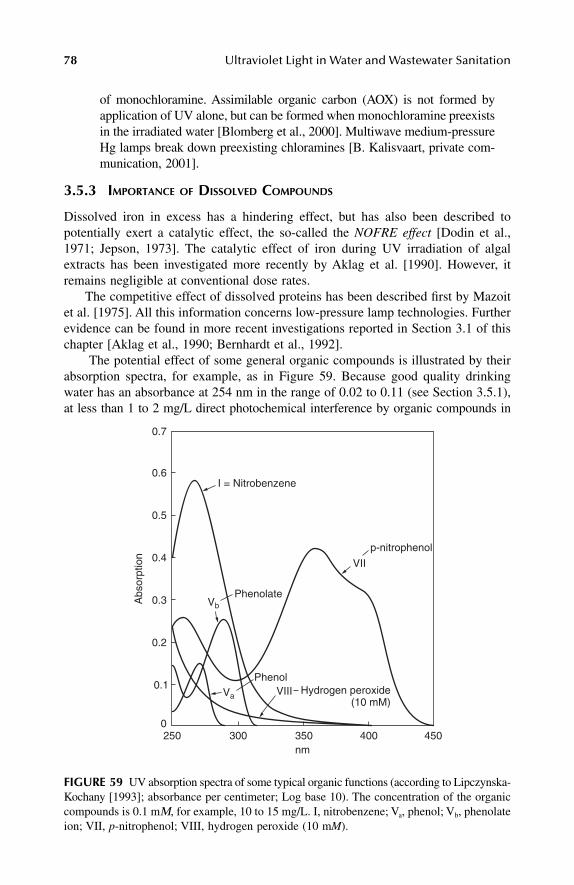
78 Ultraviolet Light in Water and Wastewater Sanitation
of monochloramine. Assimilable organic carbon (AOX) is not formed byapplication of UV alone, but can be formed when monochloramine preexistsin the irradiated water [Blomberg et al., 2000]. Multiwave medium-pressureHg lamps break down preexisting chloramines [B. Kalisvaart, private com-munication, 2001].
3.5.3 IMPORTANCE OF DISSOLVED COMPOUNDS
Dissolved iron in excess has a hindering effect, but has also been described topotentially exert a catalytic effect, the so-called the NOFRE effect [Dodin et al.,1971; Jepson, 1973]. The catalytic effect of iron during UV irradiation of algalextracts has been investigated more recently by Aklag et al. [1990]. However, itremains negligible at conventional dose rates.
The competitive effect of dissolved proteins has been described first by Mazoitet al. [1975]. All this information concerns low-pressure lamp technologies. Furtherevidence can be found in more recent investigations reported in Section 3.1 of thischapter [Aklag et al., 1990; Bernhardt et al., 1992].
The potential effect of some general organic compounds is illustrated by theirabsorption spectra, for example, as in Figure 59. Because good quality drinkingwater has an absorbance at 254 nm in the range of 0.02 to 0.11 (see Section 3.5.1),at less than 1 to 2 mg/L direct photochemical interference by organic compounds in
FIGURE 59 UV absorption spectra of some typical organic functions (according to Lipczynska-Kochany [1993]; absorbance per centimeter; Log base 10). The concentration of the organiccompounds is 0.1 mΜ, for example, 10 to 15 mg/L. I, nitrobenzene; Va, phenol; Vb, phenolateion; VII, p-nitrophenol; VIII, hydrogen peroxide (10 mM).
250
0.7
0.6
0.5
0.4
0.3
0.2
0.1
0300 350 400 450
Abs
orpt
ion
nm
VIII
VII
I = Nitrobenzene
Vb
Va
p-nitrophenol
Hydrogen peroxide(10 mM)
Phenol
Phenolate
L1603_Frame_C03 Page 78 Tuesday, March 5, 2002 5:37 PM
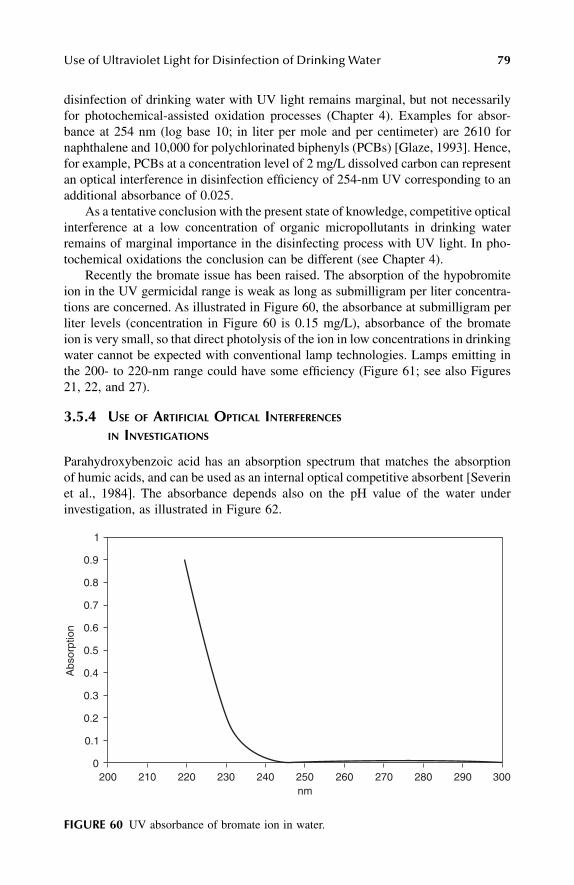
Use of Ultraviolet Light for Disinfection of Drinking Water 79
disinfection of drinking water with UV light remains marginal, but not necessarilyfor photochemical-assisted oxidation processes (Chapter 4). Examples for absor-bance at 254 nm (log base 10; in liter per mole and per centimeter) are 2610 fornaphthalene and 10,000 for polychlorinated biphenyls (PCBs) [Glaze, 1993]. Hence,for example, PCBs at a concentration level of 2 mg/L dissolved carbon can representan optical interference in disinfection efficiency of 254-nm UV corresponding to anadditional absorbance of 0.025.
As a tentative conclusion with the present state of knowledge, competitive opticalinterference at a low concentration of organic micropollutants in drinking waterremains of marginal importance in the disinfecting process with UV light. In pho-tochemical oxidations the conclusion can be different (see Chapter 4).
Recently the bromate issue has been raised. The absorption of the hypobromiteion in the UV germicidal range is weak as long as submilligram per liter concentra-tions are concerned. As illustrated in Figure 60, the absorbance at submilligram perliter levels (concentration in Figure 60 is 0.15 mg/L), absorbance of the bromateion is very small, so that direct photolysis of the ion in low concentrations in drinkingwater cannot be expected with conventional lamp technologies. Lamps emitting inthe 200- to 220-nm range could have some efficiency (Figure 61; see also Figures21, 22, and 27).
3.5.4 USE OF ARTIFICIAL OPTICAL INTERFERENCES IN INVESTIGATIONS
Parahydroxybenzoic acid has an absorption spectrum that matches the absorptionof humic acids, and can be used as an internal optical competitive absorbent [Severinet al., 1984]. The absorbance depends also on the pH value of the water underinvestigation, as illustrated in Figure 62.
FIGURE 60 UV absorbance of bromate ion in water.
200 210 220 230 240 250 260 270 280 2900
0.1
0.2
0.3
0.4
0.5
0.6
0.7
0.8
0.9
1
300
Abs
orpt
ion
nm
L1603_Frame_C03 Page 79 Tuesday, March 5, 2002 5:37 PM
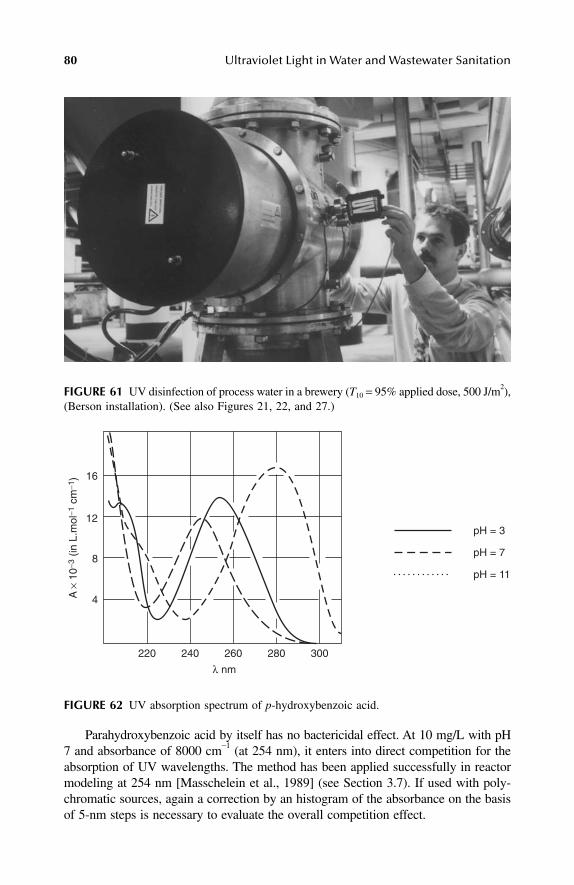
80 Ultraviolet Light in Water and Wastewater Sanitation
Parahydroxybenzoic acid by itself has no bactericidal effect. At 10 mg/L with pH7 and absorbance of 8000 cm−1 (at 254 nm), it enters into direct competition for theabsorption of UV wavelengths. The method has been applied successfully in reactormodeling at 254 nm [Masschelein et al., 1989] (see Section 3.7). If used with poly-chromatic sources, again a correction by an histogram of the absorbance on the basisof 5-nm steps is necessary to evaluate the overall competition effect.
FIGURE 61 UV disinfection of process water in a brewery (T10 = 95% applied dose, 500 J/m2),(Berson installation). (See also Figures 21, 22, and 27.)
FIGURE 62 UV absorption spectrum of p-hydroxybenzoic acid.
4A ×
10−
3 (in
L.m
ol−1
cm
−1)
λ nm
220 240 260 280 300
pH = 3
pH = 7
pH = 11
8
12
16
L1603_Frame_C03 Page 80 Tuesday, March 5, 2002 5:37 PM
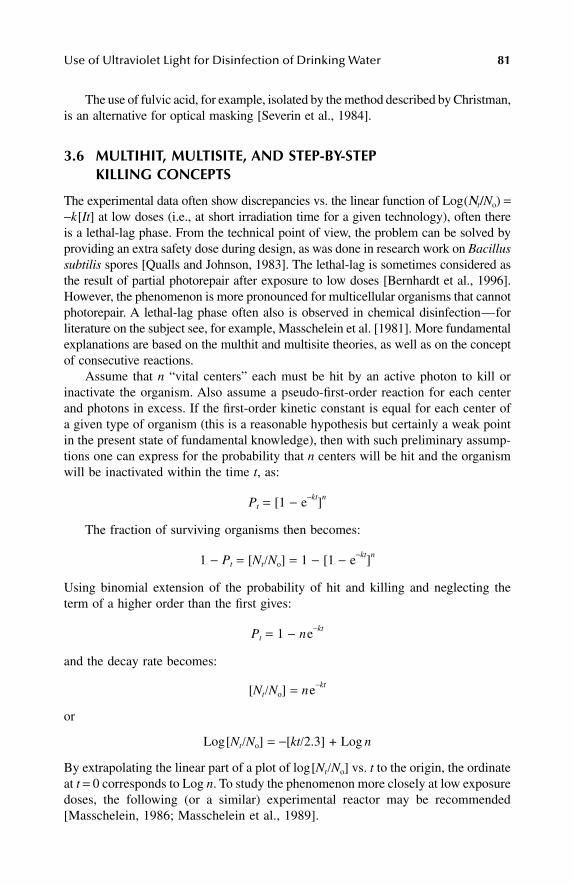
Use of Ultraviolet Light for Disinfection of Drinking Water 81
The use of fulvic acid, for example, isolated by the method described by Christman,is an alternative for optical masking [Severin et al., 1984].
3.6 MULTIHIT, MULTISITE, AND STEP-BY-STEP KILLING CONCEPTS
The experimental data often show discrepancies vs. the linear function of Log(Νt/No) =−k[It] at low doses (i.e., at short irradiation time for a given technology), often thereis a lethal-lag phase. From the technical point of view, the problem can be solved byproviding an extra safety dose during design, as was done in research work on Bacillussubtilis spores [Qualls and Johnson, 1983]. The lethal-lag is sometimes considered asthe result of partial photorepair after exposure to low doses [Bernhardt et al., 1996].However, the phenomenon is more pronounced for multicellular organisms that cannotphotorepair. A lethal-lag phase often also is observed in chemical disinfection—forliterature on the subject see, for example, Masschelein et al. [1981]. More fundamentalexplanations are based on the multhit and multisite theories, as well as on the conceptof consecutive reactions.
Assume that n “vital centers” each must be hit by an active photon to kill orinactivate the organism. Also assume a pseudo-first-order reaction for each centerand photons in excess. If the first-order kinetic constant is equal for each center ofa given type of organism (this is a reasonable hypothesis but certainly a weak pointin the present state of fundamental knowledge), then with such preliminary assump-tions one can express for the probability that n centers will be hit and the organismwill be inactivated within the time t, as:
Pt = [1 − e−kt]n
The fraction of surviving organisms then becomes:
1 − Pt = [Nt/No] = 1 − [1 − e−kt]n
Using binomial extension of the probability of hit and killing and neglecting theterm of a higher order than the first gives:
Pt = 1 − ne−kt
and the decay rate becomes:
[Nt/No] = ne−kt
or
Log[Nt/No] = −[kt/2.3] + Log n
By extrapolating the linear part of a plot of log[Nt/No] vs. t to the origin, the ordinateat t = 0 corresponds to Log n. To study the phenomenon more closely at low exposuredoses, the following (or a similar) experimental reactor may be recommended[Masschelein, 1986; Masschelein et al., 1989].
L1603_Frame_C03 Page 81 Tuesday, March 5, 2002 5:37 PM
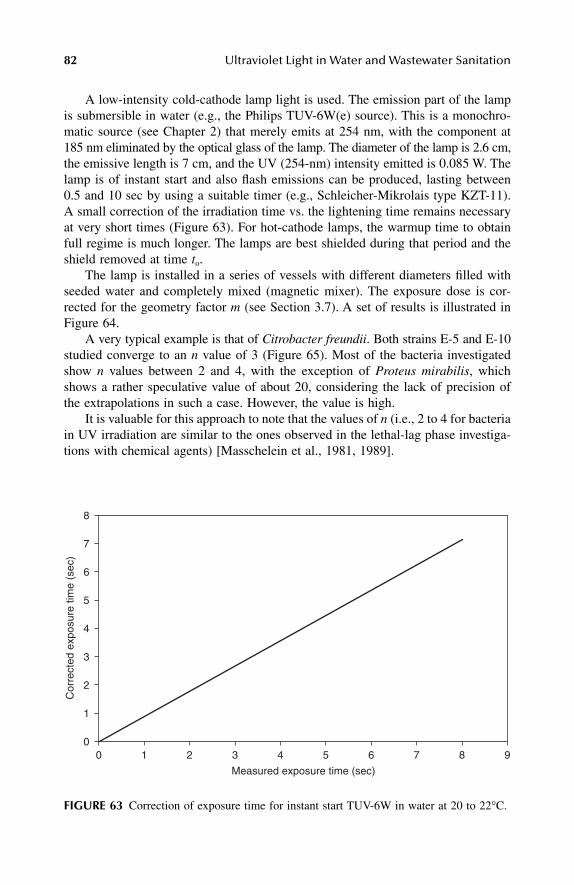
82 Ultraviolet Light in Water and Wastewater Sanitation
A low-intensity cold-cathode lamp light is used. The emission part of the lampis submersible in water (e.g., the Philips TUV-6W(e) source). This is a monochro-matic source (see Chapter 2) that merely emits at 254 nm, with the component at185 nm eliminated by the optical glass of the lamp. The diameter of the lamp is 2.6 cm,the emissive length is 7 cm, and the UV (254-nm) intensity emitted is 0.085 W. Thelamp is of instant start and also flash emissions can be produced, lasting between0.5 and 10 sec by using a suitable timer (e.g., Schleicher-Mikrolais type KZT-11).A small correction of the irradiation time vs. the lightening time remains necessaryat very short times (Figure 63). For hot-cathode lamps, the warmup time to obtainfull regime is much longer. The lamps are best shielded during that period and theshield removed at time to.
The lamp is installed in a series of vessels with different diameters filled withseeded water and completely mixed (magnetic mixer). The exposure dose is cor-rected for the geometry factor m (see Section 3.7). A set of results is illustrated inFigure 64.
A very typical example is that of Citrobacter freundii. Both strains E-5 and E-10studied converge to an n value of 3 (Figure 65). Most of the bacteria investigatedshow n values between 2 and 4, with the exception of Proteus mirabilis, whichshows a rather speculative value of about 20, considering the lack of precision ofthe extrapolations in such a case. However, the value is high.
It is valuable for this approach to note that the values of n (i.e., 2 to 4 for bacteriain UV irradiation are similar to the ones observed in the lethal-lag phase investiga-tions with chemical agents) [Masschelein et al., 1981, 1989].
FIGURE 63 Correction of exposure time for instant start TUV-6W in water at 20 to 22°C.
0
8
7
6
5
4
3
2
1
0987654321
Cor
rect
ed e
xpos
ure
time
(sec
)
Measured exposure time (sec)
L1603_Frame_C03 Page 82 Tuesday, March 5, 2002 5:37 PM
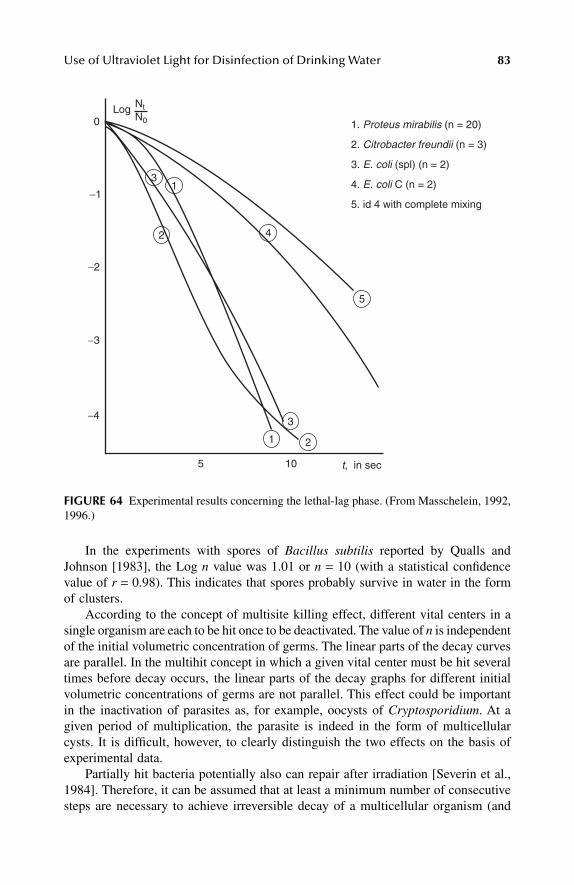
Use of Ultraviolet Light for Disinfection of Drinking Water 83
In the experiments with spores of Bacillus subtilis reported by Qualls andJohnson [1983], the Log n value was 1.01 or n = 10 (with a statistical confidencevalue of r = 0.98). This indicates that spores probably survive in water in the formof clusters.
According to the concept of multisite killing effect, different vital centers in asingle organism are each to be hit once to be deactivated. The value of n is independentof the initial volumetric concentration of germs. The linear parts of the decay curvesare parallel. In the multihit concept in which a given vital center must be hit severaltimes before decay occurs, the linear parts of the decay graphs for different initialvolumetric concentrations of germs are not parallel. This effect could be importantin the inactivation of parasites as, for example, oocysts of Cryptosporidium. At agiven period of multiplication, the parasite is indeed in the form of multicellularcysts. It is difficult, however, to clearly distinguish the two effects on the basis ofexperimental data.
Partially hit bacteria potentially also can repair after irradiation [Severin et al.,1984]. Therefore, it can be assumed that at least a minimum number of consecutivesteps are necessary to achieve irreversible decay of a multicellular organism (and
FIGURE 64 Experimental results concerning the lethal-lag phase. (From Masschelein, 1992,1996.)
1 2
3
5
4
13
2
0
−1
−2
−3
−4
5 10 t, in sec
1. Proteus mirabilis (n = 20)
2. Citrobacter freundii (n = 3)
3. E. coli (spl) (n = 2)
4. E. coli C (n = 2)
5. id 4 with complete mixing
Log NtN0
L1603_Frame_C03 Page 83 Tuesday, March 5, 2002 5:37 PM
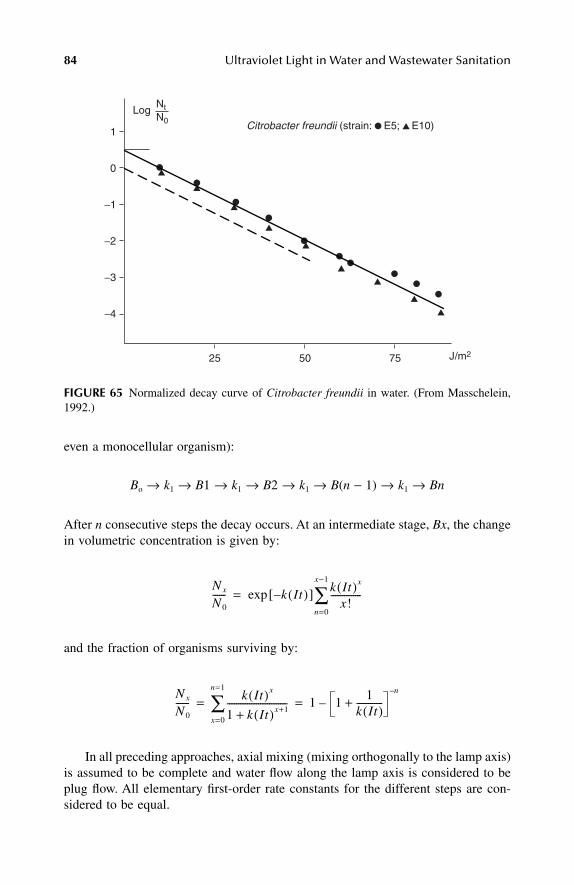
84 Ultraviolet Light in Water and Wastewater Sanitation
even a monocellular organism):
Bo → k1 → B1 → k1 → B2 → k1 → B(n − 1) → k1 → Bn
After n consecutive steps the decay occurs. At an intermediate stage, Bx, the changein volumetric concentration is given by:
and the fraction of organisms surviving by:
In all preceding approaches, axial mixing (mixing orthogonally to the lamp axis)is assumed to be complete and water flow along the lamp axis is considered to beplug flow. All elementary first-order rate constants for the different steps are con-sidered to be equal.
FIGURE 65 Normalized decay curve of Citrobacter freundii in water. (From Masschelein,1992.)
0
1
−1
−2
−3
−4
25 50 75 J/m2
LogNtN0 Citrobacter freundii (strain: E5; E10)
N x
N 0
------ k It( )–[ ]exp k It( )x
x!--------------
n=0
x−1
∑=
N x
N 0
------ k It( )x
1 k It( )x+1+---------------------------
x=0
n=1
∑ 1 11
k It( )------------+
n–
–= =
L1603_Frame_C03 Page 84 Tuesday, March 5, 2002 5:37 PM
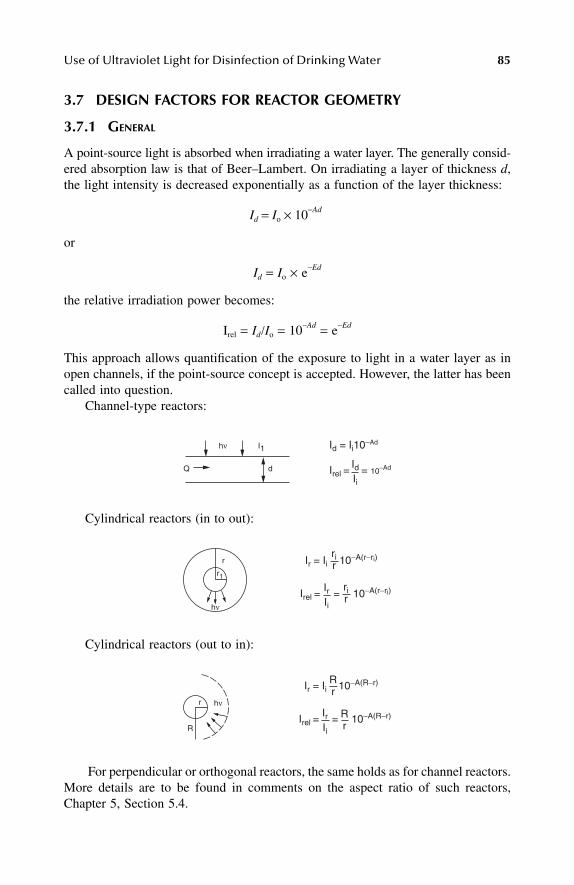
Use of Ultraviolet Light for Disinfection of Drinking Water 85
3.7 DESIGN FACTORS FOR REACTOR GEOMETRY
3.7.1 GENERAL
A point-source light is absorbed when irradiating a water layer. The generally consid-ered absorption law is that of Beer–Lambert. On irradiating a layer of thickness d,the light intensity is decreased exponentially as a function of the layer thickness:
Id = Io × 10−Ad
or
Id = Io × e−Ed
the relative irradiation power becomes:
Irel = Id/Io = 10−Ad = e−Ed
This approach allows quantification of the exposure to light in a water layer as inopen channels, if the point-source concept is accepted. However, the latter has beencalled into question.
Channel-type reactors:
Cylindrical reactors (in to out):
Cylindrical reactors (out to in):
For perpendicular or orthogonal reactors, the same holds as for channel reactors.More details are to be found in comments on the aspect ratio of such reactors,Chapter 5, Section 5.4.
hν I1
dQ
Id = Ii10−Ad
Irel = = 10−AdIdIi
hν
Ir = Ii 10−A(r−ri)rir
Irel = = 10−A(r−ri)IrIi
rir
r
r1
Ir = Ii 10−A(R−r)Rr
Irel = = 10−A(R−r)IrIi
Rr
hν
R
r
L1603_Frame_C03 Page 85 Tuesday, March 5, 2002 5:37 PM
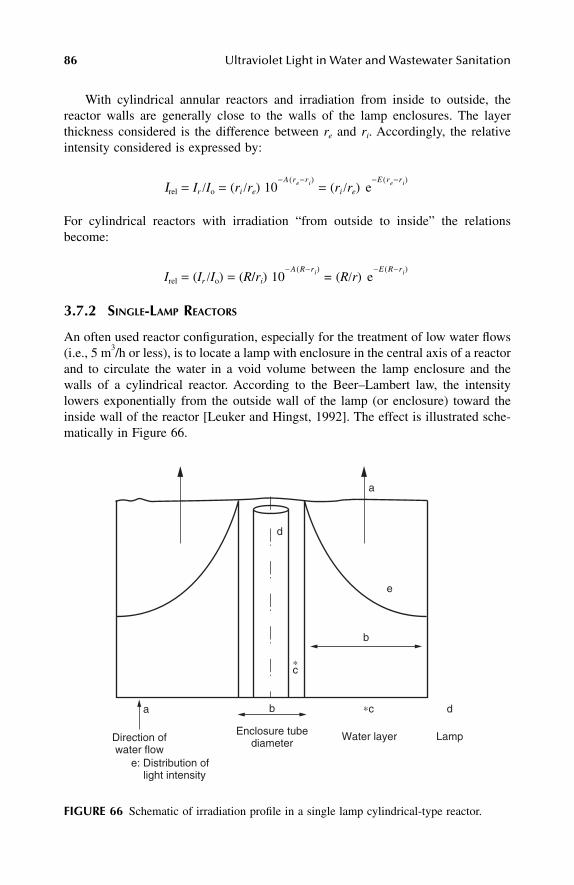
86 Ultraviolet Light in Water and Wastewater Sanitation
With cylindrical annular reactors and irradiation from inside to outside, thereactor walls are generally close to the walls of the lamp enclosures. The layerthickness considered is the difference between re and ri. Accordingly, the relativeintensity considered is expressed by:
Ιrel = Ir /Io = (ri /re) = (ri /re)
For cylindrical reactors with irradiation “from outside to inside” the relationsbecome:
Irel = (Ir /Io) = (R/ri) = (R/r)
3.7.2 SINGLE-LAMP REACTORS
An often used reactor configuration, especially for the treatment of low water flows(i.e., 5 m3/h or less), is to locate a lamp with enclosure in the central axis of a reactorand to circulate the water in a void volume between the lamp enclosure and thewalls of a cylindrical reactor. According to the Beer–Lambert law, the intensitylowers exponentially from the outside wall of the lamp (or enclosure) toward theinside wall of the reactor [Leuker and Hingst, 1992]. The effect is illustrated sche-matically in Figure 66.
FIGURE 66 Schematic of irradiation profile in a single lamp cylindrical-type reactor.
10− A re−ri( )
e−E re−ri( )
10− A R−ri( )
e−E R−ri( )
a
a
e
b
b
∗c
∗c d
d
Direction ofwater flow
Water layer LampEnclosure tubediameter
e: Distribution of light intensity
L1603_Frame_C03 Page 86 Tuesday, March 5, 2002 5:37 PM
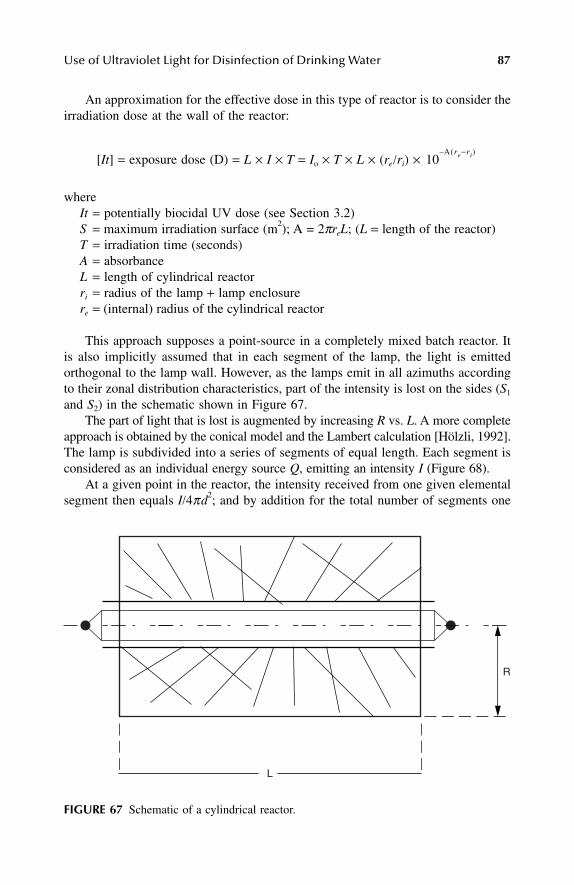
Use of Ultraviolet Light for Disinfection of Drinking Water 87
An approximation for the effective dose in this type of reactor is to consider theirradiation dose at the wall of the reactor:
[It] = exposure dose (D) = L × I × T = Io × T × L × (re/ri) ×
whereIt = potentially biocidal UV dose (see Section 3.2)S = maximum irradiation surface (m2); A = 2πreL; (L = length of the reactor) T = irradiation time (seconds)A = absorbanceL = length of cylindrical reactorri = radius of the lamp + lamp enclosurere = (internal) radius of the cylindrical reactor
This approach supposes a point-source in a completely mixed batch reactor. Itis also implicitly assumed that in each segment of the lamp, the light is emittedorthogonal to the lamp wall. However, as the lamps emit in all azimuths accordingto their zonal distribution characteristics, part of the intensity is lost on the sides (S1
and S2) in the schematic shown in Figure 67. The part of light that is lost is augmented by increasing R vs. L. A more complete
approach is obtained by the conical model and the Lambert calculation [Hölzli, 1992].The lamp is subdivided into a series of segments of equal length. Each segment isconsidered as an individual energy source Q, emitting an intensity I (Figure 68).
At a given point in the reactor, the intensity received from one given elementalsegment then equals I/4πd2; and by addition for the total number of segments one
FIGURE 67 Schematic of a cylindrical reactor.
10A re−ri( )–
L
R
L1603_Frame_C03 Page 87 Tuesday, March 5, 2002 5:37 PM
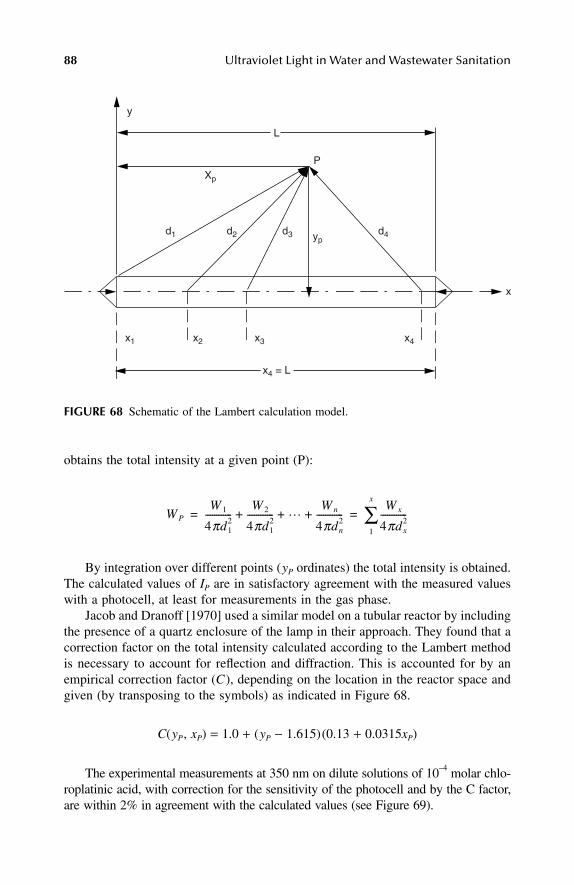
88 Ultraviolet Light in Water and Wastewater Sanitation
obtains the total intensity at a given point (P):
By integration over different points (yP ordinates) the total intensity is obtained.The calculated values of IP are in satisfactory agreement with the measured valueswith a photocell, at least for measurements in the gas phase.
Jacob and Dranoff [1970] used a similar model on a tubular reactor by includingthe presence of a quartz enclosure of the lamp in their approach. They found that acorrection factor on the total intensity calculated according to the Lambert methodis necessary to account for reflection and diffraction. This is accounted for by anempirical correction factor (C), depending on the location in the reactor space andgiven (by transposing to the symbols) as indicated in Figure 68.
C(yP, xP) = 1.0 + (yP − 1.615)(0.13 + 0.0315xP)
The experimental measurements at 350 nm on dilute solutions of 10−4 molar chlo-roplatinic acid, with correction for the sensitivity of the photocell and by the C factor,are within 2% in agreement with the calculated values (see Figure 69).
FIGURE 68 Schematic of the Lambert calculation model.
y
L
Xp
ypd1
x1 x2 x3 x4
x4 = L
x
d2 d3 d4
P
W PW 1
4πd12
------------W 2
4πd12
------------ … W n
4πdn2
------------+ + +W x
4πdx2
------------1
x
∑= =
L1603_Frame_C03 Page 88 Tuesday, March 5, 2002 5:37 PM
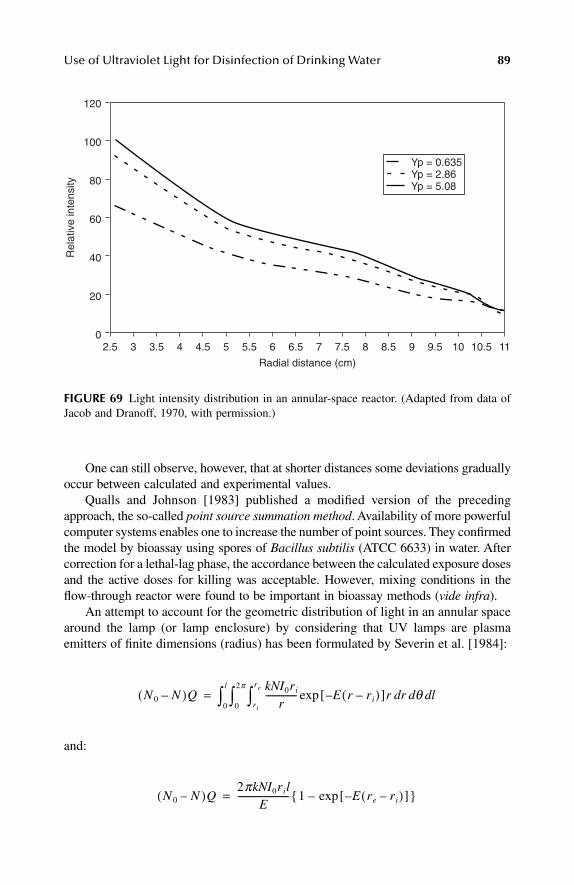
Use of Ultraviolet Light for Disinfection of Drinking Water 89
One can still observe, however, that at shorter distances some deviations graduallyoccur between calculated and experimental values.
Qualls and Johnson [1983] published a modified version of the precedingapproach, the so-called point source summation method. Availability of more powerfulcomputer systems enables one to increase the number of point sources. They confirmedthe model by bioassay using spores of Bacillus subtilis (ATCC 6633) in water. Aftercorrection for a lethal-lag phase, the accordance between the calculated exposure dosesand the active doses for killing was acceptable. However, mixing conditions in theflow-through reactor were found to be important in bioassay methods (vide infra).
An attempt to account for the geometric distribution of light in an annular spacearound the lamp (or lamp enclosure) by considering that UV lamps are plasmaemitters of finite dimensions (radius) has been formulated by Severin et al. [1984]:
and:
FIGURE 69 Light intensity distribution in an annular-space reactor. (Adapted from data ofJacob and Dranoff, 1970, with permission.)
2.5 3 3.5 4 4.5 5 5.5 6 6.5 7 7.5 8 8.5 9 9.5 10 10.50
120
100
80
60
40
20
11
Rel
ativ
e in
tens
ity
Radial distance (cm)
Yp = 0.635Yp = 2.86Yp = 5.08
N 0 N–( )QkNI0ri
r-------------- E r ri–( )–[ ]r drexp θ dld
ri
re
∫0
2π
∫0
l
∫=
N 0 N–( )Q2πkNI0ril
E----------------------- 1 E re ri–( )–[ ]exp–{ }=
L1603_Frame_C03 Page 89 Tuesday, March 5, 2002 5:37 PM
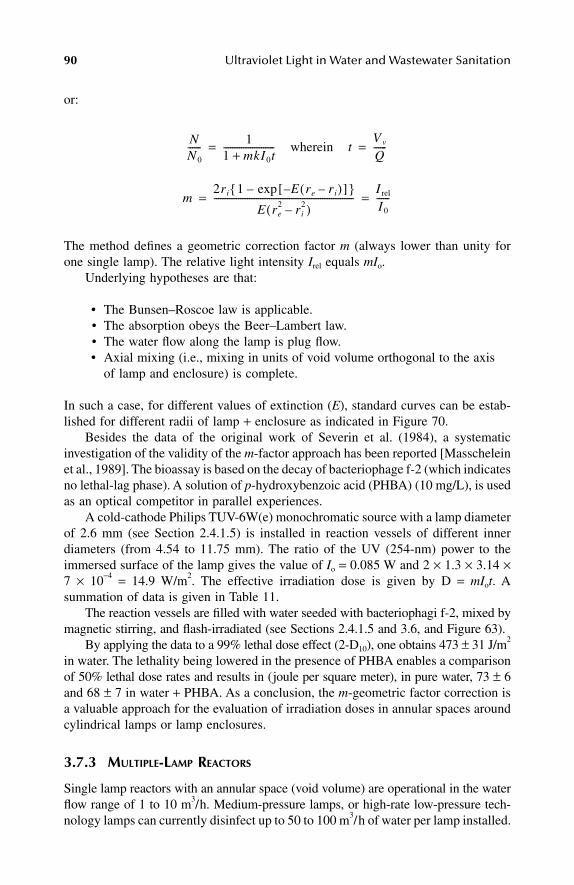
90 Ultraviolet Light in Water and Wastewater Sanitation
or:
The method defines a geometric correction factor m (always lower than unity forone single lamp). The relative light intensity Irel equals mIo.
Underlying hypotheses are that:
• The Bunsen–Roscoe law is applicable.• The absorption obeys the Beer–Lambert law.• The water flow along the lamp is plug flow.• Axial mixing (i.e., mixing in units of void volume orthogonal to the axis
of lamp and enclosure) is complete.
In such a case, for different values of extinction (E), standard curves can be estab-lished for different radii of lamp + enclosure as indicated in Figure 70.
Besides the data of the original work of Severin et al. (1984), a systematicinvestigation of the validity of the m-factor approach has been reported [Masscheleinet al., 1989]. The bioassay is based on the decay of bacteriophage f-2 (which indicatesno lethal-lag phase). A solution of p-hydroxybenzoic acid (PHBA) (10 mg/L), is usedas an optical competitor in parallel experiences.
A cold-cathode Philips TUV-6W(e) monochromatic source with a lamp diameterof 2.6 mm (see Section 2.4.1.5) is installed in reaction vessels of different innerdiameters (from 4.54 to 11.75 mm). The ratio of the UV (254-nm) power to theimmersed surface of the lamp gives the value of Io = 0.085 W and 2 × 1.3 × 3.14 ×7 × 10−4 = 14.9 W/m2. The effective irradiation dose is given by D = mIot. Asummation of data is given in Table 11.
The reaction vessels are filled with water seeded with bacteriophagi f-2, mixed bymagnetic stirring, and flash-irradiated (see Sections 2.4.1.5 and 3.6, and Figure 63).
By applying the data to a 99% lethal dose effect (2-D10), one obtains 473 ± 31 J/m2
in water. The lethality being lowered in the presence of PHBA enables a comparisonof 50% lethal dose rates and results in (joule per square meter), in pure water, 73 ± 6and 68 ± 7 in water + PHBA. As a conclusion, the m-geometric factor correction isa valuable approach for the evaluation of irradiation doses in annular spaces aroundcylindrical lamps or lamp enclosures.
3.7.3 MULTIPLE-LAMP REACTORS
Single lamp reactors with an annular space (void volume) are operational in the waterflow range of 1 to 10 m3/h. Medium-pressure lamps, or high-rate low-pressure tech-nology lamps can currently disinfect up to 50 to 100 m3/h of water per lamp installed.
NN 0
------ 11 mkI0t+----------------------- wherein t
V v
Q------= =
m2ri 1 E re ri–( )–[ ]exp–{ }
E re2 ri
2–( )---------------------------------------------------------------
I rel
I0
------= =
L1603_Frame_C03 Page 90 Tuesday, March 5, 2002 5:37 PM
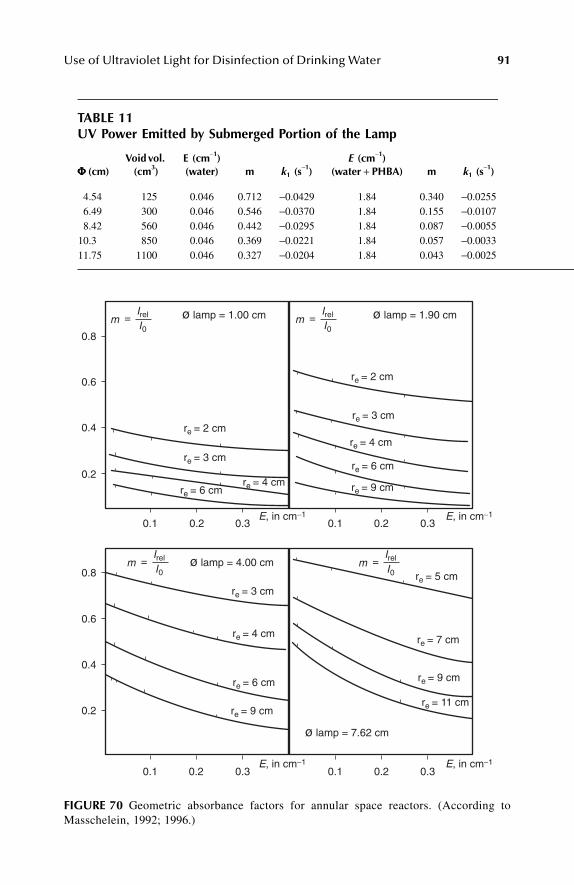
Use of Ultraviolet Light for Disinfection of Drinking Water 91
TABLE 11UV Power Emitted by Submerged Portion of the Lamp
ΦΦΦΦ (cm)Void vol.
(cm3)E (cm−1)(water) m k1 (s
−1)E (cm−1)
(water + PHBA) m k1 (s−1)
4.54 125 0.046 0.712 −0.0429 1.84 0.340 −0.02556.49 300 0.046 0.546 −0.0370 1.84 0.155 −0.01078.42 560 0.046 0.442 −0.0295 1.84 0.087 −0.0055
10.3 850 0.046 0.369 −0.0221 1.84 0.057 −0.003311.75 1100 0.046 0.327 −0.0204 1.84 0.043 −0.0025
FIGURE 70 Geometric absorbance factors for annular space reactors. (According toMasschelein, 1992; 1996.)
0.8
0.6
0.4
0.2
0.8
0.6
0.4
0.2
0.20.1 0.3 0.20.1 0.3
0.20.1 0.3 0.20.1 0.3
mIrel
I0= m
Irel
I0=
mIrel
I0= m
Irel
I0=
re = 2 cm
re = 2 cm
re = 3 cm
re = 3 cm
re = 3 cm
re = 9 cm
re = 9 cm
re = 9 cm
re = 11 cm
re = 7 cm
re = 5 cm
re = 6 cm
re = 6 cm
re = 6 cm
re = 4 cm
re = 4 cm
re = 4 cm
ø lamp = 1.00 cm
ø lamp = 4.00 cm
ø lamp = 7.62 cm
ø lamp = 1.90 cm
E, in cm−1 E, in cm−1
E, in cm−1 E, in cm−1
L1603_Frame_C03 Page 91 Tuesday, March 5, 2002 5:37 PM

92 Ultraviolet Light in Water and Wastewater Sanitation
Higher water flows per lamp become possible also by installing medium-pressurelamps in a transverse mode.
In the respective technologies, treatment of higher water flows necessitates mul-tiplication of sequential single-lamp units or construction of multilamp reactors. In themultiple-lamp reactors, the configuration is called positive. In a single-lamp annularreactor the intensity levels decrease exponentially as a function of the distance betweenthe lamp enclosure and the irradiated point considered (see Figure 66). In the multiple-lamp technologies, several lamps can irradiate a single point and thus create a localincremental effect. However, the shielding effect of one lamp by another must finallybe taken into consideration as well.
A first approximation of the cumulative effect can be obtained by a simplifiedcalculation: the lamps are supposed to be installed at equal distances along a circleof radius r in an annular space reactor of radius R, and the distance along the circlebetween the lamps is 2d.
The number of lamps along the circle is:
n = 3.14 × (R − d)/d
Suppose one wants to obtain a dose of D = 250 J/m2 to treat a water flow of 175 m3/h,or Q = 0.05 m3/sec. If the reactor radius is R = 0.6 m and the useful reactor lengthis L = 0.8 m, the necessary exposure intensity is given by:
I = D (250 J/m2) × Q (0.05 m3/s)/3.14 × R2 × L
I = 14 W/m2
From the irradiance curves of the manufacturers (see Chapter 2 and also anexample in Figure 71), it can be noticed that the choice (if low-pressure Hg lampsare to be used) is the 30 W(e) lamp installed at distances between the lamps 2d =
π
2d
R
L1603_Frame_C03 Page 92 Tuesday, March 5, 2002 5:37 PM
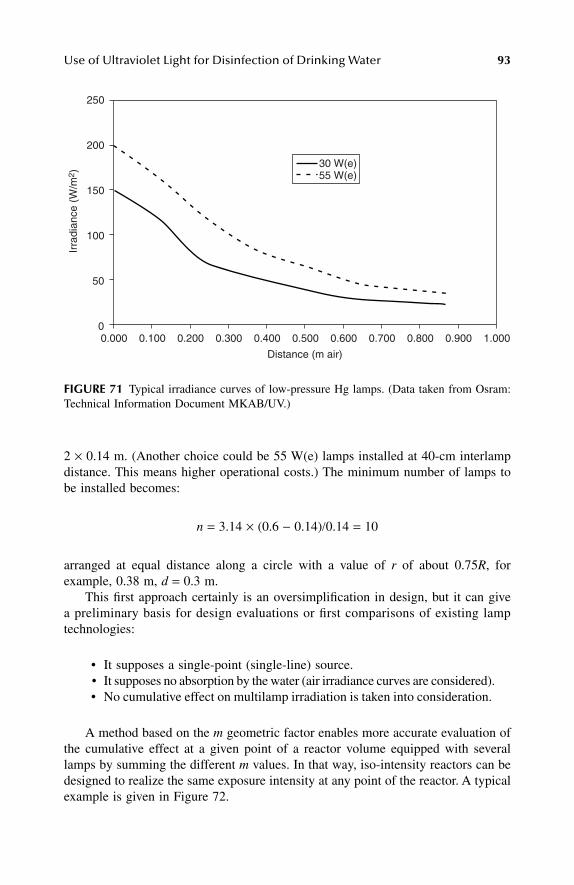
Use of Ultraviolet Light for Disinfection of Drinking Water 93
2 × 0.14 m. (Another choice could be 55 W(e) lamps installed at 40-cm interlampdistance. This means higher operational costs.) The minimum number of lamps tobe installed becomes:
n = 3.14 × (0.6 − 0.14)/0.14 = 10
arranged at equal distance along a circle with a value of r of about 0.75R, forexample, 0.38 m, d = 0.3 m.
This first approach certainly is an oversimplification in design, but it can givea preliminary basis for design evaluations or first comparisons of existing lamptechnologies:
• It supposes a single-point (single-line) source.• It supposes no absorption by the water (air irradiance curves are considered).• No cumulative effect on multilamp irradiation is taken into consideration.
A method based on the m geometric factor enables more accurate evaluation ofthe cumulative effect at a given point of a reactor volume equipped with severallamps by summing the different m values. In that way, iso-intensity reactors can bedesigned to realize the same exposure intensity at any point of the reactor. A typicalexample is given in Figure 72.
FIGURE 71 Typical irradiance curves of low-pressure Hg lamps. (Data taken from Osram:Technical Information Document MKAB/UV.)
0
250
200
150
100
50
1.0000.9000.8000.7000.6000.5000.4000.3000.2000.1000.000
Irra
dian
ce (
W/m
2 )
Distance (m air)
30 W(e)55 W(e)
L1603_Frame_C03 Page 93 Tuesday, March 5, 2002 5:37 PM
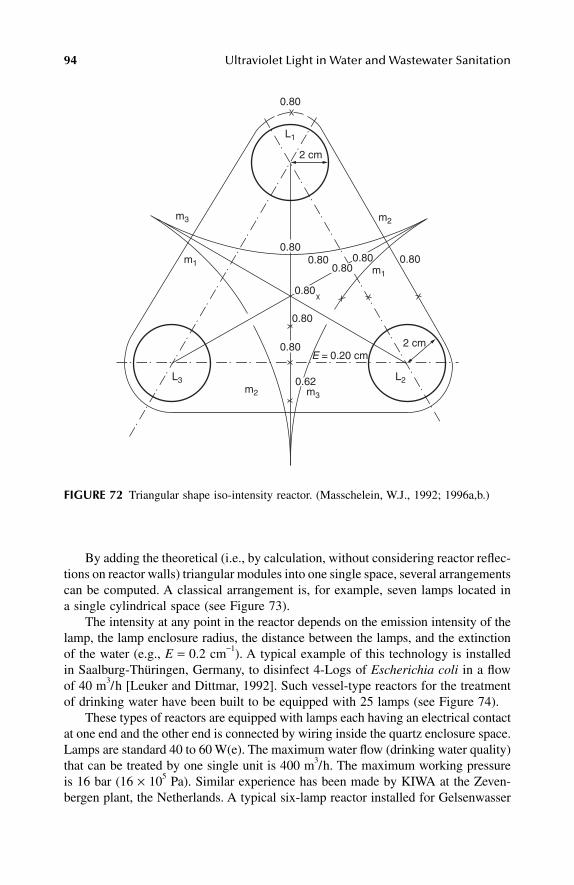
94 Ultraviolet Light in Water and Wastewater Sanitation
By adding the theoretical (i.e., by calculation, without considering reactor reflec-tions on reactor walls) triangular modules into one single space, several arrangementscan be computed. A classical arrangement is, for example, seven lamps located ina single cylindrical space (see Figure 73).
The intensity at any point in the reactor depends on the emission intensity of thelamp, the lamp enclosure radius, the distance between the lamps, and the extinctionof the water (e.g., E = 0.2 cm−1). A typical example of this technology is installedin Saalburg-Thüringen, Germany, to disinfect 4-Logs of Escherichia coli in a flowof 40 m3/h [Leuker and Dittmar, 1992]. Such vessel-type reactors for the treatmentof drinking water have been built to be equipped with 25 lamps (see Figure 74).
These types of reactors are equipped with lamps each having an electrical contactat one end and the other end is connected by wiring inside the quartz enclosure space.Lamps are standard 40 to 60 W(e). The maximum water flow (drinking water quality)that can be treated by one single unit is 400 m3/h. The maximum working pressureis 16 bar (16 × 105 Pa). Similar experience has been made by KIWA at the Zeven-bergen plant, the Netherlands. A typical six-lamp reactor installed for Gelsenwasser
FIGURE 72 Triangular shape iso-intensity reactor. (Masschelein, W.J., 1992; 1996a,b.)
m2
m2 m3
E = 0.20 cm
m1
m1
m3
L3
L1
L2
0.80
0.80
0.800.80
0.80 0.80
0.80
0.80
0.80
0.62
2 cm
2 cm
L1603_Frame_C03 Page 94 Tuesday, March 5, 2002 5:37 PM
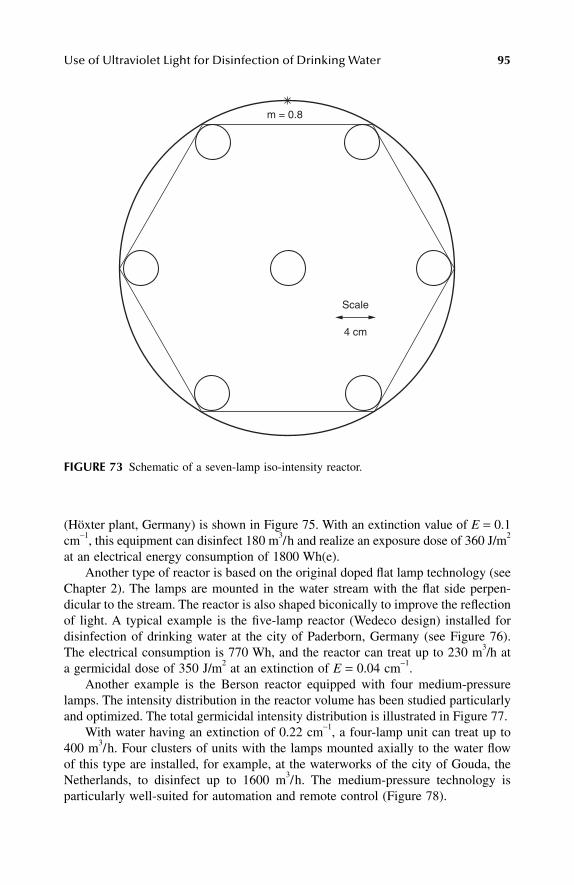
Use of Ultraviolet Light for Disinfection of Drinking Water 95
(Höxter plant, Germany) is shown in Figure 75. With an extinction value of E = 0.1cm−1, this equipment can disinfect 180 m3/h and realize an exposure dose of 360 J/m2
at an electrical energy consumption of 1800 Wh(e).Another type of reactor is based on the original doped flat lamp technology (see
Chapter 2). The lamps are mounted in the water stream with the flat side perpen-dicular to the stream. The reactor is also shaped biconically to improve the reflectionof light. A typical example is the five-lamp reactor (Wedeco design) installed fordisinfection of drinking water at the city of Paderborn, Germany (see Figure 76).The electrical consumption is 770 Wh, and the reactor can treat up to 230 m3/h ata germicidal dose of 350 J/m2 at an extinction of E = 0.04 cm−1.
Another example is the Berson reactor equipped with four medium-pressurelamps. The intensity distribution in the reactor volume has been studied particularlyand optimized. The total germicidal intensity distribution is illustrated in Figure 77.
With water having an extinction of 0.22 cm−1, a four-lamp unit can treat up to400 m3/h. Four clusters of units with the lamps mounted axially to the water flowof this type are installed, for example, at the waterworks of the city of Gouda, theNetherlands, to disinfect up to 1600 m3/h. The medium-pressure technology isparticularly well-suited for automation and remote control (Figure 78).
FIGURE 73 Schematic of a seven-lamp iso-intensity reactor.
m = 0.8
4 cm
Scale
L1603_Frame_C03 Page 95 Tuesday, March 5, 2002 5:37 PM
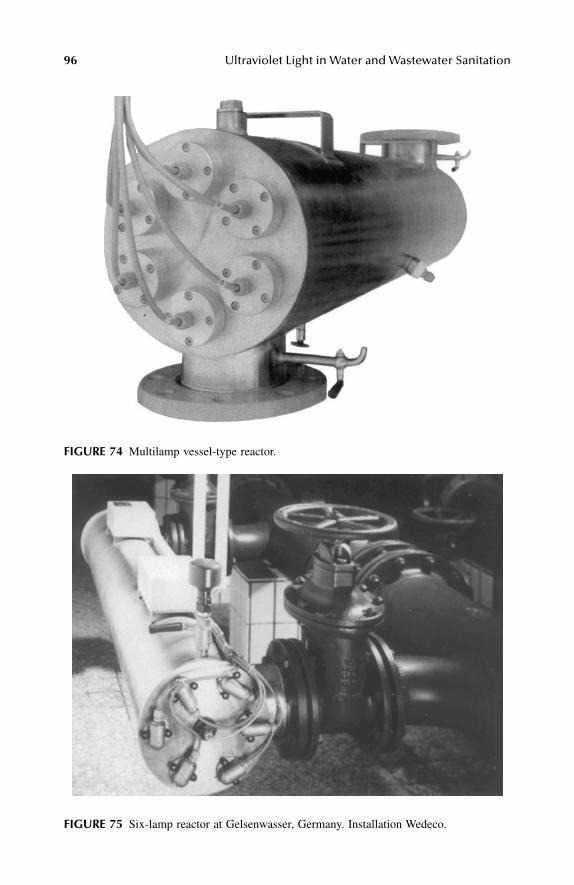
96 Ultraviolet Light in Water and Wastewater Sanitation
FIGURE 74 Multilamp vessel-type reactor.
FIGURE 75 Six-lamp reactor at Gelsenwasser, Germany. Installation Wedeco.
L1603_Frame_C03 Page 96 Tuesday, March 5, 2002 5:37 PM
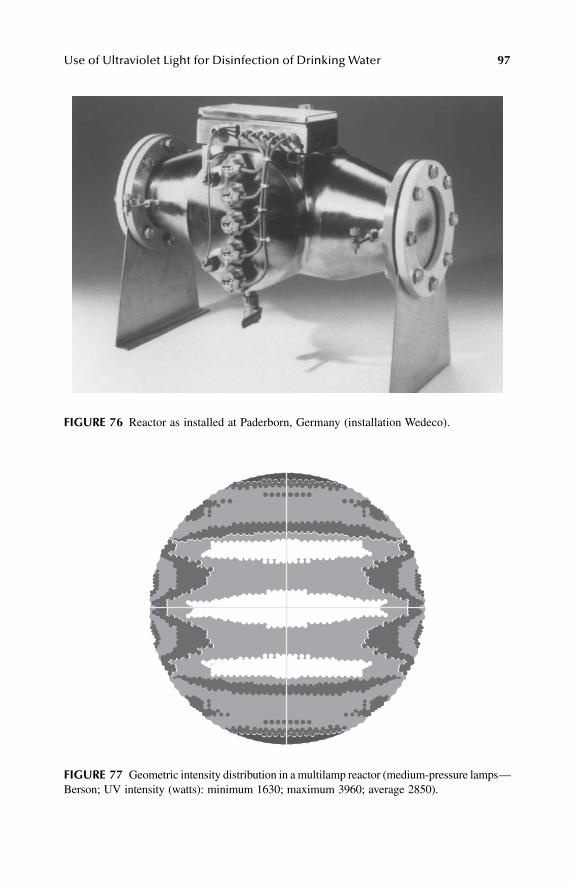
Use of Ultraviolet Light for Disinfection of Drinking Water 97
FIGURE 76 Reactor as installed at Paderborn, Germany (installation Wedeco).
FIGURE 77 Geometric intensity distribution in a multilamp reactor (medium-pressure lamps—Berson; UV intensity (watts): minimum 1630; maximum 3960; average 2850).
L1603_Frame_C03 Page 97 Tuesday, March 5, 2002 5:37 PM
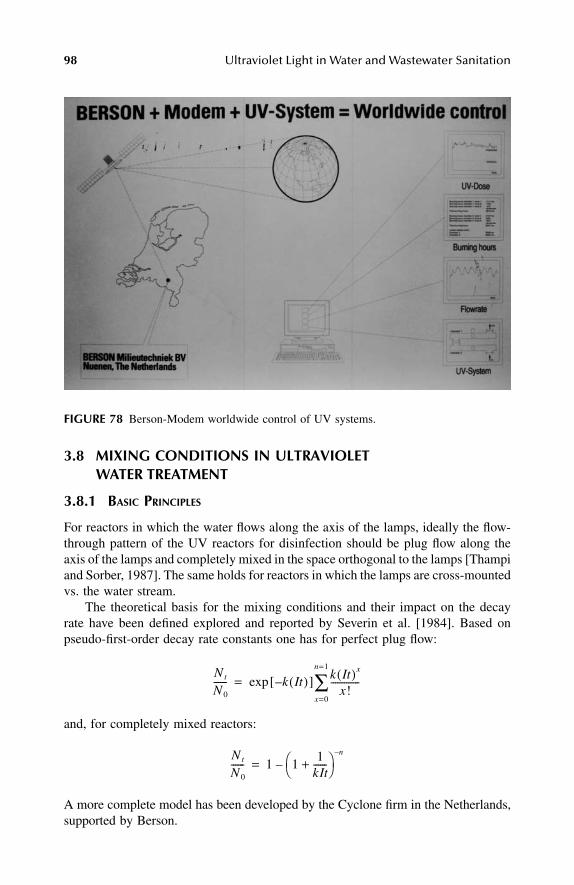
98 Ultraviolet Light in Water and Wastewater Sanitation
3.8 MIXING CONDITIONS IN ULTRAVIOLET WATER TREATMENT
3.8.1 BASIC PRINCIPLES
For reactors in which the water flows along the axis of the lamps, ideally the flow-through pattern of the UV reactors for disinfection should be plug flow along theaxis of the lamps and completely mixed in the space orthogonal to the lamps [Thampiand Sorber, 1987]. The same holds for reactors in which the lamps are cross-mountedvs. the water stream.
The theoretical basis for the mixing conditions and their impact on the decayrate have been defined explored and reported by Severin et al. [1984]. Based onpseudo-first-order decay rate constants one has for perfect plug flow:
and, for completely mixed reactors:
A more complete model has been developed by the Cyclone firm in the Netherlands,supported by Berson.
FIGURE 78 Berson-Modem worldwide control of UV systems.
Nt
N 0
------ k It( )–[ ]exp k It( )x
x!-------------
x=0
n=1
∑=
Nt
N 0
------ 1 11
kIt------+
n–
–=
L1603_Frame_C03 Page 98 Tuesday, March 5, 2002 5:37 PM
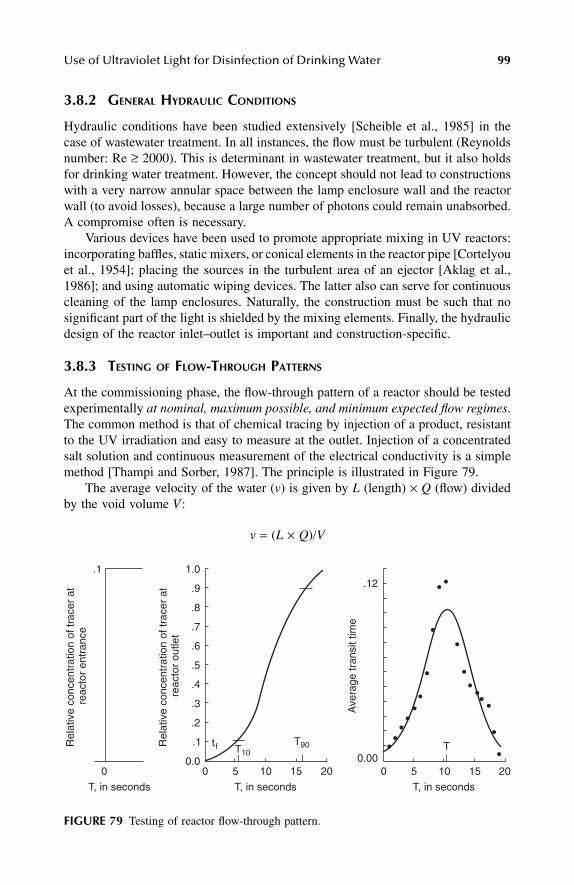
Use of Ultraviolet Light for Disinfection of Drinking Water 99
3.8.2 GENERAL HYDRAULIC CONDITIONS
Hydraulic conditions have been studied extensively [Scheible et al., 1985] in thecase of wastewater treatment. In all instances, the flow must be turbulent (Reynoldsnumber: Re ≥ 2000). This is determinant in wastewater treatment, but it also holdsfor drinking water treatment. However, the concept should not lead to constructionswith a very narrow annular space between the lamp enclosure wall and the reactorwall (to avoid losses), because a large number of photons could remain unabsorbed.A compromise often is necessary.
Various devices have been used to promote appropriate mixing in UV reactors:incorporating baffles, static mixers, or conical elements in the reactor pipe [Cortelyouet al., 1954]; placing the sources in the turbulent area of an ejector [Aklag et al.,1986]; and using automatic wiping devices. The latter also can serve for continuouscleaning of the lamp enclosures. Naturally, the construction must be such that nosignificant part of the light is shielded by the mixing elements. Finally, the hydraulicdesign of the reactor inlet–outlet is important and construction-specific.
3.8.3 TESTING OF FLOW-THROUGH PATTERNS
At the commissioning phase, the flow-through pattern of a reactor should be testedexperimentally at nominal, maximum possible, and minimum expected flow regimes.The common method is that of chemical tracing by injection of a product, resistantto the UV irradiation and easy to measure at the outlet. Injection of a concentratedsalt solution and continuous measurement of the electrical conductivity is a simplemethod [Thampi and Sorber, 1987]. The principle is illustrated in Figure 79.
The average velocity of the water (v) is given by L (length) × Q (flow) dividedby the void volume V:
v = (L × Q)/V
FIGURE 79 Testing of reactor flow-through pattern.
1.0.1
.9 .12
0.00
.8
.7
.6
.5
.4
.3
.2
.1
0.000 5 10 15 20 0 5 10 15 20
T10T90 Ttf
T, in secondsT, in seconds T, in seconds
Ave
rage
tran
sit t
ime
Rel
ativ
e co
ncen
trat
ion
of tr
acer
at
reac
tor
outle
t
Rel
ativ
e co
ncen
trat
ion
of tr
acer
at
reac
tor
entr
ance
L1603_Frame_C03 Page 99 Tuesday, March 5, 2002 5:37 PM

100 Ultraviolet Light in Water and Wastewater Sanitation
The variance in residence time at the reactor outlet (σt)2 defines a dispersion coef-
ficient D:
D = 0.5 × v × L × (σt)2/T2
(T is the observed average residence time.) The lower the dispersion coefficient, thebetter it is for disinfection efficiency.
The Morrill index equals the ratio of times for 90 to 10% of the tracer to pass.In perfect plug flow, T90/T10 approaches 1. In UV systems, the recommended valueis to be lower than 2 at all flow-through regimes.
Qualls and Johnson [1983] have used spores of Bacillus subtillis as a tracer insteadof a chemical. In the system they investigated, the Morrill index was 1.7. The bioassaymethod has the advantage of also controlling the disinfection efficiency and at thesame time the hydraulic characteristics of the reactors; however, the method is morelabor intensive. At present, bacteriophage is the preferred trace organism. Spores ofB. subtilis are an alternative [Sommer et al., 1997].
3.8.4 LONGITUDINAL OR TRANSVERSE MOUNTING OF LAMPS
Berson intensively studied the flow-through patterns of lamp installations in reactors,particularly at turbulent regimes. In a conventional longitudinal arrangement, poten-tial hydraulic short-circuiting can occur, but it can be kept under appropriate controlby design, as illustrated in Figure 80.
By mounting the lamps in the traverse mode, more uniform distribution of UVintensity is obtained, as well as less formation of deposits on the lamps (and lampenclosures). In addition, the distribution of the water is approximately steady overthe entire reactor section, as illustrated in Figure 81. The company Berson-UVdeveloped extensive computer modeling of both the hydraulics of the reactors andthe distribution of UV intensity of the lamps installed. It is now practically possibleto “tailor-to-measure” such equipment.
Figure 82 illustrates a still more recent arrangement, not only for disinfection pur-poses but also for appropriate synergistic oxidation with UV and hydrogen peroxide.
3.9 OPERATIONAL CONTROL OF EFFICIENCY
3.9.1 DIRECT CONTROL
Direct control of the disinfection efficiency of the installed systems is based oncomparative microbiological counts of the incoming and outgoing water. The mostsuitable test organisms are the total plate counts (TPC) at 22 and 37°C, coliformand E. coli counts, and occasionally (at monthly periods) spores of Clostridiumperfringens. Coliphage f-2 (also termed as a variant MS-2) is a significant organismfor control. Personally, we also find the occasional control of spores of Actinomyces(even with a simplified procedure—Masschelein [1966]) appears relevant in relation
L1603_Frame_C03 Page 100 Tuesday, March 5, 2002 5:37 PM
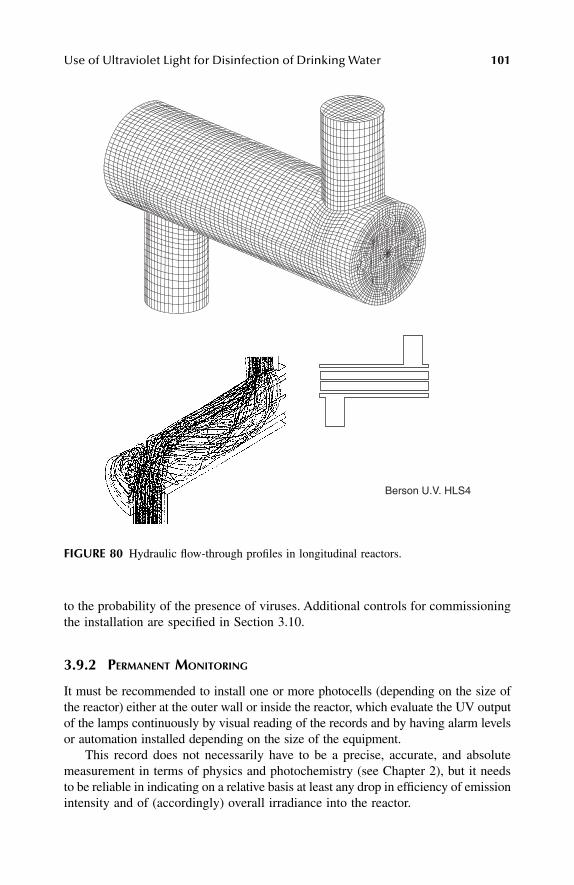
Use of Ultraviolet Light for Disinfection of Drinking Water 101
to the probability of the presence of viruses. Additional controls for commissioningthe installation are specified in Section 3.10.
3.9.2 PERMANENT MONITORING
It must be recommended to install one or more photocells (depending on the size ofthe reactor) either at the outer wall or inside the reactor, which evaluate the UV outputof the lamps continuously by visual reading of the records and by having alarm levelsor automation installed depending on the size of the equipment.
This record does not necessarily have to be a precise, accurate, and absolutemeasurement in terms of physics and photochemistry (see Chapter 2), but it needsto be reliable in indicating on a relative basis at least any drop in efficiency of emissionintensity and of (accordingly) overall irradiance into the reactor.
FIGURE 80 Hydraulic flow-through profiles in longitudinal reactors.
Berson U.V. HLS4
L1603_Frame_C03 Page 101 Tuesday, March 5, 2002 5:37 PM
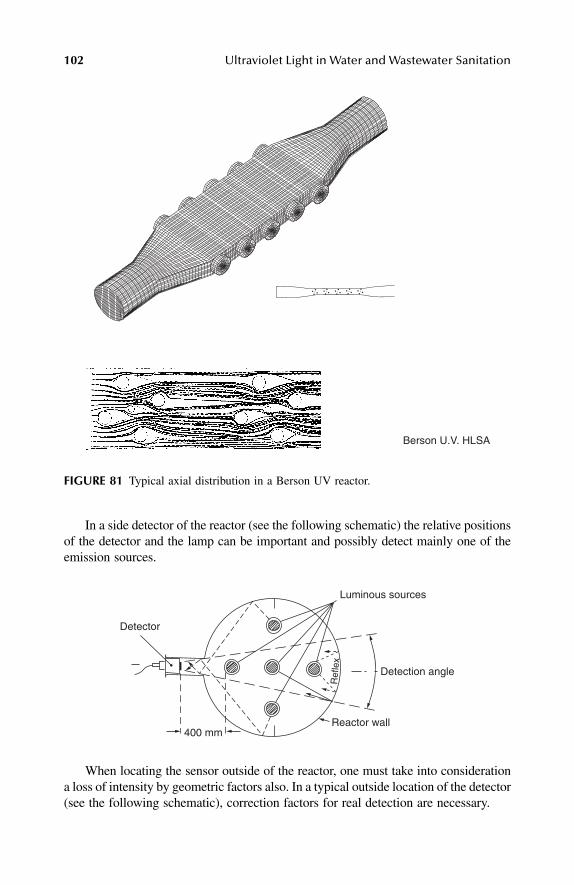
102 Ultraviolet Light in Water and Wastewater Sanitation
In a side detector of the reactor (see the following schematic) the relative positionsof the detector and the lamp can be important and possibly detect mainly one of theemission sources.
When locating the sensor outside of the reactor, one must take into considerationa loss of intensity by geometric factors also. In a typical outside location of the detector(see the following schematic), correction factors for real detection are necessary.
FIGURE 81 Typical axial distribution in a Berson UV reactor.
Berson U.V. HLSA
Detection angle
Detector
400 mm
Luminous sources
Reactor wall
Ref
lex
L1603_Frame_C03 Page 102 Tuesday, March 5, 2002 5:37 PM
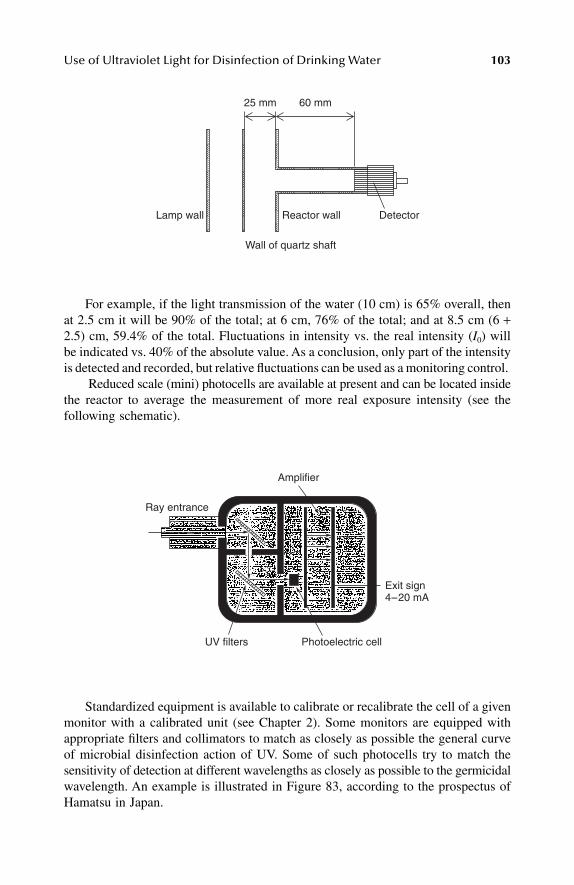
Use of Ultraviolet Light for Disinfection of Drinking Water 103
For example, if the light transmission of the water (10 cm) is 65% overall, thenat 2.5 cm it will be 90% of the total; at 6 cm, 76% of the total; and at 8.5 cm (6 +2.5) cm, 59.4% of the total. Fluctuations in intensity vs. the real intensity (I0) willbe indicated vs. 40% of the absolute value. As a conclusion, only part of the intensityis detected and recorded, but relative fluctuations can be used as a monitoring control.
Reduced scale (mini) photocells are available at present and can be located insidethe reactor to average the measurement of more real exposure intensity (see thefollowing schematic).
Standardized equipment is available to calibrate or recalibrate the cell of a givenmonitor with a calibrated unit (see Chapter 2). Some monitors are equipped withappropriate filters and collimators to match as closely as possible the general curveof microbial disinfection action of UV. Some of such photocells try to match thesensitivity of detection at different wavelengths as closely as possible to the germicidalwavelength. An example is illustrated in Figure 83, according to the prospectus ofHamatsu in Japan.
25 mm 60 mm
DetectorReactor wallLamp wall
Wall of quartz shaft
Exit sign4–20 mA
Photoelectric cell
Amplifier
UV filters
Ray entrance
L1603_Frame_C03 Page 103 Tuesday, March 5, 2002 5:37 PM
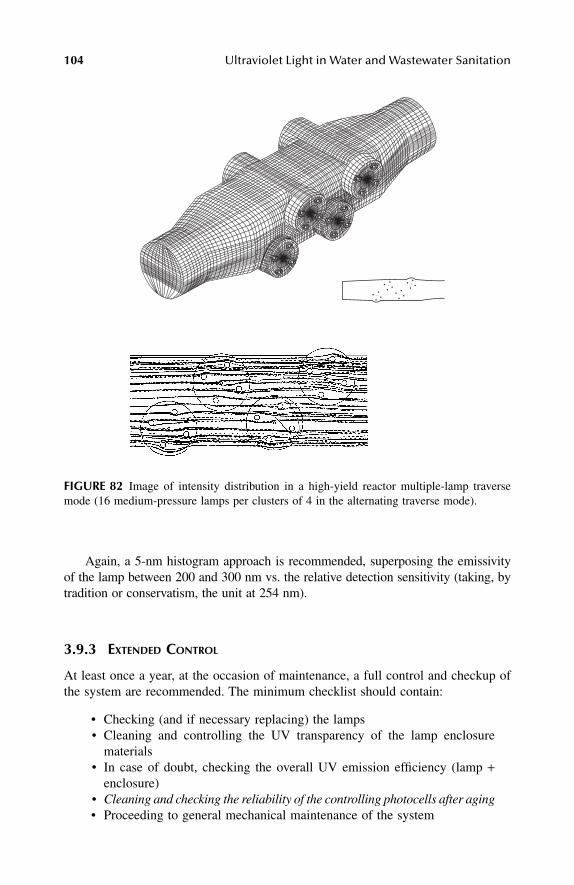
104 Ultraviolet Light in Water and Wastewater Sanitation
Again, a 5-nm histogram approach is recommended, superposing the emissivityof the lamp between 200 and 300 nm vs. the relative detection sensitivity (taking, bytradition or conservatism, the unit at 254 nm).
3.9.3 EXTENDED CONTROL
At least once a year, at the occasion of maintenance, a full control and checkup ofthe system are recommended. The minimum checklist should contain:
• Checking (and if necessary replacing) the lamps• Cleaning and controlling the UV transparency of the lamp enclosure
materials• In case of doubt, checking the overall UV emission efficiency (lamp +
enclosure)• Cleaning and checking the reliability of the controlling photocells after aging• Proceeding to general mechanical maintenance of the system
FIGURE 82 Image of intensity distribution in a high-yield reactor multiple-lamp traversemode (16 medium-pressure lamps per clusters of 4 in the alternating traverse mode).
L1603_Frame_C03 Page 104 Tuesday, March 5, 2002 5:37 PM
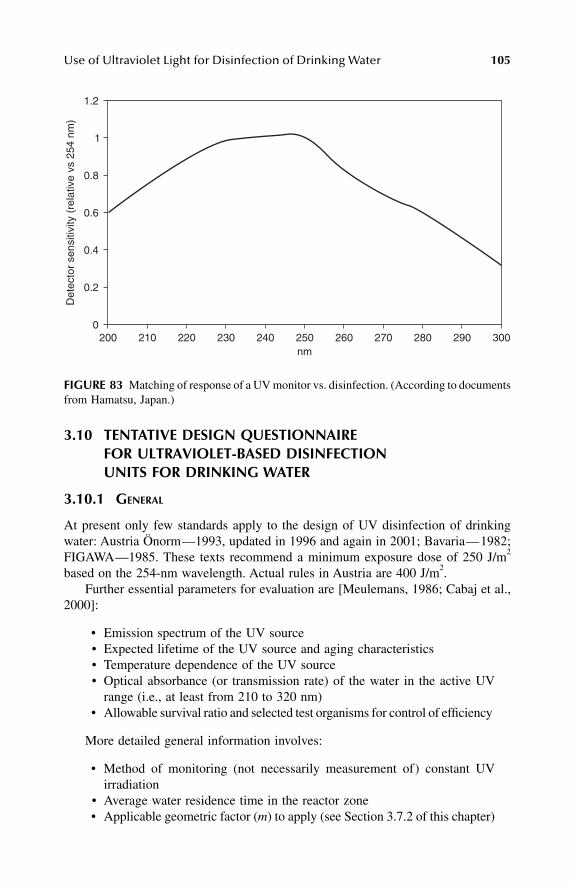
Use of Ultraviolet Light for Disinfection of Drinking Water 105
3.10 TENTATIVE DESIGN QUESTIONNAIRE FOR ULTRAVIOLET-BASED DISINFECTION UNITS FOR DRINKING WATER
3.10.1 GENERAL
At present only few standards apply to the design of UV disinfection of drinkingwater: Austria Önorm—1993, updated in 1996 and again in 2001; Bavaria—1982;FIGAWA—1985. These texts recommend a minimum exposure dose of 250 J/m2
based on the 254-nm wavelength. Actual rules in Austria are 400 J/m2.Further essential parameters for evaluation are [Meulemans, 1986; Cabaj et al.,
2000]:
• Emission spectrum of the UV source• Expected lifetime of the UV source and aging characteristics• Temperature dependence of the UV source• Optical absorbance (or transmission rate) of the water in the active UV
range (i.e., at least from 210 to 320 nm)• Allowable survival ratio and selected test organisms for control of efficiency
More detailed general information involves:
• Method of monitoring (not necessarily measurement of) constant UVirradiation
• Average water residence time in the reactor zone• Applicable geometric factor (m) to apply (see Section 3.7.2 of this chapter)
FIGURE 83 Matching of response of a UV monitor vs. disinfection. (According to documentsfrom Hamatsu, Japan.)
0
0.2
0.4
0.6
0.8
1
1.2
210 220 230 240 250 260 270 280 290 300200
Det
ecto
r se
nsiti
vity
(re
lativ
e vs
254
nm
)
nm
L1603_Frame_C03 Page 105 Tuesday, March 5, 2002 5:37 PM
106 Ultraviolet Light in Water and Wastewater Sanitation
3.10.2 DEFINITION OF PERFORMANCE REQUIRED
To obtain the most appropriate offer and the best guarantee of success, the problemto be solved must be defined as accurately as possible. This implies at least:
• Origin of the water to be treated (source, lake, groundwater, surface water,etc.)
• Pretreatment, if any• Ionic balance (with eventual seasonal minimum–maximum values) of the
water to be treated• Possible seasonal variation in water temperature and pH values• Possible content of iron and manganese• Possible turbidity and amount of suspended solids (milligrams per liter)• Possible total and dissolved organic carbon• Information on specific pollutants (if any significant)• Total plate count (TPC)• Coliform and E. coli counts• If available, counts for Clostridium perfringens, bacteriophages, and spe-
cific parasites• Definition of treatment objectives, microbiological standards to be met• Commissioning parameters
• Hydraulic tests at various flow regimes• Bioassay methods• Control methods of disinfection performance• Measurement of power consumption
3.10.3 ELEMENTS OF QUALIFICATION AND TENDERING
3.10.3.1 General Presentation of the Offer
• Manufacturer (of reactor and of lamps and quartz enclosures, with address,phone, fax, e-mail, and name of contact person)
• Possible flow to be treated, cubic meters per second (or per hour)• UV absorbance (full spectrum 210 to 320 nm), per centimeter or per meter• Type of reactor, materials, schematic, etc.• Nominal flow at 100% transmittance, cubic meters per hour• Nominal flow at absorbance indicated earlier, cubic meters per hour• Admissible water pressure, pascal• Headloss at nominal operation, pascal• Admissible variations in water flow, cubic meters per hour• Feed current volt and hertz• Type of electrical connection, standard applied• Total electrical consumption, watt-ampere• Number of lamps• Power consumption of one lamp, watt• Total UV yield of one lamp (+ spectrum), watt
L1603_Frame_C03 Page 106 Tuesday, March 5, 2002 5:37 PM
Use of Ultraviolet Light for Disinfection of Drinking Water 107
• Absorbance of enclosure material (+ spectrum), per centimeter or per meter• Expected lifetime of lamps and enclosure material, hour• Principle of mixing (if any)• Principle of continuous monitoring• Degree of automation• Cleaning device and mode of operation• Conditions of water feed (hammer protection, etc.)• Maintenance requirements and recommendations • Possibility of maintenance contract • Recommended number and type of spare parts • Start–stop procedures• Maintenance conditions during periods of out of service (long and short)
3.10.3.2 Operational Guarantee
• Financial guarantee • Guarantee on hardware • Guarantee on components (if different from hardware) • Recommended insurances • Obligations to be met by the user
3.10.3.3 Cost Parameters
• Reactor hardware cost, per unit• Cost of lamps, per unit• Cost of lamp enclosure, per unit• Cost of UV monitoring device, per unit• Cost of hydraulic protection of the system, per reactor or subunit • Cost of automation (if any) • Cost of mounting on site • Cost of assistance on starting-up • Costs and conditions of a preliminary pilot investigation (on a separate
basis from the main offer)
3.10.3.4 References
• To similar installations in operation• To standards applicable• To evaluations of similar equipment made by official bodies• To certifications, ISO, CEN, EPA (if any are applicable)• To specific descriptions in literature and scientific publications
Note: Existing standards may not be a hindrance for innovation and progress.
3.10.3.5 Other Aspects
The tender may include other aspects more specifically.
L1603_Frame_C03 Page 107 Tuesday, March 5, 2002 5:37 PM
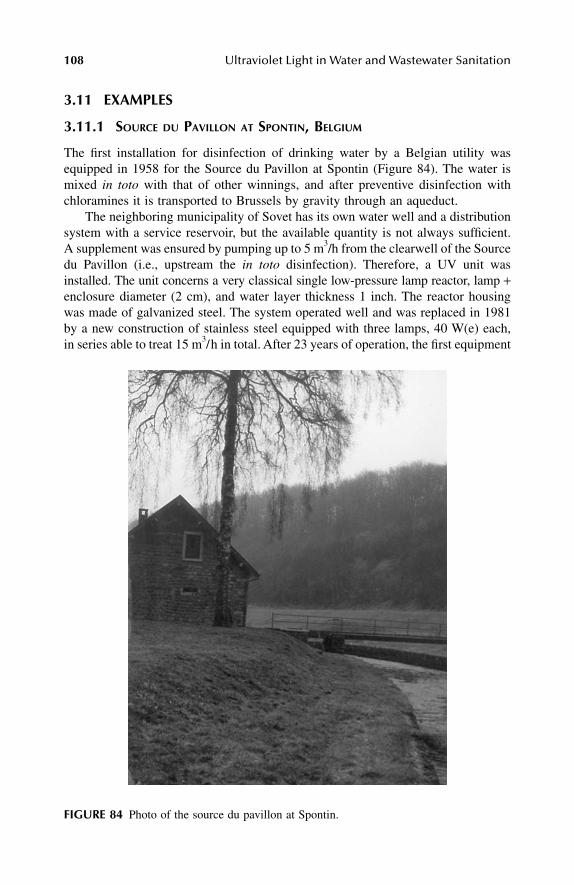
108 Ultraviolet Light in Water and Wastewater Sanitation
3.11 EXAMPLES
3.11.1 SOURCE DU PAVILLON AT SPONTIN, BELGIUM
The first installation for disinfection of drinking water by a Belgian utility wasequipped in 1958 for the Source du Pavillon at Spontin (Figure 84). The water ismixed in toto with that of other winnings, and after preventive disinfection withchloramines it is transported to Brussels by gravity through an aqueduct.
The neighboring municipality of Sovet has its own water well and a distributionsystem with a service reservoir, but the available quantity is not always sufficient.A supplement was ensured by pumping up to 5 m3/h from the clearwell of the Sourcedu Pavillon (i.e., upstream the in toto disinfection). Therefore, a UV unit wasinstalled. The unit concerns a very classical single low-pressure lamp reactor, lamp +enclosure diameter (2 cm), and water layer thickness 1 inch. The reactor housingwas made of galvanized steel. The system operated well and was replaced in 1981by a new construction of stainless steel equipped with three lamps, 40 W(e) each,in series able to treat 15 m3/h in total. After 23 years of operation, the first equipment
FIGURE 84 Photo of the source du pavillon at Spontin.
L1603_Frame_C03 Page 108 Tuesday, March 5, 2002 5:37 PM
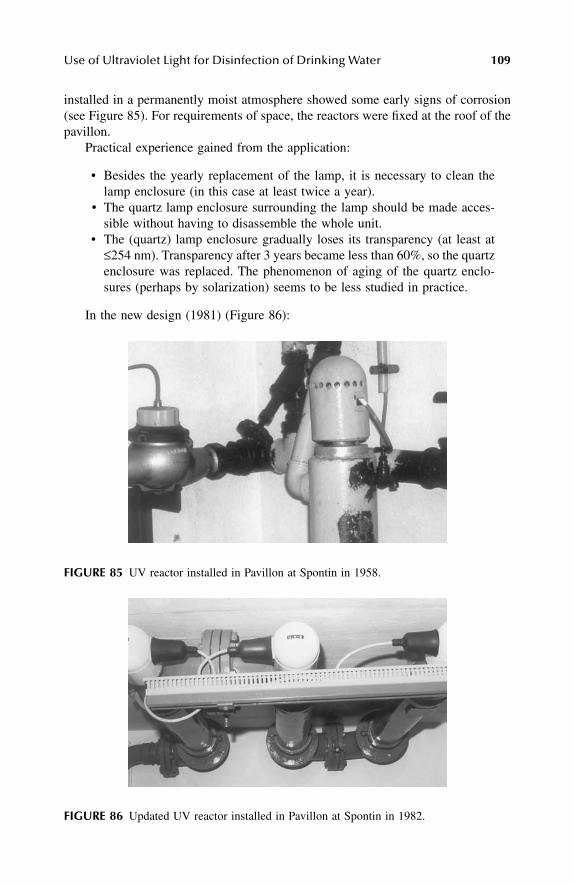
Use of Ultraviolet Light for Disinfection of Drinking Water 109
installed in a permanently moist atmosphere showed some early signs of corrosion(see Figure 85). For requirements of space, the reactors were fixed at the roof of thepavillon.
Practical experience gained from the application:
• Besides the yearly replacement of the lamp, it is necessary to clean thelamp enclosure (in this case at least twice a year).
• The quartz lamp enclosure surrounding the lamp should be made acces-sible without having to disassemble the whole unit.
• The (quartz) lamp enclosure gradually loses its transparency (at least at≤254 nm). Transparency after 3 years became less than 60%, so the quartzenclosure was replaced. The phenomenon of aging of the quartz enclo-sures (perhaps by solarization) seems to be less studied in practice.
In the new design (1981) (Figure 86):
FIGURE 85 UV reactor installed in Pavillon at Spontin in 1958.
FIGURE 86 Updated UV reactor installed in Pavillon at Spontin in 1982.
L1603_Frame_C03 Page 109 Tuesday, March 5, 2002 5:37 PM

110 Ultraviolet Light in Water and Wastewater Sanitation
• Results were always satisfactory for coliforms as they were for E. coli.• At lamp aging, reduction in performance for TPC bacterial number is
observed and aftergrowth after storage of 24 h in the laboratory occurs.This is observed before break-through of enterobacteria, and is a safesignal to take action.
• In the application, the off-take of water is variable with time. In case ofno off-take, a minimum water circulation through the reactors is main-tained (0.2 to 0.3 m3/h) in a closed loop to maintain the system.
3.11.2 IMPERIA, ITALY
The Imperia facility (installed by Berson, the Netherlands) (Figure 87) produces1200 m3/h of drinking water by disinfection of groundwater with low-pressure Hglamps. Four reactors are installed in series, each equipped with 12 lamps of 80 W(e).
3.11.3 ZWIJNDRECHT, THE NETHERLANDS
The Zwijndrecht (installed by Berson, the Netherlands) (Figure 88) facility disinfectsriverbank-infiltrated water with T10 = 85%. Four units are each equipped with fourmedium-pressure multiwave UV lamps.
3.11.4 ROOSTEREN, THE NETHERLANDS
The Roosteren facility (installed by Berson, the Netherlands) (Figure 89) treats 1000to 1600 m3/h by UV disinfection of groundwater (T10 97%). Four reactors operatein parallel, a total of 20 multiwave medium-pressure lamps.
FIGURE 87 Imperia, Italy-AMAT: 1200 m3/h, disinfection of groundwater with low-pressureHg lamps; four reactors in series, each equipped with 12 lamps of 80 W(e).
L1603_Frame_C03 Page 110 Tuesday, March 5, 2002 5:37 PM
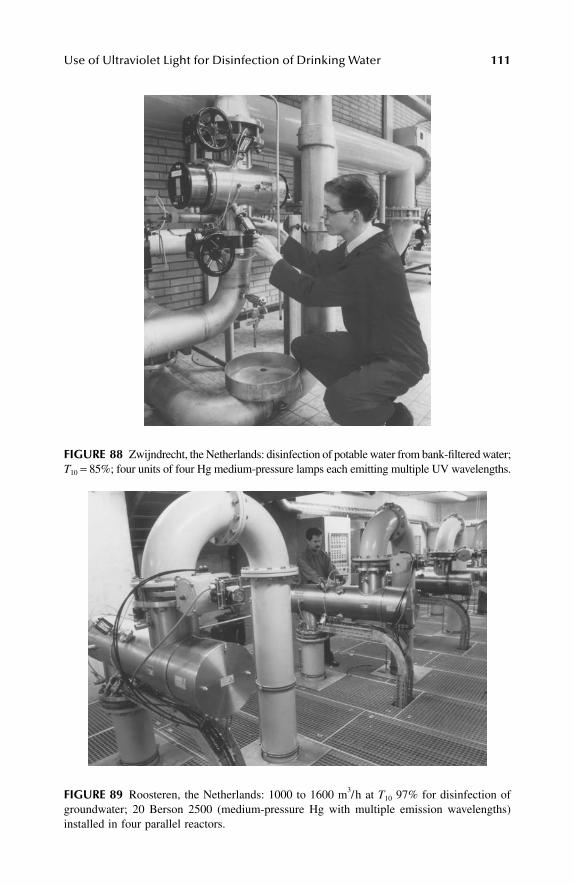
Use of Ultraviolet Light for Disinfection of Drinking Water 111
FIGURE 88 Zwijndrecht, the Netherlands: disinfection of potable water from bank-filtered water;T10 = 85%; four units of four Hg medium-pressure lamps each emitting multiple UV wavelengths.
FIGURE 89 Roosteren, the Netherlands: 1000 to 1600 m3/h at T10 97% for disinfection ofgroundwater; 20 Berson 2500 (medium-pressure Hg with multiple emission wavelengths)installed in four parallel reactors.
L1603_Frame_C03 Page 111 Tuesday, March 5, 2002 5:37 PM
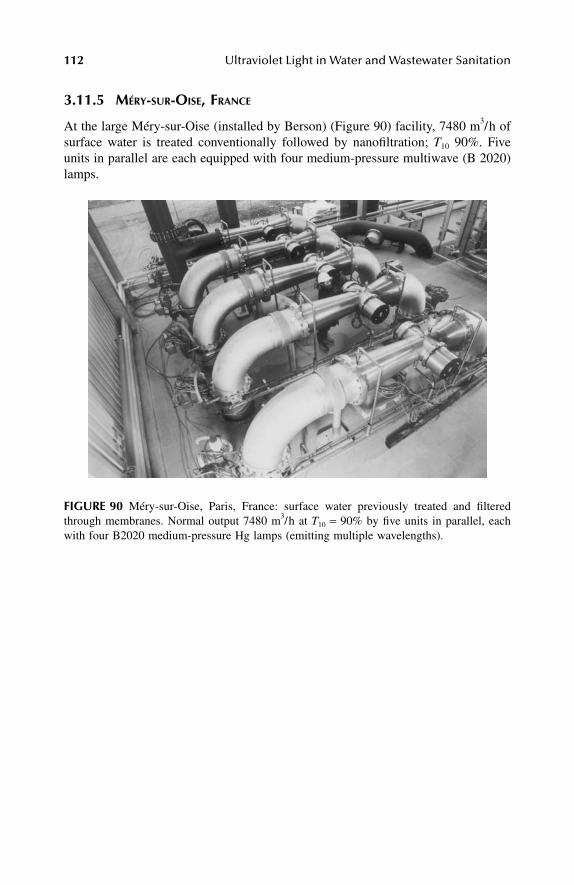
112 Ultraviolet Light in Water and Wastewater Sanitation
3.11.5 MÉRY-SUR-OISE, FRANCE
At the large Méry-sur-Oise (installed by Berson) (Figure 90) facility, 7480 m3/h ofsurface water is treated conventionally followed by nanofiltration; T10 90%. Fiveunits in parallel are each equipped with four medium-pressure multiwave (B 2020)lamps.
FIGURE 90 Méry-sur-Oise, Paris, France: surface water previously treated and filteredthrough membranes. Normal output 7480 m3/h at T10 = 90% by five units in parallel, eachwith four B2020 medium-pressure Hg lamps (emitting multiple wavelengths).
L1603_Frame_C03 Page 112 Tuesday, March 5, 2002 5:37 PM

113
Use of Ultraviolet in Photochemical Synergistic Oxidation Processes in Water Sanitation
4.1 BASIC PRINCIPLES
4.1.1 G
ENERAL
Photochemical synergistic oxidation processes are a recent development in watertreatment, related to the necessary removal of pollutants that are resistant to themore classical methods of treatment. The techniques, still in further development,are often termed commercially advanced oxidation processes (AOPs).
Besides the chemistry specifically related to ozone (for an overview, see Hoigné[1998]), these technologies involve several aspects related to the application ofultraviolet (UV):
• Direct photolytic action on compounds dissolved in the water sources• Photochemically assisted production of oxidants (mainly supposed to be
hydroxyl free radicals)• Photochemically assisted catalytic processes
Although effects have been observed on the ground, it must not be forgotten thatan overall energetic balance is required.
Considerable amounts of data have been reported in the literature related towater treatment, both in laboratory experiences, pilot plant investigations, and full-scale applications. However, even when the conditions and methods applied havebeen described with precision, it is often not possible to formulate general guidelinesfor design from the positive evidence as reported. These oxidation methods areapplicable for the removal of compounds resisting the more classical techniques.This effect is often considered as secondary in technical literature. More investigationon this subject is required. It certainly plays a role in combined ozone-UV processes[Denis et al., 1992; Masschelein, 1999; Leitzke and Friedrich, 1998].
The aim of this chapter is to summarize some fundamental aspects of theseapplications and to tentatively indicate preliminary recommendations for futuredesign rules and experimental protocols to be formulated and to apply.
4
L1603_frame_C04 Page 113 Tuesday, March 5, 2002 6:03 PM
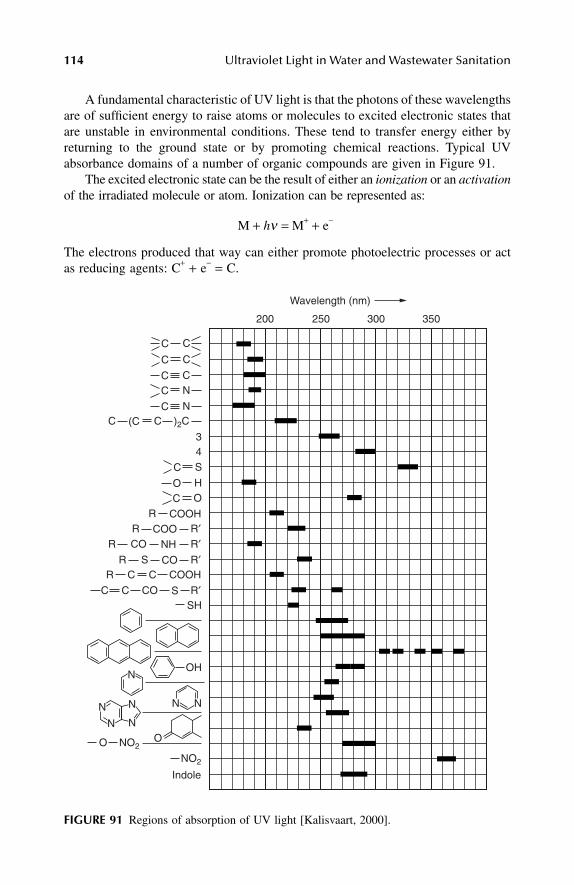
114
Ultraviolet Light in Water and Wastewater Sanitation
A fundamental characteristic of UV light is that the photons of these wavelengthsare of sufficient energy to raise atoms or molecules to excited electronic states thatare unstable in environmental conditions. These tend to transfer energy either byreturning to the ground state or by promoting chemical reactions. Typical UVabsorbance domains of a number of organic compounds are given in Figure 91.
The excited electronic state can be the result of either an
ionization
or an
activation
of the irradiated molecule or atom. Ionization can be represented as:
M
+
h
ν
=
M
+
+
e
−
The electrons produced that way can either promote photoelectric processes or actas reducing agents: C
+
+
e
−
=
C.
FIGURE 91
Regions of absorption of UV light [Kalisvaart, 2000].
200 250 300 350
C C
C C
C N
C S
34
C OO H
COOHR
COOR R′NHR CO R′
R C C COOHCOR S R′
SCC COSH
OH
OO NO2
NO2
Indole
R′
(C CC )2C
C C
C N
NN
N N
NN
N
Wavelength (nm)
L1603_frame_C04 Page 114 Tuesday, March 5, 2002 6:03 PM
Use of Ultraviolet in Photochemical Synergistic Oxidation Processes
115
Activation can be shown as:
M
+
h
ν
=
M
∗
Several mechanisms of deactivation of M
∗
can occur:
• Thermal dissipation (which is not interesting for water treatment)• Photonic energy transfers, as by fluorescence, that is, energy transfer to
other molecules or atoms of lower energy state of activation (e.g., chainreaction mechanisms)
• Rupture of linkages between atoms in molecules
The two latter mechanisms can be significant in water treatment. The direct effect of the 253.7-nm wavelength of the low-pressure mercury lamps
on the decomposition of dissolved chlorinated hydrocarbons has been studied asearly as 1986 [Frischerz, 1986; Schöller, 1989]. To obtain removal of trichloroetheneand trichloroethanes by 40 to 85% in conditions of germicidal treatment, an irradi-ation time of 1 h was required.
Sundstrom et al. [1986] reported the direct photolysis of halogenated hydrocar-bons. For example, 80% removal of trichloroethylene from a solution at 58-ppmconcentration needs an irradiation time of 40 min. Other experiments similarly con-cern the irradiation of chlorinated aromatic compounds. Weir et al. [1987] reportedsimilar yields for the abatement of benzene. Zeff and Leitis [1989] patented resultson direct photolysis of methylene chloride. With conventional equipment, an irradi-ation time of 25 min was required to obtain an abatement of ca. 60% when startingfrom solutions of 100-ppm concentration.
Guittonneau et al. [1988] studied the oxidation of THMs and related halogenatedethanes in a batch reactor system. The conclusion was that evaporation losses maynot be neglected in the experimental conditions as applied and that no evidencecould be produced in the experiments for the rupture of C–Cl bonds. Nicole et al.[1991] investigated again the potential destruction of THMs in annular reactors.They found that C–Br bonds can be photolyzed, but only after long exposure times(e.g., 30 min or longer).
The UV-B range also has been prospected and may be important for the appli-cation of medium-pressure Hg lamps. Dulin et al. [1986] reported on the photolysisof chloroaromatic compounds in water by irradiation with medium-pressure mercurylamps from which the UV-C was removed by optical filters. Simmons and Zepp[1986] found that at 366 nm, humic substances could produce an inner filter effect(which is optical competition by absorption of at least part of the light), on thephotolysis of nitroaromatic compounds. Peterson et al. [1990] studied the directphotochemical degradation of pesticides in water with a medium-pressure mercurylamp. Toy et al. [1990] prospected Xenon-doped arcs to remove 1,1,1-trichloroeth-ylene. Up to 80% removal could be obtained after 30 min of irradiation. Finally,Eliasson and Kogelschatz [1989] have developed excimer sources capable of ionizingor activating C–Cl bonds more specifically. This development is still in an experi-mental stage as far as drinking water treatment is concerned.
L1603_frame_C04 Page 115 Tuesday, March 5, 2002 6:03 PM
116
Ultraviolet Light in Water and Wastewater Sanitation
It can be concluded that direct photochemical reactions with trace concentrationsof organic micropollutants are of low efficiency and would require high irradiationdoses to be operated. Reaction times mentioned by the authors range between 25and 60 min with germicidal lamps. By comparison, average hydraulic residencetimes in UV disinfection units are in the range between 1 and 15 sec. This meansthat direct photooxidation would require UV dosages in the range of 40,000 to80,000 J/m
2
. The possible reactions, however, may not be neglected as potential secondary
effects in the synergistic oxidation processes. Most of the principles of photochem-ically assisted oxidations in water treatment are, at the present state of knowledge,considered as •OH-radical chemistry.
Direct photooxidation of water is important in photosynthesis [Rabinowitch,1945]. Under conditions of water treatment, however, vacuum UV light is requiredto directly dissociate water into reactive H• and •OH radicals. Another method isbased on photocatalytic processes, as discussed in Section 4.4. In the synergisticoxidation processes, •OH radicals also are produced by photolysis of either ozoneor hydrogen peroxide.
Vacuum UV, xenon excimer lamps (172 nm) are in full development [Eliassonand Kogelschatz, 1989] for the direct production of radicals on irradiation of water.Applications for general water treatment are not yet expected considering the limitedsize of the equipment and the yet undefined cost.
4.1.2 C
HARACTERISTICS
OF
•OH R
ADICALS
R
ELATED
TO
W
ATER
T
REATMENT
Hydroxyl radicals have both oxidation and reduction properties. The standard redoxpotential (i.e., vs. normal hydrogen electrode, calculated) of •OH is 2.47 V (valuesup to 2.8 V are published). The reducing properties are, as suggested by Weiss [1951]due to dissociation: •OH
=
O
−
+
H
+
. The reducing properties have been attributedto the oxygen mono-ion. Furthermore, the reducing properties of •OH can determineback-reactions in oxidations of ions as, for example:
Fe
2
+
+
•OH
=
(Fe
3
+
−
OH
−
)
followed by
(Fe
3
+
−
OH
−
)
+
•OH
=
Fe
2
+
+
H
2
O
2
In the case of iron salts, the first reaction is the most important, but with otherpolyvalent ions (e.g., cerium salts), the reduction pathway can become moreimportant [Uri, 1952]. These types of reactions have not yet been consideredexhaustively in water treatment, and at present the oxidation pathway is mostdescribed.
The O–H bond dissociation energy is estimated as (418
±
8) kJ/mol [Dwyer andOldenberg, 1944]. The overall energetic aspects of reactions of •OH radicals and
L1603_frame_C04 Page 116 Tuesday, March 5, 2002 6:03 PM
Use of Ultraviolet in Photochemical Synergistic Oxidation Processes
117
related oxygen species
in the aqueous phase
are reported according to Uri [1952](data in kilojoule per mole):
Halogen ions inhibit the reactions of •OH radicals [Taube and Bray, 1940; Allen,1948]. The effect occurs due to radical ion transfer reactions of the type •OH
+
X
−
=
OH
−
+
X•. Thus, X• radicals can be left in the medium and are potential halogenatingagents of organic compounds. These also can react directly with water: X•
+
H
2
O
=
X
−
+
H
+
+
•OH. (Similar reactions of X• radicals with hydrogen peroxide areindicated in Section 4.2.)
The thermodynamic data relating the reactions are reported as [Uri, 1952]:
These thermodynamic data, to which an activation energy must be associated,indicate that the probability of retroformation of •OH starting from X• is low. (In thecase of the exothermic reaction of F•, the activation energy in aqueous solution isestimated on the order of 20 to 40 kJ/mol.) Except for the reactions with hydrogenperoxide species commented on later, the most significant effects of radical ion transferreactions are related to bicarbonate and carbonate ions often present at relatively highconcentrations in drinking water.
Scavenging reactions reported are:
•OH
+
=
OH
−
+
and
•OH
+
HC
=
OH
−
+
With carbonate ions, the effect is much more important than with bicarbonate ions[Hoigné and Bader, 1977]. The carbonate radical remains an oxidant by itself, butits capabilities in water treatment have not yet been explored thoroughly. For exam-ple, it is reported that when oxidations are promoted by hydroxyl radicals in thepresence of bicarbonate–carbonate ions in the aqueous phase, the potential formation
•OH
+
H
2
O
2
=
H
2
O
+
HO
2
(radical) 79.5•OH
+
HO
2
(radical)
=
H
2
O
+
O
2
322HO
2
(radical)
+
H
2
O
2
=
H
2
O
+
•OH
+
O
2
125.5HO
2
(radical)
+
HO
2
(radical)
=
H
2
O
2
+
O
2
242.7•OH
+
•OH
=
H
2
O
2
196.6•OH
+
•OH
=
H
2
O
+
O 62.8
∆
H• (kJ/mol)
∆
G• (kJ/mol)
X•
=
F•
−
88
−
63 (exothermic)X•
=
Cl•
+
41.8
+
46 (endothermic)X•
=
Br•
+
96
+
100 (endothermic)X•
=
I•
+
167
+
163 (endothermic)
CO32− CO3
•–
O3− HCO3
•
L1603_frame_C04 Page 117 Tuesday, March 5, 2002 6:03 PM

118 Ultraviolet Light in Water and Wastewater Sanitation
of bromate ion by oxidation of bromide-hypobromite is increased vs. bromateformation in the absence of bicarbonate–carbonate ions. As a preliminary designrule, one can state that carbonate ion is best absent in waters treated by methodsbased on •OH radicals (i.e., to operate at pH values lower than 8).
In aqueous solution, the radical can dissociate into H+ and . The pKa
value of equals about 2 [Uri, 1952]. The molecular oxygen monovalent ionradical in aqueous solution is a supposed intermediate in the H2O2/UV processesdiscussed later. The first electron affinity of oxygen (exothermic) is reported as66 kJ/mol (O2 + e = + 66 kJ/mol). The mono-ion radical is solvated (solvationenergy is proposed as 293 kJ/mol). Oxygen as a molecular divalent ion ( ) ishydrolyzed into and OH− with an exothermic balance of +376.6 kJ/mol.
4.1.3 ANALYTICAL EVIDENCE OF •OH RADICALS IN WATER TREATMENT
Bors et al. [1978] have considered the practical possibilities of evidence of thespecific presence of •OH radicals under conditions comparable to those duringthe treatment of drinking water. Bleaching of p-nitrosodimethylaniline seems tobe a possible method because the dye is not bleached by singlet oxygen [Kraljicand Moshnsi, 1978; Sharpatyi et al., 1978]. The solutions of the dye also arestable in the presence of hydrogen peroxide, but not with application of hydrogenperoxide + UV [Pettinger, 1992]. Ozone-free UV light does not bleach the dyewithin delays encountered in practice. Ozone, however, added or generated on-site, interferes.
p-Nitrosodimethylaniline reacts rapidly with hydroxyl radicals: k2 = 1.2 ×10¹⁰ L/mol-sec [Baxendale and Wilson, 1957]. At pH = 9, the molar absorptioncoefficient in water, at 435 nm, has been reported as 84,400 L/mol ⋅cm. It isrecommended to measure the bleaching of a solution at the initial concentrationof 4 × 10⁻⁴ mol/L, and to operate with water that is saturated in oxygen vs. air[Pettinger, 1992].
No precise protocol or standard method has yet been defined for the detectionand determination of •OH radicals under conditions applicable to drinking watertreatment processes. It must be remembered that the lifetime of hydroxyl radicalsis in the range of nanoseconds and that the potential stationary concentration ofradicals such as •OH in water is low (estimated 10−12 to 10−13 mol/L by Acero andvon Gunten [1998]).
The absorbance of hydroxyl radicals in the UV-C range is about 500 to 600L/mol ⋅cm. Comparative values at 254 nm are 1000 L/mol ⋅cm for ; 2100L/mol⋅cm for ; 150 L/mol⋅cm for . A general value for aliphatic peroxyradicals is in the range of 1200 to 1600 L/mol⋅cm. The case of hydrogen peroxide ismentioned later.
It can be concluded that the potential optical interference of such radicals underconditions of water treatment is negligible in the UV-C range. However, such radicalscan be activated by absorbing UV-C light, and as such they cannot be neglected. Anoverview of literature on the degradation of chlorophenols is reported by Trapido et al.[1997].
HO2• O2
−•
HO2• O2
−•
O2−
O22−
HO2–
HO2•
O2− HO3
•
L1603_frame_C04 Page 118 Tuesday, March 5, 2002 6:03 PM
Use of Ultraviolet in Photochemical Synergistic Oxidation Processes 119
4.1.4 REACTIONS OF HYDROXYL RADICALS WITH ORGANIC COMPOUNDS IN AQUEOUS SOLUTION
Several mechanisms are operating in concomitant and competitive ways, as exploredby Peyton [1990].
4.1.4.1 Recombination to Hydrogen Peroxide
The recombination to hydrogen peroxide reaction follows:
2 •OH = H2O2
4.1.4.2 Hydrogen Abstraction
The hydrogen abstraction reaction is illustrated by:
•OH + + RH2 = …,RH• + H2O
These first steps are followed by a reversible reaction with dissolved oxygen:
RH• + O2 = RH
Hydrogen abstraction seems to be the dominant pathway. As a design rule, one canrecommend the water to be saturated (even oversaturated) in dissolved oxygenconcentration if submitted to •OH-based oxidations.
The organic peroxyl radical RH can further initiate thermally controlledoxidations.
• Decomposition and hydrolysis: RH = RH+ + ( + H2O) = RH+ + H2O2
• Homolysis: RH + …, RH2 = RHO2H (i.e., hydroxyl, carbonyl, andcarboxylic compounds) + RH•, thus initiating a chain mechanism; gen-eration of polymer products also possibly occurring; the latter easilyremoved by classical processes like coagulation–flocculation–settling
• Deactivation by hydrolysis of into H2O2 thus maintaining anothercyclic pathway
4.1.4.3 Electrophilic Addition
Direct addition to organic π-bond systems like carbon–carbon double bond systems,leads to organic radicals that are intermediates in dechlorination. An exhaustivereview on chlorophenols is available [Trapido et al., 1997].
4.1.4.4 Electron Transfer Reactions
•OH + RX = OH− + RX+•
This reaction corresponds to the reduction of the •OH radical and seems to beimportant in the case of multiple halogen-substituted compounds.
…
O2•
O2•
O2• O2
−•
O2•
O2−•
L1603_frame_C04 Page 119 Tuesday, March 5, 2002 6:03 PM
120 Ultraviolet Light in Water and Wastewater Sanitation
4.2 COMBINATIONS OF HYDROGEN PEROXIDE AND ULTRAVIOLET LIGHT
4.2.1 GENERAL ASPECTS
Hydrogen peroxide can be present in natural waters at concentrations in the rangeof 0.01 to 10 µM (i.e., 0.34 µg/L to 0.34 mg/L). This natural hydrogen peroxide canbe decomposed by sunlight and can contribute to natural purification mechanisms.However, the reacting concentrations correspond to very low levels. Hydrogen per-oxide is an allowed technical additive in drinking water, for example, at concentra-tions of 17 mg/L in Germany or 10 mg/L in Belgium. The European Commissionof Normalization (CEN) is considering the adoption of a limit of 17 mg/L.
Advantages of hydrogen peroxide as a source of hydroxyl ions are:
• Wide commercial availability of the reagent• High (almost infinite) miscibility with water• Relatively simple storage conditions and dosing procedures• High potential yield of production of hydroxyl radicals: two per molecule
Major specific disadvantages of the direct use of hydrogen peroxide in the •OH-based photochemical processes for water treatment are:
• Low absorbance in the classical UV range of wavelengths (vide infra)• Potential disproportionation reactions to form hydroperoxyl radicals; the
latter, (less or not active) putting a limit on the potentially useful hydrogenperoxide concentration that can be set in: H2O2 + •OH = H2O + H
The most commonly accepted mechanism of initial reaction of hydrogen per-oxide to produce hydroxyl radicals on irradiation with UV light is the cleavage intotwo •OH radicals: H2O2 + (hν) = 2 •OH. The quantum yield is about unity in dilutesolutions. According to the thermodynamics, this reaction phase is endothermic tothe extent of about 230 kJ/mol. Activation energy remains necessary to maintain theinternuclear distances during the photodissociation (Franck–Condon principle). Thenecessary initial energy input is in the range of 314 kJ/mol [Kornfeld, 1935].
At high concentrations (e.g., in the range of grams per liter), the direct UVphotolysis of hydrogen peroxide is of zero order. In other words, under such condi-tions that exist in industrial applications, the photonic flux is the rate-determiningstep. At lower concentrations, up to concentrations of 10 mg/L of hydrogen peroxide,the dissociation reaction of hydrogen peroxide obeys first-order kinetics: C(H2O2) =Co(H2O2) × e−kt. The k values can differ as a function of the UV lamp technology andreactor design. Typical values for k are, for example, 0.016/min for a low-pressure8-W(e) lamp (without the 185 nm-line), and 0.033/min for a 15-W(e) lamp transmit-ting also the 185 nm-line. At similar electrical power input, the k value can beapproximately doubled by Xenon-doped low-pressure mercury lamps also emittinga continuum around 200 to 220 nm [Pettinger, 1992].
O2•
L1603_frame_C04 Page 120 Tuesday, March 5, 2002 6:03 PM
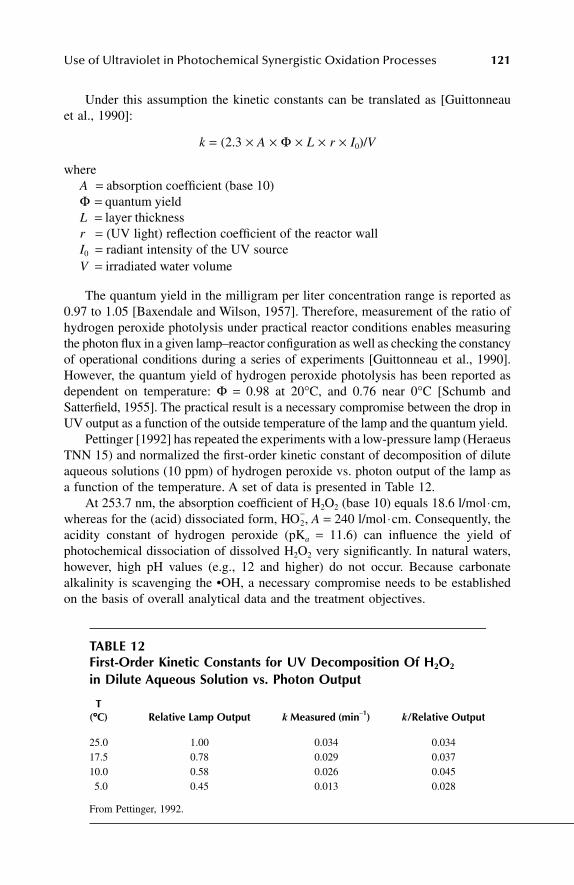
Use of Ultraviolet in Photochemical Synergistic Oxidation Processes 121
Under this assumption the kinetic constants can be translated as [Guittonneauet al., 1990]:
k = (2.3 × A × Φ × L × r × I0)/V
where A = absorption coefficient (base 10) Φ = quantum yield L = layer thickness r = (UV light) reflection coefficient of the reactor wall I0 = radiant intensity of the UV source V = irradiated water volume
The quantum yield in the milligram per liter concentration range is reported as0.97 to 1.05 [Baxendale and Wilson, 1957]. Therefore, measurement of the ratio ofhydrogen peroxide photolysis under practical reactor conditions enables measuringthe photon flux in a given lamp–reactor configuration as well as checking the constancyof operational conditions during a series of experiments [Guittonneau et al., 1990].However, the quantum yield of hydrogen peroxide photolysis has been reported asdependent on temperature: Φ = 0.98 at 20°C, and 0.76 near 0°C [Schumb andSatterfield, 1955]. The practical result is a necessary compromise between the drop inUV output as a function of the outside temperature of the lamp and the quantum yield.
Pettinger [1992] has repeated the experiments with a low-pressure lamp (HeraeusTNN 15) and normalized the first-order kinetic constant of decomposition of diluteaqueous solutions (10 ppm) of hydrogen peroxide vs. photon output of the lamp asa function of the temperature. A set of data is presented in Table 12.
At 253.7 nm, the absorption coefficient of H2O2 (base 10) equals 18.6 l/mol⋅cm,whereas for the (acid) dissociated form, H , A = 240 l/mol ⋅cm. Consequently, theacidity constant of hydrogen peroxide (pKa = 11.6) can influence the yield ofphotochemical dissociation of dissolved H2O2 very significantly. In natural waters,however, high pH values (e.g., 12 and higher) do not occur. Because carbonatealkalinity is scavenging the •OH, a necessary compromise needs to be establishedon the basis of overall analytical data and the treatment objectives.
TABLE 12First-Order Kinetic Constants for UV Decomposition Of H2O2 in Dilute Aqueous Solution vs. Photon Output
T(°°°°C) Relative Lamp Output k Measured (min−1) k/Relative Output
25.0 1.00 0.034 0.03417.5 0.78 0.029 0.03710.0 0.58 0.026 0.0455.0 0.45 0.013 0.028
From Pettinger, 1992.
O2−
L1603_frame_C04 Page 121 Tuesday, March 5, 2002 6:03 PM
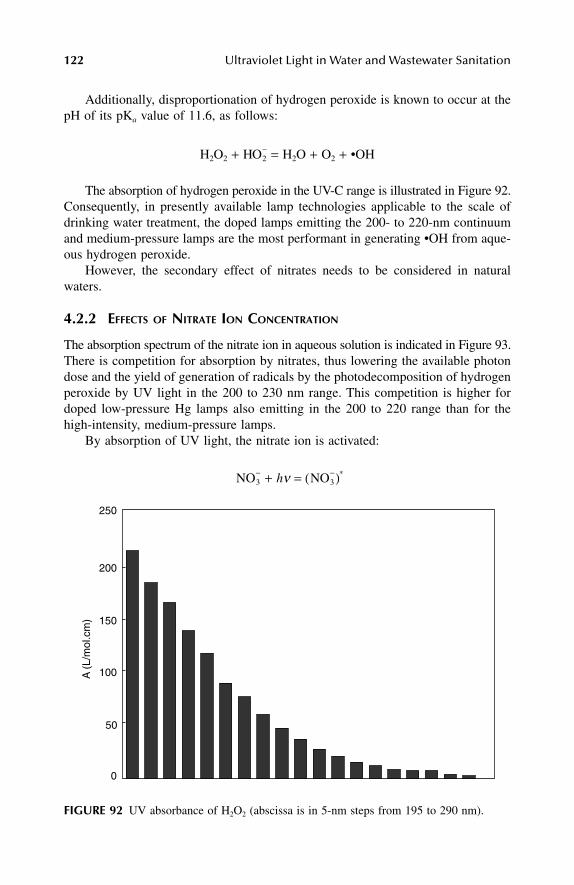
122 Ultraviolet Light in Water and Wastewater Sanitation
Additionally, disproportionation of hydrogen peroxide is known to occur at thepH of its pKa value of 11.6, as follows:
H2O2 + H = H2O + O2 + •OH
The absorption of hydrogen peroxide in the UV-C range is illustrated in Figure 92.Consequently, in presently available lamp technologies applicable to the scale ofdrinking water treatment, the doped lamps emitting the 200- to 220-nm continuumand medium-pressure lamps are the most performant in generating •OH from aque-ous hydrogen peroxide.
However, the secondary effect of nitrates needs to be considered in naturalwaters.
4.2.2 EFFECTS OF NITRATE ION CONCENTRATION
The absorption spectrum of the nitrate ion in aqueous solution is indicated in Figure 93.There is competition for absorption by nitrates, thus lowering the available photondose and the yield of generation of radicals by the photodecomposition of hydrogenperoxide by UV light in the 200 to 230 nm range. This competition is higher fordoped low-pressure Hg lamps also emitting in the 200 to 220 range than for thehigh-intensity, medium-pressure lamps.
By absorption of UV light, the nitrate ion is activated:
+ hν = ∗
FIGURE 92 UV absorbance of H2O2 (abscissa is in 5-nm steps from 195 to 290 nm).
O2−
NO3− NO3
−( )
0
50
100
150
200
250
A (
L/m
ol.c
m)
L1603_frame_C04 Page 122 Tuesday, March 5, 2002 6:03 PM
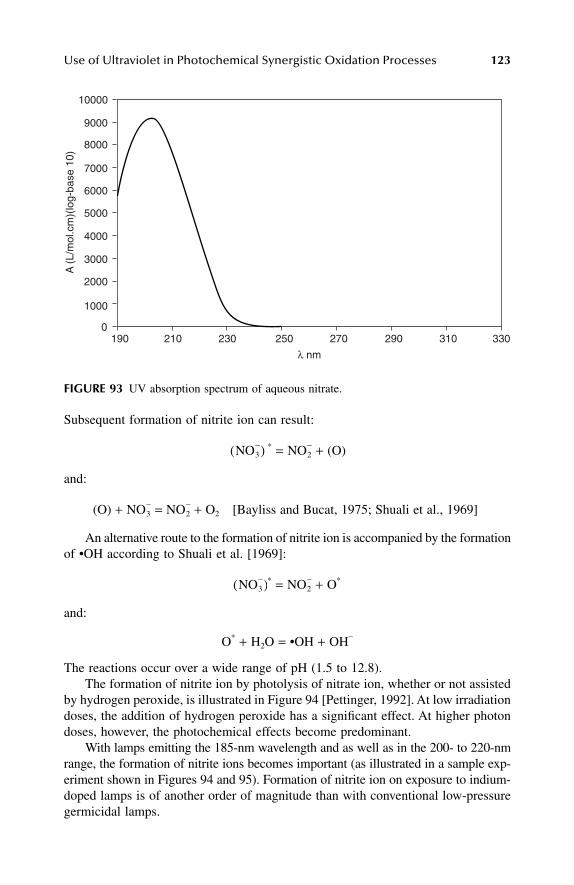
Use of Ultraviolet in Photochemical Synergistic Oxidation Processes 123
Subsequent formation of nitrite ion can result:
∗ = + (O)
and:
(O) + = + O2 [Bayliss and Bucat, 1975; Shuali et al., 1969]
An alternative route to the formation of nitrite ion is accompanied by the formationof •OH according to Shuali et al. [1969]:
∗ = + O∗
and:
O∗ + H2O = •OH + OH−
The reactions occur over a wide range of pH (1.5 to 12.8). The formation of nitrite ion by photolysis of nitrate ion, whether or not assisted
by hydrogen peroxide, is illustrated in Figure 94 [Pettinger, 1992]. At low irradiationdoses, the addition of hydrogen peroxide has a significant effect. At higher photondoses, however, the photochemical effects become predominant.
With lamps emitting the 185-nm wavelength and as well as in the 200- to 220-nmrange, the formation of nitrite ions becomes important (as illustrated in a sample exp-eriment shown in Figures 94 and 95). Formation of nitrite ion on exposure to indium-doped lamps is of another order of magnitude than with conventional low-pressuregermicidal lamps.
FIGURE 93 UV absorption spectrum of aqueous nitrate.
1900
1000
2000
3000
4000
5000
6000
7000
8000
9000
10000
210 230 250 270 290 310 330
A (
L/m
ol.c
m)(
log-
base
10)
λ nm
NO3−( ) NO2
−
NO3− NO2
−
NO3−( ) NO2
−
L1603_frame_C04 Page 123 Tuesday, March 5, 2002 6:03 PM

124 Ultraviolet Light in Water and Wastewater Sanitation
FIGURE 94 UV photolysis of nitrate ion. (Low-pressure Hg lamp with 185-nm wavelengthfiltered, classical germicidal lamps without increased emission yield in the 200 to 220 nmrange.) (From Pettinger, K.H., thesis, Technical University of Munich, Germany, 1992.)
FIGURE 95 Increased formation of nitrite ion during 185- to 220-nm irradiation of nitrate.
00
10
20
30
40
50
60
200 400 600 800 1000 1200
µg/L
nitr
ite (
ion)
Exposition 254 nm : µE/L
NO3 : 20 mg/L H2O2 : 0 mg/L
NO3 : 60 mg/L H2O2 : 0 mg/L
NO3 : 60 mg/L H2O2 : 10 mg/L
NO3 : 60 mg/L H2O2 : 20 mg/L
100
50
0
100
150
200
250
300
350
400
450
200 300 400 500 600 700 800 900 1000
Con
cent
ratio
n of
nitr
ite io
n (µ
g/L)
Micro-Einstein per liter (200–300 nm)
Y1 20 mg/L NO3Y2 40 mg/L NO3Y3 60 mg/L NO3
L1603_frame_C04 Page 124 Tuesday, March 5, 2002 6:03 PM
Use of Ultraviolet in Photochemical Synergistic Oxidation Processes 125
4.2.3 REPORTED DATA ON ULTRAVIOLET SYNERGISTIC OXIDATION WITH HYDROGEN PEROXIDE
Not many studies of full-scale data have been reported extensively yet on hydrogenperoxide-UV in drinking water, but the process is in significant development. Datafrom laboratory and pilot plant investigations on the removal of organic productsfrom water have been reviewed by Legrini et al. [1993]. One has the following sourcesof information classified by type of compound oxidized:
Chlorinated (and brominated) low molecular-mass compounds—Glaze et al.[1987]; Guittonneau et al. [1988]; Masten and Butler [1986]; Sundstromet al. [1986]; Sundstrom et al. [1989]; Symons et al. [1989]; Weir andSundstrom [1989].
Phenols, chlorinated phenols and nitrophenols—Castrantas and Gibilisco[1990]; Köppke and von Hagel [1991]; Ku and Ho [1990]; Lipczynska-Kochany and Bolton [1992]; Sundstrom et al. [1989]; Yue and Legrini[1989, 1992]; and more related to waste treatment, Yost [1989].
Organochlorine pesticides—Bandemer and Thiemann [1986]; Bourgine andChapman [1996, p. II.a]; Winner [1993]; Kruithof [1996]; Kruithof andKamp [2000].
Monocyclic aromatic hydrocarbons (also substituted)—Barich and Zeff [1990];Bernardin [1991]; Beyerle-Pfnür et al. [1989]; Cater et al. [1991]; Glaze andKang [1990]; Guittonneau et al. [1988a,b, 1990]; Ho [1986]; Peterson et al.[1990]; Sundstrom et al. [1989]; Symons et al. [1989]; Symons et al. [1990];Bischof [1994]; Dussert et al. [1996, p. I.IV.a].
Miscellaneous compounds and special casesCarbon tetrachloride. Guittonneau et al. [1988]; Sundstrom et al. [1989];
Symons et al. [1989]Diethylmalonate. Peyton and Gee [1989]Dimethylhydrazine. Guitonneau et al. [1990]Dioxane. Cater et al. [1991]Freon TF. Yost [1989]Methanol. Zeff and Leitis [1988]; Barich and Zeff [1990]Herbicides. Peterson et al. [1990]; Pettinger [1992]
Often, the results of investigations remain system-dependent (a particular reactorand a given lamp are used). Although the geometric description of the systemsgenerally is precise, it is not possible to accurately estimate the true absorbed dosein kilojoule per square meter, which is the necessary parameter for commercialscaling-up. Data are most often reported in terms of exposure dose. Recommenda-tions on this point are formulated at the end of this chapter.
At laboratory temperatures of 20 to 22°C and with initial concentrations ofpollutants in the range of 10−5 to 10−4 mol/L, a general observation of the resultswould be that an abatement of 60 to 100% requires 30 to 90 min. This also dependson the general matrix of the water (total organic carbon [TOC], pH, dissolved oxygen,etc.). In terms of energy consumption, in practice and also in pilot investigationsone must reckon with 0.8 kWh for 80% removal [Bourgine and Chapman, 1996].
L1603_frame_C04 Page 125 Tuesday, March 5, 2002 6:03 PM
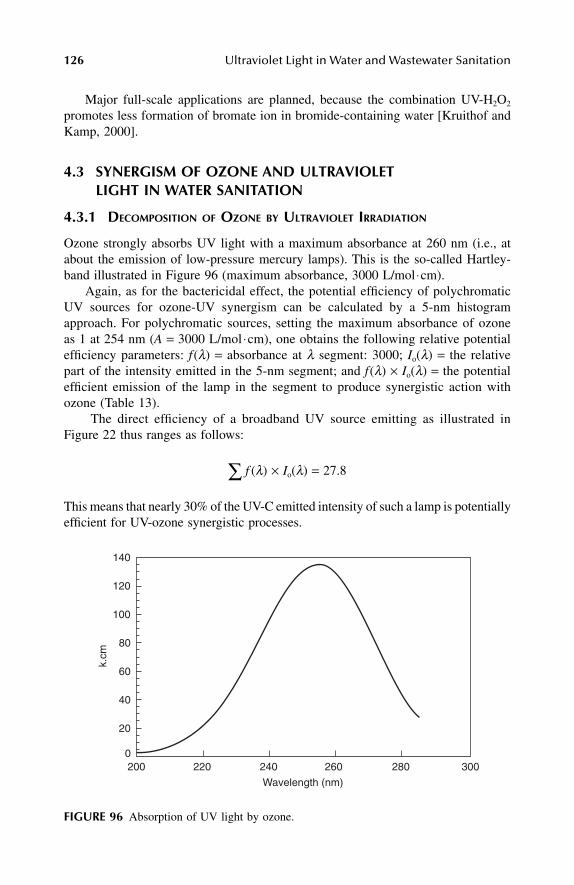
126 Ultraviolet Light in Water and Wastewater Sanitation
Major full-scale applications are planned, because the combination UV-H2O2
promotes less formation of bromate ion in bromide-containing water [Kruithof andKamp, 2000].
4.3 SYNERGISM OF OZONE AND ULTRAVIOLET LIGHT IN WATER SANITATION
4.3.1 DECOMPOSITION OF OZONE BY ULTRAVIOLET IRRADIATION
Ozone strongly absorbs UV light with a maximum absorbance at 260 nm (i.e., atabout the emission of low-pressure mercury lamps). This is the so-called Hartley-band illustrated in Figure 96 (maximum absorbance, 3000 L/mol ⋅cm).
Again, as for the bactericidal effect, the potential efficiency of polychromaticUV sources for ozone-UV synergism can be calculated by a 5-nm histogramapproach. For polychromatic sources, setting the maximum absorbance of ozoneas 1 at 254 nm (A = 3000 L/mol ⋅cm), one obtains the following relative potentialefficiency parameters: f(λ) = absorbance at λ segment: 3000; Io(λ) = the relativepart of the intensity emitted in the 5-nm segment; and f(λ) × Io(λ) = the potentialefficient emission of the lamp in the segment to produce synergistic action withozone (Table 13).
The direct efficiency of a broadband UV source emitting as illustrated inFigure 22 thus ranges as follows:
(λ) × Io(λ) = 27.8
This means that nearly 30% of the UV-C emitted intensity of such a lamp is potentiallyefficient for UV-ozone synergistic processes.
FIGURE 96 Absorption of UV light by ozone.
f∑
200 220 240 260 280 3000
20
40
60
80
100
120
140
Wavelength (nm)
k.cm
L1603_frame_C04 Page 126 Tuesday, March 5, 2002 6:03 PM
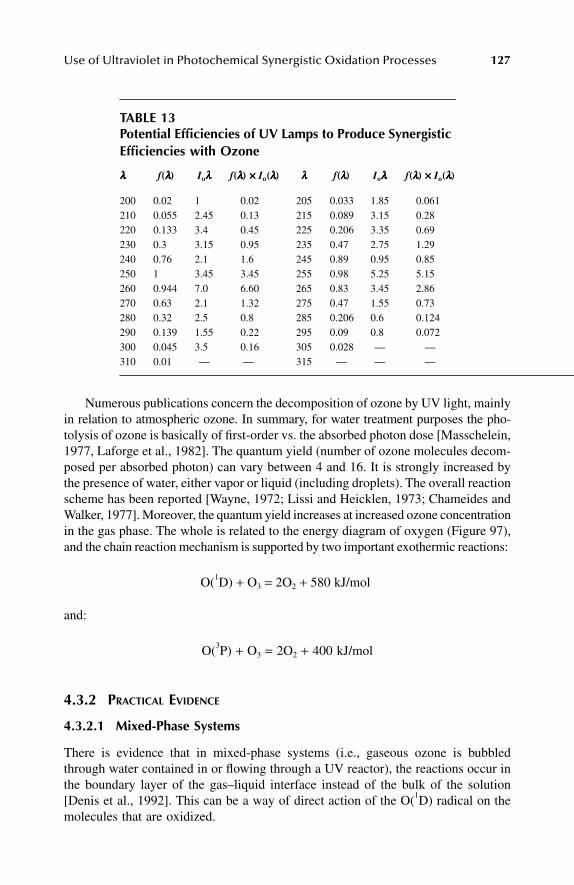
Use of Ultraviolet in Photochemical Synergistic Oxidation Processes 127
Numerous publications concern the decomposition of ozone by UV light, mainlyin relation to atmospheric ozone. In summary, for water treatment purposes the pho-tolysis of ozone is basically of first-order vs. the absorbed photon dose [Masschelein,1977, Laforge et al., 1982]. The quantum yield (number of ozone molecules decom-posed per absorbed photon) can vary between 4 and 16. It is strongly increased bythe presence of water, either vapor or liquid (including droplets). The overall reactionscheme has been reported [Wayne, 1972; Lissi and Heicklen, 1973; Chameides andWalker, 1977]. Moreover, the quantum yield increases at increased ozone concentrationin the gas phase. The whole is related to the energy diagram of oxygen (Figure 97),and the chain reaction mechanism is supported by two important exothermic reactions:
O(1D) + O3 = 2O2 + 580 kJ/mol
and:
O(3P) + O3 = 2O2 + 400 kJ/mol
4.3.2 PRACTICAL EVIDENCE
4.3.2.1 Mixed-Phase Systems
There is evidence that in mixed-phase systems (i.e., gaseous ozone is bubbledthrough water contained in or flowing through a UV reactor), the reactions occur inthe boundary layer of the gas–liquid interface instead of the bulk of the solution[Denis et al., 1992]. This can be a way of direct action of the O(1D) radical on themolecules that are oxidized.
TABLE 13Potential Efficiencies of UV Lamps to Produce Synergistic Efficiencies with Ozone
λλλλ f(λλλλ) Ioλλλλ f(λλλλ) ×××× Io(λλλλ) λλλλ f(λλλλ) Ioλλλλ f(λλλλ) ×××× Io(λλλλ)
200 0.02 1 0.02 205 0.033 1.85 0.061210 0.055 2.45 0.13 215 0.089 3.15 0.28220 0.133 3.4 0.45 225 0.206 3.35 0.69230 0.3 3.15 0.95 235 0.47 2.75 1.29240 0.76 2.1 1.6 245 0.89 0.95 0.85250 1 3.45 3.45 255 0.98 5.25 5.15260 0.944 7.0 6.60 265 0.83 3.45 2.86270 0.63 2.1 1.32 275 0.47 1.55 0.73280 0.32 2.5 0.8 285 0.206 0.6 0.124290 0.139 1.55 0.22 295 0.09 0.8 0.072300 0.045 3.5 0.16 305 0.028 — —310 0.01 — — 315 — — —
L1603_frame_C04 Page 127 Tuesday, March 5, 2002 6:03 PM
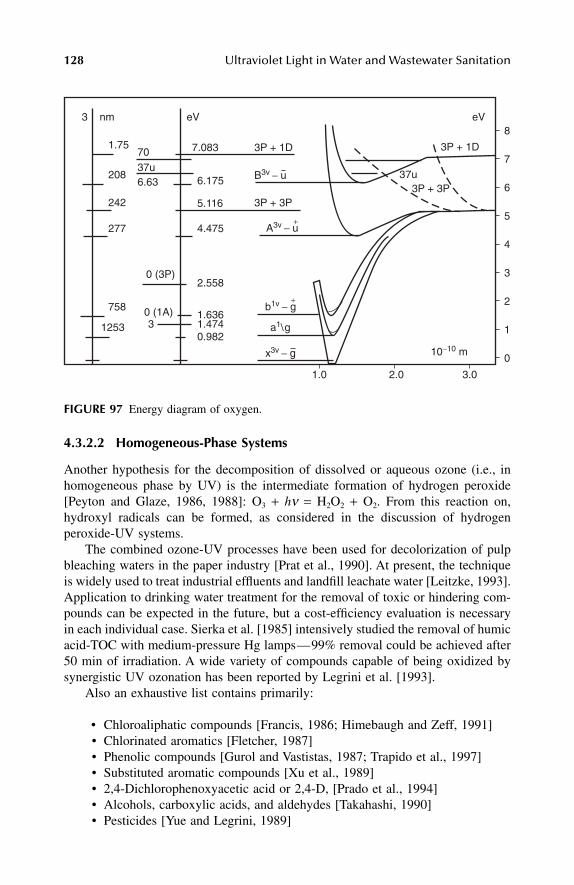
128 Ultraviolet Light in Water and Wastewater Sanitation
4.3.2.2 Homogeneous-Phase Systems
Another hypothesis for the decomposition of dissolved or aqueous ozone (i.e., inhomogeneous phase by UV) is the intermediate formation of hydrogen peroxide[Peyton and Glaze, 1986, 1988]: O3 + hν = H2O2 + O2. From this reaction on,hydroxyl radicals can be formed, as considered in the discussion of hydrogenperoxide-UV systems.
The combined ozone-UV processes have been used for decolorization of pulpbleaching waters in the paper industry [Prat et al., 1990]. At present, the techniqueis widely used to treat industrial effluents and landfill leachate water [Leitzke, 1993].Application to drinking water treatment for the removal of toxic or hindering com-pounds can be expected in the future, but a cost-efficiency evaluation is necessaryin each individual case. Sierka et al. [1985] intensively studied the removal of humicacid-TOC with medium-pressure Hg lamps—99% removal could be achieved after50 min of irradiation. A wide variety of compounds capable of being oxidized bysynergistic UV ozonation has been reported by Legrini et al. [1993].
Also an exhaustive list contains primarily:
• Chloroaliphatic compounds [Francis, 1986; Himebaugh and Zeff, 1991]• Chlorinated aromatics [Fletcher, 1987]• Phenolic compounds [Gurol and Vastistas, 1987; Trapido et al., 1997]• Substituted aromatic compounds [Xu et al., 1989]• 2,4-Dichlorophenoxyacetic acid or 2,4-D, [Prado et al., 1994]• Alcohols, carboxylic acids, and aldehydes [Takahashi, 1990]• Pesticides [Yue and Legrini, 1989]
FIGURE 97 Energy diagram of oxygen.
eV eVnm
1.75
208
242
277
758
1253
70
6.63
0 (3P)
0 (1A)3
37u
3
7.083 3P + 1D 3P + 1D
3P + 3P3P + 3P
B3v − u6.175
5.116
4.475
2.558
1.6361.4740.982
A3v − u
x3v − g
+
37u
b1v − g+
a1\g
1.0 2.0 3.0
010−10 m
1
2
3
4
5
6
7
8
L1603_frame_C04 Page 128 Tuesday, March 5, 2002 6:03 PM
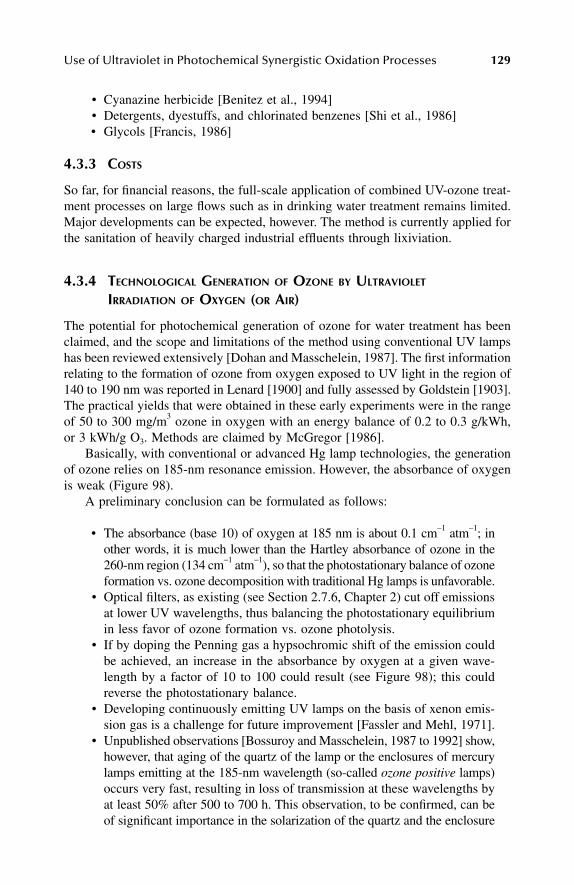
Use of Ultraviolet in Photochemical Synergistic Oxidation Processes 129
• Cyanazine herbicide [Benitez et al., 1994]• Detergents, dyestuffs, and chlorinated benzenes [Shi et al., 1986]• Glycols [Francis, 1986]
4.3.3 COSTS
So far, for financial reasons, the full-scale application of combined UV-ozone treat-ment processes on large flows such as in drinking water treatment remains limited.Major developments can be expected, however. The method is currently applied forthe sanitation of heavily charged industrial effluents through lixiviation.
4.3.4 TECHNOLOGICAL GENERATION OF OZONE BY ULTRAVIOLET IRRADIATION OF OXYGEN (OR AIR)
The potential for photochemical generation of ozone for water treatment has beenclaimed, and the scope and limitations of the method using conventional UV lampshas been reviewed extensively [Dohan and Masschelein, 1987]. The first informationrelating to the formation of ozone from oxygen exposed to UV light in the region of140 to 190 nm was reported in Lenard [1900] and fully assessed by Goldstein [1903].The practical yields that were obtained in these early experiments were in the rangeof 50 to 300 mg/m3 ozone in oxygen with an energy balance of 0.2 to 0.3 g/kWh,or 3 kWh/g O3. Methods are claimed by McGregor [1986].
Basically, with conventional or advanced Hg lamp technologies, the generationof ozone relies on 185-nm resonance emission. However, the absorbance of oxygenis weak (Figure 98).
A preliminary conclusion can be formulated as follows:
• The absorbance (base 10) of oxygen at 185 nm is about 0.1 cm−1 atm−1; inother words, it is much lower than the Hartley absorbance of ozone in the260-nm region (134 cm−1 atm−1), so that the photostationary balance of ozoneformation vs. ozone decomposition with traditional Hg lamps is unfavorable.
• Optical filters, as existing (see Section 2.7.6, Chapter 2) cut off emissionsat lower UV wavelengths, thus balancing the photostationary equilibriumin less favor of ozone formation vs. ozone photolysis.
• If by doping the Penning gas a hypsochromic shift of the emission couldbe achieved, an increase in the absorbance by oxygen at a given wave-length by a factor of 10 to 100 could result (see Figure 98); this couldreverse the photostationary balance.
• Developing continuously emitting UV lamps on the basis of xenon emis-sion gas is a challenge for future improvement [Fassler and Mehl, 1971].
• Unpublished observations [Bossuroy and Masschelein, 1987 to 1992] show,however, that aging of the quartz of the lamp or the enclosures of mercurylamps emitting at the 185-nm wavelength (so-called ozone positive lamps)occurs very fast, resulting in loss of transmission at these wavelengths byat least 50% after 500 to 700 h. This observation, to be confirmed, can beof significant importance in the solarization of the quartz and the enclosure
L1603_frame_C04 Page 129 Tuesday, March 5, 2002 6:03 PM
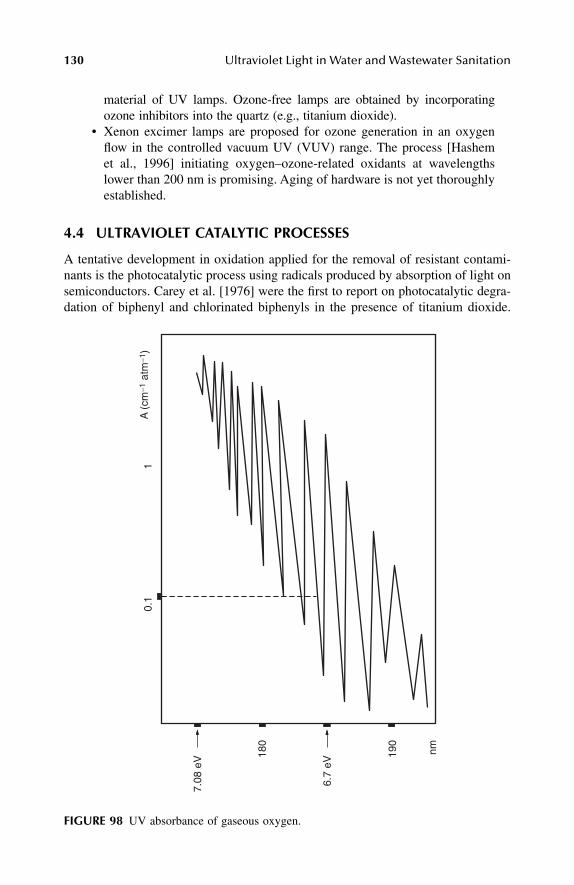
130 Ultraviolet Light in Water and Wastewater Sanitation
material of UV lamps. Ozone-free lamps are obtained by incorporatingozone inhibitors into the quartz (e.g., titanium dioxide).
• Xenon excimer lamps are proposed for ozone generation in an oxygenflow in the controlled vacuum UV (VUV) range. The process [Hashemet al., 1996] initiating oxygen–ozone-related oxidants at wavelengthslower than 200 nm is promising. Aging of hardware is not yet thoroughlyestablished.
4.4 ULTRAVIOLET CATALYTIC PROCESSES
A tentative development in oxidation applied for the removal of resistant contami-nants is the photocatalytic process using radicals produced by absorption of light onsemiconductors. Carey et al. [1976] were the first to report on photocatalytic degra-dation of biphenyl and chlorinated biphenyls in the presence of titanium dioxide.
FIGURE 98 UV absorbance of gaseous oxygen.
0.1
1A
(cm
−1 a
tm−1
)
6.7
eV
7.08
eV 18
0
190
nm
L1603_frame_C04 Page 130 Tuesday, March 5, 2002 6:03 PM
Use of Ultraviolet in Photochemical Synergistic Oxidation Processes 131
Titanium dioxide, whether or not in association with other metal oxides, has sincebeen prospected intensively for the removal of hindering compounds from leachatesof disposed hazardous wastes. Literature on the subject is reviewed by Legrini et al.[1993] and in proceedings of seminars [Al Ekabi, 1994 et seq.]. As far as drinkingwater treatment is concerned, no significant applications exist so far. The associationof other metal oxides with TiO2 (Ce, Pt, Mn, etc.) may require preliminary toxicologicalevaluation for this application. Association with copper ions is another feasibleoption [Paillard, 1996].
The basic principle of the process is the production of a semiconductor havingan electron hole:
TiO2(+hν) → TiO2(h+) + TiO2(e
−)
This reaction can be initiated by all wavelengths of the conventional UV ranges, A,B and C. Consequently, all light emitted by medium-pressure Hg lamps is potentiallyapplicable.
The quantum yield of the initiating reaction is very low, either less or equal to0.05 according to Mathews [1989], Pellizetti [1985], and Bolton [1991]. The reactioncan be obtained with some limits on exposure to sunlight [Takahashi et al., 1990].The oxidations at the electron-depleted entity only occur at short distances, that is,to molecules adsorbed on the catalyst (e.g., water or adsorbed organics):
TiO2(h+) + H2O (adsorbed) → TiO2 + H+ + •OH (adsorbed)
Direct reactions of adsorbed organic compounds are possible as well:
TiO2(h+) + RY (adsorbed) → TiO2 + H+ + RY• (adsorbed)
Molecular oxygen must be present to act as the electron acceptor:
TiO2(e−) + O2 → TiO2 +
Complementary addition of hydrogen peroxide can increase considerably the for-mation of •OH radicals, supposedly through following route:
TiO2(e−) + H2O2 → TiO2 + OH− + OH•
Determining parameters are pH, oxygen concentration, and TOC concentration.The process is controlled by adsorption and reactions at short distances on the catalystsurface. Therefore, the major problems to be solved are related to the reversibilityof the adsorption, the construction of adequate catalyst surfaces, the removal of thecatalyst from the treated water, the materials of construction of the equipment, andthe neccessary fundamental knowledge on the kinetics of the processes occurring[Legrini et al., 1993], [Okatomo et al., 1985a,b]. Up to now, the titanium dioxideprocesses have been focused on the treatment of industrial effluents and leachates,but developments for drinking water treatment are likely to occur in the future.
O2−•
L1603_frame_C04 Page 131 Tuesday, March 5, 2002 6:03 PM
132 Ultraviolet Light in Water and Wastewater Sanitation
4.5 TENTATIVE DESIGN RULES FOR ULTRAVIOLET SYNERGISTIC OXIDATION PROCESSES
As explained in Section 4.1.1, the data reported—even very precise—are often toosystem-dependent to enable direct formulation of general guidelines. An attempt ismade to draw the attention to some essential aspects that necessarily precede designwork of UV-assisted oxidation processes, as follows:
1. Flow of water to be treated, treatment scheme already existing—Minimum,maximum, and average guidelines are expected for the future.
2. Complete recorded and quantified UV spectrum of the water to betreated—These spectra (with variations in time, if any) in the full UVrange from 200 to 400 nm are a dominant parameter in the choice of thetype of lamp technology and possibly of the oxidant to be used in con-juction with UV.
3. A record of the total organic carbon (TOC), with variations in time—More precise information on the specific type of contaminants, as presentand whose removal is the objective, is of utmost important.
4. Ionic balances of the water composition and variations with specialemphasis ona. Total alkalinity, carbonate alkalinity and pH. These parameters can
determine the necessity of installing an acid pretreatment.b. Dissolved oxygen concentration. UV-assisted oxidation processes are
favored by high dissolved oxygen concentrations; the concentrations asexisting can determine the need for a preliminary aeration or oxygenation.
c. Nitrate ion content of the water, and variations. This parameter directlyinfluences the choice of lamp technology and also can determine thechoice of UV-H2O2 or UV-O3 technologies.
d. Temperature range of the water. This parameter influences the choiceof the lamp technology to apply and possibly the lamp enclosure.
e. Turbidity range of the water. This parameter influences the lamp clean-ing procedures of the system.
5. Total plate counts (TPC) and enterobacteria number—These numberscan determine the combination of disinfection–oxidation.
6. Preliminary investigations—If feasible within the economics of the localconditions, it is recommended to make at least a preliminary investigationin the laboratory, preferably a pilot study on the water to be treated. Tobe useful for design, these evaluations should report the informationspecified in 2 to 5. Moreover, besides a full description of the method,these evaluations should describe the irradiation dose applied (joule persquare meter). Concepts of experimental reactor designs and evaluationof the dose are described in Chapter 2.
7. Checklist of design of UV-synergistic oxidation processes in water sanitationa. Reliability of preliminary information and definition of the objectives
to achieve (see preceding 1 to 6)b. Basic justification of the system proposed vs. alternatives
L1603_frame_C04 Page 132 Tuesday, March 5, 2002 6:03 PM
Use of Ultraviolet in Photochemical Synergistic Oxidation Processes 133
c. Comments on complementary installation and operation conditions(incorporating into an existing or future treatment scheme pH-adjustment,aeration–oxygenation, mixing conditions, etc.)
d. Degree of automation and remote control requirede. Level of safety and redundancy requiredf. Priority of objectives (either with or without combined disinfection and
photochemical oxidation)g. Justification vs. alternative oxidation methodsh. Standards and codes of practice to apply (electrical, ambient, and envi-
ronmental safety aspects)i. Economic evaluation of the projectj. Maintenance and costs of spare partsk. Level of guarantee applicablel. Reference to existing installations (location, publications, etc.)m. Flexibility for future extensions and developments
L1603_frame_C04 Page 133 Tuesday, March 5, 2002 6:03 PM

L1603_frame_C04 Page 134 Tuesday, March 5, 2002 6:03 PM

135
Use of Ultraviolet Light for Sanitation of Wastewater
Ultraviolet (UV) light is a valuable alternative for disinfection of treated wastewater,because it forms no or very low levels of disinfection by-products. Among the negativesof the method that have been considered is the potential reactivation of organisms afterexposure, whether or not in relation to shielding of organisms by suspended solids.At present, no general rules exist for the necessary (high) UV doses that could promoteformation of by-products. Pilot investigations are advisable for each particular case.The potential toxicity of the treated effluent must be evaluated.
In contrast with drinking water treatment, a wastewater method is better estab-lished in the United States than in Europe. A survey made for the U.S. EPA [1986]found more than 600 utilities using UV for disinfection of secondary effluent, withthe period of experience more than 20 years [Martin, 1994]. This development stillis in progress, with the growing importance of the issue of disinfection by-products,but 1200 stations were mentioned to be in operation in the United States and Canadain 1995 [Blatchley and Xie, 1995]. No clear report is available on the number ofEuropean applications in wastewater treatment.
5.1 REGULATIONS AND GUIDELINES FOR DISINFECTION OF TREATED WASTEWATER
Concerning wastewater reuse for the purpose of irrigation of crops, the World HealthOrganization (WHO) recommends a maximum limit of 100 total coliforms per 100 mL,in 80% of the samples collected at regular intervals.
The Council Directive of the European Union concerning urban wastewatertreatment (91/271/European Economic Community [EEC]) (O.J. 25-05-1991) doesnot require specific disinfection of treated wastewater as it is discharged into theenvironment. The member stated or the local authorities can lay down specific require-ments as a function of reuse of treated water (recreation, shellfish culture, irrigationof crops
…
).The directive of the (European) council of December 8, 1975 lays down the
following bacteriological criteria for swimming water. They can be a good starting
5
L1603_frame_C05 Page 135 Tuesday, March 5, 2002 6:08 PM
136
Ultraviolet Light in Water and Wastewater Sanitation
point to evaluate disinfected wastewater:
•
Total coliforms
—Guide number less than 500 per 100 mL for 80% of thesamples at a given site, and imperatively less than 10,000 per 100 mL for95% of the determinations at a given sampling site
•
Fecal coliforms
—Guide number less than 100 per 100 mL for 80% of thedeterminations and imperative criterion of less than 2000/100 mL for 95%of the determinations
•
Fecal streptococci
—At least 90% of the samples in compliance with theguide number of less than 100 per 100 mL
The directive is the basis of national regulations. In France, general conditions of discharge and reuse of treated wastewater are
defined by the Décret 94-469 of June 3, 1994. For specific reuse, permits remaincase-dependent. For example, in the sea bathing station of Deauville, France, localcriteria applicable (using chlorine dioxide) for discharge of secondary effluent duringthe summer period is less than 2000 total coliforms per 100 mL, with the effluentdischarged at 2 km into the sea [Masschelein, CEFIC, 1996].
Another example involves Dieppe, France: Requirements have been set (for 95%of minimum 24 analyses) at total coliforms
<
10,000 per 100 mL, fecal coliforms
<
10,000 per 100 mL,
Streptococcus faecalis
<
1000 per 100 mL [Baron et al., 1999].ATV [1993], for example, also gives some general national recommendations.
In South Africa, the standards applicable to treated sewage specify the absence offecal coliforms per 100 mL sample (see South African General and Special Standards[1984]).
In the United States, requirements are formulated by the U.S. EPA Design Manualon Municipal Wastewater Disinfection [Haas et al., 1986]. Again, the individualstates can set specific requirements. Typical examples are cited next.
California regulations according to Title 22, Division 4, Chapter 3 of the CaliforniaCode of Regulations follow:
• If used for spray irrigation of crops the median is less than 2.2 total coliformsper 100 mL (maximum allowed exception: less than 23 per 100 mL once amonth) [Braunstein et al., 1994].
• The Contra Costa Sanitary District requires less than 240 total coliformbacteria per 100 mL [Heath, 1999]. At other locations, the local permit fortotal coliforms most probable network (MPN) is 23 per 100 mL as amonthly median with an allowable daily maximum of 500 per 100 mL.
• Gold Bar Wastewater Treatment of secondary effluent permits less than200 total coliforms per 100 mL; tertiary effluent, less than 2.2 (MPN)total coliforms per 100 mL.
• Mt. View Sanitary District allows a 5-d median limit of 23 (MPN) totalcoliforms per 100 mL with a wet weather maximum of 230 per 100 mL.
In Florida, State Rule 62-600.400 of the Florida Administrative Code permitsan annual average of less than 200 fecal coliforms per 100 mL, and no single samplecontaining more than 800 per 100 mL. In Massachusetts, the standard for average
L1603_frame_C05 Page 136 Tuesday, March 5, 2002 6:08 PM
Use of Ultraviolet Light for Sanitation of Wastewater
137
fecal coliforms for swimming water is less than 200 per 100 mL; in open shellfishareas, median total less than 70 per 100 mL (10% not exceeding 230 per 100 mL).
In Israel, the bacteriological criteria for reuse of treated wastewater in agriculture(and related applications) have been reviewed extensively [Narkis et al., 1987]. Onthe basis of 80% of the collected samples and per 100 mL, the limits for total coliformsfor irrigation are set as:
• Less than 250 for vegetables to be cooked, fruits, football fields, golf courses• Less than 12 for unrestricted irrigation of crops• Less than three for irrigation of public parks and lawn areas (in 50% of
the samples)
(In this context, the EEC Directive 75/440 on quality of surface water sources in-tended to be treated to obtain drinking water, recommends the following for the lowestquality allowable: total coliforms 500,000 per liter; fecal coliforms 200,000 per liter;fecal streptococci 100,000 per liter. The AWWA recommendations [AWWA, 1968] areless tolerant: total coliforms
<
200,000 per liter, fecal coliforms
<
100,000 per liter.Most requirements in force concern enterobacteria (mostly coliforms). Counting
of fecal coliforms is sometimes considered as an extended test. Some alternative testshave been considered, however, without general limits of tolerance. Proposed testorganisms are bacteriophage f-2 (or MS-2) [Braunstein, 1994], and poliovirus seededinto the effluent [Tree, 1997].
Clostridium perfringens
spores were also taken as anindicator for more resistent organisms (e.g., viruses) [Bission and Cabelli, 1980].
The estimated fecal coliform concentrations per 100 mL of undisinfected effluentsare as follows (according to U.S. EPA): primary effluent, 10
6
to 10
7
; secondaryeffluent, 10
4
to 10
5
; and tertiary effluent, 10
3
to 10
5
.Figure 99 is a photo of UV disinfection of wastewater at the wastewater treatment
plant at Gwinnett County, Georgia.
5.2 GENERAL CHARACTERISTICS OF EFFLUENTS IN RELATION TO DISINFECTION BY ULTRAVIOLET LIGHT
Dominant parameters to be considered are UV transmittance (UVT) and total sus-pended solids (TSS). As for the UVT, the wavelength of 254 nm is generallyconsidered in the published articles. (This holds for the low-pressure Hg lamps;appropriate correction factors apply in the use of other lamp technologies [e.g., bythe 5-nm histogram approach discussed earlier for drinking water disinfection].) Thepercentage of transmission is expressed for a layer thickness of 1 cm, and in termsof Beer–Lambert law on Log base 10 scale (sometimes not explicitly defined).
The unfiltered transmittance of a secondary-treated effluent is reported [Lodgeet al., 1994] to be in the range of 35 to 82% (average 60%). From other literaturesources, a range from 58 to 89% is observed and an average of 72% is probablysuited in design [Appleton et al., 1994]. Acceptance of a value of 69.5% (to be
L1603_frame_C05 Page 137 Tuesday, March 5, 2002 6:08 PM
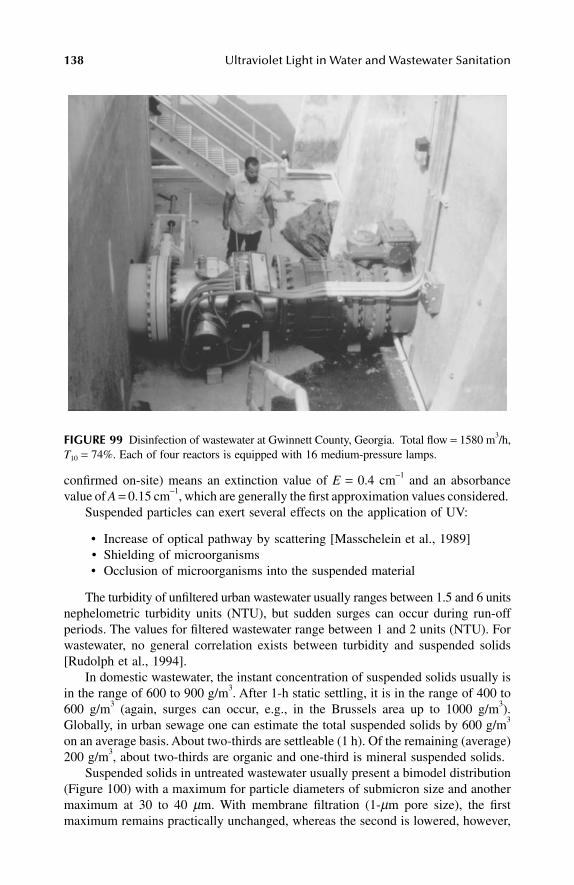
138
Ultraviolet Light in Water and Wastewater Sanitation
confirmed on-site) means an extinction value of
E
=
0.4 cm
−
1
and an absorbancevalue of
A
=
0.15 cm
−
1
, which are generally the first approximation values considered. Suspended particles can exert several effects on the application of UV:
• Increase of optical pathway by scattering [Masschelein et al., 1989]• Shielding of microorganisms• Occlusion of microorganisms into the suspended material
The turbidity of unfiltered urban wastewater usually ranges between 1.5 and 6 unitsnephelometric turbidity units (NTU), but sudden surges can occur during run-offperiods. The values for filtered wastewater range between 1 and 2 units (NTU). Forwastewater, no general correlation exists between turbidity and suspended solids[Rudolph et al., 1994].
In domestic wastewater, the instant concentration of suspended solids usually isin the range of 600 to 900 g/m
3
. After 1-h static settling, it is in the range of 400 to600 g/m
3
(again, surges can occur, e.g., in the Brussels area up to 1000 g/m
3
).Globally, in urban sewage one can estimate the total suspended solids by 600 g/m
3
on an average basis. About two-thirds are settleable (1 h). Of the remaining (average)200 g/m
3
, about two-thirds are organic and one-third is mineral suspended solids. Suspended solids in untreated wastewater usually present a bimodel distribution
(Figure 100) with a maximum for particle diameters of submicron size and anothermaximum at 30 to 40
µ
m. With membrane filtration (1-
µ
m pore size), the firstmaximum remains practically unchanged, whereas the second is lowered, however,
FIGURE 99
Disinfection of wastewater at Gwinnett County, Georgia. Total flow
=
1580 m
3
/h,
T
10
=
74%. Each of four reactors is equipped with 16 medium-pressure lamps.
L1603_frame_C05 Page 138 Tuesday, March 5, 2002 6:08 PM
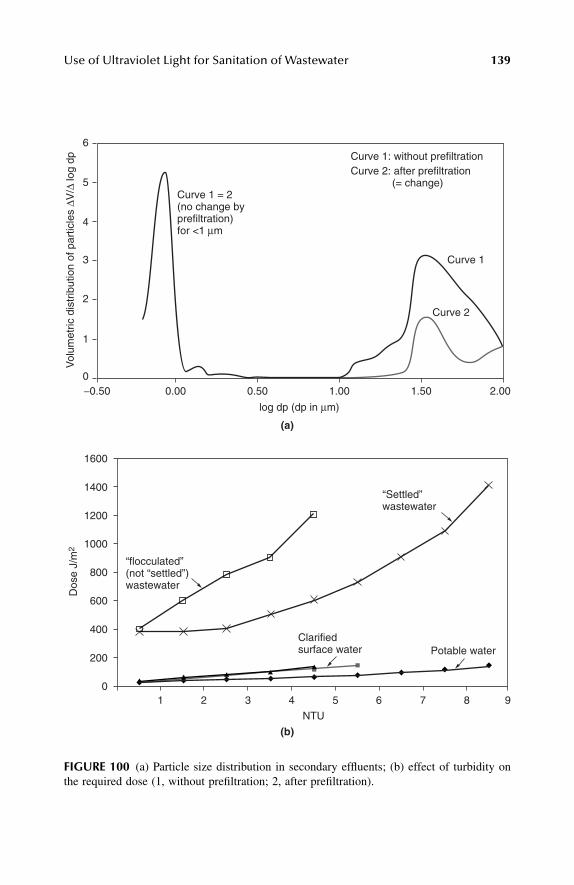
Use of Ultraviolet Light for Sanitation of Wastewater
139
FIGURE 100
(a) Particle size distribution in secondary effluents; (b) effect of turbidity onthe required dose (1, without prefiltration; 2, after prefiltration).
0
1
2
3
4
5
6
−0.50 0.00 0.50 1.00 1.50 2.00
Vol
umet
ric d
istr
ibut
ion
of p
artic
les
∆V/∆
log
dp
log dp (dp in µm)
Curve 1: without prefiltrationCurve 2: after prefiltration (= change)
Curve 2
Curve 1 = 2(no change byprefiltration)for <1 µm
Curve 1
(a)
(b)
0
200
400
600
800
1000
1200
1400
1600
1 2 3 4 5 6 7 8 9
Dos
e J/
m2
NTU
“flocculated”(not “settled”)wastewater
“Settled”wastewater
Clarifiedsurface water Potable water
L1603_frame_C05 Page 139 Tuesday, March 5, 2002 6:08 PM
140
Ultraviolet Light in Water and Wastewater Sanitation
not completely removed. With intense mechanical mixing (estimated velocity gradient,
G
=
≥
1000 sec
−
1
) or ultrasonication, the large particle size material (1.5
−
1.6
µ
m)of the initial bimodel distribution can be partially destroyed as well as agglomeratedto develop a trimodal distribution with secondary maxima at d
b
at 0.1 to 0.2, 0.8 to0.9, and 1.4 to 1.7
µ
m. This point might be important in laboratory experiments.More literature on particle-associated coliforms has been reported extensively byParker and Darby [1994].
Overall, according to the data of Geesey and Costerson [1984], 76% of the bacteriaare free-swimming and 24% are particle-associated. It is also reported that fecalbacteria adsorbed on sediments [Roper and Marshall, 1978], are more resistant toaggressions than free-swimming bacteria (e.g., irradiation by sunlight). Particle-associated bacteria are mostly found on suspended solids of particle diameter sizelarger than 10
µ
m [Ridgway and Olson, 1981, 1982].It is not easy to establish a clear difference between adsorbed microorganisms,
shielded microorganisms, and embedded microorganisms. A recommended proce-dure as published by Parker and Darby [1994] follows:
• Blend the sample (either wastewater or made-up sample) with an ampho-teric detergent (e.g., Zwittergent) to make the concentration 10
−
6
M
.• Add a complexing agent (e.g., ethylenediaminetetraacetic acid [EDTA])
to make the sample at 3 to 12
×
10
−
3
M
.• Make it 0.01% (wt) in
tris
-peptone buffer.• Adjust to pH 7 by phosphate buffering.• Stir, operating at 19,000 r/min (about 320 r/sec) for 5 to 17 min. (The
description is too vague to define a strict velocity gradient for the mixingconditions. From general methods of evaluation [Masschelein, 1991, 1996],the velocity gradient must have been higher than 5000 sec
−
1
.) Under suchconditions of mechanical mixing, an apparent increase in total coliformcounts by a factor of 4.0 to 7.7 could be observed. This means that the app-arent direct numeration in the raw water can be a considerable underestima-tion of the total number if no vigorous agitation is applied on sampling.
Under static conditions (i.e., without mechanical mixing but by dosing the blendingsolutions only in static conditions) no significant apparent increase in counts of totalcoliforms was observed.
5.3 AFTERGROWTH AND PHOTOREPAIR AFTER EXPOSURE TO ULTRAVIOLET DISINFECTION OF WASTEWATER
It is difficult to distinguish between aftergrowth and photorepair in treated waste-water. In the first case, residual undamaged bacteria develop in the wastewater, whichremains a nutrient medium. In the second case the schematic is as described inChapter 3.
Note:
In experimental work using artificial irradiation to promote photorepair,the mechanism is most often termed
photoreactivation
.
L1603_frame_C05 Page 140 Tuesday, March 5, 2002 6:08 PM
Use of Ultraviolet Light for Sanitation of Wastewater
141
The generally proposed hypothesis is that a photoreactivating enzyme forms acomplex with the pyrimidine dimer, the latter complex subject to photolysis by UV-A photons and restoring the original monomer as reported [Lindenauer and Darby,1994; Harm, 1980; Jagger, 1967]. Visible light from UV up to 490 nm is also reportedas able to promote photorepair. In other interpretations, enzymatic repair is consid-ered to be possible in the dark [Whitby et al., 1984].
Many organisms have been found able to photorepair UV-damaged DNA, includ-ing total and fecal coliforms,
Streptococcus feacalis, Streptomyces, Saccharomyces,Aerobacter, Micrococcus, Erwinia, Proteus, Penicillium
, and
Neurospora
. On theother hand, some organisms have been reported not to be subject to photorepair:
Pseudomonas aeruginosa, Clostridium perfringens, Haemophilus influenzae,
Dipli-coccus pneumoniae,
Bacillus subtilis
,
and
Micrococcus radiodurans
. Literature isextensively reviewed by Lindenauer and Darby [1994].
There are several ways to quantify the photorepair:
N
=
concentration of organisms surviving UV disinfection
N
o
=
concentration of organisms prior to UV disinfection
N
pr
=
concentration of organisms after photorepair
Kelner [1951] defines the degree of photorepair by (
N
pr
−
N
)/(
N
o
−
N
). To evaluatethe possible photorepair in wastewater treated by UV-C, a log-increase
approximation
is more often used:
log(
N
pr
/
N
o
)
−
log(
N
/
N
o
)
=
Log[(
N
pr
/
N
o
)
/
(
N
/
N
o
)]
=
log(
N
pr
/
N
)
According to literature, photoreactivation (in the log expression) could rangebetween 1 and 3.4. However, photorepair and photoreactivation are related to theinitial UV-C disinfecting dose. If the disinfecting UV dose is not sufficiently high,repair is greater. In the log approximation, no clear relation between the initial UVdisinfecting dose and the yield of repair is obvious. By analyzing the data andexpressing them in terms of degree of photorepair, however, a clear correlation isobtained (Figure 101).
No reported standardized testing procedures exist for evaluating photorepairor photoreactivating in water treatment. The use of white-light sources has beendescribed by Lindenauer and Darby [1994] (e.g., a 40-W Vitalight source was used[Durolight Corp.]), placed at 75 cm over a layer of 1 cm of wastewater. The exposurewas estimated at the exposure of 1 h sunlight at 12 noon (in the Californian sky).
The present conclusions on photorepair include:
• In wastewater disinfection by UV, a more careful analysis indicates thatthe photorepair is related to the UV exposure dose for disinfection,although in some publications, no relation between disinfection exposuredose and potential photorepair has been claimed.
• In practical conditions, the apparent regrowth as counted could also resultfrom embedded organisms in the suspended solids.
• As indicated, some organisms are more subject to repair than others.
L1603_frame_C05 Page 141 Tuesday, March 5, 2002 6:08 PM
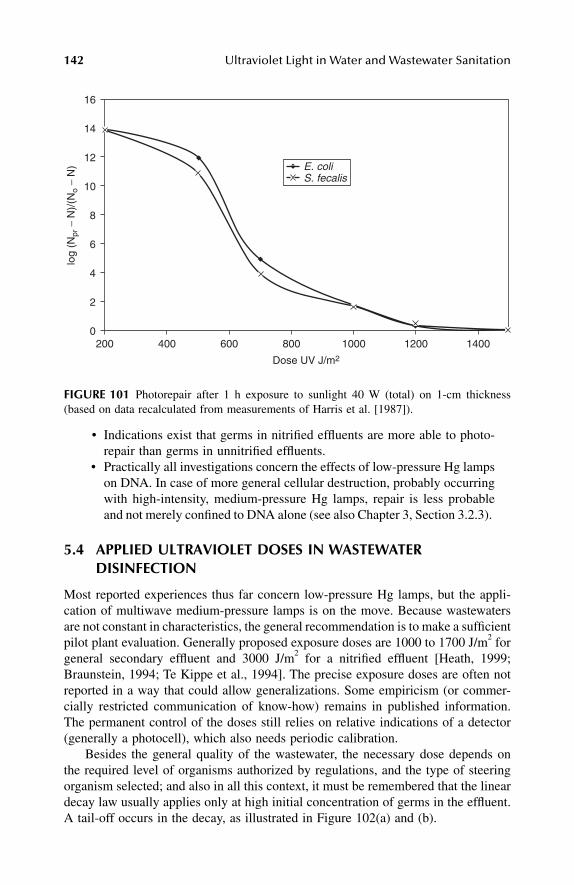
142
Ultraviolet Light in Water and Wastewater Sanitation
• Indications exist that germs in nitrified effluents are more able to photo-repair than germs in unnitrified effluents.
• Practically all investigations concern the effects of low-pressure Hg lampson DNA. In case of more general cellular destruction, probably occurringwith high-intensity, medium-pressure Hg lamps, repair is less probableand not merely confined to DNA alone (see also Chapter 3, Section 3.2.3).
5.4 APPLIED ULTRAVIOLET DOSES IN WASTEWATER DISINFECTION
Most reported experiences thus far concern low-pressure Hg lamps, but the appli-cation of multiwave medium-pressure lamps is on the move. Because wastewatersare not constant in characteristics, the general recommendation is to make a sufficientpilot plant evaluation. Generally proposed exposure doses are 1000 to 1700 J/m
2
forgeneral secondary effluent and 3000 J/m
2
for a nitrified effluent [Heath, 1999;Braunstein, 1994; Te Kippe et al., 1994]. The precise exposure doses are often notreported in a way that could allow generalizations. Some empiricism (or commer-cially restricted communication of know-how) remains in published information.The permanent control of the doses still relies on relative indications of a detector(generally a photocell), which also needs periodic calibration.
Besides the general quality of the wastewater, the necessary dose depends onthe required level of organisms authorized by regulations, and the type of steeringorganism selected; and also in all this context, it must be remembered that the lineardecay law usually applies only at high initial concentration of germs in the effluent.A tail-off occurs in the decay, as illustrated in Figure 102(a) and (b).
FIGURE 101
Photorepair after 1 h exposure to sunlight 40 W (total) on 1-cm thickness(based on data recalculated from measurements of Harris et al. [1987]).
E. coliS. fecalis
0
2
4
6
8
10
12
14
16
200 400 600 800 1000 1200 1400
Dose UV J/m2
log
(Npr
− N
)/(N
o −
N)
L1603_frame_C05 Page 142 Tuesday, March 5, 2002 6:08 PM
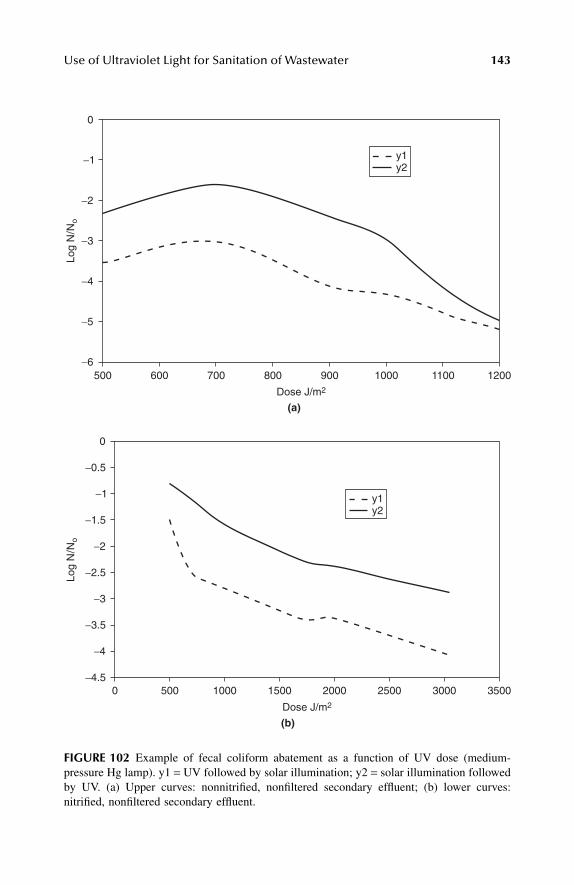
Use of Ultraviolet Light for Sanitation of Wastewater
143
FIGURE 102
Example of fecal coliform abatement as a function of UV dose (medium-pressure Hg lamp). y1
=
UV followed by solar illumination; y2
=
solar illumination followedby UV. (a) Upper curves: nonnitrified, nonfiltered secondary effluent; (b) lower curves:nitrified, nonfiltered secondary effluent.
500−6
−5
−4
−3
−2
−1
0
600 700 800 900 1000 1100 1200
Log
N/N
o
Dose J/m2
y1y2
0−4.5
−4
−3.5
−3
−2.5
−2
−1.5
−1
−0.5
0
500 1000 1500 2000 2500 3000 3500
Log
N/N
o
Dose J/m2
y1y2
(a)
(b)
L1603_frame_C05 Page 143 Tuesday, March 5, 2002 6:08 PM
144
Ultraviolet Light in Water and Wastewater Sanitation
An empirical design model has been proposed as follows by Appleton et al.[1994]:
N = (f )Dn
where N = bacterial concentration D = active UV dose f and n = empirical coefficients
The dose is estimated to be the average germicidal UV intensity (I) × irradiationtime. The water quality factor f is approached by f = A × (TSS)a × (UVT)b, whereA, a, and b are again empirical coefficients.
The whole is combined in an empirical model in which e is the random errorof the model:
logN = log A + a log(TSS) + b log(UVT) + n log I + n logt + (e)
As for the average germicidal UV intensity again, an empirical binomial approachis considered:
I = −3.7978 + 0.36927 (UVT) − 0.0072942 (UVT)2 + 0.0000631 (UVT)3
in which UVT is the UV transmittance in percentage of the unfiltered effluent. Thisapproach was obtained for the Discovery Bay WWTP, California. It is not entirelyestablished yet to what extent it can be of general value. However, the wholeapproach, based on the requirements for admissible limits for N and historicalknowledge of TSS and UVT, ends in the choice of values for N and t.
The general structure of the method gives satisfactory results as reported; how-ever, the essential parameters of the model can remain case-dependent. For the restof design remaining determinants include hydraulic conditions, quality standards tobe met and lamp technologies, intensity vs. irradiation time [Zukovs et al., 1986],maintenance, and performance control.
Numerous publications report on the installation of the lamps in the longitudinalmode (i.e., horizontal length in the same direction of the water flow [see Baron et al.,1999]), in the vertical mode (i.e., lamps up-down in the water flow [see Chu-Fei, H.Ho et al., 1994]). For low-pressure Hg lamps, these options appear not to be determi-nant in terms of efficiency. The choice parameters are related to both preexistinghardware to be retrofitted and general facilities for maintenance.
The Morrill index in comparable arrangements is about the same: between 1.15and 1.35 in existing reactors [Blatchley et al., 1994]. The aspect ratio is usuallyhigher in the horizontal lamp arrangement than in the vertical one. The aspect ratioAR is defined by the following relation [Soroushian et al., 1994]:
AR = X/L = X/4RH = (X × AW)/4Vv
whereX = length of the reactor-contact basin into the direction of water flowL = cross section of the UV lamps module perpendicular to the water flow (L = 4RH)
L1603_frame_C05 Page 144 Tuesday, March 5, 2002 6:08 PM
Use of Ultraviolet Light for Sanitation of Wastewater 145
RH = hydraulic radius = (Vv /Aw) Vv = net wetted volume that contains the lampsAw = total wetted horizontal surface of the module that contains the lamps
In existing plants with low-pressure Hg lamp technologies, the aspect ratiogenerally is between 15 and 40. The higher the value of AR, the closer plug-flowconditions are approached. It is important to consider this parameter in designingpilot experiments, particularly for retrofitting plants in which existing basins will beused to install UV units for disinfection.
For high UV emission intensity technologies such as medium-pressure lamps,installation of the lamps in the vertical or traverse mode orthogonal to the water flowis preferred, both for facility of maintenance and for compact hardware. Mixingconditions and intensity distribution patterns are illustrated in Chapter 3 (Figures 80,81, 82).
5.5 CHOICE OF LAMP TECHNOLOGY IN WASTEWATER DISINFECTION
In wastewater treatment, most present and existing applications are based on low-pressure lamp technologies. These are a result of historical factors related to tech-nologies available at the time. From investigations [Kwan, 1994], medium-pressurehigh emission intensity systems can be more economical than the more conventionallow-pressure lamp systems in both capital investment and lifetime costs (see alsoSoroushian [1994]). The number of plants making use of medium-pressure lampsis increasing rapidly. Until now, the use of excimer lamps and pulsed Xenon lampsin the field of wastewater disinfection remains experimental (e.g., for disinfectionof agricultural wastewater [Hunter et al., 1998]).
A rule of thumb is to install 40 to 60 low-pressure lamps per 150 m3/h ofwastewater with an electrical power requirement of 65 to 80 W each. The electricalcost thus amounts to about 17 to 32 W/m3. In some advanced installations, it cango up to nearly one lamp of 65 W(e)/m3/h [Baron et al., 1999]. Low-pressure mercurylamps used in this application usually have a length between 1.2 and 1.5 m.
Note: Low-pressure mercury lamps operate only on an all-or-nothing on–off basisvs. the nominal emission capacity.
As described before, the output of medium-pressure lamps currently can bemonitored between 60 and 100% of nominal emission capacity. This makes themattractive for treatment of variable water flows.
As for drinking water treatment, the lamps are installed in a quartz enclosure,which usually is mechanically cleaned with a to-and-fro wiper operated continuouslyor in an automated mode actioned as a function of a drop in light intensity ascontinuously measured.
Note: In the case of wastewater it is also necessary to clean the photocells andoccasionally to recalibrate the system.
L1603_frame_C05 Page 145 Tuesday, March 5, 2002 6:08 PM
146 Ultraviolet Light in Water and Wastewater Sanitation
This mechanical cleaning procedure is more complex in the case of low-pressureHg lamps, so that chemicals usually are required. A general cleaning procedure isto remove the lamps + enclosures per entire modules of several lamps and to dipthem into an acid solution. The generally recommended solution is composed ofphosphoric acid at 10% by weight. Air bubbling can accelerate the procedure.
An alternative is to use 10% citric acid and a water spray, although the lattermethod has been reported to fail in some cases [Chu-Fei, H. Ho et al., 1994]. Detergentscan be associated in the cleaning mixture and alternatives are also vinegar or ammonia[Martin, 1994]. In all cases, washing with a clear water bath or spray is recommendedat the end of the procedure. Cleaning of the window of the photocells usually needsan additional mechanical brushing (softly, however, so as not to damage the windowmaterial). Calibration of the cell after cleaning the window is required.
5.6 TOXICITY AND FORMATION OF BY-PRODUCTS
At the UV doses applied for wastewater disinfection (with some exceptions), pre-existing potentially toxic compounds are not significantly removed. For synergistictechnologies, see Chapter 4.
Formation of aldehydes has been observed both with low-pressure lamps [Awadet al., 1993] and medium-pressure lamps [Soroushian et al., 1994]. In summary, atirradiation doses of 1000 and 2000 J/m2:
• Volatile and semivolatile compounds (EPA 8270) such as chloroform andother chlorinated by-products, 2-hexanone at parts per billion levels areremoved by the general treatment without evidence of impact of UV.
• Carboxylic acids (acetic, formic, oxalic, haloacetic acids) at subparts perbillion levels are unchanged with UV.
• Aldehydes (formaldehyde, acetaldehyde, glyoxal, m-glyoxal) are poten-tially formed at parts per billion levels.
• Alcohols (butanol, pentanol) are nondetectable in the UV-treated effluent.• Propanol and substituted propanols—2-(2-hydroxypropoxy)-1-propanol,
1-(2-ethoxypropoxy)-2-propanol, 1-(2-methoxypropoxy)-1-propanol—atparts per billion levels appear unchanged at the preceding UV irradiationdoses.
Toxicity to fish of UV-treated wastewater tested both in laboratory and at fullscale did not show any additional toxicity vs. that of the effluent before UV treatment[Cairns and Conn, 1979; Oliver and Carey, 1976; Whitby et al., 1984].
5.7 PRELIMINARY CONCLUSIONS ON WASTEWATER DISINFECTION WITH ULTRAVIOLET
1. UV light technologies certainly are a valuable alternative for the disin-fection of conventionally treated wastewater.
2. A wide choice of alternatives exists for lamp technologies and reactordesigns.
L1603_frame_C05 Page 146 Tuesday, March 5, 2002 6:08 PM
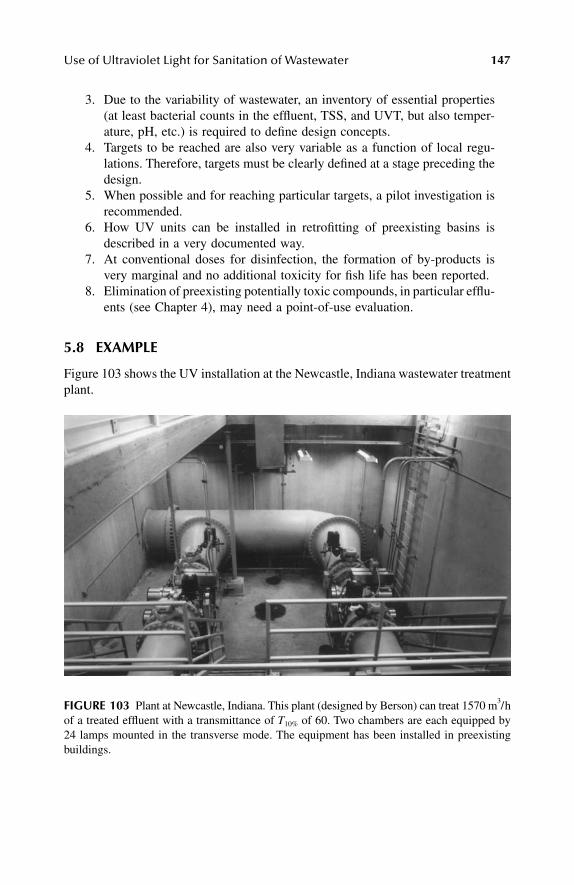
Use of Ultraviolet Light for Sanitation of Wastewater 147
3. Due to the variability of wastewater, an inventory of essential properties(at least bacterial counts in the effluent, TSS, and UVT, but also temper-ature, pH, etc.) is required to define design concepts.
4. Targets to be reached are also very variable as a function of local regu-lations. Therefore, targets must be clearly defined at a stage preceding thedesign.
5. When possible and for reaching particular targets, a pilot investigation isrecommended.
6. How UV units can be installed in retrofitting of preexisting basins isdescribed in a very documented way.
7. At conventional doses for disinfection, the formation of by-products isvery marginal and no additional toxicity for fish life has been reported.
8. Elimination of preexisting potentially toxic compounds, in particular efflu-ents (see Chapter 4), may need a point-of-use evaluation.
5.8 EXAMPLE
Figure 103 shows the UV installation at the Newcastle, Indiana wastewater treatmentplant.
FIGURE 103 Plant at Newcastle, Indiana. This plant (designed by Berson) can treat 1570 m3/hof a treated effluent with a transmittance of T10% of 60. Two chambers are each equipped by24 lamps mounted in the transverse mode. The equipment has been installed in preexistingbuildings.
L1603_frame_C05 Page 147 Tuesday, March 5, 2002 6:08 PM

L1603_frame_C05 Page 148 Tuesday, March 5, 2002 6:08 PM
149
General Conclusions
• Both drinking water and process water of high quality can be disinfectedby available ultraviolet (UV) technologies. The same holds for treatedwastewaters.
• Precise guidelines apply to the design of equipment. Very often the infor-mation made available to the client remains somewhat empirical andmerely commercial.
• By integrating present knowledge and experience, it is possible now tointegrate adequate rules for design and methods for evaluation of perfor-mance. Depending on the case, tentative general rules are indicated in thistext (Sections 2.6, 3.10, 4.5, and 5.7).
• The choice of a given technology and the performance of a given option ofthe UV lamps are determinants, depending on the expected result. Tailoringto measure is possible at present (see Chapter 2).
• The selection of the lamp is a determining issue that depends on anyparticular application. Constant progress is being made in the field (seeChapters 2 and 3).
• Appropriate design of reactors is an element for the success of the method,to be evaluated in each case (see Chapters 3 and 5).
• In all instances, essential data on the general quality of the water remainnecessary, such as total suspended solids, transmittance of UV light, con-centration of dissolved oxygen, turbidity, iron content, and general ionicbalance.
• Fundamental principles of the application are at present thoroughlygrounded and explained in this text.
• Cost parameters may be very case dependent. These are not commented onin this contribution and should be evaluated for each specific application.
6
L1603_frame_C06 Page 149 Tuesday, March 5, 2002 6:11 PM

L1603_frame_C06 Page 150 Tuesday, March 5, 2002 6:11 PM

151
Glossary*
absorption coefficient.
See
Beer–Lambert law.Beer–Lambert law.
Quantifies the absorption of a monochromatic wavelengthby an homogeneous substance relating the incident radiant intensity (
I
o
)to the transmitted intensity (
I
) by
I
=
I
o
×
10
−
ACd
, where
A
is the absorptioncoefficient;
C
, the concentration of the absorbing species, and
d
, the opticalpath length (usually in centimeters). The units for
A
are either in liters permole-centimeter, or, for undefined compounds or for mixtures, in litersper centimeter (of liquid).
Alternatively, the law can be expressed basically on the Naperian log(ln)basis:
I
=
I
o
e
−
ECd
, in which
E
is the extinction coefficient, also in litersper mole-centimeter. Other symbols and units are found in the literature;however, the important point is to distinguish data expressed in publica-tions either in the Log 10 base or in the Ln e base logarithms.
black body.
A thermodynamic equilibrium concept that correlates temperature-heat transfer into the capacity of emission of light at given wavelengths.The maximum of emission is displaced to lower wavelengths when thetemperature is increased.
Bunsen–Roscoe law.
The ratio of reaction proportional to the absorbed dose.(The law generally applies to disinfection of drinking water; in photo-chemical processes, side effects must be considered.)
constants.
See
end of this glossary.
dose.
Corresponds to the radiant power or radiant flux received per second by aunit surface. In this text, the dose is expressed in joules per square meter;in the literature data often are found also in milliwatt second per squarecentimeter.
Einstein law.
The absorption of one single photon promoting a single photo-chemically induced change in the absorbing atom or molecule. The initialchange in the molecule is the result of the absorption of one single photon.
Einstein (unit).
The Einstein can be considered as a mole of photons (i.e., 6.022
×
10
23
photons of the wavelength considered). For example, at 253.7 nm,1
E
is equal to 472 kJ, or 131 Wh (or 1J = 1 W
⋅
sec = 2.12
E
).
energy.
Energy is expressed in joule. The energy of a photon is given by
E
=
h
ν
=
hc
/
λ
; where
h
is the Planck constant (6.626
×
10
−
34
J sec) and
c
,the velocity of light (2.998
×
10
8
m/sec).
energy of a photon.
See
energy.frequency.
May be expressed in hertz (i.e., cycles per second; sec
−
1
), or wavenumber 1
/
λ
(per meter or per centimeter).
* Note that units, terms, and symbols are as in the Système International (SI) system.
L1603_frame_C0Glossary Page 151 Tuesday, March 5, 2002 5:17 PM
152
Ultraviolet Light in Water and Wastewater Sanitation
Grothius–Draper law.
Only radiation (photon) that is absorbed capable of ini-tiating a photochemical process.
intensity.
Flux or fluence (i.e., power), incident on a surface of unit area; wattper square meter. (This is not to be confused with radiant intensity;
seealso
irradiance
.
)
irradiance.
See
intensity.
Remark
: both intensity and irradiance are found indis-tinctly in the literature on water treatment. Irradiance is a nonspecific con-cept concerning wavelength, emission source, and distance from the source.Intensity (less useful for general lighting conditions) remains more specif-ically wavelength-related and involves more discrete (specific) sourcereceptors (i.e., specific parts of DNA instead of general irradiance).
length.
In meters (m) or centimeters (cm). Wavelengths usually are expressedin nanometers (nm) or micrometers (
µ
m). (In the literature, one can stillfind units that are not in conformity with the SI nomenclature such asmicrons (
µ
), which equals micrometers; millimicrons (m
µ
), which equalsnanometers, and Ångströms (Å), which equals l0
−
9
m.)
photometry.
Measurement of light energy perceived by the human eye. Manyphotometric units exist, such as lux, lumen, candella, phots, etc. In UVparlance, these units are not used.
Planck constant.
Proportionality constant between radiant energy and frequencyof light
E
=
h
ν
; with
h
=
6.626
×
10
−
34
J sec.
Planck’s theory.
Electromagnetic radiation consists of discrete quanta (or pho-tons) quantified by the energy of each photon as
h
ν
(
see
Planck constant
).
radiance.
Flux (power) per unit solid angle per unit surface area (remote source)watt per square meter per steradian (W m
−
2
sr
−
1
).
radiant emittance.
Flux per unit area received from a remote source: watt persquare meter (W m
−
2
).
radiant energy.
Radiant power multiplied by the irradiation time: watt timessecond (W
×
sec) or Joule (J).
radiant intensity.
Flux (power) emitted by a source per unit solid angle: wattper steradian (W sr
−
1
).
radiant power or radiant flux.
Emitted power by a light source, watt (W).
radiometry.
Quantification of total radiant energy at all wavelengths emitted bya source.
radiometry (spectral).
See
spectral radiometry.
reciprocity law.
See
Bunsen–Roscoe law.
spectral radiometry.
Quantification of radiant energy emitted at particularwavelengths or wavelength regions.
wavelength.
See
length.
L1603_frame_C0Glossary Page 152 Tuesday, March 5, 2002 5:17 PM
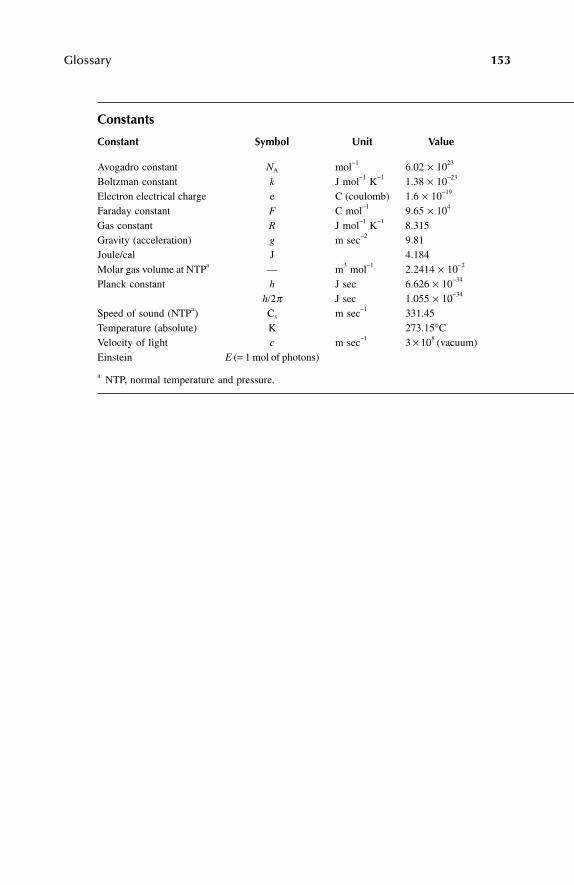
Glossary
153
Constants
Constant Symbol Unit Value
Avogadro constant
N
A
mol
−
1
6.02
×
10
23
Boltzman constant
k
J mol
−
1
K
−
1
1.38
×
10
−
23
Electron electrical charge e C (coulomb) 1.6
×
10
−
19
Faraday constant
F
C mol
−
1
9.65
×
10
4
Gas constant
R
J mol
−
1
K
−
1
8.315Gravity (acceleration)
g
m sec
−
2
9.81Joule/cal J 4.184Molar gas volume at NTP
a
— m
3
mol
−
1
2.2414
×
10
−2
Planck constant h J sec 6.626 × 10⁻³⁴
h/2π J sec 1.055 × 10⁻³⁴
Speed of sound (NTPa) Cs m sec−1 331.45Temperature (absolute) K 273.15°CVelocity of light c m sec−1 3 × 10⁸ (vacuum)Einstein E (= 1 mol of photons)
a NTP, normal temperature and pressure.
L1603_frame_C0Glossary Page 153 Tuesday, March 5, 2002 5:17 PM

L1603_frame_C0Glossary Page 154 Tuesday, March 5, 2002 5:17 PM
155
References
Acero, J.L. and von Gunten, U., in Proc. IOA-EA3G Symposium, Poitiers, France, Interna-tional Ozone Association, Paris, France, 1998.
Aicher, J.O. and Lemmers, E.,
Illum. Eng
.
,
52, 579, 1957.Akkad, F., Pape, E., and Weigand, F.,
IHLE Berichte,
Düsseldorf, Germany, 1986.Aklag, M.S., Schumann, H.P., and von Sonntag, Cl.,
Environ. Sci
.
Technol
.
,
24, 379, 1990.Al Ekabi, H.,
AOTs,
Science and Technology Integration, University of Western OntarioResearch Park, London, Ontario, Canada, 1994.
Allen, A.O.,
J. Phys. Colloidal Chem.,
52, 479, 1948.Anon.,
Eng. News,
66, 686, 1911.Anon., Sterilization of polluted water by ultra-violet rays at Marseille (France),
Eng. News,
64, 633, 1910.Appleton, A.R. et al., communication, Montgomery Watson Engineers, Walnut Creek, CA,
1994.
AQUA—J. Water Supply,
16(2), 1992.ATV, St. Augustin, (now Hennef, Germany), 1993.Awad, J., Gerba, C., and Magnuson, G., in Proc. WEF Speciality Conference, Whippany NJ,
Water Environment Federation, Alexandria, VA, 1993.AWWA,
J. Am. Water Works Assoc.,
60, 1317, 1968.(Austria) Österreichisches Normungsinstitut (Austrian Standard Institute), Vienna, Austria,
ÖNORM M 5873 (1996); ÖNORM M 5873-1, ed., 2001-03-01, 2001.AWWA, Recommendations for raw water quality,
J. Am. Water Works Assoc.,
60, 1317, 1968.Bandemer, Th. and Thiemann, W., in Proc. IOA Symposium, Amsterdam, the Netherlands,
International Ozone Association, Paris, France, 1986, p. C.4.1.Barich, J.T. and Zeff, J.D., in Proc. 83rd Annual Meeting and Exhibition of Air & Water
Management Association, Vol. 2, AWMA, Pittsburgh, PA, 1990, p. 90–245.Baron, J. et al.,
Technol. Sci. Méthodes-AGHTM,
1999.Baxendale, J. and Wilson, J.,
Trans. Faraday Soc.,
53, 344, 1957.Bayliss, S. and Bucat, R.,
Aust. J. Chem.,
28, 1865, 1975.Becker, H.G.O.,
Einführung in die Photochemie,
2nd ed., George Thieme Verlag, Stuttgart,Germany, 1983.
Benitez, F.J., Beltrán-Heredia, J., and Gonzalez, T.,
Ozone: Sci. Eng.,
16, 213, 1994.Bernardin, F.E., in Proc. 84th Annual Meeting and Exhibition of the Air and Water Manage-
ment Association, Vancouver, BC, Canada; as cited in Air and Water ManagementAssociation, Pittsburgh, PA, 1991, pp. 11, 91-24-1.
Bernardt, H. et al., in Proc. IOA Conference, Amsterdam, the Netherlands, 1986, InternationalOzone Association, Paris, France, 1986, p. 85; see also Masschelein, W.J., 1986.
Bernhardt, H. et al.,
Wasser-Abwasser,
133, 632, 1992.Beyerle-Pfnür et al.,
Toxicol. Environ. Chem.,
20–21, 129, 1989.Bischof, H.M.A. thesis, Technical University of Munich, Germany, 1994.Bission, J.W. and Cabelli, V.W.,
J. Water Pollut. Control Fed.,
52, 241, 1980.Blatchley, E.R. and Xie, Y.,
Water Environ. Res.,
67, 475, 1995.Blatchley, E.R. et al., communication, School of Civil Engineering, Environmental and Hydro-
logical Engineering, Purdue University, West Lafayette, IN, 1994.
L1603_frame_Ref Page 155 Tuesday, March 5, 2002 5:19 PM
156
Ultraviolet Light in Water and Wastewater Sanitation
Blomberg, J., Ericksson, U., and Nordwall, I., UV Disinfection and Formation of ChlorinatedBy-Products in Presence of Chloramines, in Proc. Intil. Conf. on Applications of Ozoneand also on UV and Related Ozone Technologies (in Conjunction with IUVA) atWasser Berlin 2000, International Ozone Association, Paris, France, 2000, pp. 329– 344.
Bolton, J.R.,
Eur.
Photochem. Assoc. Newsl.,
43, 40, 1991.Bors, W. et al.,
Photochem. Photobiol.,
28, 629, 1978.Bossuroy A. and Masschelein, W.J., unpublished observations, 1987.Bott, W.,
Zentralbl
.
Bakteriol. Hyg. Abt. Orig. B,
178, 263, 1983.Bourgine, F.P. and Chapman, J.E., in Proc. IOA Conference, Amsterdam, the Netherlands,
1986, International Ozone Association, Paris, France, 1996, p. II.a; see alsoMasschelein, W.J., (1996a,b).
Braun, A., Maurette, M.-Th., and Oliveros, E., Technologie Photochimique, Ed. Presses Poly-techniques Romandes Diffusion par Lavoisier Technique et Documentation, Paris,France, 1986.
Braunstein, J.F. et al.,
WEF,
Digest,
1994, p. 335.Bruce, J.,
Gen. Physiol.,
41, 693, 1958.Buck, R.P.,
Anal. Chem.,
26, 1240, 1954.Bukhari, Z., Hargy, T.M., Bolton, J.R., Dussert, B., and Clancy, J.L., Medium-pressure UV
light for oocyst inactivation,
J. Am. Water Works Assoc,
91(3), 86–94, 1999.Cabaj, A., Sommer, R., and Haider, Th., in Proc. IOA Conference Wasser Berlin—2000,
International Ozone Association, Paris, France, 2000, pp. 297–311.Cairns, V.W. and Conn, K., Canada-Ontario Agreement of Great Lakes Water Quality,
Research report 92, 1979.Calvert, J.G. and Pitts, J.N.,
Photochemistry,
John Wiley & Sons, New York, 1966.Carey, J.H., Lawrence, J., and Tosine, H.M.,
Bull. Environ. Toxicol.,
16, 697, 1976.Carnimeo, D. et al.,
Water Sci. Technol.,
30, 125, 1994.Carter, S.R. et al., U.S. Patent 5, 043, 080, 1991.Castrantas, H.M. and Gibilisco, R.D.,
ACS Symp. Ser.,
422, 77, 1990.Cayless, M.A.,
Br. J. Appl. Phys.,
11, 492, 1960.Chameides, W.L. and Walker, J.G.C.,
J. Geophys. Res.,
32, 89, 1997.Chu-Fei, H. Ho, et al., communication environmental engineering, San Francisco, CA, 1994.Clancy, J.L., Bukhari, Z., Hargy, T.M., Bolton, J.R., Dussert, B., and Marshall, M.M., Using
UV to inactivate
Cryptosporidium,
J. Am. Water Works Assoc.,
92(9), 97–104, 2000.Clancy, J.L. and Hargy, T.M., Ultraviolet light inactivation of
Cryptosporidium, Chem. Technol.,
July–Aug., 5–7, 2001.Clancy, J.L., Hargy, T.M., Marshall, M.M., and Dyksen, J.E., UV light inactivation of
Cryptospo-ridium
oocysts,
J. Am. Water Works Assoc.,
90(9), 92–102, 1998.Clemence, W., UV at Marseille,
Engineering,
91, 106, 142, 1911.Cortelyou, J.R. et al.,
Appl. Microbiol.,
2, 227, 1954.Denis, M., Minon, G., and Masschelein, W.J.,
Ozone: Sci. Eng.,
14, 215, 1992.Deutschland: Vorschriften für Klassification und Bau von Strählern; Seeschiffe, Band II, Kap.
(Aug. 1973).DIN (German Normalization Institute), Standard 5031-10, 1996.Dodin, A. et al.,
Bull. Acad. Nat. Médecine (France),
155, 44, 1971.Dohan, J.M. and Masschelein, W.J.,
Ozone: Sci. Eng.,
9, 315, 1987.Downes, A. and Blunt, T.P.,
Proc. R. Soc.,
26, 488, 1877.Dulin, D., Drossman, H., and Mill, T.,
Environ. Sci. Technol.,
20, 20, 1986.Dussert, B.W., Bircher, K.G., and Stevens, R.D., in Proc. IOA Conference, Amsterdam, the
Netherlands, 1996, International Ozone Association, Paris, France, 1996, p. I.IV.a.DVGW Arbeitsblatt, 1997, W-29–4.
L1603_frame_Ref Page 156 Tuesday, March 5, 2002 5:19 PM
References
157
Dwyer, R.J. and Oldenburg, O.,
J. Chem. Phys.,
12, 351, 1944.Eaton, A.,
J. Am. Water Works Assoc.,
87, 86, 1995.Egberts, G., in Proc. IOA Conference Wasser Berlin—1989, International Ozone Association,
Paris, France, 1989, pp. II-1–10.Eliasson, B. and Kogelschatz, U., in Proc. IOA Conference Wasser Berlin—1989, International
Ozone Association, Paris, France, 1989, p. IV-6–4.Elenbaas, W.,
The High Pressure Mercury Discharge,
North-Holland, Amsterdam, 1951.Ellis, C. and Wells, A.A.,
The Chemical Action of Ultraviolet Rays,
Reinhold, New York,1941.
EPRI, Electric Power Research Institute, Ultraviolet Light for Water and Wastewater, 1995.Fair, G.M.,
J. Am. Water Works Assoc.,
7, 325, 1920.Fassler, D. and Mehl, L.,
Wiss. Z. Univ. Jena; Naturwiss. Reihe,
20, 137, 1971.FIGAWA, Technische Mitteilungen, Cologne, Germany, 1987.Finch, G. and Belosevic, M., communication at U.S. EPA Workshop on NV for Potable Water
Applications, Arlington, VA, April 28–29, 1999.Fletcher, D.B.,
WaterWorld News,
3, May–June, 1987.Francis, P.D., in Proc. IOA Conference, Amsterdam, the Netherlands, 1986, International
Ozone Association, Paris, France, 1986, pp. C.3.1–17.Francis, P.D., Electricity Council Centre, Chester, U.K., 1988, report M 2058.Frischerz, H., et al.,
Water Supply,
4, 167, 1986.Geesey, G.G. and Costerson, J.W.,
Can. J. Microbiol.,
25, 1058, 1984.Gellert, B. and Kogelschatz, U.,
Appl. Phys.
B,
12, 14, 1991.Gelzhäuser, P.,
Disinfection von Trinkwasser durch UV-Bestrahlung,
Expert Verlag Ehningen,Ehningen, Germany, 1985.
Germany: Seeschiffen, Vol. 2, Chap. 4, 1973.Germany: Bayrisches Landesamt für Wasserwirtschaft, 1.-7.3, 1982.Glaze, W.H., An overview of advanced oxidation processes: current status and kinetic models,
in
Chemical Oxidation, Technologies for the Nineties,
Vol. 3, Technomic Press, Lancaster,PA, 1994, pp. 1–11.
Glaze, W.H. and Kang, J.W., in Proc. Symposium on Advanced Oxidation Processes andTreatment of Contaminated Water and Air, Burlington, Ontario, Canada, 1990.
Glaze, W.H., Kang, J.W., and Chapin, D.H.,
Ozone: Sci. Eng.,
9, 335, 1987.Goldstein, E.,
Chem. Ber.,
36, 3042, 1903.Groocock, N.H.,
J. Inst. Water Eng. Scientists,
38, 163, 1984.Guillerme, J., Collection Que Sais-Je, Presses Universitaires de France, 1974.Guittonneau, S. et al.,
Environ. Technol. Lett.,
9, 1115, 1998.Guittonneau, S. et al.,
Ozone: Sci. Eng.,
12, 73, 1990.Guittonneau, S. et al.,
Rev. Fr. Sci. Eau,
1, 35, 1988.Gurol, M.D. and Vastistas, R.,
Water Res.,
21, 895, 1987.Haas, C.N. et al., U.S. EPA Design Manual, U.S. EPA Report No. 625/1-86/021, 1986.Hargy, T.M., Clancy, J.L., Bukhari, Z., and Marshall, M.M., Shedding UV light on the
Cryptosporidium
threat,
J. Environ. Health,
July–Aug. 19–22, 2000.Harm, W.,
Biological Effects of Ultraviolet Radiation,
Cambridge University Press, Cambridge,U.K., 1980.
Harris, G.D.,
Water Res.,
21, 687, 1987.Harris, L. and Kaminsky, J.,
J. Am. Chem. Soc.,
57, 1154, 1935.Hashem, T.M. et al., in Proc. IOA Conference, Amsterdam, the Netherlands, 1986, Interna-
tional Ozone Association, Paris, France, 1996, pp. II.V.A.Hatchard, G.C. and Parker, C.A.,
Proc. R. Soc. A,
235, 518, 1956.Hautniemi, M. et al.,
Ozone: Sci. Eng.,
20, 259, 1997.
L1603_frame_Ref Page 157 Tuesday, March 5, 2002 5:19 PM
158
Ultraviolet Light in Water and Wastewater Sanitation
Havelaar, A.H. and Hogeboom, W.M.,
J. Appl. Bacteriol.,
56, 439, 1984.Havelaar, A.H. et al., Chapter D-3; see also Masschelein, W. J., IOA Conference, Amsterdam,
1986, International Ozone Association, Paris, France, 1986.Heath, M.S., private communication, Montgomery-Watson Engineers, at EPA Meeting on
UV for Potable Water Applications, Arlington, VA, April 1999.Himebaugh, W.S. and Zeff, J.D., in
Proc. Annu. Meet. Air Waste Manage. Assoc.,
11, 91/24.3,1991.
Ho, P.C.,
Environ. Sci. Technol.,
20, 260, 1986.Hoigné, J. and Bader, H.,
Vom Wasser,
48, 283, 9, 1977.Hoigné, J.,
Handbook of Environmental Chemistry,
Vol. Part C, Springer-Verlag, Heidelberg,Germany, 1998, p. 83.
Hölzli, J.P., private communication, Hölzli Gesellschaft, Seewalchen, Austria, 1992.Huff, C.B. et al.,
Public Health Rep.,
337, 1965.Hunter, G.L. et al.,
Water Environ. Technol.,
41, 1998.IUVA, International Ultraviolet Association, Proc. First Intl. Congress on UV Technologies,
Washington, D.C., June 14–16, 2001.Jackson, G.F.,
Eur. Water Pollut. Control,
18, 1994.Jacob, S.M. and Dranoff, J.S.,
J. Am. Inst. Chem. Eng.,
16, 359, 1970.Jagger, J.,
Introduction to Research in Ultraviolet Photobiology,
Prentice Hall, New York,1967.
Jepson, J.D.,
Proc. Water Treat. Eng.,
175, 1973.
J. Water Supply—AQUA,
16(2), 1992.Kalisvaart, B.F., Microbiological Effects of Berson Multiwave UV Lamps, Berson UV Tech-
niek, Neunen, the Netherlands, 1999.Kalisvaart, B.F., Berson Document: Photoelectrical Effects of Berson Multiwave Lamps
to prevent Microbial Recovery, Berson UV Techniek, Neunen, the Netherlands,2000.
Kalisvaart, B.F., Berson Company, private communication, 2001.Kawabata, T. and Harada, T.,
J. Illum. Soc.,
36, 89, 1959.Kelner, A.,
J. Gen. Physiol.,
34, 835, 1951.Kiefer, J.,
Ultraviolette Strahlen,
Ed., Walter de Gruyter, Berlin, Germany, 1977.Köppke, K.E. and von Hagel, G.,
Wasser-Abwasser,
132, 1990; 313, 1991.Kornfeld, G.,
Z. Phys. Chem. B,
29, 205, 1935. Kraljic, I. and Moshnsi, S. El.,
Photochem. Photobiol.,
28, 577, 1978.Kruithof, J.C. et al., in Proc. IOA Conference, Amsterdam, the Netherlands, 1996, Interna-
tional Ozone Association, Paris, France, 1996, pp. IV.V.a., see also Masschelein, W.J.,1996.
Kruithof, J.C. and Kamp, P.C., in Proc. IOA Conference Wasser Berlin—2000, InternationalOzone Association, Paris, France, 2000, pp. 437–464, 631–660.
Ku, Y. and Hu, S.C.,
Environ. Prog.,
9, 218, 1990.Kwan, A. et al., communication, CH2M HILL Engineering, Calgary, Alberta, Canada, 1994.Laforge, P., Fransolet, G., and Masschelein, W.J.,
Rev. Fr. Sci. Eau,
1, 255, 1982.Lafrenz, R.A., Workshop U.S. EPA, Arlington, VA, Apr. 28–29, 1999.Lafrey, (copy at), EPA meeting on UV for Potable Water Applications, Arlington, VA, April
1999.Legan, R.W.,
Chem. Eng.,
25, 95, 1982.Legrini, O., Oliveros, E., and Braun, A.M.,
Chem. Rev.,
93, 671, 1993.Leighton, W.G. and Forbes, G.S.,
J. Am. Chem. Soc.,
52, 3139, 1930.Leitzke, O. and Friedrich, M., in Proc. IOA Conference Moscow, Russia, 1998, International
Ozone Association, Paris, France, 1996, p. 567.
L1603_frame_Ref Page 158 Tuesday, March 5, 2002 5:19 PM
References
159
Leitzke, O., in Proceedings of IOA Conference at Wasser Berlin—1993, (Paris, France:International Ozone Association, 1993, p. IV.6.1; see also Brtko-Juray, and O. Leitzke,in Proc. IOA Conference at Wasser Berlin—1993, International Ozone Association,Paris, France, 1993, p. III.1.1.
Lenard, P.,
Ann. Phys.
(Leipzig),
1, 486, 1900.Leuker, G. and Dittmar, A.,
BBR
. Germany, 54, 1992.Leuker, G. and Hingst, V.,
Zentralbl. Hyg.,
193, 237, 1992.Linden, K.G., Workshop U.S. EPA, Arlington, VA, April 28–29, 1999.Linden, K.G. and Darby, J.L.,
J. Environ. Eng.,
123, 1142, 1997.Lindenauer, K.G. and Darby, J.L.,
Water Res.,
28, 805, 1994.Lipczynska-Kochany, E. and Bolton, J.R.,
Environ. Sci. Technol.,
26, 259, 1992.Lipczynska-Kochany, E., Degradation of aromatic pollutants by means of the advanced
oxidation processes in a homogeneous phase: photolysis in the presence of hydrogenperoxide versus the fenton reaction, in
Chemical Oxidation, Technologies for theNineties,
Vol. 3, Technomic Press, Lancaster, PA, 1994, pp. 12–27.Lissi, E. and Heicklen, J.,
J. Photochem,
1, 39, 1973.Lodge, F.J., reported in
WEF Digest,
p. 437, 1994.Lowke, J.J. and Zollweg, R.H.,
J. Illum. Eng. Soc.,
4, 253;
J. Appl. Phys.,
46, 650, 1975.Maier, A. et al.,
Water Sci. Technol.,
31, 141, 1995.Malley, J., personal communication, University of New Hampshire, Durham, NH, 1999.Mark, G. et al.,
Aqua,
39, 309, 1990;
J. Photochem. Photobiol. A—Chem.,
55, 1990.Martin, J.S., reported in
WEF Digest,
p. 461, 1994.Martiny, H. et al.,
Zentralbl. Bakteriol.,
185, 350, 1988.Masschelein, W.,
TSM Eau,
61, 95, 1966.Masschelein, W.J.,
TSM Eau,
77, 177, 1977.Masschelein, W.J., Coordinated Proceedings of IOA Conferences, Amsterdam, International
Ozone Association, Paris, France, 1986 and 1996.Masschelein, W.J.,
Unit Processes in Drinking Water Treatment,
Marcel Dekker, New York,1992.
Masschelein, W.J., in
Proc. CEFIC Symposium, Rome, Italy, 1996a,
p. 153.Masschelein, W.J.,
Processus Unitaires dans le Traitement de l’Eau Potable,
CEBEDOC,Liège, Belgium, 1996b.
Masschelein, W.J., in Proc. 14th Ozone World Congress, Dearborn, MI, International OzoneAssociation, Pan American Group, Norwalk, CT, 1999.
Masschelein, W.J.,
Wasser,
in Proc. IOA Conference, Berlin, 2000, International OzoneAssociation, Paris, France.
Masschelein, W.J., Debacker, E., and Chebak, S.,
Rev. Fr. Sci. Eau,
2, 29, 1989.Masschelein, W.J., Fransolet, G., and Debacker, E.,
Eau Québec,
13, 289; 14, 41, 1981.Masten, S.J. and Butler, J.N.,
Ozone: Sci. Eng.,
8(4), 339–353, 1986.Mathews, R.W.,
J. Chem. Soc. Faraday Trans., 85, 1291, 1989.Mazoit, L.P. et al., Trib. Cebedeau, 344, 21, 1975.McGregor, F.R., in Proc. IOA Conference, Amsterdam, the Netherlands, 1986, International
Ozone Association, Paris, France, 1986, p. B.5.1.Mechsner, K.I. and Fleischmann, Th., GWA, 72, 807, 1992.Meulemans, C.C.E., in Proc. IOA Conference, Amsterdam, the Netherlands, 1986, Interna-
tional Ozone Association, Paris, France, 1986, chap. B-1; see also Masschelein, W.J.,1986.
Milano, J.C., Bernat-Escallien, C., and Vernet, J.L., Water Res., 24, 557, 1990.Murov, S.L., Transmission of light filters, in Handbook of Photochemistry, Marcel Dekker,
New York, 1973, pp. 97–103.
L1603_frame_Ref Page 159 Tuesday, March 5, 2002 5:19 PM
160 Ultraviolet Light in Water and Wastewater Sanitation
Narkis, N. et al. in Water Chlorination, Vol. 6, Jolley, R.L., Ed., Lewis Publishers, Chelsea,MI, 1987, chap. 73.
Nicole, I. et al., Environ. Technol., 12, 21, 1991.NWRI, Ultraviolet Disinfection Guidelines for Drinking Water and Water Reuse, National
Water Research Institute, Fountain Valley, CA, Dec. 2000.Okatomo, K. et al., Bull. Chem. Soc. Jpn., 58, 2015; 2023, 1985.Oliver, B.G. and Carey, J.H., J. Water Pollut. Control Fed., 48, 2619, 1976.Österreichisches Normungsinstitut (Austrian Standards Institute, Vienna, Austria), ÖNORM
M 5873, 1996; ÖNORM M 5873-1, ed. 2001-03-01, 2001.Paillard, H., thèse, Université de Poitiers, Poitiers, France, 1996.Parker, J.A. and Darby, J.L., reported in WEF Digest, p. 469, 1994.Pellizetti, E. et al., Chim. Ind., 67, 623, 1985.Perkins, R.G. and Welch, H., J. Am. Water Works Assoc., 22, 959, 1930.Peterson, D., Watson, D., and Winterlin, W., Bull. Environ. Contam. Toxicol., 44, 744, 1990.Pettinger, K.H., Entwicklung und Untersuchung eines Verfahrens zum Atrazineabbau in Trink-
wasser mittels UV-aktiviertem Wasserstoffperoxid, thesis, Technical University ofMunich, Germany, 1992.
Peyton, G.R., Oxidative treatment methods for removal of organic compounds from drinkingwater supplies, in Significance and Treatment of Volatile Organic Compounds inWater Supplies, Lewis Publishers, Chelsea, MI, 1990, pp. 313–362.
Peyton, G.R. and Gee, C.S., in Advances in Chemistry Series 219, American Chemical Society,Washington, D.C., 1989, p. 639.
Peyton, G.R. and Glaze, W.H., Environ. Sci. Technol., 22, 761, 1988.Peyton, G.R. and Glaze, W.H., Photochemistry of environmental systems, in Advances in
Chemistry Series 327, American Chemical Society, Washington, D.C., 1986, p. 76.Phillips, R., Sources and Applications of Ultraviolet Radiation, Academic Press, 1983.Prado, J. et al., Ozone: Sci. Eng., 16, 235, 1994.Prat, C., Vincente, M., and Esplugas, S., Ind. Eng. Chem. Res. Ser., 29, 349, 1990.Qualls, R.G. and Johnson, J.D., Appl. Environ. Microbiol., 45, 872, 1983.Rabinowitch, E., Photosynthesis, Interscience, New York, 1945.Rahn, R.O., Photochem. Photobiol., 66, 450, 1997.Ridgway, H.F. and Olson, B.H., Appl. Environ. Microbiol., 41, 274, 1981; 44, 972, 1982.Roper, M.M. and Marshall, K.C., Microbial Ecol., 4, 279, 1978.Rudolph, K.U., Böttcher, J., and Nelle, Th., GWF; Wasser-Abwasser, 135, 529, 1994.Sadoski, T.T. and Roche, W.J., J. Illum. Eng. Soc., 5, 143, 1976.Sagawura, T., Funayama, H., and Nakano, K., presentation at Am. Inst. Chem. Engrs. Sym-
posium on Photochemical Reaction Engineering, Institute of Chemical Engineers,New York, NY, 1984.
Schäfer, J., British Patent 1,552,334, 1979.Scheible, O.K., Casey, M.C., and Fondran, A., NITS Publication 86-145182, National Tech-
nical Information Service, Springfield, VA, 1985.Schöller, F. and Ollram, F., Water Supply, Special Session 19, 1989, p. 13.Schumb, W. and Satterfield, C., Hydrogen Peroxide, Reinhold, New York, 1955.Severin, B.F. et al., J. Water Pollut. Control Fed., 56, 164; 881, 1984.Sharpatyi, V. and Kraljic, I., Photochem. Photobiol., 28, 587, 1978.Shi, H., Wang, Z., and Zhang, C., in Proc. IOA Symposium, Amsterdam, International Ozone
Association, Paris, France, 1986, p. C.1.1–10.Shuali, U. et al., J. Phys. Chem., 73, 3445, 1969.Sierka, R.A. and Amy, G.L., Ozone: Sci. Eng., 7, 47, 1985.Simmons, M.S. and Zepp, G.R., Water Res., 20, 899, 1986.
L1603_frame_Ref Page 160 Tuesday, March 5, 2002 5:19 PM
References 161
Smith, A.T., Eng. News Rec., 79, 1021, 1917.Smithells, C.J., Metals Reference Book, 5th ed., Butterworths, London, 1976.Sommer, R. et al., Water Sci. Technol., 35(11/12), 113, 1997.Soroushian, F. et al., communications, CH2M HILL, Santa Ana, CA, 1994.South African General and Special Standards, Act 96 of 18 May 1984, 9225—Regulation 991.Spencer, R.R., J. Am. Water Works Assoc., 4, 172, 1917.Staehelin, J., and Hoigné, J., Environ. Sci. Technol., 19, 1206, 1985.Stryer, L., Biochemistry, W.H. Freeman, San Francisco, CA, 1975. Sundstrom, D.W. and Klei, H.E., NTIS Publ. Nr. PB 87-149357, National Technical Infor-
mation Service, Springfield, VA, 1986.Sundstrom, D.W. et al., Hazard Waste—Hazard Mater., 3, 101, 1986.Sundstrom, D.W., Weir, B.A., and Reding, K.A., in ACS Symp. Ser., 422, 67, 1989.Symons, J.M., Prengle, H.W., and Belhateche, D., in Proc. Am. Water Works Assoc. Conf.,
422, part 1, p. 67; part 2, p. 895, 1989.Takahashi, N., Ozonation of several organic compounds having low molecular weight under
ultraviolet irradiation, Ozone: Sci. Eng., 12(1), 1–17, 1990.Taube, H. and Bray, W.H., J. Am. Chem. Soc., 62, 3357, 1940.Te Kippe, T. et al., reported in WEF Digest, p. 511, 1994.Thampi, M.V. and Sorber, C.A., Water Res., 21, 765, 1987.Torota, Microbiology; An Introduction, 5th ed., Benjamin Cummings, Menlo Park, CA,
1995.Toy, M.S., Carter, M.K., and Pasell, T.O., Environ. Sci. Technol., 11, 837, 1990.Trapido, M. et al., Ozone: Sci. Eng., 19, 75, 1997.Tree, J.A., Adams, R.R., and Lees, D.N., Water Sci. Technol., 35, 227, 1997.United Kingdom, Regulation 29(6) of the Merchant Shipping Regulations of the Marine
Surveyors of the Department of Trade, 1973.United States, Handbook on Sanitation of Vessel Construction, U.S. Government Printing
Office, Department of Health, Education and Welfare, Washington, D.C., pp. 17–18.Uri, N., Inorganic free radical reactions in solution, Chem. Rev., 50, 375, 1952.U.S. Department of Commerce, Investigation into the Chemistry of the UV-Ozone Purification
Process, National Technology Information Service, 1979, Springfield, VA, reportPB-296 485.
U.S. EPA, Design Manual for Municipal Wastewater Disinfection, report EPA/625/1-86/021U.S. Environmental Protection Agency, Washington, D.C., 1986.
U.S. EPA, Workshop on UV Disinfection of Drinking Water, Arlington, VA, 1999.U.S. EPA, National primary drinking water regulations: ground water rule; proposed rules,
Fed. Reg., 65(91), 30193, 2000.von Recklinghausen, M., J. Am. Water Works Assoc., 1, 565, 1914.Walden, F.H. and Powell, S.T., in Proc. Am. Water Works Assoc. Conference, 1911, p. 341.Waymouth, J.F., Electric Discharge Lamps, MIT Press, Cambridge, MA, 1971.Wayne, R.P., Faraday Discuss. Chem. Soc., 53, 172, 1972.WEF Digest, Water Environmental Federation, Alexandria, VA; Available also at European
Office, The Hague, the Netherlands, 1994.Weir, B.A. and Sundstrom, D.W., in Proc. Am. Inst. Chem. Engrs. Natl. Meeting, San Francisco,
CA, 1989.Weir, B.A., Sundstrom, D.W., and Klei, H.E., Hazard Waste—Hazard Mater., 4, 165, 1987.Weiss, J., Symposium on Mechanisms of Electron Transfer Reactions, Société de Chimie Phy-
sique, Paris, France, 1951.Whitby, G.E. et al., J. Water Pollut. Control Fed., 57, 844, 1984.Winter, Br., dissertation, Technical University of Munich, Germany, 1993.
L1603_frame_Ref Page 161 Tuesday, March 5, 2002 5:19 PM
162 Ultraviolet Light in Water and Wastewater Sanitation
Wright, H., Cairns, W.L., and Sakamoto, G., communication, Trojan Technologies, London,Ontario, Canada, 1999.
Xu, S., Zhou, H., Wei, X., and Lu, J., Ozone: Sci. Eng., 11, 281, 1989.Yost, K.W., in Proc. Intl. Waste Conf. Water Pollut. Control Fed., 1989, p. 441.Yue, P.L. and Legrini, O., Am. Inst. Chem. Engrs. Natl. Meeting, San Francisco, CA, 1989.Zeff, J.D. and Leitis, E., U.S. Patent 4,792,407, 1988; U.S. Patent 4,849,114, 1989.Zukova et al., J. Water Pollut. Control Fed., 58, 199, 1986.
L1603_frame_Ref Page 162 Tuesday, March 5, 2002 5:19 PM

163
Index
A
Absorption, 7Absorption coefficient, 151Actinic waves, 6Actinometry, 14, 47, 51–54
hydrogen peroxide, 54iodide-iodate, 52mineral salts, 51–52uridine, 54
Actinomyces
, 100–101Activation, 9–10, 12, 114, 115Activation energy, 117Adenovirus, 73Advanced oxidation processes (AOPs), 113
Aerobacter
, 60, 141
Aerobacter aeromonas
, 73, 75Aging, of UV lamp components
emission yield effects, 19glass vs. quartz, 19low-pressure Hg lamps, 19, 38measuring power loss, 47medium-pressure Hg lamp, 27, 39on-off effects, 34–35quartz materials, 40, 109, 129solarization, 19, 40start-stop and, 19xenon flash-output lamps, 36
Agriculture use standards, 136, 137Air-conditioning, 29Alcohols, 128, 146Algae, 72, 74, 75Alkaline earth oxides, 16, 27Aluminum precipitation, 42Amalgams, 17, 32American National Standards Institute (ANSI), 4American Water Works Association (AWWA), 2Amino acids, 64, 66, 77ANSI criteria, 4Antimony iodide, 34Antimony lamps, 67Argon, 10, 12, 21, 32Aromatic hydrocarbons, 125Aspect ratio, 144–145
Aspergillus niger
, 74Assimilable organic carbon (AOX), 78
Austrian standards, 3Automation, 27, 39, 95
Berson-Modem, 98medium-pressure Hg lamps, 27, 39monitoring, 101–104
Avalanche effect, 9Avogadro constant, 153AWWA Research Foundation (AWWARF), 2
B
Bacillus anthracis
, 73
Bacillus paratyphosus
, 73
Bacillus pyocyaneus
, 73
Bacillus subtilis
, 4, 60, 73, 81, 83, 89, 100, 141Bacterial DNA,
See
DNABacterial photorepair,
See
PhotorepairBacterial proteins, UV absorbance, 65–66Bactericidal action,
See also
Disinfection efficiency
solar radiant energy, 2, 59UV irradiation, 60–68
Bacteriophages, 66, 73, 75, 76, 90
Bacterium coli
, 73
Bacterium megatherium
, 73
Bacterium prodigiosus
, 73Baking yeast, 73Ballast, 25Barium, 27Barium oxide, 16, 17Bathing water, 29Beer brewing yeasts, 73Beer–Lambert law, 70, 85, 86, 90, 137, 151Belgian standards, 3Benzene, 115Berea, Ohio, 2Berlin, Germany, 59Berson-Modem, 98Bicarbonate ions, 117Bioassay, 89, 100Biphenyls, 130Black body, 7, 9, 151Bleaching, 118Blue-green algae, 74Blue light, 60
L1603_frame_Index Page 163 Friday, March 8, 2002 10:55 AM
164
Ultraviolet Light in Water and Wastewater Sanitation
Boats and ships, 3, 59BOD-5, 77Body health applications, 59Boltzmann constant, 27, 153“Boston sunlight on a cloudy day,” 2Bremstrahlung, 27Breweries, 59, 80Broadband mercury lamps, 13, 24
efficiency for UV-ozone synergistic applications, 126
pulsed systems, 36Bromate, 79, 118, 126Brominated hydrocarbons, 125Bunsen–Roscoe law, 60, 68–69, 90, 151Butanol,
tert-
, 53
C
Calcium oxide, 16Calcium precipitation, 42California regulations, 136Campgrounds, 59Capsids, 65, 66Carbonate ions, 117–118Carbon tetrachloride, 125Carboxylic acids, 128, 146Carrier gas, 10–12, 14,
See also
Penning mixture;
specific components
deuterium, 33–34doping, 29, 31–32,
See also
specific substances
metal halides, 35xenon, 32–33
Cathode normal thermoionic emission, 26–27Cathode temperature, 24, 26Cerium salts, 116Channel-type reactors, light exposure
quantification, 85Chemical tracing, 99Chemical water treatment, 59Chemical waves, 6Chloramines, 77–78Chloride* (Cl
*
2
) excimer technology, 36–38Chlorinated aromatics, 128Chlorinated benzenes, 129Chlorinated biphenyls, 130Chlorinated by-products, 146Chlorinated hydrocarbons, 115, 125, 128Chlorinated phenols, 118, 119, 125Chlorine-based disinfection, 2, 65Chlorine dioxide, 65Chloroform, 146Chloroplatinic acid, 88Chromophores, 67
Citric acid, 146
Citrobacter freundii
, 73, 82, 84Cleaning, UV lamps, 39, 145–146
Clostridium perfringens
, 73, 76, 100, 106, 141Cobalt iodide, 34Cold-cathode, 16, 82Coliform bacteria
counts, 106drinking water source standards, 137D
10
values, 73photorepair capability, 62swimming water criteria, 136UV disinfection performance, 110
Collimator, 69–70, 71, 103Color, 77Computer-controlled systems, 27Computer modeling of hydraulics, 100Condensation chambers, 32Constants, 153Contact sensors, 72Contra Costa Sanitary District, 136Copper, 131Corrosion, 109
Corynebacterium diphtheriae
, 73Cosinusoidal photocells, 46, 49Costs, 107, 129, 149
Cryptosporidium oocysts
, 72, 73, 75, 83
Cryptosporidium parvum
, 2Cup size correction factor, 71Cyanazine herbicide, 129
Cyanobacter
, 74Cylindrical lamps, 15
zonal distribution of emission, 54, 58Cylindrical photocells, 46Cylindrical reactors, light exposure quantification,
85, 86Cysteine, 64Cytochrome c, 66
D
Dark spaces, 16Deauville, France, 136Detergents, 129, 140, 146Deuterium discharge lamps, 33–34Deutsches Verein von Gas and
Wasserfachmännern (DVGW), 3Diatoms, 742,4-Dichlorophenoxyacetic acid (2,4-D), 128Dielectric filters, 46Dieppe, France, 136Diethylmalonate, 125Diffraction, 88Diffusion, 7
L1603_frame_Index Page 164 Friday, March 8, 2002 10:55 AM
Index
165
Dimethylhydrazine, 125Dioxane, 125
Diplococcus pneumoniae
, 60, 141Discharge current, electron density in, 14Discovery Bay WWTP, California, 144Disinfection, of drinking water,
See
Drinking water disinfection
Disinfection efficiency, 67–68dispersion coefficient and, 100dose-efficiency,
See
Dose-efficiencyoperational control of, 104
extended control, 104direct control, 100–101permanent monitoring, 101–104
Disinfection kinetics, 68Dispersion coefficient, 100Dissolved organic compounds, 64, 78–79Dissolved oxygen, 53, 119, 132DNA, 60–62, 66,
See also
Photorepairprotein cross-links, 65single- and double-stranded, 66
Doped mercury lamps, 29, 31–32, 38Dose, defined, 151,
See also
Ultraviolet irradiation dose
Dose-efficiency, 68–75,
See also
Disinfection efficiency; Ultraviolet irradiation dose
basic equations, 68–69D
10
dose, 68reported values, 72–75
efficiency coefficient values, 69lethal dose determination, 69–72
collimator method, 69–70geometric correction, 71shallow-bed reactor, 71–72
low-pressure Hg lamps, 21single-lamp reactor, 87–90test organisms, 76water temperature and pH effects, 76
Double-stranded DNA, 66Drinking water
absorption spectrum, 70, 78competitive UV absorption of components,
76–78loss of irradiation intensity, 70–71
Drinking water disinfection, 7, 59–112algicidal treatment, 72artificial optical interference, 79–81chemical sanitation vs., 59design factors for reactor geometry, 85–97
definition of required performance, 106design questionnaire, 105–107multiple-lamp reactors, 90–97qualification and tendering, 106–107single-lamp reactors, 86–87point-source summation model, 89
disinfection efficiency,
See
Disinfection efficiency
dissolved compounds, 78–79dose-efficiency, 68–75,
See also
Dose-efficiency
European facilities, 2evaluation parameters, 105examples
Imperia, Italy, 110Méry-sur-Oise, France, 112Roosteren, the Netherlands, 110Source Du Pavillon, 108–110Zwindrecht, the Netherlands, 110
germicidal action, 60–68action curves, 60disinfection mechanism, 60–64germicidal efficiency evaluation, 67–68protein and amino acid effects, 60, 64–67
historical context, 1–3history, 59hydraulic conditions, 99lamps,
See
Ultraviolet (UV) lampslethal-lag phase, 76, 81
consecutive reactions, 83–84experimental reactor, 81–82multihit and multisite theories, 81–83
mixing effects, 90, 98–100operational control of efficiency, 100–104prevalence of UV systems, 59, standards and regulations, 3–4steering parameters, 77synergistic UV/H
2
O
2
action,
See
Hydrogen peroxide, combined UV synergistic action
synergistic oxidation,
See
Photochemical synergistic oxidation
UV lamp germicidal efficiency, 67–68water component competitive absorption,
76–77D
10
dose, 68reported values, 72–75
Dyestuffs, 129Dysentery bacilli, 63
E
Eberthella typhosa
, 73EDTA, 140Effective dose,
See
Dose-efficiencysingle-lamp reactor, 87–90
Efficiency coefficient values, 69Einstein, 151, 153Einstein law, 151Electrical current feed system, 16–17
L1603_frame_Index Page 165 Friday, March 8, 2002 10:55 AM
166
Ultraviolet Light in Water and Wastewater Sanitation
Electroconductivity measurement, 99Electrode connections, 25–26Electrode emission coefficient, 27Electromagnetic radiation, 4–5Electron charge, 153Electron density, 14Electron hole, 131Electron-ion pair, 14, 16Electron temperature, vs. gas temperature, 22–23Electron transfer reactions, hydroxyl radicals and
organic compounds, 119Electrophilic addition, 119Emission distribution, 57, 58Emission intensity, photocells, 46Emission spectrum, low-pressure Hg lamp, 19–20Emission yield,
See also
specific parameters
aging effects, 19temperature effects, 17
Energy, 151Energy consumption, 125Enterobacteria, 65, 72
drinking water source standards, 137UV absorption, 65UV-assisted oxidation and, 132
Enterobacter cloacae
, 73
Enterococcus faecalis
, 76Enteroviruses, 72Enzymatic repair, 60, 64EPA,
See
U.S. Environmental Protection Agency
Erwinia
, 60, 141Erythema, 6
Escherichia coli (E. coli)
, 60, 73, 94DNA, 66monitoring/controlling disinfection efficiency,
100UV disinfection performance, 110
European Economic Community (EEC) Council Directive 91/271, 4, 135
Evaporation losses, 115Excimer lamps, 14, 36–38, 115, 116, 130
ozone generation, 130vacuum UV range, 37–38wastewater disinfection, 145
Excited electronic states, 114Exonuclease system, 64Exothermic reactions, 117Exposure dose, 125,
See also
Dose-efficiency; Ultraviolet irradiation dose
wastewater disinfection, 142–145
F
Faraday constant, 153Faraday dark spaces, 16
Fecal bacteria, in wastewater, 140Fecal coliforms
drinking water source standards, 137swimming water criteria, 136
Fecal streptococci, 136, 137FIGAWA, 3Filling gas,
See
Carrier gas; Penning mixtureFilters, optical, 45–46, 129Filtration, 4Fish toxicity, 146Flash-output lamps, 14, 36,
See also
Xenon-pulsed lamp technology
Flat lamp technologies, 15, 28–31, 95multiple-lamp reactor design, 95zonal distribution of emission, 58
Florida regulations, 136Flow-capacity, multi-lamp medium-pressure
reactors, 90, 92, 94Flow-through patterns, testing, 99–100Fluorescence, 17, 115Fluorine optics, 5Fluorocarbons, 39Food processing industries, 59Football fields, 137Free radicals,
See
Hydroxyl radicalsFrench wastewater regulations, 136Freon TF, 125Frequency, 151Fresnel’s law, 44Fruits, 137Fulvic acid, 81Fungal spores, 74
Fusarium
, 73
G
Gallium iodide, 34Gamma (
γ
) radiation, 6Gas constant, 153Gelsenwasser facility, Germany, 94–95Geometric factor correction (
m
), 82, 90, 93, 105German Association of Manufacturers of
Equipment for Water Treatment (FIGAWA), 3
German Standardization Institute (DIN), 3Germicidal action, 60–68,
See also
Disinfection efficiency
Germicidal action curves, 60Germicidal efficiency, 67–68,
See
Disinfection efficiency
Giardia Lamblia
, 2, 73Glow discharge mercury lamps, 20, 21Glycols, 129Glycyl-tryptophan dimer, 65
L1603_frame_Index Page 166 Friday, March 8, 2002 10:55 AM
Index
167
Gold Bar Wastewater Treatment, 136Golf courses, 137Gouda, the Netherlands, 95Gravity constant, 153Green algae, 74Grothian diagram, 10, 15Grothius–Draper law, 60, 152Groundwater Disinfection Rule (GWDR), 2Guarantee, 107Gwinnett County, Georgia, 137
H
Haemophilus influenzae
, 60, 141Halide doping, 34Halogen ions, hydroxyl radicals and, 117,
See also
specific halogens
Hamatsu, 103Hartley absorbance, 129Hartley band, 126Heat capacity, 17Helium, 12Henderson, Kentucky, 2Hepatitis virus A, 4, 73Herbicides, 125, 1292-Hexanone, 146High-pressure mercury lamps, 14,
See also
Medium-pressure mercury lamps
Histogram method, 67, 70, 80Horton, Kansas, 2Hospitals, 59Hot cathode, 16–17, 82Household scale UV disinfection, 59Humic acids, 79, 128Humic substances, 115Hydraulic conditions, 99Hydrogen abstraction reaction, 119Hydrogen peroxide, combined UV synergistic
action, 3, 38, 120–126,
See also
Photochemical synergistic oxidation
advantages/disadvantages for water treatment, 120
catalytic processes, 131hydroxyl radical formation, 131hydroxyl radical recombination, 119,
See also
Hydroxyl radicals
intermediate formation, O
3
-UV reaction, 128
pH effects, 122reported data, 125
Hydrogen peroxide, UV absorption, 78, 122actinometric check-control method, 54
Hydroxyl radicals, 116–119,
See also
Photochemical synergistic oxidation
analytical evidence in water treatment, 118generation from H
2
O
2
, 120hydrogen peroxide and formation, 131lifetime, 118organic compound reactions, 119UV-C absorbance, 118
Hypsochromic shift, 129
I
Imperia, Italy, 110Indirect irradiation technologies, 40Indium-doped lamps, 19, 29, 31–32, 38, 123Industrial affluents, 128Infectious pancreatic necrosis, 73Infrared (IR) emissions, 23Intensity, defined, 152Interference filters, 46Interference principle, 5International Ozone Association, 3Iodide-doped lamps, 34Iodide-iodate actinometer, 52Ionization, 9–10, 12, 114, 115
low-pressure mercury plasma, 14Ionization energy, 9, 10, 11, 12Iron, 77, 78
electrodes, 16precipitation, 42salts, 116
Iron iodide, 34Irradiance, 152,
See also
Ultraviolet irradiation dose
measures, 44–45yield, medium-pressure Hg lamp, 24
Irradiation intensity, 152,
See also
Ultraviolet irradiation dose
drinking water losses, 70–71Irradiation time correction, 82Irrigation, 136, 137Iso-intensity reactors, 93–95Israeli standards, 137
J
Joule/cal, 153
K
KIWA, 94
Klebsiella pneumoniae
, 73Krypton, 12
excimer technology, 37
L1603_frame_Index Page 167 Friday, March 8, 2002 10:55 AM
168
Ultraviolet Light in Water and Wastewater Sanitation
L
Lamblia-Jarroll
, 73
Lamblia muris
, 73Lamps,
See
Ultraviolet (UV) lampsLandfill leachate, 128Lasers, 37Lawns, 137Leachates, 128, 131Lead iodide, 34
Legionella pneumophilia
, 73Length, 152Lethal-lag phase, 76, 81
consecutive reactions, 83–84multihit and multisite theories, 81–83point-source summation model, 89
Lethal dose determination, 69–72,
See also
under
Dose-efficiency
Light, velocity of, 153Light production, 9Lixiviation, 129Longitudinal mounting, 100, 144Low-pressure mercury lamps, 13, 38
aging, 19, 22, 38bacterial photorepair studies, 142cleaning, 146doping, 38electrical feed system, 16–17example, 110flat lamps, 29general principles, 14–16high vs. low flows, 38lifetime, 22liquid mercury, 13comparative germicidal efficiency, 67Source du Pavillon, Spontin, Belgium, 108–110photochemical yield, 20–22proteins and, 65temperature effects, 17total UV output, 20–22typical emission spectrum, 19–20UV-C output, 21UV efficiency, 21voltage effects, 17wastewater disinfection considerations, 145
M
m
(geometric factor), 82, 90, 93, 105Magnesium iodide, 34Magnesium oxide-CaCO
3
, 40Magnesium precipitation, 42Maintenance checklist, 104Malachite green leucocyanide, 1
Marseille, France, 2, 59Massachusetts standards, 136Medium-pressure mercury lamps, 14, 22–28, 39
aging, 27, 38automation, 27, 39comparative germicidal efficiency, 67bacterial photorepair and, 142broadband and multi-wave technologies, 24D
10
values and, 75effective Hg pressure in discharge zone, 23electrode connections, 25–26emission spectrum, 25examples, 110, 112mercury dosing, 23multi-lamp reactor flow capacity, 90, 92, 94operating temperature, 22–23organic compound photolysis, 115proteins and, 65UV-C applications, 39UV-C optimization, 24, 27UV intensity, 67UV light emission, 23–24voltage input and UV output, 24–27wastewater disinfection considerations, 145
Membrane filtration, 138Mercury
activation of atoms, 9energy (Grothian) diagram, 10, 15isotopes, 10low-pressure technologies, 13,
See
Low-pressure mercury lamps
vapor pressure, 14, 17, 19, 23Mercury ultraviolet (UV) lamps
aging, 19, 34available technologies, 14–27broadband or multiwave emission, 13doped lamps, 29, 31–32, 38electron temperature vs. gas temperature,
22–23excimer, 14,
See
Excimer lampsFaraday dark spaces, 16filler gas and Penning mixtures, 10–12, 14,
See also
Carrier gas; Penning mixtureflash-output, 14flat lamp technologies, 28glow discharge, 20, 21high-pressure technologies, 14history, 59liquid mercury, 13low-pressure technologies, 14–22,
See
Low-pressure mercury lamps
medium-pressure technologies, 13, 22–28,
See also
Medium-pressure mercury lampsplasma emission temperature, 13
L1603_frame_Index Page 168 Friday, March 8, 2002 10:55 AM
Index
169
quartz mounting, 17,
See also
Quartz enclosures
self-absorption, 15, 17, 21thermal losses, 12, 23total heat loss, 23
Méry-sur-Oise, France, 112Metal halide lamps, 34Methanol, 125Methylene chloride, 115Microbiological counts, 100
Micrococcus
, 141
Micrococcus candidus
, 73
Micrococcus radiodurans
, 60, 141
Micrococcus sphaeroïdes
, 73Mineral deposits, 42–44Mineral salt actinometers, 51Mixed-phase UV-ozone systems, 127Mixing conditions, 90, 98–100
hydraulic conditions, 99longitudinal or transverse mounting, 100testing flow-through patterns, 99–100
Molar gas volume at NTP, 153Molecular oxygen,
See
OxygenMolecular radiation, 27Molybdenum electrode connections, 25Monitoring, 101–104Monochromatic UV lamps
comparative disinfection efficiency, 67bacterial photorepair, 64low-pressure Hg lamps, 38
Morrill index, 100, 144Mt. View Sanitary District, 136Multihit killing effects, 81–83Multiple-lamp reactors, design factors for, 90–97Multisite killing effects, 83Multiwave emission, 13, 24,
See also
Polychromatic UV lamps
N
Nanofiltration, 112Naphthalene, 79National Sanitation foundation (NSF), 4
Neisseria catarrhalis
, 73Neon, 12, 21, 32Netherlands, UV water treatment standards, 3
Neurospora
, 141New Jersey standards, 4Newcastle, Indiana, 147Nickel electrodes, 16Nitrate ion, 122–124, 132Nitrified effluents, photorepair capability, 142Nitrite, 123, 124
Nitrobenzene, 78Nitrogen UV absorption, 7Nitrophenols, 78, 125
p
-Nitrosodimethylaniline, 118NOFRE effect, 78Nucleic acids, 60,
See
DNANurseries, 59
O
On–off lighting effects, 34–35Operational guarantee, 107Optical filters, 45–46, 129Optical glass, solarization effects, 19,
See also
Aging, of UV lamp components; Solarization
Optical interferencedissolved compounds, 78–79investigational tool, 79–81
Organic compounds,
See also
Photochemical synergistic oxidation;
specific compounds
direct photochemical interference, 78hydroxyl radical reactions, 119competitive optical interferences, 78–79synergistic UV-H
2
O
2
effects, 125–126synergistic UV-ozone effects, 128–129UV catalytic processes, 130–131UV light effects, 114–116,
See also
Photochemical synergistic oxidation
UV-mediated toxicity and by-products, 146Organochlorine pesticides, 125Orthogonal reactors, 85Oxalic acid, 51Oxidation applications,
See
Photochemical synergistic oxidation
Oxidation-reduction reactions, 116,
See
Photochemical synergistic oxidation
Oxide coatings, 16Oxygen,
See also
Ozonedissolved
hydrogen abstraction reaction, 119synergistic oxidation reactions and, 132
tert
-butanol actinometry, 53molecular
hydrogen peroxide/UV reactions, 118low-pressure Hg lamp emission spectrum
and, 19UV absorption and vacuum ultraviolet, 7
Ozonedye bleaching effects, 118production, 129–130UV absorption, 8, 59, 126UV-induced generation, 7
L1603_frame_Index Page 169 Friday, March 8, 2002 10:55 AM
170
Ultraviolet Light in Water and Wastewater Sanitation
Ozone, synergistic UV applications, 3, 113, 126–130,
See also
Photochemical synergistic oxidation
bactericidal efficiency, 126costs, 129homogeneous-phase systems, 128mixed-phase systems, 127organic compounds susceptible to, 128–129
Ozone-free lamps, 130Ozone positive lamps, 129
P
Paderborn, Germany, 95Paper industry, 128Parahydroxybenzoic acid (PHBA), 79–80, 90Parasites, 65, 67, 76
D
10
values, 74
Penicillium
, 141Penning mixture, 12, 14, 21,
See also
Carrier gas;
specific components
doping, 31–32ozone generation, 129
Pennsylvania standards, 4Performance requirements, 106Peroxyl radical, 119Perpendicular reactors, 85Perrysburg, Ohio, 2Persulfate
tert
-butanol actinometer, 53Pesticides, 115, 125, 128,
See also
Organic compounds
pHhydrogen peroxide disproportionation and,
122optical masking and, 79–80UV disinfection dose-efficiency and, 76
Phages,
See
BacteriophagesPhenolic compounds, 78, 125, 128Phenylalanine, 64Phosphoric acid, 146Photocells, 46–47, 101, 103
cleaning, 104, 145lethal dose determination, 69–70
Photochemical synergistic oxidation, 113–133design rules, 132–133energy consumption, 125hydroxyl radicals, 116–119low-pressure lamps and, 38nitrate effects, 122–124, 132ozone-UV synergism, 113, 126–130,
See also
Ozone, synergistic UV applications
scavenger reactions, 117thermodynamic data, 117
ultraviolet catalytic processes, 130–131UV and hydrogen peroxide, 120–126,
See also
Hydrogen peroxide, combined UV synergistic action
Photographic film, 45Photohydration, 54Photolytic processes,
See
Photochemical synergistic oxidation
Photometry, 152Photons, 5, 15
energy transfer reactions, 114, 115flux, 120–121germicidal effects, 67selecting system, 46travel distance, flat lamps, 28
Photoreactivation, 140–141Photorepair, 60, 62, 64, 81, 140–142
quantification, 141Photosensitive papers, 45
Phytomonas tumefaciens
, 73Planck constant, 152, 153Planck’s theory, 152Plasma emission, 13Plasmids, 60Plug flow
aspect ratio design factor, 145mixing conditions analysis, 98
Point-of-entry criteria, 4Point-of-use, 4, 59Point-source, 85, 87, 93
summation method, 89Polar distribution, 57, 58Poliovirus, 73Pollutants,
See
Organic compounds;
specific substances
Polychlorinated biphenyls (PCBs), 79Polychromatic UV lamps
comparative disinfection efficiency, 67medium-pressure Hg lamps, 13, 23, 39lethal dose determination, 69
Potassium ferrioxalate, 51Potassium peroxydisulfate, 53Power Groove lamp, 28Power loss measurement, 47Precipitation, 42–44Propanol, 146Proteins, 60, 64–67, 77
competitive absorption effects, 78dissolved, competitive effects, 78
Proteus, 60, 141Proteus mirabilis, 82Proteus vulgaris, 73Pseudo-first-order decay rate, 98Pseudomonas aeruginosa, 73, 141
L1603_frame_Index Page 170 Friday, March 8, 2002 10:55 AM
Index 171
Pseudomonas fluorescens, 73Public parks, 137Pyrimidine bases, UV absorption, 60
Q
Quantum yield, actinometer, 47, 51Quantum yield, peroxide photodecomposition,
54Quartz, 5
aging, 40, 129materials for UV water disinfection, 7solarization, 19TiO2 doping, 20titanium dioxide doping, 20UV lamp materials, 39
Quartz enclosures, 17, 23, 44, 88, 94checking transmission yield, 37cleaning, 145correction factor for total intensity, 88diffraction and reflection, 88Source du Pavillon facility, 109transparency loss, 109
R
Radiance, 152, See also IrradianceRadiant emittance, 152Radiant energy, 152Radiant intensity, 152
drinking water losses, 70–71Radiant power or flux, 152Radiometry, 44–45, 152Railway trains, 3, 59Range of Lyman, 6Range of Millikan, 6Range of Schumann, 6Rayleigh diffusion, 7Recreational applications, 59Redox reactions, 116, See also Photochemical
synergistic oxidationReducing agents, 114Reflectance
empirical correction factor, 88optical materials, 40–42water, 44
Refractive index, 44Regulation, See Standards and regulationsResidence time, 100Resonance lines, 19Reynolds number, 99Rheovirus, 73
Risk zone applications, 59RNA, 60
quantitative UV absorption, 66Roosteren, the Netherlands, 110Rotavirus, 73Rouen, France, 2
S
Saccharomyces, 4, 60, 141Safety dose, and lethal-lag phase, 81Safety factor, for viral inactivation, 76Salmonella enteritidis, 73Salmonella typhi, 73Salmonella typhimurium, 73Salt solution injection, 99Scaling deposits, 40Scavenging reactions, 117Schools, 59Sediment, 140Self-absorption, 15, 17, 21Serratia marcescens, 73Shallow-bed reactor, 71–72Shellfish areas, 137Shigella paradysenteriae, 73Ships, 3, 59Silica wall thickness, 24Silver chloride, 5Silver reduction, 5Single-lamp reactors, design factors for,
86–90Single-stranded DNA, 66Singlet excited oxygen, 67Skin pigmentation, 6Slimes, 40, 42–44Soft drink industries, 59Solar constant, 7Solar energy batteries, 38Solarization, 19, 40, See also Aging, of UV
lamp componentsSolar photoelectric generators, 59Solar radiation (sunlight)
bactericidal effect, 2, 59solar spectrum, 5UV radiation, 6, 7–8
Solar system, 7Somatic coliphages, 73Sound, speed of, 153Source Du Pavillon, Spontin, Belgium,
108–110South African regulations, 136Sovet, Belgium, 108Specific electrical loading, 21
L1603_frame_Index Page 171 Friday, March 8, 2002 10:55 AM
172 Ultraviolet Light in Water and Wastewater Sanitation
Spectral distributionflat lamp emissions, 28low-pressure Hg lamp emission spectrum,
19–20xenon discharge lamps, 32
Spectral radiometry, 45, 46–47, 152Spectratherm®, 29Speed of sound, 153Spirillum rubrum, 73Spontin, Belgium, 108–110Spores, fungal, 74Spores, lethal-lag phase, 76, 81–84, See also
specific organisms Spray irrigation, 136Sputtered oxides, 19Standards and regulations
UV-based drinking water disinfection, 3–4wastewater treatment, 135–137
Stark–Einstein law, 47Start–stop procedure, 19Stefan–Boltzmann constant, 9Stefan–Boltzmann law, 9Streptococci
drinking water source standards, 137swimming water criteria, 136
Streptococcus faecalis, 136, 141Streptococcus hemolyticus, 73Streptococcus lactis, 73Streptococcus viridans, 73Streptomyces, 60, 141Strontium oxide, 16Sunlight, See Solar radiationSurface Water Treatment Rule (SWTR), 2Suspended solids, 77, 137–140Swimming water standards, 135–136Synergistic oxidation, See Photochemical
synergistic oxidation
T
Technology selection guidelines, 38–39Teflon, 39–40Temperature
absolute, 153broadband pulsed systems, 36mercury lamps, 13
cathode, 24, 26electron temperature vs. gas temperature,
22–23emitted intensity and, 17medium-pressure lamps, 22–23
UV disinfection dose-efficiency and, 76water, UV-assisted oxidation and, 132
Tertiary butanol, 53
Thallium iodide, 34Thermal activation, 9Thermal expansion coefficient, 25Thermal losses, 12Thermic waves, 6Thermoionic detector, 45Thermoionic emission, 16, 26–27Thorium oxide, 27Thymine, 60, 64Titanium dioxide, 20, 130–131Tobacco mosaic virus, 73Torula sphaerica, 73Total coliform counts, 140, See also Coliform
bacteriadrinking water source standards, 137swimming water criteria, 136
Total organic carbon (TOC), 132Total plate counts (TPC), UV-assisted oxidation
and, 132Total radiant power, medium-pressure Hg lamp, 24Total suspended solids, 137–138Transformers, 25, 39Transmission or reflection yields
method for checking, 47optical materials, 40–42water, 44
Transmittance filters, 46Transverse mounting, 92, 100Trichloroethanes, 115Trichloroethylene, 115Trihalomethanes (THM), 77True absorbed dose, 125Tryptophan, 64, 66
glycyl dimer, 65Tubular mercury lamp, zonal distribution of light
emission, 57Tubular reactor, design factors, 88Tungsten, 16, 26, 27Turbidity, 77, 132, 138Turbulent flow, 99Tyrosine, 64, 66
U
Ultrasonic cleaning, 39, 140Ultraviolet catalytic processes, 130–131Ultraviolet (UV) irradiation dose, 66–67
cumulative effect, 92design standards, 105dose-efficiency, See Dose-efficiencyD10 dose, 68, 72–75exposure dose, 125lethal dose determination, 69–72, See also
under Dose-efficiency
L1603_frame_Index Page 172 Friday, March 8, 2002 10:55 AM

Index 173
multiple-lamp reactor design, 90–97single-lamp reactor design, 87–90true absorbed dose, 125wastewater disinfection, 142–145
Ultraviolet (UV) lamps, 9–58, See also Mercury ultraviolet (UV) lamps
actinometry, 47, 51–54, See also Actinometryautomation, 27, 39bacterial photorepair, monochromatic vs.
broadband ultraviolet lamps, 64broadband pulsed systems, 36choice for wastewater disinfection, 145–146cleaning, 39, 145–146excimer, 36–38, See also Excimer lampsflat, 28–31, 95germicidal efficiency, 67–68, See also
Dose-efficiencyindirect irradiation technologies, 40inside temperature, 13low-intensity experimental reactor, 81–82maintenance checklist, 104materials, 39–40mercury emission lamps, 9–12, See Mercury
ultraviolet (UV) lampsmetal halides, 34optical filters, 45–46ozone formation vs. decomposition, 129ozone-free, 130permanent monitoring, 101–104precipitation (slimes), 42–44pressure terminology, 14radiometric determinations, 44–45shielding effects in multiple-lamp reactors, 92spectral radiometry (photocells), 46–47,
See also Photocellstechnology selection guidelines, 38–39transmission-reflection yields of optical
materials, 40–42submerged portion UV power, 91xenon discharge, 32–33xenon flash-output, 34–36, See also Xenon-
pulsed lamp technologyzonal distribution of emitted light, 54–58
Ultraviolet (UV) light, 114combined hydrogen peroxide treatment, See
Hydrogen peroxide, combined UV synergistic action
definition of, 4–5drinking water disinfection, See Drinking water
disinfectiongermicidal wavelengths, 27lamps, See Ultraviolet (UV) lampslight ranges and classification, 5–6, See also
UV-A; UV-B; UV-Corganic compound absorption, 114
ozone and, 59, See Ozoneozone production, 129–130solar radiant energy, 6, 7–8sunlight bactericidal effect, 2, 59synergistic ozone applications, See Ozone,
synergistic UV applicationswastewater sanitation, See Wastewater
treatmentUltraviolet (UV) synergistic oxidation processes,
See Photochemical synergistic oxidationUltraviolet (UV) transmittance, wastewater
effluents and, 137–138Uranyl salts, 51–52Uridine, 44, 55U.S. Department of Health, Education and
Welfare (DHEW), 4U.S. Electric Power Research Institute
(EPRI), 38U.S. Environmental Protection Agency (EPA)
Groundwater Disinfection Rule (GWDR), 2Surface Water Treatment Rule (SWTR), 2
Utah standards, 4UV-A, 5, 8
teflon lamps and, 40UV-B, 5, 8
water disinfection application, 7UV-C, 5
bacterial photorepair and, 64deuterium discharge lamps, 33–34D10 values and, 75excimer lamps, 36efficiency for UV-ozone synergistic
applications, 126hydrogen peroxide absorption, 122hydroxyl radical absorbance, 118low-pressure Hg lamp output, 21medium-pressure Hg lamp applications, 39optimization for medium-pressure Hg lamps,
24, 27protein/amino acid absorption, 64water disinfection application, 7, See also
Drinking water disinfectionUV-C/P filter with cosine correction, 72UV-exonuclease, 60
V
Vacuum ultraviolet (VUV)excimer technology, 37–38nitrogen and oxygen absorption, 7ozone generation, 130
Vertical installation, 144Vessel-type reactors, 94Vibrio cholerae, 73
L1603_frame_Index Page 173 Friday, March 8, 2002 10:55 AM
174 Ultraviolet Light in Water and Wastewater Sanitation
Viruses, 65, 66, 67Actinomyces control, 100–101capsid proteins, 65, 66DNA size, 66D10 values, 73, 76photorepair capability, 60safety factor, 76
Volatile compounds, 146Voltage fluctuation effects, 17Voltage input, medium-pressure Hg lamp UV
output and, 24–27
W
Wastewater treatment, 135–147aftergrowth and photorepair following UV
disinfection, 140–142applied UV dose, 142–145example, 147fecal bacteria, 140general considerations, 146–147hydraulic conditions, 99lamp technologies, 145–146, See also
Ultraviolet (UV) lampsregulations and guidelines, 135–137suspended solids, 137–140toxicity and by-products, 146turbidity, 138UV effects on effluents, 137–140white-light sources, 141
Waterabsorption spectrum, 70, 78competitive UV absorption of components,
76–78loss of irradiation intensity, 70–71reflectance, 44UV absorption spectrum, 70
quality factor, 144temperature effects, 76
Water treatment, See Drinking water disinfection; Photochemical synergistic oxidation; Wastewater treatment
Waymouth formula, 23White-light sources, wastewater treatment, 141World Health Organization (WHO), 135
X
Xenon, 12Xenon discharge lamps, 32–33Xenon-doped arcs, organic compounds and, 115Xenon excimer lamps, 37. See also Excimer
lampsozone generation, 129–130
Xenon flash-output lamps, 34–36, See Xenon-pulsed lamp technology
Xenon-pulsed lamp technology, 34–36reported D10 values, 72wastewater disinfection, 145
X-ray radiation, 6
Y
Yeasts, 66, 73Yersinia enterocolitica, 73Yttrium doping, 38
Z
Zevenbergen facility, the Netherlands, 94Zonal distribution of lamp emissions, 58Zwindrecht, the Netherlands, 110
L1603_frame_Index Page 174 Friday, March 8, 2002 10:55 AM


![Water,Sanitation,andHygieneServiceAvailabilityatRural ... · inadequate water supply and sanitation [3]. Inadequate drinking water, sanitation, and hygiene in nonhousehold settings,](https://img.dokumen.tips/doc/110x75/5e81efd69f9e151ba6551f5b/watersanitationandhygieneserviceavailabilityatrural-inadequate-water-supply.jpg)