Embed Size (px)
Citation preview

© ABB| Slide 1April 29, 2015
Solid growth in a mixed marketQ1 2015
Ulrich Spiesshofer, CEO ABB; Eric Elzvik, CFO ABB, April 29th, 2015
© ABB| Slide 2
Important notices
April 29, 2015
This presentation includes forward-looking information and statements including statements concerning the outlook for ourbusinesses. These statements are based on current expectations, estimates and projections about the factors that may affectour future performance, including global economic conditions, and the economic conditions of the regions and industries thatare major markets for ABB Ltd. These expectations, estimates and projections are generally identifiable by statementscontaining words such as “expects,” “believes,” “estimates,” “targets,” “plans,” “outlook” or similar expressions.
There are numerous risks and uncertainties, many of which are beyond our control, that could cause our actual results todiffer materially from the forward-looking information and statements made in this presentation and which could affect ourability to achieve any or all of our stated targets. The important factors that could cause such differences include, amongothers:
§ business risks associated with the volatile global economic environment and political conditions§ costs associated with compliance activities§ raw materials availability and prices§ market acceptance of new products and services§ changes in governmental regulations and currency exchange rates, and,§ such other factors as may be discussed from time to time in ABB Ltd’s filings with the U.S. Securities and Exchange
Commission, including its Annual Reports on Form 20-F.
Although ABB Ltd believes that its expectations reflected in any such forward-looking statement are based upon reasonableassumptions, it can give no assurance that those expectations will be achieved.
This presentation contains non-GAAP measures of performance. Definitions of these measures and reconciliations betweenthese measures and their US GAAP counterparts can be found in the ‘Supplemental reconciliations and definitions’ section of“Financial Information” under “Financial results & presentations” – “Quarterly results & annual reports” on our website atwww.abb.com/investorrelations

© ABB| Slide 3April 29, 2015
Q1 2015 – solid growth in a mixed market
1Changes in orders and revenues are on a like-for like basis
Growth initiatives drive solid top line development; PIE is workingOrders up 15%1, revenues grew 3%Book to bill 1.2x, >1.0x in every divisionInnovation: YuMi® robot, intelligent transformer sensors, production mgmt. software
Next Level starts to create impactNext Level starts to create impact
Business-led
collaboration
Relentlessexecution
Profitablegrowth
Progress in Power Systems “step change” program, 2.2% op EBITA marginGroup operational EBITA margin steady at 11.1%5% higher operational EPS on a constant currency basisNew performance linked compensation system rolled out to 60’000 employees
Key project wins driven by combined power and automation offeringEngagement with +7’000 customers at ABB Automation & Power World in Houston, TX
Delivering along our three focus areas

© ABB| Slide 4April 29, 2015
Q1 2015Key figures
1On a like-for-like basis; 2 Calculated on basic EPS before rounding; 3Calculated before rounding
Q1 15 Q1 14 Change
$ mn unless otherwise indicated
Orders 10’404 10’358 +15%1
Order backlog (end March) 25’491 26’924 +10%1
Revenues 8’555 9’471 +3%1
Operational EBITA 949 1’039 +5%1
as % of operational revenues 11.1% 11.0% +0.1 pts
Net income 564 544 +4%
Basic earnings per share ($) 0.25 0.24 +6%2
Operational earnings per share ($) (constant currency basis) 0.31 0.29 +5%3
Cash from operations 53 (45) n/a

© ABB| Slide 5April 29, 2015
Focused growth initiatives drive 15% order increaseBase orders increase in four divisions
1Asia, Middle East, and Africa; 2 Selected countries from among ABB’s Top 20 countries
2015 Q1 total order growth by region
Brazil -10%
Canada +8%
China 0%
Finland +16%
Italy +15%
India +15%
Japan +23%
Sweden +5%
UK 0%
US +4%
Change on a like-for-like basis
Broad-based growth in both power and automation ordersBroad-based growth in both power and automation orders
AmericasAutomation +4%Power +19%
Total +9%US +4%Canada -3%Brazil +30%
EuropeAutomation -2%Power +90%
Total +27%Germany +87%UK +20%Italy +22%
AMEA1
Automation +12%Power +3%
Total +8%China +6%Japan +23%South Africa +247%
2015 Q1 base ordergrowth2
Change on a like-for-like basis

© ABB| Slide 6April 29, 2015
Negative double digit translation impacts in Q1Foreign exchange exposures – overview
Translation impacts from strong USD will continueTranslation impacts from strong USD will continue
15% appreciation of USD15% appreciation of CHF vs EUR
Example:
Structural effectUSD appreciation
Transaction
Translation to USD
Medium-term Inc. from op. á ~$200-400 mnInc. from op.%á ~0.5-1% point
Net exporter from EUR-zone to $-zone
Medium-termInc. from op.â $100-200 mnInc. from op.%â ~0.25-0.5%
point
Mitigated by sourcingand cost optimization
Immediate Minor ~ fully hedged, but somevaluation timing differences
Policy to hedge allexposures
Immediate Inc. from op./orders/revenuesâ ~9%
> 50% of revenuesfrom non-$ zones
Timing Estimated impact
Structural effectCHF appreciation
Actions / Drivers
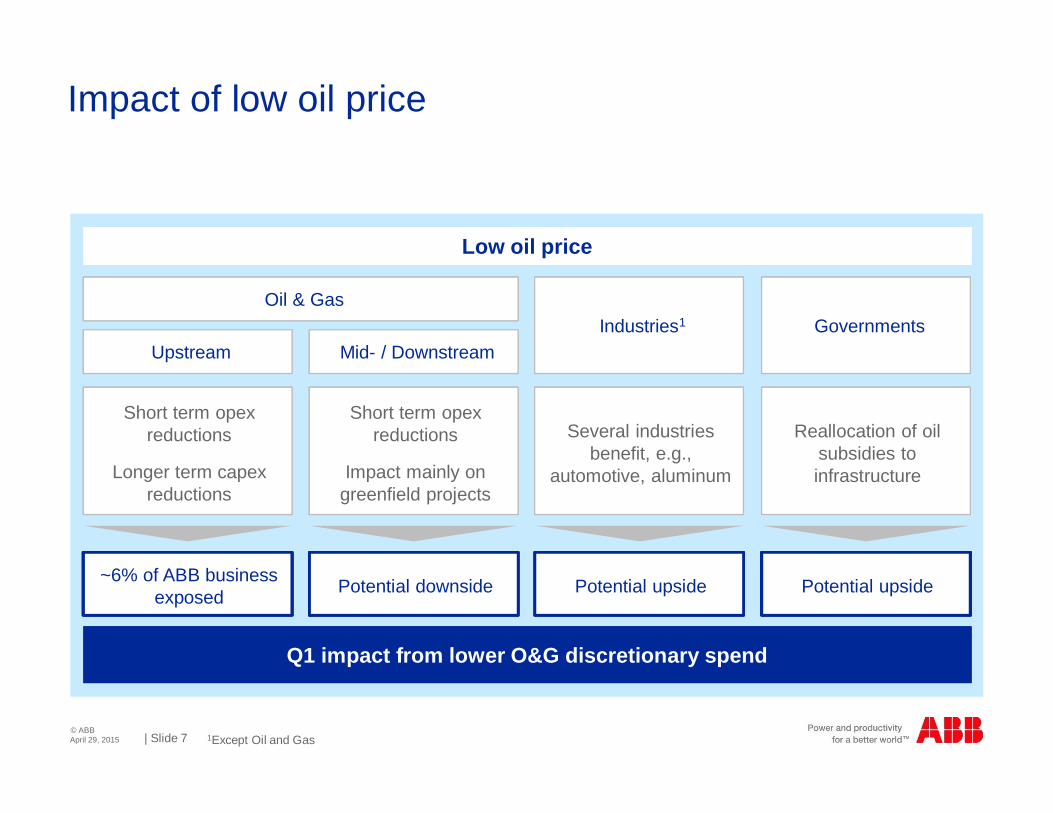
© ABB| Slide 7
Short term opexreductions
Longer term capexreductions
Short term opexreductions
Impact mainly ongreenfield projects
Oil & Gas
Upstream Mid- / Downstream
April 29, 2015
Impact of low oil price
Low oil priceLow oil price
Reallocation of oilsubsidies toinfrastructure
Governments
Several industriesbenefit, e.g.,
automotive, aluminum
Industries1
1Except Oil and Gas
~6% of ABB businessexposed Potential downside Potential upsidePotential upside
Q1 impact from lower O&G discretionary spendQ1 impact from lower O&G discretionary spend

© ABB| Slide 8
Growth offset by mix and foreign translation
April 29, 2015
Operational EBITA bridge
Actions under way for further cost reductions and white collar productivityActions under way for further cost reductions and white collar productivity
Factors affecting operational EBITA Q1 2015 vs Q1 2014
Op EBITAQ1 2014
Op EBITAQ1 2015
11.0% op.EBITA margin
11.1% op.EBITA margin
949
+100 -109+81 -58
-35+91,039
-78
1,093
Netsavings
Costsavings
offset pricepressure
NetvolumeRevenue
impact plusinvestmentsfor growth
OtherCosts
Projectmargins
MixBusiness &Geographic
DivestituresForexTranslation
effects

© ABB| Slide 9April 29, 2015
Q1 2015 performance by divisionKey figures quarter on quarter
$ mnunless otherwise stated Orders
rLike-for-like Revenues
rLike-for-like
OperationalEBITA% r
Cash flow fromoperations r
Discrete Automationand Motion 2’569 -1% 2’271 +4% 14.2% -0.6 pts 223 (71)
Low VoltageProducts 1’703 +2% 1’555 -1% 15.6% -0.3 pts (10) +17
Process Automation 1’921 +16% 1’579 -4% 12.2% -0.4 pts 64 (31)
Power Products 2’656 +7% 2’275 +4% 11.2% -1.5 pts 80 +21
Power Systems 2’394 +90% 1’472 +4% 2.2% +5.5 pts (147) +156
Corporate &consolidation (839) (597) (157) +6
ABB Group 10’404 +15% 8’555 +3% 11.1% +0.1 pts 53 +98

© ABB| Slide 10April 29, 2015
Capital managementFreeing up cash for growth and value creation
1NWC: Net Working Capital
Continued focus on driving sustainable value creationContinued focus on driving sustainable value creation
Net working capital focused efforts:• Stronger operational execution on lead times,
on-time delivery, payables/receivables• Focus on driving inventory turnsNWC1 at 15% of revenues; aim long term 11-13%
Actions in place
A solid, more balanced, cash generator
Cash from operations, $ mn
Q1 2014 Q1 2015
-4553
Dividend from capital contribution to be paidearly May (0.55CHF/ share)Dividend distribution from nominal reduction tobe paid late July/ early August (0.17CHF/share)
Q1 purchased 21.5 mn shares with a buybackvalue of ~$450 million
In total: 54 mn shares purchase with anapprox value of $1.2 billion
2015 Total cash distribution
Status of share buyback

© ABB| Slide 11April 29, 2015
ABB – our Next Level strategyShaping a global leader in power & automation
Attractivemarkets
Wellpositioned
Shifting the center of gravity§ Strengthening competitiveness§ Driving organic growth momentum§ Lowering risk
Incremental acquisitions and partnerships
Leading operating modelDriving change through 1’000 dayprogramsLinked strategy, performance managementand compensation
Simplifying how we work togetherStreamlining market focused organizationLeadership development
Profitablegrowth
Relentlessexecution
Business-ledcollaboration
Delivering attractiveshareholder returns
2014-2016share buy-back
Accelerating sustainable value creation
Presented September 9th, 2014

© ABB| Slide 12April 29, 2015
Profitable growthDriving organic growth momentum
Attractivemarkets
Wellpositioned
Example
Profitablegrowth
Relentlessexecution
Business-ledcollaboration
Penetration
Innovation
Expansion
Growth in Japan§ Q1 2015 growth >20%§ e.g., solar, utilities,
robotics
Yumi®§ Collaborative dual-arm
robots for small partsassembly; 3C industry
Partnership with Samsung formodular and scalablemicrogrids e.g., India, SouthAsia, Africa
2011 20142012 2013
>10% CAGR
Orders received

© ABB| Slide 13
Profitablegrowth
Relentlessexecution
Business-ledcollaboration
April 29, 2015
Profitable growthPartnerships to expand into growth markets
Attractivemarkets
Wellpositioned
Example
Technological expertise andscale in lithium batterytechnology
High performance battery energystorage portfolio
Battery integration and batterymanagement system knowledge
Worldwide track record
Power electronics, converter andelectrification competence
Packaged energy storagesolutions
Grid connection capabilities,automation and remotemonitoring
Global market access
Joining forces to enable microgrids globally

© ABB| Slide 14
Profitablegrowth
Relentlessexecution
Business-ledcollaboration
April 29, 2015
Relentless executionSecuring profitability in challenging markets
Attractivemarkets
Wellpositioned
Example
Structural costsavings
Productivityimprovements
Value chainoptimization
New global business model for ITinfrastructureSustainably lower annual costs
8’000 workforce reduction viaproductivity & portfolio measuresAccelerated cost-out initiativesreduced G&A by 7%
Footprint expansion, in SaudiArabia, India, Czech Rep.Closure of Swedish motor factory

© ABB| Slide 15
Profitablegrowth
Relentlessexecution
Business-ledcollaboration
April 29, 2015
Relentless executionPower Systems delivering on ‘step change’
Attractivemarkets
Wellpositioned
Example
What we said
Progress on profitability in 2015
Strengthen leadership
Complete off-shore wind
Exit solar EPC
New partnerships
Grow base business
De-risk business model, improvedrisk mgmt.
What we delivered
Profitable Q1
Division line and project mgmt.strengthened
Milestone progress on track
On track for completion
Samsung microgrid partnership
Steady base orders and service
Reflected in order bookings
Solid ‘step change’ progress, key wins reflect newbusiness model

© ABB| Slide 16
Profitablegrowth
Relentlessexecution
Business-ledcollaboration
April 29, 2015
Relentless executionNew compensation model rolled out
Attractivemarkets
Wellpositioned
Example
Better link between performance and compensation
Rolled outglobally
What wesaid in Q4
2014
Compensation further aligned to performance targets§ Rolled out to more than 60’000 employees in Q1§ Institutional and individual targets
CustomerOTD
Requestin Place
CCRP‘sResolvedon Time
FieldFailureRate
Metric inPlace
CostCost
reductions as %cost
OPQ as% COS
Productivity
Coefficient
Δ* Actual
CashDPO
Δ* ActualInventory
TurnsΔ* Actual
DSOΔ* Actual
Care
Hazard Ratio

© ABB| Slide 17
Profitable growth from combined power & automation offering
Profitablegrowth
Relentlessexecution
Business-ledcollaboration
April 29, 2015
Business-led collaboration
Attractivemarkets
Wellpositioned
Example
Cross-division collaboration deliversgreater customer value in Q1
Statoil, Norway~$120 mn
Industry
200-km subseapower link – ABBexpertise in HVDCplus offshore O&G
Stadler rail~$60 mn combined
Transportation &Infrastructure
Integrate power &automation toincrease efficiency,lower environmentalimpact
Eskom,South Africa~$170 mn
Utilities
Power plantcontrol, software,instrumentation

© ABB| Slide 18April 29, 2015
Q1 summary and outlook2015 priorities remain unchanged
Mixed short-term picture, uncertainty remains
Continued growth in US; slower growth inChina; modest growth in Europe
Oil price & forex translation effects to continue
Long-term demand outlook remains positive –growth drivers in place for utility, industry,transportation & infrastructure
Growth initiatives drive top line, PIE is working
Order backlog support revenues
Higher operational EPS in constant currency
Continued progress in PS step change
Steady operational EBITA margin
New compensation model rolled out
Key orders combining power and automation
Sharper focus on markets and customers
Q1 results Outlook
Next Level starts to create impactNext Level starts to create impact Manage uncertainties ahead throughNext Level
Manage uncertainties ahead throughNext Level

© ABB| Slide 19April 29, 2015

© ABB| Slide 20April 29, 2015
Key figures Q1 2015
Q1 15 Q1 14 Change
$ mn unlessotherwise indicated $ Local currency Like-for-like
Orders 10’404 10’358 0% +13% +15%
Order backlog (end March) 25’491 26’924 -5% +9% +10%
Revenues 8’555 9’471 -10% 0% +3%
Operational EBITA 949 1’039 -9% +1% +5%
as % of operational revenues 11.1% 11.0%
Income from operations 859 855 0%
as % of revenues 10.0% 9.0% +1.0 pts
Net income 564 544 +4%
Basic earnings per share ($) 0.25 0.24 +6%
Cash from operating activities 53 (45) n.a.

© ABB| Slide 21April 29, 2015
Order backlog by division
Q1 2015 Q1 2014 Change %
Order backlog (end March)$ mn $ Like-for like
Discrete Automation and Motion 4’596 4’839 -5% +6%
Low Voltage Products 1’003 1’161 -14% +6%
Process Automation 5’648 5’836 -3% +19%
Power Products 7’874 8’277 -5% +7%
Power Systems 8’746 9’280 -6% +11%
Consolidation and Other(incl. Inter-division eliminations) (2’376) (2’469)
Total Group 25’491 26’924 -5% +10%

© ABB| Slide 22April 29, 2015
Operational EPS analysis
Q1 2015 Q1 2014
mn $except per share data in $ EPS1 EPS r2
Net income(attributable to ABB) 564 0.25 544 0.24 +6%
Restructuring and restructuring-related expenses3 19 0.01 34 0.01
Acquisition-related expensesand certain non-operational items4 8 0.00 8 0.00
FX/commodity timing differences in Income fromoperations3 (21) (0.01) 18 0.01
Amortization rel. to acquisitions3 59 0.03 72 0.03
Operational net income 629 0.28 676 0.29 -5%
Operational EPS (constant currency) 0.31 0.29 +5%
1EPS amounts are computed separately, therefore the sum of the per share amounts may not equal to thetotal; 2Calculated on basic earnings per share before rounding; 3Net of tax at the Adjusted Group effective taxrate; 4Net of tax at the Adjusted Group effective tax rate, except for gains and losses on sale of businesseswhich are net of the actual provision for taxes;

© ABB| Slide 23April 29, 2015
Regional share of total orders and revenues by divisionQ1 2015
Ord
ers
Ord
ers
DiscreteAutomation &
Motion
Rev
enue
sR
even
ues
Low VoltageProducts
ProcessAutomation
PowerProducts
PowerSystems
Europe Americas Asia, Middle East and Africa
31% 35%
34%
32% 40%
28%
44% 36%
20%
43%26%
31% 64%13%
23%
28%37%
35%
30%40%
30%
44% 31%
25%
41%27%
32%
36% 38%
26%

© ABB| Slide 24April 29, 2015
Discrete Automation & MotionQ1 2015
Base orders increased, led byrobotics; large orders declinedmainly due to a difficult Q12014 comparable – resulting ina flat order development.
Orders up in AMEA* andAmericas.
Revenues increased onexecution of the stronger orderbacklog, mainly in deliveries tothe rail transportation sectorand robotics.
Operational EBITA margindeclined, reflecting a lowershare of higher-marginstandard products in totalrevenues compared with thesame quarter a year ago.
$ mn, y-o-y change like-for-like $ mn, y-o-y change like-for-like $ mn, operational EBITAmargin
2'48
5
2'81
6
2'56
9
1 2 32'
327
2'38
1
2'27
1
1 2 3
378
352
318
1 2 3
-1% +4% 14.2%
Orders received Revenues Operational EBITA
* Asia, Middle East, and Africa
Q1 13 Q1 14 Q1 15 Q1 13 Q1 14 Q1 15 Q1 13 Q1 14 Q1 15
2,48
5
2,81
6
2,56
9
2,32
7
2,38
1
2,27
1
378
352
318
© ABB| Slide 25April 29, 2015
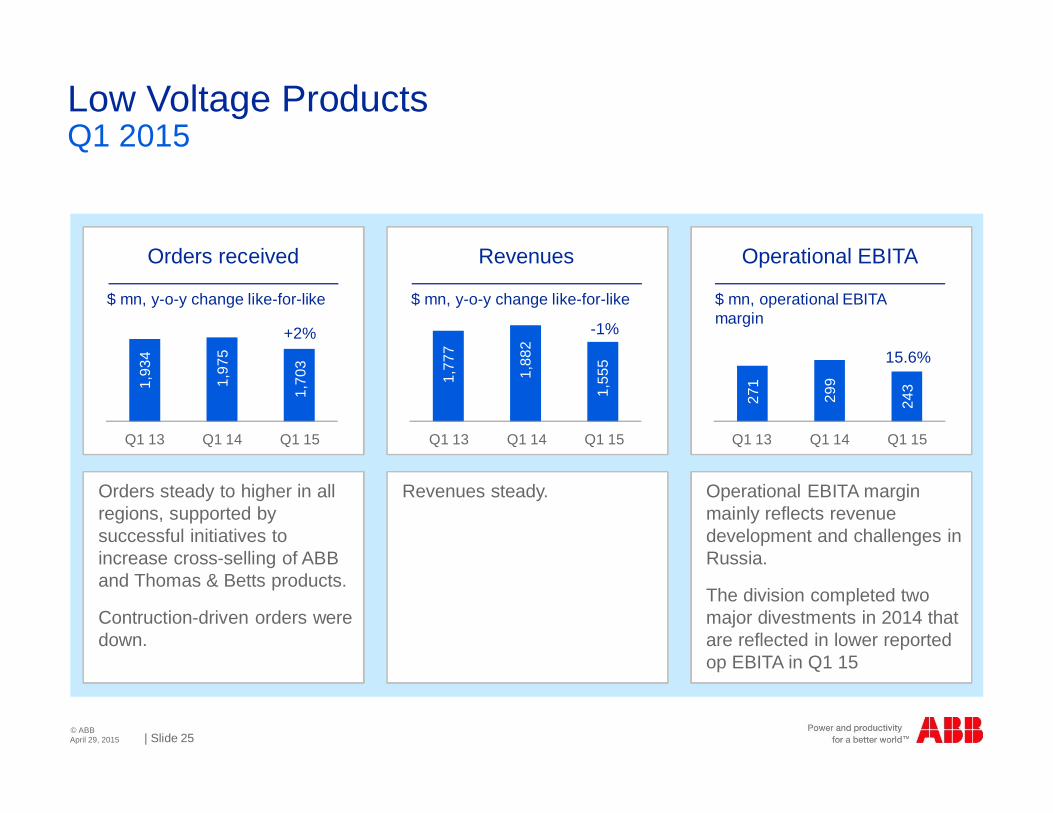
Low Voltage ProductsQ1 2015
Orders steady to higher in allregions, supported bysuccessful initiatives toincrease cross-selling of ABBand Thomas & Betts products.
Contruction-driven orders weredown.
Revenues steady. Operational EBITA marginmainly reflects revenuedevelopment and challenges inRussia.
The division completed twomajor divestments in 2014 thatare reflected in lower reportedop EBITA in Q1 15
$ mn, y-o-y change like-for-like $ mn, y-o-y change like-for-like $ mn, operational EBITAmargin
1'93
4
1'97
5
1'70
3
1 2 31'
777
1'88
2
1'55
5
1 2 3
271
299
243
1 2 3
+2% -1%
15.6%
Orders received Revenues Operational EBITA
Q1 13 Q1 14 Q1 15 Q1 13 Q1 14 Q1 15 Q1 13 Q1 14 Q1 15
1,93
4
1,97
5
1,70
3
1,77
7
1,88
2
1,55
5
271
299
243

© ABB| Slide 26April 29, 2015
Process AutomationQ1 2015
Orders increased significantlyas a result of large orders fromoffshore O&G, and marinesectors; base orders lower,partly due to reduceddiscretionary spend in O&G.Mining and metals remained atlow levels.
Revenues declined, as theresult of the reduceddiscretionary spend of O&Gcustomers and timing of orderbacklog execution in themarine business.
Operational EBITA and therelated margin declined as theresult of lower revenues.
$ mn, y-o-y change like-for-like $ mn, y-o-y change like-for-like $ mn, operational EBITAmargin
2'50
0
2'00
4
1'92
1
1 2 31'
978
1'94
3
1'57
9
1 2 3
242
245
192
1 2 3
+16% -4% 12.2%
Orders received Revenues Operational EBITA
* Liquified natural gas
Q1 13 Q1 14 Q1 15 Q1 13 Q1 14 Q1 15 Q1 13 Q1 14 Q1 15
2,50
0
2,00
4
1,92
1
1,97
8
1,94
3
1,57
9
242
245
192

© ABB| Slide 27April 29, 2015
Power ProductsQ1 2015
Both large and base ordersincreased, led primarily byselective power transmissioninvestments and supported byindustrial demand.
Revenues grew in allbusinesses on the execution ofthe order backlog.
The operational EBITA margindecline largely reflects theramp-up costs associated withthe strategic productionfootprint alignment towards keymarkets, such as Saudi Arabiaand India.Lower volumes in Russia alsoweighed on divisional results.
$ mn, y-o-y change like-for-like $ mn, y-o-y change like-for-like $ mn, operational EBITAmargin
2'85
9
2'72
5
2'65
6
1 2 32'
489
2'39
1
2'27
5
1 2 3
319
304
253
1 2 3
+7% +4%11.2%
Orders received Revenues Operational EBITA
Q1 13 Q1 14 Q1 15 Q1 13 Q1 14 Q1 15 Q1 13 Q1 14 Q1 15
2,85
9
2,72
5
2,65
6
2,48
9
2,39
1
2,27
5
319
304
253

© ABB| Slide 28April 29, 2015
Power SystemsQ1 2015
Orders almost doubled, led bystrong increase in large ordersin areas such as high-voltagedirect current (HVDC)transmission links, cablesystems, and power plantautomation under the newbusiness model.
Revenue growth was mainlydriven by execution of theorder backlog.
Operational EBITA and marginup, reflecting ongoing ‘stepchange’ measures andcontinued cost savings toreturn the division to higherand more consistentprofitability.
$ mn, y-o-y change like-for-like $ mn, y-o-y change like-for-like $ mn, operational EBITAmargin
1'63
7
1'49
0 2'39
4
1 2 32'
051
1'60
8
1'47
2
1 2 3
147
-54
33
1 2 3
+90%+4% 2.2%
Orders received Revenues Operational EBITA
Q1 13 Q1 14 Q1 15 Q1 13 Q1 14 Q1 15 Q1 13 Q1 14 Q1 15
1,63
7
1,49
0 2,39
4
2,05
1
1,60
8
1,47
2 147
-54
33

© ABB| Slide 29April 29, 2015
More information available at ABB Investor Relations
Name Telephone E-Mail
Alanna AbrahamsonHead of Investor Relations +41 43 317 3804 [email protected]
John Fox +41 43 317 3812 [email protected]
Binit Sanghvi +41 43 317 3832 [email protected]
Beat Fueglistaller +41 43 317 4144 [email protected]
Tatyana Dubina +41 43 317 3816 [email protected]
Annatina Tunkelo +41 43 317 3820 [email protected]
Ruth Jaeger +41 43 317 3808 [email protected]