Embed Size (px)
Citation preview
UK Earthquake Monitoring 2003/2004
BGS Seismic Monitoring and Information Service
Fifteenth Annual Report

BRITISH GEOLOGICAL SURVEY
COMMISSIONED REPORT IR/04/094
UK Earthquake Monitoring 2003/2004
B. Baptie and L. Ottemöller (editors)
The National Grid and other Ordnance Survey data are used with the permission of the Controller of Her Majesty’s Stationery Office. Ordnance Survey licence number GD 272191/1999
Key words
Monitoring, Earthquakes, Seismology.
Front cover
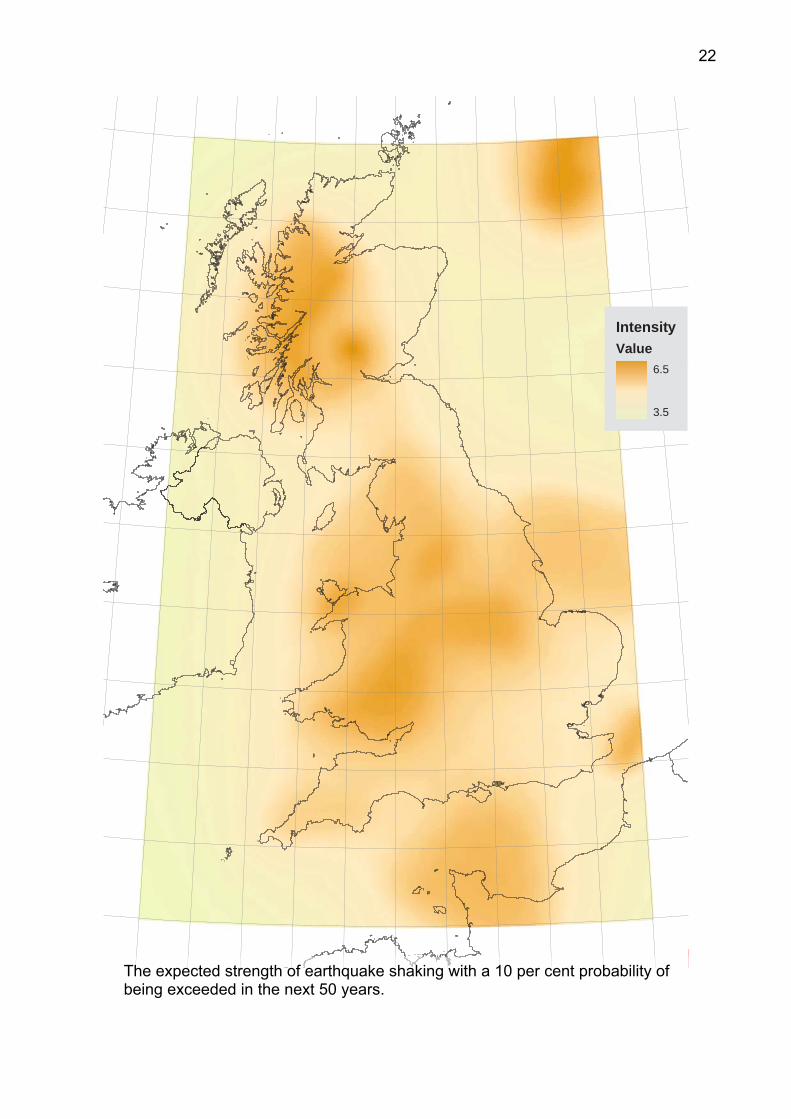
Cover picture The expected intensity of earthquake shaking with a ten per cent probability of being exceeded in the next 50 years.
Bibliographical reference
BAPTIE, B. AND OTTEMÖLLER, L.. 2004. UK Earthquake Monitoring 2003/2004. British Geological Survey Commissioned Report, IR/04/094
34pp.
© NERC 2004
Edinburgh British Geological Survey 2004

i
Contents Contents......................................................................................... i Summary ....................................................................................... ii Introduction ..................................................................................1
Monitoring Network .....................................................................3
Achievements ...............................................................................5
Network Development .................................................................5
Information Dissemination...........................................................8
Collaboration and Data Exchange...............................................9
Public Understanding of Science ..............................................11
Seismic Activity..........................................................................13
Aberfoyle ...................................................................................15
Bridgwater .................................................................................17
Global Earthquakes...................................................................18
Scientific Objectives ..................................................................19
Distribution of UK Seismicity .....................................................19
Attenuation of Seismic Waves...................................................20
Intensity Attenuation..................................................................21
Crustal Structure .......................................................................23
Seismotectonics and Stress ......................................................23
Acknowledgements....................................................................25
References ..................................................................................25
Appendix 1 The Project Team...............................................26
Appendix 2 Publications .......................................................27
BGS internal reports..................................................................27
External publications .................................................................27
Appendix 3 Publication Summaries .....................................28

ii
Summary The aims of the Seismic Monitoring and Information Service are to develop and maintain a national database of seismic activity in the UK for use in seismic hazard assessment, and to provide near-immediate responses to the occurrence, or reported occurrence, of significant events. The British Geological Survey (BGS) has been charged with the task of operating and further developing a uniform network of seismograph stations throughout the UK in order to acquire standardised data on a long-term basis. The project is supported by a group of organisations under the chairmanship of the Office of the Deputy Prime Minister (ODPM) with major financial input from the Natural Environment Research Council (NERC).
In the 15th year of the project four new broadband seismograph stations were established, with strong-motion accelerometers deployed at three of these sites. A further four stations were upgraded to high dynamic range data acquisition. All except one of the seismic sub-networks now use data loggers running under the QNX operating system. Ten portable data loggers were purchased, which can be rapidly deployed to record data from aftershock sequences and earthquake swarms and to study specific areas.
All significant felt events and some others were reported rapidly to the Customer Group through seismic alerts sent by e-mail. The alerts were also published on the Internet (http://www.earthquakes.bgs.ac.uk). Monthly seismic bulletins were issued six weeks in arrears and, following revision, were compiled into an annual bulletin (Simpson, 2004). In all reporting areas, scheduled targets have been met or surpassed.

1
Introduction The BGS Seismic Monitoring and Information Service has developed as a result of the commitment of a group of organisations with an interest in the seismic hazard of the UK and the immediate effects of felt or damaging vibrations on people and structures. The supporters of the programme, drawn from industry and central and local government are referred to as the Customer Group.
Earthquake monitoring is required to refine our understanding of the level of seismic risk in the UK. Although seismic hazard and risk are low by world standards they are by no means negligible, particularly with respect to potentially hazardous installations and sensitive structures. The results help in assessment of the level of precautionary measures which should be taken to prevent damage and disruption to new buildings, constructions and installations which otherwise could prove hazardous to the population. For nuclear sites, objective information is also provided to verify the nature of seismic events or to confirm false alarms, which might result
from locally generated instrument triggers. In addition, seismic events cause public concern and there is a need for accurate and objective information as soon as possible in order to allay any unnecessary concerns. Most seismic events occur naturally but some are triggered by human activities such as mining, and other tremors are often mistaken for earthquakes (e.g. sonic booms and explosions). The Information Service aims to rapidly identify these various sources and causes of seismic events, which are felt or heard.
2
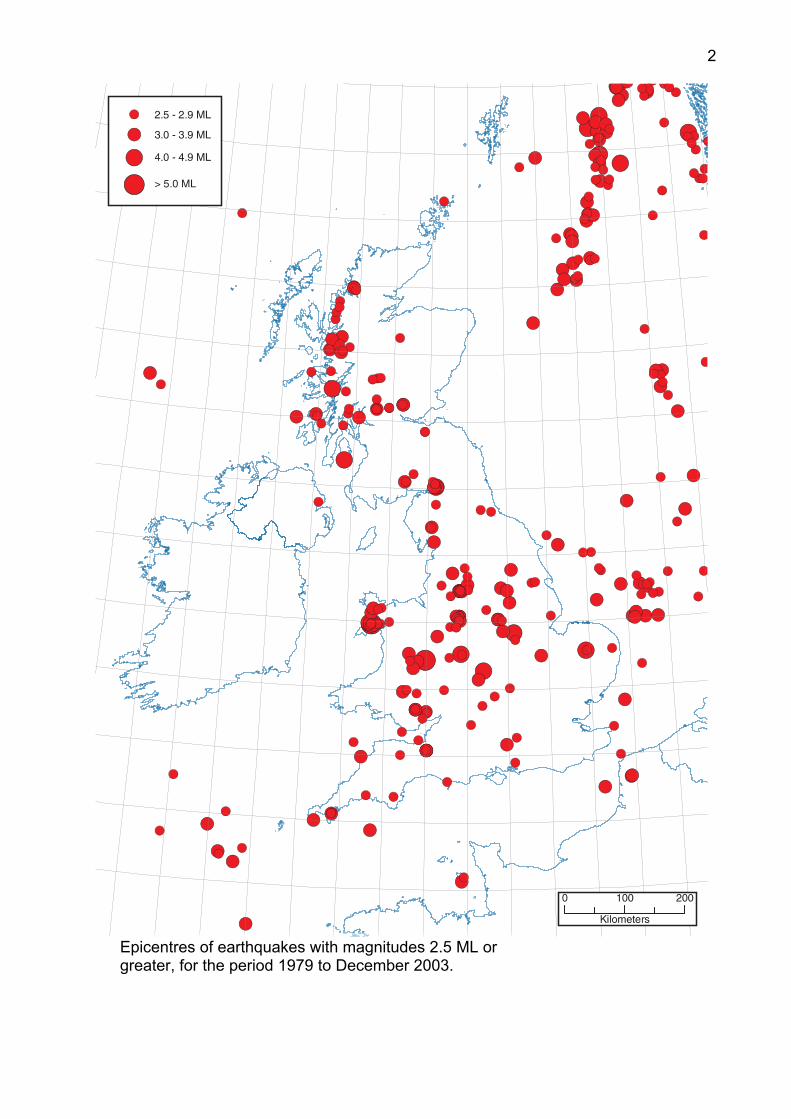
Epicentres of earthquakes with magnitudes 2.5 ML or greater, for the period 1979 to December 2003.

3
Introduction
Monitoring Network
The project started in April 1989, building on small networks of seismograph stations, which had been installed previously for site-specific purposes. Over time, the monitoring network has grown to 146 stations, with an average spacing of 70 km, giving UK-wide coverage and a detection threshold of 2.5 ML for all onshore earthquakes, even in poor noise conditions.
In the late 1960’s BGS installed a network of eight seismograph stations centred on Edinburgh, with data transmitted to the recording site in Edinburgh by radio, over distances of up to 100 km. Data were recorded on a slow running FM magnetic tape system. Since then, the network has grown in size, both in response to specific events, such as the Lleyn Peninsula earthquake in 1984, and as a result of specific monitoring initiatives, such as monitoring North Sea seismicity and the Hot Dry Rock geothermal energy project in Cornwall. The whole network now consists of a number of sub-networks, which, in turn, consist of up to ten 'outstation' vertical seismometers radio-linked to a central site. Here, the data, along with that from a local 3-component set of two horizontal and one vertical seismometer, are recorded
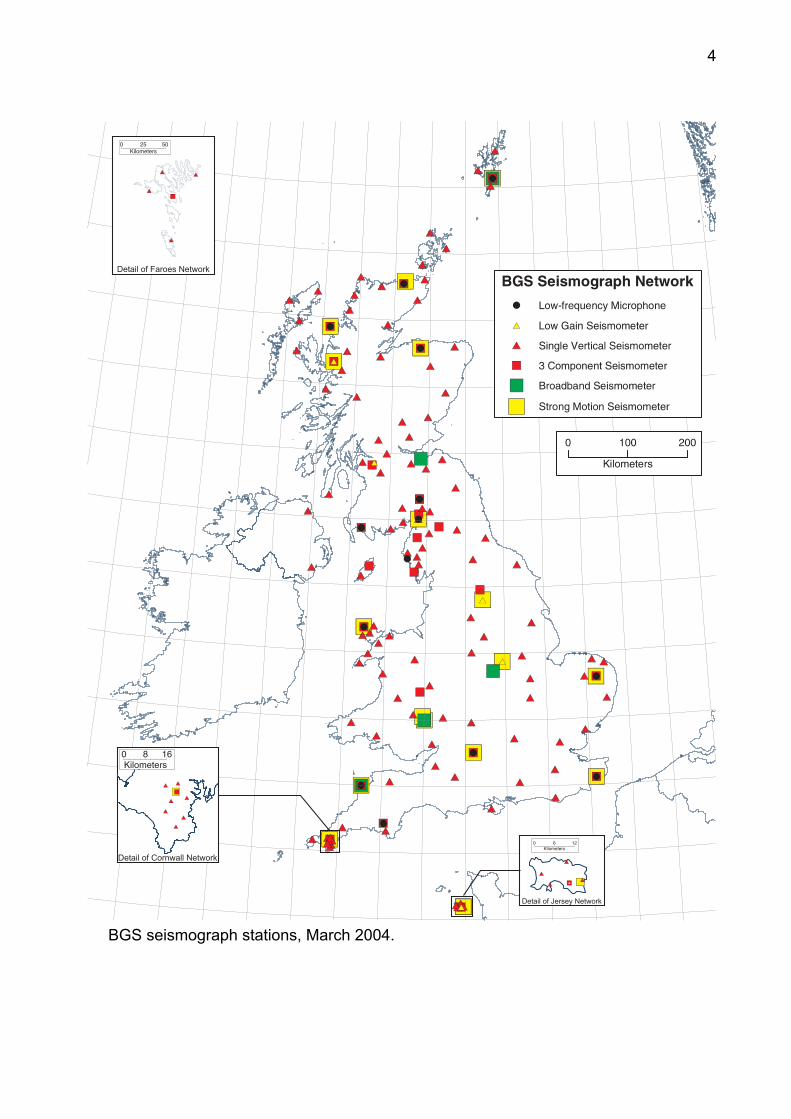
digitally. The system records data continuously, and also creates event-triggered files. The sub-networks are accessed for data transfer from Edinburgh several times a day through Internet or dial-up modems. Once transferred, the events are analysed to provide a rapid response for location and magnitude. At a number of sites, low-gain vertical seismometers are installed to extend the dynamic range of the system to stronger motions, and low frequency microphones are used to aid the discrimination of sonic booms. In addition, strong motion accelerometers have been installed at locations throughout the country and record accelerations up to 0.1g. A number of broadband seismic stations provide data with a larger dynamic range and over a wider frequency band.
4
BGS seismograph stations, March 2004.

5
Achievements
Network Development
Broadband sensors with 24-bit acquisition are being deployed to improve the bandwidth of the data in terms of dynamic range and frequency. This will improve the scientific value of the data and add value to services provided to customers.
Since June 2003, four new broadband stations have been installed at Hartland (North Devon), Lerwick (Shetland), Michaelchurch (Hereford) and Charnwood Forest (Keyworth). Continuous data from Hartland, Lerwick and Charnwood Forest are transmitted in real-time to Edinburgh, where it is archived. Data from the IRIS station at the Eskdalemuir Observatory have also been incorporated into the data stream. Broadband recording uses high dynamic range data acquisition so that recording remains on-scale for a wide range of signals.
Strong motion accelerometers have been deployed alongside the broadband seismometers at Hartland, Lerwick and Michaelchurch, also using high dynamic range acquisition, giving an effective recording range of between 1 µg-0.25 g. Three-component short period sensors at Edinburgh, Eskdalemuir and Paisley have been upgraded to use high-dynamic range, 24-bit, acquisition. A single radio-linked outstation within the LOWNET network around Edinburgh also uses similar technology.

6
Preparing portable recording equipment for deployment.
Plans to upgrade a single sub-network to 24-bit data acquisition and digital telemetry have been revised. The equipment purchased for this can be better used as portable data loggers that can be rapidly deployed to study aftershock sequences and earthquake swarms and to survey areas of specific interest. The importance of collecting data from aftershocks has long been recognised, and was demonstrated during the Manchester
earthquake swarm in 2002, when BGS deployed three temporary stations. The new equipment will allow BGS to deploy up to ten temporary stations, all using 24-bit acquisition, with two of these using three component broadband sensors. Such data can be used to determine precise relative locations for aftershocks and swarms and also investigate rupture processes using empirical Green’s functions.

7
Seismic data acquisition at all sites, except the Borders sub-network, is now based on a PC-platform running QNX, a Unix-like operating system. This offers increased processing power and larger storage capacity of up to one hundred days of continuous data. These large capacity disks help to prevent loss of relevant data if the event-triggered systems miss any events, such as very small earthquakes or sonic booms that are reported and investigated some time after the event. Over the past few years software engineers within the Seismology and Geomagnetism Programme at BGS have developed new data acquisition software, SDAS, that will replace the previously used SEISLOG software. The new software has the important benefit of increased flexibility
and ease of maintenance over the SEISLOG system and has already been deployed to record data at broadband and 24-bit stations. Development in co-operation with the University of Bergen on analysis (SEISAN) and network automation (SEISNET) software has continued. Communication with sites at North Wales, Cornwall, Swindon, Hereford and Paisley has been improved by installation of digital ISDN telephone lines. This allows faster, more reliable data transfer, with the added advantage of being able to use standard Internet protocols for data transfer. Data from Eskdalemuir, Keyworth, Shetland, Hartland and Leeds are now transferred using Internet connections.
LRW 23:06:50.9
EDI 23:06:50.9
CWF 23:06:50.9
MCH 23:06:50.9
HTL 23:06:50.9
23:05:00 :10:00 :15:00
1
2
3
4
5
Time (hr:min:sec)
Broadband recording of the magnitude 6.0 earthquake on 14 April 2004, near Jan Mayen Island in the North Atlantic.
:20:00 :25:00

8
Achievements
Information Dissemination
It is a requirement of the Information Service that objective data and information be distributed rapidly and effectively after an event. Customer Group members have received seismic alerts by e-mail whenever an event was felt or heard by more than two individuals.
Alerts were issued for 17 UK events within the reporting period, five of which were of sonic origin, and for 17 global earthquakes. Typically, the information is provided within two hours of a member of the 24-hour on-call team being notified, and includes earthquake parameters, reports from members of the public, damage and historical setting. In addition, one enquiry was received from a Nuclear Power Station after an alarm triggered, and a response was given within 45 minutes. Information for destructive global earthquakes was provided to the Red Cross, the Department for International Development (DFID) and emergency rescue services.
An up-to-date catalogue of recent events continues to be available on the Seismology web pages. This is updated whenever a new event is located. Preliminary monthly bulletins of seismic information were produced and distributed to the Customer Group within six weeks of the end of each month. The project aim is to publish on CD, the revised annual Bulletin of British Earthquakes within six months of the end of a calendar year. For 2003, it was issued within four months.

90
100
200
300
400
500
600
700
800
900
Depth
Achievements
Collaboration and Data
Data from the seismograph network are freand we have continued to collaborate with institutes within the UK throughout the paswith European and world agencies.
Two long-running projects have ended within the last year. Arrowsmith (2003), University of Leeds, used P-waves from global earthquakes recorded at BGS seismograph stations to construct a three- dimensional image of the upper mantle under the UK using a tomographic inversion scheme. The resulting images suggest the existence of zones of anomalous low velocity under the UK that correlate with gravity anomalies and inferred regions of magmatic underplating of the crust. Tomlinson (2003), University of Leicester, used receiver function analysis of teleseismic data recorded at BGS three-component stations to study the onshore crustal and upper mantle velocity structure of the British Isles. The resulting
cruswithrefleIapebeeat th
(km
)
-600-400-2000200
Distance (km)
SN WO
L
ES
K
RR
R
KA
R
ED
I
CW
F
HP
K
DY
A
JS
A
200km
410km
660km
0
100
200
300
400
500
600
700
800
900
Depth
(km
)
-600-400-2000200
Distance (km)
.
-1200-1000-800 -1200-1000-800
A profile of migrated receiver functions for the British Isles showing Upper Mantle discontinuitiesat 200, 410 and 660 km (Tomlinson, 2003).
Exchange
ely available for academic use researchers at academic t year, as well as exchanged data
tal thickness measurements correlate previous seismic refraction and ction profiles except close to the tus suture. This anomaly has also n attributed to magmatic underplating e base of the crust.
3D view of a volume from 50-600 km depth beneath the British Isles, showing regions of high (blue) and low (red) velocity anomalies, from Arrowsmith (2003)

10
Arup Geotechnics, Imperial College and BGS completed work on UK attenuation relationships, commissioned by British Energy, the main results of which will be presented in Lubkowski et al. (2004). International involvement in the Pproject has continued over the last year. This has been the most ambitious hazard site study ever undertaken, with the exception of the Yucca Mountain project in the USA, and involved seismic hazard determination for four NPP sites in Switzerland, and drew experts from Switzerland, USA, UK, France, GermItaly, Spain and Norway. The projecconcluded in February 2004, althoureview process will continue for someThe PSIGN project, funded by the
EGASOS
seismic
any, t gh the
time.
ing
e
researchers
ber e
ly with
EMSC Members
European Space Agency and involvNigel Press Associates, BGS, Imperial College London and TeleRilevamento Europa (Milan), is drawing to a close in2004. The project aim is to investigate thapplication of new forms of space-based radar remote sensing for studies of tectonics and seismic hazard. A new collaborative study with from the University of Liverpool and Imperial College will begin in Septem2004. A CASE student will use earthquakdata collected by the BGS to derive a new attenuation model for Britain following the approach of Rietbrock (2001). BGS data is exchanged regularEuropean and world agencies to help improve source parameters for
earthquakes outside the UK. As a quid pro quo, BGS receives data for UK earthquakes and world events of relevance to the UK, recorded by many other agencies and institutions. Phase data for global and regional earthquakes are distributed to the European-Mediterranean Seismological Centre (EMSC) to assist with relocation of regional earthquakes and rapid determination of source parameters for destructive earthquakes. Phase data for global earthquakes are sent to the National Earthquake Information Centre (NEIC) at the USGS. Phase data are also made available to the International Seismological Centre, an agency providing definitive information on earthquake hypocentres. Data from the BGS broadband stations are transmitted to ORFEUS, the regional data centre for broadband data, in near real-time.

11
Achievements
Public Understanding of Science An important part of the BGS mission is to disseminate information to the community and promote the public understanding of science. Over the year we have tried to promote our work to as wide an audience as possible, through lectures and presentations, our information booklet, the Internet and media interviews.
A number of lectures and presentations were given to schools, university students and other interested parties, including a lecture by Roger Musson to the House of Commons Earth Sciences Committee on 10 February 2004. The BGS Open Day in September attracted 971 visitors with many of them visiting the interactive earthquake display. An updated earthquake information booklet was produced in August 2003 and is now professionally printed to improve presentation. The booklet provides
information on earthquakes and their causes in a simple and easily digestible form and is being used in school educational packs, at workshops for schools, at various science festival events throughout the country, as well as for general enquiries and requests for information about earthquakes. Over 2000 copies of the latest version have been distributed. A PDF version of the document is also available for download from the Seismology web site.

12
The Seismology web site continues to be widely accessed, with over 284,000 visitors (1.5 million hits) logged. The most popular pages are the “Recent Events” pages. An online macroseismic questionnaire will allow users to enter information for earthquakes that they have experienced. Data entered will be automatically processed to produce macroseismic maps. The main BGS web server now hosts an interactive mapping tool that allows users to view UK seismicity and query the database for information about events in user selected areas. Helicorder plots of continuous data from broadband stations are also available on the Seismology web pages. BGS remains a principal point of contact for the public and the media for information on earthquakes and seismicity, both in the UK and overseas. Although 2003-2004 has been a quieter than last year, 579 enquiries were answered. Some151 of
these were from the media, including 8for TV and radio broadcasts following significant earthquakes. The broadcaenquiries led
0
sting to 16 TV and 29 radio
interviews.
70
80 Enquiry
InterviewNewspaper
71
Radio
T V
20
40
30
10
16 29
50
21
14
60

13
Seismic Activity The details of all earthquakes, felt explosions and sonic booms detected by the network have been published in monthly bulletins and, after final revision, in the BGS Annual Bulletin for 2003 published and distributed in April 2004 (Simpson, 2004).
There were 146 earthquakes located by the monitoring network during the year, with 32 of them having magnitudes of 2.0 ML or greater. Ten events with a magnitude of 2.0 ML or greater were reported, together with a further 14 smaller ones, bringing the total to 24 felt earthquakes in 2003. The largest onshore earthquake had a magnitude of 3.2 ML and occurred near Aberfoyle on 20 June. The largest offshore earthquake occurred in the Northern North Sea on 15 December, with a magnitude of 3.9 ML. It was located approximately 265 km east of Lerwick, Shetland Islands. The spatial distribution of seismicity generally reflects that observed in the instrumental catalogue as a whole, with the majority of earthquakes occurring in and
around Wales, Cornwall, the Midlands, Cumbria and the Scottish Borders and in western Scotland. There was also activity in the northern and southern North Sea. No events were recorded in southeast England, Ireland, the Grampian region of Scotland or the Outer Hebrides. Historically, southeast England has been active but Ireland and northeast Scotland have rarely experienced events in the past. In the following sections, we provide more detailed reports of two interesting earthquake sequences in Aberfoyle, Perthshire, and Bridgwater (2004), Somerset (an area where there has been little historical precedent of similar activity), and also on two destructive global earthquakes.

14
Epicentres of all UK earthquakes located in 2003.

15
56
57
58
Seismic Activity
Aberfoyle
A sequence of 11 earthquakes occurred between 20 June and 15 September 2003, about 3.5 km southwest of Aberfoyle. Eight of the events were felt locally with maximum intensities of 3 EMS (European Macroseismic Scale). The epicentres fall into the Highland Boundary Fault Zone (HBFZ), a major tectonic boundary that extends across the entire width of Central Scotland in a NE-SW direction.
The HBFZ is a complicated structure, which appears to have been active into late Palaeozoic times. Palaeo-seismic faulting in the Aberfoyle district was predominantly reverse, however, both normal and strike-slip faulting are also observed. Both the Loch Tay Fault north of Aberfoyle and the Loch Ard Fault to the west have shown significant sinistral
strike-slip movement of the order of several kilometres. A number of more southerly trending faults are found between the two structures. Historically (pre 1921), a significant number of earthquakes had been felt around Comrie, the largest was the 4.8 ML event in 1839 (Musson, 1993). More recently, an earthquake on 16 September 1985 near Dunoon occurred near the HBFZ at a depth of about 6.5 km (Redmayne and Musson, 1987). Visual inspection of the seismograms recoded from earthquakes in the sequence indicated a high degree of similarity between the individual events, suggesting that the events were located within a small source volume and had similar source mechanisms. Phase arrivals were then determined by cross-correlation of a master event with the remaining events. Assuming that the correlation is high, travel times are more accurate and consistent between events of the sequence than those obtained through manual analysis of the individual events (e.g., Schaff and Richards, 2004).
0PCA/shz03Jun2006:44:08.9
0PCA/shz03Jun2006:53:13.7
0PCA/shz03Jun2009:03:16.7
0PCA/shz03Jun2310:04:57.5
0PCA/shz03Jun2511:53:44.2
0PCA/shz03Jun2609:57:02.4
0PCA/shz03Jun2702:09:21.1
0PCA/shz03Jun2702:11:31.0
0PCA/shz03Jun2703:12:46.1
0
PCA/shz
03Aug23
03:35:09.5
0
PCA/shz
03Sep15
08:00:38.1
:19.4 :19.5 :19.6 :19.7 :19.8 :19.9 :20.0
Time (hr:min:sec)
-7 -6 -5 -4 -3 -2
55
ELO
EAU
EDIPCO
PCA
PMS
MCD
MDO
ESY
KAR
KPL
BWH
GMK

16
The distribution of events and recording seismic stations suggested that relative locations of the events could be improved using Joint Hypocentre Determination (JHD), (Pujol, 2000). For such clusters of events, JHD can lead to improved relative event locations by simultaneous inversion for earthquake hypocentres and station corrections. The relocated epicentres (red) follow a clear alignment in SW-NE direction with hypocentral depths of about 4 km. The width of the source zone in the NW-SE direction is of the order of 100 m while the length is about 900 m in the SE-NW direction. Based on these dimensions, the relative error between events of the sequence in all three dimensions was assumed to be less than 100 m. Formal errors for the largest event in the sequence were 3.1 km in longitude and 1.3 km in latitude based on single event location (Lienert and Havskov, 1995). This represents the error in absolute location for the whole sequence. The improvement of relative event locations due to the cross-correlation and JHD was a factor of about 10. As expected from such similar waveforms, there was a match in first motion polarities between the events that allowed a joint
focal mechanism to be determined using the grid-search method of Snoke et al. (1984). The nodal planes for the best fitting solution strike either WSW-ENE and dip to the NW, with both left-lateral and normal movement, or strike NNW-SSE and dip east with both right-lateral and normal movement. The alignment of the events in the SW-NE direction is a reasonable match for the first nodal plane, suggesting this is the actual fault direction. Event alignment is also in keeping with the strike direction of the HBF, which lies about 1.5 km south. The HBF is assumed to dip to the NW, which agrees with the focal mechanism. While it appears that the events fall onto the HBF, they can possibly be attributed to a smaller parallel structure. The Loch Tay fault, another major feature, strikes in the SSW-NNE direction, however, near Aberfoyle it may be parallel to the HBF before joining it south of Aberfoyle near the epicentral area. The axis of maximum horizontal compression indicated by the focal mechanism points SSW, in disagreement with the regional stress pattern (compression in NW-SE direction) possibly indicating local variation from the regional stress pattern. It is most likely that earthquakes near Aberfoyle are the consequence of local stress adjustments and not a reactivation of the HBF.
0 10 205 k
Highland BoundaryFault (HBF)
Highland
P
m
BoundaryFault (HBF)
Loch TayFault
Loch TayFault
T
17
Seismic Activity
Bridgwater
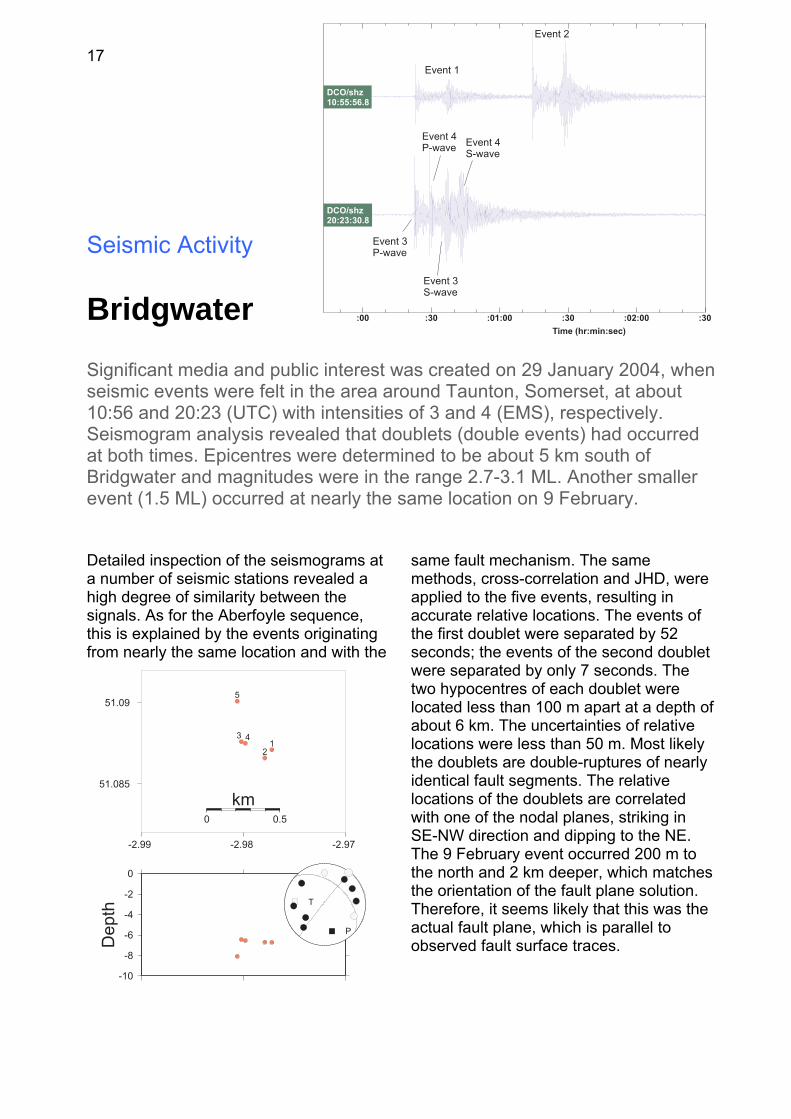
Significant media and public interest was created on 29 January 2004, when seismic events were felt in the area around Taunton, Somerset, at about 10:56 and 20:23 (UTC) with intensities of 3 and 4 (EMS), respectively. Seismogram analysis revealed that doublets (double events) had occurred at both times. Epicentres were determined to be about 5 km south of Bridgwater and magnitudes were in the range 2.7-3.1 ML. Another smaller event (1.5 ML) occurred at nearly the same location on 9 February.
Detailed inspection of the seismograms at a number of seismic stations revealed a high degree of similarity between the signals. As for the Aberfoyle sequence, this is explained by the events originating
same fault mechanism. The same methods, cross-correlation and JHDapplied to the five events, resulting in accurate relative locations. The eventsthe first doublet were separated by 52 seconds; the events of the second doubwere separated by only 7 seconds. The two hypocentres of each doublet were located less than 100 m apart at a deptabout 6 km. The uncertainties of relative locations were less than 50 m. Most likelythe doublets are double-ruptures of nearly identical fault segments. The relative locations of the doublets are correlatewith one of the nodal planes, striking in SE-NW direction and dipping to the NE. The 9 February event occurred 200 m to the north and 2 km deeper, which matchethe orientation of the fault plane solution. Therefore, it seems likely that this was theactual fault plane, which is parallel to observed fault surface traces.
, were
from nearly the same location and with the
of
let
h of
d
s
DCO/shz10:55:56.8
DCO/shz20:23:30.8
:00 :30 :01:00 :30 :02:00 :30
Time (hr:min:sec)
Event 1
Event 2
Event 3S-wave
Event 4P-wave
Event 4S-wave
Event 3P-wave
-2.99 -2.98 -2.97
51.085
51.09
0 0.5
km
12
3 4
5
-10
-8
-6
-4
-2
0
Depth
P
T

18-600000
-400000
-200000
0
200000
400000
600000
EDI/bhz18:46:32.0
-400000
-200000
0
200000
400000
EDI/bhn18:46:32.0
-400000
-200000
0
200000
400000
EDI/bhe18:46:32.0
18:48:00 :50:0
1
2
3
Seismic Activity
Global Earthquakes The UK monitoring network detects large earthquworld, depending on the event size and epicentrasuch earthquakes can be used to provide valuabproperties of the crust and upper mantle under thto improve location capabilities for local earthqua2003 to March 2004, a total of 369 teleseismic eand analysed.
On 21 May at 18:44 UTC a magnitude 6.8 earthquake struck northern Algeria. The earthquake occurred in the boundary region between the Eurasian plate and the African plate. At this section of the plate boundary the African plate is moving northwest into the Eurasian plate at approximately 6 mm per annum. The resulting compression leads to both thrust and strike-slip faulting. At least 2,266 people were killed and 10,261 injured, along with 150,000 left homeless. The total damage is estimated to exceed $100 million. On December 26 at 01:56 UTC a magnitude 6.6 earthquake struck the city of Bam, 990 km southeast of Tehran, Iran. The source mechanism is consistent with right lateral strike-slip motion on the Bam fault, on which surface faulting was
observed. major nortfaults that collision ofplates anddestructivelatest estimBam earthand appro85% of thethe surrou75,000 peoto buildingthe epicendevastatedwere destrareas healdead or mprovided w
0 :52:00 :54:00
Time (hr:min:sec)
Broadband recording of the magnitude 6.8 earthquake innorthern Algeria.
akes from around the l distance. Recordings of le information on the e UK, which, in turn, helps kes. During the period April
arthquakes were detected
This fault is part of a zone of h south, right lateral, strike-slip accommodate strain from the the Arabian and Eurasian has been responsible for earthquakes in the past. The ate of the casualties from the
quake stands at 26,000 dead ximately 30,000 injured. Over buildings collapsed in Bam and
nding area, leaving an estimated ple homeless. Serious damage
s extended nearly 90 km from tre. Schools and hospitals were , and almost all health facilities oyed, and nearly 50% of the th workers were reported either issing. Many wells, which ater, were also damaged.

19
-2˚ 16' -2˚ 14' -2˚ 12' -2˚ 10' -2˚ 08' -2˚ 06'
53˚ 28'
53˚ 30'
C
D
0
1
2
3
4
5
6
Dep
th (
km)
2 4 6 8 10Distance (km)
C D
Scientific Objectives
Distribution of UK Seismicity
The UK is a country of low to moderate seismicity and the spatial distribution of earthquakes is generally diffuse, though with some regional variation. Seismicity does not appear to be based on individual major active faults, as is the case around plate boundaries, and there is no clear relationship between tectonic province and the spatial distribution of seismicity. Our aim is to apply new methods to improve relative locations within the earthquake catalogue and try to relate earthquake activity to geological features.
No British earthquake recorded either historically or instrumentally has produced a surface rupture and typical fault dimensions for UK earthquakes are of the order of 1-2 km, therefore, it is difficult to accurately map earthquakes to specific faults, particularly at depth, where the fault distributions and orientations are unresolved. However, recent studies such as those discussed previously for the Aberfoyle and Bridgwater earthquakes and also for the Manchester earthquakes of 2002, have shown how improvements can be made in relative earthquake locations that may allow earthquake activity to be more accurately related to geological features
and improve our understanding of earthquake activity in the UK. Analysis of earthquakes from the Manchester swarm of 2002 has shown that over 50% of the recorded events are highly correlated with at least one other earthquake in the sequence. Such events must be very closely located with similar source mechanisms (Schaff and Richards, 2004) and this allows us to use cross-correlation with a “Master” event to determine consistent phase arrivals for the events in a group. The revised phase data are then used to obtain more accurate relative locations through joint hypocentral determination (Pujol, 2000).

20
Scientific Objectives
Attenuation of Seismic Waves
Understanding the strength of seismic wave attenuation (the amplitude decay with distance) is important for seismic hazard assessment. But, until now, the strength of attenuation in the UK has not been measured successfully, and many studies have assumed it to be weak, in keeping with other stable continental regions.
Recordings of Lg-waves from 13 larger UK earthquakes were used to examine the decay of amplitude with distance. Lg-waves are S-waves that are multiply reflected and trapped in the crust, and are usually observed on seismograms out to distances of several thousand kilometres. The decay of the spectral amplitude with distance was quantified over a range of frequencies, and a standard attenuation function was fitted to the results. At frequencies below 4 Hz, the attenuation in the UK is similar to measurements for eastern North America and the Baltic
Shield. Above 4 Hz, the amplitude decay is comparable to that observed in California and the west coast of Central America, which are both tectonically active regions. This result is substantiated by work on amplitude corrections used for estimating magnitude in the UK, which also shows that at high frequencies attenuation is similar to that measured in California. We are now in the process of examining the attenuation of peak ground motion in the UK. Initial findings suggest that the decay of peak ground acceleration in the UK and southern Europe is comparable.
Observed (green) and modelled (red) spectra at three stations for the Dudley earthquake.

21
Scientific Objectives
Intensity Attenuation
A revised intensity attenuation relationship has been developed for the UK, using all currently available macroseismic data, including results from the Penzance, Arran, Warwick, Melton Mowbray and Dudley earthquakes, that have occurred post 1993, and also some earlier events such as the Carlisle and Bishop’s Castle earthquakes, for which complete macroseismic studies were not previously available. Improved data for some historical UK events are also used.
A study of intensity attenuation in the UK was made in 1993, which resulted in an equation relating expected intensity to distance and magnitude. Since 1993, substantially more macroseismic data have become available for the UK, especially from modern earthquakes that have been surveyed in detail. New analysis has been carried out, based on isoseismal data rather than individual data points, as the latter are biased by population distributions, and has led to a revised attenuation relationship, given by the equation I = 3.31 + 1.28 M – 1.22 ln R where I is intensity in EMS (European Macroseismic Scale), M is local magnitude and R is hypocentral distance in km. Predictions made by the new equation, compared to those of the previous 1993 study are shown at the top of the page. Curves are plotted for three magnitudes, assuming a focal depth of 12 km. In the
magnitude-distance range where data are best constrained (4-5 ML, out to about 40 km) there is not much difference between the two studies, but the recent one indicates slightly slower attenuation with distance and thus higher intensities at longer distances. Larger earthquakes are predicted to have slightly lower maximum intensities. The revised equation has several applications. Firstly, it can be used to estimate the effects of possible significant UK events in the future. Secondly, it can be used for hazard and risk studies using intensity in place of physical ground motion parameters. While such studies cannot be used for engineering design purposes, they are useful if one wishes to estimate the probability of earthquake damage to property. Thirdly, intensity attenuation is useful in studies comparing computed hazard values with historical experience at a given site.
22
IntensityValue
6.5
3.5
The expected strength of earthquake shaking with a 10 per cent probability ofbeing exceeded in the next 50 years.
23
0 100 200 3
0
20
40
60
80
Depth
(km
)
6.2
6.25
6.4
6.45
6.98
7.0
8.0
8.2
8.4
6.05
5.65.65.86.0
Scientific Objectives
Crustal Structure Most of the published information on seismic velocity structure in the UK has been obtained from large-scale seismic refraction and wide-angle reflection surveys for example Bamford et al. (1978) and Bott et al. (1985). Models used by BGS for locating earthquakes are generally derived from such sources and define velocity as a function of depth in a number of discrete areas. However, transitions between different models do not necessarily correspond to structural boundaries and the models themselves do not account for lateral variations in the earth. P- and S-wave travel times for local seismic events recorded on the BGS seismograph network are being used to
jointly invert for earand crustal velocitieand obtain more apvelocity models for These regional modstarting point for loctomography (Thurbconstruction of threof the crust under thStation corrections for the Eskdalemuirstation contributingmonitoring networkvariance techniquebeen used to determcorrections that impmagnitude estimaterecorded at differen
Seismotectonics and Stress Accurate determination of the regional stress tensor in a given area is desirable for understanding the driving forces of current deformation. At plate boundaries stress regimes are generally straightforward, however, in intra-continental areas where there have been multiple episodes of deformation, the driving forces of deformation are less obvious. For example, causes of tectonic stress in the UK may comprise of a combination of ridge push from the Mid-
Atlantic Ridge, uplifsedimentary loadinFault plane solutionearthquakes can beorientation of the stpart of the crust (Zoaim of the current searthquake focal mthe homogeneity ofthe UK and invert thmake an estimate otensor.
Moho
6.05.85.8
6.06.0
8.0
8.4
6.98
7.01
7.01
6.98
6.45
6.4
5.8
6.25
6.25
6.3
6.3
8.2
Model of crustal structure under LISPB profile (Bamford et al., 1978).
00 400 500 600 700
thquake hypocentres s (Kissling et al., 1994), propriate regional earthquake location. els will be used as a al earthquake er, 1993) and the e-dimensional images e UK.
have been determined seismic array, the UK to the global CTBT , using an analysis of . The same method has
ine amplitude rove the consistency of s of UK events t stations.
t from de-glaciation and g. s for naturally occurring used to constrain the ress tensor in the brittle back et al., 1989). The tudy is to use echanisms to examine the stress field within ese observations to f the best-fitting stress

24
Focal mechanisms for selected UK earthquakes with magnitude 3.0 ML and greater.

25
Acknowledgements This work would not be possible without the continued support of the Customer Group. Station operators and landowners throughout the UK have made an important contribution and the BGS technical and scientific staff have been at the sharp end of the operation. The work is supported by the Natural Environment Research Council and this report is published with the approval of the Executive Director of the British Geological Survey (NERC).
References Bamford, D., Nunn, K., Prodehl, C. & Jacob, B., 1978. LISPB-IV. Crustal structure of northern Britain. Geophys. J.R. Astr. Soc., 54, 43-60. Bott, M.H.P., Long, R.E., Green, A.S.P., Lewis, A.H.J., Sinha, M.C., & Stevenson D.L., 1985. Crustal structure south of the Iapetus Suture beneath northern England, Nature, 314, 724-727. Kissling, E., Ellsworth, W.L., Eberhart-Phillips, D., and U. Kradolfer (1994) Initial reference models in local earthquake tomography, J. Geophys. Res., 99, 19635-19646. Lienert, B.R.E., and J. Havskov (1995). A computer program for locating earthquakes both locally and globally, Seis. Res. Lett., 66, 26-36. Musson R. M. W. (1993). Comrie: A historical Scottish earthquake swarm and its place in the history of seismology, Terra Nova, 5, 477-480. Pujol, J. (2000) Joint event locations - The JHD technique and applications to data from local seismic networks, in C.H. Thurber and N. Rabinowitz (Eds) Advances in seismic event location, Kluwer Academic Publishers, 163-204. Redmayne, D.W., and R. Musson (1987). The Dunoon earthquake of 16 September 1985, British Geological Survey, Global Seismology, Report No 311. Schaff, D.P. and Richards, P.G. 2004. Repeating seismic events in China. Science, 303, 1176-1178. Thurber, C. H. 1993. Local earthquake tomography; velocities and Vp / Vs ; theory. In: Seismic tomography; theory and practice, Iyer, H.M. and Hirahara, K. (Eds), 563-583, Chapman and Hall. London, United Kingdom. Zoback, M.L., Zoback, M.D., Adams.J, Assumpcao, M., Bell, S., Bergman, E.A., Bluemling, P., Brereton, N.R., Denham, D., Ding, J., Fuchs, K., Gay, N., Gregersen, S., Gupta, H.K., Gvishiani, A., Jacob, K., Klein, R., Knoll, P., Magee, M., Mercier, J, L., Mueller, B.C., Paquin, C., Rajendran, K., Stephansson, O., Suarez, G., Suter, M., Udias, A., Xu, Z.H., Zhizin, M. 1989. Global patterns of tectonic stress, Nature, 341; 6240, 291-298. Lubkowski, Z., Bommer, J., Baptie, B., Bird, J., Douglas, J., Free, M., Hancock, J., Sargeant, S., Sartain, N. and Strasser, F. 2004. An evaluation of attenuation relationships for seismic hazard assessment in the UK, 13th World Conference on Earthquake Engineering, Vancouver, B.C., Canada.

26
Appendix 1 The Project Team
Computing Support
Simon Flower
Dave Scott
Senior Software Engineer
Software Engineer
Software Engineer
Technical Operations
John Laughlin
Dave Stewart
Tom Alexander
Heiko Buxel
Daniel Dawes
Willie Velzian
Senior Electronics Engineer
Senior Field Engineer
Field Engineer
Field Engineer
Field Engineer
Electronics Engineer
Glenn Ford
Davie Galloway
Bennett Simpson
Seismologist
Seismologist
Seismologist
Seismologist
Research
Roger M W Musson
Lars Ottemoller
Susanne Sargeant
Seismic Hazard
UK & Regional seismicity
Seismic Hazard
Brian Baptie Project Leader
BGS Seismic Monitoring and Information Service
David J Kerridge Programme Leader
Programme Secretary
Consultants
Analysis Team
Julian Bukits
Freya Lawrie
Margaret Milne

27
Appendix 2 Publications BGS Internal Reports
Baptie, B., Ottemoller, L., Sargeant, S., Ford, G. and O’Mongain A. 2003. The Dudley Earthquake of 22 September, 2002. BGS Internal Report IR/03/113. Booth, D.C., 2003. Distance and station effects on UK shear- and Lg-wave amplitudes recorded in the range 0-600km, BGS Technical Report No. IR/03/55, 21 pp. O'Mongain, A.M., 2004. Seismological Calibration of Arrays, BGS Technical Report No. IR/04/056, 23 pp. Walker, A., Baptie, B. and Ottemöller, L. 2003. Earthquake Monitoring 2002/2003, BGS Seismic Monitoring and Information Service, Fourteenth Annual Report, BGS Internal Report IR/03/67. Simpson, B.A. (ed), 2004. Bulletin of British earthquakes 2003, BGS Report CR/04/074N. In addition, four confidential reports were prepared and bulletins of seismic activity were produced monthly, up to six weeks in arrears for the Customer Group.
External Publications
Baptie, B. and Ottemöller, L. 2003. The Manchester Earthquake Swarm of October 2002, in Geophysical Research Abstracts, Proceedings of the EGS-AGU-EUG Joint Assembly, Nice. Cecić, I., and Musson, R.M.W., 2004. Macroseismic surveys in theory and practice, Natural Hazards, vol 31, pp 39-61. Havskov, J., J.A. Peña, J.M. Ibáñez, L. Ottemöller and C. Martínez-Arévalo, 2003. Magnitude Scales For Very Local Earthquakes: Application For Deception Island Volcano (Antarctica), Journal of Volcanology and Geothermal Research, vol 128, pp. 115-133. Jackson, P., Gunn, D., Long, D., Musson, R.M.W., Lovell, M., Rees, J., Rochelle, C., Bateman, K., Hobbs, P., Nelder, V., 2004. Slope stability issues in hydrate bearing sediments under seismic loading, in Book of Abstracts, Oceanology International 2004 16-19 March 2004, London. Koravos, G.C., Main, I.G., Tsapanos, T.M. and Musson, R.M.W., 2003. Perceptible earthquakes in the broad Aegean area, Tectonophysics, vol 371, pp 175-186. Musson, R.M.W., Haynes, M., Bommer, J.J. and Ferretti, A., 2003. PSInSAR as a resource for tectonic modelling in subduction areas, in Book of Abstract, IUGG 2003 Sapporo, Japan, pB.471. Musson, R.M.W., 2003. Joint solution of seismicity parameters for seismic source zones through simulation, in Book of Abstract, IUGG 2003 Sapporo, Japan, pB.510. Ottemöller, L., H. H. Nielsen, K. Atakan, J. Braunmiller and J. Havskov, Ekofisk seismic event of May 7, 2001, in Book of Abstract, IUGG, Sapporo, Japan, 2003. Ottemöller L. and B. Baptie, The Dudley and Manchester earthquakes in 2002, in Book of Abstract, 34th Nordic meeting on Detection Seismolgy, Flam, Norway, 2003.
28
Appendix 3 Publication Summaries The Manchester Earthquake Swarm of October 2002 B. Baptie and L. Ottemöller
An earthquake sequence started in the Greater Manchester area of the United Kingdom on October 19, 2002. This has continued to the time of writing and has consisted of more than 100 discrete earthquakes. Three temporary seismograph stations were installed to supplement existing permanent stations and to better understand the relationship between the seismicity and local geology. Due to the urban location, these were experienced by a large number of people. The largest event on October 21 had a magnitude ML 3.9. The activity appears to be an earthquake swarm, since there is no clear distinction between a main shock and aftershocks. However, most of the energy during the sequence was actually released in two earthquakes separated by a few seconds in time, on October 21 at 11:42. Other examples of swarm activity in the UK include Comrie (1788-1801, 1839-46), Glenalmond (1970-72), Doune (1997) and Blackford (1997-98, 2000-01) in central Scotland, Constantine (1981, 1986, 1992-4) in Cornwall, and Johnstonbridge (mid1980s) and Dumfries (1991,1999). The clustering of these events in time and space does suggest that there is a causal relationship between the events of the sequence. Joint hypocenter determination was used to simultaneously locate the swarm earthquakes, determine station corrections and improve the relative locations. It seems likely that all events in the sequence originate from a relatively small source volume. This is supported by the similarities in source mechanism and waveform signals between the various events. Focal depths were found to be very shallow and of the order of about 2-3 km. Source mechanisms determined for the largest of the events show strike-slip solutions along either northeast-southwest or northwest-southeast striking fault planes. The surface expression of faults in the epicentral area is generally northwest-southeast, suggesting that this is the more likely fault plane.
The Dudley Earthquake of 22 September, 2002 B. Baptie, L.Ottemöller, S.Sargeant, G Ford and A. O’Mongain
The 4.7 ML Dudley earthquake on 22 September 2002 at 23:53 (UTC) was widely felt throughout England and Wales and was the largest earthquake to occur onshore in the United Kingdom (UK) since the magnitude 5.1 ML Bishop's Castle earthquake in 1990. The earthquake hypocentre, determined from inversion of observed P- and S-wave travel-time data suggests a source depth of 14 km and this depth estimate is also supported by forward modelling of observed waveforms. Focal mechanisms obtained from both first motion polarities of local observations and moment tensor inversion of regional observations show left-lateral, strike-slip faulting along a near vertical, near north-south striking fault plane whose orientation is in good agreement with the surface expression of the observed faults in the region. Two aftershocks were recorded within the location error ellipsoid of the mainshock. Comparison of the waveform signals revealed that the mainshock and aftershocks were nearly co-located and possibly had the same source mechanism. The observed peak ground acceleration is found to be less than that predicted using empirical relations, which have been considered applicable in the UK. Seismic moment M0 and stress drop ∆σ were measured from on-scale records where Lg arrivals were clear, and then used to give better estimates of the peak ground accelerations using a stochastic approach.
Distance and station effects on UK shear- and Lg-wave amplitudes recorded in the range 0-600km D. C. Booth
The amplitudes of shear-waves and Lg-waves recorded at UK seismograph stations from local earthquakes in the range 0-600km have been subjected to an analysis of variance, allowing separation of the effects of earthquake size, distance and local attenuation near each station. The analysis of 385 amplitude readings at 28 stations from 39 earthquakes showed that the effects of both distance and station attenuation were statistically significant. Tables of corrections for both distance and station effects have been derived to allow local magnitude ML to be determined more accurately from horizontal and vertical component records. One set of tables allows the estimation of an ML which is consistent with the original Richter definition of ML, with a standard deviation which is smaller than that produced by the theoretical attenuation curve, defined according to attenuation in Southern California, which has customarily been used to calculate ML for seismic events in the UK. The improvement in accuracy is mainly due to the

29
incorporation of station terms to correct for near-station attenuation, since the theoretical and observed variations of attenuation with distance are similar. This similarity implies that Southern California and the UK show a similar variation of distance-dependent attenuation, a surprising result in view of the differences in geology. Another set of tables will produce an ML which is consistent with the body wave magnitude mb determined by the International Data Centre (IDC) from station records of the Comprehensive Test-Ban Treaty Organisation’s global monitoring network. These local magnitude estimates are consistently closer to mb (IDC) estimates than the UK bulletin estimates of local magnitude which are made with a standardised amplitude-distance curve and no station correction.
Macroseismic Surveys In Theory And Practice, Natural Hazards Cecić and R.M.W. Musson
Macroseismology is the part of seismology that collects and evaluates non-instrumental data on earthquakes, i.e. effects on people, objects, buildings and nature. The methods that seismologists use for collecting and evaluating the macroseismic data are often based on long (trial-and-error) experience more than on some formal procedure. Until very recently manuals or guidelines on how to do a macroseismic survey were rare and often superficial. After an earthquake is felt in some region, the data are usually collected by means of questionnaires. Field survey is an obligatory tool that complements the questionnaires in the case of a damaging earthquake. An overview of the approaches to deriving the earthquake parameters (epicentre and barycentre, epicentral intensity, magnitude, depth, source parameters) from macroseismic data, as well as a review of some existing practices is given.
Magnitude Scales For Very Local Earthquakes: Application For Deception Island Volcano (Antarctica) J. Havskov ,J.A. Peña, J.M. Ibáñez, L. Ottemöller and C. Martínez-Arévalo
Different magnitude scales are calculated for a set of volcano-tectonic earthquakes recorded in Deception Island Volcano (Antarctica). The data set includes earthquakes recorded during an intense seismic series that occurred in January–February 1999, with hypocentral distances that range between 0.5 and 15 km. This data set is enlarged to include some regional earthquakes with hypocentral distances up to 200 km. The local magnitude scale, ML, fixed at a hypocentral distance of 17 km, is used as the reference for the other magnitude scales studied in the present work. ML is determined on a standard Wood–Anderson simulated trace assuming a gain of 2080. Maximum peak-to-peak amplitudes are measured on the vertical components of a short-period sensor. The Mw scale is calculated, in the vertical component, both for P and S waves. The attenuation correction of the ground motion displacement spectra is introduced using data from coda waves studied in the area. The comparison between ML values and Mw estimations indicates severe discrepancies between both values. A magnitude–duration scale is calibrated from the comparison between coda durations of the recorded events and their assigned local magnitude scales. In order to investigate the causes of the discrepancy between the ML and Mw values we analyze two possible error sources: a wrong coda Q value, or the effects of the near-surface attenuation that initially are not taken into account in the correction of the ground displacement spectra. The analysis reveals that the main cause of this discrepancy is the effect of the near-surface attenuation. The near-surface attenuation is also the cause of the determination of an anomalous spectral decay slope, after the corner frequency, and the determination of this corner frequency value. This near-surface attenuation, represented by , is estimated over the data set, obtaining an average value of 0.025. With this value, the Mw scale is recalculated using an automatic algorithm. The new Mw values are more consistent with the ML values, obtaining a relationship of Mw=0.78ML-0.02.
Slope Stability Issues In Hydrate Bearing Sediments Under Seismic Loading P. Jackson, D. Gunn, D. Long, R.M.W. Musson, M. Lovell, J. Rees, C. Rochelle, K. Bateman, P. Hobbs and V. Nelder
While there is debate concerning total gas-hydrate reserves, researchers have suggested boundary surfaces of stable hydrates are far larger than originally anticipated. Recently, a theoretical basis has begun to emerge supporting the hypothesis that pore pressures may increase on hydrate dissociation. Therefore, re-assessment of risk (e.g. earthquake triggers) to seafloor installations is required. Typically, regional seismic assessments exclude site-scale sediment property data. Consequently, the potential for underestimating risk is significant, particularly when shear strengths are reduced by increased pore
30
pressure. This suggests, for example, there is a need for improved geophysical and geotechnical property-models for sediment-hosted methane-hydrates.
Perceptible Earthquakes In The Broad Aegean Area G.C. Koravos, I.G. Main, T.M. Tsapanos and R.M.W. Musson
A probabilistic estimate of seismic hazard can be obtained from the spatial distribution, of earthquake sources, their frequency–magnitude distribution and the rate of attenuation of strong ground motion with distance. We calculate the earthquake perceptibility, i.e. the annual probability that a particular level of ground shaking will be generated by earthquakes of particular magnitude, by weighting frequency–magnitude data with the predicted felt area for a given level of ground shaking at a particular magnitude. This provides an earthquake selection criterion that can be used in the anti-seismic design of non-critical structures. We calculate the perceptibility, at a particular value of isoseismal intensity, peak ground acceleration and velocity, as a function of source magnitude and frequency for the broad Aegean area using local attenuation laws. We use frequency–magnitude distributions that were previously obtained by combining short-term catalogue data with tectonic moment rate data for 14 tectonic zones in Greece with sufficient earthquake data, and where contemporary strain rates are available from satellite data. Many of the zones show a `characteristic earthquake' distribution with the most perceptible earthquake equal to the maximum magnitude earthquake, but a relatively flat perceptibility between magnitudes 6 and 7. The maximum perceptible magnitude is in the fastest-deforming region in the middle of the Aegean sea, and tends to be systematically low on the west in comparison to the east of the Aegean sea. The tectonic data strongly constrain the long-term recurrence rates and lead to low error estimates (±0.2) in the most perceptible magnitudes.
PSInSAR As A Resource For Tectonic Modelling In Subduction Areas R.M.W. Musson, M. Haynes, J.J. Bommer, and A. Ferretti
PSInSAR is a new technique for Earth Observation derived land motion measurement which relies on permanent scatterers, and offers the possibility of measurements of ground displacements to a degree of accuracy, and over periods of time, previously unobtainable from conventional interferometry. This technique has been developed by TeleRilevamento Europa of the Politecnico di Milano in Italy. By using at least 30 satellite radar scenes of the same place acquired over many years, a network of highly reflective pre-existing ground features (permanent scatterers) are identified against which sub-mm measurements of motion can be made. These permanent scatterers can be any large, permanent angular object, such as building roofs, metallic structures, and even large boulders. Using these data, very accurate displacement histories can be obtained for the period 1991 to the present. Calibration with GPS data show good agreement, but the PSInSAR data are less noisy. A unique attribute of PSInSAR is that the history of displacements over the last nine years (length of the SAR data archive) can be extracted for any part of the globe with data coverage. We present here the results of a test monitoring study for the Tokai area of Japan. The data are similar to those derived by other means (GPS, levelling) but much denser (291,000 data points between Hamamatsu and Ito). Such data provide a resource for studies such as the modelling of impending subduction earthquakes using the ABIC method. This work results from a European Space Agency (ESA) 'Earth Observation Market Development' project entitled 'Developing markets for EO-derived land motion measurement products', involving, NPA (lead), the British Geological Survey (UK), Imperial College (UK), TeleRilevamento Europa (Italy), ImageONE (Japan), the Geographic Survey Institute (Japan), Oyo Corporation (Japan), Fugro (Netherlands) and SARCOM (ESA data distributing entity).
Joint Solution Of Seismicity Parameters For Seismic Source Zones Through Simulation R.M.W. Musson
A key issue in seismic hazard modelling is determining seismicity parameters for each source zone in a given model. The three main parameters are the activity rate, the b-value (slope of the Gutenberg-Richter magnitude-frequency curve), and the maximum magnitude. Procedures for estimating these vary from study to study; in recent years the application of maximum likelihood methods, with or without priors, seems to be the most favoured approach. A new approach is presented here, based on Monte Carlo methods, which solves for all three parameters simultaneously. The conceptual basis is as follows: there exists some “true” set of values for a, b and Mmax that governs the long-term occurrence of earthquakes in a zone. Take three values for a, b and Mmax at random and use them to generate a synthetic earthquake

31
catalogue, subject to the same historical constraints as the real catalogue. Is the resulting synthetic catalogue similar to the real one? If so, the a, b and Mmax values are credible. If not, try again. If one repeats the exercise a very large number of times, one easily builds up a weighted distribution of credible values for a, b and Mmax that can be converted directly into a logic tree structure. The method is entirely data-driven, and imposes no preconceived assumptions on the shape of the uncertainty distribution. Also the method tests implicitly whether the Gutenberg-Richter model itself is credible for that data set. If it turns out to be the case that no values for a, b and Mmax can provide a good approximation to the observed data, then a different seismicity model is called for.
Seismological Calibration of Arrays A.M. O'Mongain
The UK is responsible for the seismological calibration of their array station EKA, which contributes data to the International Monitoring System (IMS) of the Comprehensive Test Ban Treaty Organisation (CTBTO). Such calibration includes the provision of seismic travel time corrections for the array station to allow for local velocity variations on the propagation path from seismic events at different distances and azimuths. The EC ARI Framework funded a two-part investigation into techniques for facilitating seismological calibration of seismic arrays. In the first part, analysis of variance was applied to manually picked arrival times at EKA from local events. Four bins of event data at different distances and azimuths were examined and for most the station correction time terms were found to be smaller than the sample rate of the instruments (0.05 seconds). Travel time residuals from each source-station pair were also examined and some distance and azimuth dependency was found. Slowness and azimuth values were recalculated once the station correction terms were applied to the data. Large discrepancies were found between the observed slowness values and those of the standard earth model IASPEI91, indicating significant differences between the local velocity structure and the IASPEI model. The second part of the work examined automatic arrival time pickers in order to expedite the calibration procedure and extend the study to more bins of data. Analysis of variance was used to investigate the picking accuracy and two methods (across correlation method and an Auto-Regressive Akaike Information Criterion method (ARAIC)) were tested. The results showed that in most cases the cross correlation method proves to be even more accurate than manual picking (having a variance of less than 0.001s2 in most cases) while the ARAIC method is not as successful on this data set.
The Dudley and Manchester earthquakes in 2002 L. Ottemöller and B. Baptie
The UK is an area of low to moderate seismicity with around 200 earthquakes detected each year and a recurrence rate for events of magnitude 5 of approximately 10 years. Historically, the largest earthquake to affect the United Kingdom occurred 1931 in the North Sea with a magnitude of 6.1 ML. The British Geological Survey runs a seismic monitoring network consisting of 146 seismic stations distributed throughout the UK. With an average distance between stations of about 70 km, the magnitude threshold lies at about 1.5 ML. The most significant earthquake sequences in the UK during 2002 were the 22 September 4.7 ML Dudley event with two aftershocks, and the Manchester earthquake sequence with more than 100 events that started on 19 October and continued for more than a month. The Dudley events were studied in detail to resolve hypocenter location, source mechanism and the macroseismic effects. Strong similarities between the mainshock and the two aftershocks were observed, suggesting that they were nearly co-located and of similar mechanism, and possibly occurred on a single fault. The Western Boundary fault appears to be the most likely candidate. Less than a month later, the people of Manchester were shaken by more than 100 events over a one-month period, many of which were felt. Additional temporary seismograph stations were installed in Greater Manchester to improve location accuracy. Most of the energy during the sequence was released in two events within about one minute on 21 October with magnitudes 3.9 and 3.5 ML, respectively. The events were located using a JHD routine in a source volume of a few km in size at a depth between 1 and 3 km. Due to the uncertainties in phase readings, it was not possible to resolve fault structures. Comparison of waveform signals between events showed significant differences, suggesting that the events possibly resulted from rupture of several smaller faults in the hypocentral region.
Ekofisk Seismic Event of 7 May, 2001 L. Ottemöller, H. H. Nielsen, K. Atakan, J. Braunmiller and J. Havskov

32
On May 7, 2001, a seismic event was strongly felt on the platforms in the Ekofisk oil field, which is located within the Central Graben in the Norwegian sector of the North Sea. The event was recorded on seismic stations in most parts of Europe at distances of up to 2500 km. The event was analyzed using the large amount of regional seismic stations available to determine the epicenter. The formal errors in epicenter location are about 7km, while the depth derived from travel times is basically undetermined. The seismograms were dominated by long-period surface waves while body waves showed emergent onsets, possibly indicating a shallow source in relatively soft rocks. The magnitudes of MW=5.0, Mb=4.4 and MS=4.6 make this event the largest in the region in over 30 years. Spectral analysis revealed a low stress drop, which together with a considerably lower local magnitude (ML=3.0) than MW indicates that the energy released was less than for a normal stress drop event with the same seismic moment. We carried out a moment tensor inversion to resolve the source mechanism, but also to obtain an estimate of the source depth. A normal faulting solution was obtained with north-south trending nodal planes. A best fit between observed and synthetic waveforms was obtained for a shallow depth of less than 5 km. Previous events in the area were analyzed for comparison. The relation between the seismic event and hydrocarbon extraction at Ekofisk has been investigated, and appears to be likely
A Bulletin of British Earthquakes 2003. B.A. Simpson (ed)
The British Geological Survey's (BGS) Seismic Monitoring and Information Service operates a nationwide network of seismograph stations in the United Kingdom (UK). The whole of the UK, including coastal waters, is covered within the limits of the detection capabilities of the seismograph network. Location accuracy is extended in offshore areas through data exchange with neighbouring countries. Seismic phase data, location details and magnitudes are presented in this Bulletin for all earthquakes detected and located by BGS during 2003 in Tables 1 and 2, together with maps showing the larger magnitude events since 1979 (ML> 2.5) and since 1970 (ML> 3.5). The bulletin covers all of the UK land mass and its coastal waters including the North Sea to 800 kmE and 1500 kmN.
Earthquake Monitoring 2002/2003, BGS Seismic Monitoring and Information Service, Fourteenth Annual Report A.B. Walker, B. Baptie, B. and L. Ottemöller, L.
The aims of the Seismic Monitoring and Information Service are to develop and maintain a national database of seismic activity in the UK for use in seismic hazard assessment, and to provide near-immediate responses to the occurrence, or reported occurrence, of significant events. The British Geological Survey (BGS) has been charged with the task of operating and further developing a uniform network of seismograph stations throughout the UK in order to acquire standardised data on a long-term basis. The project is supported by a group of organisations under the chairmanship of the Office of the Deputy Prime Minister (ODPM) with major financial input from the Natural Environment Research Council (NERC). This Customer Group is listed in Annex A.
In the 14th year of the project (April 2002 to March 2003), three subnetworks were upgraded with the installation of data loggers running under the QNX operating system, and a strong motion instrument was installed at Hartland in North Devon. The increasing number of acceleration records being captured by strong motion instruments, is feeding into a better understanding of attenuation and seismic hazard in the UK.
Some 235 earthquakes were located by the monitoring network in 2002, with 87 of them having magnitudes of 2.0 ML or greater (Annex B). A total of 42 events in this magnitude category were reported as felt along with 6 smaller ones. Nine strong-motion records were captured from six of the nineteen sites now equipped with strong motion instruments. The largest earthquake in the reporting year, with a magnitude of 4.7 ML, occurred near Dudley on 22 September. It was felt up to 337 km away and over an area of 126,000 km2 (Isoseismal 3 EMS) and reached a maximum intensity of 5 on the European Macroseismic Scale (EMS, Annex H). A peak ground acceleration of 153 mms-2 was recorded on the three-component accelerometer at Keyworth, a distance of 83 km from the epicentre. The focal mechanism indicates strike slip movement along near vertical fault planes striking either NNE-SSW or WNW-ESE. The following month, an earthquake sequence commenced near Manchester with 117 events located, 37 of which were felt by the local population. The sequence caused widespread alarm in the greater Manchester area. The largest offshore earthquake occurred in the central North Sea on 12 October 2002 with a magnitude of 3.5 ML, approximately 70 km east of the Shetland Islands. In addition to

33
earthquakes, BGS frequently receives reports of seismic events felt and heard, which on investigation prove to be sonic booms, spurious or in coalfield areas, where much of the activity is probably induced by mining. During the reporting period, data from six sonic events were processed and reported upon following public concern or media attention.
All significant felt events and some others were reported rapidly to the Customer Group through seismic alerts sent by e-mail. The alerts were also published on the Internet (http://www.earthquakes.bgs.ac.uk). Monthly seismic bulletins were issued six weeks in arrears and, following revision, were compiled into an annual bulletin (Simpson, 2003). In all these reporting areas, scheduled targets have been met or surpassed.
Maintenance and protection of historical archives, another primary goal of the project, has continued and has been enhanced by donations of the Soil Mechanics UK data, from a study in the early 1980’s and the British Association for the Advancement of Science Seismological Committee archives.
The environmental monitoring stations at Eskdalemuir and Hartland observatories recorded a variety of parameters throughout the year and the data are now accessible on-line through an Internet connection.