Embed Size (px)
Citation preview

Kidney International, Vol. 60 (2001), pp. 1443–1451
Type of vascular access and mortality in U.S.hemodialysis patients
RAJNISH K. DHINGRA, ERIC W. YOUNG, T.E. HULBERT-SHEARON, SEAN F. LEAVEY,and FRIEDRICH K. PORT
Division of Nephrology, University of Michigan Medical Center; Kidney Epidemiology and Cost Center; andUniversity Renal Research and Education Association, Ann Arbor, Michigan, USA
Type of vascular access and mortality in U.S. hemodialysis ysis Outcomes Quality Initiative (DOQI) recommend ar-patients. teriovenous fistula (AVF) to be the VA of choice for he-
Background. Vascular access (VA) complications account for modialysis [3]. These guidelines are based on studies that16 to 25% of hospital admissions. This study tested the hypothe-suggest improved access survival and function for AVFsis that the type of VA in use is correlated with overall mortality
and cause-specific mortality. when compared with arteriovenous graft (AVG) [4–8].Methods. Data were analyzed from the U.S. Renal Data A substantial geographic variation exists in the distribu-
System Dialysis Morbidity and Mortality Study Wave 1, a ran- tion of AVF and AVG among patients with end-stagedom sample of 5507 patients, prevalent on hemodialysis as ofrenal disease (ESRD). While in Europe 81% of VA areDecember 31, 1993. The relative mortality risk during a two-AVF, the percentage of hemodialysis patients with AVFyear observation was analyzed by Cox-regression methods with
adjustments for demographic and comorbid conditions. Using in the United States is only 21% (abstract; Pisoni, J Amsimilar methods, cause-specific analyses also were performed for Soc Nephrol 10:215A, 1999). Even within the United States,death caused by infection and cardiac causes.
there is a considerable geographic variation in placementResults. In diabetic mellitus (DM) patients with end-stageof AVF. Hirth et al showed a tenfold regional variation,renal disease, the associated relative mortality risk was higher
for those with arteriovenous graft (AVG; RR � 1.41, P � with the East South Central region of the United States0.003) and central venous catheter (CVC; RR � 1.54, P � having a 2.7-fold higher adjusted odds ratio for place-0.002) as compared with arteriovenous fistula (AVF). In non-
ment of AVG than the national average, whereas thisDM patients, those with CVC had a higher associated mortalityratio was only 0.2 for the New England region [9]. This(RR � 1.70, P � 0.001), as did to a lesser degree those with
AVG (RR � 1.08, P � 0.35) when compared with AVF. Cause- large variation is not likely due to differences in patientspecific analyses found higher infection-related deaths for CVC characteristics, but rather to variation in practice pat-(RR � 2.30, P � 0.06) and AVG (RR � 2.47, P � 0.02)
terns across the United States [10].compared with AVF in DM; in non-DM, risk was higher alsoDespite recent trends in improved survival of hemodi-for CVC (RR � 1.83, P � 0.04) and AVG (RR � 1.27, P �
0.33). In contrast to our hypothesis that AV shunting increases alysis patients, mortality rates are 22.8 deaths per 100 pa-cardiac risk, deaths caused by cardiac causes were higher in tient years during the first year on hemodialysis. The five-CVC than AVF for both DM (RR � 1.47, P � 0.05) and non-
year survival for the average patient on hemodialysis isDM (RR � 1.34, P � 0.05) patients.merely 25 to 27% [11]. Cardiac diseases account for moreConclusion. This case-mix adjusted analysis suggests that CVC
and AVG are correlated with increased mortality risk when com- than half of the reported causes of deaths, while deathspared with AVF, both overall and by major causes of death. due to infection make up almost a quarter of all deaths.
The risk of infection among hemodialysis patients is rela-tively high due to the presence of a VA and the repeatedVascular access (VA) complications account for 16 toneed to access the bloodstream for hemodialysis. A Ca-25% of hospital admissions and cost over $1 billion U.S.nadian study showed that the probability of access infec-dollars annually [1, 2]. Guidelines from the current Dial-tion was higher for AVG than for AVF (19.7 vs. 4.5%)during a 12-month observation period [12]. It is com-
Key words: dialysis, central venous catheter, arteriovenous graft, mor-monly thought that the probability of infection with atality, arteriovenous fistula, USRDS study, cardiac death, end-stage
renal disease, diabetes mellitus. central venous catheter (CVC) is even higher. Accessthrombosis rates were higher also for AVG in this Cana-Received for publication December 28, 2000dian study, with a 2.5 times higher relative risk for AVGand in revised form March 28, 2001
Accepted for publication April 27, 2001 when compared with AVF. Additionally, those withAVG had a 50% higher relative risk for hospitalization 2001 by the International Society of Nephrology
1443

Dhingra et al: Access type predicts mortality1444
when compared with AVF [12]. Recently, Woods et al ber 31, 1993), had a functioning kidney transplant, werein training for any self-care treatment, or were receivinganalyzed Medicare data and found that the risk of accessperitoneal dialysis or home hemodialysis at the studyfailure was 67% higher for AVG than for AVF. Theirstart date [18].analysis also showed an increase in the rate of AVF
A copy of the data abstraction form and further designthrombosis with age. However, even for patients olderdetails of the DMMS Wave 1 have been published inthan 65 years, AVG had a 24% higher relative risk ofthe USRDS 1999 Annual Data Report, Appendix B [18].failure when compared with AVF [13]. Thus, both higherStandardized forms were sent to each dialysis unit, whererates of thrombosis and infection were associated withpersonnel abstracted data on demographics, comorbidthe use of AVG. The overall risk of infection may beconditions, laboratory, treatment, socioeconomic, andreduced with utilization of an AVF at initiation of hemo-insurance status. Details abstracted for each patient in-dialysis. Furthermore, it has been estimated that for eachcluded date of birth, gender, race, education level, mobil-0.1 unit decrease in Kt/V, the mortality rate increasesity status, cause of ESRD, and a list of comorbid condi-by 7%, all else being equal. Mean delivered dialysis dosetions present within 10 years prior to study start datein turn varies by type of access, with a CVC providing(December 31, 1993). This form included specific ques-0.1 lower Kt/V than AVG or AVF [10, 13, 14]. Sincetions regarding coronary artery disease (CAD), conges-dialysis dose, infection, and hospitalization are associ-tive heart failure (CHF), pericarditis, cerebrovascularated with mortality risk, we hypothesized that VA isdisease, peripheral vascular disease (PVD), diabetes, in-correlated with patient survival.sulin use, lung disease, cancer, and HIV status. Data alsoTo date, limited data have been published regardingwere abstracted regarding VA in use on December 31,patient survival and its association with type of VA in he-1993 for all patients. For a subsample of incident pa-modialysis patients [15–17]. In the present study, we usedtients during 1993, a special form was used to collectdata from the United States Renal Data System (USRDS)data regarding VA. For this subset, data were collectedDialysis Morbidity and Mortality Study (DMMS) Wave 1regarding VA used at the initiation of hemodialysis andto correlate mortality rates with types of VA while statis-at 30 days post-initiation of dialysis. For our study, thetically adjusting for patient characteristics and comorbidAVG group included those with polytetrafluoroethyleneconditions. We hypothesized that patients with CVC have(PTFE) (98%) and bovine graft (2%), and the CVCthe highest associated mortality risk, followed by thosegroup included those with permanent catheters (39%)with AVG, and that patients with AVF have the lowestand temporary catheters (61%). Date and cause of deathassociated mortality risk. This study also analyzed thewere obtained from the USRDS standard analysis files.data on cause of death by VA type. Our hypothesis was
that, compared with patients with CVC, those with AVF Prevalent patient analysesor AVG have higher associated risk of death from car- These analyses compared survival for all hemodialysisdiac causes because of the increased cardiac output sec- patients by the three VA groups of AVF, AVG, and CVC,ondary to presence of an AV shunt. We anticipated that after adjusting the final model for age, gender, race, bodyassociated death risk due to infection would be highest mass index (BMI), history of smoking, CAD, PVD, cere-in those with CVC, followed by AVG, and would be brovascular disease, CHF, cancer, ability to ambulate, andlowest for AVF. education level. Prior knowledge based on literature and
baseline characteristics of our study guided the decisionto choose these variables for inclusion in the final modelMETHODS[10]. The possibility of interactions between diabetes andData collectiontype of VA was explored, as well as between age and VA
Data for this study came from the USRDS DMMS type, and between time on dialysis and VA type on out-Wave 1. This is an observational study in which demo- comes. The chi-square and analysis of variance tests ingraphic, comorbid, laboratory, treatment, socioeconomic, the SAS program (SAS version 6.12; Cary, NC, USA)and insurance data were collected on a large representa- were used for categorical and continuous variables,tive sample of hemodialysis patients in the United States. respectively, to test whether there were differences inThe sample was created by randomly selecting 550 dial- baseline characteristics among the three groups. Survivalysis units from the Master List of Medicare Approved probabilities were obtained using the Cox (proportionalDialysis Facilities. Sampling was adjusted to provide an hazard) regression method with the command PROCadequate sample of new ESRD patients on hemodialysis PHREG in the SAS program. We tested the proportional(25% of total sampled population). From the 550 se- hazards assumption by testing Log(�log) survival.lected facilities, core data were collected on a total of
“Incident” patient analyses5507 in-center hemodialysis patients who were alive onDecember 31, 1993. Patients were excluded if they were Incident patients were defined as the subgroup of prev-
alent patients who initiated chronic dialysis between Oc-less than 15 years of age at the study start date (Decem-
Dhingra et al: Access type predicts mortality 1445
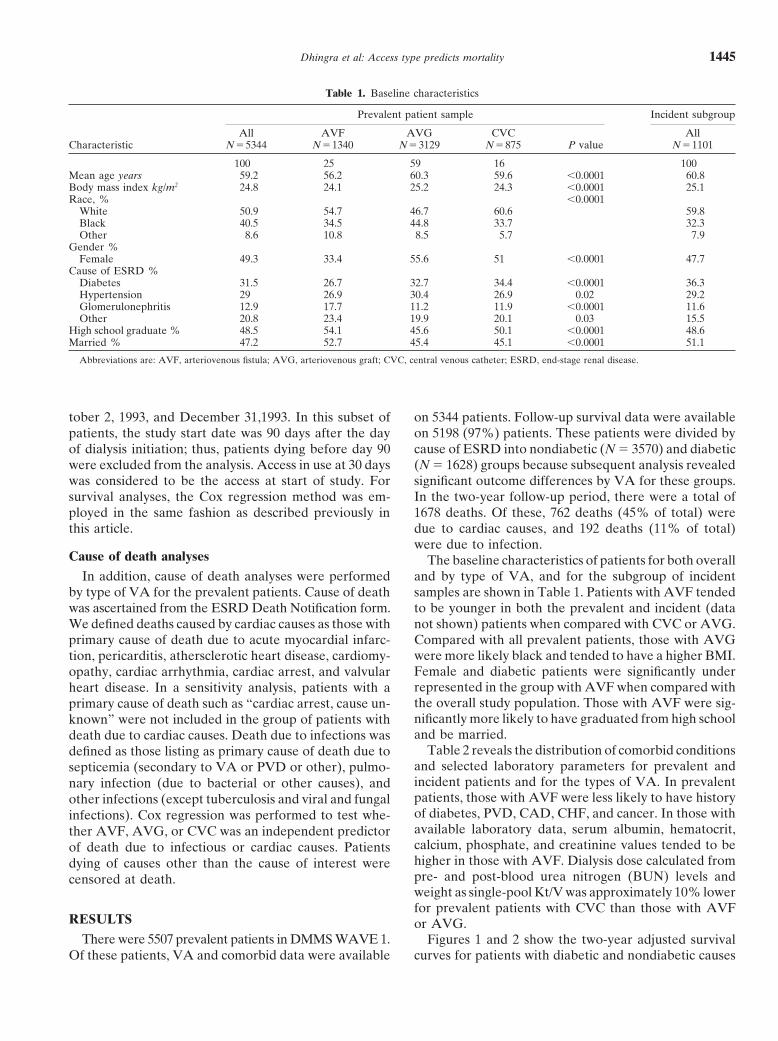
Table 1. Baseline characteristics
Prevalent patient sample Incident subgroup
All AVF AVG CVC AllCharacteristic N�5344 N�1340 N�3129 N�875 P value N�1101
100 25 59 16 100Mean age years 59.2 56.2 60.3 59.6 �0.0001 60.8Body mass index kg/m2 24.8 24.1 25.2 24.3 �0.0001 25.1Race, % �0.0001
White 50.9 54.7 46.7 60.6 59.8Black 40.5 34.5 44.8 33.7 32.3Other 8.6 10.8 8.5 5.7 7.9
Gender %Female 49.3 33.4 55.6 51 �0.0001 47.7
Cause of ESRD %Diabetes 31.5 26.7 32.7 34.4 �0.0001 36.3Hypertension 29 26.9 30.4 26.9 0.02 29.2Glomerulonephritis 12.9 17.7 11.2 11.9 �0.0001 11.6Other 20.8 23.4 19.9 20.1 0.03 15.5
High school graduate % 48.5 54.1 45.6 50.1 �0.0001 48.6Married % 47.2 52.7 45.4 45.1 �0.0001 51.1
Abbreviations are: AVF, arteriovenous fistula; AVG, arteriovenous graft; CVC, central venous catheter; ESRD, end-stage renal disease.
tober 2, 1993, and December 31,1993. In this subset of on 5344 patients. Follow-up survival data were availableon 5198 (97%) patients. These patients were divided bypatients, the study start date was 90 days after the day
of dialysis initiation; thus, patients dying before day 90 cause of ESRD into nondiabetic (N � 3570) and diabetic(N � 1628) groups because subsequent analysis revealedwere excluded from the analysis. Access in use at 30 days
was considered to be the access at start of study. For significant outcome differences by VA for these groups.In the two-year follow-up period, there were a total ofsurvival analyses, the Cox regression method was em-
ployed in the same fashion as described previously in 1678 deaths. Of these, 762 deaths (45% of total) weredue to cardiac causes, and 192 deaths (11% of total)this article.were due to infection.
Cause of death analyses The baseline characteristics of patients for both overalland by type of VA, and for the subgroup of incidentIn addition, cause of death analyses were performed
by type of VA for the prevalent patients. Cause of death samples are shown in Table 1. Patients with AVF tendedto be younger in both the prevalent and incident (datawas ascertained from the ESRD Death Notification form.
We defined deaths caused by cardiac causes as those with not shown) patients when compared with CVC or AVG.Compared with all prevalent patients, those with AVGprimary cause of death due to acute myocardial infarc-were more likely black and tended to have a higher BMI.tion, pericarditis, athersclerotic heart disease, cardiomy-Female and diabetic patients were significantly underopathy, cardiac arrhythmia, cardiac arrest, and valvularrepresented in the group with AVF when compared withheart disease. In a sensitivity analysis, patients with athe overall study population. Those with AVF were sig-primary cause of death such as “cardiac arrest, cause un-nificantly more likely to have graduated from high schoolknown” were not included in the group of patients withand be married.death due to cardiac causes. Death due to infections was
Table 2 reveals the distribution of comorbid conditionsdefined as those listing as primary cause of death due toand selected laboratory parameters for prevalent andsepticemia (secondary to VA or PVD or other), pulmo-incident patients and for the types of VA. In prevalentnary infection (due to bacterial or other causes), andpatients, those with AVF were less likely to have historyother infections (except tuberculosis and viral and fungalof diabetes, PVD, CAD, CHF, and cancer. In those withinfections). Cox regression was performed to test whe-available laboratory data, serum albumin, hematocrit,ther AVF, AVG, or CVC was an independent predictorcalcium, phosphate, and creatinine values tended to beof death due to infectious or cardiac causes. Patientshigher in those with AVF. Dialysis dose calculated fromdying of causes other than the cause of interest werepre- and post-blood urea nitrogen (BUN) levels andcensored at death.weight as single-pool Kt/V was approximately 10% lowerfor prevalent patients with CVC than those with AVF
RESULTS or AVG.There were 5507 prevalent patients in DMMS WAVE 1. Figures 1 and 2 show the two-year adjusted survival
curves for patients with diabetic and nondiabetic causesOf these patients, VA and comorbid data were available
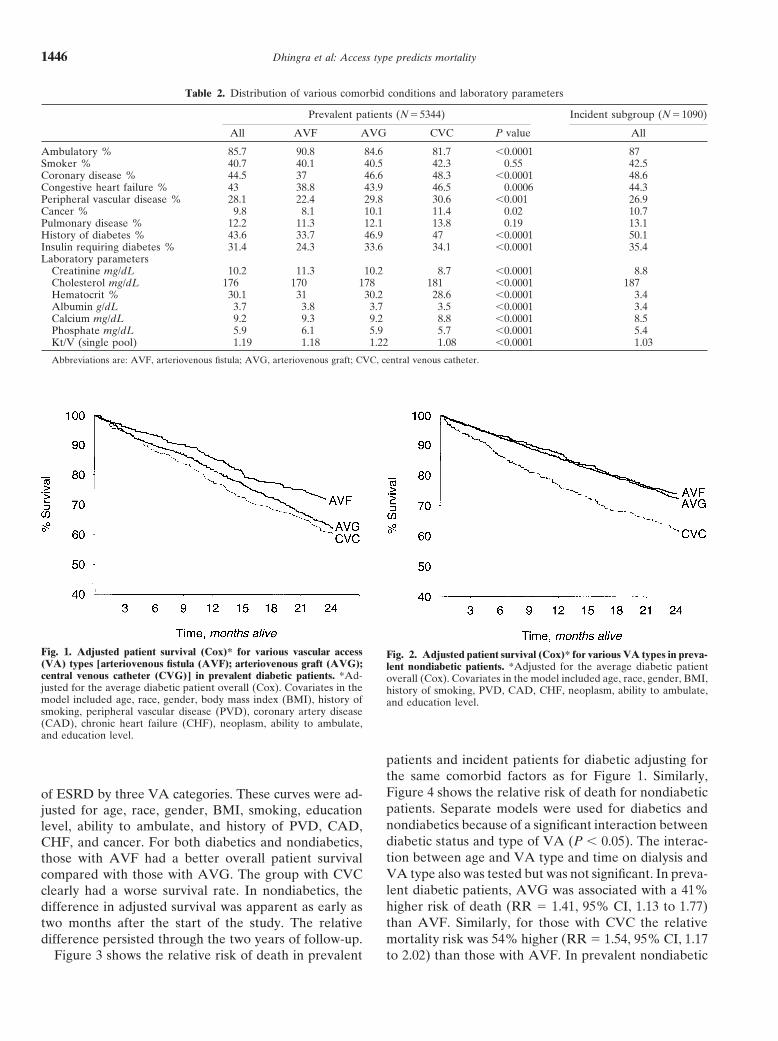
Dhingra et al: Access type predicts mortality1446
Table 2. Distribution of various comorbid conditions and laboratory parameters
Prevalent patients (N�5344) Incident subgroup (N�1090)
All AVF AVG CVC P value All
Ambulatory % 85.7 90.8 84.6 81.7 �0.0001 87Smoker % 40.7 40.1 40.5 42.3 0.55 42.5Coronary disease % 44.5 37 46.6 48.3 �0.0001 48.6Congestive heart failure % 43 38.8 43.9 46.5 0.0006 44.3Peripheral vascular disease % 28.1 22.4 29.8 30.6 �0.001 26.9Cancer % 9.8 8.1 10.1 11.4 0.02 10.7Pulmonary disease % 12.2 11.3 12.1 13.8 0.19 13.1History of diabetes % 43.6 33.7 46.9 47 �0.0001 50.1Insulin requiring diabetes % 31.4 24.3 33.6 34.1 �0.0001 35.4Laboratory parameters
Creatinine mg/dL 10.2 11.3 10.2 8.7 �0.0001 8.8Cholesterol mg/dL 176 170 178 181 �0.0001 187Hematocrit % 30.1 31 30.2 28.6 �0.0001 3.4Albumin g/dL 3.7 3.8 3.7 3.5 �0.0001 3.4Calcium mg/dL 9.2 9.3 9.2 8.8 �0.0001 8.5Phosphate mg/dL 5.9 6.1 5.9 5.7 �0.0001 5.4Kt/V (single pool) 1.19 1.18 1.22 1.08 �0.0001 1.03
Abbreviations are: AVF, arteriovenous fistula; AVG, arteriovenous graft; CVC, central venous catheter.
Fig. 1. Adjusted patient survival (Cox)* for various vascular access Fig. 2. Adjusted patient survival (Cox)* for various VA types in preva-(VA) types [arteriovenous fistula (AVF); arteriovenous graft (AVG); lent nondiabetic patients. *Adjusted for the average diabetic patientcentral venous catheter (CVG)] in prevalent diabetic patients. *Ad- overall (Cox). Covariates in the model included age, race, gender, BMI,justed for the average diabetic patient overall (Cox). Covariates in the history of smoking, PVD, CAD, CHF, neoplasm, ability to ambulate,model included age, race, gender, body mass index (BMI), history of and education level.smoking, peripheral vascular disease (PVD), coronary artery disease(CAD), chronic heart failure (CHF), neoplasm, ability to ambulate,and education level.
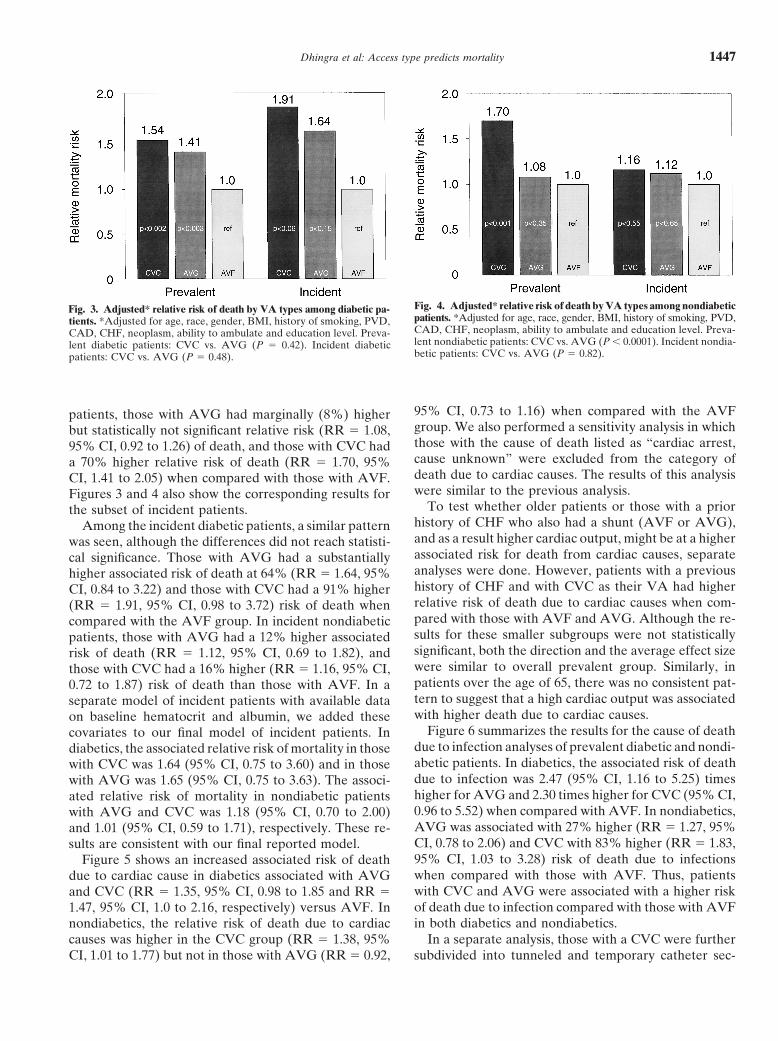
patients and incident patients for diabetic adjusting forthe same comorbid factors as for Figure 1. Similarly,Figure 4 shows the relative risk of death for nondiabeticof ESRD by three VA categories. These curves were ad-patients. Separate models were used for diabetics andjusted for age, race, gender, BMI, smoking, educationnondiabetics because of a significant interaction betweenlevel, ability to ambulate, and history of PVD, CAD,diabetic status and type of VA (P � 0.05). The interac-CHF, and cancer. For both diabetics and nondiabetics,tion between age and VA type and time on dialysis andthose with AVF had a better overall patient survivalVA type also was tested but was not significant. In preva-compared with those with AVG. The group with CVClent diabetic patients, AVG was associated with a 41%clearly had a worse survival rate. In nondiabetics, thehigher risk of death (RR � 1.41, 95% CI, 1.13 to 1.77)difference in adjusted survival was apparent as early asthan AVF. Similarly, for those with CVC the relativetwo months after the start of the study. The relativemortality risk was 54% higher (RR � 1.54, 95% CI, 1.17difference persisted through the two years of follow-up.
Figure 3 shows the relative risk of death in prevalent to 2.02) than those with AVF. In prevalent nondiabetic
Dhingra et al: Access type predicts mortality 1447
Fig. 4. Adjusted* relative risk of death by VA types among nondiabeticFig. 3. Adjusted* relative risk of death by VA types among diabetic pa-patients. *Adjusted for age, race, gender, BMI, history of smoking, PVD,tients. *Adjusted for age, race, gender, BMI, history of smoking, PVD,CAD, CHF, neoplasm, ability to ambulate and education level. Preva-CAD, CHF, neoplasm, ability to ambulate and education level. Preva-lent nondiabetic patients: CVC vs. AVG (P � 0.0001). Incident nondia-lent diabetic patients: CVC vs. AVG (P � 0.42). Incident diabeticbetic patients: CVC vs. AVG (P � 0.82).patients: CVC vs. AVG (P � 0.48).
95% CI, 0.73 to 1.16) when compared with the AVFpatients, those with AVG had marginally (8%) highergroup. We also performed a sensitivity analysis in whichbut statistically not significant relative risk (RR � 1.08,those with the cause of death listed as “cardiac arrest,95% CI, 0.92 to 1.26) of death, and those with CVC hadcause unknown” were excluded from the category ofa 70% higher relative risk of death (RR � 1.70, 95%death due to cardiac causes. The results of this analysisCI, 1.41 to 2.05) when compared with those with AVF.were similar to the previous analysis.Figures 3 and 4 also show the corresponding results for
To test whether older patients or those with a priorthe subset of incident patients.history of CHF who also had a shunt (AVF or AVG),Among the incident diabetic patients, a similar patternand as a result higher cardiac output, might be at a higherwas seen, although the differences did not reach statisti-associated risk for death from cardiac causes, separatecal significance. Those with AVG had a substantiallyanalyses were done. However, patients with a previoushigher associated risk of death at 64% (RR � 1.64, 95%history of CHF and with CVC as their VA had higherCI, 0.84 to 3.22) and those with CVC had a 91% higherrelative risk of death due to cardiac causes when com-(RR � 1.91, 95% CI, 0.98 to 3.72) risk of death whenpared with those with AVF and AVG. Although the re-compared with the AVF group. In incident nondiabeticsults for these smaller subgroups were not statisticallypatients, those with AVG had a 12% higher associatedsignificant, both the direction and the average effect sizerisk of death (RR � 1.12, 95% CI, 0.69 to 1.82), andwere similar to overall prevalent group. Similarly, inthose with CVC had a 16% higher (RR � 1.16, 95% CI,patients over the age of 65, there was no consistent pat-0.72 to 1.87) risk of death than those with AVF. In atern to suggest that a high cardiac output was associatedseparate model of incident patients with available datawith higher death due to cardiac causes.on baseline hematocrit and albumin, we added these
Figure 6 summarizes the results for the cause of deathcovariates to our final model of incident patients. Indue to infection analyses of prevalent diabetic and nondi-diabetics, the associated relative risk of mortality in thoseabetic patients. In diabetics, the associated risk of deathwith CVC was 1.64 (95% CI, 0.75 to 3.60) and in thosedue to infection was 2.47 (95% CI, 1.16 to 5.25) timeswith AVG was 1.65 (95% CI, 0.75 to 3.63). The associ-higher for AVG and 2.30 times higher for CVC (95% CI,ated relative risk of mortality in nondiabetic patients0.96 to 5.52) when compared with AVF. In nondiabetics,with AVG and CVC was 1.18 (95% CI, 0.70 to 2.00)AVG was associated with 27% higher (RR � 1.27, 95%and 1.01 (95% CI, 0.59 to 1.71), respectively. These re-CI, 0.78 to 2.06) and CVC with 83% higher (RR � 1.83,sults are consistent with our final reported model.95% CI, 1.03 to 3.28) risk of death due to infectionsFigure 5 shows an increased associated risk of deathwhen compared with those with AVF. Thus, patientsdue to cardiac cause in diabetics associated with AVGwith CVC and AVG were associated with a higher riskand CVC (RR � 1.35, 95% CI, 0.98 to 1.85 and RR �of death due to infection compared with those with AVF1.47, 95% CI, 1.0 to 2.16, respectively) versus AVF. Inin both diabetics and nondiabetics.nondiabetics, the relative risk of death due to cardiac
causes was higher in the CVC group (RR � 1.38, 95% In a separate analysis, those with a CVC were furthersubdivided into tunneled and temporary catheter sec-CI, 1.01 to 1.77) but not in those with AVG (RR � 0.92,

Dhingra et al: Access type predicts mortality1448
Fig. 5. Adjusted* relative risk of death due to cardiac causes by VA type Fig. 6. Adjusted* relative risk of death due to infection by VA type andand diabetes status. *Adjusted for age, race, gender, BMI, history of smok- diabetes status. *Adjusted for age, race, gender, BMI, history of smok-ing, PVD, CAD, CHF, neoplasm, ability to ambulate and education ing, PVD, CAD, CHF, neoplasm, ability to ambulate and educationlevel. Prevalent diabetic patients: CVC vs. AVG (P � 0.59). Prevalent level. Prevalent diabetic patients: CVC vs. AVG (P � 0.81). Prevalentnondiabetic patients: CVC vs. AVG (P � 0.003). nondiabetic patients: CVC vs. AVG (P � 0.13).
tions. In prevalent patients, there were 875 (16% of total) as compared with AVF. To our knowledge, this is the firstpatients with CVC, and these were further classified into study to use data collected on a nationally representa-533 (61%) temporary and 342 (39%) tunneled catheters. tive sample of patients and to focus on the associationThe associated relative risk of mortality in prevalent of mortality and cause-specific mortality with variousdiabetic patients with a tunneled catheter was 1.79 (95% VA types.CI, 1.28 to 2.50), and those with a temporary catheter Vascular access complications as morbidity for hemo-had a relative risk of 1.37 (95% CI, 0.99 to 1.90) when dialysis have received increased attention in recent yearscompared with those with AVF. In prevalent nondiabet- [19, 20]. However, there is little evidence of a subsequentics, the associated relative risk of mortality in those with time trend toward an increased use of AVF as the pri-tunneled catheter was 1.88 (95% CI, 1.49 to 2.38), and mary VA. Of the patients in our study who started hemo-
dialysis during the last three months of 1993, only 15%those with temporary catheter had a relative risk of 1.58had AVF, whereas AVG and CVC accounted for 42 and(95% CI, 1.27 to 1.96) when compared with those with43% each as their VA in use at 30 days after initiatingAVF. In incident patients, there were 473 (43% of total)hemodialysis. Among prevalent patients, 23% had AVF;patients with CVC, and these were further subdivided60% had AVG, and 16% had CVC. Data from the Cen-into 349 (74%) temporary and 124 (26%) tunneled cathe-ters for Disease Control from December 1999 showedters. The associated relative risk of mortality in incidenta slight difference than in 1993 for prevalent patients,diabetic patients with a tunneled catheter was 2.55 (95%with 26% having AVF, 52% AVG, and 22% CVC [21].CI, 1.14 to 5.74) and in those with a temporary catheterTherefore, among the prevalent patients in 1999 the per-RR � 1.78 (95% CI, 0.89 to 3.55). In the incident diabet-centages of patients with AVF had increased; however,ics, the associated relative risk of mortality with a tun-a simultaneous increase for CVC was even greater. Itneled catheter was 1.37 (95% CI, 0.76 to 2.47) and inis not clear whether these recent trends will affect thethose with temporary catheter, the relative risk was 1.12observed relative risks.(95% CI, 0.68 to 1.84).
This study focused on determining whether and towhat degree a particular type of VA is associated with
DISCUSSION the outcome of death. Limited literature has been pub-This study demonstrates that patients with AVG and lished in this regard previously. Our results suggest that
CVC have a higher overall relative risk of death when the relative risk of death is significantly higher in thosecompared with those with AVF, even after adjusting with CVC and AVG when compared with AVF, in bothfor various comorbid conditions. Furthermore, the study diabetics and nondiabetics, although the difference inshows that in diabetics the relative risk of death due to mortality risk was not statistically significant for AVFinfections and cardiac causes was higher in those with versus AVG in the nondiabetics. An earlier study com-AVG and CVC. The relative risk of death due to infec- pared patient mortality between those with AVG and
AVF and found the 60th percentile of survival of 698tions was also higher in nondiabetics with AVG and CVC

Dhingra et al: Access type predicts mortality 1449
days for AVF and 771 days for AVG among diabetics, A number of limitations to this current study need tobe considered. Since the design of the study is observa-whereas for nondiabetics, the 60th percentile was at 838
days for AVF and 754 days for AVG [22]. This prior tional, it is susceptible to selection bias. We minimizedthis bias by statistically adjusting for several comorbidreport was based on the USRDS Case Mix Adequacy
study and had several limitations. Although it used all conditions that may influence the choice of access type.These adjustments covered a broad spectrum (Tables 1patients who started dialysis in 1990, it only included
those who were alive on December 31, 1990. Further- and 2). Even with these multiple adjustments, we founda statistically significant association between the typemore, the analysis was limited to one age group of 65
to 79 years and did not adjust for comorbid conditions of VA and patient mortality. However, the possibilitycannot be excluded that other relevant factors were notexcept for age and diabetes status. To minimize potential
bias due to early deaths, our substudy of incident patients accounted for in this study. It has previously been shownfor incident patients that the type of VA may be relatedonly included patients who started dialysis in the last
three months of 1993 and started the survival analysis to patient acuity or pre-ESRD care [23]. Thus, it is possi-ble that poor pre-ESRD may have contributed to excesson day 90 for each patient. This resulted in a smaller sam-
ple size and decreased power to detect mortality dif- mortality in those with AVG and CVC. In some preva-lent patients CVC may be an indicator of previous accessferences. However, the direction and magnitude of the
findings for this subgroup were consistent with results failure, but whether that itself contributes to mortalityis unknown.obtained from the analysis of all prevalent patients hav-
ing a much larger sample size. Because of these major In a different study, we recently reported the associa-tion between VA type and standardized mortality ratiomethodological differences, direct comparison between
the results from the earlier and the present USRDS study (SMR) at the dialysis unit level (abstract; Wolfe et al,J Am Soc Nephrol 11:201A, 2000). This analysis mini-is probably not warranted.
Pastan et al presented similar results for prevalent mized comorbid differences between patients, since theanalysis was at the unit level and adjusted for differenceshemodialysis (N � 7497) patients from facilities in the
southeastern United States (abstract; Pastan et al, J Am in comorbid conditions at the unit level. The units withmore patients using CVC had 4% higher SMR per 10%Soc Nephrol 11:193A, 2000). However, they did not per-
form separate analyses for diabetic and nondiabetic pa- more patients using CVC when adjusting for demo-graphic and comorbid conditions at the unit level. Thistients. Their results were similar after adjusting for comor-
bid factors: Temporary and tunneled catheters had nearly analysis suggested that the unit-level practice pattern forVA is strongly associated with SMR and is consistenttwice the odds of death. AVG had a 20% higher odds of
death overall when compared with patients with AVF. with the patient level results reported in this article.We considered adding albumin level and dose of dial-Hilbelink et al recently reported their single-center
experience of the impact of hemodialysis access on the sur- ysis to the final model; however, since these factors areintermediate outcomes that are associated with both VAvival of older patients with ESRD (abstract; J Am Soc
Nephrol 11:185A, 2000). They followed 213 patients (all types and patient mortality, such adjustments may notbe appropriate. In support of this, Leavey et al foundage �69) for an average of 26 months and reported worse
patient survival with AVG (23%) followed by AVF (33%) that albumin concentration was significantly correlatedwith VA type [24]. In a cross-sectional analysis, albuminand tunneled catheters (52%). These results are very
different from the present study. They performed multi- levels vary as follows: AVF � AVG � tunneled perma-cath � temporary catheter. They also found that by ad-variate logistic regression for their survival analysis and
did not account for possible differences in various comor- justing for baseline differences, the trend effect predicteda further decrease in serum albumin at one year forbid conditions. Logistic regression treats early and late
deaths during follow-up as equivalent events, which is a AVG and permanent catheter versus AVF. It also hasbeen noted that the average blood flows during dialysispotential concern. Our study has several advantages: use
of time-to-death analysis with the Cox regression model, are lower with CVC than with AVG or AVF [25]. Addi-tionally, increased clotting and infection for AVG com-adjustment for various comorbid conditions, a large sam-
ple size of prevalent hemodialysis patients, and a repre- pared with AVF may lead to a decreased dialysis doseduring the period of access malfunction. Another reasonsentative national sample. In an attempt to replicate the
Hilbelink results, we also performed a separate analysis for not including dialysis dose in this study is that residualrenal function makes it a poor indicator of total Kt/V inof patients with tunneled catheter and compared their
mortality risk with those with AVF and AVG. No evidence incident patients, as they often have substantial residualrenal function. In a separate analysis, the addition of Kt/Vwas found to suggest that tunneled catheters are associ-
ated with a survival advantage; in fact, the results were to the model of mortality in prevalent patients did notchange the results (data not shown). Similarly, the addi-consistent with the overall results reported here for tun-
neled catheter and temporary catheters combined. tion of baseline albumin and hematocrit level measure-

Dhingra et al: Access type predicts mortality1450
ments to the model of mortality in incident patients did tors not included in the model may explain for this ele-vated relative risk of cardiac death in patients with CVC.not change the results. However, we chose not to include
these two factors in our final model for the reasons men- In conclusion, we have shown that the type of VA issignificantly associated with patient mortality. Those withtioned in this paragraph.
Misclassification bias is another potential concern. We CVC and AVG have higher relative risk of mortalitycompared with those with AVF. Furthermore, our spe-minimized this bias in the incident group by using the
access in use at 30-days postinitiation of chronic hemodi- cific cause-of-death analyses showed that those withCVC are at higher risk for death due to infections andalysis. Previously it was shown that a majority of patients
had a permanent access placed at this time. Moreover, cardiac causes. This is the first national study to showsuch an association while simultaneously adjusting forthose with CVC may, after switching to AVG or AVF,
have a lower mortality risk. Thus, misclassification would various comorbid factors. These findings suggest that thetype of VA employed may have subsequent implicationsbias results toward the null, resulting in not observing
any differences. The statistically significant observation for survival probability. Since this is the first observationstudy to show such an effect on mortality, the resultsand the average effect size seen in this study of access
type on mortality therefore may be an underestimate of need to be confirmed by other observational studies. Wecaution that a direct causal link between type of VAthe true differences. The same applies to those with AVG
or AVF when switching to CVC, since they may be mov- and mortality cannot be established based on this study.However, it is unlikely that a randomized controlled trialing to a higher risk mortality and again lead to an under-
estimate of the effect size. Furthermore, among those of AVF versus AVG will ever be performed. Therefore,given the large evidence available on a lower morbiditywith CVC, patients with temporary catheters were ob-
served to have a lower risk of mortality than those with with AVF, this study showing a strong and significantassociation of AVF with improved patient survival pro-tunneled catheters. This observation could be due also to
misclassification bias. Additionally, the possibility exists vides an additional reason for aggressive pursuit of AVF,perhaps even beyond the goals of the current DOQIthat other variables or severity indicators not included
in the model may contribute to this observation. guidelines.Previous studies have reported infection as a common
cause of death, accounting for 9.5 to 36% of deaths in ACKNOWLEDGMENTShemodialysis patients [25]. An overall 11% of deaths were The data reported here have been supplied by The United Statesdue to infections. Our definition of death due to infection Renal Data System (USRDS). The interpretation and reporting of these
data are the responsibility of the authors and in no way should bewas more stringent in that we excluded deaths due toseen as an official policy or interpretation of the U.S. government. TheHIV, tuberculosis, fungal pulmonary infections, and viral results of this study were presented in part at the 2000 American
infections from the category of deaths caused by infec- Society of Nephrology Annual Meeting in Toronto, Canada.tion. Our study is based on registry data and relies on the
Reprint requests to Rajnish K. Dhingra, M.D., Kidney Epidemiologyphysician’s report of cause of death. Although the re- and Cost Center, 315 West Huron Street, Suite 240, Ann Arbor, Michiganporting process is not standardized, there is a little reason 48103, USA.
E-mail: [email protected] believe that a misclassification would have occurredbased on the patient’s type of VA. Recently, Pastan etal reported similar preliminary results with 15% of total APPENDIXdeaths due to infections (abstract; J Am Soc Nephrol 11:
Abbreviations used in this article are: AVF, arteriovenous fistula;193A, 2000). They showed an elevated risk of infection AVG, arteriovenous graft; BMI, body mass index; CAD, coronary ar-deaths in patients with an AVG, tunneled catheter and tery disease; CHF, congestive heart failure; CI, confidence interval;
CVC, central venous catheter; DM, diabetes mellitus; DMMS, Dialysistemporary catheter compared with AVF (OR � 1.5, 4.0,Morbidity and Mortality Study; DOQI, Dialysis Outcomes Qualityand 2.7, respectively). Initiative; ESRD, end-stage renal disease; Kt/V, dialysis dose; PTFE,
Similar to USRDS reports, we found that death due polytetrafluoroethylene; PVD, peripheral vascular disease; RR, rela-tive risk; U.S., United States; USRDS, United States Renal Data Sys-to cardiac deaths accounted for 45% of total deaths dur-tem; VA, vascular access.ing the two-year follow-up period [26]. The study shows
that the associated risk of death due to cardiac causeREFERENCESwas higher among those with CVC when compared with
1. Feldman HI, Held PJ, Hutchinson JT, et al: Hemodialysis vas-AVG and AVF. This was confirmed in separate analysescular access morbidity in the United States. Kidney Int 43:1091–of high-risk subgroup of older patients and those with1096, 1993
history of CHF. Thus, we found no evidence to suggest 2. Feldman HI, Kobrin S, Wasserstein A: Hemodialysis vascularaccess morbidity. J Am Soc Nephrol 7:523–535, 1996that AV shunting with AVF or AVG is associated with
3. Schwab SJ, Besarab A, Beathard G, et al: National Kidney Foun-higher risk of death due to cardiac causes than in patientsdation DOQI: Clinical practice guidelines for vascular access. Am
with CVC most of whom have no such shunting. How- J Kidney Dis 30(Suppl 3):S154–S196, 19974. Palder SB, Kirkman RL, Whittemore AD, et al: Vascular accessever, it is possible that other variables or severity indica-

Dhingra et al: Access type predicts mortality 1451
for hemodialysis: Patency rates and results of revision. Ann Surg ysis on patient morbidity and mortality. Nephrol Dial Transplant12:657–659, 1997202:235–239, 1985
5. Munda R, First R, Alexander JW, et al: Polytetrafluoroethylene 17. United States Renal Data System: USRDS 1999 Annual DataReport (Chapter X). Am J Kidney Dis 34(Suppl 1):S124–S139,graft survival in hemodialysis. JAMA 249:219–222, 1983
6. Kherlakian GM, Roedersheimer LR, Arbaugh JJ, et al: Compar- 199918. United States Renal Data System: Researcher’s Guide to Theison of autogenous fistula versus expanded polytetrafluoroethylene
graft fistula for angioaccess in hemodialysis. Am J Surg 152:238– USRDS Database. The National Institute of Health, National Insti-tute of Diabetes and Digestive and Kidney Diseases, Bethesda,243, 1986
7. Dunlop MG, Mackinlay JY, Jenkins AM: Vascular access: Expe- 199919. Hakim R, Himmelfarb J: Hemodialysis access failure: A call torience with the brachiocephalic fistula. Ann R Coll Surg Engl 68:
203–206, 1986 action. Kidney Int 54:1029–1040, 199820. Schwab SJ, Beathard G: The hemodialysis catheter conundrum:8. Logerfo FW, Menzoian JO, Kumaki DJ, Idelson BA: Transposed
basilic vein-brachial arteriovenous fistula: A reliable secondary- Hate living with them, but can’t live without them. Kidney Int56:1–17, 1999access procedure. Arch Surg 113:1008–1010, 1978
9. Hirth RA, Turenne MN, Woods JD, et al: Predictors of type of 21. Tokars J, Miller E, Alter M, Arduino M: National Surveillanceof Dialysis-Assoc. Disease in the U.S., 1997 Dialysis Report, Centervascular access in hemodialysis patients. JAMA 276:1303–1308, 1996
10. Sehgal AR, Silver MR, Covinsky KE, et al: Use of standardized for Disease Control and Prevention, Public Health Services, De-partment of Human and Health Servicesratios to examine variability in hemodialysis vascular access across
facilities. Am J Kidney Dis 35:275–281, 2000 22. United States Renal Data System: USRDS 1995 Annual DataReport (chapter X). Am J Kidney Dis 26(Suppl 2):S140–S156, 199511. United States Renal Data System: USRDS 1999 Annual Data
Report (chapters V and VI). Am J Kidney Dis 34(Suppl 1):S74– 23. Friedman AL, Walworth C, Meehan C, et al: First hemodialysisaccess selection varies with patient acuity. Adv Ren Replace TherS94, 1999
12. Churchill DN, Taylor DW, Cook RJ, et al: Canadian hemodialy- 7(Suppl):S4–S10, 200024. Leavey SF, Strawderman RL, Young EW, et al: Cross-sectionalsis morbidity study. Am J Kidney Dis 19:214–234, 1992
13. Woods JD, Turenne MN, Strawderman RL, et al: Vascular access and longitudinal predictors of serum albumin in hemodialysis pa-tients. Kidney Int 58:2119–2128, 2000survival among incident hemodialysis patients in the United States.
Am J Kidney Dis 30:50–57, 1997 25. Bloembergen WE, Port FK, Mauger EA, Wolfe RA: A compari-son of cause of death between patients treated with hemodialysis14. Held PJ, Port FK, Wolfe RA, et al: The dose of hemodialysis
and patient mortality. Kidney Int 50:550–556, 1996 and peritoneal dialysis. J Am Soc Nephrol 6:184–191, 199526. United States Renal Data System: USRDS Excerpts from the15. United States Renal Data System: USRDS 1995 Annual Data
Report (chapter X). Am J Kidney Dis 26(Suppl 2):S140–S156, 1995 United States Renal Data System 1996 Annual Data Report. AmJ Kidney Dis 28(Suppl 2):S1–S165, 199616. Woods JD, Port FK: The impact of vascular access for haemodial-