Embed Size (px)
DESCRIPTION
TWX 2Q14 Earnings Release
Citation preview
For Immediate Release:
TIME WARNER INC. REPORTS SECOND-QUARTER 2014 RESULTS Second-Quarter Highlights • Completed spin-off of Time Inc. on June 6, 2014
• Revenues grew 3% to $6.8 billion
• Adjusted Operating Income increased 17% to $1.6 billion
• Adjusted EPS rose 29% to $0.98
• Free Cash Flow increased 16% to $2.0 billion in the first half of 2014
• Board authorized an additional $5 billion of share repurchases
• Company repurchased 51 million shares for $3.5 billion year-to-date through August 1, 2014 NEW YORK, August 6, 2014 – Time Warner Inc. (NYSE:TWX) today reported financial results for its second quarter ended June 30, 2014. Chairman and Chief Executive Officer Jeff Bewkes said: “We had another strong quarter, reflecting the strength of our businesses and our potential for continued growth as we deliver on our strategic plan to be the world’s leading video content company. Adjusted Operating Income increased 17%, while Adjusted EPS rose 29%, and over the first half of the year we generated $2 billion of Free Cash Flow, up 16% year-over-year. We achieved these results in a milestone quarter during which we spun off Time Inc. as an independent, publicly-traded company, further unlocking value for our shareholders and giving Time Warner even more operational focus. Our commitment to invest in great storytelling was evident across the Company. With hits like Game of Thrones, True Detective and Silicon Valley, HBO once again led the industry with 99 Primetime Emmy nominations, more than double its nearest competitor for the second straight year and the most nominations for the fourteenth year in a row. At Turner, TNT debuted the two most-watched new series on ad-supported cable this year with The Last Ship and Murder in the First and ranked as ad-supported cable’s #1 primetime network among total viewers and adults 18-34, 18-49 and 25-54 in the second quarter. Turner’s other networks also continued to lead the industry, and in the second quarter TBS finished as the #3 ad-supported cable network in primetime among adults 18-49 and Adult Swim ended as ad-supported cable’s #1 network in total day among adults 18-34 and 18-49. Heading into the 2014-2015 television season, Warner Bros. is the #1 producer of shows for broadcast networks for the 11th time in the past 12 seasons. Starting this fall, Warner Bros. will have 31 shows on broadcast networks, including at least two primetime series on each network, and 60 shows across broadcast and cable. And in film, Warner Bros. benefited in the quarter from the home video releases of the second Hobbit installment and The LEGO Movie, which, in addition to being one of the year’s biggest box office hits, has also become a franchise property for the studio. Further demonstrating our commitment to shareholder returns, so far this year we’ve returned over $4 billion to our shareholders in the form of share buybacks and dividends, and our board in June approved an additional $5 billion of share repurchases.”

Company Results1 Revenues increased 3% to $6.8 billion in the second quarter of 2014 due to growth at Home Box Office and Turner. Adjusted Operating Income grew 17% to $1.6 billion due to increases at Turner, Home Box Office and Warner Bros. Operating Income increased 13% to $1.6 billion. Adjusted Operating Income and Operating Income margins were 24% and 23% in the second quarter of 2014, respectively, compared to 21% for each in the prior year quarter. In the second quarter, the Company posted Adjusted Diluted Income per Common Share from Continuing Operations (“Adjusted EPS”) of $0.98 versus $0.76 for the year-ago quarter. Diluted Income per Common Share from Continuing Operations was $0.94 for the three months ended June 30, 2014 compared to $0.73 for last year’s second quarter. For the first six months of 2014, Cash Provided by Operations from Continuing Operations reached $2.1 billion and Free Cash Flow totaled $2.0 billion. As of June 30, 2014, Net Debt was $18.1 billion, down from $18.3 billion at the end of 2013, due to the generation of Free Cash Flow, cash received from Time Inc. in connection with the spin-off and proceeds from the sale of the Company’s space in Time Warner Center, offset in part by cash used for share repurchases and dividends. Refer to “Use of Non-GAAP Financial Measures” in this release for a discussion of the non-GAAP financial measures used in this release and the reconciliations of the non-GAAP financial measures to the most directly comparable GAAP financial measures. Stock Repurchase Program Update From January 1, 2014 through August 1, 2014, the Company repurchased approximately 51 million shares of common stock for approximately $3.5 billion. These amounts reflect the purchase of 32 million shares of common stock for $2.3 billion since the amounts reported in the Company’s first quarter earnings release on April 30, 2014. In June 2014, the Company’s Board of Directors authorized an additional $5 billion of share repurchases. At August 1, 2014, $6.5 billion remained available for repurchases.
1 On June 6, 2014, the Company completed the legal and structural separation of Time Inc. from the Company. Accordingly, the Company has recast its financial information to present the financial condition and results of operations of its former Time Inc. segment as discontinued operations for all periods presented.
2
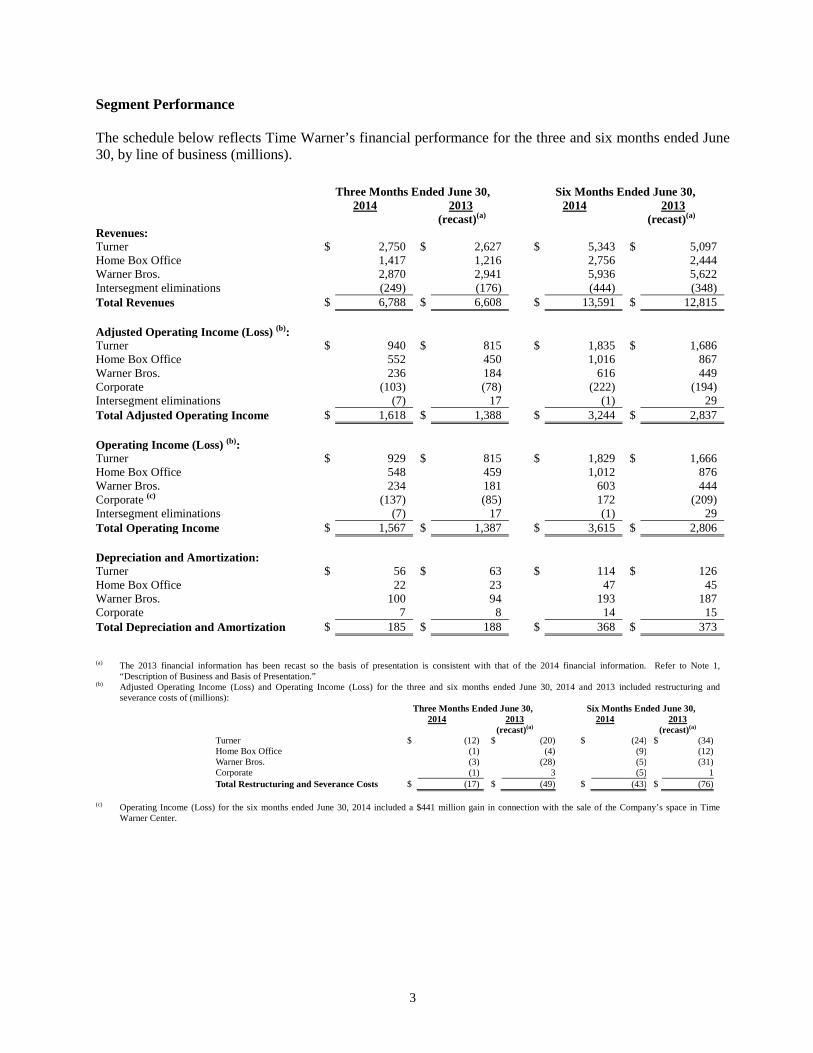
Segment Performance The schedule below reflects Time Warner’s financial performance for the three and six months ended June 30, by line of business (millions).
(a) The 2013 financial information has been recast so the basis of presentation is consistent with that of the 2014 financial information. Refer to Note 1,
“Description of Business and Basis of Presentation.” (b) Adjusted Operating Income (Loss) and Operating Income (Loss) for the three and six months ended June 30, 2014 and 2013 included restructuring and
severance costs of (millions): Three Months Ended June 30, Six Months Ended June 30, 2014 2013
(recast)(a) 2014 2013
(recast)(a) Turner $ (12) $ (20) $ (24) $ (34) Home Box Office (1) (4) (9) (12) Warner Bros. (3) (28) (5) (31) Corporate (1) 3 (5) 1 Total Restructuring and Severance Costs $ (17) $ (49) $ (43) $ (76)
(c) Operating Income (Loss) for the six months ended June 30, 2014 included a $441 million gain in connection with the sale of the Company’s space in Time
Warner Center.
Three Months Ended June 30, Six Months Ended June 30, 2014 2013 2014 2013 Revenues:
(recast)(a) (recast)(a)
Turner $ 2,750 $ 2,627 $ 5,343 $ 5,097 Home Box Office 1,417 1,216 2,756 2,444 Warner Bros. 2,870 2,941 5,936 5,622 Intersegment eliminations (249) (176) (444) (348) Total Revenues $ 6,788 $ 6,608 $ 13,591 $ 12,815 Adjusted Operating Income (Loss) (b): Turner $ 940 $ 815 $ 1,835 $ 1,686 Home Box Office 552 450 1,016 867 Warner Bros. 236 184 616 449 Corporate (103) (78) (222) (194) Intersegment eliminations (7) 17 (1) 29 Total Adjusted Operating Income $ 1,618 $ 1,388 $ 3,244 $ 2,837 Operating Income (Loss) (b): Turner $ 929 $ 815 $ 1,829 $ 1,666 Home Box Office 548 459 1,012 876 Warner Bros. 234 181 603 444 Corporate (c) (137) (85) 172 (209) Intersegment eliminations (7) 17 (1) 29 Total Operating Income $ 1,567 $ 1,387 $ 3,615 $ 2,806 Depreciation and Amortization: Turner $ 56 $ 63 $ 114 $ 126 Home Box Office 22 23 47 45 Warner Bros. 100 94 193 187 Corporate 7 8 14 15 Total Depreciation and Amortization $ 185 $ 188 $ 368 $ 373
3

Presented below is a discussion of the performance of Time Warner’s segments for the second quarter of 2014. Unless otherwise noted, the dollar amounts in parentheses represent year-over-year changes. TURNER Revenues rose 5% ($123 million) to $2.8 billion, mainly due to growth of 8% ($99 million) in Subscription revenues and 1% ($13 million) in Advertising revenues. The increase in Subscription revenues was primarily due to higher domestic rates and international growth, partially offset by the negative effect of foreign currency exchange rates. Advertising revenues increased due to growth at Turner’s domestic and international networks, partially offset by the negative effect of foreign currency exchange rates. Domestic advertising revenues benefited from the airing of two 2014 NCAA Division I Men’s Basketball Championship tournament (the “NCAA Tournament”) semifinal games and higher pricing, partially offset by lower audience delivery and demand. Adjusted Operating Income increased 15% ($125 million) to $940 million due to higher revenues. Expenses were flat in the quarter as higher programming costs were offset by lower marketing expenses and the reversal of an accrued contingency. Programming costs grew 5% primarily due to higher costs related to the NCAA Tournament. Operating Income increased 14% ($114 million) to $929 million. TNT ranked as ad-supported cable’s #1 primetime network among total viewers and adults 18-34, 18-49 and 25-54 in the second quarter and The Last Ship and Murder in the First are the two most-watched new series on ad-supported cable year-to-date. TBS was the #3 ad-supported cable network in primetime among adults 18-49 and 25-54, and The Big Bang Theory remained the #1 comedy on ad-supported cable among total viewers and adults 18-49 for the 10th consecutive quarter. Adult Swim was ad-supported cable’s #1 total day network among adults 18-24, 18-34 and 18-49, and it ranked #1 among adults 18-34 for the 25th consecutive quarter. HOME BOX OFFICE Revenues grew 17% ($201 million) to $1.4 billion, reflecting increases of 10% ($101 million) in Subscription revenues and 56% ($98 million) in Content revenues. Subscription revenues increased mainly from higher domestic rates and the consolidation of HBO Asia and HBO South Asia (collectively, “HBO Asia”) and HBO Nordic. The increase in Content revenues was primarily due to the licensing of select original programming to Amazon Prime Instant Video. Adjusted Operating Income rose 23% ($102 million) to $552 million, reflecting higher revenues, partially offset by increased expenses due to higher programming costs as well as the comparison against the prior year’s quarter, which benefited from a $31 million adjustment to a receivable allowance. Programming costs grew 11% due to increased original programming expenses as well as the consolidation of HBO Asia and HBO Nordic. Operating Income increased 19% ($89 million) to $548 million. The prior year quarter included a gain as a result of Home Box Office’s acquisition of its former partner’s interest in HBO Nordic. HBO received 99 Primetime Emmy nominations in July, the most for any network for the fourteenth year in a row and more than double the nominations of the closest competitor for the second consecutive year. Nominations included Outstanding Drama Series for Game of Thrones and True Detective, Outstanding Comedy Series for Silicon Valley and VEEP and Outstanding Television Movie for Muhammad Ali’s Greatest Fight and The Normal Heart. The fourth season of Game of Thrones, which concluded in June, averaged a gross audience of 19.0 million viewers making it the most watched season of an original series in HBO’s history, surpassing the most watched season of The Sopranos in 2002.
4
WARNER BROS. Revenues decreased 2% ($71 million) to $2.9 billion, mainly due to softer theatrical performance in the current year quarter compared to the prior year’s theatrical slate, which included Man of Steel, The Hangover Part III and The Great Gatsby. The decline was partially offset by an increase in home entertainment revenues due to the timing of the release of The Hobbit: The Desolation of Smaug, the strong performance of The LEGO Movie and continued growth in electronic sell-through, as well as growth in license fees from television production. Adjusted Operating Income increased 28% ($52 million) to $236 million as contributions from home entertainment and television, as well as lower restructuring costs and reversals of bad debt reserves, more than offset the impact of softer theatrical performances. Operating Income grew 29% ($53 million) to $234 million. Heading into the 2014-2015 television season, Warner Bros. Television Group is once again the #1 producer of shows for the broadcast networks, a position it has held for 11 of the past 12 seasons. Warner Bros. Television Group will have 31 shows on broadcast networks, including at least two primetime series on each network, and 60 shows across broadcast and cable. In June, Warner Bros. Television Group acquired Eyeworks Group’s operations outside of the U.S., increasing its international production capabilities. CONSOLIDATED NET INCOME AND PER SHARE RESULTS Company Results Adjusted EPS was $0.98 for the three months ended June 30, 2014, compared to $0.76 in last year’s second quarter. The increase in Adjusted EPS primarily reflects higher Adjusted Operating Income and fewer shares outstanding. For the three months ended June 30, 2014, the Company had Income from Continuing Operations attributable to Time Warner common shareholders of $843 million, or $0.94 per diluted common share. This compares to Income from Continuing Operations attributable to Time Warner common shareholders in the second quarter of 2013 of $698 million, or $0.73 per diluted common share. For the second quarter of 2014 and 2013, the Company had Net Income of $850 million and $771 million, respectively. USE OF NON-GAAP FINANCIAL MEASURES The Company utilizes Adjusted Operating Income (Loss) and Adjusted Operating Income margin, among other measures, to evaluate the performance of its businesses. Adjusted Operating Income (Loss) is Operating Income (Loss) excluding the impact of noncash impairments of goodwill, intangible and fixed assets; gains and losses on operating assets (other than deferred gains on sale-leasebacks); gains and losses recognized in connection with pension and other postretirement benefit plan curtailments or settlements; external costs related to mergers, acquisitions or dispositions, as well as contingent consideration related to such transactions, to the extent such costs are expensed; and amounts related to securities litigation and government investigations. Adjusted Operating Income margin is defined as Adjusted Operating Income divided by Revenues. These measures are considered important indicators of the operational strength of the Company’s businesses. Adjusted Income from Continuing Operations attributable to Time Warner Inc. common shareholders is Income from Continuing Operations attributable to Time Warner Inc. common shareholders excluding
5
noncash impairments of goodwill, intangible and fixed assets and investments; gains and losses on operating assets (other than deferred gains on sale-leasebacks), liabilities and investments; gains and losses recognized in connection with pension and other postretirement benefit plan curtailments or settlements; external costs related to mergers, acquisitions, investments or dispositions, as well as contingent consideration related to such transactions, to the extent such costs are expensed; amounts related to securities litigation and government investigations; and amounts attributable to businesses classified as discontinued operations; as well as the impact of taxes and noncontrolling interests on the above items and the Company’s share of the above items with respect to equity method investments. Similarly, Adjusted EPS is Diluted Income per Common Share from Continuing Operations attributable to Time Warner Inc. common shareholders excluding the above items. Adjusted Income from Continuing Operations attributable to Time Warner Inc. common shareholders and Adjusted EPS are considered important indicators of the operational strength of the Company’s businesses as these measures eliminate amounts that do not reflect the fundamental performance of the Company’s businesses. The Company utilizes Adjusted EPS, among other measures, to evaluate the performance of its businesses both on an absolute basis and relative to its peers and the broader market. Many investors also use an adjusted EPS measure as a common basis for comparing the performance of different companies. Some limitations of Adjusted Operating Income (Loss), Adjusted Operating Income margin, Adjusted Income from Continuing Operations attributable to Time Warner Inc. common shareholders and Adjusted EPS are that they do not reflect certain charges that affect the operating results of the Company’s businesses and they involve judgment as to whether items affect fundamental operating performance. Free Cash Flow is defined as Cash Provided by Operations from Continuing Operations plus payments related to securities litigation and government investigations (net of any insurance recoveries), external costs related to mergers, acquisitions, investments or dispositions, to the extent such costs are expensed, contingent consideration payments made in connection with acquisitions, and excess tax benefits from equity instruments, less capital expenditures, principal payments on capital leases and partnership distributions, if any. The Company uses Free Cash Flow to evaluate its businesses and this measure is considered an important indicator of the Company’s liquidity, including its ability to reduce net debt, make strategic investments, pay dividends to common shareholders and repurchase stock. A general limitation of these measures is that they are not prepared in accordance with U.S. generally accepted accounting principles and may not be comparable to similarly titled measures of other companies due to differences in methods of calculation and excluded items. Adjusted Operating Income (Loss), Adjusted Income from Continuing Operations attributable to Time Warner Inc. common shareholders, Adjusted EPS and Free Cash Flow should be considered in addition to, not as a substitute for, the Company’s Operating Income (Loss), Income from Continuing Operations attributable to Time Warner Inc. common shareholders, Diluted Income per Common Share from Continuing Operations and various cash flow measures (e.g., Cash Provided by Operations from Continuing Operations), as well as other measures of financial performance and liquidity reported in accordance with U.S. generally accepted accounting principles. ABOUT TIME WARNER INC. Time Warner Inc., a global leader in media and entertainment with businesses in television networks and film and TV entertainment, uses its industry-leading operating scale and brands to create, package and deliver high-quality content worldwide on a multi-platform basis. CAUTION CONCERNING FORWARD-LOOKING STATEMENTS This document contains forward-looking statements within the meaning of the Private Securities Litigation Reform Act of 1995. These statements are based on management’s current expectations or beliefs, and are subject to uncertainty and changes in circumstances. Actual results may vary materially from those
6

expressed or implied by the statements herein due to changes in economic, business, competitive, technological, strategic and/or regulatory factors and other factors affecting the operation of Time Warner’s businesses. More detailed information about these factors may be found in filings by Time Warner with the Securities and Exchange Commission, including its most recent Annual Report on Form 10-K and subsequent Quarterly Reports on Form 10-Q. Time Warner is under no obligation to, and expressly disclaims any such obligation to, update or alter its forward-looking statements, whether as a result of new information, future events, or otherwise. INFORMATION ON BUSINESS OUTLOOK RELEASE & CONFERENCE CALL Time Warner Inc. issued a separate release today regarding its 2014 full-year business outlook. The Company’s conference call can be heard live at 10:30 am ET on Wednesday, August 6, 2014. To listen to the call, visit www.timewarner.com/investors. CONTACTS: Corporate Communications Investor Relations Keith Cocozza (212) 484-7482 Michael Kopelman (212) 484-8920 Michael Senno (212) 484-8950
7
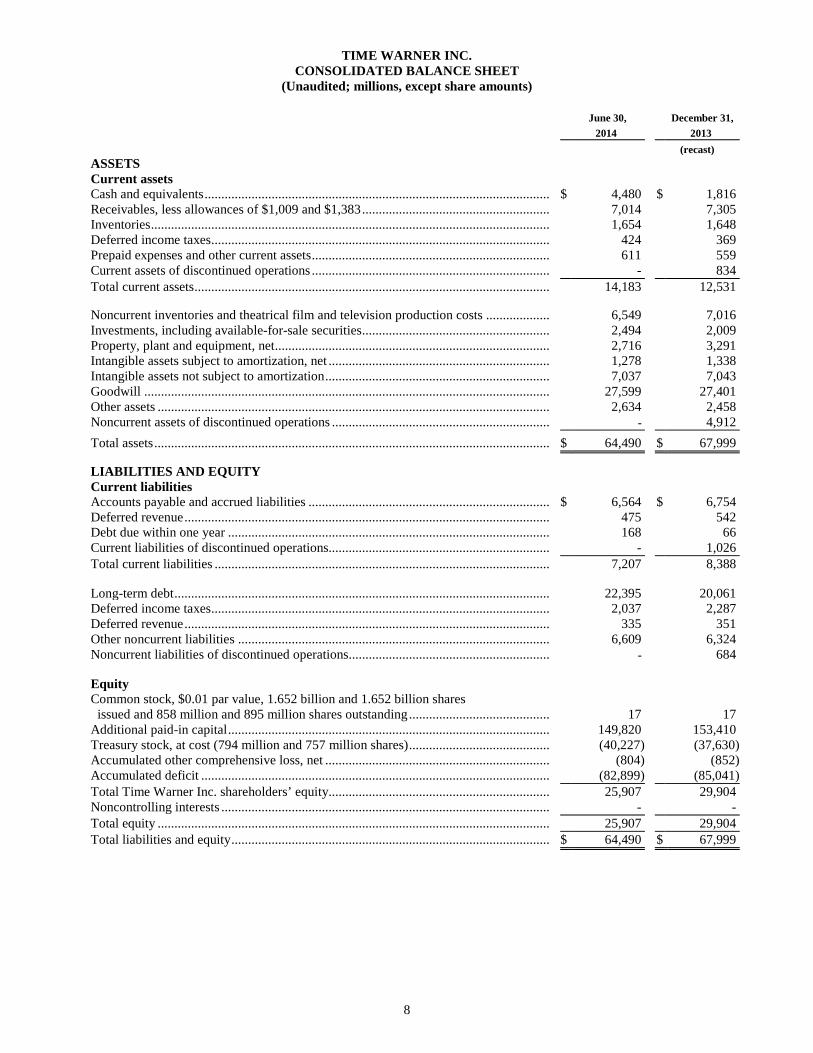
TIME WARNER INC. CONSOLIDATED BALANCE SHEET
(Unaudited; millions, except share amounts)
June 30, December 31, 2014 2013 (recast) ASSETS Current assets Cash and equivalents ....................................................................................................... $ 4,480 $ 1,816 Receivables, less allowances of $1,009 and $1,383 ........................................................ 7,014 7,305 Inventories ....................................................................................................................... 1,654 1,648 Deferred income taxes ..................................................................................................... 424 369 Prepaid expenses and other current assets ....................................................................... 611 559 Current assets of discontinued operations ....................................................................... - 834 Total current assets .......................................................................................................... 14,183 12,531 Noncurrent inventories and theatrical film and television production costs ................... 6,549 7,016 Investments, including available-for-sale securities ........................................................ 2,494 2,009 Property, plant and equipment, net .................................................................................. 2,716 3,291 Intangible assets subject to amortization, net .................................................................. 1,278 1,338 Intangible assets not subject to amortization ................................................................... 7,037 7,043 Goodwill ......................................................................................................................... 27,599 27,401 Other assets ..................................................................................................................... 2,634 2,458 Noncurrent assets of discontinued operations ................................................................. - 4,912 Total assets ...................................................................................................................... $ 64,490 $ 67,999 LIABILITIES AND EQUITY Current liabilities Accounts payable and accrued liabilities ........................................................................ $ 6,564 $ 6,754 Deferred revenue ............................................................................................................. 475 542 Debt due within one year ................................................................................................ 168 66 Current liabilities of discontinued operations.................................................................. - 1,026 Total current liabilities .................................................................................................... 7,207 8,388 Long-term debt ................................................................................................................ 22,395 20,061 Deferred income taxes ..................................................................................................... 2,037 2,287 Deferred revenue ............................................................................................................. 335 351 Other noncurrent liabilities ............................................................................................. 6,609 6,324 Noncurrent liabilities of discontinued operations............................................................ - 684 Equity Common stock, $0.01 par value, 1.652 billion and 1.652 billion shares issued and 858 million and 895 million shares outstanding .......................................... 17 17 Additional paid-in capital ................................................................................................ 149,820 153,410 Treasury stock, at cost (794 million and 757 million shares) .......................................... (40,227) (37,630) Accumulated other comprehensive loss, net ................................................................... (804) (852) Accumulated deficit ........................................................................................................ (82,899) (85,041) Total Time Warner Inc. shareholders’ equity.................................................................. 25,907 29,904 Noncontrolling interests .................................................................................................. - - Total equity ..................................................................................................................... 25,907 29,904 Total liabilities and equity ............................................................................................... $ 64,490 $ 67,999
8

TIME WARNER INC. CONSOLIDATED STATEMENT OF OPERATIONS
(Unaudited; millions, except per share amounts)
Three Months Ended Six Months Ended 6/30/14 6/30/13 6/30/14 6/30/13 (recast) (recast)
Revenues ................................................................. $ 6,788 $ 6,608 $ 13,591 $ 12,815 Costs of revenues .................................................... (3,925) (3,908) (7,776) (7,350) Selling, general and administrative ......................... (1,217) (1,219) (2,487) (2,469) Amortization of intangible assets ............................ (50) (51) (100) (101) Restructuring and severance costs .......................... (17) (49) (43) (76) Asset impairments .................................................. (14) (3) (26) (30) Gain on operating assets, net ................................... 2 9 456 17 Operating income .................................................... 1,567 1,387 3,615 2,806 Interest expense, net ................................................ (296) (300) (561) (589) Other income (loss), net .......................................... 6 (56) (5) (40) Income from continuing operations before income taxes .......................................................... 1,277 1,031 3,049 2,177 Income tax provision ............................................... (434) (333) (841) (715) Income from continuing operations ........................ 843 698 2,208 1,462 Discontinued operations, net of tax ......................... 7 73 (66) 63 Net income .............................................................. 850 771 2,142 1,525 Less Net loss attributable to noncontrolling interests ......................................... - - - - Net income attributable to Time Warner Inc. shareholders .......................................................... $ 850 $ 771 $ 2,142 $ 1,525 Per share information attributable to Time Warner Inc. common shareholders: Basic income per common share from continuing operations ............................................ $ 0.96 $ 0.75 $ 2.49 $ 1.56 Discontinued operations .......................................... 0.01 0.08 (0.07) 0.07 Basic net income per common share ....................... $ 0.97 $ 0.83 $ 2.42 $ 1.63 Average basic common shares outstanding ............. 874.8 928.6 882.9 930.7 Diluted income per common share from continuing operations ............................................ $ 0.94 $ 0.73 $ 2.45 $ 1.53 Discontinued operations .......................................... 0.01 0.08 (0.08) 0.07 Diluted net income per common share .................... $ 0.95 $ 0.81 $ 2.37 $ 1.60 Average diluted common shares outstanding .......... 894.2 950.8 902.4 953.6 Cash dividends declared per share of common stock ...................................................... $ 0.3175 $ 0.2875 $ 0.6350 $ 0.5750
9
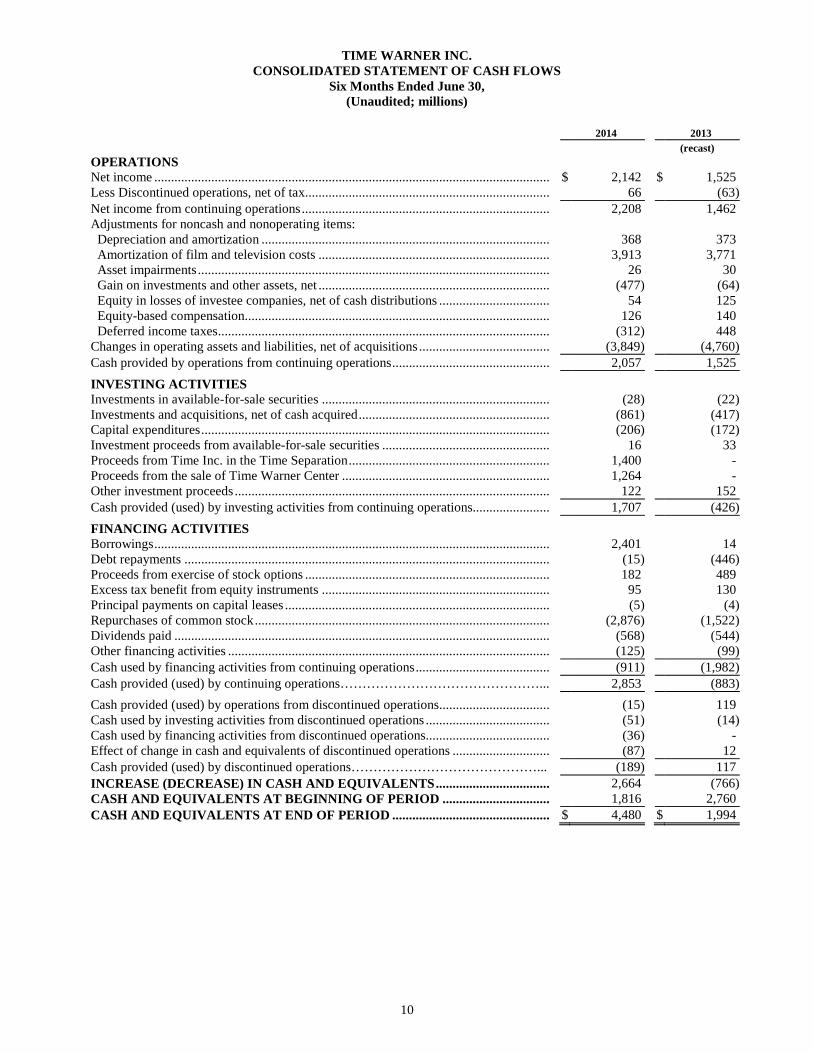
TIME WARNER INC. CONSOLIDATED STATEMENT OF CASH FLOWS
Six Months Ended June 30, (Unaudited; millions)
2014 2013 (recast) OPERATIONS Net income ...................................................................................................................... $ 2,142 $ 1,525 Less Discontinued operations, net of tax......................................................................... 66 (63) Net income from continuing operations .......................................................................... 2,208 1,462 Adjustments for noncash and nonoperating items: Depreciation and amortization ...................................................................................... 368 373 Amortization of film and television costs ..................................................................... 3,913 3,771 Asset impairments ......................................................................................................... 26 30 Gain on investments and other assets, net ..................................................................... (477) (64) Equity in losses of investee companies, net of cash distributions ................................. 54 125 Equity-based compensation........................................................................................... 126 140 Deferred income taxes ................................................................................................... (312) 448 Changes in operating assets and liabilities, net of acquisitions ....................................... (3,849) (4,760) Cash provided by operations from continuing operations ............................................... 2,057 1,525 INVESTING ACTIVITIES Investments in available-for-sale securities .................................................................... (28) (22) Investments and acquisitions, net of cash acquired ......................................................... (861) (417) Capital expenditures ........................................................................................................ (206) (172) Investment proceeds from available-for-sale securities .................................................. 16 33 Proceeds from Time Inc. in the Time Separation ............................................................ 1,400 - Proceeds from the sale of Time Warner Center .............................................................. 1,264 - Other investment proceeds .............................................................................................. 122 152 Cash provided (used) by investing activities from continuing operations....................... 1,707 (426) FINANCING ACTIVITIES Borrowings ...................................................................................................................... 2,401 14 Debt repayments ............................................................................................................. (15) (446) Proceeds from exercise of stock options ......................................................................... 182 489 Excess tax benefit from equity instruments .................................................................... 95 130 Principal payments on capital leases ............................................................................... (5) (4) Repurchases of common stock ........................................................................................ (2,876) (1,522) Dividends paid ................................................................................................................ (568) (544) Other financing activities ................................................................................................ (125) (99) Cash used by financing activities from continuing operations ........................................ (911) (1,982) Cash provided (used) by continuing operations………………………………………... 2,853 (883) Cash provided (used) by operations from discontinued operations................................. (15) 119 Cash used by investing activities from discontinued operations ..................................... (51) (14) Cash used by financing activities from discontinued operations..................................... (36) - Effect of change in cash and equivalents of discontinued operations ............................. (87) 12 Cash provided (used) by discontinued operations……………………………………... (189) 117 INCREASE (DECREASE) IN CASH AND EQUIVALENTS .................................. 2,664 (766) CASH AND EQUIVALENTS AT BEGINNING OF PERIOD ................................ 1,816 2,760 CASH AND EQUIVALENTS AT END OF PERIOD ............................................... $ 4,480 $ 1,994
10

TIME WARNER INC. RECONCILIATIONS OF NON-GAAP FINANCIAL MEASURES
(Unaudited; dollars in millions)
Reconciliations of Adjusted Operating Income (Loss) to Operating Income (Loss) and Adjusted Operating Income Margin to Operating Income Margin
Three Months Ended June 30, 2014
Adjusted Operating
Income (Loss) Asset
Impairments
Gain (Loss) on Operating Assets,
Net Other Operating
Income (Loss) Turner ................................................. $ 940 $ (10) $ 2 $ (3) $ 929 Home Box Office ............................... 552 (4) - - 548 Warner Bros. ...................................... 236 - - (2) 234 Corporate ............................................ (103) - - (34) (137) Intersegment eliminations .................. (7) - - - (7) Time Warner ...................................... $ 1,618 $ (14) $ 2 $ (39) $ 1,567 Margin(a) ............................................. 23.8% (0.2%) - (0.5%) 23.1%
Three Months Ended June 30, 2013 (recast)
Adjusted Operating
Income (Loss) Asset
Impairments
Gain (Loss) on Operating Assets,
Net Other Operating
Income (Loss) Turner ................................................. $ 815 $ - $ - $ - $ 815 Home Box Office ............................... 450 - 9 - 459 Warner Bros. ...................................... 184 (3) - - 181 Corporate ............................................ (78) - - (7) (85) Intersegment eliminations .................. 17 - - - 17 Time Warner ...................................... $ 1,388 $ (3) $ 9 $ (7) $ 1,387 Margin(a) ............................................. 21.0% - 0.1% (0.1%) 21.0% Please see below for additional information on items affecting comparability. ___________________ (a) Adjusted Operating Income margin is defined as Adjusted Operating Income divided by Revenues. Operating Income margin is defined as Operating
Income divided by Revenues.
11
TIME WARNER INC. RECONCILIATIONS OF NON-GAAP FINANCIAL MEASURES
(Unaudited; dollars in millions)
Reconciliations of Adjusted Operating Income (Loss) to Operating Income (Loss) and Adjusted Operating Income Margin to Operating Income Margin
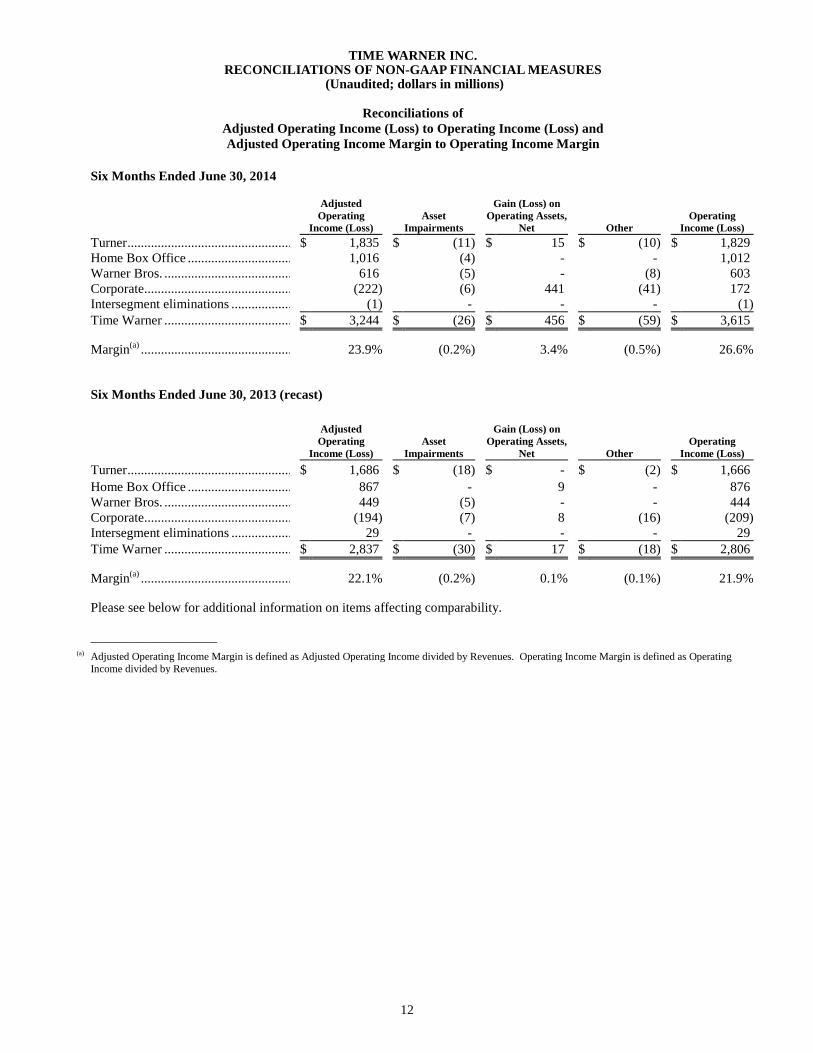
Six Months Ended June 30, 2014
Adjusted Operating
Income (Loss) Asset
Impairments
Gain (Loss) on Operating Assets,
Net Other Operating
Income (Loss) Turner ................................................. $ 1,835 $ (11) $ 15 $ (10) $ 1,829 Home Box Office ............................... 1,016 (4) - - 1,012 Warner Bros. ...................................... 616 (5) - (8) 603 Corporate ............................................ (222) (6) 441 (41) 172 Intersegment eliminations .................. (1) - - - (1) Time Warner ...................................... $ 3,244 $ (26) $ 456 $ (59) $ 3,615 Margin(a) ............................................. 23.9% (0.2%) 3.4% (0.5%) 26.6%
Six Months Ended June 30, 2013 (recast)
Adjusted Operating
Income (Loss) Asset
Impairments
Gain (Loss) on Operating Assets,
Net Other Operating
Income (Loss) Turner ................................................. $ 1,686 $ (18) $ - $ (2) $ 1,666 Home Box Office ............................... 867 - 9 - 876 Warner Bros. ...................................... 449 (5) - - 444 Corporate ............................................ (194) (7) 8 (16) (209) Intersegment eliminations .................. 29 - - - 29 Time Warner ...................................... $ 2,837 $ (30) $ 17 $ (18) $ 2,806 Margin(a) ............................................. 22.1% (0.2%) 0.1% (0.1%) 21.9%
Please see below for additional information on items affecting comparability. ___________________ (a) Adjusted Operating Income Margin is defined as Adjusted Operating Income divided by Revenues. Operating Income Margin is defined as Operating
Income divided by Revenues.
12
TIME WARNER INC. RECONCILIATIONS OF NON-GAAP FINANCIAL MEASURES
(Unaudited; millions, except per share amounts)
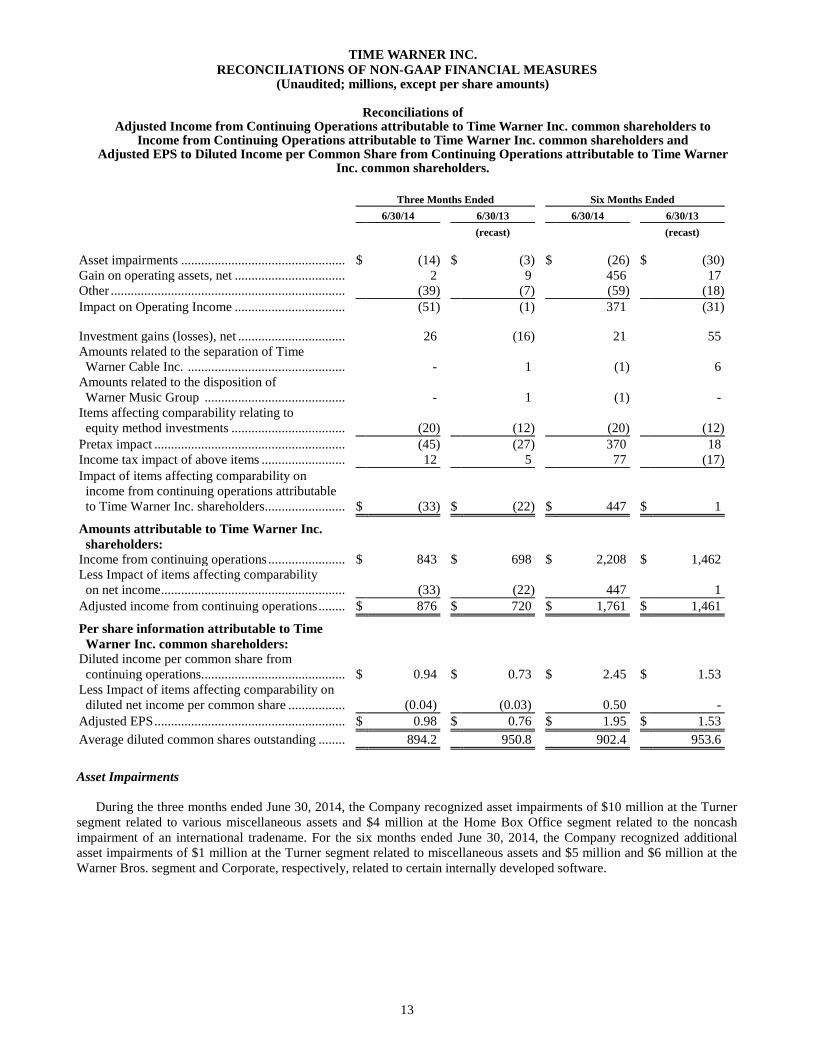
Reconciliations of Adjusted Income from Continuing Operations attributable to Time Warner Inc. common shareholders to
Income from Continuing Operations attributable to Time Warner Inc. common shareholders and Adjusted EPS to Diluted Income per Common Share from Continuing Operations attributable to Time Warner
Inc. common shareholders. Three Months Ended Six Months Ended 6/30/14 6/30/13 6/30/14 6/30/13 (recast) (recast)
Asset impairments ................................................. $ (14) $ (3) $ (26) $ (30) Gain on operating assets, net ................................. 2 9 456 17 Other ...................................................................... (39) (7) (59) (18) Impact on Operating Income ................................. (51) (1) 371 (31) Investment gains (losses), net ................................ 26 (16) 21 55 Amounts related to the separation of Time Warner Cable Inc. ............................................... - 1 (1) 6 Amounts related to the disposition of Warner Music Group .......................................... - 1 (1) - Items affecting comparability relating to equity method investments .................................. (20) (12) (20) (12) Pretax impact ......................................................... (45) (27) 370 18 Income tax impact of above items ......................... 12 5 77 (17) Impact of items affecting comparability on income from continuing operations attributable to Time Warner Inc. shareholders ........................ $ (33) $ (22) $ 447 $ 1 Amounts attributable to Time Warner Inc. shareholders: Income from continuing operations ....................... $ 843 $ 698 $ 2,208 $ 1,462 Less Impact of items affecting comparability on net income ....................................................... (33) (22) 447 1 Adjusted income from continuing operations ........ $ 876 $ 720 $ 1,761 $ 1,461 Per share information attributable to Time Warner Inc. common shareholders: Diluted income per common share from continuing operations........................................... $ 0.94 $ 0.73 $ 2.45 $ 1.53 Less Impact of items affecting comparability on diluted net income per common share ................. (0.04) (0.03) 0.50 - Adjusted EPS ......................................................... $ 0.98 $ 0.76 $ 1.95 $ 1.53 Average diluted common shares outstanding ........ 894.2 950.8 902.4 953.6 Asset Impairments
During the three months ended June 30, 2014, the Company recognized asset impairments of $10 million at the Turner
segment related to various miscellaneous assets and $4 million at the Home Box Office segment related to the noncash impairment of an international tradename. For the six months ended June 30, 2014, the Company recognized additional asset impairments of $1 million at the Turner segment related to miscellaneous assets and $5 million and $6 million at the Warner Bros. segment and Corporate, respectively, related to certain internally developed software.
13
TIME WARNER INC. RECONCILIATIONS OF NON-GAAP FINANCIAL MEASURES
(Unaudited; millions, except per share amounts)
During the three months ended June 30, 2013, the Company recognized miscellaneous asset impairments of $3 million at the Warner Bros. segment. During the six months ended June 30, 2013, the Company recognized asset impairments of $18 million at the Turner segment consisting of $12 million related to certain international intangible assets and $6 million related to programming assets resulting from Turner’s decision in the first quarter of 2013 to shut down certain of its entertainment networks in Spain, $5 million at the Warner Bros. segment related to miscellaneous assets and $7 million at Corporate related to certain internally developed software. Gain on Operating Assets, Net
For the three months ended June 30, 2014, the Company recognized a $2 million gain at the Turner segment, primarily related to the sale of a building in South America. For the six months ended June 30, 2014, the Company also recognized a $13 million gain at the Turner segment related to the sale of Zite, Inc., a news content aggregation and recommendation platform, and a $441 million gain at Corporate in connection with the sale and leaseback of the Company’s space in Time Warner Center.
For the three and six months ended June 30, 2013, the Company recognized a $9 million gain at the Home Box Office
segment as a result of the acquisition of Home Box Office’s former partner’s interest in HBO Nordic. For the six months ended June 30, 2013, the Company also recognized an $8 million gain at Corporate on the disposal of certain corporate assets. Other
Other reflects external costs related to mergers, acquisitions or dispositions of $39 million and $59 million for the three
and six months ended June 30, 2014, respectively, and $7 million and $18 million for the three and six months ended June 30, 2013, respectively. External costs related to mergers, acquisitions or dispositions for the three and six months ended June 30, 2014 consisted of $3 million and $10 million, respectively, at the Turner segment primarily related to exit costs in connection with the shutdown of CNN Latino, a Spanish-language news broadcast programming block, $2 million and $8 million, respectively, at the Warner Bros. segment primarily related to the acquisition of the operations outside the U.S. of Eyeworks Group, a television production and distribution company, and $34 million and $41 million, respectively, at Corporate related to the legal and structural separation of Time Inc. from Time Warner (the “Time Separation”). External costs related to mergers, acquisitions or dispositions for the three and six months ended June 30, 2013 consisted of $7 million and $16 million, respectively, at Corporate related to the Time Separation and, for the six months ended June 30, 2013, $2 million at the Turner segment related to the shutdown of certain of Turner’s entertainment networks in Spain.
External costs related to mergers, acquisitions or dispositions are included in Selling, general and administrative
expenses in the accompanying Consolidated Statement of Operations. Investment Gains (Losses), Net
For the three and six months ended June 30, 2014, the Company recognized $26 million and $21 million, respectively, of net miscellaneous investment gains. For the three months ended June 30, 2013, the Company recognized $16 million of net miscellaneous investment losses. For the six months ended June 30, 2013, the Company recognized $55 million of net miscellaneous investment gains consisting of a $65 million gain on the sale of the Company’s investment in a theater venture in Japan, which included a $10 million gain related to a foreign currency contract, and $10 million of net miscellaneous investment losses. Amounts Related to the Separation of Time Warner Cable Inc.
The Company recognized other expense of $1 million for the six months ended June 30, 2014 and other income of $1 million and $6 million for the three and six months ended June 30, 2013, respectively, related to the expiration, exercise and net change in the estimated fair value of Time Warner equity awards held by Time Warner Cable Inc. employees, which has been reflected in Other income (loss), net in the accompanying Consolidated Statement of Operations.
14
TIME WARNER INC. RECONCILIATIONS OF NON-GAAP FINANCIAL MEASURES
(Unaudited; millions, except per share amounts) Amounts Related to the Disposition of Warner Music Group
The Company recognized other expense of $1 million for the six months ended June 30, 2014 and a gain of $1 million
for the three months ended June 30, 2013 primarily related to a tax indemnification obligation associated with the disposition of Warner Music Group in 2004. These amounts have been reflected in Other income (loss), net in the accompanying Consolidated Statement of Operations. Items Affecting Comparability Relating to Equity Method Investments
For both the three and six months ended June 30, 2014, the Company recognized $12 million as its share of a loss on the extinguishment of debt recorded by an equity method investee and $8 million as its share of discontinued operations recorded by an equity method investee. For both the three and six months ended June 30, 2013, the Company recognized $12 million as its share of a loss on the extinguishment of debt recorded by an equity method investee. These amounts have been reflected in Other loss, net in the accompanying Consolidated Statement of Operations. Income Tax Impact
The income tax impact reflects the estimated tax provision or tax benefit associated with each item affecting comparability. The estimated tax provision or tax benefit can vary based on certain factors, including the taxability or deductibility of the items and foreign tax on certain items.
15

TIME WARNER INC. RECONCILIATIONS OF NON-GAAP FINANCIAL MEASURES
(Unaudited; millions)
Reconciliation of Cash Provided by Operations from Continuing Operations to Free Cash Flow
Three Months Ended Six Months Ended
6/30/14 6/30/13 6/30/14 6/30/13
(recast) (recast) Cash provided by operations from continuing operations ............................................................. $ 324 $ 778 $ 2,057 $ 1,525 Add external costs related to mergers, acquisitions, investments or dispositions and contingent consideration payments ............... 17 7 32 216 Add excess tax benefits from equity instruments ... 31 46 95 130 Less capital expenditures ....................................... (114) (93) (206) (172) Less principal payments on capital leases .............. (2) (2) (5) (4) Free Cash Flow ...................................................... $ 256 $ 736 $ 1,973 $ 1,695
16
TIME WARNER INC. NOTES TO CONSOLIDATED FINANCIAL STATEMENTS
Note 1. DESCRIPTION OF BUSINESS AND BASIS OF PRESENTATION
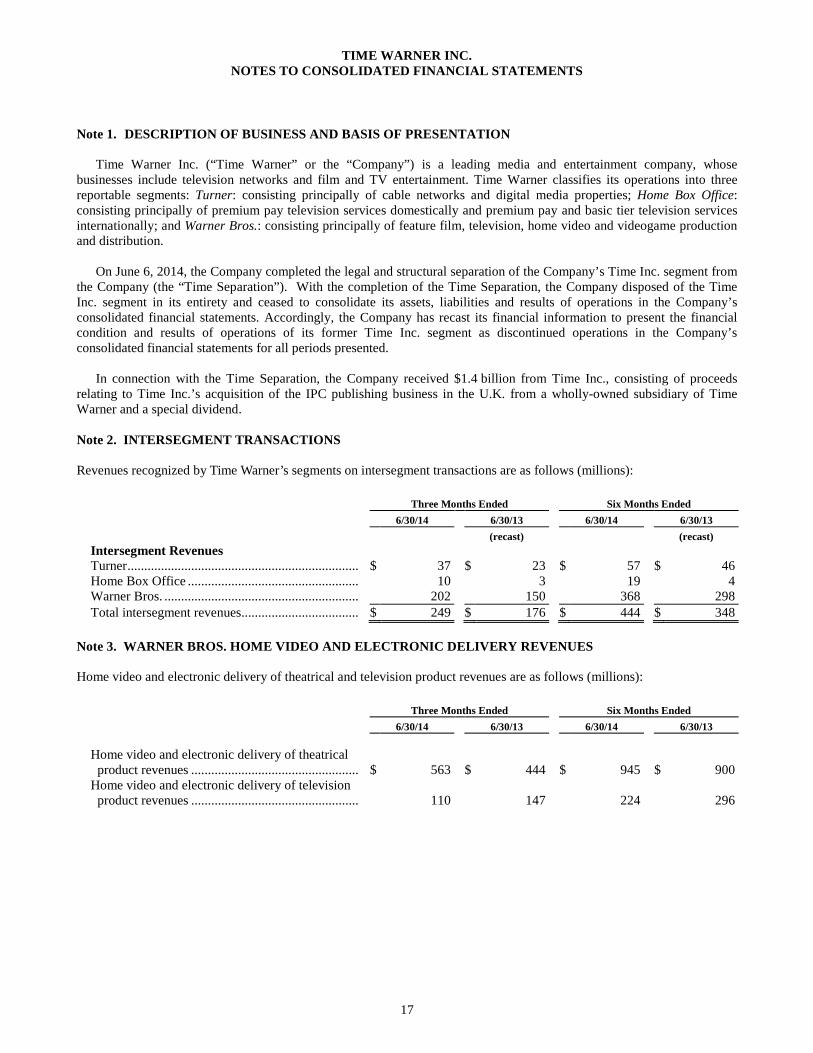
Time Warner Inc. (“Time Warner” or the “Company”) is a leading media and entertainment company, whose businesses include television networks and film and TV entertainment. Time Warner classifies its operations into three reportable segments: Turner: consisting principally of cable networks and digital media properties; Home Box Office: consisting principally of premium pay television services domestically and premium pay and basic tier television services internationally; and Warner Bros.: consisting principally of feature film, television, home video and videogame production and distribution.
On June 6, 2014, the Company completed the legal and structural separation of the Company’s Time Inc. segment from
the Company (the “Time Separation”). With the completion of the Time Separation, the Company disposed of the Time Inc. segment in its entirety and ceased to consolidate its assets, liabilities and results of operations in the Company’s consolidated financial statements. Accordingly, the Company has recast its financial information to present the financial condition and results of operations of its former Time Inc. segment as discontinued operations in the Company’s consolidated financial statements for all periods presented.
In connection with the Time Separation, the Company received $1.4 billion from Time Inc., consisting of proceeds
relating to Time Inc.’s acquisition of the IPC publishing business in the U.K. from a wholly-owned subsidiary of Time Warner and a special dividend. Note 2. INTERSEGMENT TRANSACTIONS Revenues recognized by Time Warner’s segments on intersegment transactions are as follows (millions): Three Months Ended Six Months Ended 6/30/14 6/30/13 6/30/14 6/30/13 (recast) (recast) Intersegment Revenues Turner ...................................................................... $ 37 $ 23 $ 57 $ 46 Home Box Office .................................................... 10 3 19 4 Warner Bros. ........................................................... 202 150 368 298 Total intersegment revenues.................................... $ 249 $ 176 $ 444 $ 348 Note 3. WARNER BROS. HOME VIDEO AND ELECTRONIC DELIVERY REVENUES Home video and electronic delivery of theatrical and television product revenues are as follows (millions): Three Months Ended Six Months Ended 6/30/14 6/30/13 6/30/14 6/30/13 Home video and electronic delivery of theatrical product revenues ................................................... $ 563 $ 444 $ 945 $ 900 Home video and electronic delivery of television product revenues ................................................... 110 147 224 296
17