Embed Size (px)
Citation preview

Twinning project, activity 4Maintenance assessment
The development of ProRail
By Jan Swier and Ted Slump, ProRail, The Netherlands
Tel. +31 30 235 5315. e-mail: [email protected]
© ProRail. All rights reserved File: g:\Js05\0406.Slovenie.organisation Prorail2
2
526527
539
Ah
LwHlg
Stv
Swd
Rd
Dz
GnZb
Vdm
Emn
CoSb
Mp
Mrb
Aml
ZlKpn
WdnHgl
EsDv
ZpApd
WwDr
Em
Ed
AhgZv
Nm
VrkKtr
Amf
Pon
Dld
TlGdm
Ut
Hvs
Gd
Wd
NwsShl
Apn
Asd
Zd
Hlm
Bv
Zvt
Ledn
Utg
Amr
Hwd Hn Ekz
Hdr
Lls
Gv
Hld
Mvt Rtd
KfhDdr Ddri
Otw
Zlw
Bd Tb
Mdk
Rsd
Esn
Vs
Ha
Sloe
Tnz
Fsz
Ht
VegBtl
Ehv BrVl
Kn
DhBdlg
Wt
Rm
Bon
Std
HrlHz
Mt
Wsm
Ck
Vdg
007
On
Asn
002
011
654
012
653
006
200
016
021
024025
026
033
034
038041
042
043
049
060
062
063
064
070
076
Sptn556
085 087
112
118
124
125
203
204
205
213
226
437
502
Ddn
503
506
Va 507
513
065
530
531
536
543
546
548
551
553
561
564
603
606
608 609
610
613
621
623
924950
605
023
Lar
098
020
084
211
009
107
526526527527
539539
Ah
LwHlg
Stv
Swd
Rd
Dz
GnZb
Vdm
Emn
CoSb
Mp
Mrb
Aml
ZlKpn
WdnHgl
EsDv
ZpApd
WwDr
Em
Ed
AhgZv
Nm
VrkKtr
Amf
Pon
Dld
TlGdm
Ut
Hvs
Gd
Wd
NwsShl
Apn
Asd
Zd
Hlm
Bv
Zvt
Ledn
Utg
Amr
Hwd Hn Ekz
Hdr
Lls
Gv
Hld
Mvt Rtd
KfhDdr Ddri
Otw
Zlw
Bd Tb
Mdk
Rsd
Esn
Vs
Ha
Sloe
Tnz
Fsz
Ht
VegBtl
Ehv BrVl
Kn
DhBdlg
Wt
Rm
Bon
Std
HrlHz
Mt
Wsm
Ck
Vdg
007007
On
Asn
002002
011011
654654
012012
653653
006006
200200
016016
021021
024024025025
026026
033033
034034
038038041041
042042
043043
049049
060060
062062
063063
064064
070070
076076
Sptn556556
085085 087087
112112
118118
124124
125125
203203
204204
205205
213213
226226
437437
502502
Ddn
503503
506506
Va 507507
513513
065065
530530
531531
536536
543543
546546
548548
551551
553553
561561
564564
603603
606606
608608 609609
610610
613613
621621
623623
924924950950
605605
023023
Lar
098098
020020
084084
211211
009009
107107
Facts & Figures
Network length 2,800 km Track length 6,500 kmElectrified track 4,700 kmSwitches 8,700 numberBridges and tunnels 4,500 numberLevel crossings 3,000 numberStations 380 numberPassengers 900,000 per dayTrains 6,000 per day
3
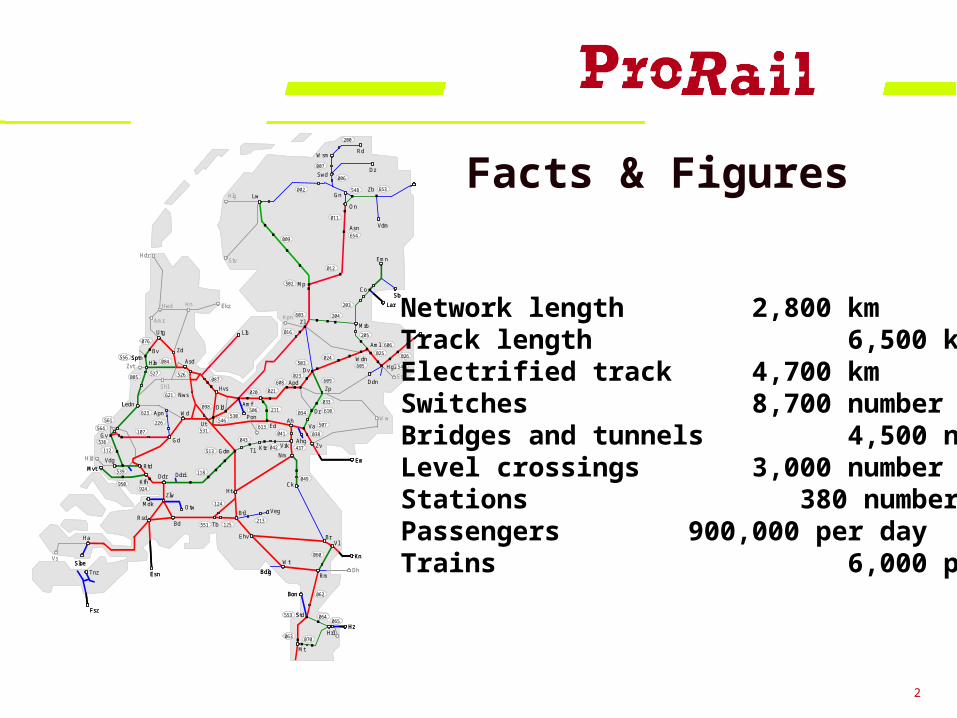
Rail Transport in the Netherlands;separation of exploitation and infra
NV Nederlandse Spoorwegen(Netherlands Railways)
NS Group NV
Rail Infra Trust
Corporate staff
Passenger Services
FreightServices
Stations PropertyOperations
NS FacilityMngt
Participations
Business units
Train Operations Rail Infrastructure
Capacity mngt.
Traffic Control mngt.
Infrastructure mngt.

4
100% outsourcing of Engineering
100% outsourcing of Maintenance & Renewal
Development of rail infrastructure management integration, separation and split-off
< 1990 1990 1994 1998
NS
Engineering
1000
NS Infra:Maintenance
4200
EpOd
Is
5200
Discharge600
Execution of maintenance(NS InfraService)
2800
Managementof maintenance(NS RIB) 800
Track Mainte-nance
New Infra and Renewals
1500
3700
27000
NS RIB1000
2003
ProRailProRail
StruktonVolker StevinBAM/NBM
HollandRailconsult
© ProRail. All rights reserved

5
Restructuring of the railway market in 1994-1998“From specialized contractors to all-round partners”
.
Track renewal (Railbouw BV)
Track renewal (v. Welzenes BV)
Track renewal (Strukton BV)
Renewal of signalling, energy supplyand Telecom (NS Electrorail Group)
Maintenance (NS Infra Services)
Integral
50% 30% 20%Strukton
VolkerStevin
BAMNBM
Maintenance
Track Renewal
Renewal of signaling, energy supply, telecom
Sp
ecia
liza
t io
n

6
CentralRegional
1995-1998
TechnicalStaff
Staff
ManagingDirectors
(2)
RegionManager (3)
Technicalspecialists
Regionmanager (7)
Region headTechniques
(35)
1990-1994
StaffTechnicalStaff
ManagingDirector
(1)
RegionManager (5)
Region manager
technique (20)
Section headTechniques
(80)
Technicalspecialists
Outsourcing of maintenance; shift in skills1999-Today
TechnicalStaff
Staff
Team of Directors
RegionManager (4)
Technicalspecialists
Manager Planning
Manager Realization (4)
(4)
Contractmanagers (11+20)
(4)
Up to 1990
StaffHeads of Techniques
Head(2)
District headtechniques
Section head techniques
TechnicalSpecialists
(5)
(10)
© ProRail. All rights reserved

7
Changes in the way of managing
1994 Orientation 2003 Orientation
* Technology * Business performance
* Implicit output * Explicit output
* Tasks * Processes
* Man-hours * Costs
* Annual budget plan * Multi-year production plan
* Budgets * Results: costs and quality
* Rules & Instructions * Contracts (specifications)
© ProRail. All rights reserved

8
Mission, ambition, themes and targets (2002)MissionThe Rail Infra Manager facilitates optimal operation of the value chain by neutrally creating both possible infrastructure capacity with high reliability, at the lowest possible costs.
Ambitions1. improved operational performance 2. steady growth in train routes 3. improved value for money
ThemesAvailability and reliability
Value for moneyBusiness oriented
Simplification of processes and systemsSafety and the environmentStep-by-step constructionTechnological innovation
Marketing rail infrastructure
TargetsThinking, ideas and actions of
ProRail (and hence of the employees) hallmarked by (RAMS):
•reliability•availability •maintainability•safety

9
Roles in the intuitional triangle (2005)
enGovernment
*Legislator, Shareholder, Financier*Supervisor, Concession granter
*Policy targets and Scope*Guarantee Public Interest
Train operators
*Customers*Trains
RIBVLProRail
*Quality*Functionality
*Capacity*Available and safe
train path

10
enGovernments
Train Operators
Transport concession (Passengers only ) Performance contract
ForwarderPassengers
Forwarders
Repaymentscheme
Network statement Access agreement Payment for use (variable costs) Performance regime (RAM)
Contractors EBs
Process contractsProject specifications
RIBVLProRail
Management concession-Budget (fixed costs)-Performance agreements (RAMSHE)
Business relations in the Netherlands (2005)
RAMSHE = Reliability, Availability, Maintainablity, Safety, Health, Environment
EB = Engineering Bureaus

11
ProRail
Government & TOC’s
Contractors & Consultants
Contract
Contracts
Relationship chain: “from contract to contacts”
TOC= Train Operation Companies

12
Rail Transport (= the product)
The Business of Rail Infra Management
Rail Infrastructure (= means of production)
Rail Infrastructure mngt.Build, maintain and renew rail
infrastructure
Quality•Reliability•Availability•Maintainability•Safety•Health•Environment•Comfort
Functionality•Max. train speed•Max. train length•Max. axle load•Max. gauge train•Capacity
© ProRail. All rights reserved
Traffic ControlRail infrastructure is operated by Traffic Control
Capacity mngt.Specify functionality and divide the capacityof the rail infrastructure
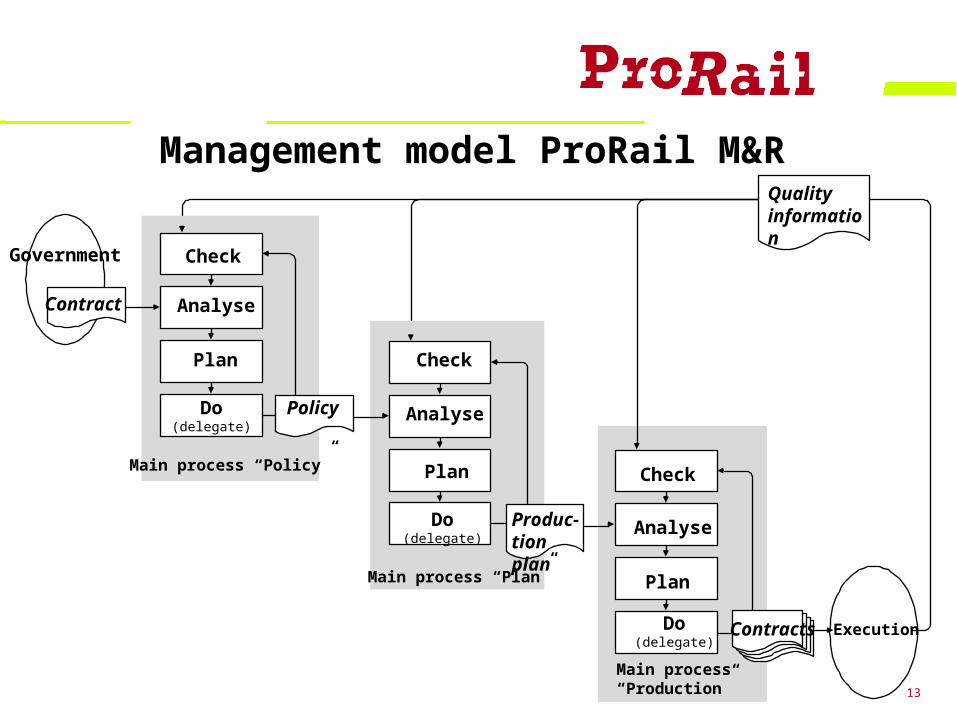
13
Main process “Production”
Check
Analyse
Plan
OpdrachtenOpdrachtenOpdrachtenContractsDo(delegate)
Management model ProRail M&R
Government
Contract
Execution
Quality information
Main process “Plan”
Check
Analyse
Plan
Produc-tion plan
Do(delegate)
Main process “Policy”
Check
Analyse
Do(delegate)
Plan
Policy
14
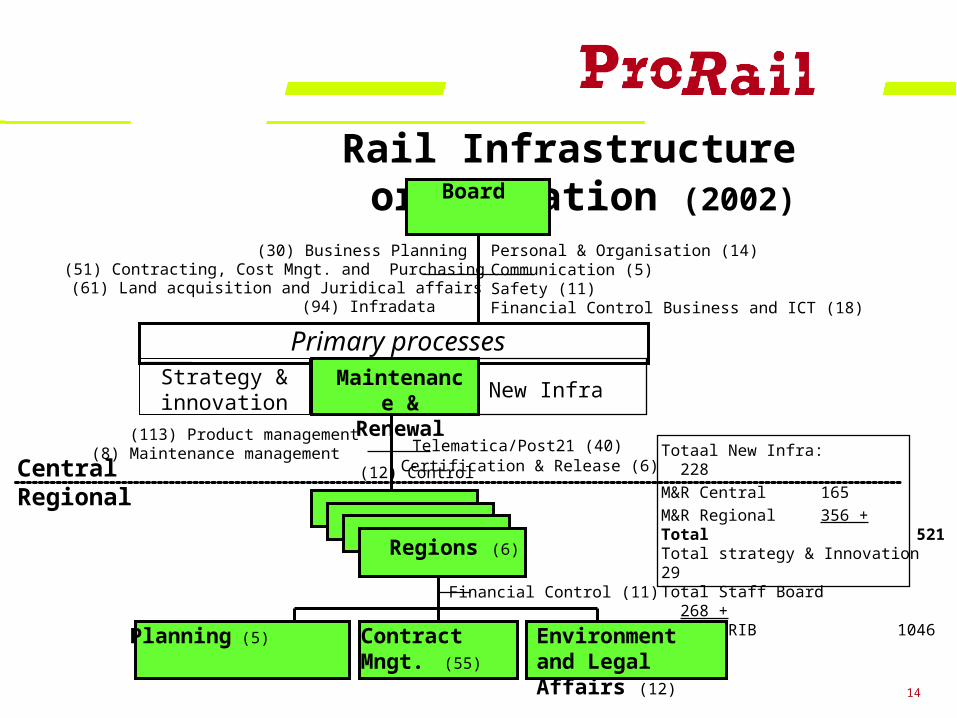
Rail Infrastructure organisation (2002)Board
Personal & Organisation (14)Communication (5)Safety (11)Financial Control Business and ICT (18)
(30) Business Planning (51) Contracting, Cost Mngt. and Purchasing
(61) Land acquisition and Juridical affairs(94) Infradata
Primary processes
Totaal New Infra: 228M&R Central 165M&R Regional 356 +Total 521Total strategy & Innovation 29 Total Staff Board 268 +Totaal RIB 1046
(113) Product management (8) Maintenance management (12) Control Certification & Release (6)
Telematica/Post21 (40)
Regions (6)
Planning (5) Contract Mngt. (55)
Environment and Legal Affairs (12)
Financial Control (11)
Maintenance &
Renewal
New InfraStrategy &innovation
CentralRegional

15
Maintenance & renewal costsTotal yearly costs
168
62
31
34
109
75
114
51
30
0
100
200
300
400
500
600
700
2000
Mio
eur
o
Othere company costsWages & salaries RIBIntrest DepreciationRenewal track & switchesMaintenance stationsSupervisionLarge scale maintenanceSmall scale maintenance
4850 km m
aintra
ck
51
5
9
12
9
3
11
0
10
20
30
40
50
60
70
80
90
100
1
Per
cen
tag
e (%
)
Level Crossings
Telecom
Traffic Control; equipment
Signaling
Energy supply
Bridges & Tunnels
Track
Maintenance costs

16
Separation of train operations and rail infrastructure had an effect on Punctuality
2005 2006 2007
At least 87%
Possible 89%
65
70
75
80
85
90
95
1 2 3 4 5 6 7 8 9 10 11 12 13 14 15 16 17 18 19 20 21 22 23 24 25 26 27 28 29 30 31 32 33 34 35 36 37 38 39 40 41 42 43 44 45 46 47 48 49 50 51 52 1 2 3 4 5 6 7 8 9 10 11 12 13 14 15 16 17 18 19 20 21 22 23 24 25 26 27 28 29 30 31 32 33 34 35 36 37 38 39 40 41 42 43 44 45 46 47 48 49 50 51 52 1 2 3 4 5 6 7 8 9 10 11 12 13 14 15 16 17 18 19 20 21 22 23 24 25 26 27 28 29 30 31 32 33 34 35 36 37 38 39 40 41 42 43 44 45 46 47 48 49 50 51 52 1 2 3 4 5 6 7 8 9 10 11 12 13 14 15 16 17 18 19 20 21 22 23 24 25 26 27 28 29 30 31 32 33 34 35 36 37 38 39 40 41 42 43 44 45 46 47 48 49 50 51 52 53 1 2 3 4 5 6 7 8 9 10 11 12 13 14 15 16 17 18 19 20 21 22 23 24 25 26 27 28 29 30 31 32 33 34 35 36 37 38 39 40 41 42 43 44 45 46 47 48 49 50 51 52 1 2 3 4 5 6 7 8 9 10 11 12 13 14 15 16 17 18 19 20 21 22 23 24 25 26 27 28 29 30 31 32 33 34 35 36 37 38 39 40 41 42 43 44 45 46 47 48 49 50 51 52 1 2 3 4 5 6 7 8 9 10 11 12 13 14 15 16 17 18 19 20 21 22 23 24 25 26 27 28 29 30 31 32 33 34 35 36 37 38 39 40 41 42 43 44 45 46 47 48 49 50 51 52 1 2 3 4 5 6 7 8 9 10 11 12 13 14 15 16 17 18 19 20 21 22 23 24 25 26 27 28 29 30 31 32 33 34 35 36 37 38 39 40 41 42 43 44 45 46 47 48 49 50 51 52 1 2 3 4 5 6 7 8 9 10 11 12 13 14 15 16 17 18 19 20 21 22 23 24 25 26 27 28 29 30 31 32 33 34 35 36 37 38 39 40 41 42 43 44 45 46 47 48 49 50 51 52 1 2 3 4 5 6 7 8 9 10 11 12 13 14 15 16 17 18 19 20 21 22 23 24 25 26 27 28 29 30 31 32
1995 1996 1997 1998 1999 2000 2001 2002 2003 2004
Year
Per
cen
tag
e
< 3 minutes tr
ain delay
© ProRail. All rights reserved
Seperation Suboptimalisation Train Operator
Coöperation and improved performance management

17
According European benchmarks ProRail performs well but……. it has to improve
Intensive used of infra
benchmark gebruik
0
5000
10000
15000
20000
25000
30000
C D E F G
ProRail
I J K L M N Q U
Avera
ge
Bedrijf
Trei
nkm
/km
hfd
.sp
oo
r
Benchmark Utilisation
Good quality of track
Brenchmark spoorstaaf breuken
0
5
10
15
20
25
30
C D E F G
ProRail I J L N U AA
Avera
ge
Bedrijf
Aa
nta
l/1
00
0 k
m h
fd.s
po
or
Benchmark Rail Breaks
15% more expensive as average
Benchmark kosten (2000)
0
20
40
60
80
100
D I C U E J L F G
ProRai
l M N Q K
Gemid
deld
e
Bedrijf
1000
*Eu
ro/k
m h
fd.s
po
or
Benchmark M&R Costs (2002)
Average amount of failures
Storingen; techniek en proces (2002)
0
100
200
300
400
500
600
700
C G
ProRail J K U
Gem
iddeld
Bedrijf
Aan
tal T
AO
's/1
000
km
hfd
.sp
oo
r
Benchmark Failures (technique+Process)

18
Train effecting rail infrastructure failures
5000
6000
7000
8000
9000
10000
1994 1995 1996 1997 1998 1999 2000 2001 2002 2003 2004
Am
ou
nt
Outsourcing of maintenance had effect on reliability
Separations and Reorganisations Recovery
2005 2006 2007
Improved Performance management
At least 7250
Possible 6525
© ProRail. All rights reserved

19
Development of small scale maintenance costs
0
50
100
150
200
250
300
1994 1995 1996 1997 1998 1999 2000 2001 2002 2003 2004
Mio
Eu
ro
Improved performamcemanagement
Outsourcing of maintenance
2005 2006 2007
Cost reduction small scale maintenance
Development of small scale maintenance costs
0
50
100
150
200
250
300
1994 1995 1996 1997 1998 1999 2000 2001 2002 2003 2004
Mio
Eu
ro
Improved performamcemanagement
Outsourcing of maintenance
2005 2006 2007
Cost reduction small scale maintenance
Price Level +14,7 %Outsourcing: - Profit, Risk, Overhead +15,2 % - Conditions of employment + 8,7 % - Efficiency improvements - 12,5%Size and complexity network + 4,1 %Utilization + 6,6 %Personal Safety + 7,0 % +Cost rise 1994-2000 + 43,8 %
Price Level +14,7 %Outsourcing: - Profit, Risk, Overhead +15,2 % - Conditions of employment + 8,7 % - Efficiency improvements - 12,5%Size and complexity network + 4,1 %Utilization + 6,6 %Personal Safety + 7,0 % +Cost rise 1994-2000 + 43,8 %
Outsourcing of small scale maintenance had an effect on costs
-40 mio Euro
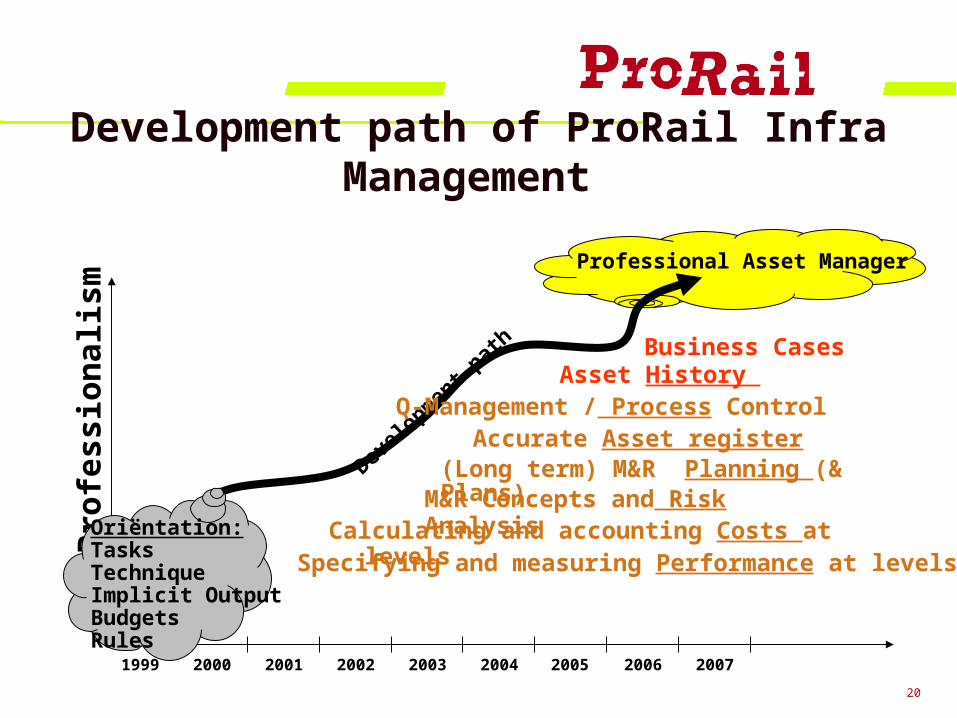
20
Professional Asset Manager
Development path of ProRail Infra Management
Pro
fess
ion
alis
m
Devel
opmen
t pat
h
Calculating and accounting Costs at levelsSpecifying and measuring Performance at levels
(Long term) M&R Planning (& Plans)
Q-Management / Process ControlAccurate Asset register
2001 2002 2003 2004 2005
Asset History
2006 2007
Business Cases
M&R Concepts and Risk Analysis
1999 2000
Oriëntation:TasksTechniqueImplicit OutputBudgetsRules

21
Thank you for your attention
Any questions?