Embed Size (px)
Citation preview

No 5 /2021
Turbulence after lift-off: global economic and insurance market outlook 2022/23
02 Executive summary03 Key takeaways06 Macroeconomic
environment and outlook
21 Insurance market outlook 2022/23
36 Alternative economic and insurance scenarios
40 Appendix

2 Swiss Re Institute sigma No 5/2021
The world economy is making a strong recovery from the COVID-19 shock and the outlook is positive. However, peak growth is behind us and this cyclical recovery is not a structural one. We forecast global real economic growth of 5.6% in 2021, 4.1% in 2022 and 3.0% in 2023. The recovery will be uneven, with risks tilted to the downside. Supply-side shocks, including global supply chain issues, labour shortages and energy shortages, may persist, while monetary policy is becoming less accommodative.1 Inflation is our number one near-term macro risk and we expect it to be elevated for some time, stemming from the same supply-side factors that are constraining growth. Pressure is starting to feed into slower-moving but harder to reverse areas such as rent and wages. We expect these headwinds to weigh on the outlook in 2022 and 2023, making structural healing – the policies that work to reverse the permanent negative impacts of the pandemic on the economy – difficult.
We identify three structural trends that will shape the long-term path of the world economy. These are the “three Ds”: divergence, digitalisation and decarbonisation. We are concerned by growing divergence within and between countries in economic recovery, wealth, income and socio-economic opportunity. These divergences make the recovery fragile. To overcome them, swift progress towards inclusive digital transformation is vital. Digitalisation – the adoption of digital technology throughout the economy including digital infrastructure – is key to higher productivity growth. Finally, the extreme weather events worldwide this year indicate that climate risks are materialising and rapid progress on decarbonisation is imperative. How we transition to a green economy will define the economic outlook going forward, but will not be easy or come without pain, as the energy crisis shows.
We are positive on the outlook for global insurance premiums, expecting above-trend real growth of 3.3% in 2022 and 3.1% in 2023. Growth is benefiting from rising risk awareness in both the life and non-life segments, as consumers and businesses alike seek protection following the shock of the COVID-19 pandemic and above-average natural catastrophes. The ongoing rate hardening in non-life insurance commercial lines will provide further support. By our projections, global insurance premiums should exceed USD 7 trillion for the first time by mid-2022, sooner than we had estimated in July.2 In 2021 we estimate global premiums to grow by 3.4% in real terms, taking global direct premiums written in 2021 to 8% above the 2019 level.
The past year has taught important lessons. The pandemic shock has highlighted the important role the insurance industry plays as a risk absorber in times of crisis by providing financial relief to households, businesses and governments. At the same time, the global supply chain disruptions we have seen highlight the need for better protection to improve societal resilience. Climate risk has also been front of mind given extreme weather events, and above-average insured losses from natural catastrophes add urgency to the race to net-zero carbon emissions. We have also learned how much consumers welcome digital and online insurance, and of the need to be aware of how rising inequality may worsen social inflation in casualty lines.
Insurance sector profitability has come under pressure in 2021, as the industry absorbs COVID-19-related claims, above-average catastrophe losses and high inflation. We expect a strong rebound from 2022. Non-life underwriting profitability should recover fast as insurers internalise expectations of higher inflation, and rates in commercial lines rise again. For life insurers, advances in COVID-19 vaccinations should strengthen profitability after a year of high mortality. In Brazil for instance, the life insurance benefit ratio in April 2021 (97.3%) was more than double that of April 2020 (42.5%). Investment returns will likely be challenged by ongoing low interest rates that do not fully compensate for inflation, making underwriting discipline crucial.
1 On the energy crisis: The global energy crisis: adding fuel to the fire, Swiss Re Institute, 5 October 2021.2 sigma 3/2021 - World insurance: the recovery gains pace, Swiss Re Institute, 14 July 2021.
A robust cyclical economic recovery is set to gradually slow as supply-side shocks constrain growth and lift inflation.
Three Ds shape the long-term outlook: divergence, digitalisation and decarbonisation.
Global insurance demand should grow at above-trend rates in the coming years.
The year has taught important lessons on risk, resilience, climate and digitalisation.
Insurance profitability should improve next year after a challenging 2021.
Executive summary

sigma No 5/2021 Swiss Re Institute 3
We see a positive growth outlook, but the strongest recovery momentum is behind us. Inflation is the number one near-term macro risk.
Note: E = estimates; F = forecasts. Data as of 11 November 2021. Source: Bloomberg, Swiss Re Institute
2020 2021E 2022F 2023F
Actual SRI Consensus SRI Consensus SRI Consensus
Real GDP growth, annual average
US –3.5% 5.5% 5.6% 3.7% 4.0% 1.5% 2.4%
Euro area –6.6% 5.0% 5.1% 4.1% 4.3% 2.0% 2.1%
China 2.3% 8.0% 8.0% 5.1% 5.4% 5.7% 5.4%
Inflation, all-items CPI, annual average
US 1.2% 4.7% 4.4% 5.0% 3.3% 2.2% 2.3%
Euro area 0.3% 2.5% 2.4% 2.6% 2.0% 1.5% 1.5%
China 2.5% 1.3% 1.0% 2.3% 2.2% 2.5% 2.2%
Yield, 10-year govt bond, year-end
US 1.0% 1.4% 1.7% 1.6% 2.0% 1.9% 2.4%
Euro area –0.6% –0.2% –0.2% 0.0% 0.0% 0.2% 0.4%
Three key structural trends will define the long-term economic outlook: divergence, digitalisation and decarbonisation. Divergence – across countries, within countries, and from pre-pandemic global trends – will shape future world growth. Governments are investing heavily in digital transformation to “future proof” economies. And as climate change materialises, rapid progress on decarbonisation is imperative.
Diverging output loss versus pre-pandemic levels, major economies
Note: output loss or gain is in comparison with 2019 level. Source: Bloomberg, Swiss Re Institute
Note (right): estimates are the product of anticipated average market prices and sales of tradeable units. Source: (left) Technology and Innovation Report 2021, UNCTAD, February 2021; (right) World Energy Outlook 2021, IEA, October 2021; Swiss Re Institute
–15%
–10%
–5%
0%
5%
10%
15%
20%
Q4 22Q3 22Q2 22Q1 22Q4 21Q3 21Q2 21Q1 21Q4 20Q3 20Q2 20Q1 20
US Europe China
Forecasts
Growing global market size estimates of new technologies, USD billions Estimated market size of oil and selected clean energy technology to reach net zero emissions by 2050
3.75G
Blockchain
Nanotechnology
Gene editing
3D Printing
AI
Robotics
Big data
Solar PV
Drones
IoT
5G
Blockchain
Nanotechnology
Gene editing
3D Printing
AI
Robotics
Big data
Solar PV
Drones
IoT
54
13032
32
10.6
0.7
69
16 10
344
157
1 500499
191
449.7
2.261
141
277
2018$350 billion
2025$3.2 trillion
Internet of things Solar PVDrones Big data AIRobotics
3D Printing NanotechnologyGene editing Blockchain 5G
Cleanenergy$123B
0
500
1 000
1 500
2 000
2050204020302020
2%5%2%0%
91%
4%16%
61%
5%13%
Oil$1.25T
Oil$182B
Cleanenergy$1.2T
Fuel cells Batteries Wind Solar Oil
Original-Diagramm: siehe Figure 9
Key takeaways

4 Swiss Re Institute sigma No 5/2021 Key takeaways
We forecast global insurance demand to grow faster than its long-term trend rate in 2022 and 2023. Real insurance premium forecasts, global regions
Note: Total insurance premium forecasts are for life and non-life combined. Icons show direction of deviation from long-term trend (2005–2020) for each region. Green triangle indicates a growth rate 0.5% or more above the long-term trend; dash indicates +/–0.5% relative to long-term trend, and red triangle 0.5% or more below the long-term trend. Source: Swiss Re Institute
Total Non-Life Life
2021E 2022–23F 2021E 2022–23F 2021E 2022–23F
World 3.4% 3.2% 3.3% 3.5% 3.5% 2.8%
Advanced markets 3.3% 2.4% 2.8% 2.4% 4.1% 2.3%
North America 2.3% 2.4% 2.7% 2.4% 1.2% 2.2%
EMEA 4.9% 2.0% 2.3% 2.3% 6.9% 1.7%
Asia-Pacific 3.9% 3.2% 4.6% 2.9% 3.8% 3.3%
Emerging markets 3.4% 6.4% 5.8% 8.2% 1.4% 4.6%
Excl China 5.7% 5.1% 4.7% 4.7% 6.9% 5.8%
China 1.5% 7.0% 6.4% 10.3% –2.8% 3.6%
The pandemic and economic recovery have provided key lessons for the insurance industry. The key lessons learned this year
Source: Swiss Re Institute
Increasing inequalityrisks exacerbating
social inflation
Rising risk awareness isgenerating demand for
more insurance protection
Consumers welcomedigital and online insurance
and it should grow rapidly
The re/insurance industryremains a vital risk absorber in times of crisis
Record-breaking weatherextremes add urgency tothe race to net-zero
Supply chain disruptions tobusiness and society showthat better protection is required
Key lessonsof 2021

Key takeaways sigma No 5/2021 Swiss Re Institute 5
We consider three alternative macroeconomic scenarios to our base case of positive global economic growth over the next three years. We give the base case a 65% likelihood, and the three alternatives a combined probability of 35%.
Note: The probabilities reported for each scenario are conditional on the realisation across two dimensions (macroeconomic and financial markets) over a three-year horizon (from 2022 to 2024). The reported narratives are not exhaustive. We give the stagflation scenario a 15% likelihood over three years, but see substantially higher likelihood over a one-year period, and even more so if only the macroeconomic dimension is considered (without the associated financial markets developments). Geopolitical risks are ordered according to their importance and relevance under each scenario. There are other risks that are present under any possible scenario without representing a large threat to the real economy, such as cyber-attacks. Other risks, such as climate policy gridlock, carry significant risk for the real economy but are longer-term than the three-year horizon considered here. Source: Swiss Re Institute
Optimistic Pessimistic
Golden 20s (probability: 10%) Stagflation (probability: 15%) Renewed recession (probability: 10%)
Structural reforms effectively direct spending to infrastructure (including green energy) and making economies more competitive.
Higher long-term productivity and higher interest rates.
Companies increase capex spending to make their corporations future fit.
Persistent supply chain disruptions and ongoing de-globalisation translate into emergence of parallel supply chains.
Overheating of economies de-anchors long-term inflation expectations.
Higher inequality and rising social discontent lead to redistributive policies (e.g. tax reforms, universal basic income, increase in minimum wage, etc).
Demand-driven growth slowdown and recession triggered by pandemic setbacks.
Unwind of crowded investor positioning tightens financial conditions abruptly.
Geopolitical risks, including China-US tensions as well as within the euro area, are amplified.
2022E 2023F 2024F 2022E 2023F 2024F 2022E 2023F 2024F
Real GDP growth
US 5.3% 3.2% 2.7% 2.2% 1.0% 1.2% –0.4% 1.1% 1.7%
Euro area 5.7% 3.0% 1.7% 2.1% 0.6% 0.8% –2.2% 0.9% 1.4%
China 5.9% 5.9% 5.7% 3.1% 4.5% 4.0% 2.9% 4.5% 5.1%
Inflation US 3.6% 2.8% 2.7% 4.6% 4.6% 4.7% 2.4% 1.2% 1.7%
Euro area 2.4% 1.9% 1.8% 3.3% 3.0% 2.8% 1.9% 0.9% 0.9%
China 2.6% 2.9% 2.8% 6.2% 6.8% 7.4% 1.7% 1.3% 2.0%
10y yield US 2.3% 3.1% 3.5% 2.6% 3.8% 4.9% 0.3% 0.3% 0.4%
Euro area 1.1% 1.3% 1.7% 1.3% 2.0% 2.6% –0.5% –0.5% –0.3%
China 3.5% 3.6% 3.7% 4.2% 4.7% 5.1% 1.2% 1.2% 1.3%

6 Swiss Re Institute sigma No 5/2021
Economic and inflation outlook
This year has marked a strong cyclical recovery for the world economy and the growth outlook remains positive, though the strongest momentum is likely behind us. We forecast growth of 5.6% in 2021, followed by a slowdown to 4.1% in 2022 and 3.0% in 2023 (see Table 1). Near-term momentum is weighed down by ongoing supply-side shocks, including protracted global supply chain issues, labour shortages and energy shortages that are expected to persist for months.3 Demand, on the other hand, remains strong. At the same time, policy conditions are tightening, given fading fiscal stimulus and a move towards less accommodative monetary policy. We expect these headwinds and supply-side constraints, in addition to dissipating base effects, to weigh on growth through 2022 and 2023. This will make structural healing – reversing the permanent negative impacts of the pandemic on the economy with macro policies – difficult. Longer-term growth will likely be lower than before the pandemic due to the structural damage done. We see three factors at play: divergence, digitalisation and decarbonisation (see Three “Ds” define our outlook).
The growth trajectory will be uneven across countries and the momentum fragile. Growth momentum is declining in both the US and China, albeit from high rates, with the lagging recovery in the euro area and Japan in turn also impacted by this slowdown. There is still significant risk of new virus variants and waves that bring restrictions on economic activity as long as global vaccine distribution and up-take is uneven. This could perpetuate supply chain disruptions and friction in labour markets, as well as the shifts in demand we have seen so far in the pandemic.4 The legacy of high debt, low interest rates and lower growth render countries significantly less resilient at absorbing future shocks (see Rebuilding ecoonomic and health resilience).
3 For more on the energy crisis, see The global energy crisis: adding fuel to the fire, op. cit.4 While 57% of the entire populations in the US and 75% in China have been fully vaccinated, globally the
coverage remains at only 40% (as of 10 November according to vaccinations data from local governments via Our World in Data). Coverage is much lower in emerging markets, including some that are key for global supply chains. For example, in Vietnam and India only 32% and 25%, respectively, of people have been fully vaccinated.
The world economy has made a strong cyclical recovery from the COVID-19 crisis as vaccination rollout and stimulus, particularly in advanced markets, has generated surging demand. However, growth is hitting bumps in the road caused by supply side disruptions, and we anticipate an uneven recovery for the next two years with risks tilted to the downside. We expect growth rates to slow in 2022 and 2023 from their 2021 post-crisis peak and inflation to stay elevated despite interest rate rises by central banks. We expect government bond yields to remain low. Three “Ds” define this outlook: divergence, as the world risks pulling further apart on the economic recovery and inequality, digitalisation, as new technologies strengthen productivity; and decarbonisation, as the world grapples with climate change. Further risks come from very high asset valuations and the unfolding energy crisis.
We forecast a positive growth outlook, albeit with slower momentum ahead.
The outlook for growth remains uneven and fragile, especially amidst lower levels of resilience.
Macroeconomic environment and outlook

Macroeconomic environment and outlook sigma No 5/2021 Swiss Re Institute 7
Inflation outlookInflation is our number one near-term macro risk and we expect it to be elevated for some time. We forecast above-consensus inflation globally throughout 2022, with pressure most acute in the US, UK and among emerging markets. We expect CPI for the US, euro area UK and emerging markets to be above central bank targets in 2022. In particular, we forecast average annual inflation to be 5.0% in the US, 2.6% in the euro area and 3.8% in the UK, relative to central banks’ targets of 2%. The risk in the euro area is less pronounced given its significant economic slack, placing the risk of overheating a way off. Inflation forecasts for 2021 are lower in China and Japan, given faster-falling prices for some items (eg, pork in China and mobile phone charges in Japan) and weaker consumption, but we still expect increases in 2022. The risk of higher medium-term inflation has also increased.
In addition to base effects and firm demand, the acceleration in inflation is being fuelled by cost pressures stemming from the same supply-side factors that are constraining growth – persistent supply chain bottlenecks, labour shortages and the energy crisis. Indicators suggest that the situation may still be intensifying. For example, the Baltic Dry Index, the global benchmark for bulk shipping prices, remains above the level seen in the decade before the pandemic, amid a shortage of shipping containers and backlogs at ports. Natural gas prices are at 10-year highs and Brent crude oil is the highest since a brief spell in 2018 and before that 2014 (see The global energy crisis: adding fuel to the fire energy crisis). Increasing house prices also play a role (see Surging house prices heighten risks of retrenchment or inflation).
Cost pressures are starting to feed into slower-moving but harder to reverse prices such as for rent and wage increases, as well as changes to household and financial market inflation expectations, particularly in the US and UK. For example, US long-term
Table 1 Real GDP growth, inflation and interest rates in select regions, 2020 to 2023
E=estimates, F=forecasts. Note: Euro area policy rate refers to the interest on the main refinancing operations; data as of 11 November 2021. * US policy rate consensus is taken as the mid-point of the range. Source: Bloomberg, Swiss Re Institute
2020 2021E 2022F 2023F
Actual SRI Consensus SRI Consensus SRI Consensus
Real GDP growth, annual average
US –3.5% 5.5% 5.6% 3.7% 4.0% 1.5% 2.4%
UK –9.7% 6.9% 7.0% 4.7% 5.1% 2.0% 2.0%
Euro area –6.6% 5.0% 5.1% 4.1% 4.3% 2.0% 2.1%
Japan –4.9% 2.3% 2.4% 2.4% 2.6% 1.2% 1.3%
China 2.3% 8.0% 8.0% 5.1% 5.4% 5.7% 5.4%
Switzerland –2.5% 3.4% 3.5% 3.0% 3.0% 1.5% 1.6%
Global –3.6% 5.6% 5.9% 4.1% 4.5% 3.0% 3.5%
Inflation, all-items CPI, annual average
US 1.2% 4.7% 4.4% 5.0% 3.3% 2.2% 2.3%
UK 0.9% 2.4% 2.3% 3.8% 3.2% 1.9% 2.0%
Euro area 0.3% 2.5% 2.4% 2.6% 2.0% 1.5% 1.5%
Japan –0.1% 0.0% –0.2% 0.7% 0.6% 0.8% 0.6%
China 2.5% 1.3% 1.0% 2.3% 2.2% 2.5% 2.2%
Switzerland –0.7% 0.5% 0.5% 0.6% 0.6% 0.7% 0.7%
Global 2.0% 3.5% 3.6% 3.5% 3.3% 2.6% 2.8%
Policy rate, year-end
US 0.1% 0.1% 0.1%* 0.6% 0.3%* 1.1% 0.9%*
UK 0.1% 0.1% 0.3% 0.5% 0.6% 0.8% 1.0%
Euro area 0.0% 0.0% 0.0% 0.0% 0.0% 0.0% 0.1%
Japan 0.0% 0.0% 0.0% 0.0% 0.0% 0.0% 0.0%
Yield, 10-year govt bond, year-end
US 1.0% 1.4% 1.7% 1.6% 2.0% 1.9% 2.4%
UK 0.3% 1.0% 1.1% 1.2% 1.4% 1.4% 1.5%
Euro area –0.6% –0.2% –0.2% 0.0% 0.0% 0.2% 0.4%
Japan 0.0% 0.0% 0.1% 0.1% 0.1% 0.1% 0.1%
Inflation will remain elevated for a protracted period.
Supply shocks may continue to drive inflationary pressures.
Cost pressures are feeding through into long-term inflation expectations and hard-to-reverse items.

8 Swiss Re Institute sigma No 5/2021 Macroeconomic environment and outlook
household inflation expectations are now well above the target.5 UK and German 10-year breakeven inflation rates, a proxy for market inflation expectations, have increased substantially as the energy crisis is felt more strongly in the region (see Figure 1). A granular assessment of inflation drivers in the US reveals broad price pressures (see Table 2). It is critical to monitor inflation dynamics closely.
5 The latest University of Michigan 5–10yr household inflation expectation survey is at 2.8%.
Figure 1 Evolution of the 10-year breakeven rates for major economies
Source: Bloomberg, Swiss Re Institute
0%
1%
2%
3%
4%
5%
US
UK
–0.5%
0.0%
0.5%
1.0%
1.5%
2.0%
Germany
Japan
October 2021
July
2021
April 2021
January
2021
October 2020
July
2020
April 2020
January
2020
US (LHS) UK (LHS) Germany (RHS) Japan (RHS)
Table 2 US inflation monitor indicators
Note: * Last 20-day average instead of the last available reading as for all other variables. ** Due to data availability, the percentile of the Global container freight costs is computed from October 2017. Our US inflation monitor considers inflationary dynamics along six dimensions as shown bucketed in the table. Percentiles are computed based on monthly data over the past 10 years, with the exception of the US Fed Common Inflation Expectation percentile which is based on quarterly data given availability. A cautious approach is warranted when drawing conclusions on wage evolution due to COVID-19-induced distortions in the labour market data. The Purchasing Managers’ Index (PMI) captures business sentiment, specifically whether market conditions are perceived to be expanding (>50) or contracting (<50). Source: Bloomberg, Swiss Re Institute
Indicator Latest data pointPercentile vs last 10 years Recent trend evolution
CPI & sub-components Headline inflation (yoy) 6.2% 100%
Shelter CPI (yoy) 3.4% 79%
Car rental CPI (yoy) 40.5% 95%
Recreation CPI (yoy) 3.5% 100%
Consumer/market expectations
5-year breakeven rate 2.9% 100%
10-year breakeven rate 2.6% 100%
Conference Board Inflation Expectation 7.0% 100%
Fed Common Inflation Expectation 2.1% 72%
Supply disruptions Supplier delivery times (slower responses, PMI) 52.5 96%
Inventories (lower responses, PMI) 14.2 8%
Global container freight cost (yoy) 363% 94%**
Demand Consumer spending (yoy) 6.2% 10%
Household savings (yoy) –46.7% 32%
Business sentiment ISM Manufacturing PMI 60.8 96%
ISM Services PMI 66.7 100%
Commodities Natural gas future (yoy) 62% 92%
Brent crude future (yoy) 125% 98%
Lumber future (yoy) 19% 60%
Wages Hourly wages (yoy) 4.9% 95%
Weekly wages (yoy) –1.6% 2%
Employment Cost Index (yoy) 3.7% 100%

Macroeconomic environment and outlook sigma No 5/2021 Swiss Re Institute 9
The global energy crisis: adding fuel to the fireA series of energy supply shocks, coupled with a worldwide post-COVID-19 surge in demand, has led to dramatic surges in global energy prices this year. This is primarily in fossil fuels (see Figure 1) but also renewables.6 This year, European wholesale natural gas prices have approximately tripled, dwarfing the ascent of Brent and WTI crude oil to multi-year highs. Immediate consequences range from a dozen small UK energy suppliers going bust in under three months, to a nationwide power outage in Lebanon, and streetlights in China being kept in the dark overnight. This situation is expected to worsen in the coming months, as weather forecasters predict a particularly cold winter ahead, while countries’ gas reserves are already depleted versus the same time last year.7
Source: Bloomberg8, Swiss Re Institute
The crisis weighs on GDP growth and puts upward pressure on inflation. In China, power rationing has caused factory closures and power cuts that are dragging on economic activity. In the UK, the impact on the entire industrial supply chain is evident, as the surge in gas prices shut down fertiliser production, leading to a collapse in the supply of its key by-product carbon dioxide, which in turn impeded the meat industry. Still, we expect only a partial and staggered passthrough from higher energy prices to Consumer Price Indices (CPI) since household energy prices are typically capped (e.g. in Spain9 and the UK10). The short-term and idiosyncratic drivers of this crisis, such as the demand shock, should normalise within 12 months. However, structural flaws decades in the making, such as lower capital expenditure by traditional energy companies amid decarbonisation efforts, coupled with still too low capacities in alternative energy sources, leave energy markets vulnerable to similar flare-ups in the long term.
6 In Germany, wind power generation was 50% below its five-year average in the first two weeks of September. In the UK, wind power usually provides over 20% of the UK’ s power, but recently the share has been below 10%. “Natural-gas prices are spiking around the world”, The Economist. “Europe’ s Power Crisis moves North as Water Shortage Persists”, Yahoo Finance, 4 October 2021.
7 “Cold Christmas raises fears of further gas price rises”, The Times, 15 October 2021.8 Chinese coal prices were not published from 1–7 October 2021 inclusive.9 “Tackling soaring energy bills, Spain to gap gas price, utilities’ profits”, Reuters, 14 September 2021.10 “UK’ s promised energy price cap will expire in 2020”, Financial Times, 12 October 2021.
Energy prices have surged this year after both demand and supply shocks.
Figure 2 Energy prices indexed to 1 June 2021
0
100
200
300
400
500
WTI
Brent
Chinese coal
Asia gas
US gas
European gas
EU carbon allowances
October 2021September 2021August 2021July 2021June 2021
EU carbon allowances European gas US gas Asia gas Chinese coal
Brent WTI
The crisis is lowering economic growth and contributing to inflation.

10 Swiss Re Institute sigma No 5/2021 Macroeconomic environment and outlook
Interest rate outlook
As central banks start to rein in accommodative monetary policy to address inflation, policy rates and government bond yields will increase modestly in the near term. The Fed will commence in December with tapering of USD 15 billion per month through the first of half of 2022 and we expect two rate hikes in the second half of the year. We also expect two rate hikes from the Bank of England next year. Monetary policy has limited power to address supply disruptions, which has potentially difficult implications for central banks’ credibility. We expect long-term government bond yields to remain largely flat globally this year, increasing modestly into next year. We forecast 10-year US treasury yields to be 1.4% at year-end, 1.6% by end-2022 and 1.9% by end-2023.
There is no easy way out of the low interest rate environment that has dominated the global landscape for the past decade and financial repression is here to stay.11 The underlying drivers of this environment, including debt, demographics, and other structural characteristics (e.g., the distribution of wealth), among others, will not reverse soon. Given higher inflation, most sovereign bond yields will yield negative real interest rates in the coming years. Structural policies aimed at increasing the natural rate of interest are needed (see A solution to the productivity conundrum?).
Three “Ds” define our outlook
We identify three trends that will define the path the world economy takes. We are calling them the three Ds: divergence, digitalisation and decarbonisation.
DivergenceDivergence – across countries, within countries, and from pre-pandemic global trends – will shape the future world growth trajectory. Policies that address the structural drivers of these divergences need to be prioritised to support sustainable growth (see Rebuilding economic and health resilience).
Across countries, divergence in the speed and extent of the economic recovery reflects differences in public policy choices, structural features, and national vaccination rates. The euro area is the only one of the three major economies (the US, euro area, and China), not to have reached its pre-pandemic output (adjusted for inflation) of end-2019 by the third quarter of 2021. We forecast the lost output to be recouped in Q4 2021 (see Figure 3). China’ s aggressive early response to the outbreak enabled a quick return to pre-pandemic output, by the second quarter of 2020, which supported emerging markets more broadly. We expect emerging economies to exceed their 2019 output by more than 4% by end-2021 (versus 1.8% for advanced economies). Excluding China, however, we expect emerging markets only to reach pre-crisis output in early 2022.
11 Financial repression is defined as a situation where government interventions influence private capital allocation. See Financial repression: here to stay and stronger than ever, Swiss Re Institute, September 2020, and sigma 7/2020 – Rebuilding better: global economic and insurance market outlook 2021/22, Swiss Re Institute, November 2021.
Modest interest rate rises are ahead as central banks start to rein in monetary policy.
The low-for-longer interest rate environment is nevertheless still valid.
Economic indicators are diverging both between and within countries.
China’ s recovery has diverged from the other two major global economies.

Macroeconomic environment and outlook sigma No 5/2021 Swiss Re Institute 11
Should high inflation continue to force tighter monetary policy in emerging economies, it will intensify the divergence with advanced markets. Global financial conditions are likely to worsen as monetary policy tightens in advanced economies, with potentially higher volatility in capital flows to emerging markets. Advanced countries’ fiscal responses will also give them an edge, as seen in Europe’ s NextGenerationEU plan and Biden’ s infrastructure push. Emerging economies, especially China and in southeast Asia, may lose some of the gains from their integration into global supply chains over the past decade, given moves to reshore and re-route supply chains post-pandemic. There is also a divergence in vaccination rates between advanced and emerging regions (see Risk considerations).
There are also disparities in the recovery within countries across different agents in the economy, which risk aggravating discontent and social tensions. The pandemic’ s impact on employment and earnings have been felt very differently across the population and risks increasing income inequality within countries (both emerging and advanced). Job losses have disproportionately affected younger and lower-skilled workers. Inflation is surging just as COVID-19 support measures are being withdrawn, adding pressure to low-income households. Wealth inequality is also on the rise, as asset price rises have outperformed the real economy (see Stretched asset valuations: limited upside and large downside).12 With more moderate growth ahead, the average household may be left behind.
Finally, the economic recovery is associated with large deviations from pre-pandemic global trends (see Figure 4). In the US, for example, core goods inflation is 1% up from the average seen in the five years prior to the pandemic. Consumer goods spending, in turn, is seeing massive fluctuations, with deviations up to 15% relative to its pre-pandemic trend. This illustrates the current high demand and constrained supply environment. The US real GDP shortfall has been estimated at 2.7% as of Q3 2021 relative to its potential pre-pandemic pace (vs 5.6% for the euro area), with some of this gap expected to persist beyond 2022.13 We forecast some degree of convergence back to pre-pandemic trends is likely, but more permanent scarring of the supply side of the global economy is possible, with the result that some of these growth constraints and divergences may persist. By end-2022, we forecast the euro area shortfall versus its potential pre-pandemic pace to stand at twice that of the US (2.8% for the euro area versus 1.4% for the US). China, in contrast, should see further divergence from its potential pre-pandemic pace given the changes to the country’ s economic structure.
12 As of 11 November the US stock market (proxied by the S&P 500 Index) has grown by more than 107% since the trough in March 2020, whereas real GDP has grown by 12% since the trough in Q2 2020.
13 The potential pre-pandemic pace of GDP growth is taken as the average real GDP growth in the five years in the lead up to the pandemic (i.e., from 2015 to 2019 included).
Figure 3 Output loss versus pre-pandemic levels for major economies
Note: output loss or gain is in comparison with 2019 level. Source: Bloomberg, Swiss Re Institute
–15%
–10%
–5%
0%
5%
10%
15%
20%
Q4 22Q3 22Q2 22Q1 22Q4 21Q3 21Q2 21Q1 21Q4 20Q3 20Q2 20Q1 20
US Europe China
Forecasts
Emerging markets are falling behind in the global economic recovery.
Income and wealth disparities within countries risk fuelling social tension.
GDP, consumption and inflation patterns continue to show large deviations relative to pre-pandemic trends.

12 Swiss Re Institute sigma No 5/2021 Macroeconomic environment and outlook
Stretched asset valuations: limited upside and large downsideLoose financial conditions have supported asset valuations, but this trend may now reverse. COVID-19 stimulus measures and high household savings have intensified the rise in asset prices seen since the GFC (see Figure 5). Stock market growth has outpaced corporate earnings and economic growth since the start of the pandemic, with the ratio of stock market capitalization to GDP (the “Buffett indicator”) the highest in at least a decade. In the US, the ratio exceeds that seen at the peak of the dot-com boom. Similar trends are evident in the housing market (see Surging house prices heighten risks of retrenchment or inflation). However, this divergence between market performance and the real economy results largely from financial repression and not fundamentals.14 High valuations can be sustained while financial conditions are loose, but long-run interest rates are unlikely to decline much further as policy support rolls off. Weaker performance in equity markets is also likely as growing concerns about the global recovery and inflation weigh on the optimism that has been driving markets.
14 Financial repression: here to stay and stronger than ever, op. cit.
Figure 4 Deviation of US goods spending (left axis) and core inflation (right axis) from 2014–2019 trend
Source: Bloomberg, Swiss Re Institute
–20%
–15%
–10%
–5%
0%
5%
10%
15%
20%
Real consumption expenditure on goods
202120202019201820172016
–2.0%
–1.5%
–1.0%
–0.5%
0.0%
0.5%
1.0%
1.5%
2.0%
Core CPI (RHS)
Real consumption expenditure on goods (LHS) Core CPI (RHS)
Asset valuations are at very high levels, but further upside is likely to be limited.
Figure 5 Financial market valuation indicators
Source: Bloomberg, Swiss Re Institute
0%
50%
100%
150%
200%
250%
Wilshire 5000 to GDP
202020152010200520001995
0%
6%
12%
18%
24%
30%
Euro Stoxx to GDP (RHS)
S&P 500 to GDP (RHS)
Wilshire 5 000 to GDP (LHS) S&P 500 to GDP (RHS) Euro Stoxx to GDP (RHS)

Macroeconomic environment and outlook sigma No 5/2021 Swiss Re Institute 13
Financial markets fragilities also make them susceptible to downside risk. Interest rate sensitivity, or duration risk, in major asset classes is the highest in 20-years (Figure 6).15 This means that market prices will react more to unexpected changes in interest rates than in the past. The corporate credit universe is also riskier. For example, the share of lower-rated (BBB) debt in the investment grade credit market grew from just 17% in 2001 to more than 50% today.16 In addition, the search for yield has directed investors towards overlapping investment positions. This carries the risk that investors would seek to liquidate similar positions at the same time, which would drive large and self-reinforcing downward price moves. Any unexpected tightening in financial conditions could result in a correction of equity prices that in turn induce higher volatility and larger mark-to-market losses.
DigitalisationThe cyclical recovery from the pandemic is not enough to address structural damage. Digitalisation – the adoption of digital technology throughout the economy – is a promising path to higher productivity growth, which has declined since the Global Financial Crisis (GFC). Digitalisation improves productivity growth by automating manual processes, enabling innovation and reducing costs. Higher productivity growth raises living standards and increases the natural rate of interest – r* (see A solution to the productivity conundrum?). This allows policymakers more room for monetary manoeuvre and strengthens economies’ resilience. Digitalisation also supports resilience in business and can mitigate climate risk. Firms that digitalised effectively (even in typically high-contact services) navigated the pandemic more successfully, while remote work and less travel helped reduce emissions.17
The pandemic accelerated digital transformation by restricting physical movement. Internet-enabled “frontier technologies” are expected to grow strongly (see Figure 7).Governments are furthering this transformation with investment, to “futureproof” economies.18 For example, in the US, Biden’ s infrastructure bill earmarks USD $65 billion for broadband alone.19 More should be done to foster an environment in which digitalisation can flourish. As more devices are connected to the internet, cyber security is also crucial, especially given current geopolitical tensions, in which cyber is a key arena for conflict. The EU has recognised these conditions and earmarked 20% of its EUR 724 billion Recovery and Resilience Facility funds for digital-related investments alone, including in supercomputing, artificial intelligence, cybersecurity, advancing
15 Duration risk: an antidote for new-year financial market optimism, Swiss Re Institute, 21 January 2021. 16 Covid-19 pandemic and market risks: a systemic crisis in the making?, Swiss Re Institute, January 2020. 17 COVID-19 digital transformation & technology, McKinsey, 5 October 2020.18 Technology and Innovation Report 2021, UNCTAD, February 2021.19 FACT SHEET: President Biden Announces Support for the Bipartisan Infrastructure Framework, The White
House, 24 June 2021.
A sudden and unexpected tightening in financial conditions could trigger a reversal of high asset prices.
Figure 6 Modified duration across assets (years)
Source: Barclays, Goldman Sachs, Swiss Re Institute
25
35
45
55
65
75
85
95
US equities (LHS)
0
1
2
3
4
5
6
7
8
9
10
US IG credit (RHS)
US treasuries (RHS)
20212020
20192018
20172016
20152014
20132012
20112010
20092008
20072006
20052004
20032002
20012000
1999
US equities (LHS) US IG credit (RHS) US treasuries (RHS)
Digitalisation can help to increase productivity growth and resilience at the macro and micro levels.
The push for digitalisation is best complemented by investment in skills and cyber security.

14 Swiss Re Institute sigma No 5/2021 Macroeconomic environment and outlook
digital skills and increasing the wider use of digital technologies across the economy and society.20
A solution to the productivity conundrum?Productivity growth has declined since the GFC, but if reversed, has the potential to raise living standards and end the decades-long decline in interest rates (see Figure 8). A low r*, the “natural” rate of interest at which the market for savings clears, poses problems for policymakers including limiting monetary authorities’ ability to lower interest rates, given the zero lower bound.21 This is important because COVID-19 has left monetary policy largely exhausted, meaning macroeconomic resilience in the face of future shocks is weak.
The pandemic has impacted capital, labour and technological progress, all of which influence productivity and output. Pandemic-induced uncertainty has discouraged investment in capital. Stimulus has also flowed to “unproductive” assets, encouraging the zombification of firms. The pandemic is unlikely to have disrupted the prior trend of decline in the working age proportion of the population, however, it has disrupted the education of millions of schoolchildren and students. The longer-run impact of the
20 “The EU’ s 2021–2027 long-term budget & NextGenerationEU”, European Union, 29 April 2021.21 A. Mian, L. Straub and A. Sufi, “What Explains the Decline in r*? Rising Income Inequality Versus Demographic
Shifts”, University of Chicago, Becker Friedman Institute for Economics, 22 September 2021.
Figure 7 Growing global market size estimates of new frontier technologies, USD billions
Source: “Technology and Innovation Report 2021”, UNCTAD February 2021
3.75G
Blockchain
Nanotechnology
Gene editing
3D Printing
AI
Robotics
Big data
Solar PV
Drones
IoT
54
13032
32
10.6
0.7
69
16 10
344
157
1 500499
191
449.7
2.261
141
277
2018$350 billion
2025$3.2 trillion
Internet of things Solar PVDrones Big data AIRobotics
3D Printing NanotechnologyGene editing Blockchain 5G
Productivity growth has the potential to drive interest rates higher.
Figure 8 Modelled estimates* of natural interest rates in the US, Canada, euro area and UK
Source: Federal Reserve Bank of New York *Note: Estimates of the model described in “Measuring the Natural rate of Interest: International Trends and Determinants,” by Kathryn Holston, Thomas Laubach, and John C. Williams, Journal of International Economics, 2017. Data from: Measuring the Natural Rate of Interest – Federal Reserve Bank of New York (newyorkfed.org)
0%
1%
2%
3%
4%
5%
UK
Euro Area
Canada
US
20202018
20162014
20122010
20082006
20042002
20001998
19961994
19921990
19881986
19841982
19801978
19761974
1972
US Canada Euro Area UK
COVID-19 has disrupted capital, labour and technological progress.

Macroeconomic environment and outlook sigma No 5/2021 Swiss Re Institute 15
pandemic on technological progress remains to be seen. Support for productivity growth should come from the acceleration in uptake of technological innovations, such as AI and machine learning.
The net effect of the pandemic on productivity growth will depend on the policy response to these developments as well as the extent to which opportunities that have arisen are harnessed. Policymakers need to target stimulus towards capital that ultimately helps to make economies more productive, whilst also being mindful of exacerbating inequality. Investment in education should be prioritised in order to avoid some falling permanently behind, leveraging on further digital diffusion to expand access to education. Workers should be enabled to re- and up-skill as less productive sectors shrink. To address the slowdown of technological progress since the GFC, more investment in R&D is needed. Productivity gains should be more widely shared, as during the pandemic they have been concentrated in firms that were already advancing, including professional, scientific and technical services such as IT, healthcare and communication.22
DecarbonisationClimate risk looms as perhaps the biggest societal threat, and no longer only in the longer-term. The extreme weather events seen worldwide this year underline the realization that climate risks have already started to materialise (see Climate change and the global economy). How we approach the decarbonisation transition today will define both our economic and social outlook, but the energy crisis (see The global energy crisis: adding fuel to the fire) illustrates the complexity of this transition. The energy crisis is partly an unintended consequence of the global push to reduce reliance on fossil fuels and reaffirms the need to accelerate investments in greater and more reliable alternative energy supplies to fill the gap (see Figure 9). The supply of renewables needs to be ramped up alongside existing oil capacity with the latter being reduced once renewables become more reliable. At the same time, this green transition has the potential to unlock new economic opportunities and jobs, as every USD 1 invested is estimated to yield an average USD 4 in economic benefits.23 A global annual investment to the green economy between now and 2023 of USD 1 trillion, about 0.7% of current global GDP, is also estimated to create or save roughly 9 million jobs a year and add 1.1% to economic growth, essentially paying for itself.24
22 Will productivity and growth return after the COVID-19 crisis?, McKinsey, 1 March 2021.23 Financing Climate Action, United Nations. https://www.un.org/en/climatechange/raising-ambition/climate-
finance24 “IEA offers world governments a sustainable recovery plan to boost economic growth, create millions of jobs
and put emissions into structural decline,” International Energy Agency, 18 June 2020. https://bit.ly/3AsBZry
Policymakers have an opportunity to usher economies towards higher productivity growth.
Climate change is materialising, but the decarbonisation transition will be difficult.
Figure 9 Estimated market size of oil and selected clean energy technology to reach net-zero emissions by 2050
Note: estimates are the product of anticipated average market prices and sales of tradeable units. Source: IEA World Energy Outlook 2021, Swiss Re Institute
0
500
1 000
1 500
2 000
Solar
Wind
Batteries
Fuel cells
Oil
2050204020302020
Oil$1.25T
Cleanenergy$123B
2%5%2%0%
91%
4%
16%
61%
5%13%
Oil$182B
Cleanenergy$1.2T
Fuel cells Batteries Wind Solar Oil

16 Swiss Re Institute sigma No 5/2021 Macroeconomic environment and outlook
Climate change and the global economyThis year has brought extremes of temperatures, wildfires and flooding. In August the UN Intergovernmental Panel on Climate Change (IPCC) issued a “code red” alert, warning that without drastic further action, the world’ s surface will likely be around 2°C warmer by mid-century relative to pre-industrial times.25 Rising global temperatures and more extreme weather events will increasingly set economies back through physical risks such as property damage, disruption to trade, and lost productivity. We estimate that the world stands to lose around 11% of GDP under a scenario of 2°C warming by 2050.26 Achieving the Paris Agreement target would reduce the economic losses and be the best possible outcome. Limiting warming to well-below 2°C by mid-century would mean a global GDP loss of 7% less than under 2°C warming, with some regions benefiting much more. In ASEAN, for example, a GDP loss of as much as 13% could be prevented (see Figure 10).
The transition to a green economy has a long way to go and requires huge investment. Global emissions must fall by 45% by 2030 (relative to 2010) to limit emissions to a level consistent with global warming of no more than 1.5°C, but we are on track for a 13.7% increase.27 Total additional capital expenditure of USD 131 trillion is needed by 2050 to hit the Paris target, as well as a global carbon price of at least USD 75 per ton.28 The global average price is only USD 3 per ton today, and covers merely one-fifth of global emissions.29 Scalable carbon-capture capacity is also crucial to achieve net-negative emissions for the long term.
Momentum on climate change action and decarbonisation is growing. The COP26 climate talks in Glasgow have prompted new net-zero targets and agreements on coal, methane and deforestation. But this is not enough; the world is still on track to miss the Paris Agreement target.30 Governments and the private sector need to work together to combine additional investment with a systemic approach that focuses on multiple drivers of change at once. Around 30% of the EU’ s 2021–2027 budget and “NextGenerationEU” (NGEU) fund – together worth around EUR 2 trillion in current prices – will be spent on fighting climate change – the highest share ever, from the
25 Sixth Assessment Report (AR 6), Intergovernmental Panel on Climate Change (IPCC), 2021. 26 The economics of climate change: no action not an option, Swiss Re Institute, April 2021.27 COP26: Update to the NDC Synthesis Report, UNFCCC, November 2021.28 The State of the Global Energy Transition, Aurora Energy Research, 2021.29 Five Things to Know About Carbon Pricing, IMF F&D, September 2021.30 Glasgow’s 2030 credibility gap: net zero’s lip service to climate action, Climate Action Tracker.
Climate change will incur large economic losses. The Paris Agreement temperature target would be the most desirable outcome.
Figure 10 Mitigated GDP loss by mid-century if Paris Agreement target is met, versus 2°C rise
Note: The figure is based on simulation of the severe economic impacts from climate change. It shows the difference between the 2°C scenario and the Paris scenario, as % of GDP in a world without climate change. Source: Swiss Re Institute
0%
2%
4%
6%
8%
10%
12%
14%
North A
merica
OECD
Europe
Advanced A
sia
South A
merica
WorldAsia
Middle East
and Afric
a
ASEAN
Substantial additional investment and mitigation is needed to put the world on a path towards the Paris Agreement target.
Governments are mobilising to combat climate change but it is still not enough: a systemic approach is needed.

Macroeconomic environment and outlook sigma No 5/2021 Swiss Re Institute 17
largest EU budget ever.31 In the US, the proposed USD 550 billion bill for new physical infrastructure includes USD 198 billion of investments that will work towards combating climate change, including modernising the power grid, promoting electric vehicles and zero-emission upgrades to public transit, water infrastructure to protect against climate-related disasters, and environmental clean-up.32
Insurers can support the transition to a low-carbon economy as a provider of risk transfer capability, risk knowledge and management, and long-term investment. Infrastructure projects can deliver attractive yields to help insurers match their long-term liabilities, while the construction and operational phases of infrastructure projects will require insurance solutions for engineering and property risk. More broadly, actions such as pledges to implement a “net zero” approaches in re/insurers’ asset and underwriting portfolios, and public-private partnerships with sustainability criteria at their core, can help to nudge global stakeholders towards a greener future.33
Risk considerations
The balance of risks to our baseline outlook is tilted to the downside, with the most prominent near-term risks being further upside to inflation. Though elevated inflation globally is already factored into our baseline outlook for 2022, there is high uncertainty about the persistence and magnitude of the ongoing supply shocks that are fueling inflation. Spillovers from one supply chain to another, including across countries, are feeding into and strengthening one another, amplified by labour shortages and higher input prices. Given that inflation risk is asymmetric, increases can come about rapidly, whereas reversals are hard and painful to effect. We assign a 35% probability to near-term upside inflation risks and 15% probability to a stagflation scenario over three years across both macroeconomic and financial market dimensions (see Alternative economic and insurance scenarios). Under stagflation, higher inflation would feed back into a weaker growth outlook by weighing on consumer sentiment and demand, particularly if price rises outpace wage increases. Very low real rates and elevated inflation uncertainty further suggest material tail risk of spiking long-term nominal yields and suddenly tightened financing conditions.
There is still the possibility of winter resurgences in COVID-19 cases as colder weather approaches in the Northern hemisphere, with a key risk being the emergence of new virus variants that could decrease vaccine effectiveness. Though political and public appetite for full lockdowns is much reduced, this could nevertheless cause tightening or extensions of restrictions already in place (such as zero-COVID strategies). This will be the case as long as global vaccine distribution and uptake is uneven. Going forward, the speed and scale of booster shot rollouts will also become critical.
Geopolitical tensions are heightened on several fronts. The Russia-Europe gas pipeline in development, Nord Stream 2, has gained attention amid the energy crisis and remains controversial. Tension between Russia and Ukraine persists. Middle East tensions continue to pose a risk to oil supply. There is potential for military flashpoints in the South China Sea. US and China bilateral relations on trade and technology continue, with other sectors potentially drawn in. The economics-versus-politics tug of war caused by the tension between strong integration and mutual reliance on the one hand, and the opposition to fully liberalising trade on the other, will remain. Emerging market financial stress adds to the uncertain environment.
31 “The EU’ s 2021–2027 long-term budget & NextGenerationEU”, European Union, 29 April 2021.32 FACT SHEET: Historic Bipartisan Infrastructure Deal | The White House, October 2021.33 Launch of UN-convened Net-Zero Insurance Alliance, Swiss Re, 11 July 2021.
Greater public infrastructure investments provide opportunities both on the asset and liability side of insurance companies.
The balance of risks is tilted to the downside, with inflation the biggest near-term risk.
COVID-19 is here to stay, but there are risks associated with variants and countries’ responses.
Geopolitical risks also remain a threat.

18 Swiss Re Institute sigma No 5/2021 Macroeconomic environment and outlook
Surging house prices heighten risks of retrenchment or inflation Housing prices have risen rapidly in many countries (see Figure 11), leaving prices more vulnerable to a correction on the one hand, and feeding through into rents and inflation on the other. Over the past year alone, nominal prices in the US have soared by 20% year-on-year. Low interest rates, policy support, excess savings and shifting household preferences have boosted demand, while limited building permits, construction shortages and rising material and labour costs have weighed on supply.
Given the value of global real estate–more than 3.5 times total global GDP–a fall in house prices could lead to financial instability.34 Some of the factors that have been driving the recent price surges, especially on the demand side, may ease. Still, as in other sectors, tight supply is expected to persist, mitigating the risk of price falls. The IMF estimates a worst-case scenario for house price declines over the next three years of about 14% in advanced economies, and more elsewhere.35
We see other risks from the rise in house prices. Excess leverage could mean higher debt service costs that push homeowners and property developers to default on repayments. China, for example, has tightened financing conditions for property developers as part of the government’ s intentional deleveraging of the real estate sector. More stringent regulations (“three red lines”), loan requirements and cap, have softened the real estate sector’ s performance in 2021 and turned the liquidity issues of Evergrande into a solvency crisis. There is a risk of volatility spillover from the housing market to other financial markets. Surging house prices may also add to affordability concerns and inflationary pressures. This is the key risk in the US rather than financial stability concerns, as borrowers have far stronger credit scores and are using adjustable-rate mortgages much less than prior to the GFC. High house prices will increase rents, which account for roughly 40% of the US consumer inflation basket. Rises are not yet reflected in price indices, suggesting upside pressure to come. The IMF estimates that in general, across countries, a 5.3% increase in nominal house prices, which is the increase globally in 2020, the largest in 15 years, can add a cumulative 1.5ppt to inflation over two years.36
34 8 things to know about global real estate value, Savills Impacts.35 Global Financial Stability Report, IMF, October 2021.36 World Economic Outlook, IMF, October 2021.
House prices have been surging in many countries.
Figure 11 Real house price growth between Q4 2019 Q4 and Q1 2021
Source: IMF
–10%
–5%
0%
5%
10%
15%
20%
New Zealand
Luxe
mbourg
Turke
y
Denmark
Netherla
ndsUSA
Germany
Canada
RussiaUK
SwedenJa
pan
FranceSpain
Italy
China
Hong Kong
Malays
iaIndia
Philippines
Rapid house price increases come with risk of retrenchment.
Tightening financial conditions and excessive leverage pose a risk in some countries.
Macroeconomic environment and outlook sigma No 5/2021 Swiss Re Institute 19
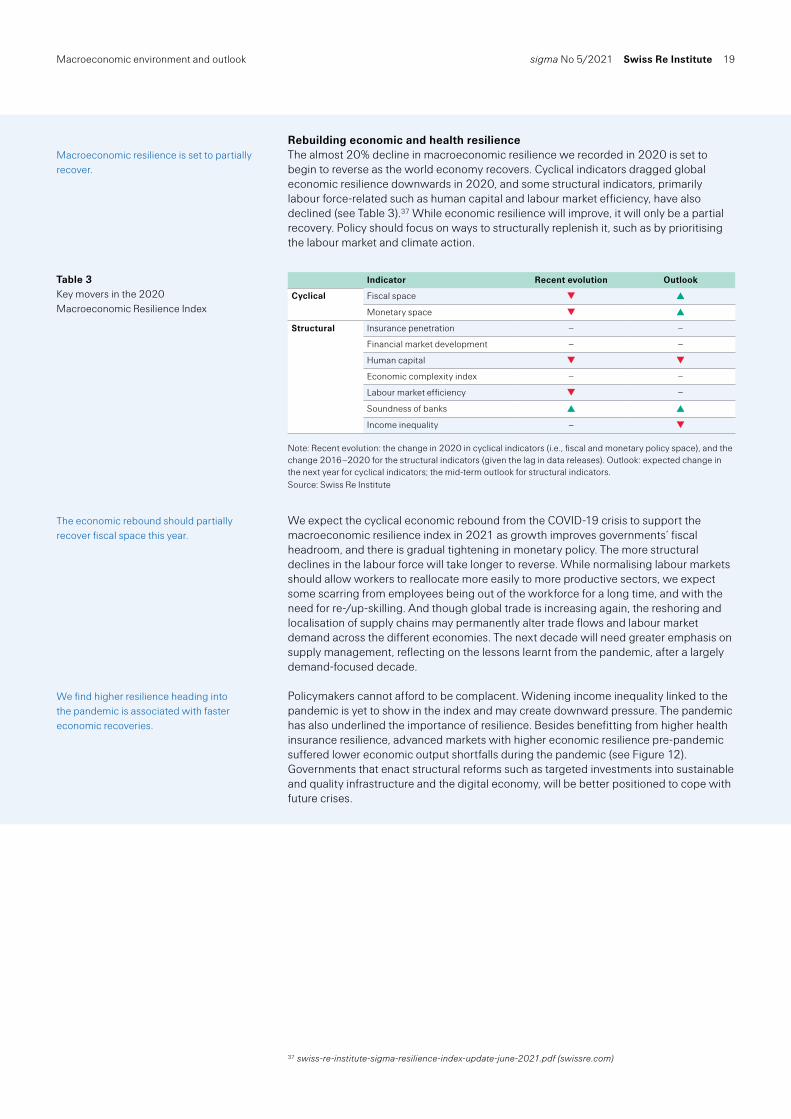
Rebuilding economic and health resilienceThe almost 20% decline in macroeconomic resilience we recorded in 2020 is set to begin to reverse as the world economy recovers. Cyclical indicators dragged global economic resilience downwards in 2020, and some structural indicators, primarily labour force-related such as human capital and labour market efficiency, have also declined (see Table 3).37 While economic resilience will improve, it will only be a partial recovery. Policy should focus on ways to structurally replenish it, such as by prioritising the labour market and climate action.
We expect the cyclical economic rebound from the COVID-19 crisis to support the macroeconomic resilience index in 2021 as growth improves governments’ fiscal headroom, and there is gradual tightening in monetary policy. The more structural declines in the labour force will take longer to reverse. While normalising labour markets should allow workers to reallocate more easily to more productive sectors, we expect some scarring from employees being out of the workforce for a long time, and with the need for re-/up-skilling. And though global trade is increasing again, the reshoring and localisation of supply chains may permanently alter trade flows and labour market demand across the different economies. The next decade will need greater emphasis on supply management, reflecting on the lessons learnt from the pandemic, after a largely demand-focused decade.
Policymakers cannot afford to be complacent. Widening income inequality linked to the pandemic is yet to show in the index and may create downward pressure. The pandemic has also underlined the importance of resilience. Besides benefitting from higher health insurance resilience, advanced markets with higher economic resilience pre-pandemic suffered lower economic output shortfalls during the pandemic (see Figure 12). Governments that enact structural reforms such as targeted investments into sustainable and quality infrastructure and the digital economy, will be better positioned to cope with future crises.
37 swiss-re-institute-sigma-resilience-index-update-june-2021.pdf (swissre.com)
Macroeconomic resilience is set to partially recover.
Table 3 Key movers in the 2020 Macroeconomic Resilience Index
Note: Recent evolution: the change in 2020 in cyclical indicators (i.e., fiscal and monetary policy space), and the change 2016–2020 for the structural indicators (given the lag in data releases). Outlook: expected change in the next year for cyclical indicators; the mid-term outlook for structural indicators. Source: Swiss Re Institute
Indicator Recent evolution Outlook
Cyclical Fiscal space
Monetary space
Structural Insurance penetration
Financial market development
Human capital
Economic complexity index
Labour market efficiency
Soundness of banks
Income inequality
The economic rebound should partially recover fiscal space this year.
We find higher resilience heading into the pandemic is associated with faster economic recoveries.

20 Swiss Re Institute sigma No 5/2021 Macroeconomic environment and outlook
Figure 12 Pre-pandemic levels of macro resilience and subsequent output shortfalls
Source: Swiss Re Institute
2020
Out
put s
hort
fall
2019 Macro resilience (index level)
0%
2%
4%
6%
8%
10%
12%
14%
16%
0 0.1 0.2 0.3 0.4 0.5 0.6 0.7 0.8 0.9
Greece
Italy
Spain
Canada
Switzerland
NorwayFinland
Japan
US

sigma No 5/2021 Swiss Re Institute 21
We expect global insurance premiums to grow by 3.2% in real terms annually on average for the next two years, above the long-term trend.38 In non-life insurance, advanced Europe and emerging markets will see above-trend growth, while advanced Asia Pacific and North America will grow in line with their long-term trend. In life insurance, advanced markets growth will be above-trend but emerging markets will lag below trend. Premium forecasts are underpinned by rising risk awareness by consumers and businesses after the shock of COVID-19, and a stronger performance in non-life insurance personal lines, alongside the continued hard market for rates in commercial lines. Non-life insurance profitability will rely on underwriting discipline as ongoing low interest rates do not fully compensate for inflation, while for life insurers, advances in vaccination and lower mortality should bolster profitability.
We are positive on the outlook for global insurance premiums, expecting above-trend growth of 3.3% in 2022 and 3.1% in 2023. This forecast is underpinned by rising risk awareness in both the life and non-life segments, as consumers and businesses alike seek protection following the shock of the COVID-19 pandemic. The ongoing rate hardening in non-life insurance commercial lines will provide further support. By our projections, the global insurance market should exceed USD 7 trillion in premium terms for the first time by mid-2022, sooner than we previously estimated in July.39 The insurance industry has displayed strong resilience to COVID-19 and we estimate that global premiums will grow by 3.4% in real terms in 2021, taking total global direct premiums written in 2021 to 8% higher than the pre-crisis 2019 levels.
38 “Trend” refers to the long-term 2005–2020 average CAGR. Trend growth for total global real insurance premiums is 2.0% per annum.
39 sigma 3/2021 – World insurance: the recovery gains pace, Swiss Re Institute, July 2021
Global insurance premiums should grow above-trend for the next two years and surpass USD 7 trillion by mid-2022.
Table 4 Insurance premium forecasts, global regions
Note: Figure shows insurance premium forecasts, in real terms. Total insurance premium forecasts are for life and non-life combined. Icons show direction of deviation from long-term trend (2005–2020) for each region. Source: Swiss Re Institute
Total Non-Life Life
2021E 2022–23F 2021E 2022–23F 2021E 2022–23F
World 3.4% 3.2% 3.3% 3.5% 3.5% 2.8%
Advanced markets 3.3% 2.4% 2.8% 2.4% 4.1% 2.3%
North America 2.3% 2.4% 2.7% 2.4% 1.2% 2.2%
EMEA 4.9% 2.0% 2.3% 2.3% 6.9% 1.7%
Asia-Pacific 3.9% 3.2% 4.6% 2.9% 3.8% 3.3%
Emerging markets 3.4% 6.4% 5.8% 8.2% 1.4% 4.6%
Excl China 5.7% 5.1% 4.7% 4.7% 6.9% 5.8%
China 1.5% 7.0% 6.4% 10.3% –2.8% 3.6%
Insurance market outlook 2022/23
22 Swiss Re Institute sigma No 5/2021 Insurance market outlook 2022/23
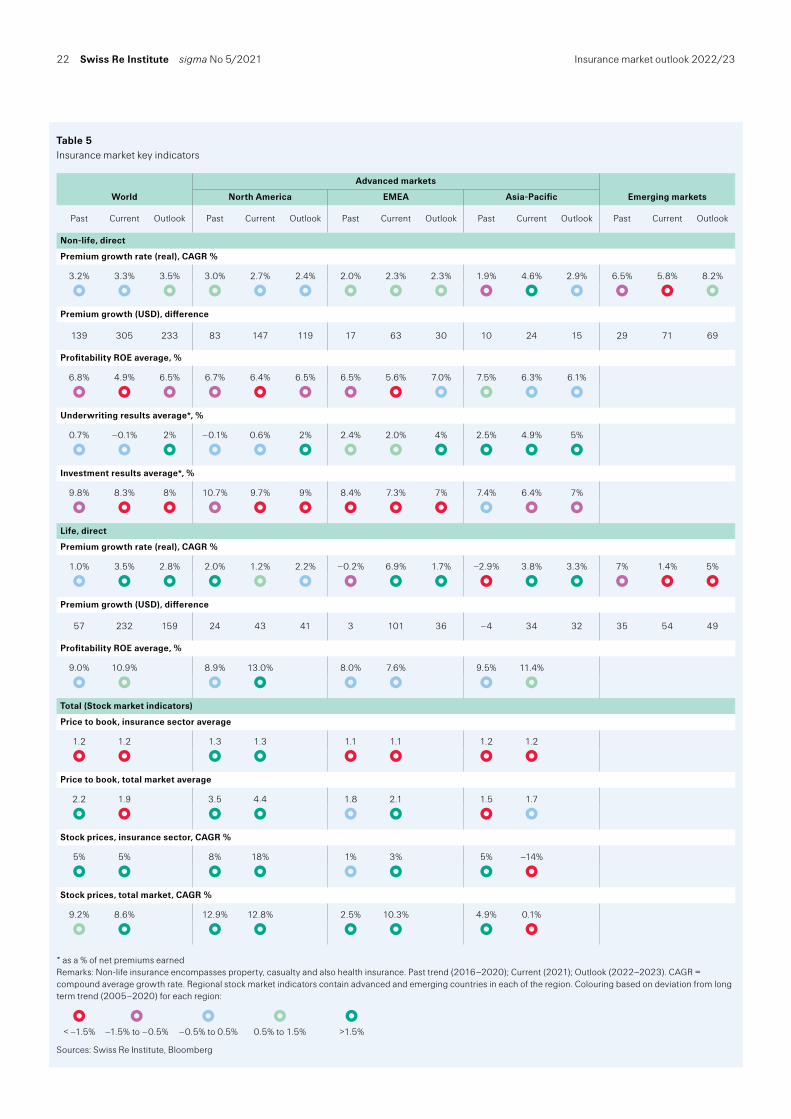
Table 5 Insurance market key indicators
* as a % of net premiums earned Remarks: Non-life insurance encompasses property, casualty and also health insurance. Past trend (2016–2020); Current (2021); Outlook (2022–2023). CAGR = compound average growth rate. Regional stock market indicators contain advanced and emerging countries in each of the region. Colouring based on deviation from long term trend (2005–2020) for each region:
< –1.5% –1.5% to –0.5% –0.5% to 0.5% 0.5% to 1.5% >1.5%
Sources: Swiss Re Institute, Bloomberg
World
Advanced markets
Emerging marketsNorth America EMEA Asia-Pacific
Past Current Outlook Past Current Outlook Past Current Outlook Past Current Outlook Past Current Outlook
Non-life, direct
Premium growth rate (real), CAGR %
3.2% 3.3% 3.5% 3.0% 2.7% 2.4% 2.0% 2.3% 2.3% 1.9% 4.6% 2.9% 6.5% 5.8% 8.2%
Premium growth (USD), difference
139 305 233 83 147 119 17 63 30 10 24 15 29 71 69
Profitability ROE average, %
6.8% 4.9% 6.5% 6.7% 6.4% 6.5% 6.5% 5.6% 7.0% 7.5% 6.3% 6.1%
Underwriting results average*, %
0.7% –0.1% 2% –0.1% 0.6% 2% 2.4% 2.0% 4% 2.5% 4.9% 5%
Investment results average*, %
9.8% 8.3% 8% 10.7% 9.7% 9% 8.4% 7.3% 7% 7.4% 6.4% 7%
Life, direct
Premium growth rate (real), CAGR %
1.0% 3.5% 2.8% 2.0% 1.2% 2.2% –0.2% 6.9% 1.7% –2.9% 3.8% 3.3% 7% 1.4% 5%
Premium growth (USD), difference
57 232 159 24 43 41 3 101 36 –4 34 32 35 54 49
Profitability ROE average, %
9.0% 10.9% 8.9% 13.0% 8.0% 7.6% 9.5% 11.4%
Total (Stock market indicators)
Price to book, insurance sector average
1.2 1.2 1.3 1.3 1.1 1.1 1.2 1.2
Price to book, total market average
2.2 1.9 3.5 4.4 1.8 2.1 1.5 1.7
Stock prices, insurance sector, CAGR %
5% 5% 8% 18% 1% 3% 5% –14%
Stock prices, total market, CAGR %
9.2% 8.6% 12.9% 12.8% 2.5% 10.3% 4.9% 0.1%

Insurance market outlook 2022/23 sigma No 5/2021 Swiss Re Institute 23
What lessons have we learned in 2021?The insurance industry has confronted multiple new dynamics introduced by the pandemic this year (see Figure 13). This has brought new lessons in all areas of the global market.
The re/insurance industry remains a vital risk absorber in times of crisis. The pandemic was a significant global shock, and one that has been compounded by severe and costly natural catastrophe losses this year. The re/insurance industry’ s timely provision of financial relief to households, businesses and governments has enabled a fast and effective rebuild and recovery. The experience has reiterated the supportive role the re/insurance industry plays in strengthening global resilience.
Supply chain disruptions show that better protection is required to improve societal resilience. Insurers continue to upscale their digital technology and data analytics capabilities to provide better understanding of supply chain risks and design innovative covers, particularly in the realms of contingent business interruption and non-physical damage solutions.40
Record-breaking weather extremes add urgency to the race to net-zero. 2021 is a year of extreme heat, cold, drought and water. We estimate that 2021 will be the fourth-costliest year on sigma record for the insurance industry. Flood is the year’ s most prominent secondary peril, from Europe to China and the US. Insured claims from secondary perils have been rising for a decade decade and represent the majority of insured losses globally each year, with climate change a key driver. We expect this to continue given urbanisation, concentration of assets in exposed areas, and climate change risk of more intense precipitation as rising temperatures increase moisture in the atmosphere. Insurance plays a crucial role not only in absorbing catastrophe losses, but also in supporting investments in resilient infrastructure to mitigate the impacts of volatile weather conditions.
40 sigma 6/2020 – De-risking global supply chains, Swiss Re Institute, September 2020
We have learned several key lessons this year.
Figure 13 The key lessons learned this year
Source: Swiss Re Institute
Increasing inequalityrisks exacerbating
social inflation
Rising risk awareness isgenerating demand for
more insurance protection
Consumers welcomedigital and online insurance
and it should grow rapidly
The re/insurance industryremains a vital risk absorber in times of crisis
Record-breaking weatherextremes add urgency tothe race to net-zero
Supply chain disruptions tobusiness and society showthat better protection is required
Key lessonsof 2021

24 Swiss Re Institute sigma No 5/2021 Insurance market outlook 2022/23
Increasing inequality risks exacerbating social inflation. While everyone suffers, the pandemic has disproportionally affected some lower-income segments and we expect it to worsen social trends such as inequality. This has ramifications for US insurers, which face rising claims costs higher than general economic inflation in commercial casualty lines from litigation case awards. The drivers of this social inflation are non-economic, and it is heavily influenced by jurors’ attitudes to issues such as social injustice, inequality and negative sentiment toward corporations. A policy reset that supports greater societal inclusion and cohesion could help to address this divergence in attitudes.
Rising risk awareness is generating demand for more insurance protection. The pandemic has increased consumers’ awareness of health and mortality risk and underpinned life and health insurance premium growth. Our 2020 and 2021 surveys of consumer trends in major Asia-Pacific markets find consistent evidence of consumers’ rising awareness of health and mortality risks and a perception of being under-insured.41 The change in risk perception is reflected in observed growth in life and health insurance premiums. Health insurance premiums globally increased at an above average rate of 5.5% in 2020 and 3.2% in 2021, even as many other lines had experienced a decline. The broad-based elevation of risk concerns also helped sustain positive growth in life protection insurance premiums last year, with volumes up 1.5% in 2020 and 4.9% globally in 2021, our own analysis finds. The growth contrasts with previous crises, during which life premiums contracted. For instance, life protection premiums contracted 0.7% during the GFC in 2008 and remained almost flat in 2009, while health insurance premium growth slowed two percentage points to 3% during the GFC.
Consumers welcome digital and online insurance and it should grow rapidly. The pandemic has transformed consumers’ receptiveness to interacting with insurance digitally, our research has found. Whether for sales, after-sale service, claims or add-ons, people now see online provision as essential. In Asia Pacific, our consumer surveys find two thirds (66%) of respondents see online features as key criteria for life and health insurance purchases. Of those who purchased new insurance policies online in early 2021, 85% would do the same for future purchases. Another Swiss Re survey in Asia found 42% of respondents prefer to buy non-life insurance products online. Since digital penetration of non-life insurance is still low, at 1–2% of premium sales, this suggests huge growth potential.42 Beyond Asia, Swiss Re qualitative research into mental wellbeing with consumers in advanced markets including US, Canada, Germany, France and the UK finds almost all participants expect to see an app in a mental wellbeing insurance solution.
Non-life insurance
Global non-life premiums to return to trend growth We estimate that global non-life premiums will expand by 3.3% in real terms in 2021 despite headwinds from the lingering impacts of the pandemic. The magnitude of the rise in inflation this year, particularly in advanced markets, erodes nominal growth of 8.7% in non-life premiums. Motor premium growth worldwide has been generally weak this year and particularly in China, where we estimate a 7.1% motor premium decline caused by de-tariffication rate cuts. We estimate the segment globally to contract by 0.4% in real terms in 2021 but to recover both in China and worldwide in 2022. Overall, global real non-life premium growth should be above-trend at 3.7% in 2022 and slightly weaker at 3.3% in 2023.
41 Swiss Re COVID-19 Consumer Survey: Financial anxiety, demand for insurance products accelerates across APAC, Swiss Re, April 2040, Swiss Re COVID-19 consumer survey 2021: views of insurance in Asia Pacific one year on, June 2021
42 Source: Digital adoption in personal P&C insurance in south and southeast Asia, Digital adoption in personal P&C insurance in south and southeast Asia | Swiss Re
Global non-life premiums continue to grow despite the lingering impacts of the pandemic

Insurance market outlook 2022/23 sigma No 5/2021 Swiss Re Institute 25
The divergence in growth trends between commercial and personal lines of business is expected to fade. In commercial lines, market sentiment points to continued hard market momentum in 2022, reflecting strong demand and inflation-induced higher claims developments, though rises may be more moderate than in 2021. We expect property-catastrophe rates to improve in 2022 after another year of high losses this year (see Above-average catastrophe losses support hardening rates). Casualty rates should also be stronger in 2022 against the background of ongoing social inflation. Personal lines will benefit from early signs of improving motor pricing in the US and Europe. However, motor premium growth will continue to lag the recovery in other personal lines as this segment is highly competitive. For global health and medical insurance, we anticipate growth of 4.2% in 2022 and 4.1% in 2023, up from 3.7% in 2021, driven by growth in the US economy and stable advanced market demand. In emerging markets, where public health systems are often weak, higher risk awareness will likely increase demand for health-related insurance covers.
By region, non-life premiums in advanced markets will recover to above-trend real growth of 2.6% in 2022 and 2.3% in 2023, slightly down from 2.8% in 2021. The momentum of recovery in 2021 is faster than it seems – in nominal terms premiums in advanced markets should grow by 8.0% in 2021, compared with 3.1% in 2020, but the CPI inflation surge will erode that. Driven by higher rates, commercial property and liability lines will see much faster growth: we project more than 3.4% growth in real terms in 2022 in advanced markets. In the first half of 2021, US P&C (excluding medical insurance) direct premiums written increased by 9.0% in nominal terms (6.7% in real terms), driven by exposure growth tied to the economic recovery, a hard market in commercial lines, and a favourable year-on-year comparison.43 Medical insurance in advanced markets will grow at a steady 2.6% annually from 2021 to 2023, slightly down
43 Quarterly statutory financial data aggregated by AM Best and S&P.
We expect further, albeit more moderate, rate hardening in commercial lines and stronger results in personal lines.
Table 6 Real non-life growth rates by segment
Note: E = estimate, F= forecast Source: Swiss Re Institute
2020 2021E 2022F 2023F 2011–2020 average
Commercial lines 1.6% 4.0% 3.6% 2.9% 2.7%
Personal lines 0.5% 2.1% 3.1% 2.6% 2.7%
Medical insurance 2.0% 3.7% 4.2% 4.1% 4.5%
Non-life 1.5% 3.3% 3.7% 3.3% 3.5%
Figure 14 Global non-life premiums 2020, by line of business, USD billions
Note: We harmonise the allocation of lines of business to compare regions. Accident & health business is allocated to non-life insurance, independent of whether it is written by life, non-life or composite insurers (see Appendix for methodology). Health insurance accounts for almost half of global non-life insurance; personal lines represent 28% and commercial lines 24%.Source: Swiss Re Institute
Commercial Lines
Personal Lines
Health
28%
48%
180210
230
160
220
590
1 680
21024%
Health
Health
Personal Lines
Motor
Property
Other
Commercial Lines
Property
Liability
Motor
Other
Premium growth in advanced markets should return to trend-growth in 2022 and 2023.

26 Swiss Re Institute sigma No 5/2021 Insurance market outlook 2022/23
from 2.7% in 2021. The key driver is the US market, at 80% of global medical insurance volume, which is benefiting from a rebound in employment and growth in enrolment and premiums into the Medicare and Medicaid government programmes.
Expansion in emerging markets is expected to be strong with above-trend growth of 8.9% for 2022 and 7.6% in 2023, up from 5.8% in 2021. We expect China to grow at 10% in each of the next two years, largely driven by strong demand for medical insurance (including critical illness covers). However, commercial lines (excluding motor) will also benefit from government initiatives such as a five-year investment plan for ’ new infrastructure’ projects (i.e. the digital economy) and promotion of cyber insurance programmes for telecommunications, as well as Internet of Things (IoT) in mobility and industrial sectors. China’ s motor insurance segment should resume growth after two years of de-tariffication-triggered contractions in 2020 and 2021, albeit only moderately as the market remains very competitive, with expected rises of 3.8% and 3.0% in 2022 and 2023 respectively. Growth in other emerging markets has recovered in 2021 after two years of sluggish development, and we forecast strong, above-trend growth of 4.9% for 2022 and 4.6% for 2023 as heightened risk awareness boosts personal lines and higher rates support commercial lines.
In terms of the contribution to the global non-life premium pool, North America will add most with USD 113 billion annually in total in 2022 and 2023. Over the same period, China will add USD 49 billion annually, followed by USD 30 billion annually from advanced EMEA. Other emerging markets (excluding China) will contribute about USD 20 billion annually. Advanced markets remain dominant in terms of absolute premium contribution, at 70% of additional premium volumes.
Emerging markets will see above-trend growth for the next two years...
…although advanced markets remain the largest in premium volume terms.
Figure 15 Global non-life insurance premium growth rates in real terms, actual and forecasts (2021 values in brackets)
Source: Swiss Re Institute
0%
2%
4%
6%
8%
10%
12%
2016–20
2022–23F
2021E
China(6.4%)
Excl. China(4.7%)
All(5.8%)
Asia Pacific(4.6%)
EMEA(2.3%)
North America(2.7%)
All(2.8%)
World(3.3%)
Advanced markets Emerging markets
2021E 2016–20 2022–23F

Insurance market outlook 2022/23 sigma No 5/2021 Swiss Re Institute 27
Positive pricing momentum to continuePricing in non-life insurance commercial lines has strengthened again this year, and we expect this to continue into 2022. The third quarter of 2021 marked again a significant rate increase, with prices up 15% year-on-year (y-o-y). The upswing has broadened across lines of business and by region. There were strong price increases in Property (9% in the third quarter) and in Financial and Professional liability (FinPro) (+32%) lines in almost all regions. For Property, rates have been mainly driven by cat-related covers, and in FinPro by rising D&O claims. Casualty business, which had remained soft until 2018, exhibited 6% price improvements this year. This is again being driven by improvements in the US and Europe, while Asia and Latin America remain sluggish. We see sustained, but moderating rate hardening in commercial lines into 2022. Our positive view on rate increases into next year is based on inflation-induced higher claims developments in all lines of business, and a still significant profitability gap in non-life as witnessed by the average ROE of 6.2% in 2021 (see Figure 16). We expect prices in casualty to improve against the background of ongoing social inflation in the US and interest rates remaining persistently low.
Rate improvements across all lines of business will continue into 2022, due partly to Inflation-induced higher claims.
Figure 16 Commercial insurance composite rate rises and outlook
Note: up arrow: accelerating rate increase, flat arrow: stable rate increase in high level, down arrow: decelerating rate increase.
Note: Green arrows indicate the rate is increasing y-o-y, yellow arrows indicate the rate is neutral y-o-y; red arrows indicate the rate is falling y-o-y. Source: Marsh, Global insurance rate index, Swiss Re Institute
0%
10%
20%
30%
40%
50%
AustraliaAsia Latin America EuropeUK US Global
3Q 2020 4Q 2020 1Q 2021 2Q 2021 3Q 2021 Trend
Rate changes in % Global USA UK Europe LatAm Asia Pacific
Property 9% 10% 11% 12% 2% 5% 11%
Casualty 6% 7% 7% 5% –3% 1% 15%
Financial & Professional Liability 32% 27% 54% 24% 17% 17% 25%
Composite 15% 14% 27% 10% 2% 6% 17%

28 Swiss Re Institute sigma No 5/2021 Insurance market outlook 2022/23
Above-average catastrophe losses support hardening ratesNatural catastrophe activity has been above-average throughout 2021 and we anticipate a full-year insured loss of above USD 100 billion. This would make 2021 the fourth-costliest year on record for the insurance industry (after 2005, 2011 and 2017). US Hurricane Ida in August provided a powerful reminder of the loss potential of primary perils in densely populated areas. The hurricane inflicted an estimated USD 28–30 billion of insured losses as of 29 October 2021, from extensive wind, storm surge and inland flood damage in Louisiana and across the southeast.44 The storm’ s remnants also added to the secondary peril loss tally for the year through severe flash floods and tornadoes in the mid-Atlantic and northeastern regions. The heavy precipitation that accompanies a hurricane often results in major flooding that can impact regions far from the landfall and long after the winds have subsided.
Flood is the peril we expect to increase the most as a result of climate change, in particular pluvial flood (from both thunderstorms and tropical cyclones). 45 Europe’ s flooding in July was the costliest of all European natural catastrophe in sigma records, with close to USD 12 billion estimated insured losses. The wider economic losses of the flood may reach USD 40 billion, we estimate. China has also been impacted by devastating floods this year. At USD 1.9 billion insured losses, floods in Henan, also in July, were one of the costliest natural catastrophes the insurance industry has ever faced in the country. Most climate models project that the extreme precipitation events that cause floods will become more intense as rising temperatures lead to more moisture in the atmosphere.
Weak infrastructure in the US exacerbated catastrophe damages this year. In February, winter storm Uri caused insured losses of USD 15 billion, a record for this peril, from wind damage and burst pipes. Severe multiple failures of the Texas power grid played a big contributing role in the losses. Similarly, the remnants of Hurricane Ida exposed the New York City storm drains’ and transport system’s vulnerability to rainfall. Previous investments in coastal protection after the storm surge from Hurricane Sandy in 2012 were ineffective against the rainfall-induced stormwater in City neighbourhoods. With more extreme weather events anticipated from climate change, substantial investment in hardening critical infrastructure is needed. Insurance can support investments in resilient infrastructure, to mitigate the impact of volatile weather and projected increases in rainfall intensity, to strengthen societal resilience to climate change.
Non-life profitability to strengthen in 2022 after a challenging 2021We expect global non-life insurance profitability to improve slightly in 2022 after a soft 2021, as rates in commercial lines continue to rise and investment returns are stable. We estimate non-life insurance return on equity (ROE) at 6.6% in 2022, comparable to the estimated 6.6% in 2020 and up from an expected 6.2% for 2021. Underwriting profitability is weaker this year as the resumption in mobility from low levels due to the 2020 COVID-19 lockdown measures has created higher claims in segments such as US liability, and motor globally. Higher natural catastrophes have also had an impact (see Above-average catastrophe losses support hardening rates), while high inflation has impacted claims payments in the US (see Inflation impacts on non-life insurers).
Investment returns in non-life should be slightly up in 2021, driven by realised investment gains. We estimate the total yields on the combined investment portfolios of the G8 non-life insurance markets to be about 3.0% in 2021, up from 2.9% in 2020. Current investment returns should improve slightly in 2022, supported by small interest rate rises. Nevertheless, the still very low interest rates and still elevated inflation mean real investment returns will likely be negative and reinforces insurers’ need to focus on strengthening their underwriting performance. Financial market and credit risks are serious as insurers have taken more equity, credit and illiquidity risk in their asset portfolios to hunt for yield in response to the persistently low interest rate environment since the GFC. 46
44 Loss estimate excludes US National Flood Insurance Program (NFIP) losses.45 sigma 4/2021 – More risk, Swiss Re Institute, September 202146 “Lower for even longer: what does the low interest rate economy mean for insurers”, Swiss Re Institute,
September 2020.
We expect more than USD 100 billion of insured losses from natural catastrophes this year.
Flood is a major physical climate risk that is causing increasing insured losses.
US infrastructure vulnerability has exacerbated cat losses in 2021.
Non-life sector ROE will rebound in 2022 after a softer 2021.
… slightly improved current investment yields, but negative real returns will be a concern

Insurance market outlook 2022/23 sigma No 5/2021 Swiss Re Institute 29
Supply shortage-driven inflation impacts on non-life insurers to unwind by 2023 – but pressures from wages, healthcare and social inflation to persistElevated global inflation presents a short- to medium-term risk to non-life insurers’ profitability. It has implications for both sides of insurance balance sheet. On the asset side, rising inflation expectations and gradual normalisation of monetary policy will increase somewhat bond yields, while equity performance could falter should there be real rates turn positive as a result of faster than expected policy rate hikes. For liabilities, exposure to economic inflation in different P&C lines of business varies according to the origins of claims inflation.
In the US, where inflation has been acute this year, not all sectors are equally affected (see Table 7). Construction has one of the highest inflation rates, at an estimated 12% by the end of 2021, more than four times the average of the past decade. This is driven primarily by supply and labor shortages. This shock will put pressure on property claims in 2021, but we see this as temporary and expect price rises to revert to the wider US CPI level over the next two years. Motor vehicles and car parts have also experienced a large-magnitude inflation shock driven by supply chain disruptions, with price rises estimated at 9% on average for 2021. We expect this to put upward pressure on motor claims for 2022, but this will unwind by 2023.
US wages and health care costs have experienced relatively smaller inflation shocks, but they could be more permanent. We expect US wage growth of 4.5% in 2021, twice the average rate of the past decade. Inflation in healthcare prices is expected to reach 3% in 2021, though total expenditure growth in 2021 will be skewed due to the postponement of much healthcare spending from 2020 to 2021. We expect these inflation rates to persist, and we forecast wages to grow at 4% to 4.5% and health care prices at 2.5% to 3.0% per annum for the next few years. The most exposed lines of business are liability, motor and workers comp, and we expect claims in these lines of business to see prolonged moderate inflationary pressure.
Figure 17 Aggregated performance of eight of the largest non-life insurance markets, 2012–2022F
Note: The sample consists of the US, Canada, Japan, Australia, UK, Germany, France and Italy. Source: Swiss Re Institute
–4%
–2%
0%
2%
4%
6%
8%
10%
12%
14%
16%
2022F2021E202020192018201720162015201420132012
Underwriting result Investment result Operating result ROE after tax
Inflation poses a short- to medium-term profitability risk.
Inflation shocks in construction and car prices will cause a temporary surge in property and motor claims.
Moderate, but sustained inflationary pressures on wages and health care costs to drive medium-term increases in liability and workers comp claims.

30 Swiss Re Institute sigma No 5/2021 Insurance market outlook 2022/23
In casualty, claims severity may continue trending higher in the medium term due to potential increases in healthcare and wage inflation. In parallel, we expect social inflation to continue unabated post-pandemic, further pushing claims costs higher. The US has experienced a new episode of social inflation since about 2015, with liability claims growth trending higher. This is driven by factors such as the trial bar increasingly using psychology-based strategies, data analytics, digital media advertising and litigation funding. Other factors relate to jurors’ attitudes to issues like social injustice, rising inequality, and negative sentiment toward corporations. We expect the trend of social inflation and higher liability claims to continue over the next couple of years, not least as the COVID-19 crisis is likely to amplify rather than alleviate the societal factors in play, such as economic, educational, and health inequality.
In motor, claims are rising this year after an extraordinarily positive 2020. The mobility restrictions imposed globally last year to suppress the pandemic resulted in far fewer motor insurance claims than normal. This brought gains to insurers’ profitability in 2020. For instance, in five major European markets, the motor combined ratio dropped between six and 10 percentage points in 2020. This translates into lower claims of ~USD 30 billion in those markets.47 We expect motor claims to jump back to pre-COVID-19 levels in 2022 and insurers to try to raise premium prices. Higher new and used auto prices and the semiconductor shortage resulting from the reopening demand surge are also raising prices in the auto industry and subsequently motor claims.
In property insurance, we expect claims costs to grow due to higher claims severity on top of above-average cat losses. Claims severity for homeowners and commercial property is set to rise in line with the current supply-demand imbalance, which is triggering price rises in building materials and a shortage of labour in the construction sector. For example, US home construction prices surged 12% y-o-y in August, though non-residential construction remains depressed.48 In the EU, the Eurostat database shows input prices for construction grew 3.2% y-o-y in the first half of 2021, almost 10 times faster than the average of the past five years. Still, we expect the surge in construction-related prices to be temporary and fade in 2022.
Liability and workers’ compensation claims are most exposed to medical cost inflation, which has risen more than general CPI inflation. For liability, we expect that claims severity will continue trending higher in the medium term due to potential increases in healthcare and wage inflation. In parallel, we expect social inflation to continue post-pandemic, pushing claims costs higher.
Regional profitability trendsThe US P&C underwriting result in the first half of 2021 was 96.9%, stable compared with 2020, as USD 9.5 billion of reserve releases partly offset USD 18.8 billion in natural catastrophe losses.49 Adjusting for these factors, the underlying underwriting result improved to 94.1%, as improvement in commercial liability lines offset unfavourable
47 Calculated based on improvement of underwriting result vs 2019 for five major markets (US, Germany, UK, France and Italy).
48 United States Census Bureau: Index of New Single-Family Houses Under Construction49 M. Coppola, “First Look: Six-Month 2021 Property/Casualty Financial Results”, AM Best, 23 August 2021.
Table 7 US inflation and forecasts by category
Notes: *Personal consumption expenditures (PCE): motor vehicles and parts; **Price Index of new single-family houses under construction; ***PCE: health care services; this index under-states the impact on liability claims costs since it is adjusted for increasing quality and standard of care. ****Average hourly earnings of all private employees. Sources: US Bureau of Labor Statistics (BLS), US Bureau of Economic Analysis, Swiss Re Institute
CategoryImpact on P&C claims inflation
Historic 2010–19 2021E
Medium term SRI forecast
General (CPI) Medium 1.8% 4.7% 3.5%
Cars and repair* High 0.7% 9.0% Construction** High 2.7% 12.0% Medical expenses*** High 1.5% 3.0% 2.5–3%
Wages**** Medium 2.6% 4.5% 4–4.5%
Social inflation creates additional claims inflation risks for casualty lines.
Motor profitability is being squeezed by rising claims as normal mobility has resumed.
Property claims will rise due to higher construction prices, but the surge will be only temporary.
Liability and workers’ compensation claims are most exposed to medical cost inflation.
ROE of US P&C to remain at around 6% in 2022 and 2023.
Insurance market outlook 2022/23 sigma No 5/2021 Swiss Re Institute 31
motor trends.50 However, we expect combined ratios to deteriorate in the second half of the year due to significant third-quarter catastrophe losses and ongoing struggles in motor lines given the return to pre-pandemic driving levels. By 2Q21, loss ratios for motor physical damage had surpassed pre-COVID levels, and commercial auto liability loss ratios are now trending up toward 2019 levels. In response, by the end of 3Q21, major US personal auto insurers had filed for rate increases in the mid-single digits to low double digits in several states.51 Commercial auto rate changes averaged 6.8% in the second quarter of 2021.52 As a result, we estimate 2021 US P&C ROE at 6.1%, improving slightly to 6.2% in 2022 and 2023 as better underwriting results in commercial lines are mostly offset by severity increases outpacing rate gains in personal lines.
In Europe we expect that on average non-life sector underwriting performance will decline y-o-y in 2021. In major markets such as the UK, Germany and Italy, combined ratios are expected to be significantly higher this year. Higher claims in motor are partially to blame, as mobility levels return to pre-COVID-19 trends. Property losses are also significantly higher, especially due to record-level flooding in Germany. Overall, we expect ROE in major European markets to average around 5.6% in 2021, and to rebound to 7.2% in 2022 as motor pricing improves and assuming property claims return to trend levels.
In Asia-Pacific we expect strong improvement in profitability this year, on the back of a strong recovery in underwriting results. We estimate that on average, the ROE of major Asia-Pacific markets will be up to 6.3% in 2021, up from 5.3% last year, and will remain stable at around 6% over next two years. In Australia, the non-life underwriting result was significantly weakened in 2020 due to higher BI, natural catastrophe and liability claims, all of which have improved since. In Japan also, we are expecting improvements in underwriting results driven by improved loss ratios in commercial lines.
In China, non-life insurance profitability has rebounded strongly to CNY 42.5 billion (USD 6.6 billion) by the end of the third quarter this year, attributed to better investment returns and a stronger underwriting profit after insurers paid large claims for credit insurance in 2020.53 The total profit of non-life insurers reached CNY 41.9 billion (USD 6.5 billion) in 1Q 2021, of which underwriting profit was only CNY 3.5 billion (USD 534 million).54 Motor remains the major profit contributor, adding 76% to overall underwriting profit, despite a 72% y-o-y decline in its profit contribution resulting from de-tariffication. Health, liability and agricultural insurance have all reported underwriting losses in 1Q 2021 due to higher market competition, under-pricing of new risks and catastrophe losses. We expect profitability of non-life insurers in China to improve moderately in 2022 and 2023, supported by investment returns and improving underwriting profit. However, downside risks to underwriting profit remain, including intensifying market competition on motor and health insurance, and challenges for risk pricing for liability lines as the improving legal and regulatory environment creates a growing scope of liability.
Life insurance to continue above-average growth
Higher risk awareness and recovery in group business to drive growth We estimate that global life premiums will increase by 3.5% in real terms in 2021, above the 1.0% average between 2016 and 2020 (see Table 5). Premium growth will be above-trend in both advanced EMEA and Asia Pacific excluding China. Increased consumer risk awareness in the wake of COVID-19 has raised demand for protection products, while improved stock market performance and base effects will support a stronger rebound in savings business in 2021. We forecast life insurance premiums will
50 M. Coppola, ibid.; T. Zawacki, “US P&C industry written premium growth may have peaked in Q2 at 15-year high”, S&P Global Market Intelligence, 8 September 2021.
51 T. Zawacki, “2021 US Auto Insurance Market Report”, S&P Global Market Intelligence, 30 September 2021.52 “Commercial Property/Casualty Market Index: Q2/2021”, Council of Insurance Agents and Brokers.53 P&C insurers made an underwriting loss of over CNY 10 billion (USD –1.6 billion) in 2020 whereas
underwriting profit was CNY 0.215 billion in 2019, and CNY –1.36 bn in 2018. Source: https://www.financialnews.com.cn/bx/bxsd/202104/t20210407_215909.html, http://www.news.cn/fortune/2021-11/04/c_1128028803.htm
54 Overall profit for all non-life insurers reached CNY 42.5 billion by the end of Q3 2021, however, breakdown details are limited. Source: http://finance.china.com.cn/money/insurance/20210506/5564519.shtml
We expect underwriting results in Europe to rebound strongly in 2022 as motor pricing improves.
Underwriting results in Australia and Japan have improved and ROE is set to stabilise at around 6% over 2022–2023.
Profitability in China is projected to improve moderately in 2022 and 2023.
We estimate global life premiums to increase by 3.5% in real terms in 2021 and strong growth in protection-type products from 2022.

32 Swiss Re Institute sigma No 5/2021 Insurance market outlook 2022/23
continue to grow at an above average real growth rate of 2.9% and 2.7% in 2022 and 2023, respectively. However, we see a divergence in growth between the protection and savings types of life business in the medium-term. Protection-type products should see strong demand, supported by higher risk awareness, a recovery in group business and increased digital interaction. We expect savings business to grow moderately in 2022 and 2023, reflecting slightly higher government bond yields and a recovery in employment and household incomes. Downside risk to both segments may come from new COVID-19 variants that lead to lockdowns and above-average mortality among insured populations.
COVID-19 continues to affect the life insurance industry. In November 2021, North America is recording average daily death numbers similar to November 2020.55 Europe is seeing an increase in cases over the past several weeks, but this is not converting into a proportional increase in deaths or hospitalisation. Excess mortality shows a mixed trend, with most countries returning to positive excess mortality after having experienced negative excess mortality over the summer months. Unlike many European countries, the US has experienced continuous excess mortality since the start of the pandemic.56 In Latin America, there has been an unprecedented increase in life claims (see The mortality impact of COVID-19 on Latin America’ s insurers).
The mortality impact of COVID-19 on Latin America’ s insurers The Latin American region has been hit particularly hard by COVID-19. Although it was one of the last regions to register an officially recorded case of the virus, the number of new deaths per million people has constantly been higher than that of the global aggregate (see Figure 17). As a result, life insurers have faced an unprecedented pandemic claim. In Brazil, the life insurance loss ratio in April 2021 (97.3%) was more than double the rate in the same period in 2020 (42.5%). By September 2021, 15% of all COVID-19 deaths in the country were covered by life insurance policies.
For Mexico, the pandemic is the costliest event ever recorded for the local insurance industry. This is remarkable given the country’ s high exposure to damaging natural catastrophes such as earthquakes and hurricanes. Pandemic-related insured losses over 18 months total USD 2.5 billion as of September 2021, surpassing the USD 2.4 billion loss from hurricane Wilma in 2005.57 Of the total COVID-19-related losses, 57.5% stem from life insurance payouts and the remainder from health insurance. The average COVID-19-related life insurance payout in Mexico to date is USD 11 287, and for medical expenses it is USD 24 096. The number of life insurance claims related to the pandemic almost triples that of health insurance claims, highlighting the low penetration of health insurance in Mexico, which is representative of the region at large.
55 CDC COVID Data Tracker.56 Excess mortality during the Coronavirus pandemic (COVID-19), Our World in Data, https://ourworldindata.
org/excess-mortality-covid57 Conferencia COVID-19, 30 de septiembre. Asociación Mexicana de Instituciones de Seguros.
Excess mortality shows a mixed trend.
Latin America has been particularly hit by COVID-19, and so the life insurance industry.
Figure 18 New COVID-19 deaths per million people
Source: Our World in Data, Swiss Re Institute
0
2
4
6
8
10
World
LatAm
September 2021
August 2021
July
2021
June 2021
April 2021
April 2021
March 2021
February
2021
January
2021
December 2020
November 2
020
October 2020
September 2020
August 2020
July
2020
June 2020
May 2
020
April 2020
March 2020
February
2020
October 2021
World Latin America
The COVID-19 pandemic is the costliest event for the Mexican insurance industry.

Insurance market outlook 2022/23 sigma No 5/2021 Swiss Re Institute 33
Regional trendsBased on year-to-date premium numbers for major markets, we expect life insurance premiums in advanced EMEA to register a real growth of 6.9% in 2021, far above the –0.2% average growth from 2016 to 2020. The key driver is France, Europe’ s second-largest life insurance market by premium volume, for which we estimate 22% real terms growth in 2021. This results from a very strong recovery in unit-linked business, as consumers’ investment appetite rebounds sharply from the pandemic shock. The unit-linked business accounted for close to two-fifths of the life sector’s premiums in the first seven months of 2021, up from 20% during the same period in 2016, reflecting French insurers’ initiatives to reposition their new business in favour of capital-light and unit-linked products.58 Protection-type business will also grow strongly in France in 2021. Growth will be close to historical average of about 1.3% in 2022.
Advanced EMEA premium growth should return to its trend rate of about 2% from 2022 onward. UK life premiums should grow by 1.8% in 2021 and ~1.1% in 2022 and 2023 in real terms (2011–2020 average: 1.9%). The UK bulk annuity market will be subdued in 2021 after fewer “mega” deals than in recent years. Demand for with-profit products and investment bonds has also fallen due to ultra-low interest rates. In Germany, we expect real life premiums to grow by 0.4% in 2021 and close to on average 0.7% growth in 2022 and 2023 (2011–2020 average: 0.5% in real terms) supported by continued positive momentum in risk premiums and a recovery in savings business, which constitutes over 80% of total life premiums.
US life insurance premium growth should be subdued this year (0.9% in real terms) after a strong 2020 in which demand for stable-value group annuity premiums surged in the early stages of COVID-19, leading to overall life premium growth of 3.9%. In 2021 demand for stable-value products has receded along with the pandemic-related uncertainty, and lower employment has led to a contraction in group real premiums. Moving ahead, we anticipate life insurance premiums to grow by 2.3% in 2022 and 1.9% in 2023. This is linked to higher risk awareness and stronger demand for accumulation products, which are seeing high premium inflows due to a tax provision change.59
Advanced Asia Pacific life insurance premiums should grow at above-trend ~3.8% in real terms in 2021 and 2022, led by Australia. We expect Australian life premiums to increase (in real terms) by 6% in 2021 and by 10.5% in 2022 after a sharp decline in 2020, when allegations of mis-selling during COVID-19 led to a precipitous fall in consumer confidence. Australia’ s economic growth will also modestly boost group insurance, which is bought primarily by the superannuation funds. In Japan, life insurance sales are recovering gradually due to new initiatives such as use of online and digital tools to mitigate reduced face-to-face sales activity, and promotion of new product features such as healthy lifestyle rewards and gym coupons.
China has had a transitional year in 2021 with life insurance premiums estimated to decline 2.8% in real terms, compared with our previous estimate of 7.5% growth. The major challenge has been a revision of the definition of Critical Illness (CI), and pricing directives of CI products, by the Insurance Association of China in April. The revisions introduce more stringent claims criteria and reduce lump sum payments for certain common CI (such as thyroid), which makes new CI products less attractive, though some protection demand was realised before the changes took effect. A significant shrinkage in the number of life insurance sales agents, as the job has become less attractive, is also depressing sales of life policies. The agent workforce at China’ s four major listed domestic insurers was down by 28.7% y-o-y by the end of June.60 We expect life premiums to recover gradually to real terms growth of ~3% in 2022 and ~4.3% in 2023, supported by higher incomes, greater risk awareness and new products.
58 Life Insurance at end July 2021, French Insurance Federation, 09 July 2021; and Life Insurance at end December 2016, French Insurance Federation, 31 January 2017.
59 In December 2020, the US Congress increased the amount policyholders could contribute to life insurance policies while retaining tax-advantaged status.
60 Refers to the number of total sales from half-year business operation reports of New China Life, Ping An, China Life, and CPIC, as of end of June 2021,
Advanced EMEA life premiums should grow by 6.9% in 2021 and around 2% per year thereafter.
We expect trend growth in the UK and Germany.
Accumulation-focused products will drive premium growth in 2022 due to the tax law change.
Life premiums in advanced Asia-Pacific will grow at an above trend 3.8% this year and next.
China will likely experience a transitional year in 2021 with growth expected to rebound only moderately in 2022.

34 Swiss Re Institute sigma No 5/2021 Insurance market outlook 2022/23
Emerging markets excluding China are recovering strongly, with above-trend real life premium growth of 6.9% in 2021 and 6% in 2022. In emerging Asia (excl. China), premiums should grow by 7.4% 2021 and 7.9% in 2022, supported by economic revival, rising risk awareness, use of digital distribution channels and life sector liberalisation. Latin America is benefiting from a strong increase in demand for all life and health-related business, with the first half of 2021 stronger than anticipated in several countries. Pensions-related premiums are bouncing back strongly this year in line with the labour market. We expect a slower economic recovery in Latin America in 2022 and 2023 than in 2021 given lingering structural problems that preceded the pandemic and monetary policy tightening, and insurance demand should outpace the economy. We estimate Latin American life insurance premiums to grow at a real rate of 10.7% in 2021, before returning to the near trend growth rate of 5.1% in 2022 and 3.8% in 2023.
Vaccination should cut mortality claims and raise profitability in 2022 Life insurers’ earnings will be challenged by higher mortality, low interest rates and tightening bond spreads this year but recover in 2022. Anecdotal evidence points to considerable COVID-19 related mortality claims in 2021. For example, in the US, the advanced economy hardest-hit by COVID-19 mortality, death benefits paid increased by 11% y-o-y in the first half of 2021, at the tail-end of the severe second wave.61
Vaccination rates have a negative correlation with COVID-19 related mortality and so mortality rates would be expected to decline as vaccination rates advance globally. As of 9 November 2021, more than half (~51.2%) of the world population has received at least one dose of a COVID-19 vaccine. Vaccination rates are much higher (65–75%) in key insurance markets such as the US, Canada, China, Germany, the UK, France, and Italy.62 However, waning immunity is a risk, since both vaccines and recovery immunity are less effective over time. One study suggests that vaccine effectiveness may be ~90% in the first month but only 70% after six to seven months.63 Many highly vaccinated countries are now offering booster doses to vulnerable or exposed groups.
61 First Look: Six-Month 2021 Life/Annuity Financial Results, AM Best, 24 August 2021.62 Share of people vaccinated against COVID-19, Our World in Data, 17 October 2021, https://ourworldindata.
org/covid-vaccinations63 COVID vaccine immunity is waning – how much does that matter?, Springer Nature Limited, 17 September
2021, https://www.nature.com/articles/d41586-021-02532-4#ref-CR1
Figure 19 Global life insurance premium growth rates in real terms, actual and forecast (2021 values in brackets)
Source: Swiss Re Institute
–4%
–2%
0%
2%
4%
6%
8%
10%
2016–20
2022–23F
2021E
China(–2.8%)
Excl. China(6.9%)
All(1.4%)
Asia Pacific(3.8%)
EMEA(6.9%)
North America(1.2%)
All(4.1%)
World(3.5%)
Advanced markets Emerging markets
2021E 2016–20 2022–23F
Emerging Asia excl. China will see above-average premium growth in 2022 and 2023.
Anecdotal evidence points to an increase in COVID-19 related mortality claims in 2021.
Vaccination should reduce mortality claims and improve profitability in 2022

Insurance market outlook 2022/23 sigma No 5/2021 Swiss Re Institute 35
Investment returns are expected to increase only gradually Improved stock market performance and slightly higher 10-year government bond yields should support insurers’ investment returns this year. Return on equity (RoE) in the life sector increased to 10.9% in the first half of 2021, up by 2.4ppt from full year 2020, according to a sample of 87 life insurers. Investment income also increased by 14% y-o-y in the first half of 2021. While slightly higher government yields will support life insurance sector profitability in 2022, yields are still far below 2019 levels in most major markets and are expected to increase only gradually. Life insurers are adjusting their product portfolios to cope with persistently low interest rates, for instance by moving more towards biometric risk and away from guarantees in investment-based products. Insurers are moving quickly to fee-based product offerings. Many life insurers in France and Germany have successfully repositioned their new business to favour the distribution of capital-light and unit-linked products.64
64 Market Segment Outlook: Germany Life Insurance, AM Best, 23 April 2021 and Market Segment Outlook: France Life Insurance, AM Best, 27 April 2021.
Life profitability will improve only gradually in 2022.
Figure 20 RoE of a sample of life insurers, by region
Note: From a sample of 87 life insurers. Arrows indicate RoE expectation for 2022 compared to full year 2021 Source: Bloomberg, Swiss Re Institute estimates
0
5
10
15%
20%
1H
21
2020
2019
2018
2017
2016
2015
2014
2013
2012
1H
21
2020
2019
2018
2017
2016
2015
2014
2013
2012
1H
21
2020
2019
2018
2017
2016
2015
2014
2013
2012
Middle 50% Unweighted average ROEMedian Weighted average ROE
North America Europe Asia-Pacific

36 Swiss Re Institute sigma No 5/2021
Economic scenarios
We consider three alternative scenarios to our baseline outlook for the world economy, over a three-year horizon. We see several drivers and risks that could push the world economy onto one of these alternatives. These include supply chain challenges and heightened reliance on technology. While the tech sector has been a clear winner from the COVID-19 pandemic, we anticipate greater tech regulation. Industrial policies will be upgraded to take into account of the digital economy and international competition in this respect. Increasing global inequality could damage social cohesion domestically and cooperation internationally. Geopolitical tensions are rising between world powers, and strategic competition between the US and China is driving global fragmentation as both focus on decoupling their economies. Finally, the house price surge worldwide needs close monitoring.
The three alternative economic scenarios in depthThe stagflation scenario (15% probability for the scenario to materialise over a three-year period and across both dimensions of macroeconomic and financial market variables) envisages high inflation readings until the end of 2021 driven by consumer demand, supply disruptions and an energy crisis. Entering 2022, major central banks grow uneasy as long-term inflation expectations become unanchored. As central banks raise interest rates, consumption loses momentum, financial markets tighten, and cracks show in the real estate market. Monetary tools are ineffective at addressing supply-driven inflation and the economy slows while prices enter an upward spiral. A prolonged inflationary period with low economic growth ensues. Wealth inequality and the erosion in purchasing power increase social tensions. Governments respond with redistributive policies that raise taxes for the rich and transfer payments to lower income households. We give the stagflation scenario a 15% likelihood over three years, but see a substantial higher likelihood over a one-year period given price pressures and a possible fading in consumer spending as pent-up demand subsides.
Under the renewed recession scenario (10% probability)65, pandemic setbacks derail global economic activity. Policy responses still attempt to support economies but given the weaker macroeconomic resilience (see Rebuilding economic and health resilience), authorities are constrained in their ability to deliver substantially more support. The focus is much more directed towards distributional outcomes with tax increases and spending cuts. The result may even lead to a fiscal cliff with investments falling sharply. Risk assets thus benefit less from policy support and are negatively affected by the renewed uncertainty. This in turn causes an unwind of crowded investor positions and an
65 Probabilities for the alternative scenarios are over a 3-year horizon and consider the materialisation across both macroeconomic and financial market dimensions.
Economic policies and conditions change rapidly. We monitor signposts that may indicate that an alternative scenario to our baseline will play out. We focus on two downside scenarios: “stagflation” and “renewed recession”, and one upside scenario: the “Golden 20s”. In this upside scenario, commercial lines will benefit most from improved economic activities. Life business will see lower lapse rates. Higher interest rates and strong capital markets will improve investment returns. The renewed recession scenario serves a double blow to premium and investment. Non-life long-tail lines will benefit from lower claims severity in a disinflationary environment. For life saving products with guarantees and duration mismatch will see a stronger hit on profitability. Under the stagflation scenario, long-tailed non-life business will be more sensitive to claims inflation, while in-force life savings products with guarantees will see improved profitability from higher interest rates.
Several drivers and risks could set the economy onto one of our alternative economic scenarios.
In a stagflation scenario, prices enter an upward spiral and growth slows.
Our pessimistic scenario anticipates economic contraction and financial market selloffs in 2022.
Alternative economic and insurance scenarios

Alternative economic and insurance scenarios sigma No 5/2021 Swiss Re Institute 37
abrupt tightening in financial conditions. Corporate defaults and rating downgrades increase as persistent high unemployment becomes a reality. Large fiscal deficits are increasingly financed by central banks, which keep interest rates unchanged for years. Even as bond yields reach new lows, financial markets remain weak and recover only slowly. US-China tensions and resurfacing euro area internal pressures add to geopolitical risks.
The Golden 20s scenario (10% probability) is positive, projecting a sustained growth rebound based on pent-up demand and curtailed pandemic. Emergency monetary and fiscal stimulus is smoothly phased out, with interest rate rises translating in benign financial conditions in 2022. Smarter and long-term oriented spending both by governments towards more sustainable infrastructure investments, education, and research and development, and by corporates towards more capital investment, is a key driver of the outlook. Governments and corporates’ strong focus on climate change supports the transition to “net zero” which is in line with the Paris Agreement.
For a more detailed overview of the narratives surrounding the alternative scenarios, see Table A1 in the Appendix. For effective scenario thinking we complement these scenarios with “signposts” that act as early signals of the direction of travel. Signposts are predominantly frequent indicators (monthly or quarterly) that quickly indicate new developments to allow the appropriate response. See Table 9 for the conceptual approach.
The “Golden 20s” see sustained growth and benign financial markets.
The scenarios are complemented with frequent indicators.
Table 8 Economic and financial market assumptions under alternative scenarios
Note: The probabilities reported for each scenario are conditional on the realisation across both dimensions (namely macroeconomic and financial markets) over a 3-year horizon (from 2022 to 2024) Source: Swiss Re Institute as of 1 November 2021
Country/Currency BaselineOptimistic – Productivity
revival (Golden 20s)Pessimistic - Stagflation
Pessimistic - Renewed recession
2022E 2023F 2024F 2022E 2023F 2024F 2022E 2023F 2024F 2022E 2023F 2024F
Real GDP (%) USD 3.7% 1.5% 1.7% 5.3% 3.2% 2.7% 2.2% 1.0% 1.2% –0.4% 1.1% 1.7%
EUR 4.1% 2.0% 1.3% 5.7% 3.0% 1.7% 2.1% 0.6% 0.8% –2.2% 0.9% 1.4%
RMB 5.1% 5.7% 5.5% 5.9% 5.9% 5.7% 3.1% 4.5% 4.0% 2.9% 4.5% 5.1%
Inflation (%) USD 3.3% 2.2% 2.2% 3.6% 2.8% 2.7% 4.6% 4.6% 4.7% 2.4% 1.2% 1.7%
EUR 2.1% 1.5% 1.5% 2.4% 1.9% 1.8% 3.3% 3.0% 2.8% 1.9% 0.9% 0.9%
RMB 2.3% 2.5% 2.4% 2.6% 2.9% 2.8% 6.2% 6.8% 7.4% 1.7% 1.3% 2.0%
Policy rate (%) USD 0.1% 0.4% 1.0% 0.6% 1.4% 2.2% 0.6% 1.6% 1.9% 0.1% 0.1% 0.1%
EUR 0.0% 0.0% 0.0% 0.3% 0.5% 0.8% 0.0% 0.5% 0.8% 0.0% 0.0% 0.0%
RMB 2.2% 2.3% 2.3% 2.3% 2.5% 2.6% 2.2% 2.5% 2.5% 0.9% 1.3% 1.3%
10y yield (%) USD 1.6% 1.9% 2.1% 2.3% 3.1% 3.5% 2.6% 3.8% 4.9% 0.3% 0.3% 0.4%
EUR 0.0% 0.2% 0.3% 1.1% 1.3% 1.7% 1.3% 2.0% 2.6% –0.5% –0.5% –0.3%
RMB 2.7% 2.6% 2.6% 3.5% 3.6% 3.7% 4.2% 4.7% 5.1% 1.2% 1.2% 1.3%
Risk Assets USD IG, bps 100 115 130 65 75 105 180 270 295 240 185 155
USD HY, bps 345 400 455 155 250 375 645 800 1175 870 650 605
US Equities, % 6.0% 6.0% 6.0% 15.0% 10.0% 6.0% –10.0% –10.0% –5.0% –30.0% 2.0% 6.0%

38 Swiss Re Institute sigma No 5/2021 Alternative economic and insurance scenarios
Insurance implications
Table 9 illustrates the expected impact of the three alternative economic scenarios on insurance premium paths, claims trends and profitability relative to the baseline scenario. Key takeaways for insurers’ growth and profitability are:
In the optimistic scenario: premium growth and investment returns would be stronger than the baseline. Commercial lines will benefit most from improved economic activities. Life business will also benefit from lower lapse rates. Higher interest rates as well as strong capital markets will improve investment returns.
The renewed recession scenario serves a double blow to premium revenues, with a contraction in 2022 and slower growth in 2023 and 2024. Non-life long-tail lines will benefit from lower claims severity in a disinflationary environment. For life business,
Table 9 Top 3 signposts for the alternative scenarios
Series to monitor Assessment
Sta
gfl
atio
n
Persistent supply disruptions Input cost inflation
Supplier delivery times (PMI survey)
Inventories (PMI survey)
Change in inventory (NFBI survey)
Unanchored inflation expectations Common Inflation Expectations
Breakeven rates
Bloomberg inflation consensus
Consumer inflation expectations (University of Michigan survey)
Public policy responses Monetary Policy Uncertainty index
Economic Policy Uncertainty index
Fiscal and monetary policy coordination
Distributional fiscal policy (e.g., higher taxes on wealth)
Regulatory scrutiny on tech
Ren
ewed
rec
essi
on
Renewed COVID-19 wave COVID case numbers
Hospitalisations and deaths
Mobility data
Demand slowdown Consumer spending
Disposable income
Savings
Credit creation/bank loan extension
Composite PMI survey
Inequality
Abrupt market/financial conditions stress Financial conditions index
Surging corporate credit spreads
Bankruptcies of enterprises (OECD)
Gol
den
20
s
Strong productivity growth Labour productivity
Government investment
Capital expenditure
Tightening labour market Official unemployment rate, U-3
Broad unemployment rate, U-6
Labour force participation
Jobless claims (initial)
High sentiment Business confidence (PMI survey)
US consumer confidence survey
Legend:
Not close to being met
Near being met
Threshold breached
Note: The signposts listed are meant to illustrate how scenario narratives could develop. The list of triggers is not exhaustive and can come into play both independently and in different combinations at the same time. The assessment is based on thresholds identified by the Swiss Re Institute (in terms of the magnitude of the readings and the timing). The assessment gauges which signposts might be pointing to the materialisation of one of the scenarios (red) and which readings are still remote from their identified thresholds (green). Source: Swiss Re Institute
Insurers should watch for interest rate and inflation surprises for long-tail business…

Alternative economic and insurance scenarios sigma No 5/2021 Swiss Re Institute 39
saving products with guarantees and duration mismatch will see a stronger hit on profitability than unit-linked business, where the asset risk is borne by the policyholder.
The stagflation scenario would bring a weaker growth in premium revenues in the US and Euro Area in 2022. Long-tailed non-life business will be more sensitive to claims inflation. On the other hand, in-force life savings products with guarantees will see improved profitability from higher interest rates.
Table 9 Impact of alternative economic scenarios on insurers’ growth and profitability (2022–2023)
Source: Swiss Re Institute
Optimistic Renewed recession Stagflation
Premium growth
Non-life
Property
Casualty
Trade credit Life
In-force
Protection
Life savings, guarantees
Life savings, unit linked New business
Protection
Life savings, guarantees
Life savings, unit linked
Profitability excluding general investment returns
Non-life
Property
Casualty
Trade credit Life
In-force
Protection
Life savings, guarantees
Life savings, unit linked New business
Protection
Life savings, guarantees
Life savings, unit linked
Investment returns
Negative
Moderately negative
Neutral
Moderately positive
Positive
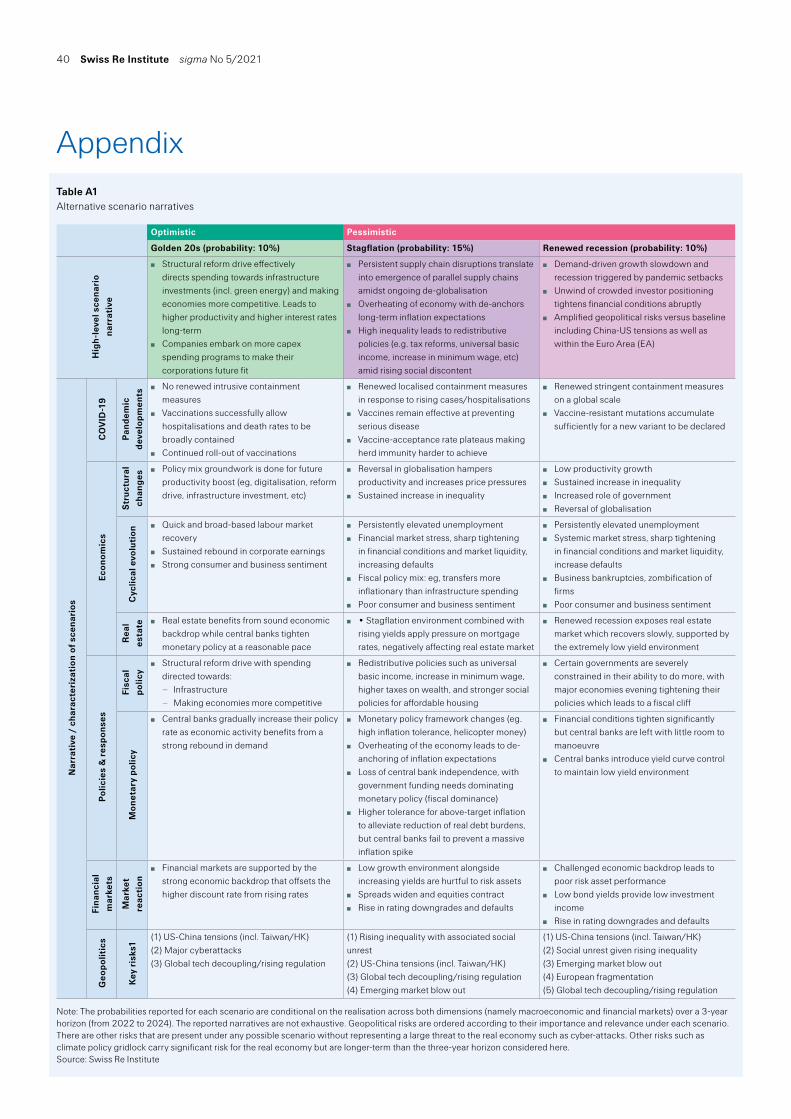
40 Swiss Re Institute sigma No 5/2021
Table A1 Alternative scenario narratives
Note: The probabilities reported for each scenario are conditional on the realisation across both dimensions (namely macroeconomic and financial markets) over a 3-year horizon (from 2022 to 2024). The reported narratives are not exhaustive. Geopolitical risks are ordered according to their importance and relevance under each scenario. There are other risks that are present under any possible scenario without representing a large threat to the real economy such as cyber-attacks. Other risks such as climate policy gridlock carry significant risk for the real economy but are longer-term than the three-year horizon considered here. Source: Swiss Re Institute
Optimistic Pessimistic
Golden 20s (probability: 10%) Stagflation (probability: 15%) Renewed recession (probability: 10%)
Hig
h-l
evel
sce
nari
o na
rrat
ive
Structural reform drive effectively directs spending towards infrastructure investments (incl. green energy) and making economies more competitive. Leads to higher productivity and higher interest rates long-term
Companies embark on more capex spending programs to make their corporations future fit
Persistent supply chain disruptions translate into emergence of parallel supply chains amidst ongoing de-globalisation
Overheating of economy with de-anchors long-term inflation expectations
High inequality leads to redistributive policies (e.g. tax reforms, universal basic income, increase in minimum wage, etc) amid rising social discontent
Demand-driven growth slowdown and recession triggered by pandemic setbacks
Unwind of crowded investor positioning tightens financial conditions abruptly
Amplified geopolitical risks versus baseline including China-US tensions as well as within the Euro Area (EA)
Nar
rati
ve /
cha
ract
eriz
atio
n of
sce
nari
os
CO
VID
-19
Pan
dem
ic
deve
lopm
ents
No renewed intrusive containment measures
Vaccinations successfully allow hospitalisations and death rates to be broadly contained
Continued roll-out of vaccinations
Renewed localised containment measures in response to rising cases/hospitalisations
Vaccines remain effective at preventing serious disease
Vaccine-acceptance rate plateaus making herd immunity harder to achieve
Renewed stringent containment measures on a global scale
Vaccine-resistant mutations accumulate sufficiently for a new variant to be declared
Econ
omic
s
Str
uctu
ral
chan
ges Policy mix groundwork is done for future
productivity boost (eg, digitalisation, reform drive, infrastructure investment, etc)
Reversal in globalisation hampers productivity and increases price pressures
Sustained increase in inequality
Low productivity growth Sustained increase in inequality Increased role of government Reversal of globalisation
Cyc
lical
evo
luti
on
Quick and broad-based labour market recovery
Sustained rebound in corporate earnings Strong consumer and business sentiment
Persistently elevated unemployment Financial market stress, sharp tightening
in financial conditions and market liquidity, increasing defaults
Fiscal policy mix: eg, transfers more inflationary than infrastructure spending
Poor consumer and business sentiment
Persistently elevated unemployment Systemic market stress, sharp tightening
in financial conditions and market liquidity, increase defaults
Business bankruptcies, zombification of firms
Poor consumer and business sentiment
Rea
l es
tate Real estate benefits from sound economic
backdrop while central banks tighten monetary policy at a reasonable pace
• Stagflation environment combined with rising yields apply pressure on mortgage rates, negatively affecting real estate market
Renewed recession exposes real estate market which recovers slowly, supported by the extremely low yield environment
Pol
icie
s &
res
pons
es
Fisc
al
polic
y
Structural reform drive with spending directed towards:
– Infrastructure – Making economies more competitive
Redistributive policies such as universal basic income, increase in minimum wage, higher taxes on wealth, and stronger social policies for affordable housing
Certain governments are severely constrained in their ability to do more, with major economies evening tightening their policies which leads to a fiscal cliff
Mon
etar
y po
licy
Central banks gradually increase their policy rate as economic activity benefits from a strong rebound in demand
Monetary policy framework changes (eg. high inflation tolerance, helicopter money)
Overheating of the economy leads to de-anchoring of inflation expectations
Loss of central bank independence, with government funding needs dominating monetary policy (fiscal dominance)
Higher tolerance for above-target inflation to alleviate reduction of real debt burdens, but central banks fail to prevent a massive inflation spike
Financial conditions tighten significantly but central banks are left with little room to manoeuvre
Central banks introduce yield curve control to maintain low yield environment
Fina
ncia
l m
arke
ts
Mar
ket
reac
tion
Financial markets are supported by the strong economic backdrop that offsets the higher discount rate from rising rates
Low growth environment alongside increasing yields are hurtful to risk assets
Spreads widen and equities contract Rise in rating downgrades and defaults
Challenged economic backdrop leads to poor risk asset performance
Low bond yields provide low investment income
Rise in rating downgrades and defaults
Geo
polit
ics
Key
ris
ks1
(1) US-China tensions (incl. Taiwan/HK) (2) Major cyberattacks (3) Global tech decoupling/rising regulation
(1) Rising inequality with associated social unrest (2) US-China tensions (incl. Taiwan/HK) (3) Global tech decoupling/rising regulation (4) Emerging market blow out
(1) US-China tensions (incl. Taiwan/HK) (2) Social unrest given rising inequality (3) Emerging market blow out (4) European fragmentation (5) Global tech decoupling/rising regulation
Appendix

Published bySwiss Re Management LtdSwiss Re Institute Mythenquai 50/60P.O. Box8022 ZurichSwitzerland
Telephone +41 43 285 2551Email [email protected]
AuthorsLucia BevereFernando Casanova Aizpun Irina FanDr Hendre GarbersFiona GillespieDr Anja Grujovic-VischerDr Thomas HolzheuRoman LechnerCharlotte MüllerPatrick SanerRajeev Sharan
The authors thank Sakshi Baluja, Caroline De Souza Rodrigues Cabral, Xin Dai, Ashish Dave, James Finucane, Jessie Guo, Hao Jiang, Jake Meyer, Mahesh Puttaiah, Olga Tschekassin, Ayush Uchil, Diana van der Watt and Li Xing for their contributions to this report.
sigma editorAlison Browning
Managing editorDr Jerome Jean HaegeliSwiss Re Group Chief Economist
Explore and visualise sigma data on natural catastrophes and the world insurance markets at www.sigma-explorer.com
The editorial deadline for this study was 27 October 2021.
sigma is available on Swiss Re’ s website: www.swissre.com/sigma
The internet version may contain slightly updated information.
Graphic design and production:Corporate Real Estate & Logistics / Media Production, Zurich
The entire content of this sigma edition is subject to copyright with all rights reserved. The information may be used for private or internal purposes, provided that any copyright or other proprietary notices are not removed. Electronic reuse of the data published in sigma is prohibited.
Reproduction in whole or in part or use for any public purpose is permitted only with the prior written approval of Swiss Re and if the source reference “sigma 5/2021, Turbulence after lift-off: global economic and insurance outlook 2022/23,” is indicated. Courtesy copies are appreciated.
Although all the information used in this study was taken from reliable sources, Swiss Re does not accept any responsibility for the accuracy or comprehensiveness of the information given or forward looking statements made. The information provided and forward-looking statements made are for informational purposes only and in no way constitute or should be taken to reflect Swiss Re’ s position, in particular in relation to any ongoing or future dispute. In no event shall Swiss Re be liable for any loss or damage arising in connection with the use of this information and readers are cautioned not to place undue reliance on forward-looking statements. Swiss Re undertakes no obligation to publicly revise or update any forward-looking statements, whether as a result of new information, future events or otherwise.
Order no: 270_0521_EN

Swiss Re Management Ltd. Swiss Re Institute Mythenquai 50 /60 P.O. Box 8022 Zurich Switzerland
Telephone +41 43 285 2551 swissre.com/institute