Embed Size (px)
DESCRIPTION
distribution and diversity of pteridophytes and melastomataceae along Edaphic gradients in Yasuni National park Ecuadorian Amazonia
Citation preview
516
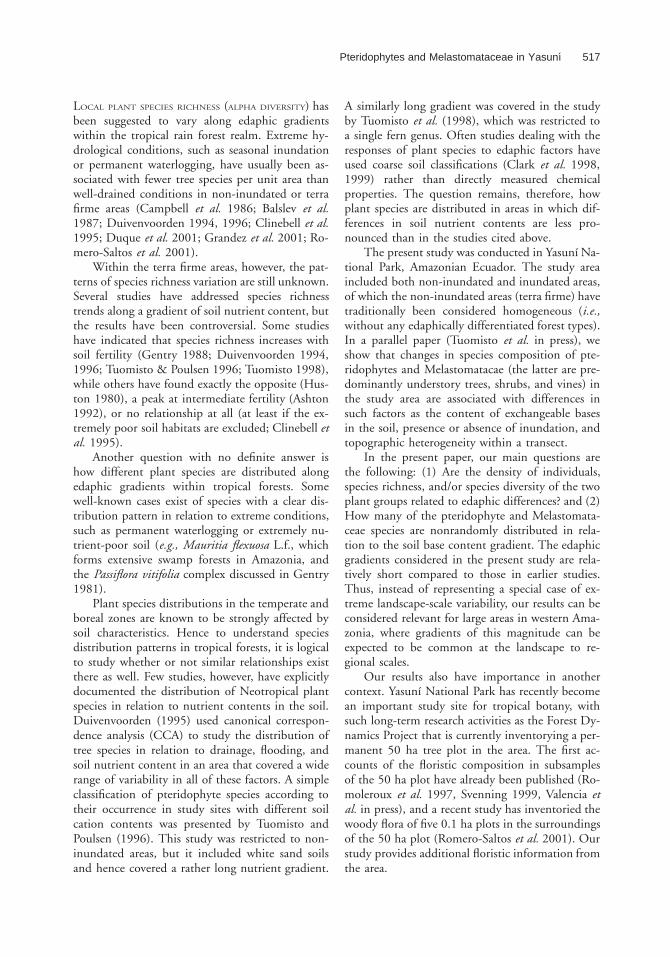
BIOTROPICA 34(4): 516–533 2002
Distribution and Diversity of Pteridophytes and Melastomataceaealong Edaphic Gradients in Yasunı National Park,Ecuadorian Amazonia1
Hanna Tuomisto2, Kalle Ruokolainen
Department of Biology, University of Turku, FIN-20014 Turku, Finland
Axel Dalberg Poulsen, Robbin C. Moran3
Department of Systematic Botany, Aarhus University, Nordlandsvej 68, DK-8240 Risskov, Denmark
Catalina Quintana, Gustavo Canas, and Jorge Celi
Departamento de Ciencias Biologicas, Herbario QCA, Pontificia Universidad Catolica del Ecuador, Av. 12 deOctubre # 1076 y Carrion, Apartado 17–01–2184, Quito, Ecuador
ABSTRACTWe documented the floristic composition of pteridophytes (ferns and fern allies) and Melastomataceae in YasunıNational Park, Amazonian Ecuador. Our main questions were: (1) Are the density of individuals, species richness,and/or species diversity (measured with Shannon’s H9) of the two plant groups related to edaphic differences? and (2)How many of the pteridophyte and Melastomataceae species are non-randomly distributed in relation to a soil basecontent gradient within terra firme (non-inundated forest). To answer these questions, we sampled 27 line transectsof 500 3 5 m distributed in an area of ca 20 3 25 km. The study area included a permanent 50 ha plot establishedto monitor forest dynamics; thus, our results also provide information on landscape-scale floristic variability to whichresults from within the plot can be compared. A total of 45,608 individuals and 140 species of pteridophytes, and4893 individuals and 89 species of the Melastomataceae, were counted in the transects. Both with pteridophytes andwith Melastomataceae, a clear negative correlation was found between the amount of extractable bases in the soil andthe number of plant individuals encountered in a transect. With Melastomataceae, species richness and species diversityalso were negatively correlated with soil base content, but with pteridophytes they were not. More than 50 percentof the common species of both pteridophytes and Melastomataceae were nonrandomly distributed along the soil cationcontent gradient within terra firme. We conclude that while the species richness patterns observed in one plant groupare not indicative of similar patterns in other plant groups, it seems likely that a substantial (but unknown) proportionof species belonging to other plant groups will be found to show distribution patterns that reflect edaphic preferenceswithin terra firme forests.
RESUMENSe estudio la composicion florıstica de pteridofitas (helechos y plantas afines) y Melastomataceas en el Parque NacionalYasunı, Amazonıa ecuatoriana. Nuestras preguntas principales fueron: (1) ¿estan relacionadas la densidad de individuos,la riqueza de especies y/o la diversidad (medida con la H9 de Shannon) de los dos grupos de plantas con las diferenciasedaficas? y (2) ¿cuantas de las especies de pteridofitas y Melastomataceas estan distribuidas en tierra firme de unamanera que no sea al azar, sino en relacion a un gradiente de concentracion de cationes en el suelo? Para desarrollarestas preguntas, muestreamos 27 transectos de 500 por 5 m distribuidos en una area de 20 por 25 km. El area deestudio incluye una parcela permanente de 50 ha, establecida para estudiar la dinamica del bosque; por lo tanto,nuestros resultados proveen informacion sobre la variabilidad florıstica en una escala del paisaje que puede compararsecon la de la parcela. En total se encontraron en los transectos 45,608 individuos y 140 especies de pteridofitas, y4893 individuos y 89 especies de Melastomataceas. Tanto las pteridofitas como las Melastomataceas, mostraron unacorrelacion negativa significativa entre la cantidad de cationes en el suelo y el numero de individuos de plantas dentrode un transecto. En las Melastomataceas, la riqueza de especies y la diversidad estuvieron negativamente correlacionadascon el contenido de cationes en el suelo, pero en las pteridofitas, no existio tal correlacion. Mas de 50 por ciento delas especies comunes de pteridofitas y Melastomataceas estuvieron distribuidas dentro de la tierra firme de una manerano aleatoria en relacion con el gradiente de cationes en el suelo. Concluimos que aunque los patrones de diversidadde las especies observadas en un grupo de plantas no son indicativos de patrones similares en otros grupos, es probableque una proporcion apreciable (pero desconocida) de especies pertenecientes a otros grupos de plantas pueda mostrarpatrones de distribucion que reflejen preferencias edaficas dentro de los bosques de tierra firme.
Key words: Amazonia; diversity; Ecuador; edaphic gradient; Melastomataceae; pteridophytes; species richness; tropical rainforest.
1 Received 16 December 2001; revision accepted 7 August 2002.2 e-mail: [email protected] Present address: New York Botanical Garden, Bronx, New York 10458-5126, U.S.A.
Pteridophytes and Melastomataceae in Yasunı 517
LOCAL PLANT SPECIES RICHNESS (ALPHA DIVERSITY) hasbeen suggested to vary along edaphic gradientswithin the tropical rain forest realm. Extreme hy-drological conditions, such as seasonal inundationor permanent waterlogging, have usually been as-sociated with fewer tree species per unit area thanwell-drained conditions in non-inundated or terrafirme areas (Campbell et al. 1986; Balslev et al.1987; Duivenvoorden 1994, 1996; Clinebell et al.1995; Duque et al. 2001; Grandez et al. 2001; Ro-mero-Saltos et al. 2001).
Within the terra firme areas, however, the pat-terns of species richness variation are still unknown.Several studies have addressed species richnesstrends along a gradient of soil nutrient content, butthe results have been controversial. Some studieshave indicated that species richness increases withsoil fertility (Gentry 1988; Duivenvoorden 1994,1996; Tuomisto & Poulsen 1996; Tuomisto 1998),while others have found exactly the opposite (Hus-ton 1980), a peak at intermediate fertility (Ashton1992), or no relationship at all (at least if the ex-tremely poor soil habitats are excluded; Clinebell etal. 1995).
Another question with no definite answer ishow different plant species are distributed alongedaphic gradients within tropical forests. Somewell-known cases exist of species with a clear dis-tribution pattern in relation to extreme conditions,such as permanent waterlogging or extremely nu-trient-poor soil (e.g., Mauritia flexuosa L.f., whichforms extensive swamp forests in Amazonia, andthe Passiflora vitifolia complex discussed in Gentry1981).
Plant species distributions in the temperate andboreal zones are known to be strongly affected bysoil characteristics. Hence to understand speciesdistribution patterns in tropical forests, it is logicalto study whether or not similar relationships existthere as well. Few studies, however, have explicitlydocumented the distribution of Neotropical plantspecies in relation to nutrient contents in the soil.Duivenvoorden (1995) used canonical correspon-dence analysis (CCA) to study the distribution oftree species in relation to drainage, flooding, andsoil nutrient content in an area that covered a widerange of variability in all of these factors. A simpleclassification of pteridophyte species according totheir occurrence in study sites with different soilcation contents was presented by Tuomisto andPoulsen (1996). This study was restricted to non-inundated areas, but it included white sand soilsand hence covered a rather long nutrient gradient.
A similarly long gradient was covered in the studyby Tuomisto et al. (1998), which was restricted toa single fern genus. Often studies dealing with theresponses of plant species to edaphic factors haveused coarse soil classifications (Clark et al. 1998,1999) rather than directly measured chemicalproperties. The question remains, therefore, howplant species are distributed in areas in which dif-ferences in soil nutrient contents are less pro-nounced than in the studies cited above.
The present study was conducted in Yasunı Na-tional Park, Amazonian Ecuador. The study areaincluded both non-inundated and inundated areas,of which the non-inundated areas (terra firme) havetraditionally been considered homogeneous (i.e.,without any edaphically differentiated forest types).In a parallel paper (Tuomisto et al. in press), weshow that changes in species composition of pte-ridophytes and Melastomatacae (the latter are pre-dominantly understory trees, shrubs, and vines) inthe study area are associated with differences insuch factors as the content of exchangeable basesin the soil, presence or absence of inundation, andtopographic heterogeneity within a transect.
In the present paper, our main questions arethe following: (1) Are the density of individuals,species richness, and/or species diversity of the twoplant groups related to edaphic differences? and (2)How many of the pteridophyte and Melastomata-ceae species are nonrandomly distributed in rela-tion to the soil base content gradient. The edaphicgradients considered in the present study are rela-tively short compared to those in earlier studies.Thus, instead of representing a special case of ex-treme landscape-scale variability, our results can beconsidered relevant for large areas in western Ama-zonia, where gradients of this magnitude can beexpected to be common at the landscape to re-gional scales.
Our results also have importance in anothercontext. Yasunı National Park has recently becomean important study site for tropical botany, withsuch long-term research activities as the Forest Dy-namics Project that is currently inventorying a per-manent 50 ha tree plot in the area. The first ac-counts of the floristic composition in subsamplesof the 50 ha plot have already been published (Ro-moleroux et al. 1997, Svenning 1999, Valencia etal. in press), and a recent study has inventoried thewoody flora of five 0.1 ha plots in the surroundingsof the 50 ha plot (Romero-Saltos et al. 2001). Ourstudy provides additional floristic information fromthe area.
518 Tuomisto, Ruokolainen, Poulsen, Moran, Quintana, Canas, and Celi
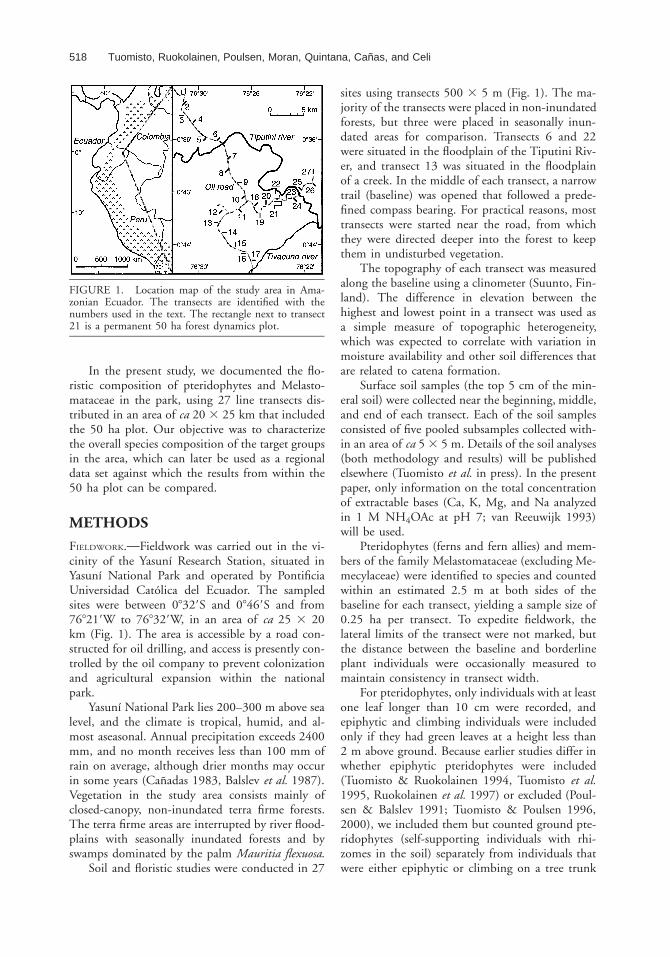
FIGURE 1. Location map of the study area in Ama-zonian Ecuador. The transects are identified with thenumbers used in the text. The rectangle next to transect21 is a permanent 50 ha forest dynamics plot.
In the present study, we documented the flo-ristic composition of pteridophytes and Melasto-mataceae in the park, using 27 line transects dis-tributed in an area of ca 20 3 25 km that includedthe 50 ha plot. Our objective was to characterizethe overall species composition of the target groupsin the area, which can later be used as a regionaldata set against which the results from within the50 ha plot can be compared.
METHODS
FIELDWORK. Fieldwork was carried out in the vi-cinity of the Yasunı Research Station, situated inYasunı National Park and operated by PontificiaUniversidad Catolica del Ecuador. The sampledsites were between 08329S and 08469S and from768219W to 768329W, in an area of ca 25 3 20km (Fig. 1). The area is accessible by a road con-structed for oil drilling, and access is presently con-trolled by the oil company to prevent colonizationand agricultural expansion within the nationalpark.
Yasunı National Park lies 200–300 m above sealevel, and the climate is tropical, humid, and al-most aseasonal. Annual precipitation exceeds 2400mm, and no month receives less than 100 mm ofrain on average, although drier months may occurin some years (Canadas 1983, Balslev et al. 1987).Vegetation in the study area consists mainly ofclosed-canopy, non-inundated terra firme forests.The terra firme areas are interrupted by river flood-plains with seasonally inundated forests and byswamps dominated by the palm Mauritia flexuosa.
Soil and floristic studies were conducted in 27
sites using transects 500 3 5 m (Fig. 1). The ma-jority of the transects were placed in non-inundatedforests, but three were placed in seasonally inun-dated areas for comparison. Transects 6 and 22were situated in the floodplain of the Tiputini Riv-er, and transect 13 was situated in the floodplainof a creek. In the middle of each transect, a narrowtrail (baseline) was opened that followed a prede-fined compass bearing. For practical reasons, mosttransects were started near the road, from whichthey were directed deeper into the forest to keepthem in undisturbed vegetation.
The topography of each transect was measuredalong the baseline using a clinometer (Suunto, Fin-land). The difference in elevation between thehighest and lowest point in a transect was used asa simple measure of topographic heterogeneity,which was expected to correlate with variation inmoisture availability and other soil differences thatare related to catena formation.
Surface soil samples (the top 5 cm of the min-eral soil) were collected near the beginning, middle,and end of each transect. Each of the soil samplesconsisted of five pooled subsamples collected with-in an area of ca 5 3 5 m. Details of the soil analyses(both methodology and results) will be publishedelsewhere (Tuomisto et al. in press). In the presentpaper, only information on the total concentrationof extractable bases (Ca, K, Mg, and Na analyzedin 1 M NH4OAc at pH 7; van Reeuwijk 1993)will be used.
Pteridophytes (ferns and fern allies) and mem-bers of the family Melastomataceae (excluding Me-mecylaceae) were identified to species and countedwithin an estimated 2.5 m at both sides of thebaseline for each transect, yielding a sample size of0.25 ha per transect. To expedite fieldwork, thelateral limits of the transect were not marked, butthe distance between the baseline and borderlineplant individuals were occasionally measured tomaintain consistency in transect width.
For pteridophytes, only individuals with at leastone leaf longer than 10 cm were recorded, andepiphytic and climbing individuals were includedonly if they had green leaves at a height less than2 m above ground. Because earlier studies differ inwhether epiphytic pteridophytes were included(Tuomisto & Ruokolainen 1994, Tuomisto et al.1995, Ruokolainen et al. 1997) or excluded (Poul-sen & Balslev 1991; Tuomisto & Poulsen 1996,2000), we included them but counted ground pte-ridophytes (self-supporting individuals with rhi-zomes in the soil) separately from individuals thatwere either epiphytic or climbing on a tree trunk
Pteridophytes and Melastomataceae in Yasunı 519
or log. Results will be presented for the data setcontaining all individuals, except when explicitlystated otherwise. For vegetatively spreading speciessuch as Selaginella, each rooting stem was countedas one individual.
All individuals of Melastomataceae, includingseedlings that had at least one post-cotyledon leaf,were recorded. Voucher collections for all speciesof both plant groups are deposited in herbaria inEcuador (QCA, QCNE), Denmark (AAU), Fin-land (TUR), and the United States (NY). Unicatesare kept in QCA.
DATA ANALYSES. Chi-square tests were conductedto determine how many of the pteridophyte andMelastomataceae species were distributed in a non-random way across the observed gradient of soilcation content. Only the 24 terra firme transectswere used in these analyses to avoid the confound-ing effect of inundation. For the first set of chi-square analyses, the transects were allocated to twogroups: low and high soil base content (N 5 12 inboth groups; base contents 1.16–6.15 cmol(1)/kgand 8.97–27.3 cmol(1)/kg, respectively). For thesecond set of analyses, transects were allocated tothree groups: low, intermediate, and high soil basecontents (N 5 8 in each group; base contents1.16–4.81 cmol(1)/kg, 4.89–12.5 cmol(1)/kg,and 12.7–27.3 cmol(1)/kg, respectively). The ra-tionale for grouping the transects in two differentways was that the two-group test allowed identi-fying species for which occurrences were concen-trated to either half of the cation gradient, whilethe three-group test made it possible to identifyspecies with occurrences that were concentrated to-ward the middle of the gradient or to its eitherextreme. Only species that occurred in at least 4 ofthe 24 transects were tested.
A standard chi-square test assumes that eachplant individual is statistically independent of otherindividuals and yields one degree of freedom whentesting whether the corresponding species shows anonrandom distribution with respect to the group-ing criterion. We reasoned that this assumption wasnot warranted because individuals within the sametransect were probably highly autocorrelated.Therefore, we estimated the statistical significanceof each test with a Monte Carlo permutation pro-cedure using transects as the permutable units in-stead of individuals: the probability of error of theobserved chi-square statistic was estimated by com-paring its value to 999 values obtained by permut-ing transect positions along the cation gradientwhile keeping the transect-wise plant abundances
fixed. Spatial autocorrelation among transects wasnot considered a problem because Mantel tests be-tween the patterns of geographical and floristic dis-tances among the transects did not show significantcorrelations (Tuomisto et al. in press). The programResampling Stats 4.1 was used for the chi-squaretests.
Pearson correlation coefficients were calculatedto test for relationships of individual density, spe-cies richness, and diversity with soil cation contentand topographic heterogeneity. The correlation co-efficients were calculated with the programCorrpPermute (available at http://www.fas.umontreal.ca/BIOL/Legendre/indexEnglish.html), which allowsestimation of the statistical significance of r with aMonte Carlo permutation test; 999 permutations wereused.
RESULTS
PTERIDOPHYTES. A total of 45,608 individuals and140 species of pteridophytes were counted in the27 transects. Of these, 33,769 individuals (74% ofall individuals) and 108 species (77% of all species)were found growing on the ground. Because threespecies pairs were confused in the field, they havebeen lumped for the numerical analyses, whichtherefore only deal with 106 species of ground pte-ridophytes and a total of 137 species (Table 1).
The total number of pteridophyte individualsfound within one transect varied between 734 and3338, the mean being 1689 individuals per transect(6760 individuals/ha). The number of pterido-phyte individuals on the ground varied between360 and 2521 per transect, the mean being 1251(5004 individuals/ha). The number of species pertransect varied between 21 and 65 for all pterido-phytes (x 5 47), and between 12 and 46 forground pteridophytes (x 5 35).
The most abundant pteridophyte was Adian-tum humile Kunze, which was represented by 5000individuals in 26 transects (Table 1). The otherspecies with more than 2000 individuals were Poly-botrya osmundacea Willd., P. crassirhizoma Lellinger,and Lomariopsis japurensis (Martius) J. Smith. Onlytwo species were found in all 27 transects, namelyL. japurensis and A. obliquum Willd. Twenty-sixspecies were found in only one transect, and 11 ofthese were represented by a single individual. Themean number of individuals per species was 330,and the mean frequency (number of transects inwhich the species was found) was 9.
Out of the ten most abundant pteridophytespecies, five were significantly most abundant in
520 Tuomisto, Ruokolainen, Poulsen, Moran, Quintana, Canas, and Celi
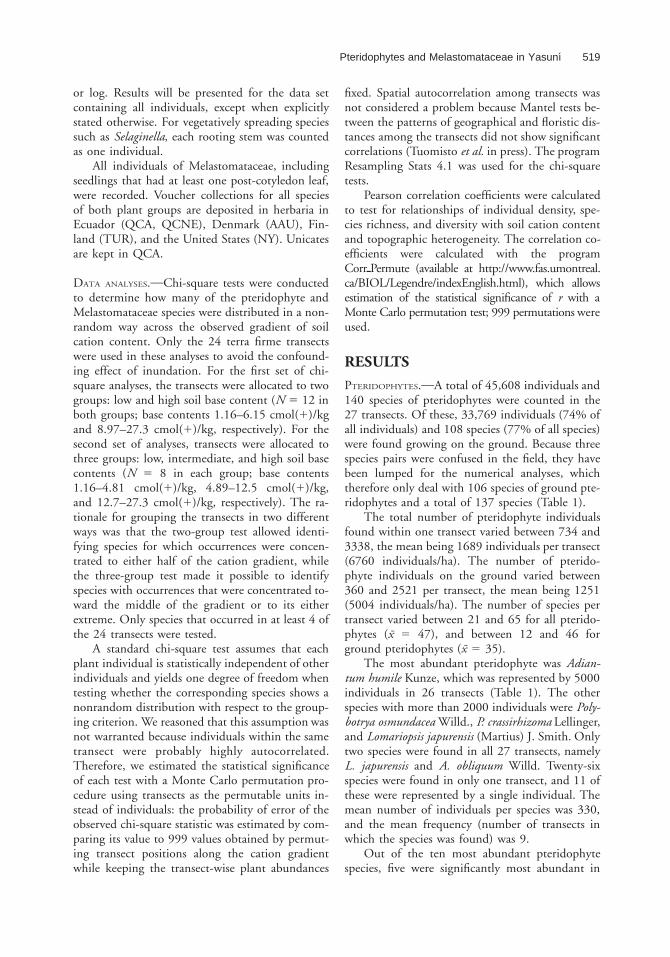
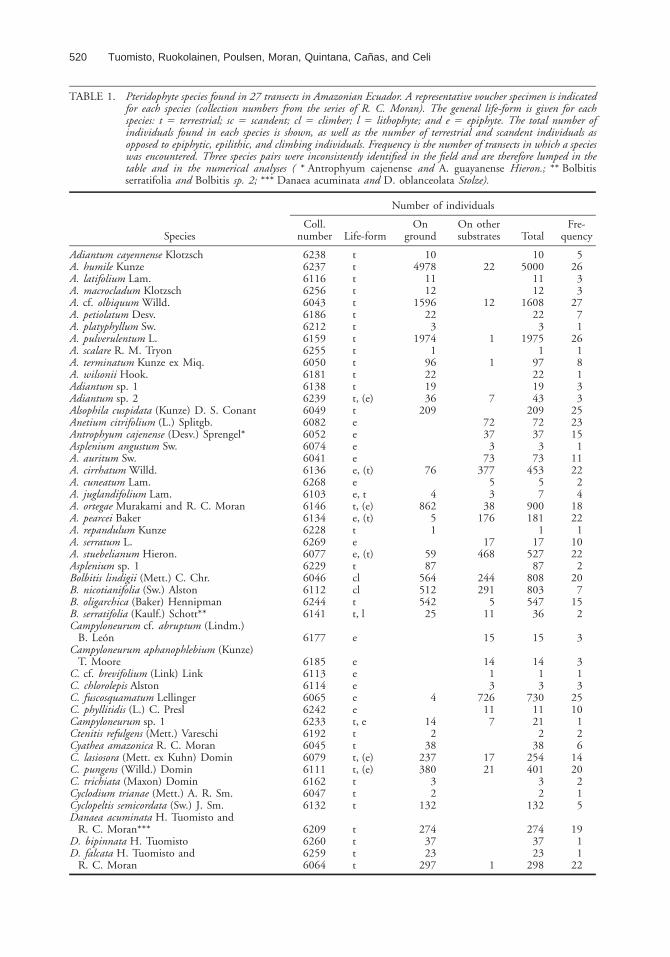
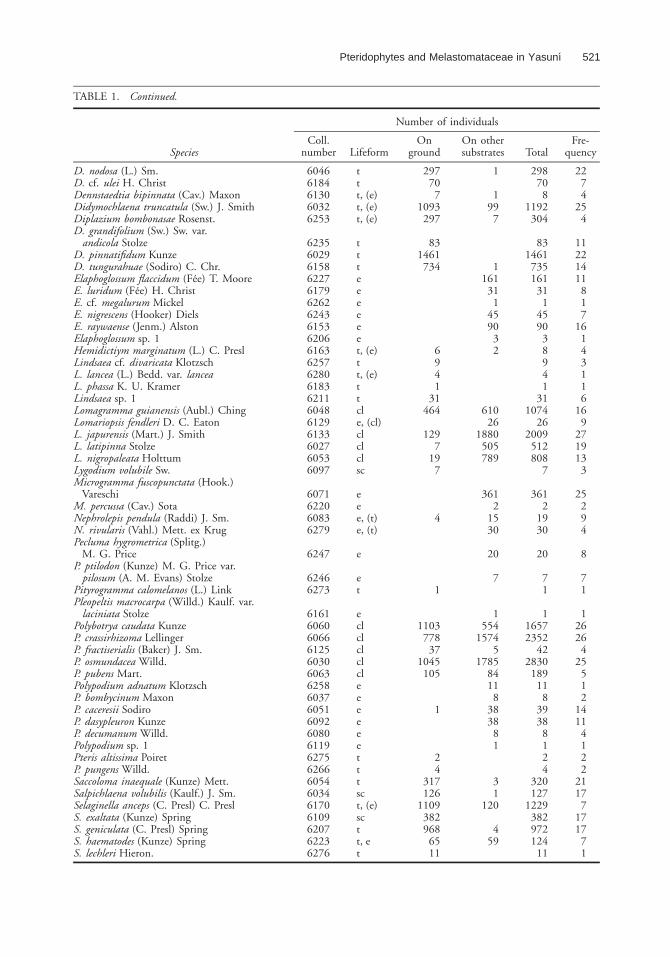
TABLE 1. Pteridophyte species found in 27 transects in Amazonian Ecuador. A representative voucher specimen is indicatedfor each species (collection numbers from the series of R. C. Moran). The general life-form is given for eachspecies: t 5 terrestrial; sc 5 scandent; cl 5 climber; l 5 lithophyte; and e 5 epiphyte. The total number ofindividuals found in each species is shown, as well as the number of terrestrial and scandent individuals asopposed to epiphytic, epilithic, and climbing individuals. Frequency is the number of transects in which a specieswas encountered. Three species pairs were inconsistently identified in the field and are therefore lumped in thetable and in the numerical analyses ( * Antrophyum cajenense and A. guayanense Hieron.; ** Bolbitisserratifolia and Bolbitis sp. 2; *** Danaea acuminata and D. oblanceolata Stolze).
Species
Number of individuals
Coll.number Life-form
Onground
On othersubstrates Total
Fre-quency
Adiantum cayennense KlotzschA. humile KunzeA. latifolium Lam.A. macrocladum KlotzschA. cf. olbiquum Willd.
62386237611662566043
ttttt
104978
1112
1596
22
12
105000
1112
1608
526
33
27A. petiolatum Desv.A. platyphyllum Sw.A. pulverulentum L.A. scalare R. M. TryonA. terminatum Kunze ex Miq.
61866212615962556050
ttttt
223
19741
96
1
1
223
19751
97
71
2618
A. wilsonii Hook.Adiantum sp. 1Adiantum sp. 2Alsophila cuspidata (Kunze) D. S. Conant
6181613862396049
ttt, (e)t
221936
2097
221943
209
133
25Anetium citrifolium (L.) Splitgb.Antrophyum cajenense (Desv.) Sprengel*Asplenium angustum Sw.A. auritum Sw.A. cirrhatum Willd.A. cuneatum Lam.A. juglandifolium Lam.
6082605260746041613662686103
eeeee, (t)ee, t
76
4
7237
373
37753
7237
373
45357
2315
11122
24
A. ortegae Murakami and R. C. MoranA. pearcei BakerA. repandulum KunzeA. serratum L.A. stuebelianum Hieron.Asplenium sp. 1Bolbitis lindigii (Mett.) C. Chr.B. nicotianifolia (Sw.) AlstonB. oligarchica (Baker) HennipmanB. serratifolia (Kaulf.) Schott**
6146613462286269607762296046611262446141
t, (e)e, (t)tee, (t)tclcltt, l
86251
5987
56451254225
38176
17468
244291
511
900181
117
52787
80880354736
1822
11022
220
715
2Campyloneurum cf. abruptum (Lindm.)
B. LeonCampyloneurum aphanophlebium (Kunze)
T. MooreC. cf. brevifolium (Link) LinkC. chlorolepis Alston
6177
618561136114
e
eee
15
1413
15
1413
3
313
C. fuscosquamatum LellingerC. phyllitidis (L.) C. PreslCampyloneurum sp. 1Ctenitis refulgens (Mett.) VareschiCyathea amazonica R. C. MoranC. lasiosora (Mett. ex Kuhn) DominC. pungens (Willd.) Domin
6065624262336192604560796111
eet, ettt, (e)t, (e)
4
142
38237380
72611
7
1721
7301121
238
254401
2510
126
1420
C. trichiata (Maxon) DominCyclodium trianae (Mett.) A. R. Sm.Cyclopeltis semicordata (Sw.) J. Sm.
616260476132
ttt
32
132
32
132
215
Danaea acuminata H. Tuomisto andR. C. Moran***
D. bipinnata H. Tuomisto62096260
tt
27437
27437
191
D. falcata H. Tuomisto andR. C. Moran
62596064
tt
23297 1
23298
122
Pteridophytes and Melastomataceae in Yasunı 521
TABLE 1. Continued.
Species
Number of individuals
Coll.number Lifeform
Onground
On othersubstrates Total
Fre-quency
D. nodosa (L.) Sm.D. cf. ulei H. ChristDennstaedtia bipinnata (Cav.) MaxonDidymochlaena truncatula (Sw.) J. SmithDiplazium bombonasae Rosenst.
60466184613060326253
ttt, (e)t, (e)t, (e)
29770
71093
297
1
199
7
29870
81192
304
2274
254
D. grandifolium (Sw.) Sw. var.andicola Stolze
D. pinnatifidum KunzeD. tungurahuae (Sodiro) C. Chr.
623560296158
ttt
831461
734 1
831461
735
112214
Elaphoglossum flaccidum (Fee) T. MooreE. luridum (Fee) H. ChristE. cf. megalurum MickelE. nigrescens (Hooker) Diels
6227617962626243
eeee
16131
145
16131
145
11817
E. raywaense (Jenm.) AlstonElaphoglossum sp. 1Hemidictiym marginatum (L.) C. Presl
615362066163
eet, (e) 6
9032
9038
1614
Lindsaea cf. divaricata KlotzschL. lancea (L.) Bedd. var. lanceaL. phassa K. U. KramerLindsaea sp. 1Lomagramma guianensis (Aubl.) ChingLomariopsis fendleri D. C. EatonL. japurensis (Mart.) J. SmithL. latipinna StolzeL. nigropaleata HolttumLygodium volubile Sw.
6257628061836211604861296133602760536097
tt, (e)ttcle, (cl)clclclsc
941
31464
1297
197
61026
1880505789
941
311074
262009
512808
7
3116
169
271913
3Microgramma fuscopunctata (Hook.)
VareschiM. percussa (Cav.) SotaNephrolepis pendula (Raddi) J. Sm.
607162206083
eee, (t) 4
3612
15
3612
19
2529
N. rivularis (Vahl.) Mett. ex Krug 6279 e, (t) 30 30 4Pecluma hygrometrica (Splitg.)
M. G. Price 6247 e 20 20 8P. ptilodon (Kunze) M. G. Price var.
pilosum (A. M. Evans) StolzePityrogramma calomelanos (L.) Link
62466273
et 1
7 71
71
Pleopeltis macrocarpa (Willd.) Kaulf. var.laciniata Stolze
Polybotrya caudata KunzeP. crassirhizoma LellingerP. fractiserialis (Baker) J. Sm.
6161606060666125
eclclcl
110377837
1554
15745
116572352
42
12626
4P. osmundacea Willd.P. pubens Mart.Polypodium adnatum KlotzschP. bombycinum MaxonP. caceresii SodiroP. dasypleuron KunzeP. decumanum Willd.Polypodium sp. 1Pteris altissima PoiretP. pungens Willd.Saccoloma inaequale (Kunze) Mett.Salpichlaena volubilis (Kaulf.) J. Sm.
603060636258603760516092608061196275626660546034
clcleeeeeetttsc
1045105
1
24
317126
17858411
83838
81
31
283018911
83938
8124
320127
25512
1411
4122
2117
Selaginella anceps (C. Presl) C. PreslS. exaltata (Kunze) SpringS. geniculata (C. Presl) SpringS. haematodes (Kunze) SpringS. lechleri Hieron.
61706109620762236276
t, (e)sctt, et
11093829686511
120
459
122938297212411
71717
71

522 Tuomisto, Ruokolainen, Poulsen, Moran, Quintana, Canas, and Celi
TABLE 1. Continued.
Species
Number of individuals
Coll.number Lifeform
Onground
On othersubstrates Total
Fre-quency
S. parkeri (Hook. and Grev.) SpringS. revoluta BakerS. speciosa A. Br.
607861016226
ttt, (e)
9089
125
2
53
9109
178
535
Stigmatopteris heterophlebia (Baker)R. C. Moran
S. opaca (Baker) C. Chr.Tectaria cf. antioquoiana (Baker) C. Chr.
616661266105
ttt
22738
1911 3
22738
1914
135
18T. draconoptera (D. C. Eaton) Copel.T. pilosa (Fee) R. C. MoranT. plantaginea (Jacq.) Maxon
606961896173
ttt
965633
965633
1273
T. pubens R. C. Moran 6180 t 169 169 7T. cf. vivipara Jermy and
T. G. WalkerTectaria sp. 1Tectaria sp. 2Thelypteris abrupta (Desv.) Proctor
6190614861046187
tttt
505228
125233
2
12
507228
126433
81823
9T. ancyriothrix (Rosenst.)
A. R. Sm. 6215 t 13 13 5T. arcana (Maxon and C. V. Morton)
C. V. Morton 6198 t 1 1 1T. biformata (Rosenst.) R. M. Tryon 6107 t, (e) 490 11 501 14T. dentata (Forssk.) E. St. John 6140 t, e 3 2 5 5T. glandulosa (Desv.) Proctor
var. brachyodus (Kunze) A. R. Sm.T. hispidula (Decne.) C. F. ReedT. juruensis (C. Chr.) R. M. Tryon and
D. S. ConantT. leprieurii (Hook.) R. M. Tryon
var. incana (H. Christ) A. R. Sm.
62186310
6241
6312
tt
t
t
1992
838
5
3
1992
841
5
31
6
2T. macrophylla (Kunze) C. V. MortonT. opposita (Vahl) ChingT. opulenta (Kaulf.) FosbergT. pennata (Poir.) C. V. MortonT. tristis (Kunze) R. M. TryonThelypteris sp. 1Thelypteris sp. 2Trichomanes collariatum Bosch
60406311613960286143620161426031
t, (e)te, tttttcl
17521
2448311
2052
28
393
21
17801
6348611
2052
21
151
1217
3316
T. diversifrons (Bory) Mett. 6067 t 245 245 21T. hostmannianum (Klotzsch) KunzeT. pinnatum HedwigT. polypodiodes L.Trichomanes sp. 1Triplophyllum funestum (Kunze) Holttum
60876264628762656090
ttett
58133
1055
1
58133
11055
115
117
137 spp. recognized in numerical analyses(total 140 spp.)
33,769 11,839 45,608
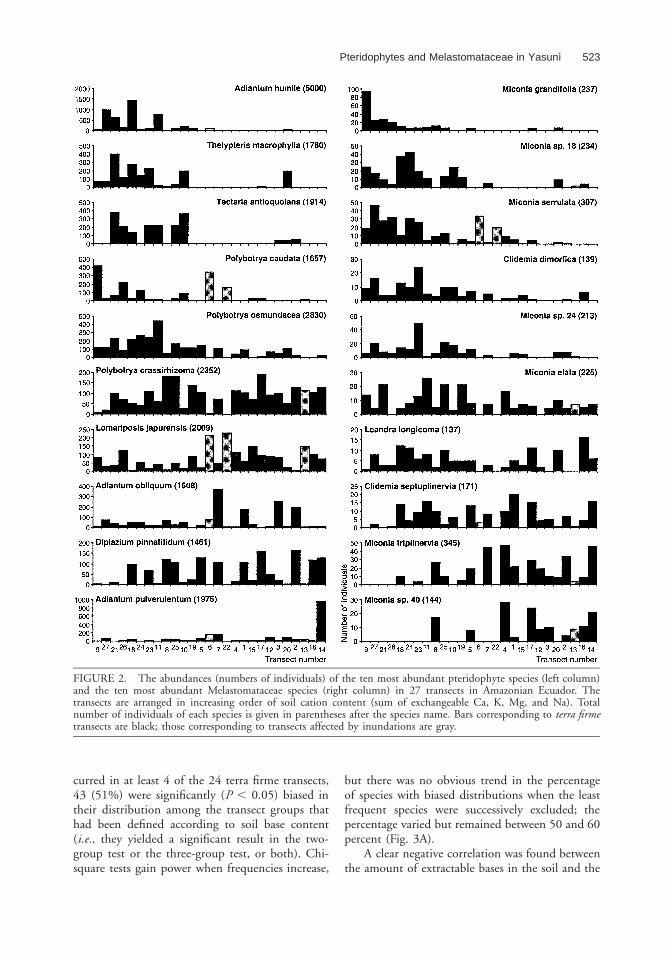
the transects in which soils had a lower than me-dian exchangeable base content. Two speciesshowed a statistically significant bias away from thepoorest soils, while the distribution of three specieswas statistically indistinguishable from randomalong the soil gradient (Fig. 2). Two of the abun-dant species, Polybotrya caudata Kunze and L. ja-purensis, were especially abundant in transects 6and 22, which were affected by the inundations of
the Tiputini River. Most of the other species wereeither rare or absent in these transects. Of course,even the terra firme transects often included poorlydrained sections in places where the transectcrossed a creek or a poorly drained valley, but asthe present analyses were done at the level of entiretransects, distributions at finer spatial scales werenot assessed.
Out of the 84 pteridophyte species that oc-
Pteridophytes and Melastomataceae in Yasunı 523
FIGURE 2. The abundances (numbers of individuals) of the ten most abundant pteridophyte species (left column)and the ten most abundant Melastomataceae species (right column) in 27 transects in Amazonian Ecuador. Thetransects are arranged in increasing order of soil cation content (sum of exchangeable Ca, K, Mg, and Na). Totalnumber of individuals of each species is given in parentheses after the species name. Bars corresponding to terra firmetransects are black; those corresponding to transects affected by inundations are gray.
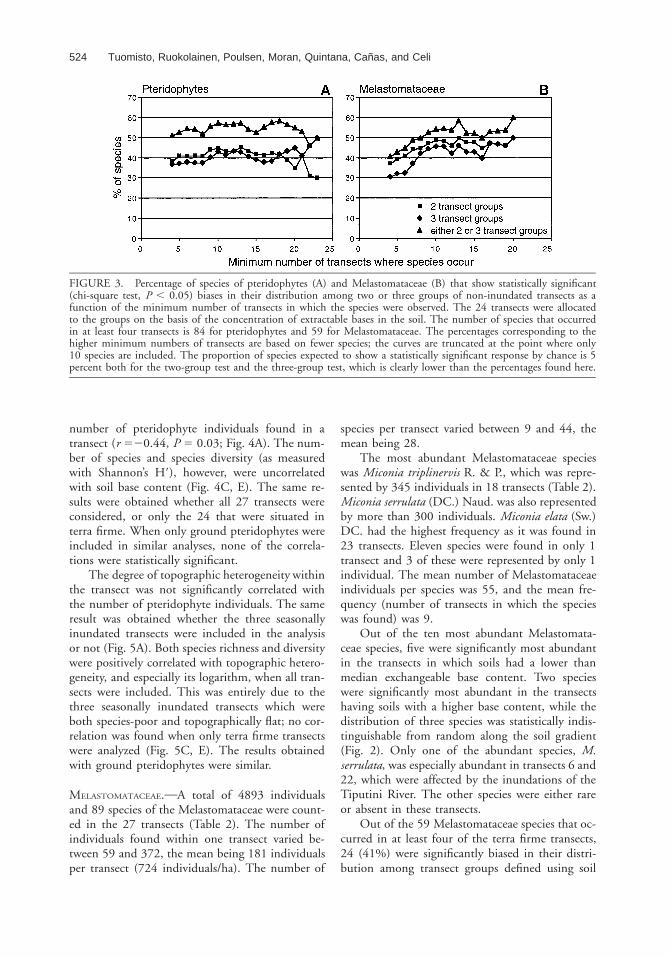
curred in at least 4 of the 24 terra firme transects,43 (51%) were significantly (P , 0.05) biased intheir distribution among the transect groups thathad been defined according to soil base content(i.e., they yielded a significant result in the two-group test or the three-group test, or both). Chi-square tests gain power when frequencies increase,
but there was no obvious trend in the percentageof species with biased distributions when the leastfrequent species were successively excluded; thepercentage varied but remained between 50 and 60percent (Fig. 3A).
A clear negative correlation was found betweenthe amount of extractable bases in the soil and the
524 Tuomisto, Ruokolainen, Poulsen, Moran, Quintana, Canas, and Celi
FIGURE 3. Percentage of species of pteridophytes (A) and Melastomataceae (B) that show statistically significant(chi-square test, P , 0.05) biases in their distribution among two or three groups of non-inundated transects as afunction of the minimum number of transects in which the species were observed. The 24 transects were allocatedto the groups on the basis of the concentration of extractable bases in the soil. The number of species that occurredin at least four transects is 84 for pteridophytes and 59 for Melastomataceae. The percentages corresponding to thehigher minimum numbers of transects are based on fewer species; the curves are truncated at the point where only10 species are included. The proportion of species expected to show a statistically significant response by chance is 5percent both for the two-group test and the three-group test, which is clearly lower than the percentages found here.
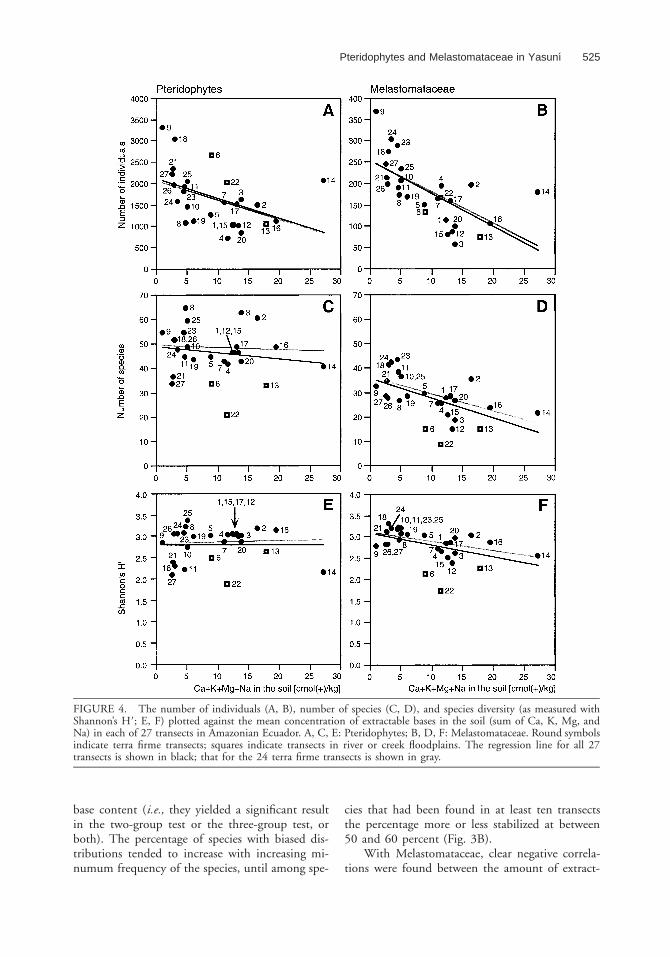
number of pteridophyte individuals found in atransect (r 520.44, P 5 0.03; Fig. 4A). The num-ber of species and species diversity (as measuredwith Shannon’s H9), however, were uncorrelatedwith soil base content (Fig. 4C, E). The same re-sults were obtained whether all 27 transects wereconsidered, or only the 24 that were situated interra firme. When only ground pteridophytes wereincluded in similar analyses, none of the correla-tions were statistically significant.
The degree of topographic heterogeneity withinthe transect was not significantly correlated withthe number of pteridophyte individuals. The sameresult was obtained whether the three seasonallyinundated transects were included in the analysisor not (Fig. 5A). Both species richness and diversitywere positively correlated with topographic hetero-geneity, and especially its logarithm, when all tran-sects were included. This was entirely due to thethree seasonally inundated transects which wereboth species-poor and topographically flat; no cor-relation was found when only terra firme transectswere analyzed (Fig. 5C, E). The results obtainedwith ground pteridophytes were similar.
MELASTOMATACEAE. A total of 4893 individualsand 89 species of the Melastomataceae were count-ed in the 27 transects (Table 2). The number ofindividuals found within one transect varied be-tween 59 and 372, the mean being 181 individualsper transect (724 individuals/ha). The number of
species per transect varied between 9 and 44, themean being 28.
The most abundant Melastomataceae specieswas Miconia triplinervis R. & P., which was repre-sented by 345 individuals in 18 transects (Table 2).Miconia serrulata (DC.) Naud. was also representedby more than 300 individuals. Miconia elata (Sw.)DC. had the highest frequency as it was found in23 transects. Eleven species were found in only 1transect and 3 of these were represented by only 1individual. The mean number of Melastomataceaeindividuals per species was 55, and the mean fre-quency (number of transects in which the specieswas found) was 9.
Out of the ten most abundant Melastomata-ceae species, five were significantly most abundantin the transects in which soils had a lower thanmedian exchangeable base content. Two specieswere significantly most abundant in the transectshaving soils with a higher base content, while thedistribution of three species was statistically indis-tinguishable from random along the soil gradient(Fig. 2). Only one of the abundant species, M.serrulata, was especially abundant in transects 6 and22, which were affected by the inundations of theTiputini River. The other species were either rareor absent in these transects.
Out of the 59 Melastomataceae species that oc-curred in at least four of the terra firme transects,24 (41%) were significantly biased in their distri-bution among transect groups defined using soil
Pteridophytes and Melastomataceae in Yasunı 525
FIGURE 4. The number of individuals (A, B), number of species (C, D), and species diversity (as measured withShannon’s H9; E, F) plotted against the mean concentration of extractable bases in the soil (sum of Ca, K, Mg, andNa) in each of 27 transects in Amazonian Ecuador. A, C, E: Pteridophytes; B, D, F: Melastomataceae. Round symbolsindicate terra firme transects; squares indicate transects in river or creek floodplains. The regression line for all 27transects is shown in black; that for the 24 terra firme transects is shown in gray.
base content (i.e., they yielded a significant resultin the two-group test or the three-group test, orboth). The percentage of species with biased dis-tributions tended to increase with increasing mi-numum frequency of the species, until among spe-
cies that had been found in at least ten transectsthe percentage more or less stabilized at between50 and 60 percent (Fig. 3B).
With Melastomataceae, clear negative correla-tions were found between the amount of extract-

526 Tuomisto, Ruokolainen, Poulsen, Moran, Quintana, Canas, and Celi
FIGURE 5. The number of individuals (A, B), number of species (C, D), and species diversity (as measured withShannon’s H9; E, F) plotted against the largest elevation difference measured within each of 27 transects in AmazonianEcuador. A, C, E: Pteridophytes; B, D, F: Melastomataceae. Round symbols indicate terra firme transects; squaresindicate transects in river or creek floodplains. The best-fitting regression curve for all 27 transects is shown in black;that for the 24 terra firme transects is shown gray. The nonlinear curves are either logarithmic (C, E) or quadratic (B,D, F).
Pteridophytes and Melastomataceae in Yasunı 527
able bases in the soil, and the number of individ-uals, number of species, and Shannon’s H9 diversityindex. The correlation between extractable basesand individuals was slightly more pronouncedwhen all 27 transects were considered (r 520.65,P , 0.001) than when only the 24 terra firmetransects were considered (r 520.62, P , 0.001;Fig. 4B). The opposite was true of both the cor-relations between extractable bases and number ofspecies (r 520.56, P 5 0.004 with all transects, r520.60, P 5 0.003 with terra firme transects) andShannon’s H9 (r 520.46, P 5 0.02 with all tran-sects, r 520.56, P 5 0.008 with terra firme tran-sects; Fig. 4D, F).
The degree of topographic heterogeneity withinthe transect was negatively correlated with thenumber of Melastomataceae individuals when theseasonally inundated transects were excluded, butnot when they were included in the analysis. Bothwith the terra firme data set and the full data set,a quadratic regression gave a better fit than astraight line (Fig. 5B). The peak at intermediatetopographic heterogeneity was especially strongwith species richness and diversity, both of whichshowed a statistically significant quadratic responsefunction but no linear correlation. These resultswere similar with the full data set and the 24 terrafirme transects (Fig. 5D, F).
COMPARISON OF THE TWO PLANT GROUPS. The Me-lastomataceae were clearly less abundant than ter-restrial pteridophytes; the number of Melastoma-taceae individuals was only 14 percent of the num-ber of terrestrial pteridophyte individuals. The dif-ference in species richness, however, was relativelysmall; the number of Melastomataceae species was82 percent of the number of terrestrial pterido-phyte species.
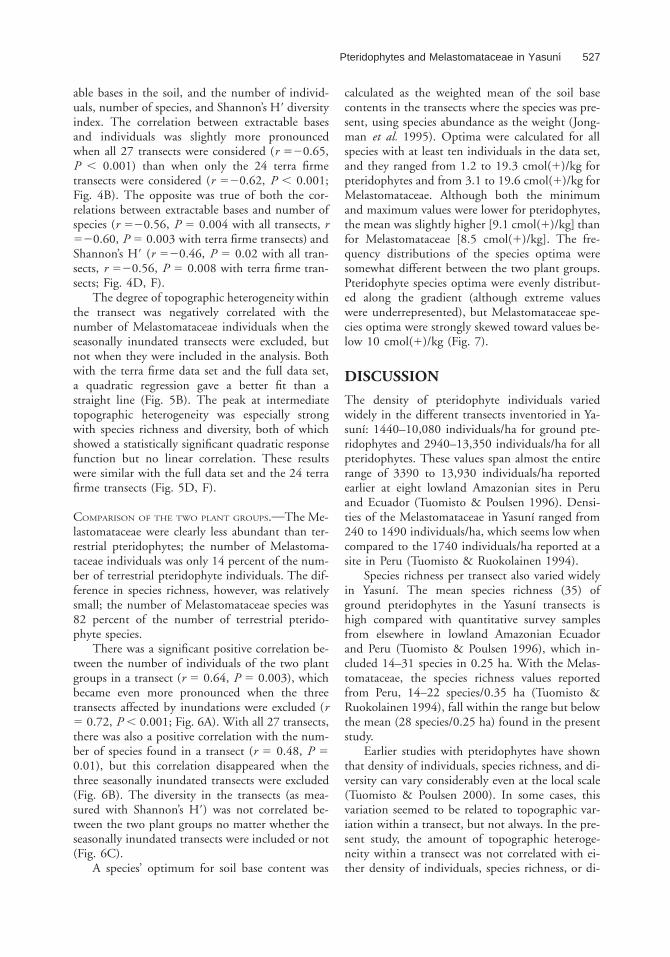
There was a significant positive correlation be-tween the number of individuals of the two plantgroups in a transect (r 5 0.64, P 5 0.003), whichbecame even more pronounced when the threetransects affected by inundations were excluded (r5 0.72, P , 0.001; Fig. 6A). With all 27 transects,there was also a positive correlation with the num-ber of species found in a transect (r 5 0.48, P 50.01), but this correlation disappeared when thethree seasonally inundated transects were excluded(Fig. 6B). The diversity in the transects (as mea-sured with Shannon’s H9) was not correlated be-tween the two plant groups no matter whether theseasonally inundated transects were included or not(Fig. 6C).
A species’ optimum for soil base content was
calculated as the weighted mean of the soil basecontents in the transects where the species was pre-sent, using species abundance as the weight (Jong-man et al. 1995). Optima were calculated for allspecies with at least ten individuals in the data set,and they ranged from 1.2 to 19.3 cmol(1)/kg forpteridophytes and from 3.1 to 19.6 cmol(1)/kg forMelastomataceae. Although both the minimumand maximum values were lower for pteridophytes,the mean was slightly higher [9.1 cmol(1)/kg] thanfor Melastomataceae [8.5 cmol(1)/kg]. The fre-quency distributions of the species optima weresomewhat different between the two plant groups.Pteridophyte species optima were evenly distribut-ed along the gradient (although extreme valueswere underrepresented), but Melastomataceae spe-cies optima were strongly skewed toward values be-low 10 cmol(1)/kg (Fig. 7).
DISCUSSION
The density of pteridophyte individuals variedwidely in the different transects inventoried in Ya-sunı: 1440–10,080 individuals/ha for ground pte-ridophytes and 2940–13,350 individuals/ha for allpteridophytes. These values span almost the entirerange of 3390 to 13,930 individuals/ha reportedearlier at eight lowland Amazonian sites in Peruand Ecuador (Tuomisto & Poulsen 1996). Densi-ties of the Melastomataceae in Yasunı ranged from240 to 1490 individuals/ha, which seems low whencompared to the 1740 individuals/ha reported at asite in Peru (Tuomisto & Ruokolainen 1994).
Species richness per transect also varied widelyin Yasunı. The mean species richness (35) ofground pteridophytes in the Yasunı transects ishigh compared with quantitative survey samplesfrom elsewhere in lowland Amazonian Ecuadorand Peru (Tuomisto & Poulsen 1996), which in-cluded 14–31 species in 0.25 ha. With the Melas-tomataceae, the species richness values reportedfrom Peru, 14–22 species/0.35 ha (Tuomisto &Ruokolainen 1994), fall within the range but belowthe mean (28 species/0.25 ha) found in the presentstudy.
Earlier studies with pteridophytes have shownthat density of individuals, species richness, and di-versity can vary considerably even at the local scale(Tuomisto & Poulsen 2000). In some cases, thisvariation seemed to be related to topographic var-iation within a transect, but not always. In the pre-sent study, the amount of topographic heteroge-neity within a transect was not correlated with ei-ther density of individuals, species richness, or di-
528 Tuomisto, Ruokolainen, Poulsen, Moran, Quintana, Canas, and Celi
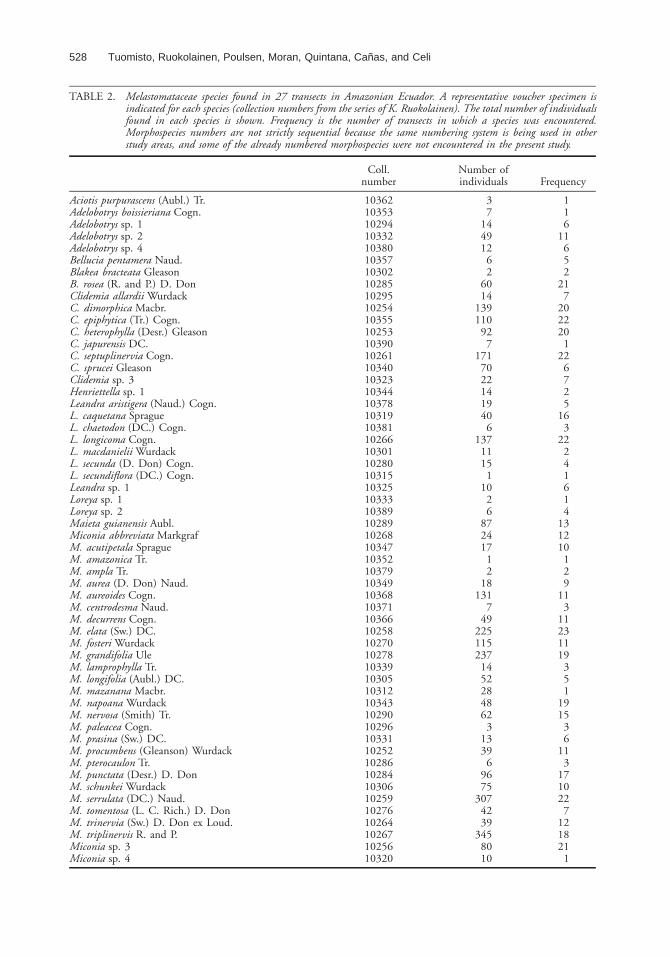
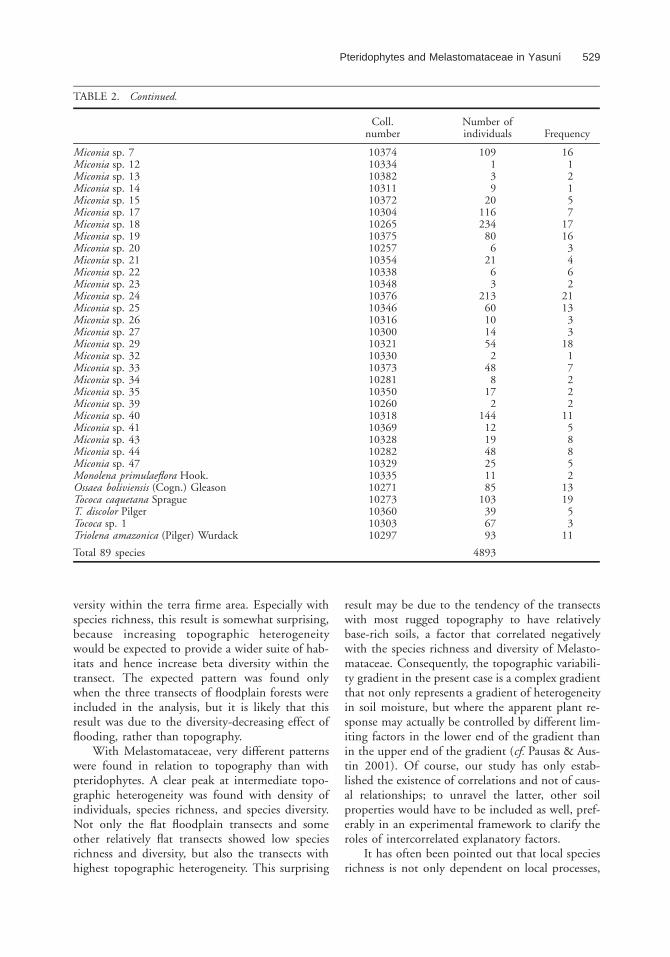
TABLE 2. Melastomataceae species found in 27 transects in Amazonian Ecuador. A representative voucher specimen isindicated for each species (collection numbers from the series of K. Ruokolainen). The total number of individualsfound in each species is shown. Frequency is the number of transects in which a species was encountered.Morphospecies numbers are not strictly sequential because the same numbering system is being used in otherstudy areas, and some of the already numbered morphospecies were not encountered in the present study.
Coll.number
Number ofindividuals Frequency
Aciotis purpurascens (Aubl.) Tr.Adelobotrys boissieriana Cogn.Adelobotrys sp. 1Adelobotrys sp. 2Adelobotrys sp. 4Bellucia pentamera Naud.Blakea bracteata GleasonB. rosea (R. and P.) D. DonClidemia allardii Wurdack
103621035310294103321038010357103021028510295
37
144912
62
6014
116
11652
217
C. dimorphica Macbr.C. epiphytica (Tr.) Cogn.C. heterophylla (Desr.) GleasonC. japurensis DC.C. septuplinervia Cogn.C. sprucei GleasonClidemia sp. 3Henriettella sp. 1
1025410355102531039010261103401032310344
13911092
7171702214
202220
122
672
Leandra aristigera (Naud.) Cogn.L. caquetana SpragueL. chaetodon (DC.) Cogn.L. longicoma Cogn.L. macdanielii WurdackL. secunda (D. Don) Cogn.L. secundiflora (DC.) Cogn.Leandra sp. 1Loreya sp. 1Loreya sp. 2
10378103191038110266103011028010315103251033310389
1940
61371115
110
26
516
322
241614
Maieta guianensis Aubl.Miconia abbreviata MarkgrafM. acutipetala SpragueM. amazonica Tr.M. ampla Tr.M. aurea (D. Don) Naud.M. aureoides Cogn.M. centrodesma Naud.M. decurrens Cogn.M. elata (Sw.) DC.
10289102681034710352103791034910368103711036610258
872417
12
18131
749
225
131210
129
113
1123
M. fosteri WurdackM. grandifolia UleM. lamprophylla Tr.M. longifolia (Aubl.) DC.M. mazanana Macbr.M. napoana WurdackM. nervosa (Smith) Tr.M. paleacea Cogn.M. prasina (Sw.) DC.
102701027810339103051031210343102901029610331
1152371452284862
313
1119
351
1915
36
M. procumbens (Gleanson) WurdackM. pterocaulon Tr.M. punctata (Desr.) D. DonM. schunkei WurdackM. serrulata (DC.) Naud.M. tomentosa (L. C. Rich.) D. DonM. trinervia (Sw.) D. Don ex Loud.M. triplinervis R. and P.
1025210286102841030610259102761026410267
396
9675
3074239
345
113
171022
71218
Miconia sp. 3Miconia sp. 4
1025610320
8010
211
Pteridophytes and Melastomataceae in Yasunı 529
TABLE 2. Continued.
Coll.number
Number ofindividuals Frequency
Miconia sp. 7Miconia sp. 12Miconia sp. 13Miconia sp. 14Miconia sp. 15Miconia sp. 17Miconia sp. 18
10374103341038210311103721030410265
109139
20116234
1612157
17Miconia sp. 19Miconia sp. 20Miconia sp. 21Miconia sp. 22Miconia sp. 23Miconia sp. 24Miconia sp. 25Miconia sp. 26Miconia sp. 27
103751025710354103381034810376103461031610300
806
2163
213601014
163462
2113
33
Miconia sp. 29Miconia sp. 32Miconia sp. 33Miconia sp. 34Miconia sp. 35Miconia sp. 39Miconia sp. 40Miconia sp. 41Miconia sp. 43
103211033010373102811035010260103181036910328
542
488
172
1441219
1817222
1158
Miconia sp. 44Miconia sp. 47Monolena primulaeflora Hook.Ossaea boliviensis (Cogn.) GleasonTococa caquetana SpragueT. discolor PilgerTococa sp. 1Triolena amazonica (Pilger) Wurdack
1028210329103351027110273103601030310297
48251185
103396793
852
1319
53
11
Total 89 species 4893
versity within the terra firme area. Especially withspecies richness, this result is somewhat surprising,because increasing topographic heterogeneitywould be expected to provide a wider suite of hab-itats and hence increase beta diversity within thetransect. The expected pattern was found onlywhen the three transects of floodplain forests wereincluded in the analysis, but it is likely that thisresult was due to the diversity-decreasing effect offlooding, rather than topography.
With Melastomataceae, very different patternswere found in relation to topography than withpteridophytes. A clear peak at intermediate topo-graphic heterogeneity was found with density ofindividuals, species richness, and species diversity.Not only the flat floodplain transects and someother relatively flat transects showed low speciesrichness and diversity, but also the transects withhighest topographic heterogeneity. This surprising
result may be due to the tendency of the transectswith most rugged topography to have relativelybase-rich soils, a factor that correlated negativelywith the species richness and diversity of Melasto-mataceae. Consequently, the topographic variabili-ty gradient in the present case is a complex gradientthat not only represents a gradient of heterogeneityin soil moisture, but where the apparent plant re-sponse may actually be controlled by different lim-iting factors in the lower end of the gradient thanin the upper end of the gradient (cf. Pausas & Aus-tin 2001). Of course, our study has only estab-lished the existence of correlations and not of caus-al relationships; to unravel the latter, other soilproperties would have to be included as well, pref-erably in an experimental framework to clarify theroles of intercorrelated explanatory factors.
It has often been pointed out that local speciesrichness is not only dependent on local processes,
530 Tuomisto, Ruokolainen, Poulsen, Moran, Quintana, Canas, and Celi
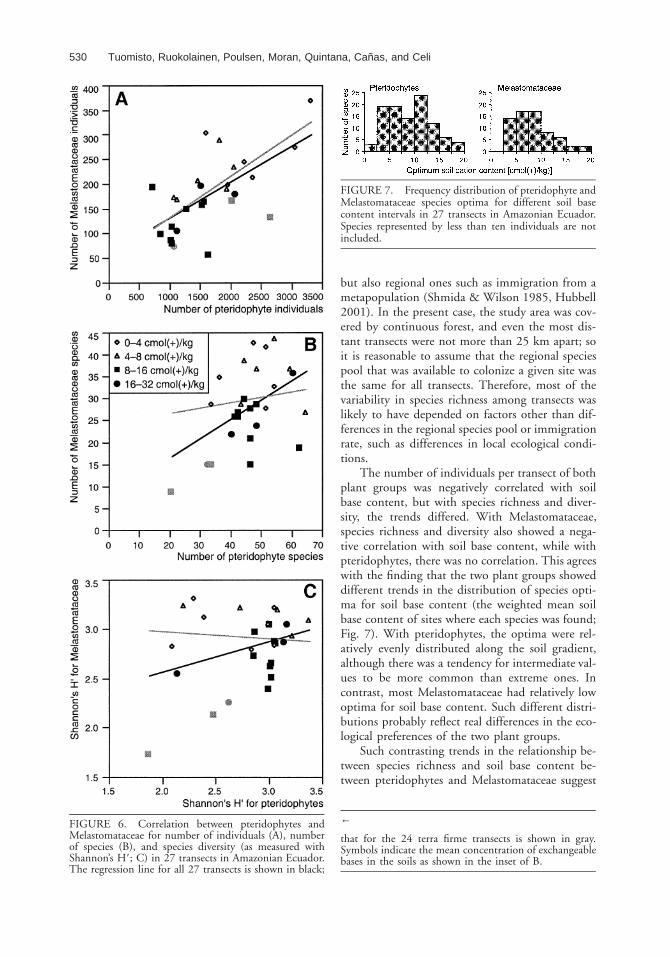
FIGURE 6. Correlation between pteridophytes andMelastomataceae for number of individuals (A), numberof species (B), and species diversity (as measured withShannon’s H9; C) in 27 transects in Amazonian Ecuador.The regression line for all 27 transects is shown in black;
FIGURE 7. Frequency distribution of pteridophyte andMelastomataceae species optima for different soil basecontent intervals in 27 transects in Amazonian Ecuador.Species represented by less than ten individuals are notincluded.
←
that for the 24 terra firme transects is shown in gray.Symbols indicate the mean concentration of exchangeablebases in the soils as shown in the inset of B.
but also regional ones such as immigration from ametapopulation (Shmida & Wilson 1985, Hubbell2001). In the present case, the study area was cov-ered by continuous forest, and even the most dis-tant transects were not more than 25 km apart; soit is reasonable to assume that the regional speciespool that was available to colonize a given site wasthe same for all transects. Therefore, most of thevariability in species richness among transects waslikely to have depended on factors other than dif-ferences in the regional species pool or immigrationrate, such as differences in local ecological condi-tions.
The number of individuals per transect of bothplant groups was negatively correlated with soilbase content, but with species richness and diver-sity, the trends differed. With Melastomataceae,species richness and diversity also showed a nega-tive correlation with soil base content, while withpteridophytes, there was no correlation. This agreeswith the finding that the two plant groups showeddifferent trends in the distribution of species opti-ma for soil base content (the weighted mean soilbase content of sites where each species was found;Fig. 7). With pteridophytes, the optima were rel-atively evenly distributed along the soil gradient,although there was a tendency for intermediate val-ues to be more common than extreme ones. Incontrast, most Melastomataceae had relatively lowoptima for soil base content. Such different distri-butions probably reflect real differences in the eco-logical preferences of the two plant groups.
Such contrasting trends in the relationship be-tween species richness and soil base content be-tween pteridophytes and Melastomataceae suggest

Pteridophytes and Melastomataceae in Yasunı 531
that species richness of one group of organisms isnot necessarily a very good predictor of speciesrichness of another group of organisms. This resultagrees with earlier studies conducted both in thetropics and elsewhere (Prendergast et al. 1993,Howard et al. 1998). It may be difficult or evenimpossible to find a group of organisms that couldserve as a reliable indicator of spatial species rich-ness patterns in other groups.
The soils in all of our Yasunı transects haverelatively high base contents when compared toother Ecuadorian and Peruvian sites that we haveinventoried. Therefore, the species richness trendsobserved here represent only a small part of the soilvariation found in Amazonia, and the patterns ob-served may not apply to longer edaphic gradients.In earlier studies, we noticed that in soils with low-er base contents, both pteridophytes and the Me-lastomataceae showed a trend of increasing speciesrichness with increasing soil base content (Tuomis-to & Ruokolainen 1994, Tuomisto & Poulsen1996, Tuomisto 1998; K. Ruokolainen, pers. obs.).
These kinds of differences in species richnesstrends in different parts of the edaphic gradientprobably explain some of the discrepancies amongthe results of earlier studies. Several researchershave suggested that the response curve of plant spe-cies richness along a productivity gradient is uni-modal and attains a peak at intermediate produc-tivity (Ashton 1992, Rosenzweig & Abramsky1993). If species richness along a long soil basecontent gradient shows this kind of a unimodalpattern, then the pattern observed along a shortedaphic gradient can be either decreasing, increas-ing, or flat depending on which part of the longgradient is sampled (review in Pausas & Austin2001).
In both pteridophytes and the Melastomata-ceae, more than half of the common speciesshowed a statistically significant bias in their abun-dance distribution in relation to soil base content(Figs. 2, 3). There is no reason to consider the soilgradient observed here as exceptionally long inwestern Amazonian terms, and therefore, our re-sults suggest that the majority of pteridophyte andMelastomataceae species perceive the unfloodedforests of the area as a mosaic of different habitats,rather than homogeneous. The fact that the speciesoptima were relatively evenly distributed along thesoil cation gradient, however, indicates that thehabitats need not be sharply differentiated fromeach other either floristically or in terms of their
environment, but rather that they form a contin-uum.
Patterns in pteridophyte and Melastomataceaespecies composition have been observed to be high-ly correlated with patterns in tree species compo-sition (Tuomisto et al. 1995, Ruokolainen et al.1997, Ruokolainen & Tuomisto 1998, Vormisto etal. 2000). Therefore, one may expect that not onlypteridophytes and Melastomataceae but also manytree species, and perhaps species of other plantgroups, show nonrandom distributions across anedaphic gradient of the length observed in the pre-sent study. Our results, however, cannot be extrap-olated to other plant groups without further studiesbecause big plants may actually show more gener-alized behavior along edaphic gradients than smallplants (Ruokolainen & Vormisto 2000, Ruokolai-nen et al. 2002). The tree studies of Clark et al.(1999) in Costa Rica and Webb and Peart (2000)on Borneo support our conclusions, while those ofPitman et al. (1999, 2001) in southern Peru sug-gest that edaphic differences are less significant.Out of these studies, however, the Webb and Peart(2000) study is the only one to include chemicalanalyses of soils.
A comparison of species lists (Tables 1 and 2)and soil properties for Yasunı and other study sitesis illuminating. Out of the 49 pteridophyte speciesconsidered rich-soil specialists by Tuomisto andPoulsen (1996), 45 were found in our Yasunı sam-ple, while out of the 28 intermediate to poor soilspecialists, only 3 were. Similarly, only 4 out of the24 Melastomataceae species reported by Tuomistoand Ruokolainen (1994) from a poor to interme-diate soil site in northern Peru were found in ourpresent Yasunı sample, and all of these seem to begeneralists that have been found also elsewhere ina wide range of soils (K. Ruokolainen, pers. obs.).Such results suggest that the observed edaphic pref-erences of pteridophyte and Melastomataceae spe-cies are rather consistent even over wider spatialscales.
ACKNOWLEDGMENTSWe thank Pontificia Universidad Catolica del Ecuador forlogistic support, especially its Yasunı Research Station andHerbarium QCA. Renato Valencia is acknowledged forhelp in making the logistic arrangements, Oscar Mendozaand Ermindo Zambrano for assistance in the field work,and Alan R. Smith and John T. Mickel for help withspecies identification. The study was funded by the Dan-ish Center for Tropical Biodiversity and the Academy ofFinland.
532 Tuomisto, Ruokolainen, Poulsen, Moran, Quintana, Canas, and Celi
LITERATURE CITED
ASHTON, P. S. 1992. Species richness in plant communities. In P. L. Fiedler and S. K. Jain (Eds.). ConservationBiology, pp. 3–22. Chapman and Hall, New York, New York.
BALSLEV, H., J. LUTEYN, B. ØLLGAARD, AND L. B. HOLM-NIELSEN. 1987. Composition and structure of adjacentunflooded and floodplain forest in Amazonian Ecuador. Opera Bot. 92: 37–57.
CAMPBELL, D. G., D. D. DALY, G. T. PRANCE, AND U. N. MACIEL. 1986. Quantitative ecological inventory of terrafirme and varzea tropical forest on the Rio Xingu, Brazilian Amazon. Brittonia 38: 369–393.
CANADAS, L. 1983. El mapa bioclimatico ecologico del Ecuador. Editores Asociados Cıa. Ltda., Quito. Ecuador.CLARK, D. B., D. A. CLARK, AND J. M. READ. 1998. Edaphic variation and the mesoscale distribution of tree species
in a neotropical rain forest. J. Ecology 86: 101–112.———, M. W. PALMER, AND D. A. CLARK. 1999. Edaphic factors and the landscape-scale distributions of tropical
rain forest trees. Ecology 80: 2662–2675.CLINEBELL, R. R., II, O. PHILLIPS, A. H. GENTRY, N. STARK, AND H. ZUURING. 1995. Prediction of neotropical tree
and liana species richness from soil and climatic data. Biodiv. Conserv. 4: 56–90.DUIVENVOORDEN, J. F. 1994. Vascular plant species counts in the rain forests of the middle Caqueta area, Colombian
Amazonia. Biodiv. Conserv. 3: 685–715.———. 1995. Tree species composition and rain forest-environment relationships in the middle Caqueta area, Co-
lombia, NW Amazonia. Vegetatio 120: 91–113.———. 1996. Patterns of tree species richness in rain forests of the middle Caqueta area, Colombia, NW Amazonia.
Biotropica 28: 142–158.DUQUE, A., M. SANCHEZ, J. CAVELIER, J. F. DUIVENVOORDEN, P. MIRANA, J. MIRANA, AND A. MATAPI. 2001. Relacion
bosque-ambiente en el Medio Caqueta, Amazonıa colombiana. In J. F. Duivenvoorden, H. Balslev, J. Cavelier,C. Grandez, H. Tuomisto, and R. Valencia (Eds.). Evaluacion de recursos forestales no maderables en laAmazonıa noroccidental, pp. 99–129. IBED, Universiteit van Amsterdam, Amsterdam, The Netherlands.
GENTRY, A. H. 1981. Distributional patterns and an additional species of the Passiflora vitifolia complex: Amazonianspecies diversity due to edaphically differentiated communities. Plant Syst. Evol. 137: 95–105.
———. 1988. Changes in plant community diversity and floristic composition on environmental and geographicalgradients. Ann. Mo. Bot. Gard. 75: 1–34.
GRANDEZ, C., A. GARCIA, A. DUQUE, AND J. F. DUIVENVOORDEN. 2001. La composicion florıstica de los bosques enlas cuencas de los rıos Ampiyacu y Yaguasyacu (Amazonıa peruana). In J. F. Duivenvoorden, H. Balslev, J.Cavelier, C. Grandez, H. Tuomisto, and R. Valencia (Eds.). Evaluacion de recursos forestales no maderablesen la Amazonıa noroccidental, pp. 163–176. IBED, Universiteit van Amsterdam, Amsterdam, The Nether-lands.
HOWARD, P. C., P. VISKANIC, T. R. B. DAVENPORT, F. W. KIGENYI, M. BALTZER, C. J. DICKINSON, J. S. LWANGA, R. A.MATTHEWS, AND A. BALMFORD. 1998. Complementarity and the use of indicator groups for reserve selectionin Uganda. Nature 394: 472–475.
HUBBELL, S. P. 2001. The unified neutral theory of biodiversity and biogeography. Monographs in population biology32. Princeton University Press, Princeton, New Jersey.
HUSTON, M. 1980. Soil nutrients and tree species richness in Costa Rican forests. J. Biogeogr. 7: 147–157.JONGMAN, R. H. G., C. J. F TER BRAAK, AND O. F. R. VAN TONGEREN (EDS.). 1995. Data analysis in community and
landscape ecology. Cambridge University Press, Cambridge, United Kingdom.PAUSAS, J. G., AND M. P. AUSTIN. 2001. Patterns of plant species richness in relation to different environments: An
appraisal. J. Veg. Sci. 12: 153–166.PITMAN, N. C. A., J. TERBORGH, M. R. SILMAN, AND P. NUNEZ V. 1999. Tree species distributions in an upper
Amazonian forest. Ecology 80: 2651–2661.———, ———, ———, ———, D. A. NEILL, C. E. CERON, W. A. PALACIOS, AND M. AULESTIA. 2001. Dominance
and distribution of tree species in upper Amazonian terra firme forests. Ecology 82: 2101–2117.POULSEN, A. D., AND H. BALSLEV. 1991. Abundance and cover of ground herbs in an Amazonian rain forest. J. Veg.
Sci. 2: 315–322.PRENDERGAST, J. R., R. M. QUINN, J. H. LAWTON, B. C. EVERSHAM, AND D. W. GIBBONS. 1993. Rare species, the
coincidence of diversity hotspots and conservation strategies. Nature 365: 335–337.ROMERO-SALTOS, H., R. VALENCIA, AND M. J. MACIA. 2001. Patrones de diversidad, distribucion y rareza de plantas
lenosas en el Parque Nacional Yasunı y la Reserva Etnica Huaorani, Amazonıa ecuatoriana. In J. F. Duiven-voorden, H. Balslev, J. Cavelier, C. Grandez, H. Tuomisto, and R. Valencia (Eds.). Evaluacion de recursosforestales no maderables en la Amazonıa noroccidental, pp. 131–162. IBED, Universiteit van Amsterdam,Amsterdam, The Netherlands.
ROMOLEROUX, K., R. FOSTER, R. VALENCIA, R. CONDIT, H. BALSLEV, AND E. LOSOS. 1997. Arboles y arbustos (dap$1cm) encontrados en dos hectareas de un bosque de la Amazonıa ecuatoriana. In R. Valencia and H. Balslev(Eds.). Estudios sobre diversidad y ecologıa de plantas, pp. 189–215. Memorias del II Congreso Ecuatorianode Botanica. Pontificia Universidad Catolica del Ecuador, Quito, Ecuador.
ROSENZWEIG, M. L., AND Z. ABRAMSKY. 1993. How are diversity and productivity related? In R. E. Ricklefs and D.Schluter (Eds.). Species diversity in ecological communities, pp. 52–65. The University of Chicago Press,Chicago, Illinois.
RUOKOLAINEN, K., A. LINNA, AND H. TUOMISTO. 1997. Use of Melastomataceae and pteridophytes for revealing phy-togeographic patterns in Amazonian rain forests. J. Trop. Ecol. 13: 243–256.
Pteridophytes and Melastomataceae in Yasunı 533
———, AND H. TUOMISTO. 1998. Vegetacion natural de la zona de Iquitos. In R. Kalliola and S. Flores Paitan (Eds.).Geoecologıa y desarrollo amazonico: estudio integrado en la zona de Iquitos, Peru. Ann. Univ. Turkuensis Ser.A II 114: 253–365.
———, ———, J. VORMISTO, AND N. PITMAN. 2002. Two biases in estimating range sizes of Amazonian plant species.J. Trop. Ecol. 18: 935–942.
———, AND J. VORMISTO. 2000. The most widespread Amazonian palms tend to be tall and habitat generalists. BasicAppl. Ecol. 1: 97–108.
SHMIDA, A., AND M. V. WILSON. 1985. Biological determinants of species diversity. J. Biogeogr. 12: 1–20.SVENNING, J.-C. 1999. Microhabitat specialization in a species-rich palm community in Amazonian Ecuador. J. Ecol.
87: 55–65.TUOMISTO, H. 1998. What satellite imagery and large-scale field studies can tell about biodiversity patterns in Ama-
zonian forests. Ann. Mo. Bot. Gard. 85: 48–62.———, AND A. D. POULSEN. 1996. Influence of edaphic specialization on pteridophyte distribution in neotropical
rain forests. J. Biogeogr. 23: 283–293.———, AND ———. 2000. Pteridophyte diversity and species composition in four Amazonian rain forests. J. Veg.
Sci. 11: 383–396.———, ———, AND R. C. MORAN. 1998. Edaphic distribution of some species of the fern genus Adiantum in
Western Amazonia. Biotropica 30: 392–399.———, ———, K. RUOKOLAINEN, R. C. MORAN, C. QUINTANA, J. CELI, AND G. CANAS. Linking floristic patterns
with soil heterogeneity and satellite imagery in Ecuadorian Amazonia. Ecol. Appl. In press.———, AND K. RUOKOLAINEN. 1994. Distribution of Pteridophyta and Melastomataceae along an edaphic gradient
in an Amazonian rain forest. J. Veg. Sci. 5: 25–34.———, ———, R. KALLIOLA, A. LINNA, W. DANJOY, AND Z. RODRIGUEZ. 1995. Dissecting Amazonian biodiversity.
Science 269: 63–66.VALENCIA R., R. CONDIT, K. ROMOLEROUX, G. VILLA, E. LOSOS, H. BALSLEV, J.-C. SVENNING, AND E. MAGAARD. Patterns
of tree species diversity and distribution from a large-scale forest inventory in Yasunı National Park, easternEcuador. In E. Losos and R. Condit (Eds.). The demography of tropical forest plants. Smithsonian InstitutionPress, Washington, D.C. In press.
VAN REEUWIJK, L. P. 1993. Procedures for soil analysis. International Soil Reference and Information Centre. Technicalpaper 9 (4th edition). Wageningen, The Netherlands.
VORMISTO, J., O. PHILLIPS, K. RUOKOLAINEN, H. TUOMISTO, AND R. VASQUEZ. 2000. A comparison of small-scaledistribution patterns of four plant groups in an Amazonian rainforest. Ecography 23: 349–359.
WEBB, C. O., AND D. R. PEART. 2000. Habitat associations of trees and seedlings in a Bornean rain forest. J. Ecol.88: 464–478.

BIOTROPICA 35(1): 131 2003
ERRATUM
Biotropica 34(4)
IN TABLE 1 [Biotropica 34(4): 520–521 by Tuomisto et al.], the data for D. falcata follow the collectionnumber 6259. The data following collection number 6064 belong to D. nodosa. The correct collectionnumber for D. nodosa is 6064 (not 6046).
131