Embed Size (px)
Citation preview
Disclaimer: This report and the information therein is derived from selected public sources. Chain Reaction Research is an unincorporated project of Climate Advisers, Profundo, and Aidenvironment (individually and together, the "Sponsors"). The Sponsors believe the information in this report comes from reliable sources, but they do not guarantee the accuracy or completeness of this information, which is subject to change without notice, and nothing in this document shall be construed as such a guarantee. The statements reflect the current judgment of the authors of the relevant articles or features, and do not necessarily reflect the opinion of the Sponsors. The Sponsors disclaim any liability, joint or severable, arising from use of this document and its contents. Nothing herein shall constitute or be construed as an offering of financial instruments or as investment advice or recommendations by the Sponsors of an investment or other strategy (e.g., whether or not to “buy”, “sell”, or “hold” an investment). Employees of the Sponsors may hold positions in the companies, projects or investments covered by this report. No aspect of this report is based on the consideration of an investor or potential investor's individual circumstances. You should determine on your own whether you agree with the content of this document and any information or data provided by the Sponsors.
Tunas Baru Lampung | March 2018
Tunas Baru Lampung: Contested land and peat clearing could drive substantial value loss Tunas Baru Lampung (TBLA) is an integrated palm oil and sugar cane company established in 1973. It was publicly listed on the Jakarta Stock Exchange in 2000. TBLA is a member of the Sungai Budi Group, which is one of Indonesia’s largest manufacturers and distributers of agricultural consumer products. As of January 2018, 46 percent of the company’s shares were publicly listed. TBLA’s oil palm landbank is estimated at 88,660 hectares (ha), located in South Sumatra and West Kalimantan. In addition, the company converted two plantations – PT Dinamika Graha Sarana and PT Bangun Nusa Indah Lestari – to sugar cane in 2017. TBLA aims to grow its plantations with 2,000-4,000 ha per year in addition to the 74,060 hectares already developed. The company’s palm oil operations are vertically integrated. Besides its plantations, TBLA possesses three mills, two palm oil refineries, three processing facilities for soap and margarine and one biodiesel plant. Its two refineries are located in Lampung and Sidoarjo. They have processing capacity of 51,000 MT/year and 30,000 MT/year respectively.
Key Findings
• An estimated 75 percent of TBLA’s landbank is contested. Since 2014, TBLA
has cleared almost 7,000 ha of peatland and forest across its concessions and it
has been involved in four reported social conflicts. TBLA’s total oil palm
landbank equals 88,660 ha, of which 74,060 ha are already developed and
planted with oil palm. The remaining 14,600 ha, 16.5 percent of the total
landbank, are still covered with peat, peat forest and forest.
• Several TBLA clients have engaged the company on sustainability issues. The
issues raised by TBLA’s clients increase the likelihood of its suspension from
the No Deforestation, No Peat, No Exploitation (NDPE) market. As a result,
the company could be limited to supplying the ‘palm oil leakage’ market.
Whereas its vertically integrated business model allows TBLA to circumvent
trader/refiner NDPE policies, its sales to consumer goods companies with zero-
deforestation commitments are at risk.
• TBLA’s recent peat clearance violates Indonesia’s peat moratorium. The
company faces regulatory risk from these violations at several plantations, in
the form of fines, stop-work orders, loss of business permits and operational
licenses, and loss of tender eligibility for subsidized biodiesel supply.
• As a result of non-compliance with clients’ NDPE sourcing policies, 10 percent of TBLA’s revenues are at risk. Additionally, TBLA’s violations could result in a 1-year permit freeze resulting in a decrease of eight percent of its revenue. Jointly these negative effects could equal to 26 percent of TBLA’s equity value. The company may also face increased cost of capital in the future.
• To mitigate potential revenue losses, TBLA may opt to restore its peat lands. TBLA might also need to set aside an additional 13 percent of its land for peat restoration. These two changes equals 16 percent of the company’s equity.
Chain Reaction Research 1320 19th Street NW, Suite 400 Washington, DC 20036 United States Website: www.chainreactionresearch.com Email: [email protected] Authors: Tim Steinweg Milena Levicharova Zach Drennen
Key risks As % of
total
As % of equity value
Revenue at risk 10% 24%
Permit freeze (ha) 27% 2%
or
Stranded land (ha) 13% 12%
Land restoration (ha) 6% 4%
List of key NDPE customers:
• Golden Agri-Resources
• Musim Mas
• Wilmar
• Nestlé
• Bumitama
Tunas Baru Lampung | March 2018|2
Company Profile
Tunas Baru Lampung (TBLA) is an integrated palm oil and sugar cane company that was
established in 1973. It was publicly listed on the Jakarta Stock Exchange in 2000. TBLA is
a member of the Sungai Budi Group, which is one of Indonesia’s largest manufacturers
and distributers of agricultural consumer products. The company’s business activities
include manufacturing and distribution of agricultural-based products, such as palm
cooking oil, coconut cooking percent derivatives of sugar cane and products.’ The
company is vertically integrated with its own plantations, mills and processing/refining
capacity.
TBLA has approximately 88,600 ha in its palm oil landbank, located in South Sumatra
and West Kalimantan. In addition, the company converted two plantations – PT
Dinamika Graha Sarana and PT Bangun Nusa Indah Lestari – to sugar cane in 2017
(24,330 ha).
Besides plantations, TBLA possesses three CPO/PK mills, two palm oil refineries, three
processing facilities for soap and margarine and one biodiesel plant. Its two refineries
are in Lampung and Sidoarjo with processing capacities of 51,000 MT/year and 30,000
MT/year respectively. TBLA aims to grow its plantations with 2,000-4,000 ha per year in
South Sumatra and West Kalimantan.
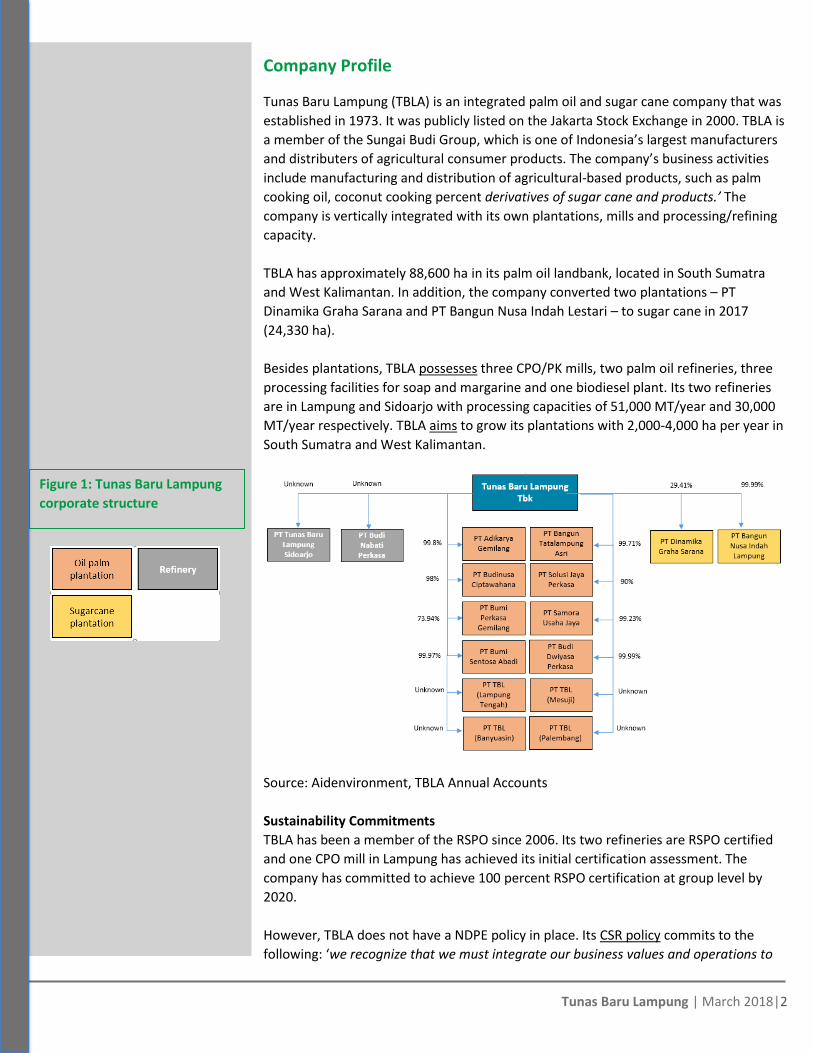
Source: Aidenvironment, TBLA Annual Accounts
Sustainability Commitments
TBLA has been a member of the RSPO since 2006. Its two refineries are RSPO certified
and one CPO mill in Lampung has achieved its initial certification assessment. The
company has committed to achieve 100 percent RSPO certification at group level by
2020.
However, TBLA does not have a NDPE policy in place. Its CSR policy commits to the
following: ‘we recognize that we must integrate our business values and operations to
Figure 1: Tunas Baru Lampung
corporate structure
Tunas Baru Lampung | March 2018|3
meet expectations of our stakeholders. They include customers, employees, regulators,
investors, suppliers, community and the environment.’ TBLA’s environmental
commitments appear to be limited to minimizing its consumption of natural resources
and energy, waste reduction and responsible waste management.
TBLA does not have a sustainable sourcing policy. Its two refineries might be a source
of non-sustainable palm oil leakage. TBLA’s refinery capacity exceeds that of its three
CPO mills. It is likely that the refineries rely on third party CPO supply.
In response to a draft version of this report, TBLA indicated that it operates in
accordance with all relevant laws and overall sustainability principles. However, it
would not provide further details on these sustainability commitments.
Sustainability Risks
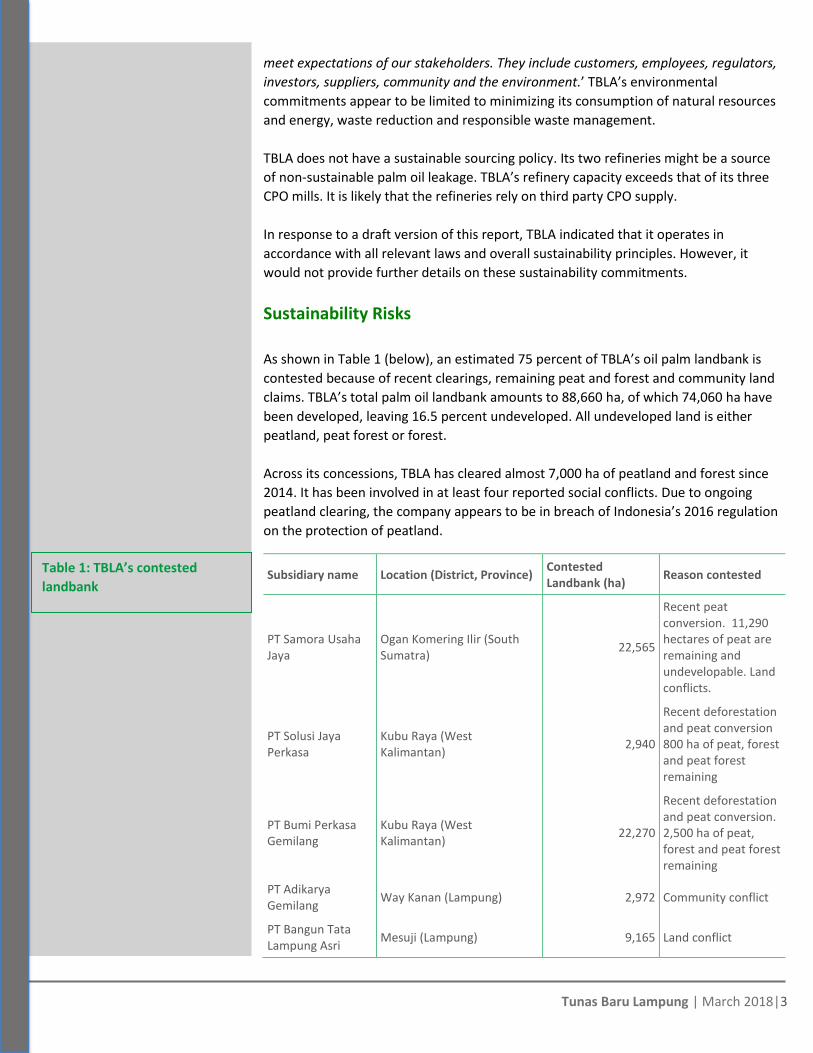
As shown in Table 1 (below), an estimated 75 percent of TBLA’s oil palm landbank is
contested because of recent clearings, remaining peat and forest and community land
claims. TBLA’s total palm oil landbank amounts to 88,660 ha, of which 74,060 ha have
been developed, leaving 16.5 percent undeveloped. All undeveloped land is either
peatland, peat forest or forest.
Across its concessions, TBLA has cleared almost 7,000 ha of peatland and forest since
2014. It has been involved in at least four reported social conflicts. Due to ongoing
peatland clearing, the company appears to be in breach of Indonesia’s 2016 regulation
on the protection of peatland.
Subsidiary name Location (District, Province) Contested Landbank (ha)
Reason contested
PT Samora Usaha Jaya
Ogan Komering Ilir (South Sumatra)
22,565
Recent peat conversion. 11,290 hectares of peat are remaining and undevelopable. Land conflicts.
PT Solusi Jaya Perkasa
Kubu Raya (West Kalimantan)
2,940
Recent deforestation and peat conversion 800 ha of peat, forest and peat forest remaining
PT Bumi Perkasa Gemilang
Kubu Raya (West Kalimantan)
22,270
Recent deforestation and peat conversion. 2,500 ha of peat, forest and peat forest remaining
PT Adikarya Gemilang
Way Kanan (Lampung) 2,972 Community conflict
PT Bangun Tata Lampung Asri
Mesuji (Lampung) 9,165 Land conflict
Table 1: TBLA’s contested
landbank
Tunas Baru Lampung | March 2018|4
PT Tunas Baru Lampung (PKS 2)
Mesuji (Lampung) N/A No map available
PT Tunas Baru Lampung (PKS 4)
Palembang / Banyuasin (South Sumatra)
6.985 Land issues with transmigration communities.
Source: Aidenvironment
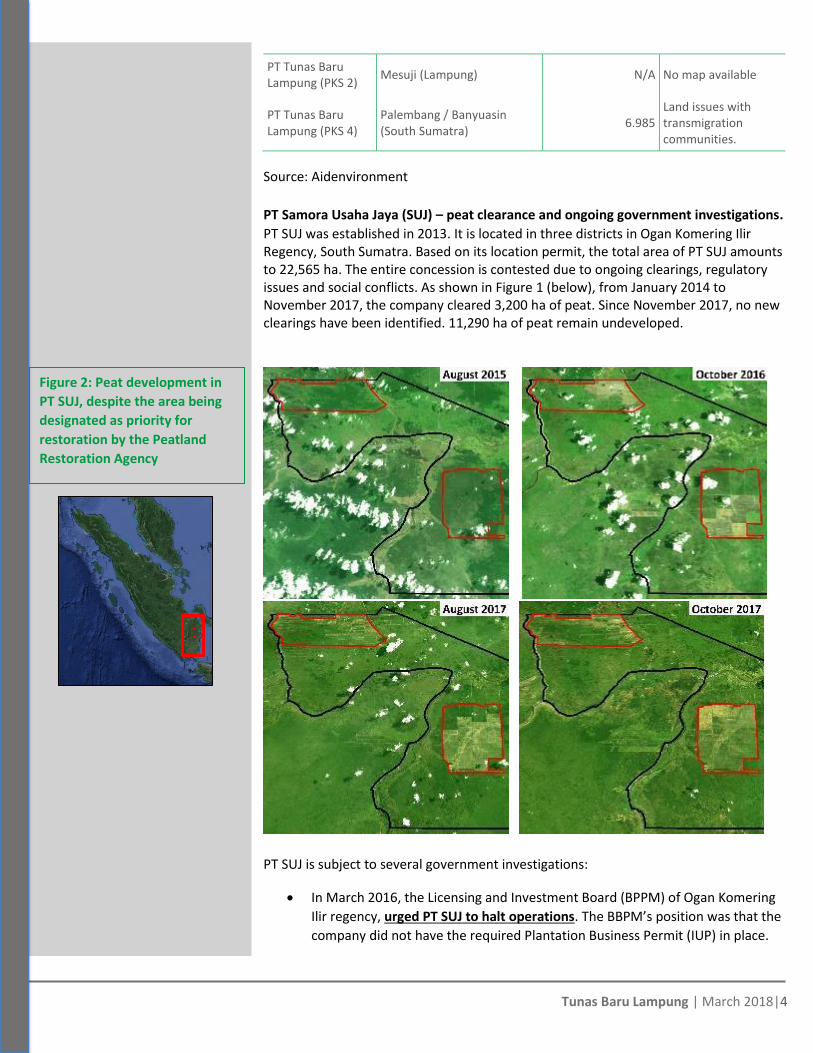
PT Samora Usaha Jaya (SUJ) – peat clearance and ongoing government investigations.
PT SUJ was established in 2013. It is located in three districts in Ogan Komering Ilir Regency, South Sumatra. Based on its location permit, the total area of PT SUJ amounts to 22,565 ha. The entire concession is contested due to ongoing clearings, regulatory issues and social conflicts. As shown in Figure 1 (below), from January 2014 to November 2017, the company cleared 3,200 ha of peat. Since November 2017, no new clearings have been identified. 11,290 ha of peat remain undeveloped.
PT SUJ is subject to several government investigations:
• In March 2016, the Licensing and Investment Board (BPPM) of Ogan Komering
Ilir regency, urged PT SUJ to halt operations. The BBPM’s position was that the
company did not have the required Plantation Business Permit (IUP) in place.
Figure 2: Peat development in
PT SUJ, despite the area being
designated as priority for
restoration by the Peatland
Restoration Agency
Tunas Baru Lampung | March 2018|5
Further BPPM investigations revealed that the company did not respect the
stop-work order.
• In November 2016, the Ministry of Environment and Forestry (KLHK) found that
PT SUJ conducted new planting activities in areas that have been designated
for restoration by the Peat Restoration Agency (BRG), in response to the
aftermath of the 2015 fire cases. According to the company, this area does not
fall under the peatland moratorium, according to the revised Map for the
Deferment of New License Issuance (PIPPIB Map Revision XIII) of the Peat
Restoration Agency.
• The original KLHK permit, issued in 2012, designated the concession for the
cultivation of sugar cane, yet PT SUJ produces palm oil. According to the
company, all planting activities are in accordance with its permits.
In March 2016, local media reported citizen demonstrations against the alleged land
grabbing of 800 ha by PT SUJ. According to the article, residents reported the problem
to the district’s Land Dispute Settlement officers and the provincial government.
Notwithstanding, PT SUJ continued land development in the contested area. The
company states that no grievances over land issues have been filed with the company
or the district government.
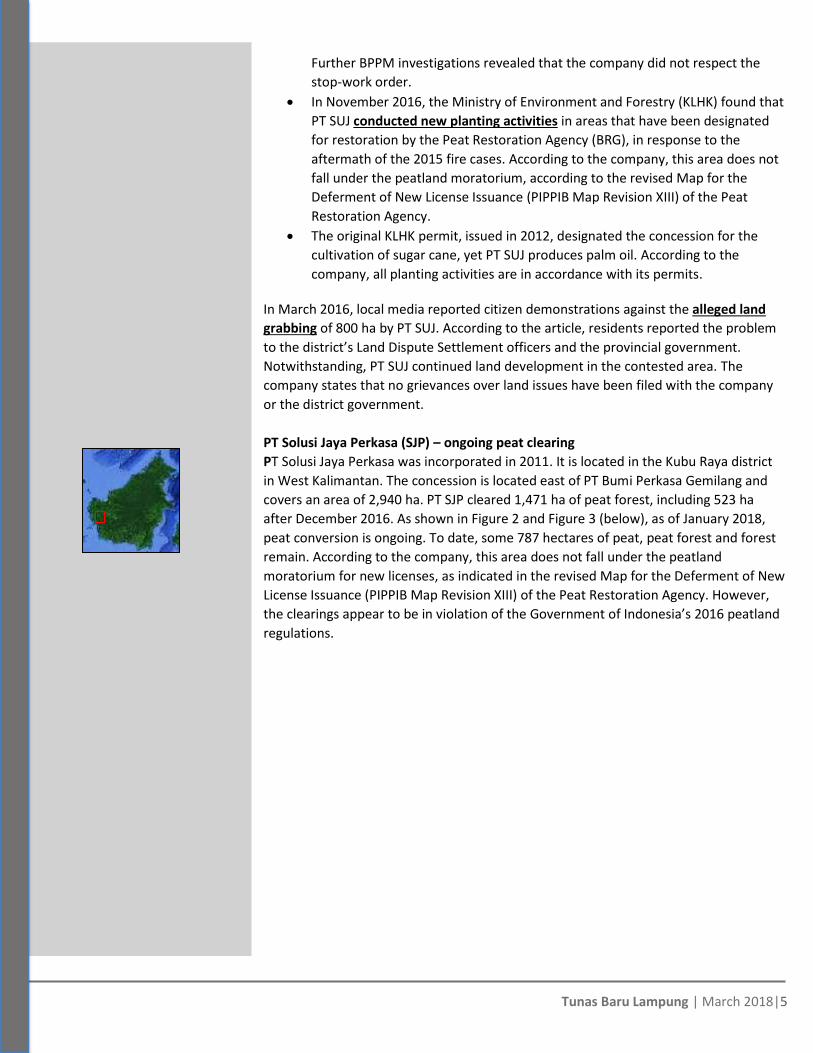
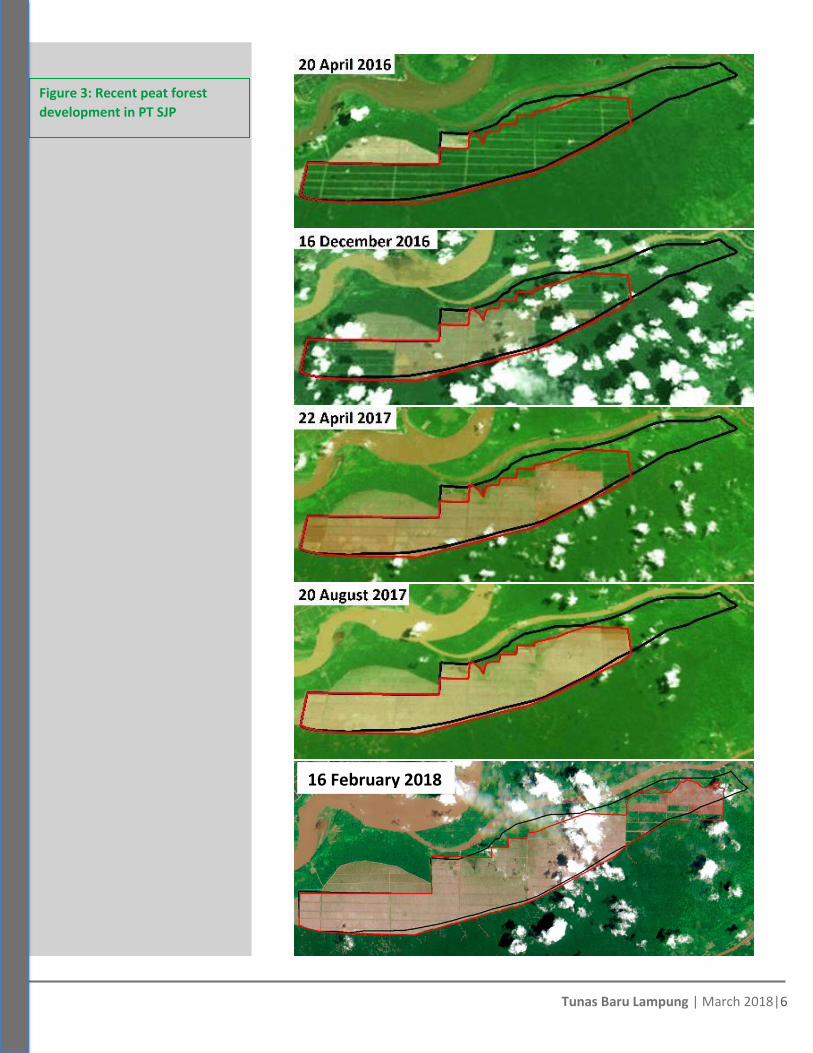
PT Solusi Jaya Perkasa (SJP) – ongoing peat clearing
PT Solusi Jaya Perkasa was incorporated in 2011. It is located in the Kubu Raya district
in West Kalimantan. The concession is located east of PT Bumi Perkasa Gemilang and
covers an area of 2,940 ha. PT SJP cleared 1,471 ha of peat forest, including 523 ha
after December 2016. As shown in Figure 2 and Figure 3 (below), as of January 2018,
peat conversion is ongoing. To date, some 787 hectares of peat, peat forest and forest
remain. According to the company, this area does not fall under the peatland
moratorium for new licenses, as indicated in the revised Map for the Deferment of New
License Issuance (PIPPIB Map Revision XIII) of the Peat Restoration Agency. However,
the clearings appear to be in violation of the Government of Indonesia’s 2016 peatland
regulations.
Tunas Baru Lampung | March 2018|6
Figure 3: Recent peat forest
development in PT SJP
16 February 2018

Tunas Baru Lampung | March 2018|7
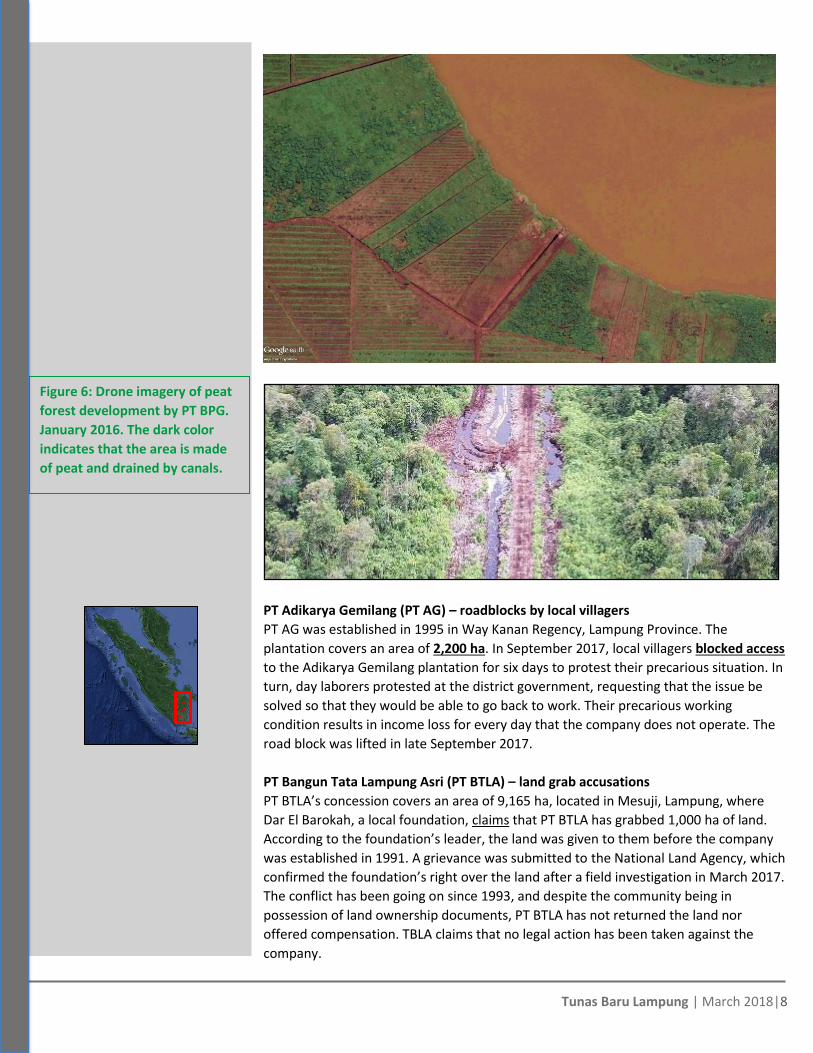
PT Bumi Perkasa Gemilang (BPG) – peat clearing
PT BPG secured a plantation permit (IUP) in February 2012 for an area of 22,270 ha in
Kubu Raya District, West Kalimantan. The PT BPG concession area was predominantly
forested peatland. Based on spatial analysis, PT BPG converted approximately 2,000
hectares of peat forest to oil palm estate between early 2014 and September 2017. As
shown by the dark lines in Figure 4 (below), high resolution Google Earth imagery
suggests that PT BPG drains peatland directly into the Kapuas River, without the legally
required dams in place. According to the company, this area does not fall under the
peatland moratorium, according to the revised Map for the Deferment of New License
Issuance (PIPPIB Map Revision XIII) of the Peat Restoration Agency.
Figure 4: Drone imagery of peat
forest development in PT SJP.
November 2017.
Figure 5: Google Earth imagery
of direct peat drainage by PT
BPG into Kapuas river,
December 2015.
Tunas Baru Lampung | March 2018|8
PT Adikarya Gemilang (PT AG) – roadblocks by local villagers
PT AG was established in 1995 in Way Kanan Regency, Lampung Province. The
plantation covers an area of 2,200 ha. In September 2017, local villagers blocked access
to the Adikarya Gemilang plantation for six days to protest their precarious situation. In
turn, day laborers protested at the district government, requesting that the issue be
solved so that they would be able to go back to work. Their precarious working
condition results in income loss for every day that the company does not operate. The
road block was lifted in late September 2017.
PT Bangun Tata Lampung Asri (PT BTLA) – land grab accusations
PT BTLA’s concession covers an area of 9,165 ha, located in Mesuji, Lampung, where
Dar El Barokah, a local foundation, claims that PT BTLA has grabbed 1,000 ha of land.
According to the foundation’s leader, the land was given to them before the company
was established in 1991. A grievance was submitted to the National Land Agency, which
confirmed the foundation’s right over the land after a field investigation in March 2017.
The conflict has been going on since 1993, and despite the community being in
possession of land ownership documents, PT BTLA has not returned the land nor
offered compensation. TBLA claims that no legal action has been taken against the
company.
Figure 6: Drone imagery of peat
forest development by PT BPG.
January 2016. The dark color
indicates that the area is made
of peat and drained by canals.

Tunas Baru Lampung | March 2018|9
PT Tunas Baru Lampung (Banyuasin) – transmigration community complaint
PT Tunas Baru Lampung (Banyuasin; PT TBL)’s total concession area amounts to 6,985
ha. In June 2017, the Transmigration Community Communication Forum (FKTM) argued
that PT TBL was in violation of Indonesia’s transmigration law. It filed for a hearing at
the Public Accountability Agency (BAP) of the Regional Representative Council (DPD),
requesting that PT TBL’s business permit be revised or revoked. The complaint centered
around land issues with transmigrant communities, who failed to receive plasma
plantations, contrary to agreements with the company. According to the company, this
has resulted in a mediation process that has since been concluded. TBL has submitted
an official letter to the DPD suggesting that the transmigration community take legal
action if there is transmigration land within the plantation.
Business Risks
Market access risks
As reported in its corporate filings, the two largest buyers of TBLA’s palm oil and sugar
are its affiliate PT Sungai Budi, and Inter-United Enterprises, a company based in
Singapore and owned by the British Virgin Island based Laguna United Ltd. From 2015 to
2017, net sales to PT Sungai Budi almost doubled from 23 percent to 41 percent of TBLA’s
revenues and its reliance on external clients decreased from 77 to 59 percent to 43
percent.

Tunas Baru Lampung | March 2018|10
TBLA customers Parent Company
More than 10 percent of TBLA’s total sales
PT Sungai Budi Sungai Budi
Inter United Enterprises Laguna United Ltd.
Less than 10 percent of TBLA’s total sales
PT Perkebunan Nusantara VII PTPN VII
Badan Pengelola Dana
Perkebunan Kelapa Sawit Perkebunan Kelapa
Sawit
PT Harapan Makmur PT Harapan Makmur
PT Sukses Mekar Sawit PT Sukses Mekar Sawit
PT Energi Bahari Lestari Bumitama Agri Ltd
CV Gunung Tambora CV Gunung Tambora
PT Inti Benua Perkasatama Musim Mas
PT Sriwijaya Alam Segar Wings Group
PT Wilmar Nabati Perkasa Wilmar
PT Rezeki Kencana Tianjin Julong
CV Makmur Sentosa
PT Ecogreen Oleo Chemical Ecogreen Oleochemicals
Perum Bulog Indonesian Bureau of Logistics
PT Sintang Raya Miwon
PT Ivomas Tunggal Sinar Mas
PT Aneka Kimia Raya AKR Corporindo Tbk
PT Pundi Lahan Khatulistiwa Pundi Lahan Khatulistiwa
Nestle Oil Singapore Pte. Ltd. Nestlé
Multi Commodity International Multi Commodity International Ltd
Peter Cremer Holdings Peter Cremer Holdings GmbH & Co
Zara General Trading Limitada Zara General Trading
Perissos Development and Investment Lda. Perissos Development and Investment LDA
Franco Asian Enterprises Singapore Ltd Franco Asian Enterprises Singapore Ltd
Aba Corp Ltd Aba Corp Ltd
As shown in Table 2 (above), the company mainly serves the Indonesian market but
also exports to African, Asia-Pacific and European destinations.
Table 2: TBLA customers.
Source: TBLA Q3/2017 financial
report.

Tunas Baru Lampung | March 2018|11
TBLA’s ongoing peatland and forest clearing at its PT SUJ, PT SJP and PT BPG
plantations constitute violations of the NDPE policies of at least 6 of its buyers. At
least five identified clients have NDPE policies. Several buyers have already engaged
with TBLA in response to Chain Reaction Research’s sustainability benchmark.
• Golden Agri-Resources engaged with TBLA in February 2017 and recommended
the company conduct a soil study for its PT SUJ concession, offer the results of
that study to Indonesia’s Peat Restoration Agency and temporarily halt further
development of the concession until the verification process was complete.
• Musim Mas engaged with TBLA in January 2017 and applied ‘controlled
purchase’ on the mills that supply Musim Mas. In August 2017, Musim Mas
reported that it no longer purchased from TBLA’s mills in South Sumatra nor
had a business relation with PT SUJ.
• Wilmar reports engagements with TBLA in October 2016, and January and May
2017.
In addition, TBLA’s customers include a number of other clients with NDPE policies,
including ADM, Nestlé and Bumitama. Given the repeat offenses of their NDPE policies,
TBLA’s access to these buyers is at significant risk.
Furthermore, the previously discussed media reports about social conflicts at PT SUJ, PT
AG and PT BTLA signify that TBLA might also be in violation of the ‘No Exploitation’
provisions of its buyers’ NDPE policies.
Regulatory risks
TBLA’s subsidiaries PT SUJ, PT TBL and possibly PT BTLA are exposed to legal
compliance risks and could face sanctions by regulatory agencies. Furthermore, TBLA’s
multiple peat clearings constitute a violation of Indonesia’s 2016 regulation on the
protection of peatland. This could materialize in fines, stop-work orders and the
revoking of business permits and concession licenses. It could also jeopardize TBLA’s
eligibility for tenders to supply subsidized biodiesel to Pertamina, Indonesia’s state-
owned oil company. This risk is present for 63,925 ha of TBLA’s landbank.
Operational risks
Finally, the six days strike reported at PT AG could signify underlying tensions that
might result in future strikes and blockades. Further obstruction of the company’s
operations might be expected.
Financial Analysis
TBLA’s market cap is USD 476 million (IDR 6.4 trillion), which positions it as a medium-sized company. It supplies less than 0.01 percent of the global CPO market. Tunas Baru Lampung faces four key financial issues: 1. How would Tunas Baru Lampung be affected if buyers/customers react to Tunas
Baru Lampung’s sustainability and deforestation violations? 2. Are the potentially-stranded assets substantial in size, and could this impact the
value of the company significantly?
Table 3: TBLA’s Average Annual
Sales by Market. Source: TBLA
Q3/2017 financial report.
Avg. Sales 2015 2016 2017 (Q3)
Domestic 73.2% 83.8% 84.9%
Export 26.8% 16.2% 15.1%
Total 100% 100% 100%

Tunas Baru Lampung | March 2018|12
3. Who is financing Tunas Baru Lampung’s debt and equity, and how will non-compliance related to deforestation impact this?
4. How much of the value of debt and equity could be affected by the impacts of deforestation incompliance or by the impact of ‘stranded land’, i.e. land owned by Tunas Baru Lampung that will not be taken into production?
Recent financial performance As shown in Table 4 (below), the company is experiencing growth. In 2016, total revenue was USD 484 million, up 25 percent vs 2015. Operating profit in 2016 was 87 percent up y-o-y (in USD), reaching USD 82 million. Average selling price increased 17 percent vs 2015. For 2017, (due to lack of published results), the consensus estimated revenue and operating profit are also expected considerably higher than in prior years, i.e. at USD 637 million and USD 110 million respectively. In Q317, the company’s revenue was 44 percent up vs the same quarter in 2016, while operating profit was up 65 percent. The consensus expected revenue growth for 2017 of 30 percent vs 2016. The projection is more modest for 2018, with expectations for 8 percent revenue growth. This may be considerably reduced if the company losses access to the NDPE market.
USD million 2013 2014 2015 2016 2017E 2018E CAGR
‘17-‘13
Revenue 304.7 511.9 386.8 483.6 637.1 685.9 20%
EBITDA 54.9 82.0 59.7 103.5 150.8 165.1 29%
Operating profit/EBIT
40.7 64.2 43.8 82.0 110.0 130.0 28%
Net Profit 6.9 35.0 14.3 45.7 71.3 80.72 79%
EPS (USD) 0.01 0.00 0.01 0.00 0.01 0.01 0%
Free Cash Flow - - -4.7 -119.1 -86.4 38.2 330%
35 percent of the company’s revenue is generated by its sugar segment, approximately the same by palm cooking oil, and the rest comes mainly from refined palm oil products (and some sugar). 41 percent of TBLA’s sales go to a related party (Sungai Budi). As of Q3 2017, another major buyer with 15 percent of sales is a Singaporean company, Inter-United Enterprises. On one hand, TBLA has grown increasingly reliant on those two parties. On the other hand, there is little revenue at risk, as it can be assumed that TBLA may find a selling route within the group of companies under Sungai Budi. The lack of transparency on internal pricing, however, is likely one of the drivers of the company’s share price underperformance.
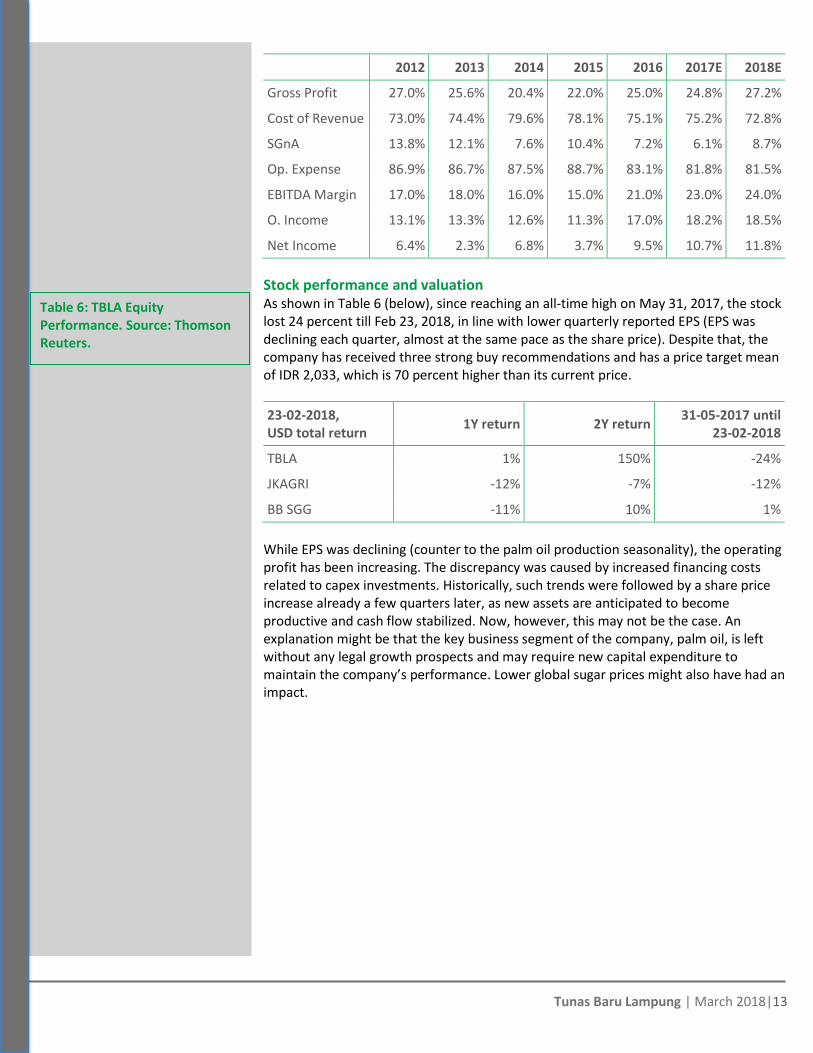
The margins are showing some efficiency gains, but likely to slow down As shown in Table 5 (below), TBLA’s gross profit margin, which went from 22 percent in 2015 to 25 percent in 2016, remained slightly above 25 percent in the first three quarters of 2017. Both gross and net margin will increase in 2017E, and according to the consensus estimates are likely to be maintained in 2018.
Table 4: Key TBLA Financial Figures. Source: Thomson Reuters, consensus estimates, Chain Reaction Research.
Table 5: Key TBLA Margins. Source: Thomson Reuters, consensus estimates, Chain Reaction Research.
Tunas Baru Lampung | March 2018|13
2012 2013 2014 2015 2016 2017E 2018E
Gross Profit 27.0% 25.6% 20.4% 22.0% 25.0% 24.8% 27.2%
Cost of Revenue 73.0% 74.4% 79.6% 78.1% 75.1% 75.2% 72.8%
SGnA 13.8% 12.1% 7.6% 10.4% 7.2% 6.1% 8.7%
Op. Expense 86.9% 86.7% 87.5% 88.7% 83.1% 81.8% 81.5%
EBITDA Margin 17.0% 18.0% 16.0% 15.0% 21.0% 23.0% 24.0%
O. Income 13.1% 13.3% 12.6% 11.3% 17.0% 18.2% 18.5%
Net Income 6.4% 2.3% 6.8% 3.7% 9.5% 10.7% 11.8%
Stock performance and valuation As shown in Table 6 (below), since reaching an all-time high on May 31, 2017, the stock lost 24 percent till Feb 23, 2018, in line with lower quarterly reported EPS (EPS was declining each quarter, almost at the same pace as the share price). Despite that, the company has received three strong buy recommendations and has a price target mean of IDR 2,033, which is 70 percent higher than its current price.
23-02-2018, USD total return
1Y return 2Y return 31-05-2017 until
23-02-2018
TBLA 1% 150% -24%
JKAGRI -12% -7% -12%
BB SGG -11% 10% 1%
While EPS was declining (counter to the palm oil production seasonality), the operating profit has been increasing. The discrepancy was caused by increased financing costs related to capex investments. Historically, such trends were followed by a share price increase already a few quarters later, as new assets are anticipated to become productive and cash flow stabilized. Now, however, this may not be the case. An explanation might be that the key business segment of the company, palm oil, is left without any legal growth prospects and may require new capital expenditure to maintain the company’s performance. Lower global sugar prices might also have had an impact.
Table 6: TBLA Equity Performance. Source: Thomson Reuters.

Tunas Baru Lampung | March 2018|14
Relative valuation using consensus estimates Share price, Feb 23 2018, USD 0.08
P/E (x)
EV/EBITDA (x)
EV/Revenue (x) (select
peers)
Equal weighted fair value
USD
TBLA as of 18.01.2018 5.7 6.6 1.5
Own hist avg since Dec 2012 12.3 7.1 1.3
Peer average forward 2018 ` 16.2 12.0 1.4
Fair value in USD
Fair value with own 5Y hist avg 0.19 0.14 0.08 0.14
Fair value with peer avg 0.25 0.30 0.09 0.21
Share price vs fair value in %
Fair value with own 5Y hist avg -138% -75% 0% -71%
Fair value with peer avg -213% -275% -13% -167%
Peer group is a mix of palm oil and sugar companies, total number 30; select peer group is 8
As shown in Table 7 (above), in USD terms, TBLA is currently trading at USD 0.08, while there is a consensus estimate upside of 70 percent. This is predominantly driven by the company’s low relative peer valuation. Its 2018 expected Price/Earnings ratio is 5.7x vs a peer average of 16x. The company is also trading below its own historical average P/E. The same trend is confirmed by the 2018 forward EV/EBITDA of 6.6x vs expected peers’ 7.1x. EV/Revenue is also lagging. The market is substantially discounting TBLA’s share price, for several possible reasons:
• The lack of transparency of internal pricing to its majority shareholder, i.e. is it selling its products at the optimum market price?
• It is majority owned by two individuals
• It has not generated positive free cash flow in 2015-2017E
• It is more leveraged (relatively more debt) than its peers (including sugar peers)
In relation to NDPE, the company may be facing further valuation impairments, which are described in separate scenarios below.
NDPE violations can suppress TBLA’s financial and share price performance
Given the company’s attitude to the near industry-norm NDPE, TBLA is probably exposed to significant risk of lost revenue from unrelated parties. There is also a high chance that TBLA has to regenerate 7,000 ha of peatland recently cleared in violation of NDPE and peat moratorium. The company’s remaining palm oil land of 14,600 ha is likely to become stranded. Its permit on 30,000 ha, more than half its productive land, may be frozen for a year due to regulatory violations. Each of these scenarios/impacts is reviewed in detail below.
Financial risk 1: NDPE driven revenue loss -10 percent, i.e. 24 percent of equity This is a high likelihood scenario, merited by the fact that several of its customers have committed to NDPE policies. The table on page 9 shows a list of some of TBLA’s direct identified customers, five of which adhere to higher sustainability standards than TBLA
Table 7: TBLA Relative Valuation. Source: Thomson Reuters.

Tunas Baru Lampung | March 2018|15
itself. No quantitative data was found as to how much each one is purchasing. However, based on the company’s reported accounts receivable, it can be reasonably assumed that on average each of the unrelated NSPE customers buys around 2 percent of TBLA’s revenue. Thus, based on the identified names, as much as 10 percent of the company’s revenue is at risk. It is possible, that the company loses more than that due to indirect customers have NDPE commitments. Alternatively, it could find replacement buyers without NDPE policies standards and thus supply the shrinking leakage market. As shown in Table 8 (below)he current consensus estimates for TBLA’s 2018 revenue is at USD 686 million. In the event that it does lose customers and its revenues drops 10 percent to USD 617 million, the company’s EBITDA and net earnings would also be impaired to USD 149 million and USD 72 million. EPS would also decline by 10 percent.
Basic P&L proforma estimates, USD million
Consensus scenario Risk 1: Revenue loss 10 percent
Revenue 686 617
EBITDA 165 149
Net Income 81 73
Nr shares 5,342 5,342
EPS 0.02 0.01
As shown in Table 9 (below) if the stock price continues to closely follow the EPS as in 2017, a 10 percent decline in profit could ultimately reduce its equity value by 8 to 10 percent. Assuming that the EBITDA loss of USD 16.5 million is a good proxy of free cash flows which will not be recovered in the mid-term, and using a WACC of 10.5 percent, leads to a DCF value of the lost revenue of USD 116 million. This is equal to 24 percent of TBLA’s equity value and to 12 percent of its enterprise value. Even if the stock fails to respond directly, then its relative upside potential will be reduced from 71 percent to 51 percent. Using EV/Revenue as a relative valuation multiple shows that the stock’s upside potential can be even completely destroyed in the event of a 10 percent revenue loss. Nevertheless, valuation in line with peers is highly unlikely as the company has never attained it before.
Relative valuation in USD using equal weighted fair value estimates of EV/EBITDA, P/E and EV/Revenue
Consensus scenario
Risk 1: Revenue loss 10 percent
Difference with
Consensus
Own historical fair value premium 71 % 51 % -28 %
In line with peers fair value premium 167 % 135% -19%
Net debt/EBITDA 2.5x 2.7x 11 %
Net debt/EBITDA peers 1.6x 1.6x 0 %
In either case, however, TBLA remains more leveraged compared to its peers. In the consensus estimates for 2018, its Net Debt / EBITDA is 2.5x, which is 27 percent higher
Table 8: Key financial figures; Scenario 1 proforma estimates. Source: Thomson Reuters, Chain Reaction Research.
Table 9: Relative valuation, Scenario 1. Source: Thomson Reuters, Chain Reaction Research.
Tunas Baru Lampung | March 2018|16
than the peer average. If the company loses 10 percent revenue, this multiple is likely to rise to 2.7x, continuing to suppress the share price.
Financial risk 2: 1Y permit freeze on 27 percent land, equals 2 percent of equity The regulatory risks which TBLA is facing concern two of its subsidiaries: PT SUJ and PT TBL. They jointly hold 30,000 ha land, of which 18,260 is developed. It is possible that the permits on these concessions could be temporarily suspended while the company resolves the conflicts pertaining to this land. If this freeze lasts for 1 year, the company would not be able to generate any profits from the developed part. Using the same assumptions as above (4.5 CPO tons per ha at USD 650/ton, cost rate at 80%) shows that this permit freeze could cost TBLA USD 11 million in free cash flows, which equals 2% of its equity value.
Financial risk 3: Peat land restoration expense equal to 4 percent of equity value There is already precedent of companies (Felda and Abdi Budi Mulia) restoring lands in order to keep their market access. Therefore, it is possible that the threat of NDPE-related revenue loss becomes an incentive for TBLA’s to restore the recently cleared 7,000 ha peat land. Using a conservative restoration cost of USD 2,500 per ha, this could cost it USD 17.5 million, or 11 percent off its expected 2018 EBITDA. This would also result in a Net Profit reduction by USD 8 million and it represents 4 percent of equity value.
Financial risk 4: Stranded land equal to 12 percent equity All the remaining undeveloped oil palm land of TBLA, or 14,600 ha equalling c.13% of the company’s total, would likely become stranded if the company complies with the Indonesian peat moratorium. As for agri-companies like TBLA land assets are substantial drivers of firm value, writing off this land would lower that value. Assuming that each hectare can produce 4.5 tons CPO per ha at USD 650/ton revenue and apply a cost rate including capex of 80%, then the estimated DCF value of this land is USD 60 million (with WACC assumption at 10.5 percent). This equals 12 percent of the company’s equity value and 6 percent of its enterprise value.
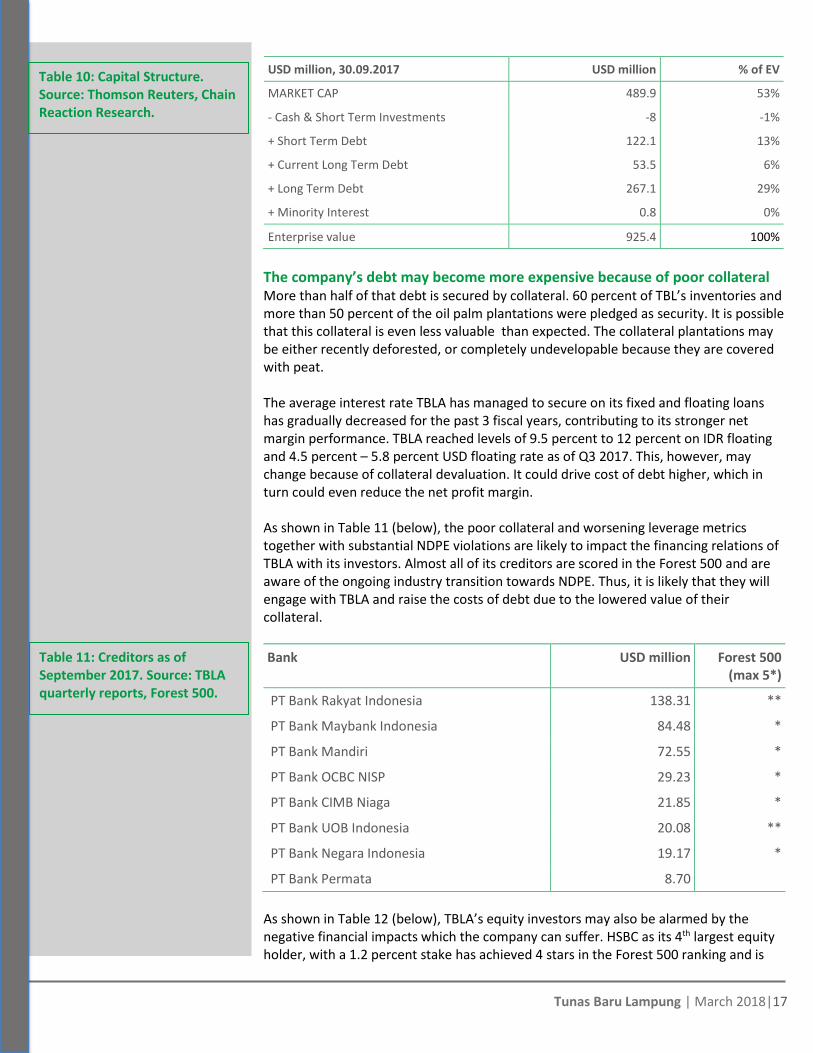
Capital structure
As shown in Table 10 (below), it is noticeable that the company is 53 percent equity funded, the rest being debt. In December 2017 and January 2018, TBLA issued new bonds to refinance bank loans to Maybank Indonesia, Bank CIMB Niaga, Bank OCBC NISP and Bank Rakyat Indonesia. The January-2018- issued bonds USD 200 million were rated BB- and Ba3 by Fitch and Moody’s, considerably lower than previous issuances. 98 percent of the issue was allocated to Asian investors, while only 2 percent were international. Including these latest bond issues, an estimated 50% of total debt is in bonds, the other half being bank credit lines.
Tunas Baru Lampung | March 2018|17
The company’s debt may become more expensive because of poor collateral More than half of that debt is secured by collateral. 60 percent of TBL’s inventories and more than 50 percent of the oil palm plantations were pledged as security. It is possible that this collateral is even less valuable than expected. The collateral plantations may be either recently deforested, or completely undevelopable because they are covered with peat. The average interest rate TBLA has managed to secure on its fixed and floating loans has gradually decreased for the past 3 fiscal years, contributing to its stronger net margin performance. TBLA reached levels of 9.5 percent to 12 percent on IDR floating and 4.5 percent – 5.8 percent USD floating rate as of Q3 2017. This, however, may change because of collateral devaluation. It could drive cost of debt higher, which in turn could even reduce the net profit margin. As shown in Table 11 (below), the poor collateral and worsening leverage metrics together with substantial NDPE violations are likely to impact the financing relations of TBLA with its investors. Almost all of its creditors are scored in the Forest 500 and are aware of the ongoing industry transition towards NDPE. Thus, it is likely that they will engage with TBLA and raise the costs of debt due to the lowered value of their collateral.
Bank USD million Forest 500 (max 5*)
PT Bank Rakyat Indonesia 138.31 **
PT Bank Maybank Indonesia 84.48 *
PT Bank Mandiri 72.55 *
PT Bank OCBC NISP 29.23 *
PT Bank CIMB Niaga 21.85 *
PT Bank UOB Indonesia 20.08 **
PT Bank Negara Indonesia 19.17 *
PT Bank Permata 8.70
As shown in Table 12 (below), TBLA’s equity investors may also be alarmed by the negative financial impacts which the company can suffer. HSBC as its 4th largest equity holder, with a 1.2 percent stake has achieved 4 stars in the Forest 500 ranking and is
USD million, 30.09.2017 USD million % of EV
MARKET CAP 489.9 53%
- Cash & Short Term Investments -8 -1%
+ Short Term Debt 122.1 13%
+ Current Long Term Debt 53.5 6%
+ Long Term Debt 267.1 29%
+ Minority Interest 0.8 0%
Enterprise value 925.4 100%
Table 10: Capital Structure. Source: Thomson Reuters, Chain Reaction Research.
Table 11: Creditors as of September 2017. Source: TBLA quarterly reports, Forest 500.

Tunas Baru Lampung | March 2018|18
thus highly likely to either engage with TBLA or divest. HSBC, together with a few other international investors may exert pressure on the stock regarding its NDPE violations.
Major Shareholders As of % holdings
Forest 500
PT Budi Delta Swakarya 30-09-2017 26.21 %
PT Sungai Budi 30-09-2017 25.04 %
Dimensional Fund Advisors, L.P. 30-11-2017 1.39 % 0
HSBC Global Asset Management (Hong Kong) Limited
30-11-2017 1.20 % ****
FIL Investment Management (Singapore) Ltd. 30-11-2017 0.96 %
Pheim Asset Management (Asia) Pte. Ltd. 30-09-2016 0.31 %
BlackRock Institutional Trust Company, N.A. 31-12-2017 0.21 % *
Daiwa Asset Management Co., Ltd. 31-08-2017 0.08 %
Astmax Asset Management, Inc. 30-11-2016 0.07 %
Widarto 30-09-2017 0.04 %
Winata (Santoso) 30-09-2017 0.04 %
S.E.A. Asset Management Singapore Pte. Ltd. 30-11-2017 0.04 %
Nuveen LLC 30-11-2017 0.04 %
BlackRock Advisors (UK) Limited 31-12-2017 0.03 % *
Pheim Asset Management Sdn. Bhd. 30-06-2017 0.03 %
As of 21st of February 2018, the bondholders of the latest bond issuances were unknown (likely because the quarterly holding reports are still upcoming).
Conclusion: Material equity value risk
The company may be facing a trade-off: lose 10 percent of revenue and risk having the permit frozen on the land generating another 8 percent, both totaling 26 percent of equity value; or to recognize stranded assets and restore land, jointly equal to 16 percent of equity value. The first scenario is very destructive to equity price, while the second could let TBLA regain access to the NDPE market and help avoid prolonged revenue loss.
Table 12: Most Recent Equity Holders. Source: Thomson Reuters, Forest 500.