Embed Size (px)
Citation preview

Tuberculosis in the UKData handling exerciseFor A level biology students
By Severa von Wentzel & Mary Doherty For Doctors Without Borders/
Medecins Sans Frontieres (MSF)

TB OVERVIEW
Photograph: Barts Hospital/Getty Images

Tuberculosis global emergency
• Around since the Neolithic time, TB is not a disease of the past – it is an important communicable public health problem.
• “HIV/AIDS, poverty, travel, and migration have seen tuberculosis re-emerge as a global pandemic.”(BMJ 2011;343;d4991)
• “The 2015 Millennium Development Goal (MDG) of halting and reversing TB incidence has been achieved globally, in all six WHO regions and in most of the 22 high TB burden countries (HBCs).” (http://www.who.int/tb/publications/global_report/en/)

TB infections• One-third of the world’s population is currently infected with the
tuberculosis (TB) bacillus. Not everyone infected with TB becomes ill (latent TB), but 10 per cent will develop active TB at some point in their lives.
• TB is spread through the air when infected people cough or sneeze, usually after close and lengthy contact with an infected person. The disease most often affects the lungs (pulmonary TB accounts for about 80% of TB cases globally)*.
• Symptoms include a persistent cough, fever, weight loss, chest pain and breathlessness in the lead-up to death.
• Every year, nine million people develop active TB and 1.5 million die from it of whom 360,000 were HIV positive. Greatest infectious disease challenge along with malaria and HIV/AIDS. Q1 What is the difference between latent TB infection and disease? Q2 Find out how the TB mortality rate is calculated?

TB incidence rate
The number of TB cases per 100,000 population, called the TB case rate / cumulative incidence or an incidenceRate. It is calculated by the following equation, thisformula provides an estimate of the risk for developing adisease: Number of new TB cases during a specified time period x 100,000
the population at risk

Q1 Examine this choropleth map*. Identify countries where there is a high number of estimated new TB cases and state what is the incidence in those regions.
TB incidence rate
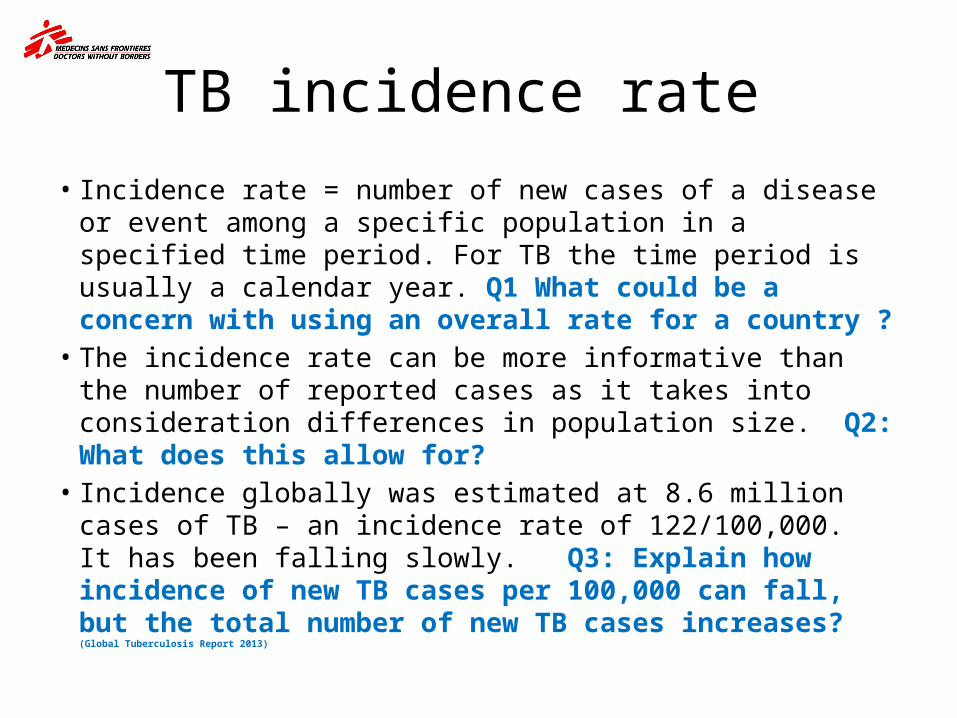
• Incidence rate = number of new cases of a disease or event among a specific population in a specified time period. For TB the time period is usually a calendar year. Q1 What could be a concern with using an overall rate for a country ?
• The incidence rate can be more informative than the number of reported cases as it takes into consideration differences in population size. Q2: What does this allow for?
• Incidence globally was estimated at 8.6 million cases of TB – an incidence rate of 122/100,000. It has been falling slowly. Q3: Explain how incidence of new TB cases per 100,000 can fall, but the total number of new TB cases increases? (Global
Tuberculosis Report 2013)

UK incidence rate
Year Notified cases
n
UK Population (in thousands)
Incidence rate per 100,000
2010 8,398 62,027
2011 8,923 63,285
2012 8,729 63,705
Q1 Calculate the incidence rate for years 2010 to 2012. Describe the trend in TB incidence rate over time.
Source: https://www.gov.uk/government/publications/tuberculosis-tb-in-the-uk

Risk of developing disease
Source: http://www.cdc.gov/tb/education/corecurr/pdf/chapter2.pdf
TB incidence is higher for people with diabetes and much higher and the leading cause of death among people with HIV.

Q1 Discuss this pictogram with a partner - why is high incidence of TB linked to HIV infection? Watch tackling TB in HIV patients: https://www.youtube.com/watch?v=wK3vS4Dg5VQ

Archaic diagnostic tests
• The most widely-used test for diagnosing active TB in developing countries relies on examining a patient’s phlegm under a microscope: sputum spear microscopy.
• This method, developed nearly 140 years ago (in the 1880s!), detects less than half of all active TB cases and in particular largely fails to detect the disease in children*, people co-infected with HIV and those with drug-resistant forms of TB.
• Traditional diagnostic tests can take over two months to get results. This opens a dangerous gap in which the patient is not being treated properly and his or her form of TB can spread.
Source: http://www.plosmedicine.org/article/info%3Adoi%2F10.1371%2Fjournal.pmed.1001760
Early TB treatment
• About 37 million lives were saved through TB diagnosis and treatment between 2000 and 2013 according to the WHO.
• Early and rapid diagnosis of all forms of TB (drug sensitive and drug resistant) is essential for best treatment outcomes.– If diagnosis is late and treatment delayed, the body
part(s) affected by TB can be damaged beyond repair.
– As long as a person is untreated, s/he is infectious to others.

Vaccines and new medicines
• The BCG (Bacillus Calmette-Guérin) vaccine doesn’t prevent TB in all cases*.
• Treating all forms of TB successfully represents the only way to halt the spread of more dangerous and more highly resistant strains.
• New anti-TB medicines with shorter and more effective treatment courses are needed to improve treatment adherence and treatment outcomes.

Treating active, drug-sensitive* TB disease is a long process especially compared to many infectious diseases that only require a course of antibiotics. Patients take four antimicrobial drugs for six to 30 months, a combination known as the “first-line treatment”.
Image: http://www.niaid.nih.gov/topics/tuberculosis/Understanding/WhatIsTB/VisualTour/pages/firstline.aspx

Drug resistant TB (DR-TB)
• TB is a curable disease, but an inadequate global response has allowed the growing epidemic of drug-resistant tuberculosis with cases reported in most countries worldwide.
• Drug resistance originally developed because of improper use of anti-TB medicines: getting the wrong medicines or doses or failing to complete treatment are common. This increases drug resistant forms of TB.
• The deadlier drug resistant strains are spreading from person to person, including to people who never had TB before.
• DR-TB is more difficult and expensive to diagnose and treat.

Drug-resistant tuberculosis
Source: http://www.cdc.gov/tb/education/corecurr/pdf/chapter2.pdf

MDR-TB = resistance to isoniazid plus rifampin. XDR-TB = resistance to at least rifampin and isoniazid + resistance to the fluoroquinolones and 1 or more of the injectable drugs capreomycin, kanamycin and amikacin. Source: http://www.nature.com/nm/journal/v13/n3/images/nm0307-295-F1.gif

Treatment for drug-resistant TB involves swallowing 20 pills a day and receiving a painful daily injection that makes it difficult to sit or even lie down.
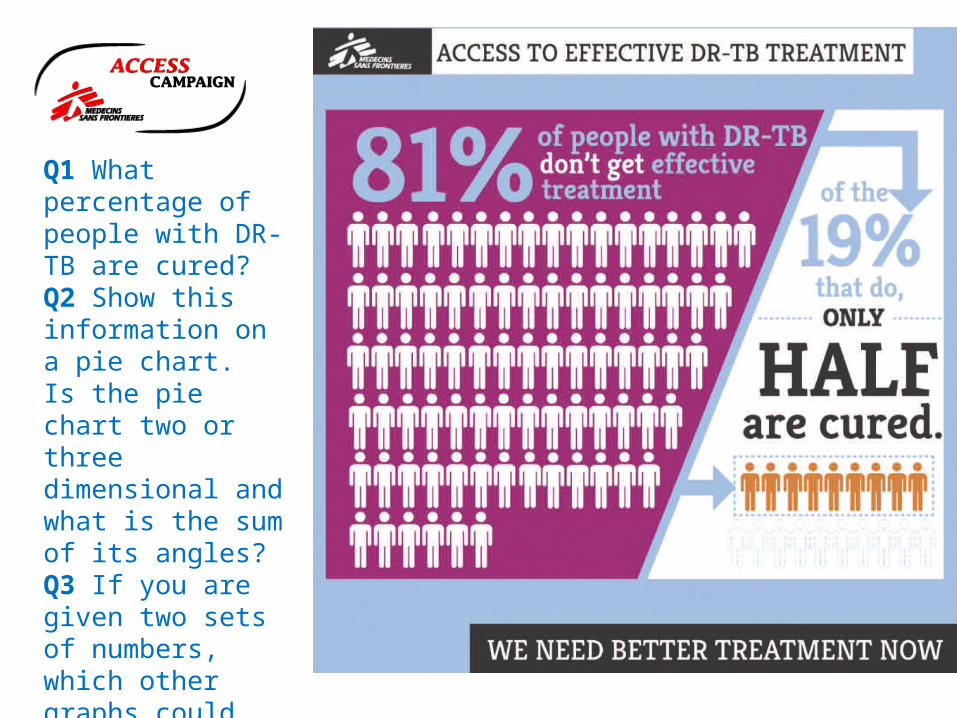
Q1 What percentage of people with DR-TB are cured?Q2 Show this information on a pie chart. Is the pie chart two or three dimensional and what is the sum of its angles?Q3 If you are given two sets of numbers, which other graphs could you use?
MDR-TB
• The most widely reported strain of DR-TB is multi-drug-resistant TB (MDR-TB), which is resistant to at least two of the most powerful, first-line (or standard) anti-TB drugs isoniazid and rifampicin. Inappropriate treatment is its primary cause.
• Treatment of people with multi-drug resistant tuberculosis (MDR-TB) has become an international public health priority following the work by several organisations, including MSF.
• For an Interactive MDR-TB map on diagnosis and notification globally between 2005-2012 see: https://extranet.who.int/sree/Reports?op=vs&path=/WHO_HQ_Reports/G2/PROD/EXT/MDRTB_Indicators_map

© Aurelie Baumel
MDR-TB represents a public health crisis. About 3.5% of new and 20.5% of previously treated TB cases (an estimated 480,000 cases) have had MDR-TB in 2013. (WHO). National estimates of MDR-TB have been included in WHO reports since 2008.

Research & Development (R & D)• The research and development of new, more effective
diagnostic tools and drugs for TB has been severely lacking for decades.
• Efforts to develop an affordable rapid test that provides results on the spot need to be ramped up. Diagnostic methods other than sputum smear microscopy exist but these require laboratories, a steady power supply and skilled staff to deliver results which are mainly unavailable in remote and rural settings.
• Sufficient funding, treatment gaps and getting the technology and know-how to the countries where they are needed most remains a problem.(WHO Global TB Report 2014)
© Andre Francois

Xpert MTB/RIF• A promising new diagnostic
test, Xpert MTB/RIF was introduced in 2010 and recommended by WHO since late 2010.
• The test is not applicable to all settings, nor effective for diagnosing children* or patients with TB that occurs outside of the lungs (extra-pulmonary TB).
• Q1 Make a note of the challenges outlined in the film: https://www.youtube.com/watch?v=cnsH64yW7eE
— An MSF staff member performs the Xpert MTB/RIF test in Kibera South Health Centre.
TB DATA HANDLING ACTIVITYUK AND LONDON
Overview

Treatment for TB in the UK
• TB is a serious public health concern in the UK.• Treatment for TB is free of charge for everyone in the
UK, but access to / reach of health services can be poor for ‘hard to reach’ groups including those most at risk such as asylum seekers. (http://www.bmj.com/content/343/bmj.d4281?tab=responses)
• Treatment completion has improved in the last decade. However, none of the “UK region[s] exceeds the WHO 85% treatment completion levels for active tuberculosis. This cannot continue.” (http://www.bmj.com/content/343/bmj.d4281?tab=responses)

TB in the UK• Around 150 years ago, caused about 1 in 8 deaths, but by 1980s
uncommon(NHS). There were 7,892 cases in 2013 - a rate of 12.3 cases per 100,000 in the UK in 2013 - but death from TB is rare.
– 38% of cases were in London - a rate of 36 per 100,000 population - the highest TB rate in the UK and Western Europe, where rates are stable or declining.
– 73% of cases are likely the result of latent TB infection among persons who were born in high burden countries outside the UK.
– 70% of cases live in the 40% most deprived areas. – 10% of cases had at least one social risk factor (history of alcohol
or drug misuse, homelessness or imprisonment.)Source: http://www.tbalert.org/about-tb/statistics-a-targets/uk-stats-and-targets/; WHO 2012 report http://appg-tb.org.uk/images/reports/Report%20on%20TB%2011.04.2013%20-MTA.pdf; https://www.gov.uk/government/uploads/system/uploads/attachment_data/file/360335/TB_Annual_report__4_0_300914.pdf

TB is a disease of poverty – not of migration*
• Around 85% of TB cases in the UK are reported among people born overseas – however, not among recent arrivals. The majority with TB have been in the UK for at least two years, meaning that for those cases port of entry screening is ineffective.
• This suggests that the increase is …a combination of TB disease developing in individuals who may have been infected for some time and new infections acquired in the UK, or as a result of travel to other countries where TB is common." - Dr John Watson, head of the HPA's Respiratory Diseases Department

Q1: Calculate the percentages of cases by country of birth. What are the most common countries of origin of non-UK-born cases?Source:https://www.gov.uk/government/uploads/system/uploads/attachment_data/file/360335/TB_Annual_report__4_0_300914.pdf

Q1 Which age group has the highest rates among non-UK born and UK-born population and what are the rates? Source:https://www.gov.uk/government/uploads/system/uploads/attachment_data/file/360335/TB_Annual_report__4_0_300914.pdf

TB case notification England and Wales
Source: http://apps.who.int/iris/bitstream/10665/129942/1/9789241548786_eng.pdf?ua=1&ua=1
Case notification rates were already declining long before any effective TB intervention became available. Q1 What kind of graph is it? Q2: What has been the trend since the 1920s to 1985? Q3 What factors might have contributed to the increase in TB cases from the mid 1980s to 1992?
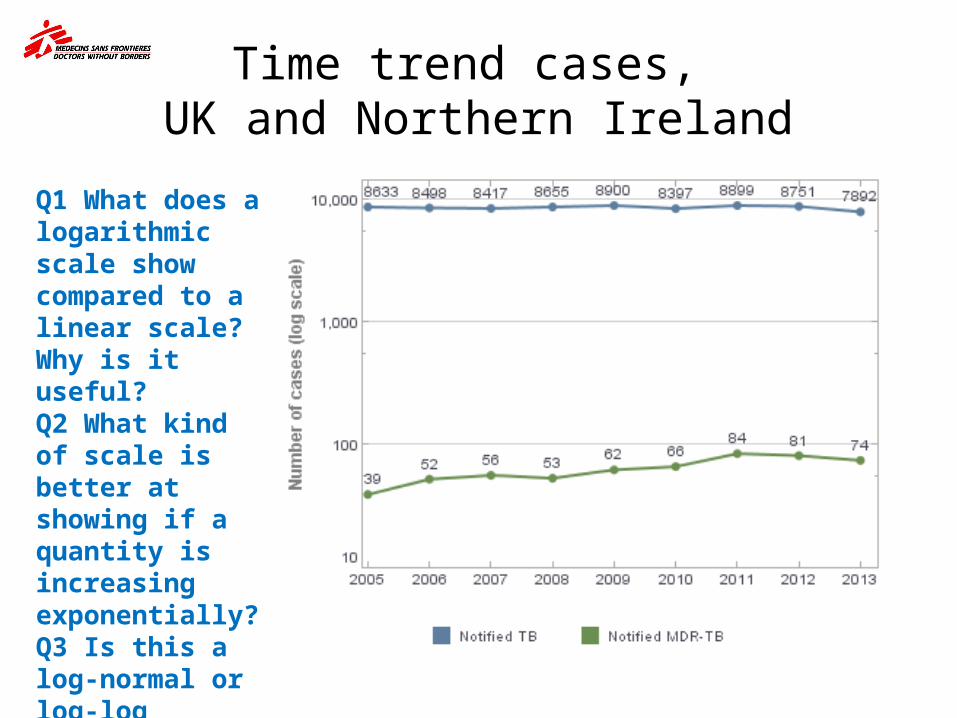
Time trend cases, UK and Northern Ireland
Q1 What does a logarithmic scale show compared to a linear scale? Why is it useful?Q2 What kind of scale is better at showing if a quantity is increasing exponentially?Q3 Is this a log-normal or log-log graphical representation?

Tuberculosis case reports and rates, UK, 2004-2013
Source: http://www.tbalert.org/wp-content/uploads/2012/12/TB-in-the-UK-2014.pdf
Q1: Describe the pattern of number of case reportsQ2 and describe the pattern of rates graphs- use data to support your answers to these two questions. Q2: If annually in the UK rates remain similar, what does this suggest? Q3: What is the percentage increase in number of cases from 2004 to 2012? Q4 Why are the rate and the number of cases coming closer together? Does this show population increase?

33Tuberculosis in the UK: 2014 report
Number & proportion of TB cases with drug resistance by age group, UK, 2013
Source: Enhance Tuberculosis Surveillance (ETS), Enhanced Surveillance of Mycobacterial Infections (ESMI)Data as at: May 2014. Prepared by: TB Section, Centre for Infectious Disease Surveillance and Control, Public Health England
Age Group
Isoniazid resistant
Multi-drug resistant
Total
n % n % n
0-14 1 1.6 0 0.0 62
15-44 238 8.1 61 2.1 2,931
45-65 66 6.9 11 1.1 964
65+ 24 3.7 2 0.3 649
Q1 Calculate the figures for each of the empty boxes in the table. How many people in the 0-14 cohort have DR TB? Q2 Add the total number of cases, proportion by age group and indicate which group has the highest proportion. Q3 Does this mean they are at the highest risk of developing TB disease? Why do you think this age group has the highest number of TB case?

Proportion of cases with Isoniazid resistance or MDR-TB, UK, 2004-2014
Q1: Has the proportion of isoniazid cases increased, decreased or remained stable since 2011? Use the percentages shown on the graph to justify your answer.
Q2: What has happened to MDR cases?
Q3: Can the proportion tell you about numbers and rates in the country?
Q4: What kind of graph is it?
Source: http://www.tbalert.org/wp-content/uploads/2012/12/TB-in-the-UK-2014.pdf

UK surveillance system• The UK is an example of a high-income country with a high
performing surveillance and health system that captures all or almost all incident cases – so routine case notifications provide accurate estimates of incidence.
• The system for reporting cases in the UK is very reliable compared to those in some medium- and low-income countries, this means that the real incidence in countries such as India is probably higher.
• Public Health England (PHE) manages a web-based TB surveillance system that is set up to maximise data quality.
• Q1 Discuss with a partner and suggest what should be included in a complete analysis of surveillance data.
• Further info on surveillance in the UK: http://www.who.int/tb/advisory_bodies/impact_measurement_taskforce/meetings/tf_17march10_bg_5_quality_surveillance_uk.pdf

Area or region level TB case notification
• To compare how TB burden differs within a country, it is helpful to examine case notification at each sub-national level (e.g., provincial or district level); dividing total case notification by area by population of the respective area.
• Depiction with maps using colours for different case notification levels by area can show area or regional variation clearly.
• Q1: Lower TB case notification in a region may indicate true differences in TB burden in the area. Suggest what else they might indicate.

Three-year average tuberculosis case rates by local area, UK, 2011-2013
Source: Enhanced Tuberculosis Surveillance (ETS), Enhanced Surveillance of Mycobacterial Infections (ESMI), Office for National Statistics (ONS)Data as at July 2013Prepared by: TB Section, Centre for Infectious Disease Surveillance and Control, Public Health England ; http://www.tbalert.org/wp-content/uploads/2012/12/TB-in-the-UK-2014.pdf
Q1: Look at the map of the UK and describe the map and the variation in rates.
Q2: Suggest reasons why the TB rate could be higher in some cities?
Q3: If there are 7,892 cases in the UK and 2,985 in London, what is the proportion of London cases to UK cases?
Images © Crown copyright and database rights 2014 Ordnance Survey 100016969
London – TB capital of Western Europe
London has very high rates of TB. Watch Youtube video: https://www.youtube.com/watch?v=0cNcycUxnkY• There is increased detection through higher staff to patient ratios and ‐ ‐
heightened awareness of tuberculosis in both the public and healthcare staff• The majority of cases are due to reactivation of latent TB. • Relatively high number of immunocompromised people who are at increased
risk of latent TB progressing to active TB (e.g., HIV+ people, chronic kidney disease and diabetes)
• The emergence of drug resistant tuberculosis‐• Changing patterns of immigration are a driver• Increased opportunities for international travel with exposure to tuberculosis
in high-burden countries• High incidence and prevalence rates among the homeless and in prison
populations – groups that can be hard or difficult to reach.Source: http://www.ncbi.nlm.nih.gov/pmc/articles/PMC2111261/; https://view.officeapps.live.com/op/view.aspx?src=http%3A%2F%2Fwww.londonhp.nhs.uk%2Fwp-content%2Fuploads%2F2012%2F02%2FTB-Case-for-change-FINAL1.doc

Q1 Describe the trends shown by the graph and comment on most recent changes
TB case reports and rates, London, 1999 – 2013
Source: https://www.gov.uk/government/uploads/system/uploads/attachment_data/file/368999/2014_10_30_TB_London_2013_data.pdf

Proportion of TB cases with first line drug resistance, London, 1999 – 2013
Source: https://www.gov.uk/government/uploads/system/uploads/attachment_data/file/368999/2014_10_30_TB_London_2013_data.pdf

Source: https://www.gov.uk/government/uploads/system/uploads/attachment_data/file/368999/2014_10_30_TB_London_2013_data.pdfhttps://www.gov.uk/government/uploads/system/uploads/attachment_data/file/368999/2014_10_30_TB_London_2013_data.pdf
TB case rate by local authority of residence, London, 2013
Q1 What should a map include?Q2 What can you learn about Newham and Brent from the map. Can you account for the incidence of TB case rates in these two areas.Q3: What may be masked by using overall rates by local authority?

Index of deprivationThe Index of Deprivation is a relative measure of deprivation at smallarea level across England. Areas are ranked from least deprived tomost deprived.
Seven different dimensions of deprivation and an overall compositemeasure of multiple deprivation:1. Income deprivation 2. Employment deprivation3. Health deprivation and disability 4. Education deprivation 5. Crime deprivation 6. Barriers to housing and services deprivation7. Living environment deprivationSource: http://data.gov.uk/dataset/index-of-multiple-deprivation

Q1: Suggest reasons why deprivation may increase the risk of transmission?
Source: http://www.londonspovertyprofile.org.uk/key-facts/overview-of-london-boroughs/
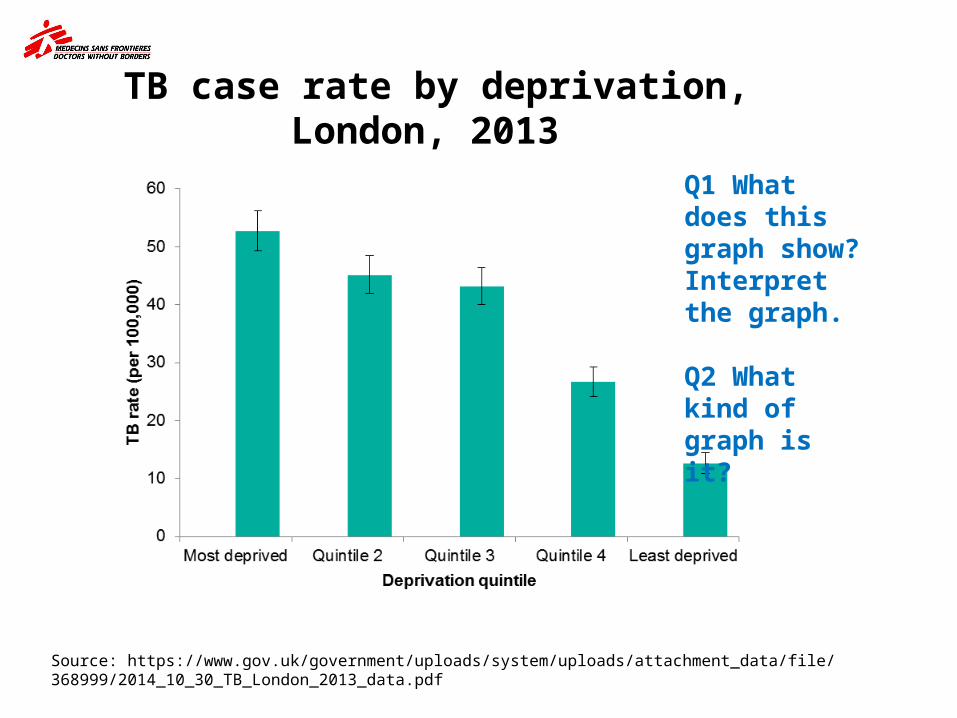
TB case rate by deprivation, London, 2013
Source: https://www.gov.uk/government/uploads/system/uploads/attachment_data/file/368999/2014_10_30_TB_London_2013_data.pdf
Q1 What does this graph show? Interpret the graph.
Q2 What kind of graph is it?

2000 2001 2002 2003 2004 2005 2006 2007 2008 20090
10
20
30
40
50
60
ParisRotterdamLondon
Source: HPA
Comparison of TB rate per 100,000 – 2000-2009

Examples of successful TB control among groups with social risk factors
“Despite similar epidemiological contexts, the UK has the highest rates in Western Europe, with exception to Portugal and Spain, which traditionally have had significantly higher rates but the incidence of which is declining.” (http://www.ncbi.nlm.nih.gov/pmc/articles/PMC4001504/)
Rotterdam and Paris have declining TB rates thanks to the use of a mobile X-ray unit and social support teams that• improved the detection of active and latent TB • increased the number of contacts traced• Improved child vaccination
New York - in a similar position to London in the early 1990s – turned around its TB rate by investing in services, a multi-faceted strategy and a coordinated, multi-agency effort.(NHS)

UK TB control• TB control has to focus on
early detection and on the appropriate screening of the vulnerable populations in those at-risk communities.
• Targeting high-risk groups actively rather than waiting for symptoms will behove treatment outcomes and will help prevent further transmission.
• Watch the film: https://www.youtube.com/watch?v=uV97hsWYEGY
London’s Find & Treat mobile X-ray unit
https://www.uclh.nhs.uk/OurServices/ServiceA-Z/HTD/PublishingImages/tbvan_main.jpg

MSF and TBAbout Médecins Sans Frontières (MSF)MSF is an independent international medical humanitarian organisation that delivers medical care to people affected by armed conflicts, epidemics,natural disasters and exclusion from healthcare. Founded in 1971, MSF hasoperations in nearly 70 countries today.
MSF has been involved in tuberculosis (TB) care for 30 years, often workingalongside National health authorities to treat patients in a wide variety ofsettings, including chronic conflict zones, urban slums, prisons, refugee campsand rural areas.
MSF’s first programmes to treat multidrug-resistant TB opened in 1999, and the organisation is now one of the largest NGO treatment providers for drugresistant TB. In 2013, the organisation treated 32,000 patients with TB in 24countries, including 1,950 patients with drug-resistant TB.

Acknowledgments
Very special thanks to our Biology working group for kindly donating their time and giving us excellent input and guidance: • Yasmin Ghayur, Archbishop Tenison Church of England High
School, Croydon; • Neil Hart, St. Saviour’s and St Olave’s School, Southwark; • Alexis Lacheze-Beer, Dulwich College, Dulwich; • Mei Lapuz, Camden School for Girls, Camden; • Shalika Lewis, Lilian Baylis, Lambeth; • Cecile Roquain and Subarna Paul, St Charles Catholic Sixth
Form College, Kensington; • Alison Waldron, Coloma Convent Girls’ School, Croydon.
Thanks also to student Maya Patel.
http://msf.org.uk/schools-resources