Embed Size (px)
Citation preview
Tuberculosis in England 2016 report (presenting data to end of 2015)
Tuberculosis in England: 2016 report (presenting data to end of 2015)
2
About Public Health England
Public Health England exists to protect and improve the nation's health and wellbeing,
and reduce health inequalities. It does this through world-class science, knowledge and
intelligence, advocacy, partnerships and the delivery of specialist public health services.
PHE is an operationally autonomous executive agency of the Department of Health.
Public Health England
Wellington House
133-155 Waterloo Road
London SE1 8UG
Tel: 020 7654 8000
www.gov.uk/phe
Twitter: @PHE_uk
Facebook: www.facebook.com/PublicHealthEngland
Prepared by: Tuberculosis Section, Centre for Infectious Disease Surveillance and
Control, National Infection Service, PHE
For queries relating to this document, please contact: [email protected]
© Crown copyright 2016
You may re-use this information (excluding logos) free of charge in any format or
medium, under the terms of the Open Government Licence v3.0. To view this licence,
visit OGL or email [email protected]. Where we have identified any third
party copyright information you will need to obtain permission from the copyright
holders concerned. Any enquiries regarding this publication should be sent to
Published September 2016
PHE publications gateway number: 2016324

Tuberculosis in England: 2016 report (presenting data to end of 2015)
3
Contents
Acknowledgements 4
Notes on the report 5
Background 7
Key points 8
1. TB notifications and incidence 10
2. Laboratory confirmation of TB 25
3. TB transmission 28
4. Delay from symptom onset to treatment start 31
5. TB outcomes in the drug sensitive cohort 34
6. Drug resistant TB (including TB outcomes in the drug resistant cohort) 40
7. TB in under-served populations 49
8. TB-HIV co-infection and HIV testing among TB cases 58
9. BCG vaccination 62
10. Latent TB infection testing and treatment 65
11. United Kingdom tuberculosis pre-entry screening programme 73
12. Conclusion 76
13. Recommendations 78
References 82
Appendix I. Supplementary tables 84
Appendix II. Supplementary tables of local level data 138
Appendix III. Methods 153
Appendix IV. Surveillance data quality 161
Appendix V. National level data for TB strategy monitoring indicators, England,
2000-2015 167
Glossary 172
Tuberculosis in England: 2016 report (presenting data to end of 2015)
4
Acknowledgements
This report was prepared by the Tuberculosis Section, Centre for Infectious Disease
Surveillance and Control, National Infection Service, PHE. The report was made
possible through collaboration with the Field Epidemiology Services, PHE, and
Microbiology Services, PHE. We gratefully acknowledge all those who contributed
information on TB cases in England, including physicians, nurses, microbiologists,
scientists and administrative staff. Special thanks are extended to those who co-
ordinate and oversee TB surveillance at subnational level for their essential
collaboration in the ongoing improvements to TB surveillance.
Authors
Jennifer A Davidson, Maeve K Lalor, Tehreem Mohiyuddin, Miranda G Loutet, Tanjila
Uddin, Srividhya Venugopalan, Morris C Muzyamba, Ayaan Gedi, Hannah Hafezi,
Dominik Zenner, Lynn Altass, Sarah R Anderson and H Lucy Thomas and for Chapter
9 BCG vaccination, Michael Edelstein, Joanne White and Kazim Beebeejaun.
Additional contributors (in alphabetical order)
Victoria Adebisi, Charlotte Anderson, Helen Bagnall, Anne Barrett, Zharain Bawa,
Alison Brown, Tim Brown, Jacqueline Carless, Paul Cosford, Angela Cox, Stefanie
Davies, William Hanson, Lamya Kanfoudi, Peter Kirwan, Jonathan Lloyd, Helen
Maguire, Veronica Maskell, Janet Mowbray, Sophie Newitt, Simon Packer, Nick Phin,
Ivan Probert, Priti Rathod, Anjana Roy, Grace Smith, Abigail Sunderland, Nikhil
Sherine Thampi, Surinder Tamne, Chanice Taylor, Simon Warwick, Joanne Winter,
David Wyllie.
Suggested citation
Public Health England. (2016) Tuberculosis in England: 2016. Public Health England,
London.

Tuberculosis in England: 2016 report (presenting data to end of 2015)
5
Notes on the report
Intended audience
This report is aimed at healthcare professionals involved in the diagnosis and/or
treatment of TB patients, commissioners involved in planning and financing TB services,
public health professionals working in the control of TB or health of at-risk populations,
researchers with an interest in TB, and government and non-governmental
organisations working in the field of TB.
Aim of report
This report describes the recent epidemiology of TB in England, providing an update on
trends and burden of TB at a national and sub-national level. It also presents data on
the implementation of the UK pre-entry TB screening programme, the national roll-out of
systematic latent TB infection (LTBI) testing, and BCG vaccination coverage estimates.
The data presented is used to inform recommendations on the ongoing implementation
of the Collaborative TB Strategy for England 2015-2020.
Data sources
This report presents detailed data on TB case notifications made to the Enhanced
Tuberculosis Surveillance system (ETS) in England to the end of 2015. Data from
notifications made to ETS from 2000 is updated annually to take into account
denotifications, late notifications and other updates. The data presented in the current
year’s report supersedes data in previous reports.
Additionally, data is presented from the pre-entry screening database (UK) to the end
of 2015 and the LTBI screening database (England) from between April 2015 and May
2016.
Experimental BCG coverage data for areas with universal BCG vaccination is
presented using the Cover of Vaccination Evaluated Rapidly (COVER) programme
data from April 2015 to March 2016.
Other data displays
High-level data on TB notifications in the UK to the end of 2015, and breakdowns by
country, can be found in the Official Statistics for TB, Reports of cases of tuberculosis
to enhanced tuberculosis surveillance systems: UK, 2000 to 2015. This is available at
Tuberculosis in England: 2016 report (presenting data to end of 2015)
6
https://www.gov.uk/government/collections/tuberculosis-and-other-mycobacterial-
diseases-diagnosis-screening-management-and-data.
As part of the Collaborative TB Strategy for England 2015-2020, a suite of TB Strategy
Monitoring Indicators has been developed
(https://www.gov.uk/government/uploads/system/uploads/attachment_data/file/403231/
Collaborative_TB_Strategy_for_England_2015_2020_.pdf). Where data for these
indicators is presented in this report, the indicator name is shown (in red boxes), and a
summary table of national-level indicators is presented in Appendix V. Data for
indicators that are presented by upper tier local authority and clinical commissioning
group can be found at http://fingertips.phe.org.uk/profile/tb-monitoring and will be
updated with data for 2015 on 4 October 2016. Hyperlinks (in red boxes) for specific
indicators are also shown throughout the report where data is presented.
Tuberculosis in England: 2016 report (presenting data to end of 2015)
7
Background
In January 2015, Public Health England and NHS England jointly launched the
Collaborative Tuberculosis Strategy for England 2015-2020 [1]. The strategy aims to
achieve a year-on-year decrease in TB incidence, a reduction in health inequalities, and
ultimately the elimination of TB as a public health problem in England.
To achieve these aims and deliver significant improvements in TB control the strategy
sets out 10 key areas for action:
1. Improve access and earlier diagnosis
2. Provide universal high-quality diagnostics
3. Improve treatment and care services
4. Ensure comprehensive contact tracing
5. Improve BCG vaccination uptake
6. Reduce drug resistant TB
7. Tackle TB in under-served populations
8. Implement new entrant latent TB (LTBI) screening
9. Strengthen surveillance and monitoring
10. Ensure an appropriate workforce to deliver TB control
Since the launch of the strategy, significant steps have been taken to deliver on the 10
areas for action, these steps have led to:
the creation of a national TB programme, with a national TB office and seven
multi-agency TB control boards (TBCBs)
the development of a national TB service specification
the provision of a new online resource of comprehensive TB data using the PHE
Fingertips tool to support TB commissioning and monitoring
the roll-out of 54 CCG new migrant LTBI programmes funded by NHS England
(£10m in 2015/16 and £10m in 2016/17)
the updating of TB awareness-raising material in collaboration with TB Alert and
the launch of a toolkit to support LTBI programme delivery
a review of the TB nursing workforce with work underway to take forward its
recommendations and help support a more professionalised workforce
the establishment of five ‘task and finish’ groups to take forward work on the
areas for action: high-quality diagnostics, LTBI testing and treatment, drug
resistant TB, TB in under-served populations and ensure an appropriate
workforce
This year’s annual TB report describes the epidemiology of TB in England since the
launch of the strategy, and provides data on the implementation of the UK pre-entry TB
screening programme, the national roll-out of systematic LTBI testing and BCG
vaccination coverage estimates. On the basis of data presented in this report,
recommendations are made on the further work required to deliver the aims of the
strategy and, ultimately, lead to improved TB control in England.

Tuberculosis in England: 2016 report (presenting data to end of 2015)
8
Key points
there has been a year-on-year decline in the incidence of TB in England over the
past four years, down to 10.5 per 100,000 (5,758 cases) in 2015, a reduction of
one-third since the peak of 15.6 per 100,000 (8,280 cases) in 2011
the reduction in the number of TB cases in England in the past year has occurred
in both the non-UK born population and the UK born population, and in all
regions of the country
the decline in the number of cases in the non UK-born population has occurred
particularly among new migrants, and 60% of non-UK born TB cases now occur
among those who have lived in the UK for more than six years
the rate of TB in the non-UK born population is still 15 times higher than in the
UK born population, and 73% of all TB cases notified in 2015 (4,087) were born
abroad
it is now also possible to see a consistent downward trend in the number of TB
cases in the UK born population, down from 2,005 in 2012 to 1,550 in 2015
there is evidence of a reduction in TB transmission in England in recent years,
with reducing rates of TB in UK born children, and a reduction in the proportion of
TB cases in a strain-typing cluster
the number and proportion of TB cases with multi-drug resistance/rifampicin
resistance (MDR/RR-TB) has decreased since 2011, with 54 cases (1.6%) with
initial MDR/RR-TB in 2015. Ten of these cases had XDR-TB
there has been a continued reduction in the number and proportion of TB cases
co-infected with HIV, down from the peak of 566 cases (7.8%) in 2005 to 197
cases (3.2%) in 2014. The majority of TB-HIV co-infected cases were born in
countries with high rates of both TB and HIV
in 2015, there has been a small reduction in the proportion of non-UK born cases
who experienced a delay of more than four months from date of reported
symptom onset to treatment start. However, long delays are still reported, with
over a quarter of pulmonary cases having a delay of more than four months in
2015
following more than ten consecutive years of improving outcomes for TB cases,
in the past year there has been a slight reduction in the proportion of drug
sensitive TB cases who had completed treatment by 12 months, from 85.4% to
84.5%

Tuberculosis in England: 2016 report (presenting data to end of 2015)
9
despite the reduction in overall TB cases, the number of cases with social risk
factors (homelessness, drug or alcohol misuse or imprisonment) has not
declined. The proportion of cases with at least one of these risk factors increased
from 9.8% in 2014 to 11.8% in 2015
TB cases with social risk factors are more likely to have pulmonary disease and
drug resistance, and have worse TB outcomes; cases notified in 2014 with at
least one social risk factor were more than twice as likely to have died or be lost
to follow-up at 12 months compared with cases with no social risk factors
the recent decline in the incidence of TB in England is likely to reflect a
combination of:
o the impact of the UK TB pre-entry screening programme, which identified
382 cases of active pulmonary TB in 2015
o a reduction in the number of new migrants from high TB burden countries
o improvements in TB control leading to a reduction in TB transmission
o the early impact of testing and treating patients with latent TB infection
(LTBI)
to continue to achieve year-on-year reductions in TB incidence, and the eventual
elimination of TB as a public health problem in England, sustained work is
required to deliver all 10 key areas for action in the Collaborative TB Strategy for
England 2015-2020. Recommendations to achieve this are outlined at the end of
this report. Specifically, it will be important to focus on:
o reducing TB among migrants through LTBI testing and treatment
o reducing diagnostic delay through awareness raising and improving
accessibility of services
o maintaining the quality of TB treatment and care services to ensure
continued high treatment completion
o addressing the social factors associated with TB, including the specific
needs of under-served populations
Tuberculosis in England: 2016 report (presenting data to end of 2015)
10
1. TB notifications and incidence
Key messages
a total of 5,758 TB cases were notified in England in 2015, a rate of 10.5 per
100,000 population, a further reduction since the peak of 8,280 cases in 2011
(15.6 per 100,000)
the number of cases and rate of TB in the non-UK born population in England
have declined year-on-year since 2011, with a decrease of more than 10% each
year since 2012
the rate of TB in the non-UK born population was 15 times higher than in the UK
born population in 2015, and 73% of cases were non-UK born
the majority (60%) of non-UK born cases occurred among those who have lived
in the UK more than six years
the rate of TB in the UK born population declined in 2015, with a decrease of
23% since the peak in 2012
the majority (60%) of UK born cases were from the White ethnic group, although
rates in non-White ethnic groups were between three and 19 times higher
Overall numbers, rates and geographical distribution
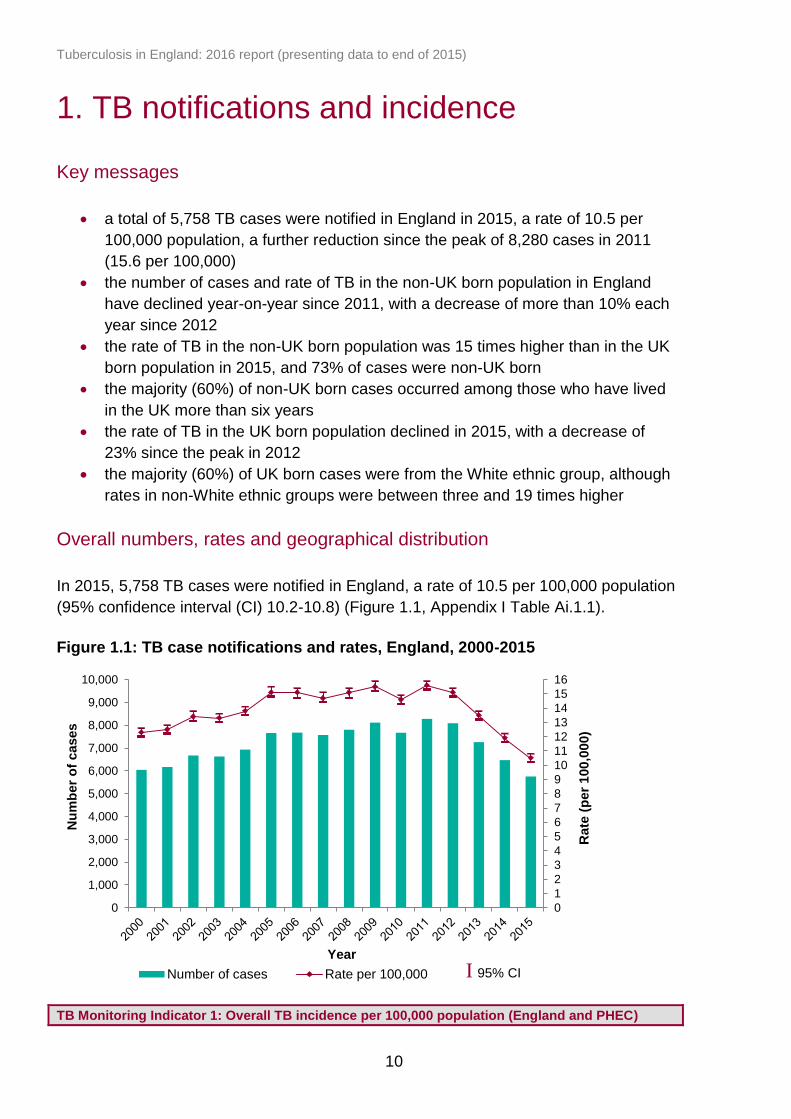
In 2015, 5,758 TB cases were notified in England, a rate of 10.5 per 100,000 population
(95% confidence interval (CI) 10.2-10.8) (Figure 1.1, Appendix I Table Ai.1.1).
Figure 1.1: TB case notifications and rates, England, 2000-2015
TB Monitoring Indicator 1: Overall TB incidence per 100,000 population (England and PHEC)
0
1
2
3
4
5
6
7
8
9
10
11
12
13
14
15
16
0
1,000
2,000
3,000
4,000
5,000
6,000
7,000
8,000
9,000
10,000
Rate
(p
er
100,0
00)
Nu
mb
er
of
cases
Year
Number of cases Rate per 100,000
I 95% CI
I 95% CI

Tuberculosis in England: 2016 report (presenting data to end of 2015)
11
In the past four years, there has been an annual decline in the number of cases and the
rate of TB, with an overall reduction in the rate of almost one-third (32.7%) since 2011
(Table Ai.1.1).
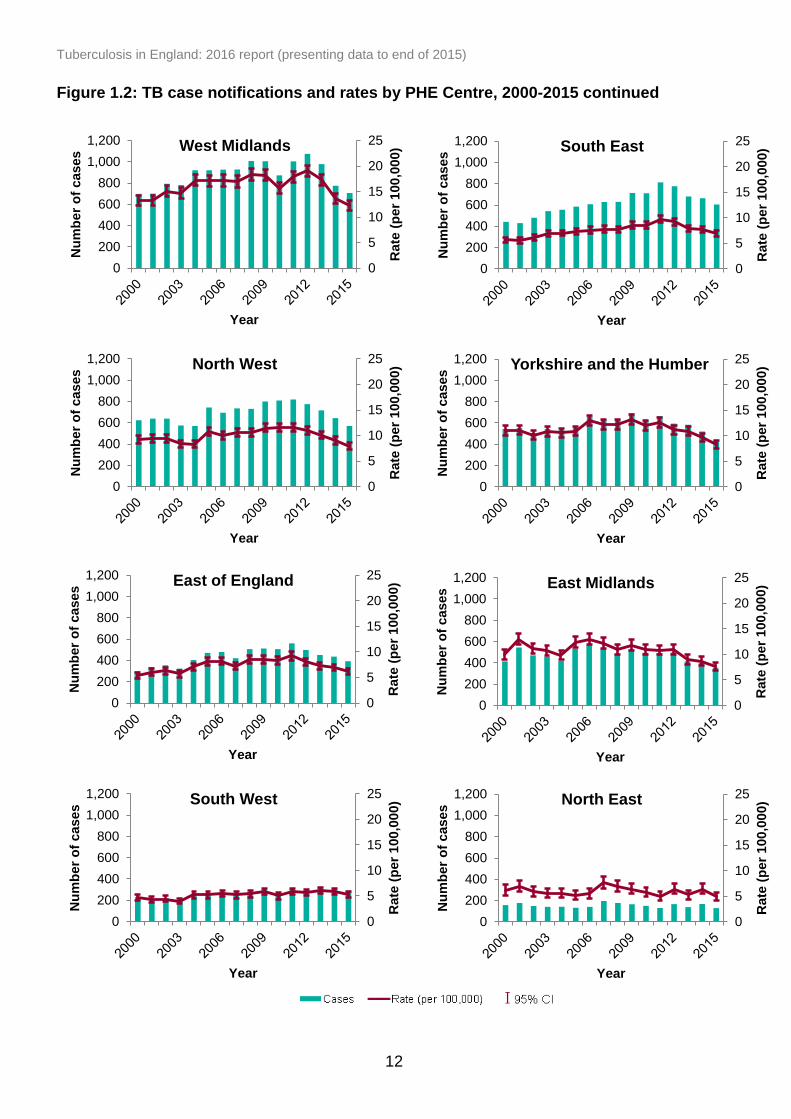
As in previous years, the main burden of disease was concentrated in large urban
areas. London PHE Centre (PHEC) accounted for the highest proportion of cases in
England (39.4%, 2,269/5,758) with a rate of 26.2 cases per 100,000 (95% CI 25.1-
27.3). In 2015, TB rates have declined in all PHECs, with particularly large year-on-year
declines in London and the West Midlands since 2011 (Figure 1.2, Table Ai.1.2). In
2015, 48.2% (157/326) of local authority districts in England had a rate less than 5.0 per
100,000 (Figure 1.3, Appendix II Table Aii.1.1).
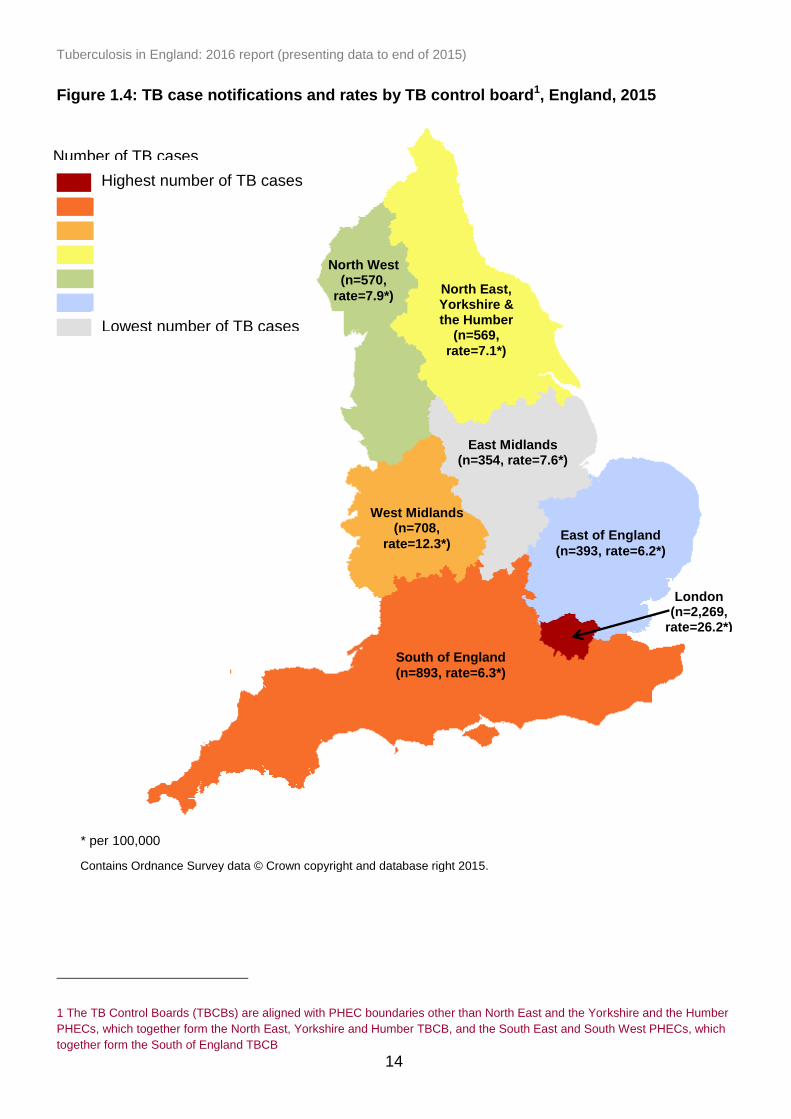
Seven TB control boards have been functioning in England since September 2015. The
number of TB cases notified in each of these TB control board areas in 2015 is shown
in Figure 1.4.
Figure 1.2: TB case notifications and rates by PHE Centre, 2000-2015
Please note: the axes on the London figure are different to that of other PHECs due to higher number of cases and rate of TB in London.
0
5
10
15
20
25
30
35
40
45
50
0
500
1,000
1,500
2,000
2,500
3,000
3,500
4,000
Rate
(p
er
100,0
00)
Nu
mb
er
of
cases
Year
London
Cases Rate (per 100,000) I 95% CI
Tuberculosis in England: 2016 report (presenting data to end of 2015)
12
0
5
10
15
20
25
0
200
400
600
800
1,000
1,200
Rate
(p
er
100,0
00)
Nu
mb
er
of
cases
Year
East Midlands
0
5
10
15
20
25
0
200
400
600
800
1,000
1,200
Rate
(p
er
100,0
00)
Nu
mb
er
of
cases
Year
East of England
0
5
10
15
20
25
0
200
400
600
800
1,000
1,200
Rate
(p
er
100,0
00)
Nu
mb
er
of
cases
Year
North West
0
5
10
15
20
25
0
200
400
600
800
1,000
1,200
Rate
(p
er
100,0
00)
Nu
mb
er
of
cases
Year
South East
0
5
10
15
20
25
0
200
400
600
800
1,000
1,200
Rate
(p
er
100,0
00)
Nu
mb
er
of
cases
Year
South West
0
5
10
15
20
25
0
200
400
600
800
1,000
1,200
Rate
(p
er
100,0
00)
Nu
mb
er
of
cases
Year
West Midlands
0
5
10
15
20
25
0
200
400
600
800
1,000
1,200
Rate
(p
er
100,0
00)
Nu
mb
er
of
cases
Year
Yorkshire and the Humber
0
5
10
15
20
25
0
200
400
600
800
1,000
1,200
Rate
(p
er
100,0
00)
Nu
mb
er
of
cases
Year
North East
Figure 1.2: TB case notifications and rates by PHE Centre, 2000-2015 continued

Tuberculosis in England: 2016 report (presenting data to end of 2015)
13
Figure 1.3: Three-year average TB rates by local authority district, England, 2013-2015 (box shows enlarged map of London area)
Contains Ordnance Survey data © Crown copyright and database right 2015.
Contains National Statistics data © Crown copyright and database right 2015.
0.0-4.9
5.0-9.9
10.0-14.9
15.0-19.9
20.0-29.9
30.0-39.9
40.0-49.9
>50.0
Tuberculosis rate (per 100,000)
Tuberculosis in England: 2016 report (presenting data to end of 2015)
14
TB burden
Highest TB burden control board
Lowest TB burden control board
Figure 1.4: TB case notifications and rates by TB control board1, England, 2015
* per 100,000
1 The TB Control Boards (TBCBs) are aligned with PHEC boundaries other than North East and the Yorkshire and the Humber
PHECs, which together form the North East, Yorkshire and Humber TBCB, and the South East and South West PHECs, which
together form the South of England TBCB
North East, Yorkshire & the Humber
(692) North West
(570)
West Midlands (n=708,
rate=12.3*)
East Midlands (n=354, rate=7.6*)
East of England
(n=393, rate=6.2*)
South of England
(n=893, rate=6.3*)
London (n=2,269,
rate=26.2*)
Contains Ordnance Survey data © Crown copyright and database right 2015.
North East, Yorkshire & the Humber
(n=569,
rate=7.1*)
North West (n=570,
rate=7.9*)
Number of TB cases
Highest number of TB cases
Lowest number of TB cases
Tuberculosis in England: 2016 report (presenting data to end of 2015)
15
Demographic characteristics
Age and sex
In 2015, 59.2% (3,407/5,758) of all cases were male and 58.0% (3,338/5,758) of all
cases were aged 15 to 44 years old. The rate of TB was highest in those aged 25 to 29
years (20.3 per 100,000), followed closely by those aged 35 to 39 years (19.6 per
100,000), and was lowest in children aged 5 to 9 years (1.5 per 100,000). A total of 220
cases were notified in children aged 0 to 14 years in 2015 (Table Ai.1.3). For the rate of
TB in UK born children over time, a proxy of TB transmission in England, see Chapter 3.
Non-UK born TB cases
In 2015, 72.5% (4,087/5,637) of TB cases with a known place of birth, were born
outside the UK. The number of non-UK born TB cases has declined year-on-year since
2011, from a peak of 6,021 cases in 2011 to 4,087 in 2015 (Figure 1.5, Table Ai.1.4).
The rate of TB in the non-UK born population has been declining over a more prolonged
period, from a peak of 100.7 per 100,000 in 2005 to 51.2 per 100,000 in 2015. In 2015,
the rate of TB in the non-UK born population was at its lowest since 2000 (Figure 1.5,
Table Ai.1.4).
In 2015, the rate of TB in this population remained 15 times higher than the rate in the
UK born population. In 2015, the highest rate of TB in the non-UK born population was
in those aged 25 to 29 years (73.9 per 100,000), and those aged 75 to 79 years (72.1
per 100,000) (Figure 1.6, Table Ai.1.3).

Tuberculosis in England: 2016 report (presenting data to end of 2015)
16
Figure 1.5: TB case notifications and rates by place of birth, England, 2000-2015
Please note: confidence intervals around the UK born population are small therefore not visible.
TB Monitoring Indicator 2: TB incidence in UK born and non-UK born populations (England)
Figure 1.6: TB case notifications and rates by age group and place of birth, England, 2015
Please note: confidence intervals around the UK born population are small therefore not visible.
0
10
20
30
40
50
60
70
80
90
100
110
0
1,000
2,000
3,000
4,000
5,000
6,000
7,000
Rate
(p
er
100,0
00)
Nu
mb
er
of
cases
Year UK born Non-UK bornRate UK born Rate Non-UK born
I 95% CI for Non-UK born
rate I 95% CI for UK born rate
0
10
20
30
40
50
60
70
80
90
100
0
100
200
300
400
500
600
700
800
900
1,000R
ate
(p
er
100,0
00)
Nu
mb
er
of
cases
Age group (years)
UK born Non-UK bornRate in UK born Rate in Non-UK born
I 95% CI for UK born rate
I 95% CI for Non-UK born rate
I 95% CI for Non-UK born
rate I 95% CI for UK born rate

Tuberculosis in England: 2016 report (presenting data to end of 2015)
17
In 2015, the highest rates of TB in the non-UK born population were in the West
Midlands PHEC (62.3 per 100,000), Yorkshire and the Humber PHEC (59.8 per
100,000), and North East PHEC (58.3 per 100,000) (Figure 1.7, Table Ai.1.5).
Figure 1.7: TB case notifications and rates by PHE Centre and place of birth,
2000-2015
I 95% CI for UK born rate
I 95% CI for Non-UK born rate
I 95% CI for UK born rate
0
20
40
60
80
100
120
140
160
180
0
500
1,000
1,500
2,000
2,500
3,000
3,500
Rate
(p
er
100,0
00)
Nu
mb
er
of
cases
Year
London
UK born Non-UK born
Rate UK born Rate Non-UK born
I 95% CI for Non-UK born
rate I 95% CI for UK born rate

Tuberculosis in England: 2016 report (presenting data to end of 2015)
18
Figure 1.7: TB case notifications and rates by PHE Centre and place of birth, 2000-2015 continued
Tuberculosis in England: 2016 report (presenting data to end of 2015)
19
0
200
400
600
800
1,000
1,200
1,400
1,600
1,800
2006 2007 2008 2009 2010 2011 2012 2013 2014 2015
Nu
mb
er
of
cases
Year
India Pakistan Somalia Bangladesh Nepal
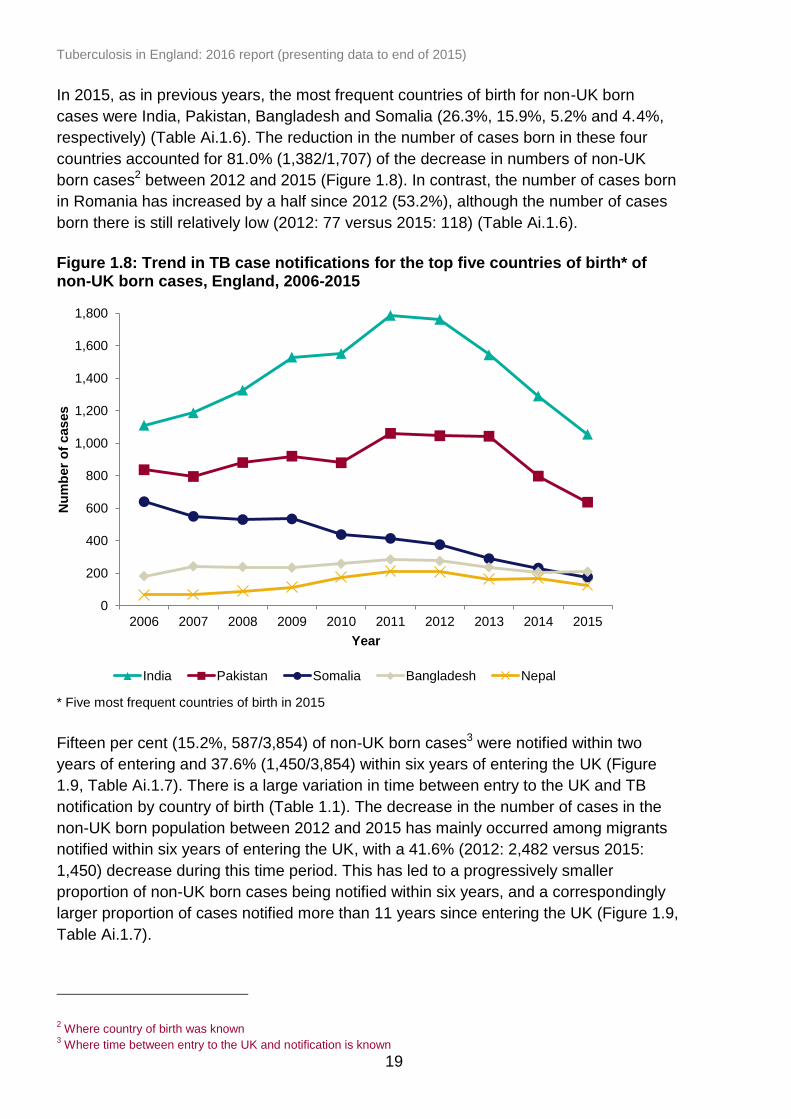
In 2015, as in previous years, the most frequent countries of birth for non-UK born
cases were India, Pakistan, Bangladesh and Somalia (26.3%, 15.9%, 5.2% and 4.4%,
respectively) (Table Ai.1.6). The reduction in the number of cases born in these four
countries accounted for 81.0% (1,382/1,707) of the decrease in numbers of non-UK
born cases2 between 2012 and 2015 (Figure 1.8). In contrast, the number of cases born
in Romania has increased by a half since 2012 (53.2%), although the number of cases
born there is still relatively low (2012: 77 versus 2015: 118) (Table Ai.1.6).
Figure 1.8: Trend in TB case notifications for the top five countries of birth* of non-UK born cases, England, 2006-2015
* Five most frequent countries of birth in 2015
Fifteen per cent (15.2%, 587/3,854) of non-UK born cases3 were notified within two
years of entering and 37.6% (1,450/3,854) within six years of entering the UK (Figure
1.9, Table Ai.1.7). There is a large variation in time between entry to the UK and TB
notification by country of birth (Table 1.1). The decrease in the number of cases in the
non-UK born population between 2012 and 2015 has mainly occurred among migrants
notified within six years of entering the UK, with a 41.6% (2012: 2,482 versus 2015:
1,450) decrease during this time period. This has led to a progressively smaller
proportion of non-UK born cases being notified within six years, and a correspondingly
larger proportion of cases notified more than 11 years since entering the UK (Figure 1.9,
Table Ai.1.7).
2 Where country of birth was known
3 Where time between entry to the UK and notification is known

Tuberculosis in England: 2016 report (presenting data to end of 2015)
20
Figure 1.9: Time between entry to the UK and TB notification for non-UK born cases, England, 2006-2015
Table 1.1: Most frequent countries of birth for TB cases and time between entry to
the UK and TB notification, England, 2015
Country of birth Number of
cases Proportion of
cases (%)*
Median time since entry to UK
(IQR)**
United Kingdom 1,550 27.8 - India 1,056 19.0 8 (3-18)
Pakistan 638 11.5 10 (4-25)
Bangladesh 210 3.8 10 (5-22)
Somalia 177 3.2 11 (5-16)
Nepal 126 2.3 5 (3-8)
Nigeria 118 2.1 8 (4-13)
Romania 118 2.1 1 (0-5)
Philippines 105 1.9 9 (5-14)
Zimbabwe 102 1.8 13 (11-14)
Eritrea 91 1.6 1 (0-6)
Poland 72 1.3 5 (2-9)
Afghanistan 69 1.2 8 (4-14)
Kenya 60 1.1 18 (10-43)
Sri Lanka 57 1.0 9 (5-16)
Other (each <1%) 1,023 18.4 9 (3-19)
Total* 5,572 100.0 9 (3-16)
* Where country of birth was known ** Years, IQR refers to interquartile range
0 10 20 30 40 50 60 70 80 90 100
2006
2007
2008
2009
2010
2011
2012
2013
2014
2015
Proportion of cases (%)
Year <2 years
2-6 years
6-11 years
11+ years

Tuberculosis in England: 2016 report (presenting data to end of 2015)
21
2
22 21
42
21 23 14 7 6 11
24
102
118
134 132
108
26
50
0
20
40
60
80
100
120
140
160
180
0
500
1,000
1,500
2,000
Wh
ite
Bla
ck-C
ari
bbe
an
Bla
ck-A
fric
an
Bla
ck-O
the
r
India
n
Pa
kis
tan
i
Ba
ng
lade
sh
i
Ch
ine
se
Mix
ed
/ O
the
r
Wh
ite
Bla
ck-C
ari
bbe
an
Bla
ck-A
fric
an
Bla
ck-O
the
r
India
n
Pa
kis
tan
i
Ba
ng
lade
sh
i
Chin
ese
Mix
ed
/ O
the
r
UK Born Non-UK Born
Rate
(p
er
100,0
00)
Nu
mb
er
of
cases
Place of birth/Ethnic group
Number of cases
Rate (per 100,000)
UK born TB cases
In 2015, there were 1,550 TB cases among the UK born population, a rate of 3.4 per
100,000 (Figure 1.5, Table Ai.1.4). Since 2012, there has been a 22.7% decrease in
both the number and the rate of TB cases in the UK born population. The largest
decline in the rate occurred between 2014 and 2015 (-10.5%).
The age distribution of UK born cases differs substantially to that of non-UK born cases,
with a fairly even number of cases in all the adult age groups, and the highest rate in the
population aged 80 years and older (5.4 per 100,000, 95% CI 4.4-6.4) (Figure 1.6,
Table Ai.1.3).
Of the UK born TB cases notified in 2015 where ethnic group was known, the majority
(60.0%, 928/1,547) were from the White ethnic group, 21.5% (332/1,547) from South
Asian ethnic groups (Indian, Pakistani and Bangladeshi) and 13.3% (206/1,547) from
Black ethnic groups (Black-Caribbean, Black-African and Black-Other). However, the
rates were highest in the non-White ethnic groups, with rates between three and
nineteen times higher than in the White ethnic group (Figure 1.10, Table Ai.1.8).
Figure 1.10: TB case notifications and rates by place of birth and ethnic group,
England, 2015
Please note: rates by ethnic group are displayed as labels.
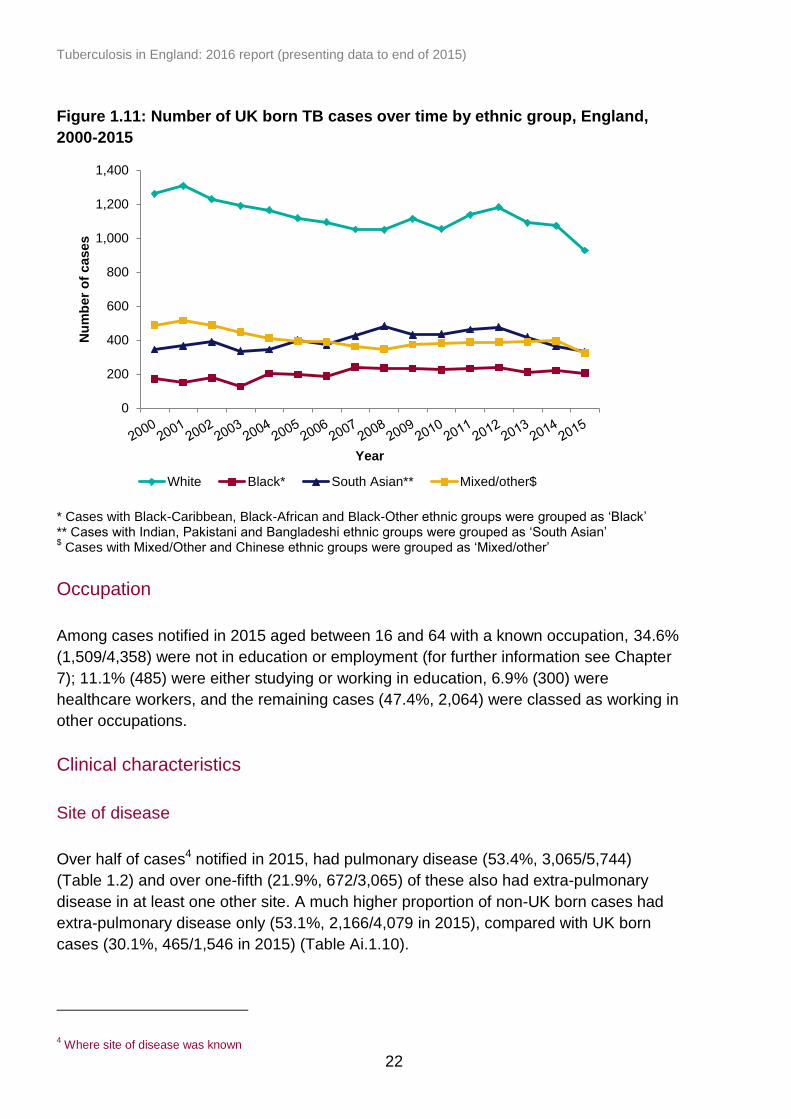
The decline in the number of cases in the UK born population since 2012 has occurred
among all ethnic groups, with the largest decline in the White (-21.5%) and South Asian
(-30.1%) ethnic groups (Figure 1.11, Table Ai.1.9).
I 95% CI
I 95% CI
Tuberculosis in England: 2016 report (presenting data to end of 2015)
22
Figure 1.11: Number of UK born TB cases over time by ethnic group, England,
2000-2015
* Cases with Black-Caribbean, Black-African and Black-Other ethnic groups were grouped as ‘Black’ ** Cases with Indian, Pakistani and Bangladeshi ethnic groups were grouped as ‘South Asian’ $ Cases with Mixed/Other and Chinese ethnic groups were grouped as ‘Mixed/other’
Occupation
Among cases notified in 2015 aged between 16 and 64 with a known occupation, 34.6%
(1,509/4,358) were not in education or employment (for further information see Chapter
7); 11.1% (485) were either studying or working in education, 6.9% (300) were
healthcare workers, and the remaining cases (47.4%, 2,064) were classed as working in
other occupations.
Clinical characteristics
Site of disease
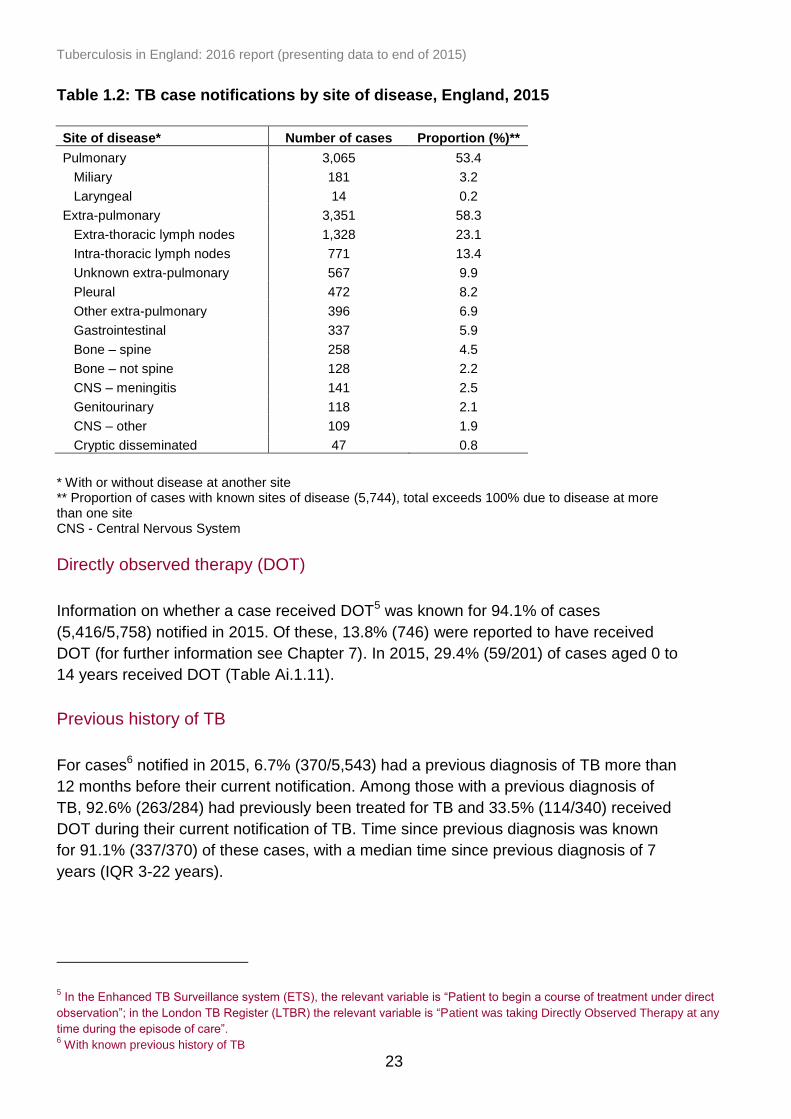
Over half of cases4 notified in 2015, had pulmonary disease (53.4%, 3,065/5,744)
(Table 1.2) and over one-fifth (21.9%, 672/3,065) of these also had extra-pulmonary
disease in at least one other site. A much higher proportion of non-UK born cases had
extra-pulmonary disease only (53.1%, 2,166/4,079 in 2015), compared with UK born
cases (30.1%, 465/1,546 in 2015) (Table Ai.1.10).
4 Where site of disease was known
0
200
400
600
800
1,000
1,200
1,400
Nu
mb
er
of
cases
Year
White Black* South Asian** Mixed/other$
Tuberculosis in England: 2016 report (presenting data to end of 2015)
23
Table 1.2: TB case notifications by site of disease, England, 2015
Site of disease* Number of cases Proportion (%)**
Pulmonary 3,065 53.4
Miliary 181 3.2
Laryngeal 14 0.2
Extra-pulmonary 3,351 58.3
Extra-thoracic lymph nodes 1,328 23.1
Intra-thoracic lymph nodes 771 13.4
Unknown extra-pulmonary 567 9.9
Pleural 472 8.2
Other extra-pulmonary 396 6.9
Gastrointestinal 337 5.9
Bone – spine 258 4.5
Bone – not spine 128 2.2
CNS – meningitis 141 2.5
Genitourinary 118 2.1
CNS – other 109 1.9
Cryptic disseminated 47 0.8
* With or without disease at another site ** Proportion of cases with known sites of disease (5,744), total exceeds 100% due to disease at more than one site CNS - Central Nervous System
Directly observed therapy (DOT)
Information on whether a case received DOT5 was known for 94.1% of cases
(5,416/5,758) notified in 2015. Of these, 13.8% (746) were reported to have received
DOT (for further information see Chapter 7). In 2015, 29.4% (59/201) of cases aged 0 to
14 years received DOT (Table Ai.1.11).
Previous history of TB
For cases6 notified in 2015, 6.7% (370/5,543) had a previous diagnosis of TB more than
12 months before their current notification. Among those with a previous diagnosis of
TB, 92.6% (263/284) had previously been treated for TB and 33.5% (114/340) received
DOT during their current notification of TB. Time since previous diagnosis was known
for 91.1% (337/370) of these cases, with a median time since previous diagnosis of 7
years (IQR 3-22 years).
5 In the Enhanced TB Surveillance system (ETS), the relevant variable is “Patient to begin a course of treatment under direct
observation”; in the London TB Register (LTBR) the relevant variable is “Patient was taking Directly Observed Therapy at any
time during the episode of care”. 6 With known previous history of TB
Tuberculosis in England: 2016 report (presenting data to end of 2015)
24
Smoking status
Information on current smoking status at onset of symptoms, presentation or during
care was collected from 2 July 2015. Between 2 July 2015 and 31 December 2015
information on smoking status was known for 76.0% (1,342/1,766) of notified TB cases.
Where information was known, 19.3% (259/1,342) were current smokers.
Travel and visitor risk factors
History of travel to and visitors received from a country outside the UK (excluding
Western Europe, US, Canada, New Zealand and Australia) in the last two years prior to
TB diagnosis has been collected since 13 May 2015. Between 13 May 2015 and 31
December 2015, information on travel history and visitor history was known for 65.0%
and 55.1% of notified TB cases, respectively. Where information was known, 23.2%
(342/1,476) of TB cases had travelled outside the UK and 6.8% (85/1,252) had received
a visitor from outside the UK. Where the country of travel or origin of visitor was known,
75.1% (244/325) of cases travelled to their country of birth and 77.5% (62/80) of cases
had received a visitor from their country of birth.

Tuberculosis in England: 2016 report (presenting data to end of 2015)
25
2. Laboratory confirmation of TB
Key messages
the proportion of TB cases that were culture confirmed has remained stable over
the past decade (58%-61%)
a higher proportion of pulmonary TB cases were culture confirmed compared
with extra-pulmonary TB cases (73% versus 46%)
culture confirmation was lowest (23%) among cases aged 0 to 14 years
only 62% of all pulmonary TB cases had a sputum smear result reported, and
half of these (52%) were positive
32% of all cases were not confirmed by any laboratory method (culture,
microscopy, histology or PCR)
Laboratory tests data collection
Data for all culture confirmed TB isolates from the Mycobacteria Reference
Laboratories, including speciation, drug susceptibility testing and Mycobacterial
Interspersed Repetitive Unit-Variable Number Tandem Repeats (MIRU-VNTR) typing
were matched to TB case notifications (see Appendix III: Methods), and the results were
used to report culture confirmation. Results for microscopy, PCR and histology were
also collected in ETS (see Appendix III: Methods).
Culture confirmation
Of the TB cases notified in 2015, 60.1% (3,460/5,758) were culture confirmed. Over the
past decade, the proportion of TB cases that were culture confirmed remained relatively
stable (Table Ai.2.1). In 2015, as in previous years, a higher proportion of pulmonary
cases were culture confirmed compared with extra-pulmonary cases (72.7%,
2,228/3,065 versus 45.9%, 1,231/2,679).
Culture confirmation varied by PHEC, with the highest proportion of culture confirmed
cases in the East Midlands (66.9%, 237/354) and the lowest in the West Midlands
(56.8%, 402/708) (Table Ai.2.1). Culture confirmation of pulmonary cases was also
highest in the East Midlands (78.2%, 165/211), and was lowest in the South West
PHEC (63.0%, 121/192) (Table Ai.2.2).
In 2015, as in previous years, the proportion of culture confirmation was lower among
TB cases aged 0 to 14 years (22.7%, 50/220) compared with those aged 15 to 44 years
(63.5%, 2,121/3,338), 45 to 64 years (57.4%, 778/1,355) and 65 years and older
(60.5%, 511/845).

Tuberculosis in England: 2016 report (presenting data to end of 2015)
26
Among culture confirmed TB cases notified in 2015 (3,460), 97.2% (3,364) were
identified as Mycobacterium tuberculosis (M. tuberculosis), 0.9% (32) Mycobacterium
bovis (M. bovis), 1.6% (56) Mycobacterium africanum (M. africanum) and 0.2% (8)
Mycobacterium tuberculosis complex (MTBC), which were not further differentiated
(Table Ai.2.3).
Sputum smear test results
Of all pulmonary TB cases notified in 2015, only 61.6% (1,888/3,065) had a sputum
smear (microscopy) result reported, of which half (52.4%, 990/1,888) were positive.
Ninety three percent (93.4%, 925/990) of those with a positive sputum smear were also
culture confirmed, compared with only 63.4% (569/898) of sputum smear negative
cases. Fifteen percent (14.5%, 443/3,065) of pulmonary TB cases had no sputum
smear result or culture confirmation.
Other laboratory test results
In 2015, 18.7% (429/2,298) of TB cases that were not culture confirmed had an
alternative positive laboratory test (microscopy, histology or PCR) result indicative of
TB, with the highest proportion (12.1%, 279/2,298) histology positive (Table 2.1). A high
proportion (81.3%, 1,869/2,298) of cases that were not culture confirmed did not have
any other known positive test result reported. Overall, almost one-third (32.5%, 1,869
/5,758) of all cases were not confirmed by any laboratory method (culture, microscopy,
histology or PCR), similar to the proportion in 2014 (32.2%, 2,082/6,472).
Table 2.1: Number and proportion of non-culture confirmed TB cases by other lab
diagnostic confirmation, England, 2015
Laboratory test results* Pulmonary Extra-pulmonary All cases**
n (837)# % n (1,448)
# % n (2,298)
# %
Sputum smear positive 65 7.8 0 0.0 65 2.8
Smear positive (not sputum) 29 3.8 40 2.8 69 3.1
Histology positive 48 5.7 231 16.0 279 12.1
PCR positive 10 1.2 22 1.5 32 1.4
No known positive lab result 691 82.6 1,165 80.5 1,869 81.3
* Some cases may have more than one test result therefore the total percentage may exceed 100% ** Total cases including those with an unknown site of disease # Total number of non-culture confirmed TB cases, used as the denominator in proportion of laboratory
test results shown

Tuberculosis in England: 2016 report (presenting data to end of 2015)
27
TB isolates7 not matched to notified cases
The number and proportion of isolates received from Mycobacteria Reference
Laboratories that could not be matched to a notified case in the previous, same or
subsequent year, have decreased from 471 isolates (9.2%) in 2006 to 99 isolates
(2.5%) in 2014 (Table 2.2). In 2015, isolates from 259 (7.3%) individuals could not be
matched to a case notified in the previous or same year (Table 2.2). As in previous
years, the proportion of unmatched isolates for 2015 is likely to decrease further once
matched to 2016 notifications.
Unmatched isolates may be due to TB cases that were not notified to the surveillance
system, thereby providing an estimate of under-reporting. Although isolates may have
failed to match to a notified case if personal identifiers were incomplete or inaccurate
and a small number may represent contaminants (which were not identified as
contaminants in surveillance reporting).
Table 2.2: Unmatched isolates by specimen year, England, 2006-2015
Specimen year
Unmatched to a case within the previous
or same year
Unmatched to a case within the
previous, same or subsequent year
All isolates*
n % n % n
2006 660 12.9 471 9.2 5,134
2007 603 12.3 416 8.5 4,890
2008 665 13.3 424 8.5 5,015
2009 582 11.6 353 7.0 5,038
2010 475 9.7 237 4.8 4,906
2011 493 9.3 205 3.8 5,327
2012 418 8.3 153 3.0 5,022
2013 358 7.9 151 3.4 4,505
2014 261 6.6 99 2.5 3,953
2015 259 7.3 - - 3,548
* Deduplicated based on patient identifiers to represent one isolate per case per notification period
7 Isolates are deduplicated to only count one isolate per case per notification period, see Appendix III: Methods for further
information.

Tuberculosis in England: 2016 report (presenting data to end of 2015)
28
3. TB transmission
Key messages
in 2015, the rate of TB in UK born children, a proxy for recent transmission in
England, continued to decline to 1.8 per 100,000; this is a 47% reduction from
the peak of 3.4 per 100,000 in 2008
the proportion of MIRU-VNTR strain typed TB cases that clustered has
decreased from 61% in 2012 to 56% in 2015, and the number of new clusters
formed each year has also decreased over this time period
the majority of strain type clusters between 2010 and 2015 were small, with
almost half (46%) containing only two cases
Rate of TB in UK born children
In 2015, the rate of TB in UK born children under 15 years of age, a proxy for recent
transmission within England, was 1.8 per 100,000 (95% CI 1.5-2.1). There has been a
47.1% reduction in this rate since the peak of 3.4 per 100,000 (95% CI 3.0-3.8) in 2007
and 2008 (Figure 3.1, Table Ai.3.1).
Figure 3.1: Rate of TB in UK born children*, England, 2000-2015
* Aged 0 to 14 years
TB Monitoring Indicator 5: Incidence of TB in UK born children aged under fifteen years (England)
0.0
0.5
1.0
1.5
2.0
2.5
3.0
3.5
4.0
Rate
(p
er
100,0
00)
Year
I 95% CI
I 95% CI

Tuberculosis in England: 2016 report (presenting data to end of 2015)
29
Strain typing and clustering
The National TB Strain Typing Service in England, established in 2010, prospectively
types TB isolates using 24 loci MIRU-VNTR. Clustered cases (with indistinguishable
MIRU-VNTR strain types) may reflect cases that are part of the same chain of
transmission, but could also reflect common endemic strains circulating either within
England or abroad. MIRU-VNTR strain typing can be used to refute transmission
between individuals who have distinguishable strain types, but an indistinguishable
strain type does not confirm transmission; additional epidemiological information is
required to assess whether cases with indistinguishable strain types are likely to reflect
recent transmission.
In 2015, 60.1% (3,460/5,758) of notified TB cases were culture confirmed and of those,
87.7% (3,034/3,460) had an isolate with at least 23 loci typed (Table 3.1). For culture
confirmed cases notified between 2010 and 2015, 83.0% (21,839/26,314) had strain
typing completed for at least 23 loci, and 58.4% (12,752/21,839) of these cases
clustered in 2,539 molecular clusters and 41.6% (9,087) had a unique strain type (Table
3.1, Table Ai.3.2). The proportion of clustered cases varied by PHEC; the areas with the
largest number of cases generally had the highest proportion of clustered cases (Table
Ai.3.2).
Table 3.1: Number and proportion of clustered cases and new clusters by place of
birth and year, England, 2010-2015
Year
Culture confirmed
cases
≥23 loci typed cases*
Clustered cases**
Non-UK born clustered
cases
UK born clustered
cases
New clusters (per year)
#
n n % n % n % n % n
2010 4,609 3,224 70.0 1,884 58.4 1,308 55.4 491 68.1 367
2011 5,031 4,268 84.8 2,484 58.2 1,695 54.1 714 72.0 539
2012 4,897 4,304 87.9 2,606 60.5 1,793 56.8 740 73.1 535
2013 4,393 3,662 83.4 2,194 59.9 1,512 56.0 641 71.6 405
2014 3,924 3,347 85.3 1,901 56.8 1,293 52.9 574 67.5 413
2015 3,460 3,034 87.7 1,683 55.5 1,139 52.0 517 65.6 280
Total 26,314 21,839 83.0 12,752 58.4 8,740 54.7 3,677 69.9 2,539
* % ≥23 loci is the proportion of culture confirmed cases which have had at least 23 loci typed ** Clustered in time period (2010-2015), clustered cases notified in year # A new cluster forms at the point when a second case is notified with indistinguishable MIRU-VNTR strain type as
an existing case
The proportion of cases that clustered with at least one other case within the six year
period from 2010 to 2015 increased from 58.4% (1,884/3,224) in 2010 to 60.5%
(2,606/4,304) in 2012, and has since declined to 55.5% (1,683/3,034) in 2015 (Table
3.1). The number of new clusters that formed each year8 peaked at 539 in 2011, and
8 A new cluster forms at the point when a second case is notified with an indistinguishable MIRU-VNTR strain type as an
existing case
Tuberculosis in England: 2016 report (presenting data to end of 2015)
30
0
5
10
15
20
25
30
35
40
45
50
2 cases 3-4 cases 5-9 cases ≥10 cases
Pro
po
rtio
n o
f clu
ste
rs (
%)
Size of clusters
has subsequently reduced to 280 new clusters in 2015. Over the last six years a higher
proportion of UK born TB cases clustered with at least one other case (69.9%,
3,677/5,257), compared with non-UK born TB cases (54.7%, 8,740/15,983).
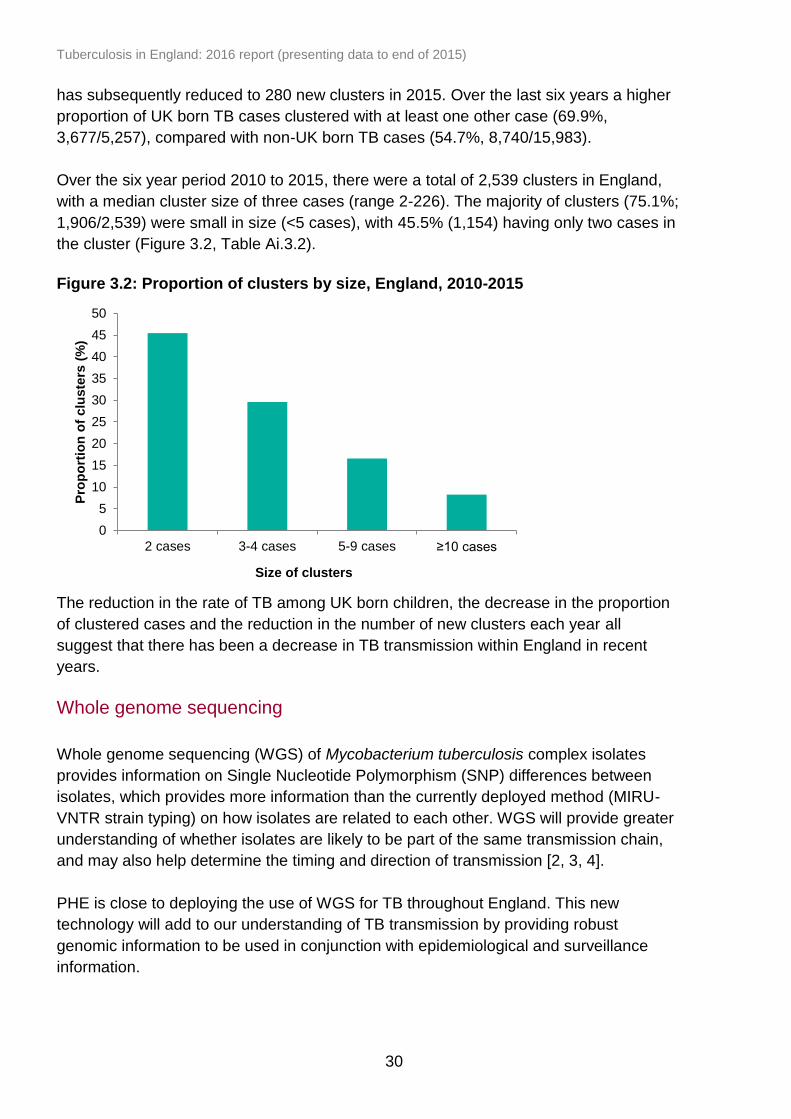
Over the six year period 2010 to 2015, there were a total of 2,539 clusters in England,
with a median cluster size of three cases (range 2-226). The majority of clusters (75.1%;
1,906/2,539) were small in size (<5 cases), with 45.5% (1,154) having only two cases in
the cluster (Figure 3.2, Table Ai.3.2).
Figure 3.2: Proportion of clusters by size, England, 2010-2015
The reduction in the rate of TB among UK born children, the decrease in the proportion
of clustered cases and the reduction in the number of new clusters each year all
suggest that there has been a decrease in TB transmission within England in recent
years.
Whole genome sequencing
Whole genome sequencing (WGS) of Mycobacterium tuberculosis complex isolates
provides information on Single Nucleotide Polymorphism (SNP) differences between
isolates, which provides more information than the currently deployed method (MIRU-
VNTR strain typing) on how isolates are related to each other. WGS will provide greater
understanding of whether isolates are likely to be part of the same transmission chain,
and may also help determine the timing and direction of transmission [2, 3, 4].
PHE is close to deploying the use of WGS for TB throughout England. This new
technology will add to our understanding of TB transmission by providing robust
genomic information to be used in conjunction with epidemiological and surveillance
information.

Tuberculosis in England: 2016 report (presenting data to end of 2015)
31
4. Delay from symptom onset to treatment
start
Key messages
in 2015, the median time between symptom onset and treatment start for
pulmonary cases was 72 days
in 2015, more than a quarter of pulmonary cases (28%) experienced a delay of
more than four months between symptom onset and treatment start
a higher proportion of UK born cases (33%) experienced a delay of more than
four months compared with non-UK born cases (25%)
there has been a small reduction in the proportion of non-UK born cases with a
delay of more than four months in 2015 (from 29% in 2014)
a low proportion (10%) of children aged 0 to 14 years old experienced a delay of
more than four months; in contrast, 35% of those aged 65 years and older
experienced a delay of more than four months
Time from symptom onset to treatment start for pulmonary TB cases
Information on time from symptom onset to treatment start was available for 92.4%
(2,771/2,999) of pulmonary cases notified in 2015. Data on the time from symptom
onset to treatment start has been available for more than two-thirds of cases since 2011
and data completion has improved during this period. Current data completeness on
date of first presentation to health services does not enable us to distinguish late
presentation to health services from delays occurring within the health service.
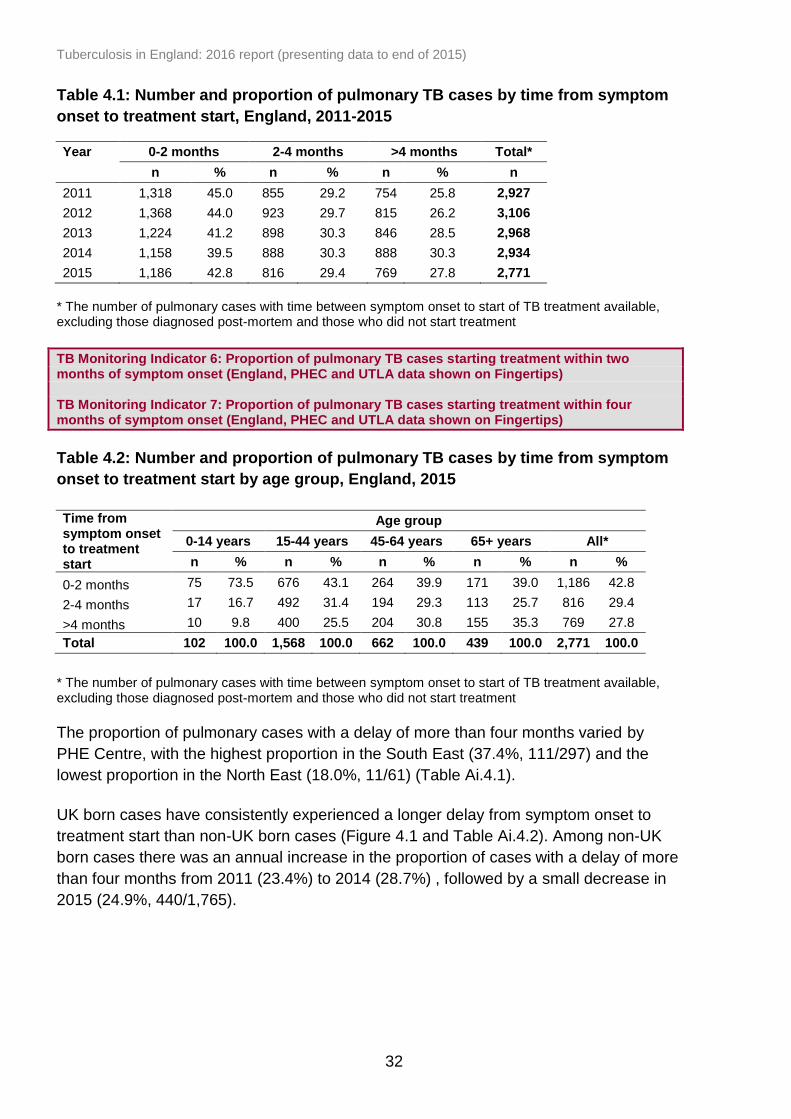
In 2015, the median time between symptom onset and treatment start was 72 days
(interquartile range (IQR) 36-132). Forty three percent (1,186/2,771) of pulmonary
cases started treatment within two months, and 29.4% (816/2,771) between two and
four months from symptom onset. Since 2011, at least one-quarter of pulmonary cases
had a delay from symptom onset to treatment start of more than four months; in 2015,
27.8% (769/2,771) of pulmonary cases had a delay of more than four months (Table
4.1).
As in previous years, the proportion of cases in 2015 that experienced a delay of more
than four months increased with age (0-14: 9.8%, 15-44: 25.5%, 45-64: 30.8%, over 65:
35.3%) (Table 4.2).
Tuberculosis in England: 2016 report (presenting data to end of 2015)
32
Table 4.1: Number and proportion of pulmonary TB cases by time from symptom
onset to treatment start, England, 2011-2015
Year 0-2 months 2-4 months >4 months Total*
n % n % n % n
2011 1,318 45.0 855 29.2 754 25.8 2,927
2012 1,368 44.0 923 29.7 815 26.2 3,106
2013 1,224 41.2 898 30.3 846 28.5 2,968
2014 1,158 39.5 888 30.3 888 30.3 2,934
2015 1,186 42.8 816 29.4 769 27.8 2,771
* The number of pulmonary cases with time between symptom onset to start of TB treatment available, excluding those diagnosed post-mortem and those who did not start treatment
TB Monitoring Indicator 6: Proportion of pulmonary TB cases starting treatment within two months of symptom onset (England, PHEC and UTLA data shown on Fingertips) TB Monitoring Indicator 7: Proportion of pulmonary TB cases starting treatment within four months of symptom onset (England, PHEC and UTLA data shown on Fingertips)
Table 4.2: Number and proportion of pulmonary TB cases by time from symptom
onset to treatment start by age group, England, 2015
Time from symptom onset to treatment start
Age group
0-14 years 15-44 years 45-64 years 65+ years All*
n % n % n % n % n %
0-2 months 75 73.5 676 43.1 264 39.9 171 39.0 1,186 42.8
2-4 months 17 16.7 492 31.4 194 29.3 113 25.7 816 29.4
>4 months 10 9.8 400 25.5 204 30.8 155 35.3 769 27.8
Total 102 100.0 1,568 100.0 662 100.0 439 100.0 2,771 100.0
* The number of pulmonary cases with time between symptom onset to start of TB treatment available, excluding those diagnosed post-mortem and those who did not start treatment
The proportion of pulmonary cases with a delay of more than four months varied by
PHE Centre, with the highest proportion in the South East (37.4%, 111/297) and the
lowest proportion in the North East (18.0%, 11/61) (Table Ai.4.1).
UK born cases have consistently experienced a longer delay from symptom onset to
treatment start than non-UK born cases (Figure 4.1 and Table Ai.4.2). Among non-UK
born cases there was an annual increase in the proportion of cases with a delay of more
than four months from 2011 (23.4%) to 2014 (28.7%) , followed by a small decrease in
2015 (24.9%, 440/1,765).

Tuberculosis in England: 2016 report (presenting data to end of 2015)
33
Figure 4.1: Proportion of pulmonary TB cases with a delay from symptom onset
to treatment start by place of birth, England, 2011-2015
0
10
20
30
40
50
60
70
2011 2012 2013 2014 2015 2011 2012 2013 2014 2015
UK born Non-UK born
Pro
po
rtio
n o
f cases (
%)
Year/Place of birth
>2 months delay >4 months delay

Tuberculosis in England: 2016 report (presenting data to end of 2015)
34
5. TB outcomes in the drug sensitive cohort
Key messages
following a year-on-year improvement, there has been a slight reduction in the
proportion of TB cases (with an expected treatment duration of less than 12
months) who had completed treatment by 12 months, from 85.4% of cases
notified in 2013 to 84.5% of cases notified in 2014
the number and proportion of all drug sensitive cases who had died at the last
recorded outcome has slightly increased from 4.7% (336) of those notified in
2013 to 5.5% (351) of those notified in 2014
the proportion of all drug sensitive cases who were lost to follow-up at last
recorded outcome was similar in 2013 (4.1%, 295) and 2014 (4.2%, 266)
Drug sensitive cohort, 2005-2014
For the purposes of international TB outcome reporting, the drug sensitive cohort is
defined as excluding all cases in the drug resistant cohort. The drug resistant cohort
comprises of TB cases with rifampicin resistant TB (initial or acquired) including MDR-
TB (initial or acquired), and non-culture confirmed cases treated with an MDR-TB
regimen [5]. Under this definition, cases with resistance to isoniazid, ethambutol and/or
pyrazinamide but without resistance to rifampicin are included in the drug sensitive
cohort. For TB outcomes in the drug resistant cohort, see Chapter 6.
TB outcomes for the drug sensitive cohort are reported separately for the following
groups:
for cases with an expected duration of treatment less than 12 months, TB
outcomes at 12 months are reported. This group excludes cases with CNS
disease, who have an expected duration of treatment of 12 months. In addition,
those with spinal, cryptic disseminated or miliary disease are excluded from this
group, as CNS involvement cannot be reliably ruled out for the purposes of
reporting.
for cases with CNS, spinal, cryptic disseminated or miliary disease, the last
recorded TB outcome is reported.
Detailed data on deaths and loss to follow-up at last recorded outcome are presented
for the entire drug sensitive cohort.
Tuberculosis in England: 2016 report (presenting data to end of 2015)
35
TB outcomes for the drug sensitive cohort with expected duration of treatment
less than 12 months
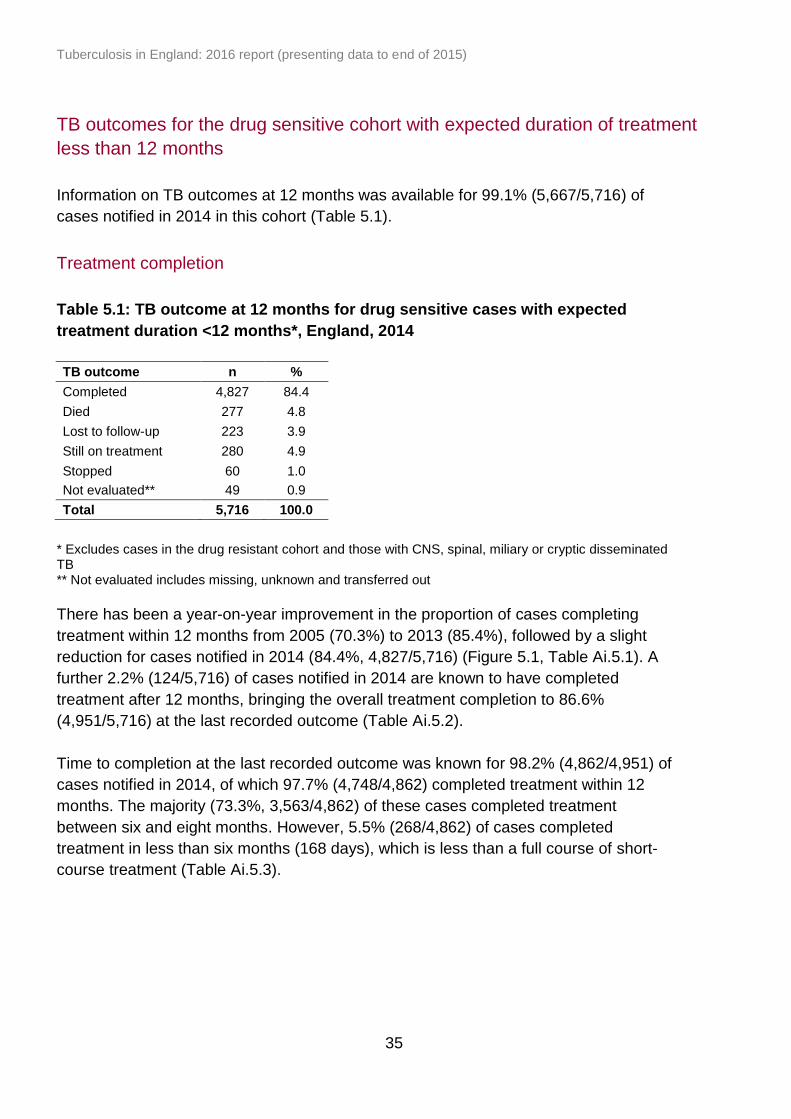
Information on TB outcomes at 12 months was available for 99.1% (5,667/5,716) of
cases notified in 2014 in this cohort (Table 5.1).
Treatment completion
Table 5.1: TB outcome at 12 months for drug sensitive cases with expected
treatment duration <12 months*, England, 2014
TB outcome n %
Completed 4,827 84.4
Died 277 4.8
Lost to follow-up 223 3.9
Still on treatment 280 4.9
Stopped 60 1.0
Not evaluated** 49 0.9
Total 5,716 100.0
* Excludes cases in the drug resistant cohort and those with CNS, spinal, miliary or cryptic disseminated TB ** Not evaluated includes missing, unknown and transferred out
There has been a year-on-year improvement in the proportion of cases completing
treatment within 12 months from 2005 (70.3%) to 2013 (85.4%), followed by a slight
reduction for cases notified in 2014 (84.4%, 4,827/5,716) (Figure 5.1, Table Ai.5.1). A
further 2.2% (124/5,716) of cases notified in 2014 are known to have completed
treatment after 12 months, bringing the overall treatment completion to 86.6%
(4,951/5,716) at the last recorded outcome (Table Ai.5.2).
Time to completion at the last recorded outcome was known for 98.2% (4,862/4,951) of
cases notified in 2014, of which 97.7% (4,748/4,862) completed treatment within 12
months. The majority (73.3%, 3,563/4,862) of these cases completed treatment
between six and eight months. However, 5.5% (268/4,862) of cases completed
treatment in less than six months (168 days), which is less than a full course of short-
course treatment (Table Ai.5.3).

Tuberculosis in England: 2016 report (presenting data to end of 2015)
36
0
10
20
30
40
50
60
70
80
90
100
2005 2006 2007 2008 2009 2010 2011 2012 2013 2014
Pro
po
rtio
n o
f cases (
%)
Year
Completed Died Lost to follow-up Still on treatment Stopped Not evaluated**
Figure 5.1: TB outcomes at 12 months for drug sensitive cases with expected
treatment duration <12 months*, England, 2005-2014
* Excludes cases in the drug resistant cohort and those with CNS, spinal, miliary or cryptic disseminated TB ** Not evaluated includes missing, unknown and transferred out
As in previous years, the proportion of cases who completed treatment within 12
months decreased with age, from 93.5% (231/247) in those aged 0 to 14 years to
69.6% (592/851) in those aged 65 years or older (Table Ai.5.4). For cases aged 0 to 14
years, there was an improvement in treatment completion between 2011 (85.2%,
300/352) and 2014 (93.5%, 231/247). Treatment completion within 12 months was
similar in females (86.4%, 2,039/2,361) and males (83.1%, 2,788/3,355).
Treatment completion at 12 months was lower in those with pulmonary disease only,
compared to those with extra-pulmonary disease only (81.9%, 2,021/2,468 versus
88.0%, 2,305/2,618, respectively).
Treatment completion at 12 months varied by PHEC; from 87.2% (1,946/2,232) in
London to 75.3% (219/291) in the South West (Table Ai.5.5). This variation in treatment
completion at 12 months by PHEC was similar to previous years (Table Ai.5.6).

Tuberculosis in England: 2016 report (presenting data to end of 2015)
37
Still on treatment
Five percent (4.9%, 280/5,716) of cases were still on treatment at 12 months (Table 5.1,
Table Ai.5.1), although it is known from the last recorded outcome that nearly half of
these (44.3%, 124/280) eventually completed treatment. Just over one-third (33.9%,
66/195) of cases still on treatment at 12 months with known drug sensitivity results were
resistant to isoniazid without MDR-TB.
Information on the reason for still being on treatment at 12 months was recorded for
84.3% (236/280) of cases notified in 2014, of which, 21.6% (51/236) had their treatment
changed, 59.8% (141/236) were known to be on a regimen exceeding 12 months, and
18.6% (44/236) had their treatment interrupted. For those with more detailed information
on the reason for still being on treatment, 35 cases were reported to still be on
treatment due to intolerance or side-effects, 12 had a poor clinical response to
treatment and 6 had been non-compliant with treatment.
TB outcomes for drug sensitive cohort with CNS, spinal, miliary or cryptic
disseminated TB
Information on TB outcome at the last recorded outcome was available for 98.8%
(681/689) of cases notified in 2014 (Table 5.2).
Table 5.2: Last recorded TB outcome for drug sensitive cohort with CNS, spinal,
miliary or cryptic disseminated* TB, England, 2014
TB outcome n %
Treatment completed 463 67.2
Died 72 10.4
Lost to follow-up 42 6.1
Still on treatment 93 13.5
Treatment stopped 11 1.6
Not evaluated** 8 1.2
Total 689 100.0
* Excludes cases in the drug resistant cohort and only includes drug sensitive TB cases with CNS, spinal, miliary or cryptic disseminated TB ** Not evaluated includes missing, unknown and transferred out
At the last recorded outcome, 67.2% (463/689) of cases notified in 2014 had completed
treatment and 13.5% (93/689) were still on treatment (Table 5.2, Table Ai.5.7). There is
a shorter follow-up period for cases notified in 2014, so the proportion who finally
complete treatment is expected to increase, as seen in previous years. For cases
notified in 2013, 82.8% (624/754) completed treatment at the last recorded outcome
(Table Ai.5.7).
Tuberculosis in England: 2016 report (presenting data to end of 2015)
38
TB outcomes in the entire drug sensitive cohort
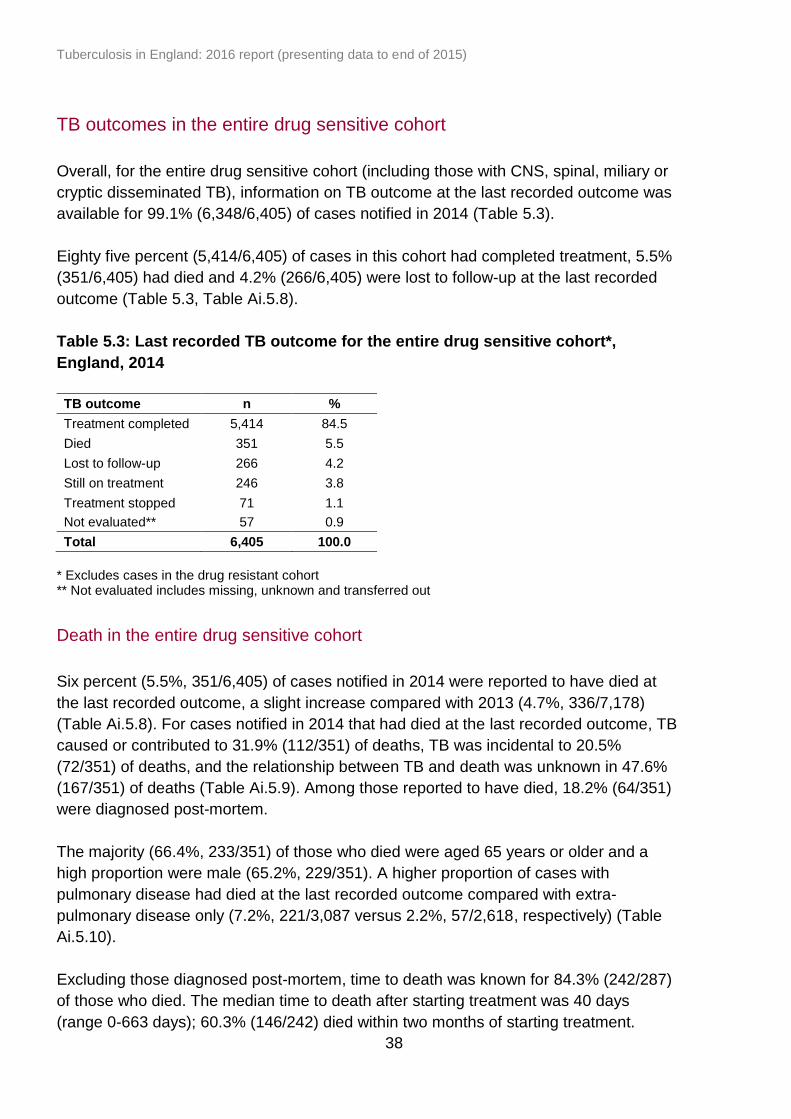
Overall, for the entire drug sensitive cohort (including those with CNS, spinal, miliary or
cryptic disseminated TB), information on TB outcome at the last recorded outcome was
available for 99.1% (6,348/6,405) of cases notified in 2014 (Table 5.3).
Eighty five percent (5,414/6,405) of cases in this cohort had completed treatment, 5.5%
(351/6,405) had died and 4.2% (266/6,405) were lost to follow-up at the last recorded
outcome (Table 5.3, Table Ai.5.8).
Table 5.3: Last recorded TB outcome for the entire drug sensitive cohort*,
England, 2014
TB outcome n %
Treatment completed 5,414 84.5
Died 351 5.5
Lost to follow-up 266 4.2
Still on treatment 246 3.8
Treatment stopped 71 1.1
Not evaluated** 57 0.9
Total 6,405 100.0
* Excludes cases in the drug resistant cohort ** Not evaluated includes missing, unknown and transferred out
Death in the entire drug sensitive cohort
Six percent (5.5%, 351/6,405) of cases notified in 2014 were reported to have died at
the last recorded outcome, a slight increase compared with 2013 (4.7%, 336/7,178)
(Table Ai.5.8). For cases notified in 2014 that had died at the last recorded outcome, TB
caused or contributed to 31.9% (112/351) of deaths, TB was incidental to 20.5%
(72/351) of deaths, and the relationship between TB and death was unknown in 47.6%
(167/351) of deaths (Table Ai.5.9). Among those reported to have died, 18.2% (64/351)
were diagnosed post-mortem.
The majority (66.4%, 233/351) of those who died were aged 65 years or older and a
high proportion were male (65.2%, 229/351). A higher proportion of cases with
pulmonary disease had died at the last recorded outcome compared with extra-
pulmonary disease only (7.2%, 221/3,087 versus 2.2%, 57/2,618, respectively) (Table
Ai.5.10).
Excluding those diagnosed post-mortem, time to death was known for 84.3% (242/287)
of those who died. The median time to death after starting treatment was 40 days
(range 0-663 days); 60.3% (146/242) died within two months of starting treatment.
Tuberculosis in England: 2016 report (presenting data to end of 2015)
39
The proportion of deaths was 2.7 times higher in cases with a previous diagnosis of TB
(10.8%, 44/408), compared with cases without a previous diagnosis of TB (4.0%,
231/5,714). The proportion of deaths varied by PHEC; from 3.0% (75/2,528) in London
to 8.8% (56/634) in North West (Table Ai.5.11).
Lost to follow-up in the entire drug sensitive cohort
Four percent (4.2%, 266/6,405) of cases notified in 2014 were lost to follow-up at the
last recorded outcome, of which 86.5% (230/266) were non-UK born (Table 5.3,
Ai.5.12). Where the reason for lost to follow-up was recorded, 63.0% (145/230) of those
born abroad had left the UK (Table Ai.5.12). The majority (72.2%, 192/266) of lost to
follow-up cases occurred in those aged 15 to 44 years; overall, 5.2% (192/3,673) of this
age group were lost to follow-up. Over half (57.5%, 153/266) of cases who were lost to
follow-up had pulmonary disease, and ten cases were known to have been lost to
follow-up before any treatment was started.
Tuberculosis in England: 2016 report (presenting data to end of 2015)
40
6. Drug resistant TB (including TB
outcomes in the drug resistant cohort)
Key messages
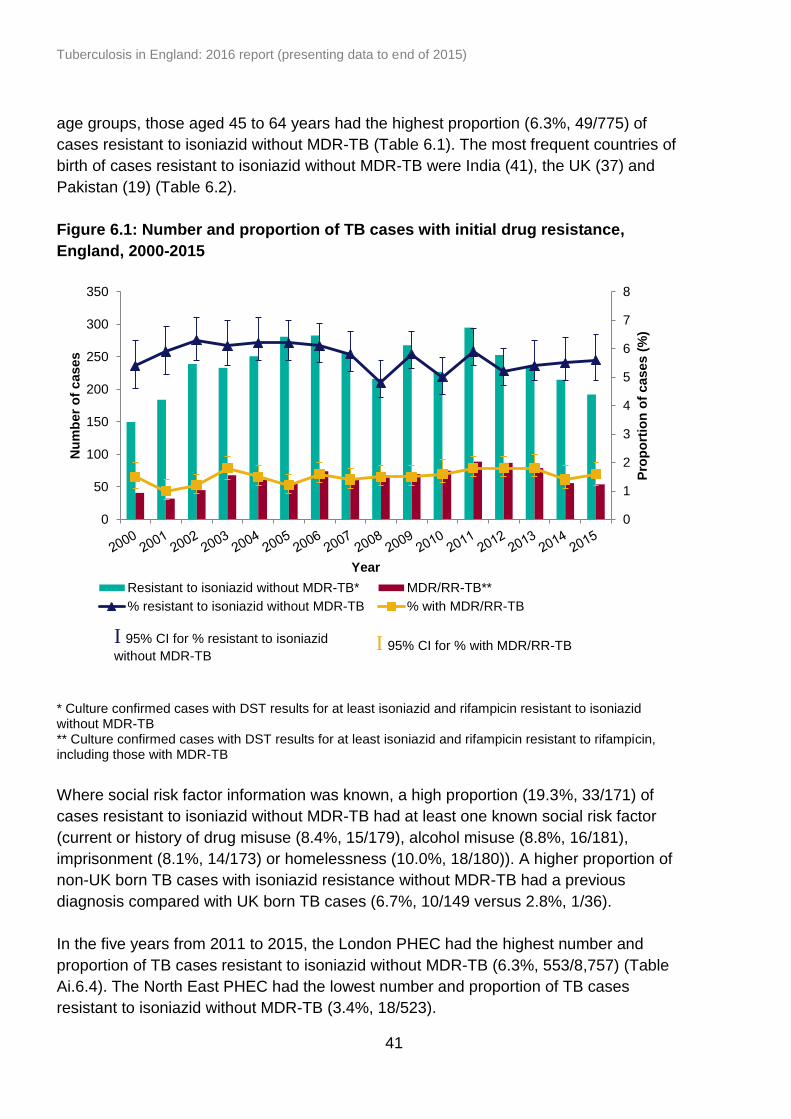
the proportion of TB cases with initial resistance to isoniazid without MDR-TB has
remained fairly stable over the past decade, at around 6%
the number (54) and proportion (1.6%) of TB cases with initial MDR/RR-TB has
decreased since the peak in 2011 (89, 1.8%)
in 2015, a high proportion of cases with resistance to isoniazid without MDR-TB
(19%) and MDR/RR-TB cases (17%) had at least one social risk factor
ten cases of XDR-TB were notified in 2015, three of whom were born in the UK;
this is the highest number of XDR-TB cases notified in one year in the last
decade
the proportion of MDR/RR-TB cases notified in 2013 who had completed
treatment by 24 months was low (58%), with many still on treatment (21%)
at the last recorded outcome, 13% of drug resistant TB cases notified in 2013
were lost to follow-up, all of which were lost to follow-up abroad, and 5% had
died.
Initial9 first line drug resistance
In 2015, drug susceptibility test (DST) results for at least isoniazid and rifampicin were
available for 99.4% (3,440/3,460) of culture confirmed notified cases, a similar
proportion to previous years (Table Ai.6.1). Of these, 6.9% (238/3,440) were resistant to
isoniazid, 1.6% (54/3,440) were resistant to rifampicin, 0.8% (27/3,436) were resistant
to ethambutol and 0.7% (24/3,388) were resistant to pyrazinamide (Table Ai.6.2). Seven
percent (7.4%, 255/3,440) were resistant to at least one first line antibiotic and 1.3%
(46/3,440) had multidrug resistant TB (MDR-TB), with resistance to at least isoniazid
and rifampicin (Table Ai.6.3).
Initial isoniazid resistance without MDR-TB
In 2015, 5.6% (192/3,440) of TB cases had initial resistance to isoniazid without MDR-
TB, which is similar to previous years (Figure 6.1, Table Ai.6.3). Compared to all other
9 Initial resistance is classed as resistance identified within three months of the first specimen date. However, cases with a
change from a sensitive to resistant result following treatment are reclassified as acquired resistance, even if this is within the
three-month period.
Tuberculosis in England: 2016 report (presenting data to end of 2015)
41
0
1
2
3
4
5
6
7
8
0
50
100
150
200
250
300
350
Pro
po
rtio
n o
f cases (
%)
Nu
mb
er
of
cases
Year
Resistant to isoniazid without MDR-TB* MDR/RR-TB**
% resistant to isoniazid without MDR-TB % with MDR/RR-TB
age groups, those aged 45 to 64 years had the highest proportion (6.3%, 49/775) of
cases resistant to isoniazid without MDR-TB (Table 6.1). The most frequent countries of
birth of cases resistant to isoniazid without MDR-TB were India (41), the UK (37) and
Pakistan (19) (Table 6.2).
Figure 6.1: Number and proportion of TB cases with initial drug resistance,
England, 2000-2015
* Culture confirmed cases with DST results for at least isoniazid and rifampicin resistant to isoniazid without MDR-TB ** Culture confirmed cases with DST results for at least isoniazid and rifampicin resistant to rifampicin, including those with MDR-TB
Where social risk factor information was known, a high proportion (19.3%, 33/171) of
cases resistant to isoniazid without MDR-TB had at least one known social risk factor
(current or history of drug misuse (8.4%, 15/179), alcohol misuse (8.8%, 16/181),
imprisonment (8.1%, 14/173) or homelessness (10.0%, 18/180)). A higher proportion of
non-UK born TB cases with isoniazid resistance without MDR-TB had a previous
diagnosis compared with UK born TB cases (6.7%, 10/149 versus 2.8%, 1/36).
In the five years from 2011 to 2015, the London PHEC had the highest number and
proportion of TB cases resistant to isoniazid without MDR-TB (6.3%, 553/8,757) (Table
Ai.6.4). The North East PHEC had the lowest number and proportion of TB cases
resistant to isoniazid without MDR-TB (3.4%, 18/523).
I 95% CI for % resistant to isoniazid
without MDR-TB
I 95% CI for % with MDR/RR-TB

Tuberculosis in England: 2016 report (presenting data to end of 2015)
42
Table 6.1: Number and proportion of TB cases with drug resistance by
characteristics, England, 2015
Characteristic
Resistant to isoniazid without
MDR-TB* MDR/RR-TB** XDR-TB
# Total
$
n % n % n % n
Sex
Female 69 5.3 23 1.8 4 0.3 1,298
Male 123 5.7 31 1.4 6 0.3 2,142
Age (years)
0-14 1 2.0 0 0.0 0 0.0 50
15-44 123 5.8 43 2.0 6 0.3 2,110
45-64 49 6.3 6 0.8 2 0.3 775
65+ 19 3.8 5 1.0 2 0.4 505
Place of birth
Non-UK born 153 6.1 48 1.9 7 0.3 2,503
UK born 37 4.3 5 0.6 3 0.3 865
At least one social risk factor
33 7.7 8 1.9 3 0.7 429
Previous TB diagnosis
11 5.9 9 4.8 1 0.5 188
* Culture confirmed cases with DST results for at least isoniazid and rifampicin who are resistant to isoniazid without MDR-TB ** Culture confirmed cases with DST results for at least isoniazid and rifampicin who are resistant to rifampicin, including those with MDR-TB # Culture confirmed cases with DST results for at least isoniazid and rifampicin who are resistant to
isoniazid and rifampicin, at least one injectable agent and at least one fluoroquinolone $ All culture confirmed cases with DST results for at least isoniazid and rifampicin
Initial multi-drug resistant/rifampicin resistant (MDR/RR) TB
The number and proportion of MDR-TB cases with initial resistance increased from
0.7% (22/3,145) in 2001 to a peak of 1.6% (81/4,967) in 2011, and has since decreased
to 1.3% (46/3,440) in 2015 (Table Ai.6.3).
TB cases with any resistance to rifampicin, including those with MDR-TB, are hereafter
referred to as multi-drug resistant/rifampicin resistant TB (MDR/RR-TB). The number
and proportion of MDR/RR-TB cases increased from 32 (1.0%) in 2001 to a peak of 89
(1.8%) in 2011, and has since decreased to 54 (1.6%) in 2015 (Figure 6.1, Table
Ai.6.3).
In 2015, the majority of MDR/RR-TB cases were aged 15 to 44 years (79.6%, 43/54)
(Table 6.1). There were no laboratory confirmed cases of MDR/RR-TB in children aged
0 to 14 years between 2013 and 2015.

Tuberculosis in England: 2016 report (presenting data to end of 2015)
43
Table 6.2: Most frequent countries of birth of TB cases with drug resistance,
England, 2015
Country of birth*
Total** Resistant to
isoniazid without MDR-TB
#
MDR/RR-TB$
n n % n %
United Kingdom 865 37 4.3 5 0.6
India 626 41 6.5 7 1.1
Pakistan 357 19 5.3 3 0.8
Somalia 110 9 8.2 2 1.8
Bangladesh 98 5 5.1 2 2.0
Romania 94 5 5.3 2 2.1
Philippines 74 8 10.8 2 2.7
Nigeria 70 6 8.6 1 1.4
Eritrea 65 2 3.1 4 6.2
Afghanistan 45 4 8.9 1 2.2
Lithuania 37 3 8.1 6 16.2
China 21 1 4.8 2 9.5
Latvia 20 8 40.0 2 10.0
* Top 13 countries of birth for cases resistant to isoniazid without MDR-TB and MDR/RR-TB cases in 2015 ** Culture confirmed cases with DST results for at least isoniazid and rifampicin # Culture confirmed cases with DST results for at least isoniazid and rifampicin who are resistant to
isoniazid without MDR-TB $ Culture confirmed cases with DST results for at least isoniazid and rifampicin who are resistant to
rifampicin, including those with MDR-TB
The majority of MDR/RR-TB cases notified in 2015 were non-UK born (90.6%, 48/53),
and for those where year of entry to the UK was known, 56.8% (25/44) had entered the
UK within the past six years. The most frequent countries of birth of MDR/RR-TB cases
were India (7), Lithuania (6) and the UK (5) (Table 6.2). Cases born in Lithuania had the
highest proportion of MDR/RR-TB (16.2%, 6/37).
The proportion of cases with MDR/RR-TB was higher in those with a previous diagnosis
of TB compared to those without (4.8%, 9/188 versus 1.3%, 42/3,114). A high
proportion of MDR/RR-TB cases in 2015 had at least one social risk factor (16.7%,
8/48).
In the five years from 2011 to 2015, London had the highest number of TB cases with
MDR/RR-TB (1.9%, 163/8,757) (Table Ai.6.4).
In 2015, in addition to the culture confirmed MDR-TB cases, six TB cases notified in
England were non-culture confirmed cases treated with an MDR-TB regimen (Table
6.3), including one child aged 0 to 14 years. One case was a contact of a culture
Tuberculosis in England: 2016 report (presenting data to end of 2015)
44
confirmed MDR-TB case, one case entered the UK having had culture and DSTs
performed abroad, one case had genotyping results to confirm drug resistant TB but the
sample could not be culture confirmed and three cases received an MDR-TB regimen
for other clinical reasons.
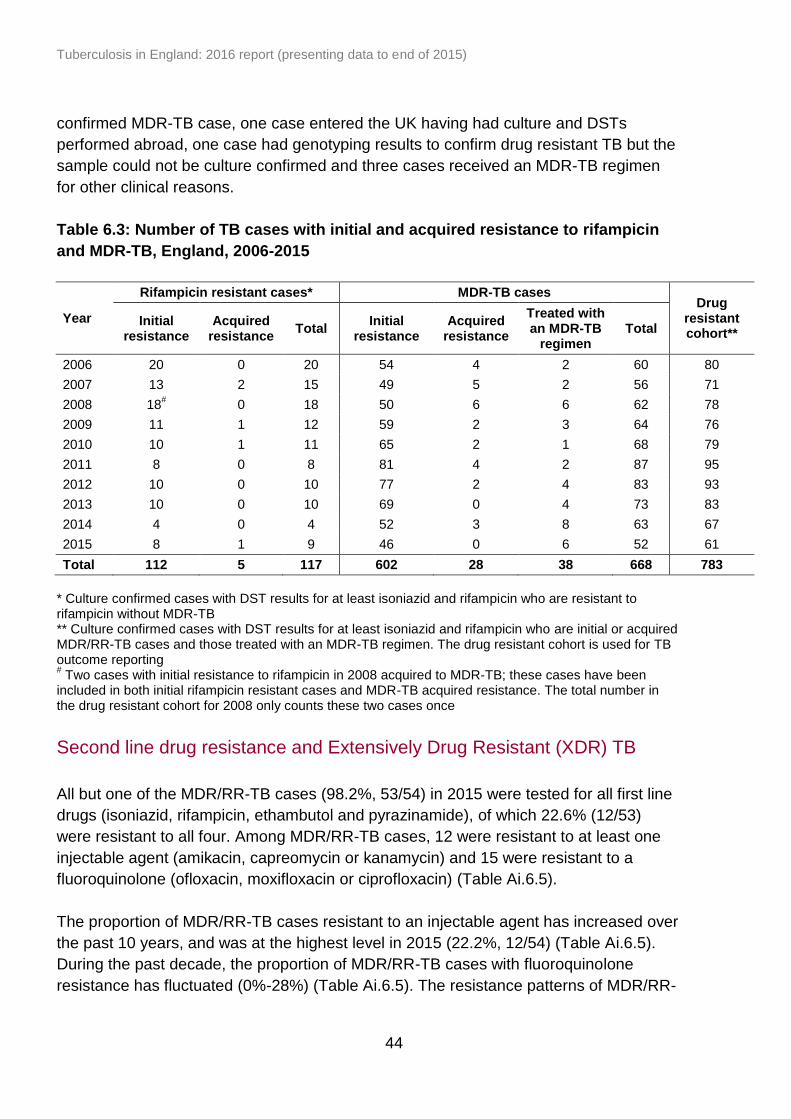
Table 6.3: Number of TB cases with initial and acquired resistance to rifampicin
and MDR-TB, England, 2006-2015
Year
Rifampicin resistant cases* MDR-TB cases Drug
resistant cohort**
Initial resistance
Acquired resistance
Total Initial
resistance Acquired
resistance
Treated with an MDR-TB
regimen Total
2006 20 0 20 54 4 2 60 80
2007 13 2 15 49 5 2 56 71
2008 18# 0 18 50 6 6 62 78
2009 11 1 12 59 2 3 64 76
2010 10 1 11 65 2 1 68 79
2011 8 0 8 81 4 2 87 95
2012 10 0 10 77 2 4 83 93
2013 10 0 10 69 0 4 73 83
2014 4 0 4 52 3 8 63 67
2015 8 1 9 46 0 6 52 61
Total 112 5 117 602 28 38 668 783
* Culture confirmed cases with DST results for at least isoniazid and rifampicin who are resistant to rifampicin without MDR-TB ** Culture confirmed cases with DST results for at least isoniazid and rifampicin who are initial or acquired MDR/RR-TB cases and those treated with an MDR-TB regimen. The drug resistant cohort is used for TB outcome reporting # Two cases with initial resistance to rifampicin in 2008 acquired to MDR-TB; these cases have been
included in both initial rifampicin resistant cases and MDR-TB acquired resistance. The total number in the drug resistant cohort for 2008 only counts these two cases once
Second line drug resistance and Extensively Drug Resistant (XDR) TB
All but one of the MDR/RR-TB cases (98.2%, 53/54) in 2015 were tested for all first line
drugs (isoniazid, rifampicin, ethambutol and pyrazinamide), of which 22.6% (12/53)
were resistant to all four. Among MDR/RR-TB cases, 12 were resistant to at least one
injectable agent (amikacin, capreomycin or kanamycin) and 15 were resistant to a
fluoroquinolone (ofloxacin, moxifloxacin or ciprofloxacin) (Table Ai.6.5).
The proportion of MDR/RR-TB cases resistant to an injectable agent has increased over
the past 10 years, and was at the highest level in 2015 (22.2%, 12/54) (Table Ai.6.5).
During the past decade, the proportion of MDR/RR-TB cases with fluoroquinolone
resistance has fluctuated (0%-28%) (Table Ai.6.5). The resistance patterns of MDR/RR-

Tuberculosis in England: 2016 report (presenting data to end of 2015)
45
16
45
6
23
3
8
19
7
4 3
18
24
20
15
12
3
10
2
4
0
2
5
1
0 0 0
10
20
30
40
50
60
70
80
90
100
Resistant to all1st line drugs**
Resistant to atleast one second
line drug#
Resistant to atleast one
injectable drug$
Resistant to atleast one
fluoroquinolone^
Extensively drugresistant-TB^^
Pro
po
rtio
n o
f M
DR
/RR
-TB
cases (
%)
India United Kingdom Lithuania Pakistan Somalia
TB cases resistant to an injectable agent or a fluoroquinolone is strongly influenced by
the country of birth of MDR/RR-TB cases each year (Figure 6.2, Table Ai.6.6).
There were ten initial XDR-TB cases notified in 2015, the highest annual number
recorded (Table Ai.6.3). The majority were aged 15 to 44 years (6/10) and non-UK born
(7/10) (Table 6.1). Of the seven non-UK born XDR-TB cases, four had entered the UK
more than 11 years prior to TB notification. All of the XDR-TB cases had pulmonary TB,
and only one had a previous history of TB diagnosis. Three of the XDR-TB cases had at
least one social risk factor reported. In 2015, three had both an epidemiological and a
molecular (MIRU-VNTR clustering) link to another XDR-TB case in England, providing
evidence that they acquired TB from recent transmission in England.
Overall between 2011 and 2015, the highest number of XDR-TB cases were born in
Lithuania (12), followed by a small number from India (3) and the UK (3) (Figure 6,2,
Table Ai.6.6).
Figure 6.2: Number* and proportion of MDR/RR-TB cases with second-line drug
resistance by most frequent country of birth, England, 2011-2015
*Number of MDR/RR-TB cases shown as data labels in figure ** Culture confirmed cases with DST results for isoniazid, rifampicin, ethambutol and pyrazinamide # Culture confirmed cases with DST results for at least isoniazid, rifampicin and at least one second line drug $ Culture confirmed cases with DST results for at least isoniazid, rifampicin and at least one injectable ^ Culture confirmed cases with DST results for at least isoniazid, rifampicin and at least one fluoroquinolone ^^ Culture confirmed cases with DST results for at least isoniazid, rifampicin and at least one injectable and at least one fluoroquinolone
Tuberculosis in England: 2016 report (presenting data to end of 2015)
46
Acquired drug resistance10 on repeat culture
Acquired drug resistance is defined as resistance identified on repeat culture after three
months of the first specimen date. In addition, cases with a change from a sensitive to
resistant result following treatment start are reclassified as acquired resistance, even if
this is within the three month period.
Six culture confirmed cases notified in 2015 had acquired resistance on repeat DST. No
cases acquired MDR-TB. However, two MDR-TB cases acquired resistance to either a
fluoroquinolone or an injectable agent to become pre-XDR TB cases.
Among cases that were notified between 2006 and 2015, 127 cases were known to
have acquired resistance while on treatment in England, of which 24.4% (31) acquired
resistance to rifampicin and 28.3% (36) acquired resistance to isoniazid. During this
time period, a total of 28 cases acquired MDR-TB (Table 6.3), of which 10 cases
acquired MDR-TB after being sensitive to all first line drugs on initial culture. Of those
with a treatment start date recorded between 2006 and 2015 (25), the median time for
cases to acquire MDR-TB after starting treatment was 260 days (range 123-363).
It should be noted that cases who acquire resistance are recorded in the year that they
were notified, not the year that they acquired resistance, therefore the numbers for
recent years may still increase for those still on treatment.
TB outcomes for the drug resistant cohort
For the purposes of TB outcome reporting, the drug resistant cohort includes MDR/RR-
TB (initial and acquired) cases, as well as those treated with an MDR-TB regimen [5].
There were 83 cases in the drug resistant cohort notified in 2013; of these, ten had
initial rifampicin resistance without MDR-TB, 69 had initial MDR-TB, of which three had
XDR-TB and four were not culture confirmed but were treated with an MDR-TB regimen
(Table 6.3). Information on 24 month TB outcome was available for all of the cases
(100.0%, 83/83) in the drug resistant cohort notified in 2013 (Table 6.4, Table Ai.6.7).
Treatment completion
Only 57.8% (48/83) of the cases in the drug resistant cohort notified in 2013 had
completed treatment within 24 months (Figure 6.3, Table 6.4, Table Ai.6.5). A further 12
cases are known to have completed treatment after 24 months, bringing overall
treatment completion for cases notified in 2013 to 72.3% (60/83) (Table 6.4, Table
Ai.6.8).
10
Referred to as “amplified resistance” in previous annual reports

Tuberculosis in England: 2016 report (presenting data to end of 2015)
47
37
39
41
30
45 40
38 48
56 48
49 42
58 46
53
59 60
64
73 60
0
10
20
30
40
50
60
70
80
90
100
2004 2005 2006 2007 2008 2009 2010 2011 2012 2013
Pro
po
rtio
n o
f cases (
%)
Year
Completed within 24 months Completed at last recorded outcome
Among drug resistant cases who were notified in 2013 and known to have completed
treatment at the last recorded outcome, 18.3% (11/60) had less than 18 months of
treatment, of which three had less than 12 months of treatment. One-fifth (20.0%,
12/60) were on treatment for more than 24 months (Table Ai.6.8, Table Ai.6.9).
Of the three XDR-TB cases notified in 2013, two had completed treatment, and one was
still on treatment at the last recorded outcome.
Table 6.4: 24-month and last recorded TB outcome for the drug resistant cohort*,
England, 2013
TB outcome At 24 months
At last recorded outcome
n % n %
Treatment completed 48 57.8 60 72.3
Died 4 4.8 4 4.8
Lost to follow-up 10 12.0 11 13.3
Still on treatment 18 21.7 5 6.0
Treatment stopped 3 3.6 3 3.6
Not evaluated** 0 0.0 0 0.0
Total 83 100.0 83 100.0
* Includes initial and acquired MDR/RR-TB and cases treated with an MDR-TB regimen ** Not evaluated includes missing, unknown and transferred out
Figure 6.3: Treatment completion for drug resistant TB cases*, England, 2004-
2013
* Includes initial and acquired MDR/RR-TB and cases treated with an MDR-TB regimen Data labels display the number of cases completing treatment
I 95% CI
Tuberculosis in England: 2016 report (presenting data to end of 2015)
48
Deaths at the last recorded TB outcome
Four (4.8%, 4/83) of the drug resistant cases notified in 2013 had died at their last
recorded outcome (Table 6.4). Three of the cases who had died were not started on
treatment. The relationship between TB and death was known for two of the cases; TB
contributed to the death of one and was incidental to the death of the other.
Lost to follow-up at last recorded TB outcome
For drug resistant cases notified in 2013, the most common reason for not completing
treatment at the last recorded TB outcome was loss to follow-up, accounting for 11
(13.3%) of the drug resistant cases (Table 6.4, Table Ai.6.8). All 11 of the cases lost to
follow-up were aged 15 to 44 years and were non-UK born, of which eight cases were
reported to have been lost to follow-up abroad (Table Ai.6.10). Ten of the 11 cases lost
to follow-up had pulmonary TB.
Tuberculosis in England: 2016 report (presenting data to end of 2015)
49
7. TB in under-served populations
Key messages
in 2015, there was an increase in both the number and proportion of TB cases
with at least one social risk factor (SRF); overall 12% (579) of TB cases had at
least one SRF in 2015 compared with 10% (538) in 2014
the proportion of UK born cases with at least one SRF (22%) was nearly three
times higher than that of non-UK born cases (8%)
a higher proportion of cases with at least one SRF had pulmonary disease (77%)
and received directly observed therapy (DOT) (56%) compared to those without
a SRF (49% and 8%, respectively)
a higher proportion of cases with at least one SRF were resistant to isoniazid
without MDR-TB (7.8%) compared to those without a SRF (5.4%)
a similar proportion of cases with at least one SRF had MDR/RR-TB (1.9%)
compared to those without a SRF (1.6%)
outcomes in drug sensitive cases with at least one SRF were worse compared to
those without a SRF; 8.6% died, 6.8% were lost to follow-up and 1.7% had their
treatment stopped, compared to 4.1%, 3.4% and 1.0%, respectively, in those
without a SRF
In the Enhanced TB Surveillance system (ETS), data is collected on the presence or
absence of four social risk factors (SRF) known to increase the risk of TB: current or
history of homelessness, imprisonment11, and drug misuse, and current alcohol misuse.
This chapter presents data for TB cases with SRFs and in addition, for TB cases who
were remanded in an immigration removal centre, identified as asylum seekers, or
unemployed. TB rates by area level deprivation are also presented (see Appendix III:
Methods). Data in this chapter, with the exception of area level deprivation, is presented
for TB cases aged 15 years and older.
Social risk factors
In 2015, among TB cases aged 15 years and older with known SRF information, 4.3%
(221/5,189) had current or a history of drug misuse, 3.9% (205/5,191) of alcohol
misuse, 4.4% (229/5,171) of homelessness, and 3.9% (198/5,033) of imprisonment
(Table Ai.7.1). In 2015, a total of 11.8% (579/4,910) of TB cases had at least one SRF,
compared with 9.8% (538/5,517) in 2014. Between 2014 and 2015, there was an
increase in both the number and proportion of cases with each of the individual SRFs
11
For London TB cases a history of imprisonment is only recorded if imprisonment was in the UK, which will lead to an
underestimate of the total number of cases with any history of imprisonment.
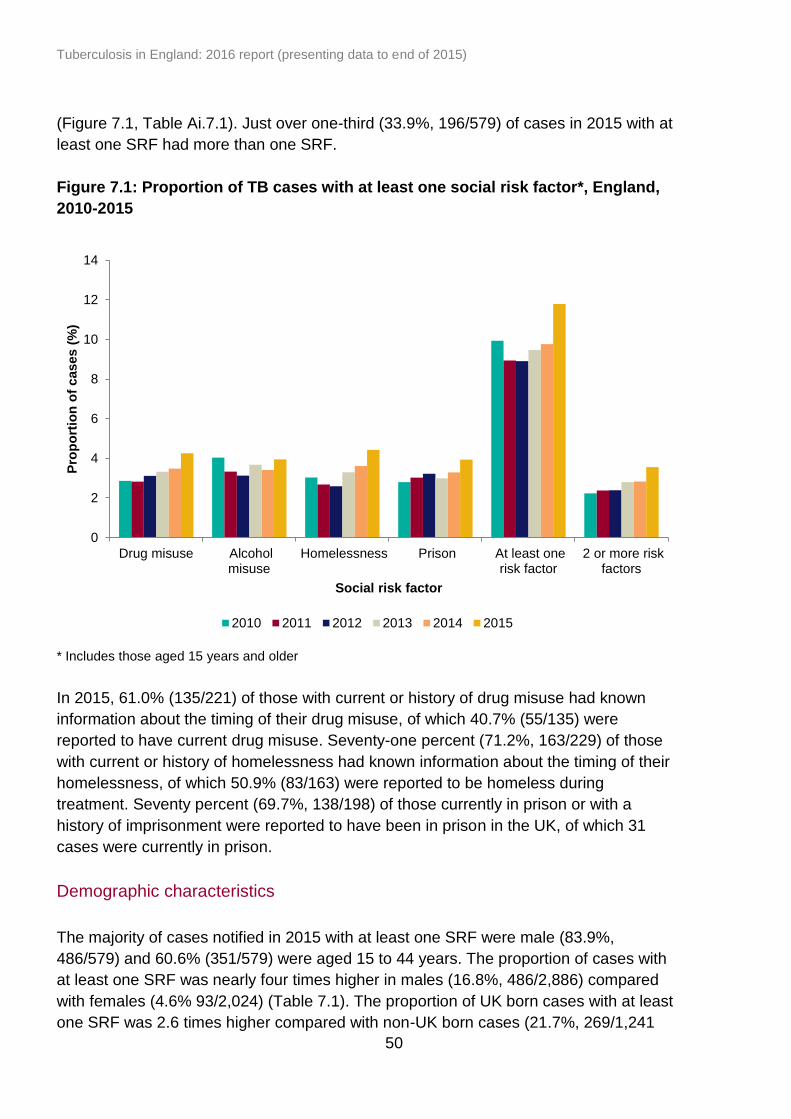
Tuberculosis in England: 2016 report (presenting data to end of 2015)
50
(Figure 7.1, Table Ai.7.1). Just over one-third (33.9%, 196/579) of cases in 2015 with at
least one SRF had more than one SRF.
Figure 7.1: Proportion of TB cases with at least one social risk factor*, England,
2010-2015
* Includes those aged 15 years and older
In 2015, 61.0% (135/221) of those with current or history of drug misuse had known
information about the timing of their drug misuse, of which 40.7% (55/135) were
reported to have current drug misuse. Seventy-one percent (71.2%, 163/229) of those
with current or history of homelessness had known information about the timing of their
homelessness, of which 50.9% (83/163) were reported to be homeless during
treatment. Seventy percent (69.7%, 138/198) of those currently in prison or with a
history of imprisonment were reported to have been in prison in the UK, of which 31
cases were currently in prison.
Demographic characteristics
The majority of cases notified in 2015 with at least one SRF were male (83.9%,
486/579) and 60.6% (351/579) were aged 15 to 44 years. The proportion of cases with
at least one SRF was nearly four times higher in males (16.8%, 486/2,886) compared
with females (4.6% 93/2,024) (Table 7.1). The proportion of UK born cases with at least
one SRF was 2.6 times higher compared with non-UK born cases (21.7%, 269/1,241
0
2
4
6
8
10
12
14
Drug misuse Alcoholmisuse
Homelessness Prison At least onerisk factor
2 or more riskfactors
Pro
po
rtio
n o
f cases (
%)
Social risk factor
2010 2011 2012 2013 2014 2015
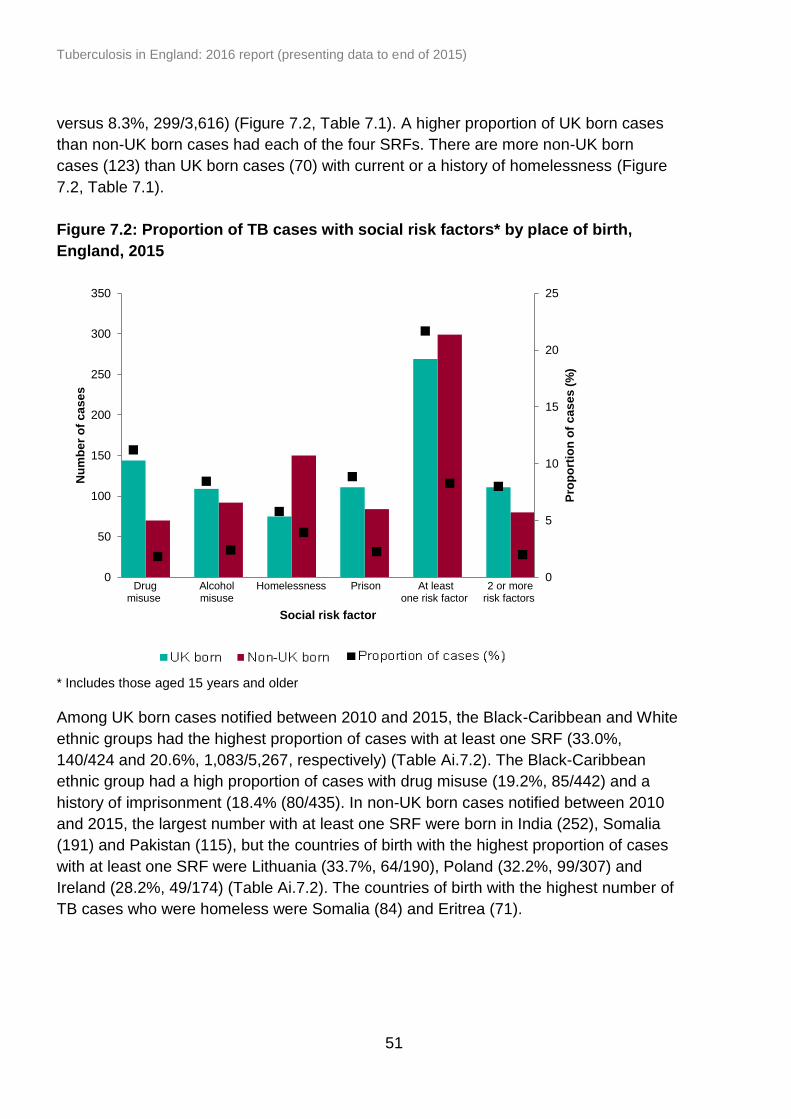
Tuberculosis in England: 2016 report (presenting data to end of 2015)
51
versus 8.3%, 299/3,616) (Figure 7.2, Table 7.1). A higher proportion of UK born cases
than non-UK born cases had each of the four SRFs. There are more non-UK born
cases (123) than UK born cases (70) with current or a history of homelessness (Figure
7.2, Table 7.1).
Figure 7.2: Proportion of TB cases with social risk factors* by place of birth,
England, 2015
* Includes those aged 15 years and older
Among UK born cases notified between 2010 and 2015, the Black-Caribbean and White
ethnic groups had the highest proportion of cases with at least one SRF (33.0%,
140/424 and 20.6%, 1,083/5,267, respectively) (Table Ai.7.2). The Black-Caribbean
ethnic group had a high proportion of cases with drug misuse (19.2%, 85/442) and a
history of imprisonment (18.4% (80/435). In non-UK born cases notified between 2010
and 2015, the largest number with at least one SRF were born in India (252), Somalia
(191) and Pakistan (115), but the countries of birth with the highest proportion of cases
with at least one SRF were Lithuania (33.7%, 64/190), Poland (32.2%, 99/307) and
Ireland (28.2%, 49/174) (Table Ai.7.2). The countries of birth with the highest number of
TB cases who were homeless were Somalia (84) and Eritrea (71).
0
5
10
15
20
25
0
50
100
150
200
250
300
350
Drug misuse
Alcohol misuse
Homelessness Prison At least one risk factor
2 or more risk factors
Pro
po
rtio
n o
f c
as
es
(%
)
Nu
mb
er
of
ca
se
s
Social risk factor
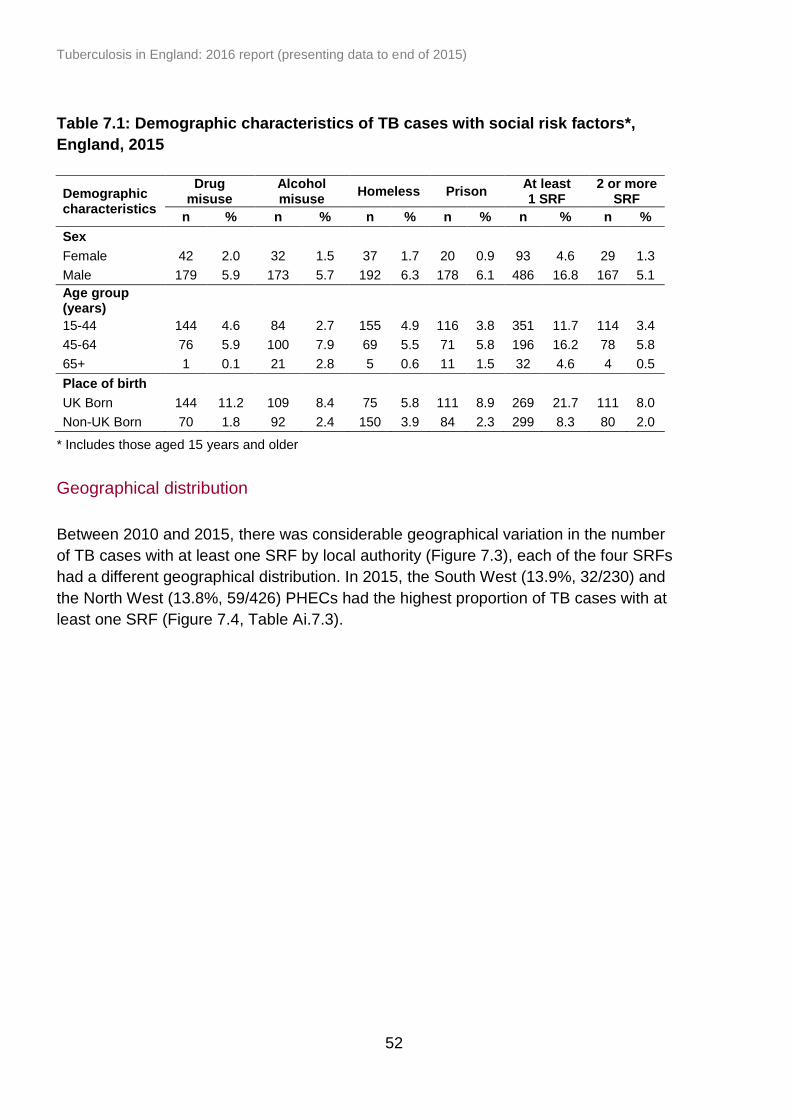
Tuberculosis in England: 2016 report (presenting data to end of 2015)
52
Table 7.1: Demographic characteristics of TB cases with social risk factors*,
England, 2015
Demographic characteristics
Drug misuse
Alcohol misuse
Homeless Prison At least 1 SRF
2 or more SRF
n % n % n % n % n % n %
Sex
Female 42 2.0 32 1.5 37 1.7 20 0.9 93 4.6 29 1.3
Male 179 5.9 173 5.7 192 6.3 178 6.1 486 16.8 167 5.1
Age group (years)
15-44 144 4.6 84 2.7 155 4.9 116 3.8 351 11.7 114 3.4
45-64 76 5.9 100 7.9 69 5.5 71 5.8 196 16.2 78 5.8
65+ 1 0.1 21 2.8 5 0.6 11 1.5 32 4.6 4 0.5
Place of birth
UK Born 144 11.2 109 8.4 75 5.8 111 8.9 269 21.7 111 8.0
Non-UK Born 70 1.8 92 2.4 150 3.9 84 2.3 299 8.3 80 2.0
* Includes those aged 15 years and older
Geographical distribution
Between 2010 and 2015, there was considerable geographical variation in the number
of TB cases with at least one SRF by local authority (Figure 7.3), each of the four SRFs
had a different geographical distribution. In 2015, the South West (13.9%, 32/230) and
the North West (13.8%, 59/426) PHECs had the highest proportion of TB cases with at
least one SRF (Figure 7.4, Table Ai.7.3).

Tuberculosis in England: 2016 report (presenting data to end of 2015)
53
Figure 7.3: Number of TB cases with at least one SRF*, drug misuse, homelessness,
imprisonment and alcohol misuse by local authority, England, 2010-2015
(box shows enlarged map of London area)
a) At least one social risk factor
Number of cases
0
1-10
11-25
26-50
51-100
>100
* Includes those aged 15 years and older Contains Ordnance Survey data © Crown copyright and database right 2015.
Contains National Statistics data © Crown copyright and database right 2015.
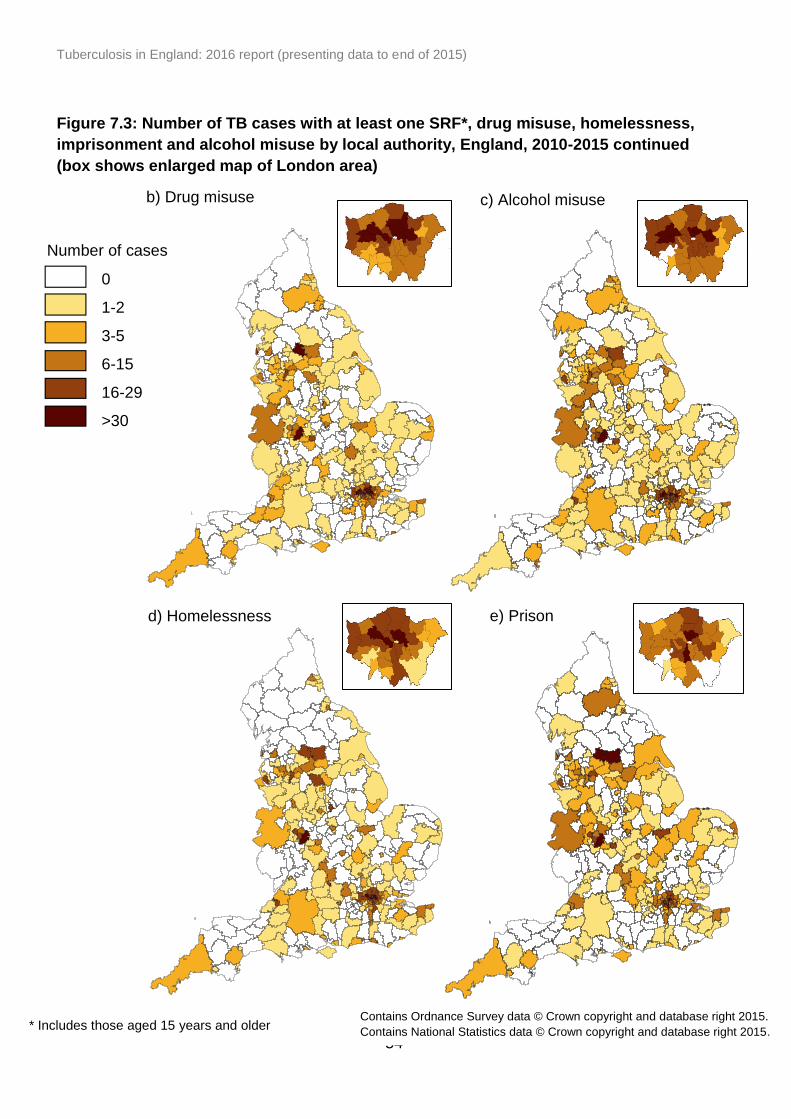
Tuberculosis in England: 2016 report (presenting data to end of 2015)
54
Figure 7.3: Number of TB cases with at least one SRF*, drug misuse, homelessness,
imprisonment and alcohol misuse by local authority, England, 2010-2015 continued
(box shows enlarged map of London area)
* Includes those aged 15 years and older
d) Homelessness
0
1-2
3-5
6-15
16-29
>30
b) Drug misuse c) Alcohol misuse
e) Prison
Number of cases
Contains Ordnance Survey data © Crown copyright and database right 2015.
Contains National Statistics data © Crown copyright and database right 2015.
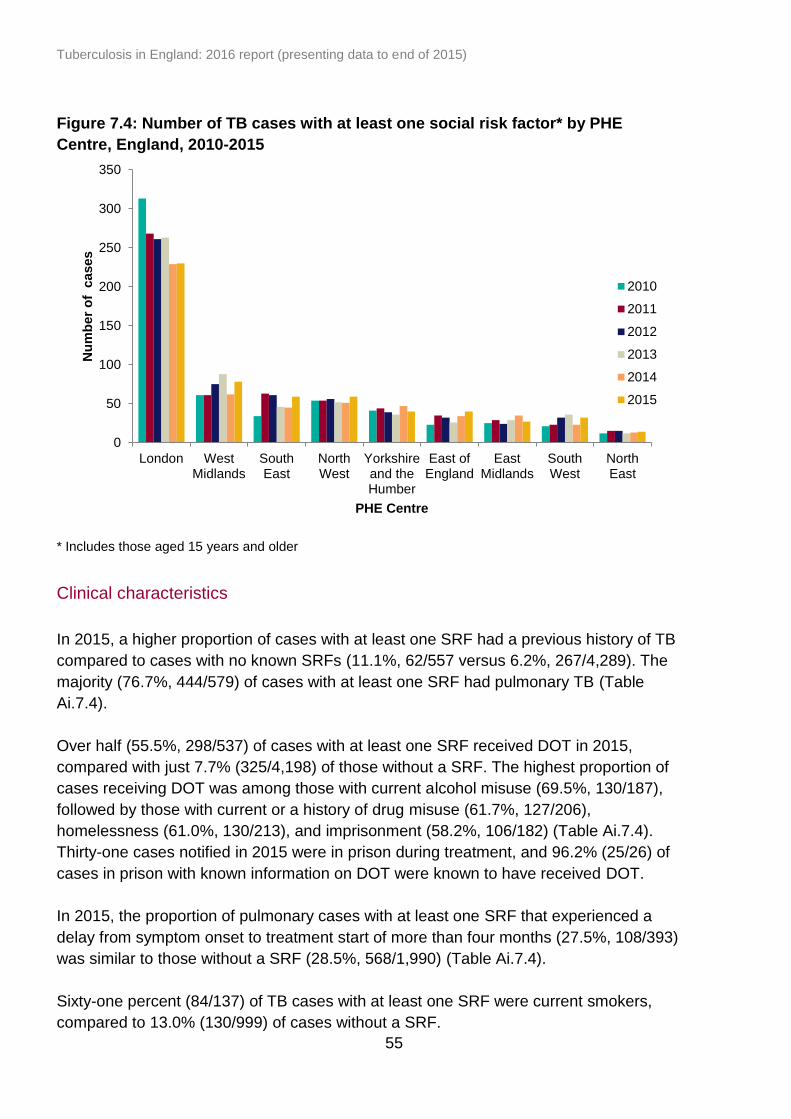
Tuberculosis in England: 2016 report (presenting data to end of 2015)
55
0
50
100
150
200
250
300
350
London WestMidlands
SouthEast
NorthWest
Yorkshireand theHumber
East ofEngland
EastMidlands
SouthWest
NorthEast
Nu
mb
er
of
cases
PHE Centre
2010
2011
2012
2013
2014
2015
Figure 7.4: Number of TB cases with at least one social risk factor* by PHE
Centre, England, 2010-2015
* Includes those aged 15 years and older
Clinical characteristics
In 2015, a higher proportion of cases with at least one SRF had a previous history of TB
compared to cases with no known SRFs (11.1%, 62/557 versus 6.2%, 267/4,289). The
majority (76.7%, 444/579) of cases with at least one SRF had pulmonary TB (Table
Ai.7.4).
Over half (55.5%, 298/537) of cases with at least one SRF received DOT in 2015,
compared with just 7.7% (325/4,198) of those without a SRF. The highest proportion of
cases receiving DOT was among those with current alcohol misuse (69.5%, 130/187),
followed by those with current or a history of drug misuse (61.7%, 127/206),
homelessness (61.0%, 130/213), and imprisonment (58.2%, 106/182) (Table Ai.7.4).
Thirty-one cases notified in 2015 were in prison during treatment, and 96.2% (25/26) of
cases in prison with known information on DOT were known to have received DOT.
In 2015, the proportion of pulmonary cases with at least one SRF that experienced a
delay from symptom onset to treatment start of more than four months (27.5%, 108/393)
was similar to those without a SRF (28.5%, 568/1,990) (Table Ai.7.4).
Sixty-one percent (84/137) of TB cases with at least one SRF were current smokers,
compared to 13.0% (130/999) of cases without a SRF.

Tuberculosis in England: 2016 report (presenting data to end of 2015)
56
Drug resistance
In 2015, 7.8% (33/422) of TB cases with at least one SRF were resistant to isoniazid
without MDR-TB compared to 5.4% (137/2,528) of those without a SRF. A similar
proportion of TB cases with at least one SRF had initial MDR/RR-TB (1.9%, 8/429),
compared to cases without a SRF (1.6%, 40/2,564).
TB outcomes
In 2014, treatment completion was lower for drug sensitive cases with at least one SRF
(75.6%, 399/528) compared to cases without a SRF (87.0%, 4,287/4,928). A higher
proportion of drug sensitive cases with at least one SRF notified in 2014 had died, were
lost to follow-up or had treatment stopped as their last recorded outcome compared to
cases with no SRFs (Table 7.2). The proportion of cases that had died at their last
recorded outcome was three times higher in those with alcohol misuse (12.9%, 25/194)
compared to those with no alcohol misuse (4.3%, 235/5,513), and double in those with
current or history of homelessness (10.6%, 22/208) than those with no history of
homelessness (4.4%, 244/5,540).
Table 7.2: Last recorded TB outcome for the entire drug sensitive cohort by social
risk factor*, England, 2014
TB outcome At least 1 SRF No SRF Total
**
n % n % N
Treatment completed 399 75.6 4,287 87.0 4,686
Died 45 8.5 203 4.1 248
Lost to follow up 36 6.8 167 3.4 203
Still on treatment 31 5.9 182 3.7 213
Treatment stopped 9 1.7 51 1.0 60
Not evaluated# 8 1.5 38 0.8 46
Total 528 100.0 4,928 100.0 5,456
* Includes those aged 15 years and older but excludes cases in drug resistant cohort ** Total cases with reported information on at least one social risk factor reported # Not evaluated includes missing, unknown and transferred out
TB Monitoring Indicator 17: Proportion of drug sensitive TB cases with at least one social risk factor who completed treatment within 12 months (England and PHEC)
For MDR/RR-TB cases notified in 2013, 62.5% (10/16) of those with at least one SRF
had completed treatment by last recorded outcome compared with 77.2% (44/57) of
those with no SRFs, although there were only a small number of cases with at least one
SRF that were drug resistant.
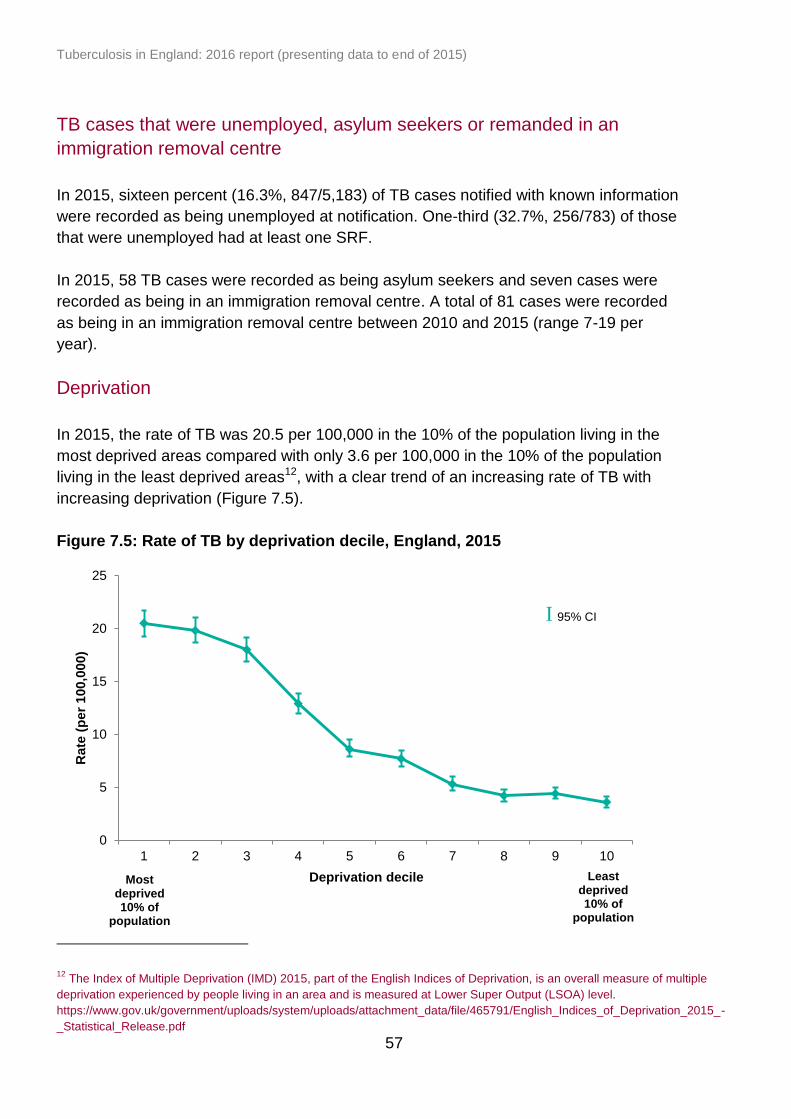
Tuberculosis in England: 2016 report (presenting data to end of 2015)
57
TB cases that were unemployed, asylum seekers or remanded in an
immigration removal centre
In 2015, sixteen percent (16.3%, 847/5,183) of TB cases notified with known information
were recorded as being unemployed at notification. One-third (32.7%, 256/783) of those
that were unemployed had at least one SRF.
In 2015, 58 TB cases were recorded as being asylum seekers and seven cases were
recorded as being in an immigration removal centre. A total of 81 cases were recorded
as being in an immigration removal centre between 2010 and 2015 (range 7-19 per
year).
Deprivation
In 2015, the rate of TB was 20.5 per 100,000 in the 10% of the population living in the
most deprived areas compared with only 3.6 per 100,000 in the 10% of the population
living in the least deprived areas12, with a clear trend of an increasing rate of TB with
increasing deprivation (Figure 7.5).
Figure 7.5: Rate of TB by deprivation decile, England, 2015
12
The Index of Multiple Deprivation (IMD) 2015, part of the English Indices of Deprivation, is an overall measure of multiple
deprivation experienced by people living in an area and is measured at Lower Super Output (LSOA) level.
https://www.gov.uk/government/uploads/system/uploads/attachment_data/file/465791/English_Indices_of_Deprivation_2015_-
_Statistical_Release.pdf
0
5
10
15
20
25
1 2 3 4 5 6 7 8 9 10
Rate
(p
er
100,0
00)
Deprivation decile Most deprived 10% of
population
Least deprived 10% of
population
I 95% CI
Tuberculosis in England: 2016 report (presenting data to end of 2015)
58
8. TB-HIV co-infection and HIV testing
among TB cases
Key messages
in 2014, 3.1% of notified TB cases were co-infected with HIV, a continuation of
the downward trend observed since the peak of 7.8% in 2003
the proportion of TB cases with HIV co-infection was highest in those aged 45 to
54 years (6.2%) and lowest in those aged 65 years and older (0.6%)
87% of TB-HIV co-infected cases notified with TB between 2010 and 2014 were
non-UK born; the majority were born in sub-Saharan African countries
94% of TB cases notified in 2014 with a previously unknown HIV status were
offered and received HIV testing; however, this was much lower for those aged 0
to 14 years (68%)
TB-HIV co-infection
HIV status is not collected in the Enhanced TB Surveillance system. To estimate TB-
HIV co-infection, TB and HIV surveillance data are matched annually for cases aged 15
years and older (see Appendix III: Methods).
The most recent year for which TB-HIV co-infection data are available for England is
2014. In 2014, 3.2% (197/6,209) of TB cases aged 15 years and older were estimated
to be co-infected with HIV (Figure 8.1, Table Ai.8.1). This is a continuation of the
downward trend observed since the peak of 8.3% in 2003.
Of the 197 TB-HIV co-infected cases in 2014, 190 were notified TB cases and seven
were un-notified MTBC positive isolates cultured in 2014 that matched to an HIV case
(see Appendix III: Methods for further information). TB-HIV co-infection varied by PHEC;
the highest proportion of co-infection among TB cases was in the East of England
(5.2%, 22/422) and the lowest in West Midlands (2.4%, 18/750) (Table Ai.8.2).
In the past decade, the age group distribution of cases with TB-HIV co-infection has
changed, with a reduction in the number of cases aged 25 to 44 years and an increase
in the number of cases aged 45 to 54 years (Figure 8.2, Table Ai.8.3). The median age
of TB-HIV co-infected cases increased over time from 34.5 years (IQR 30-41) in 2001 to
42.5 years (IQR 36-49) in 2014. In 2014, the proportion of HIV co-infection was highest
among TB cases aged 35 to 44 year olds (5.8%, 72/1,240) and 45 to 54 years (6.2%,
55/891).
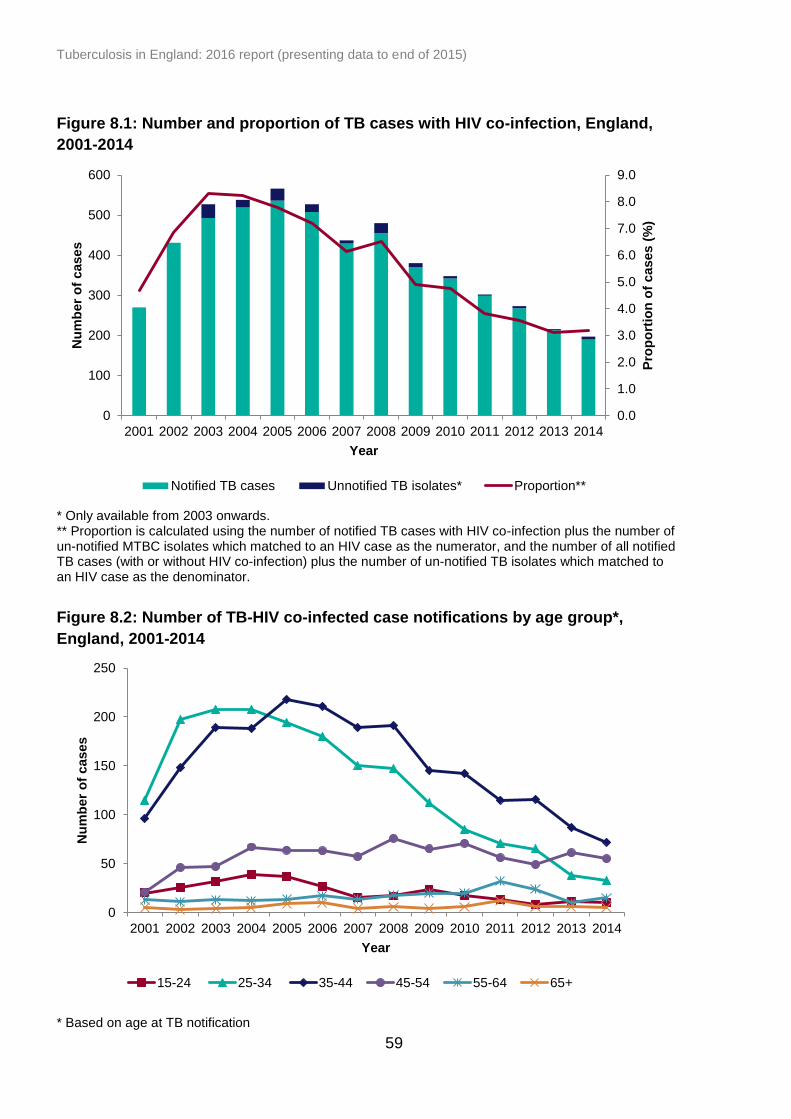
Tuberculosis in England: 2016 report (presenting data to end of 2015)
59
0.0
1.0
2.0
3.0
4.0
5.0
6.0
7.0
8.0
9.0
0
100
200
300
400
500
600
2001 2002 2003 2004 2005 2006 2007 2008 2009 2010 2011 2012 2013 2014
Year
Pro
po
rtio
n o
f cases (
%)
Nu
mb
er
of
cases
Notified TB cases Unnotified TB isolates* Proportion**
Figure 8.1: Number and proportion of TB cases with HIV co-infection, England,
2001-2014
* Only available from 2003 onwards. ** Proportion is calculated using the number of notified TB cases with HIV co-infection plus the number of un-notified MTBC isolates which matched to an HIV case as the numerator, and the number of all notified TB cases (with or without HIV co-infection) plus the number of un-notified TB isolates which matched to an HIV case as the denominator.
Figure 8.2: Number of TB-HIV co-infected case notifications by age group*,
England, 2001-2014
* Based on age at TB notification
0
50
100
150
200
250
2001 2002 2003 2004 2005 2006 2007 2008 2009 2010 2011 2012 2013 2014
Nu
mb
er
of
cases
Year
15-24 25-34 35-44 45-54 55-64 65+
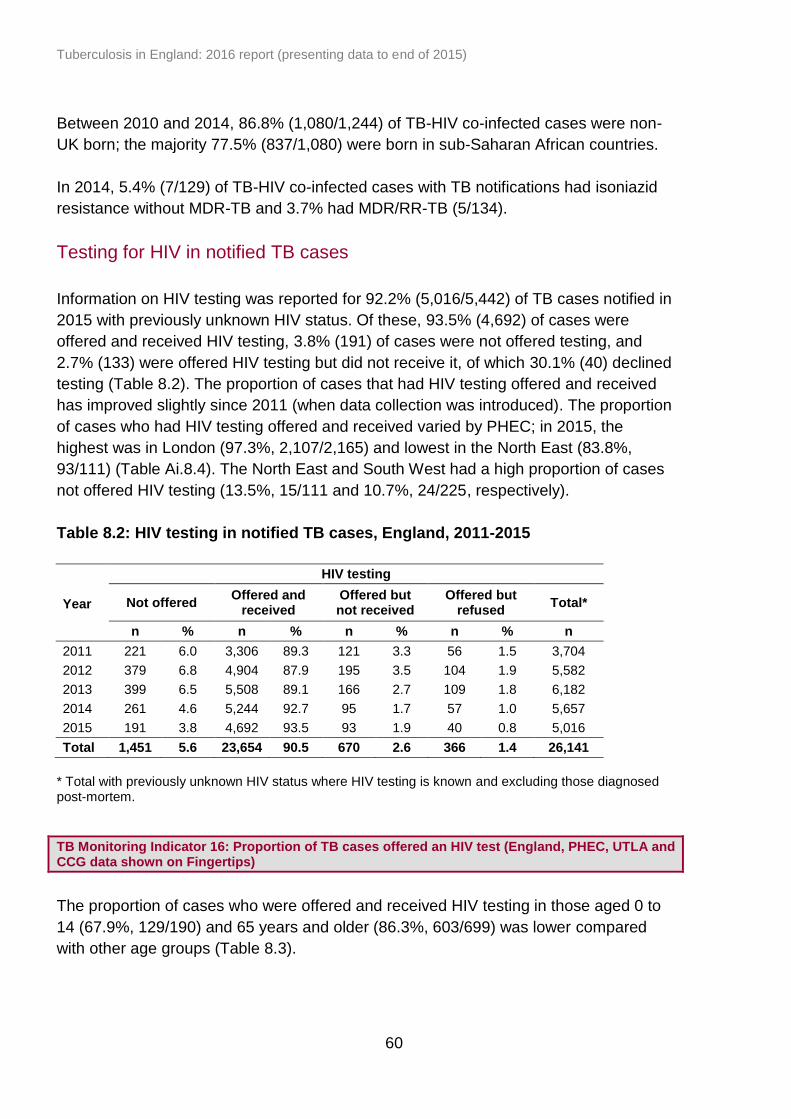
Tuberculosis in England: 2016 report (presenting data to end of 2015)
60
Between 2010 and 2014, 86.8% (1,080/1,244) of TB-HIV co-infected cases were non-
UK born; the majority 77.5% (837/1,080) were born in sub-Saharan African countries.
In 2014, 5.4% (7/129) of TB-HIV co-infected cases with TB notifications had isoniazid
resistance without MDR-TB and 3.7% had MDR/RR-TB (5/134).
Testing for HIV in notified TB cases
Information on HIV testing was reported for 92.2% (5,016/5,442) of TB cases notified in
2015 with previously unknown HIV status. Of these, 93.5% (4,692) of cases were
offered and received HIV testing, 3.8% (191) of cases were not offered testing, and
2.7% (133) were offered HIV testing but did not receive it, of which 30.1% (40) declined
testing (Table 8.2). The proportion of cases that had HIV testing offered and received
has improved slightly since 2011 (when data collection was introduced). The proportion
of cases who had HIV testing offered and received varied by PHEC; in 2015, the
highest was in London (97.3%, 2,107/2,165) and lowest in the North East (83.8%,
93/111) (Table Ai.8.4). The North East and South West had a high proportion of cases
not offered HIV testing (13.5%, 15/111 and 10.7%, 24/225, respectively).
Table 8.2: HIV testing in notified TB cases, England, 2011-2015
Year
HIV testing
Not offered Offered and
received Offered but not received
Offered but refused
Total*
n % n % n % n % n
2011 221 6.0 3,306 89.3 121 3.3 56 1.5 3,704
2012 379 6.8 4,904 87.9 195 3.5 104 1.9 5,582
2013 399 6.5 5,508 89.1 166 2.7 109 1.8 6,182
2014 261 4.6 5,244 92.7 95 1.7 57 1.0 5,657
2015 191 3.8 4,692 93.5 93 1.9 40 0.8 5,016
Total 1,451 5.6 23,654 90.5 670 2.6 366 1.4 26,141
* Total with previously unknown HIV status where HIV testing is known and excluding those diagnosed post-mortem.
TB Monitoring Indicator 16: Proportion of TB cases offered an HIV test (England, PHEC, UTLA and CCG data shown on Fingertips)
The proportion of cases who were offered and received HIV testing in those aged 0 to
14 (67.9%, 129/190) and 65 years and older (86.3%, 603/699) was lower compared
with other age groups (Table 8.3).

Tuberculosis in England: 2016 report (presenting data to end of 2015)
61
Table 8.3: HIV testing in notified TB cases by age group, England, 2015
Age group (years)
HIV testing
Not offered Offered and
received Offered but not received
Offered but refused
Total*
n % n % n % n % n
0-14 55 28.9 129 67.9 4 2.1 2 1.1 190
15-44 44 1.5 2,855 96.6 38 1.3 17 0.6 2,954
45-64 30 2.6 1,105 94.2 25 2.1 13 1.1 1,173
65+ 62 8.9 603 86.3 26 3.7 8 1.1 699
Total 191 3.8 4,692 93.5 93 1.9 40 0.8 5,016
* Total with previously unknown HIV status where HIV testing is known and excluding those diagnosed post-mortem.
Tuberculosis in England: 2016 report (presenting data to end of 2015)
62
9. BCG vaccination
Key messages
this is the first year that PHE is publishing BCG vaccine coverage estimates,
based on experimental data from Child Health Information Systems (CHISs) for
areas offering a universal neonatal programme
universal vaccination at birth is recommended for infants living in high TB
incidence, elsewhere BCG is recommended to high risk individuals (selective
programme); we report coverage only for universal vaccination programme areas
there are 11 high incidence areas in the UK, where universal vaccination is
recommended; nine of these are in London, although there is a recommendation
for a universal programme for all 32 London local authorities (LAs)
estimated BCG coverage in London ranged from 32% to 92% in high incidence
LAs
of two LAs outside London with high TB incidence, one had a universal BCG
programme in 2015
of all TB cases notified in 2015, the vaccination status was known in 69%
(3,977/5,758)
of all TB cases with known vaccination status, 71% (2,832/3,977) had been
previously vaccinated and 70% (133/190) of TB cases aged 0 to 14 were
vaccinated
BCG vaccine coverage data
The BCG immunisation programme is a risk-based programme. The vaccine is
recommended for individuals at higher risk of exposure to TB, particularly to protect
against serious forms of disease in infants [6]. In addition to this selective approach all
infants (0-12 months old) living in an area where the incidence of TB is greater than 40
per 100,000 should be offered BCG vaccine [6]. Because of large cross-boundary
movements, a decision was taken to offer universal vaccination across all London
boroughs.
From April 2015, as part of the COVER (Cover of Vaccination Evaluated Rapidly)
programme, neonatal BCG has been included in the data extraction template from local
Child Health Information Systems (CHISs), alongside extraction of coverage data for
other vaccines offered under the age of five years of age. This provides an opportunity
for BCG vaccine coverage to be estimated for local authorities offering a universal
neonatal programme [7]. It is not possible to calculate coverage for the selective
programme offered in the rest of England as the denominator is not defined in the CHIS.

Tuberculosis in England: 2016 report (presenting data to end of 2015)
63
BCG coverage is measured as the number of babies who receive vaccination at first
birthday out of all babies recorded in the CHISs for each given local authority.
There were 11 local authorities in England with a TB incidence greater than 40 per
100,000 in the period 2012-14. Of these, 10 reported offering a universal BCG
programme in 2015. In London, all local authorities reported offering universal BCG, as
part of the London-wide universal vaccination. Based on data submitted by CHISs to
COVER, estimated coverage among the nine London local authorities with high TB
incidence, ranged from 32.3% to 91.6%, whereas in the remaining London 24 local
authorities who reported having a universal programme it ranged from 2.4% to 94.7%
(Table 9.1).
Since the COVER returns for BCG have only been recently established, data is of
variable quality. Estimates of low coverage may therefore in part reflect poor data
quality, and future reports may provide more robust estimates. Since we report on the
birth cohort 1 April 2014 and 31 March 2015, the shortage of BCG vaccine from May
2015 would have had limited impact on BCG coverage.
BCG vaccination status of TB cases
BCG vaccination status is recorded for TB case notifications in the Enhanced
Tuberculosis Surveillance system (ETS).
In 2015, information on BCG vaccination status was known for 69.1% (3,977/5,758) of
cases, of which 71.2% (2,832/3,977) had previously received BCG vaccination. Seventy
percent (70.0%, 133/190) of the cases aged 0 to 14 years had received BCG
vaccination. Where vaccination status was known, the proportion of children who had
received BCG vaccination was similar for non-UK born (69.6%, 32/46) and UK born
children (70.6%, 101/143).

Tuberculosis in England: 2016 report (presenting data to end of 2015)
64
Table 9.1: BCG vaccine coverage estimates from CHISs for upper tier local
authorities, England, April 2015 to March 2016
Upper Tier Local Authority
TB rate (per 100,000) 2012-14 estimates*
Number of eligible children (1st birthday
in 2015-16)**
Proportion of universal BCG
coverage from CHIS (%)
(a) TB incidence ≥40/100,00 and universal BCG vaccination policy
Newham 100.0 5,711 91.2
Brent 82.9 4,672 32.3
Ealing 65.3 5,059 59.3
Hounslow 64.0 3,931 87.4
Harrow 60.4 3,327 40.1
Slough 51.5 2,384 not available
Redbridge 50.5 4,607 81.7
Greenwich 42.0 4,483 82.1
Hillingdon 41.9 4,138 73.2
Waltham Forest 41.3 4,521 87.4
(b) TB incidence ≥40/100,00 and selective BCG vaccination policy
Leicester 48.0 5,207 selective programme
(c) Other London boroughs with incidence <40/100,000 and universal BCG policy
Tower Hamlets 38.3 4,290 91.6
Barking and Dagenham 35.0 3,640 70.1
Haringey 33.2 3,940 15.2
Hackney 32.4 4,335 68.3
Southwark 31.7 4,384 not available
Merton 29.6 2,903 28.7
Islington 29.3 2,667 77.2
Croydon 27.6 5,629 not available
Lambeth 26.6 4,686 not available
Lewisham 25.9 4,473 69.6
Hammersmith and Fulham 24.2 2,385 39.2
Westminster 24.0 2,647 41.9
Barnet 23.2 5,377 37.9
Enfield 22.5 4,388 2.4
Kensington and Chelsea 22.2 2,325 42.0
Camden 21.8 2,483 77.7
Wandsworth 21.7 5,180 50.8
Kingston upon Thames 15.8 2,566 21.7
Sutton 13.3 2,701 28.7
City of London 12.9 59 37.3
Havering 10.9 3,275 26.5
Bexley 10.7 3,106 61.8
Bromley 8.1 4,102 24.1
Richmond upon Thames 5.9 2,592 34.0
* Based 2012-14 TB rates, on which the BCG vaccination programme was based, as published in last year’s annual report ** Cohort born between 1
st April 2014 and 31
st March 2015
Tuberculosis in England: 2016 report (presenting data to end of 2015)
65
10. Latent TB infection testing and
treatment
Key messages
the national roll-out of the systematic latent TB infection (LTBI) testing and
treatment of eligible new migrants started in April 2015, prioritising 59 high TB
burden clinical commissioning groups (CCGs) in England
as of June 2016, 30 CCGs in England started to systematically test and treat
eligible populations for LTBI
among the 22 CCGs where information was available, 5,622 eligible persons
were identified, of which 2,904 (51%) were tested
Implementing systematic LTBI testing and treatment in England
The roll-out of the national systematic testing and treatment of new migrants for LTBI
began in April 2015 by prioritising 59 out of 209 CCGs with the highest incidence and
burden of TB in England13. Eligibility for the national LTBI testing programme is limited
to persons aged 16 to 35 years, who entered the UK from a high incidence country
(≥150/100,000 or sub-Saharan Africa) within the last five years and been previously
living in that high incidence country for six months or longer.
Persons eligible for testing are primarily identified by GP practices either prospectively
during the new patient registration process or retrospectively through searches in GP
clinical system. A small number of CCGs use community or secondary care services for
identification. Tests used for the national programme include one of two commercial
interferon gamma release assays (IGRAs) – QuantiFERON-TB Gold In Tube® (QFT,
Cellestis) or T-Spot.TB® (Oxford Immunotec). Laboratory testing providers were
selected for each CCG area following a national NHS procurement process and
establishing a laboratory provider framework [8]. As per national programme clinical
guidelines, persons with a positive IGRA test result are referred to secondary care to
rule out active TB disease and to initiate treatment for LTBI [9].
LTBI data collection and information governance
The data presented in this chapter is preliminary and was reported from 22 CCGs
representing four TB control board areas in England. Clinical and demographic
13
High TB incidence is defined as incidence more than 20.0 per 100,000 and high TB burden is defined as 0.5% of
TB case burden or more in England

Tuberculosis in England: 2016 report (presenting data to end of 2015)
66
information was available from GP clinical systems (EMISWeb and SystmOne) and data
was collected using bespoke clinical templates. Treatment data from secondary care
was reported to PHE using either a secure PHE web-based portal or a bespoke MS
Excel worksheet, which was securely sent to PHE.
In February 2016, the national LTBI programme received an Information Standard
notice (SCCI2108) from the Standardisation Committee for Care Information (SCCI)
[10]. The collection was accepted as mandatory under Regulation 3 of the Health
Service (Control of Patient Information) Regulations 2002 (as made under section 60 of
the Health and Social Care Act 2001 and amended by section 251 of the NHS Act
2006). The data allows for the monitoring and evaluation of the effectiveness and safety
of the programme.
The data presented in this chapter is only a subset of LTBI screening activities, because
no data is presented from previous LTBI pilots (see previous annual report) [11] and
Newham data is restricted to activities among 16 to 35 year olds from April 2015. In
addition, a number of areas with larger screening volumes have not yet submitted data
and only some outcome data is available.
LTBI data limitations
In this early phase of the programme it is important to note that there are several
limitations to the data presented here. The data should therefore be interpreted with
caution. Much of the data comes from Newham CCG, which was the programme’s pilot
site, and outcomes for the national indicators may not be generalisable to the rest of
England, particularly considering differences in treatment settings (e.g. treatment in
primary care). In addition, and perhaps more importantly, recording of key variables
such as laboratory test results in GP clinical systems was not optimal, with a lot of
missing data. Data from laboratory services is not currently routinely collected by PHE,
therefore could not be used to assess completeness of records in GP clinical systems
for England overall.
Further analysis on data completeness by CCG and TB control area will be presented
once more robust national LTBI data is available.
CCG implementation status
NHS England has allocated £10 million for each of the financial years (FY) 2015/16 and
2016/2017 to support delivery of the LTBI programme. The first CCG to be funded was
Newham, which in 2015 reported the highest incidence of TB in England with a rate of
86.4 per 100,000 (Table Aii.1.2). Newham also served as a pilot site for the national
programme and received its funding in April 2015. Between May and October 2015 the
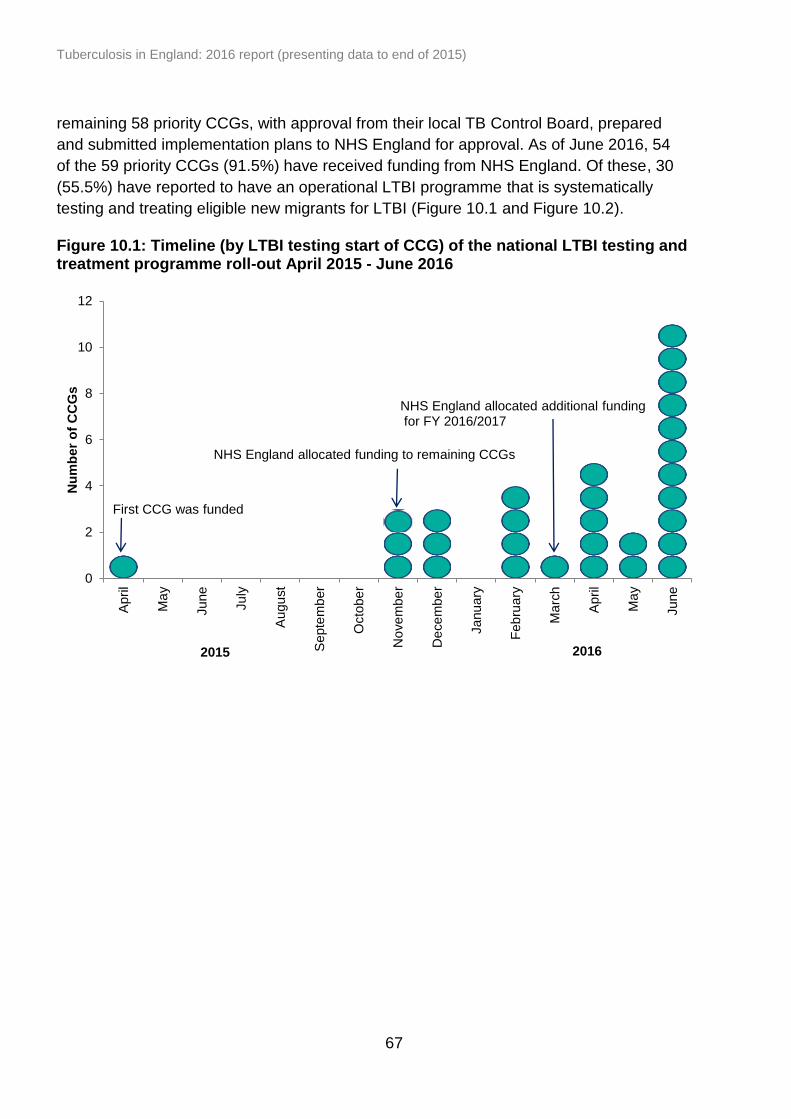
Tuberculosis in England: 2016 report (presenting data to end of 2015)
67
0
2
4
6
8
10
12
April
Ma
y
June
July
Augu
st
Septe
mb
er
Octo
be
r
No
ve
mbe
r
De
ce
mbe
r
Janu
ary
Feb
ruary
Ma
rch
April
Ma
y
June
Nu
mb
er
of
CC
Gs
2016 2015
First CCG was funded
NHS England allocated funding to remaining CCGs
NHS England allocated additional funding for FY 2016/2017
remaining 58 priority CCGs, with approval from their local TB Control Board, prepared
and submitted implementation plans to NHS England for approval. As of June 2016, 54
of the 59 priority CCGs (91.5%) have received funding from NHS England. Of these, 30
(55.5%) have reported to have an operational LTBI programme that is systematically
testing and treating eligible new migrants for LTBI (Figure 10.1 and Figure 10.2).
Figure 10.1: Timeline (by LTBI testing start of CCG) of the national LTBI testing and treatment programme roll-out April 2015 - June 2016

Tuberculosis in England: 2016 report (presenting data to end of 2015)
68
Figure 10.2: Status of national systematic LTBI testing and treatment programme by CCG, 2015-2016
Contains Ordnance Survey data © Crown copyright and database right 2015
LTBI Indicator 1: The number of CCGs that have a systematic new entrant LTBI testing and treatment initiative in place (England)
LTBI programme implementation status by priority
CCG as of June 2016
Operational
Not operational yet
Non priority CCGs operational yet
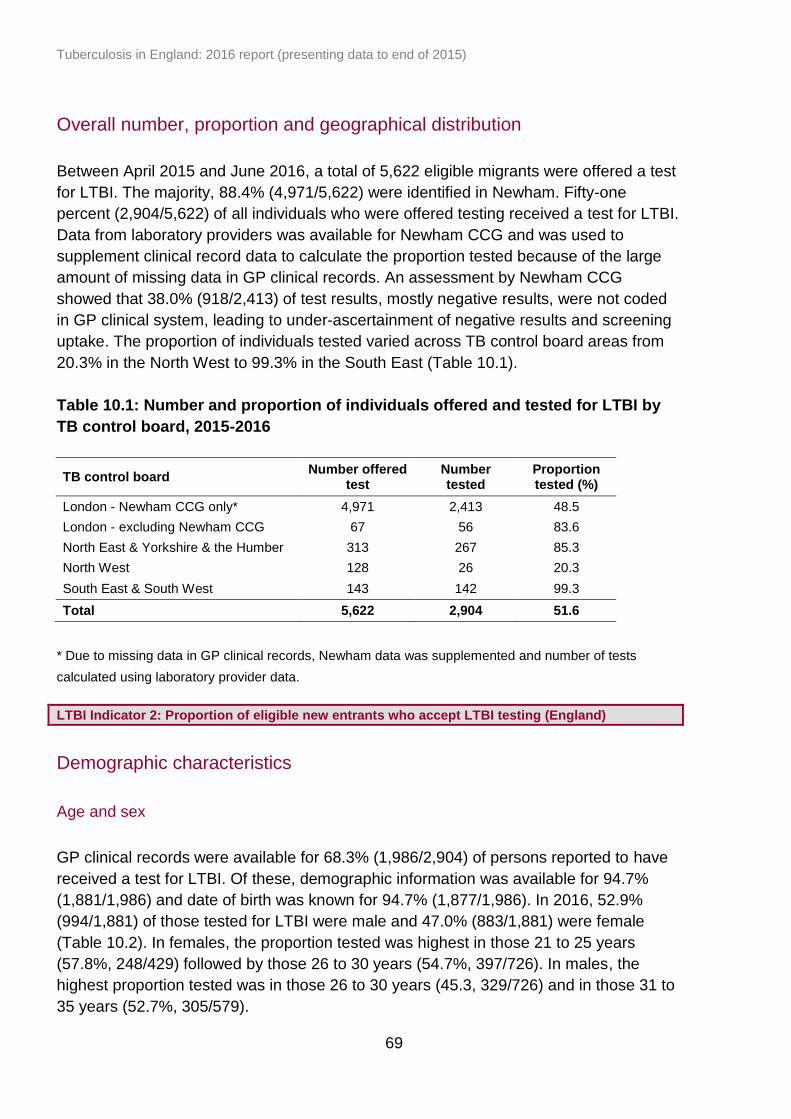
Tuberculosis in England: 2016 report (presenting data to end of 2015)
69
Overall number, proportion and geographical distribution
Between April 2015 and June 2016, a total of 5,622 eligible migrants were offered a test
for LTBI. The majority, 88.4% (4,971/5,622) were identified in Newham. Fifty-one
percent (2,904/5,622) of all individuals who were offered testing received a test for LTBI.
Data from laboratory providers was available for Newham CCG and was used to
supplement clinical record data to calculate the proportion tested because of the large
amount of missing data in GP clinical records. An assessment by Newham CCG
showed that 38.0% (918/2,413) of test results, mostly negative results, were not coded
in GP clinical system, leading to under-ascertainment of negative results and screening
uptake. The proportion of individuals tested varied across TB control board areas from
20.3% in the North West to 99.3% in the South East (Table 10.1).
Table 10.1: Number and proportion of individuals offered and tested for LTBI by
TB control board, 2015-2016
TB control board Number offered
test Number tested
Proportion tested (%)
London - Newham CCG only* 4,971 2,413 48.5
London - excluding Newham CCG 67 56 83.6
North East & Yorkshire & the Humber 313 267 85.3
North West 128 26 20.3
South East & South West 143 142 99.3
Total 5,622 2,904 51.6
* Due to missing data in GP clinical records, Newham data was supplemented and number of tests
calculated using laboratory provider data.
LTBI Indicator 2: Proportion of eligible new entrants who accept LTBI testing (England)
Demographic characteristics
Age and sex
GP clinical records were available for 68.3% (1,986/2,904) of persons reported to have
received a test for LTBI. Of these, demographic information was available for 94.7%
(1,881/1,986) and date of birth was known for 94.7% (1,877/1,986). In 2016, 52.9%
(994/1,881) of those tested for LTBI were male and 47.0% (883/1,881) were female
(Table 10.2). In females, the proportion tested was highest in those 21 to 25 years
(57.8%, 248/429) followed by those 26 to 30 years (54.7%, 397/726). In males, the
highest proportion tested was in those 26 to 30 years (45.3, 329/726) and in those 31 to
35 years (52.7%, 305/579).

Tuberculosis in England: 2016 report (presenting data to end of 2015)
70
Table 10.2: Persons tested for LTBI by age group and sex, England, 2015-2016
Age groups (years)
Female Male Total
n % n % n %
16-20 75 52.4 68 47.6 143 7.6
21-25 248 57.8 181 42.2 429 22.9
26-30 397 54.7 329 45.3 726 38.7
31-35 274 47.3 305 52.7 579 30.8
Total 994 52.9 883 47.0 1,877 100.0
Place of birth
Place of birth was known for 92.3% (1,834/1,985) of individuals tested for LTBI. India,
Bangladesh and Pakistan were the most frequent countries of birth and accounted for
36.6% (671/1,834), 22.2% (407/1,834) and 16.1% (295/1,834), respectively (Table
10.3).
Table 10.3: Most frequent countries of birth for individuals with LTBI, 2015-2016
Country of birth* Number Proportion (%)
India 671 36.6
Bangladesh 407 22.2
Pakistan 295 16.1
Nigeria 139 7.6
Pakistan 70 3.8
Ghana 46 2.5
Afghanistan 38 2.1
Somalia 24 1.3
Philippines 21 1.1
Nepal 20 1.1
Other (each <1%) 103 5.6
Total 1,834 100.0
* Where country of birth was known
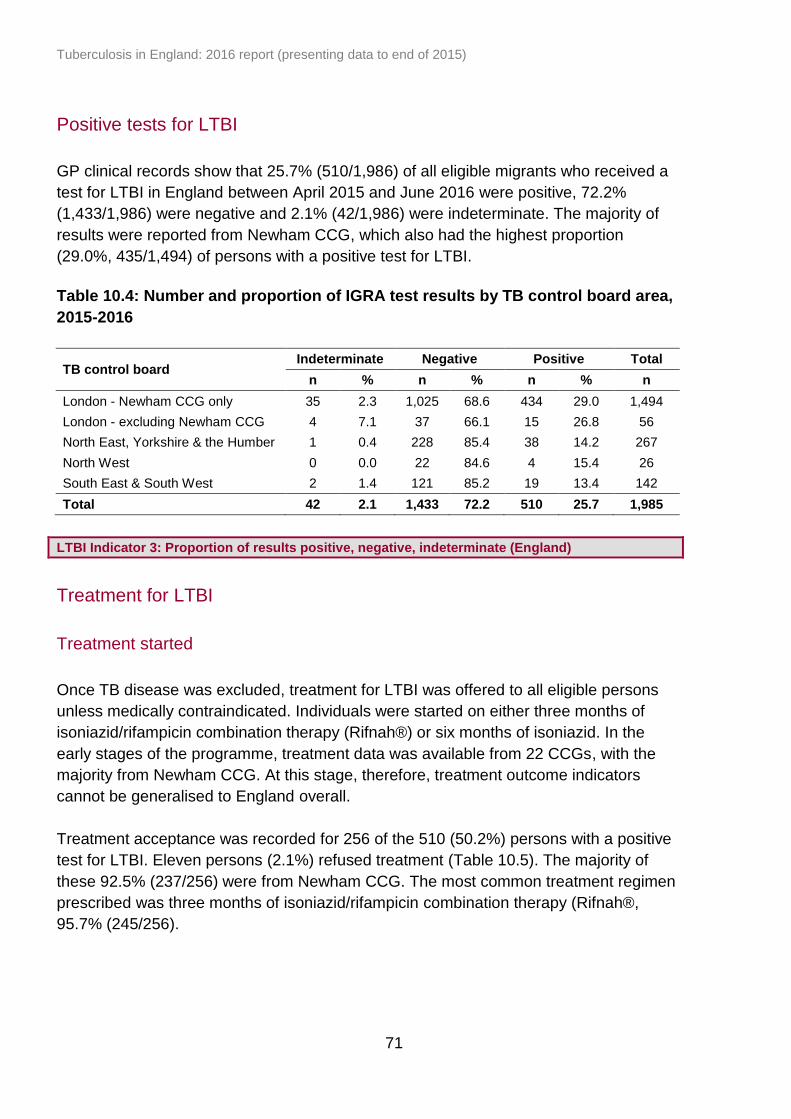
Tuberculosis in England: 2016 report (presenting data to end of 2015)
71
Positive tests for LTBI
GP clinical records show that 25.7% (510/1,986) of all eligible migrants who received a
test for LTBI in England between April 2015 and June 2016 were positive, 72.2%
(1,433/1,986) were negative and 2.1% (42/1,986) were indeterminate. The majority of
results were reported from Newham CCG, which also had the highest proportion
(29.0%, 435/1,494) of persons with a positive test for LTBI.
Table 10.4: Number and proportion of IGRA test results by TB control board area,
2015-2016
TB control board Indeterminate Negative Positive Total
n % n % n % n
London - Newham CCG only 35 2.3 1,025 68.6 434 29.0 1,494
London - excluding Newham CCG 4 7.1 37 66.1 15 26.8 56
North East, Yorkshire & the Humber 1 0.4 228 85.4 38 14.2 267
North West 0 0.0 22 84.6 4 15.4 26
South East & South West 2 1.4 121 85.2 19 13.4 142
Total 42 2.1 1,433 72.2 510 25.7 1,985
LTBI Indicator 3: Proportion of results positive, negative, indeterminate (England)
Treatment for LTBI
Treatment started
Once TB disease was excluded, treatment for LTBI was offered to all eligible persons
unless medically contraindicated. Individuals were started on either three months of
isoniazid/rifampicin combination therapy (Rifnah®) or six months of isoniazid. In the
early stages of the programme, treatment data was available from 22 CCGs, with the
majority from Newham CCG. At this stage, therefore, treatment outcome indicators
cannot be generalised to England overall.
Treatment acceptance was recorded for 256 of the 510 (50.2%) persons with a positive
test for LTBI. Eleven persons (2.1%) refused treatment (Table 10.5). The majority of
these 92.5% (237/256) were from Newham CCG. The most common treatment regimen
prescribed was three months of isoniazid/rifampicin combination therapy (Rifnah®,
95.7% (245/256).

Tuberculosis in England: 2016 report (presenting data to end of 2015)
72
Table 10.5: LTBI treatment acceptance* status England, 2015-2016
Treatment status for LTBI Number Proportion (%)
Accepted 256 50.2
Refused 11 2.1
Total 267 52.3
* Where a treatment status was recorded GP clinical systems
LTBI Indicator 4: The proportion of persons who take up treatment amongst those who have been offered it (England) LTBI Indicator 5: Proportion of individuals who complete LTBI treatment amongst those who start (England)
As most CCGs have recently started implementation of LTBI programmes treatment
completion data will come through in the autumn of 2016. Treatment completion data
was available from Newham which is a primary care based programme and treatment is
managed by accredited pharmacies. This is in contrast to most other CCGs where
treatment takes place in secondary care.
Treatment information from Webstar Health, a pharmacy information and management
system was used to calculate treatment completion rate for Newham CCG for 2015-16.
Of the 237 person who accepted treatment, 59.9% (142/237) had a record of starting
treatment. Of these, 57.0%, (81/142) completed a full course of treatment for LTBI.
Nationally, significant adverse reaction to LTBI treatment was reported for one person
(<1% of the 142 persons with records on started treatment).
LTBI Indicator 6. The proportion of persons who experience significant drug events amongst those who initiated treatment (England)
Tuberculosis in England: 2016 report (presenting data to end of 2015)
73
11. UK tuberculosis pre-entry screening
programme
Key messages
all long term visa applicants (> 6 months) from countries with an estimated
incidence of 40 per 100,000 or above are required to undergo screening for
active pulmonary TB prior to entry to the UK
over one million screening episodes were recorded to have taken place between
October 2005 and December 2015
a total of 382 TB cases were detected through pre-entry screening in 2015
as more cases were detected overseas, the number of prevalent pulmonary TB
cases notified in the UK (within one year of entry to the UK) from countries within
the pre-entry scheme decreased from 380 in 2006 to 88 in 2015
Based on a successful pilot in 15 high TB incidence countries carried out in
collaboration with the International Organisation of Migration (IOM) between 2005 and
2012, the UK replaced port based on-entry screening with pre-entry screening. The
global roll-out of pre-entry screening to 101 high incidence countries took place between
September 2012 and March 2014, when on-entry screening ceased. This chest x-ray
based active pulmonary TB screening is mandatory for all migrants from countries with
a TB incidence over 40 per 100,000 who apply for a UK visa for more than six months
and is carried out by appointed panel clinics either in the country of origin or in
neighbouring countries [12].
The number of applicants screened and the number of TB cases detected has
increased as more countries have joined the TB pre-entry scheme. A total of 1,217,842
screening episodes took place between October 2005 and December 2015, with
256,115 performed in 2015. In 2015, the majority of applicants were female (56.0%,
118,316/211,261) and 44.0% (92,945/211,261) were male (where sex was known). The
majority of applicants were young adults, aged 15 to 34 years old (77.3%,
164,661/212,933) (where age was known). The largest number of screening episodes
took place in China (27.3%, 69,845), India (16.6%, 42,431), Pakistan (8.6%,
22,043/256,115) and South Korea (6.1%, 15,608).
In total, 382 TB cases were detected in 2015, giving an overall TB yield of 149.2 per
100,000 applications. The TB rate was similar for female and male applicants. The
majority of TB cases were found among applicants aged 15 to 34 years old (46.6%,
178/382) although older age groups had higher TB rates (108.1 per 100,000 in 15-34
year olds versus 658.1 per 100,000 in those aged 55 or over). The number of TB cases
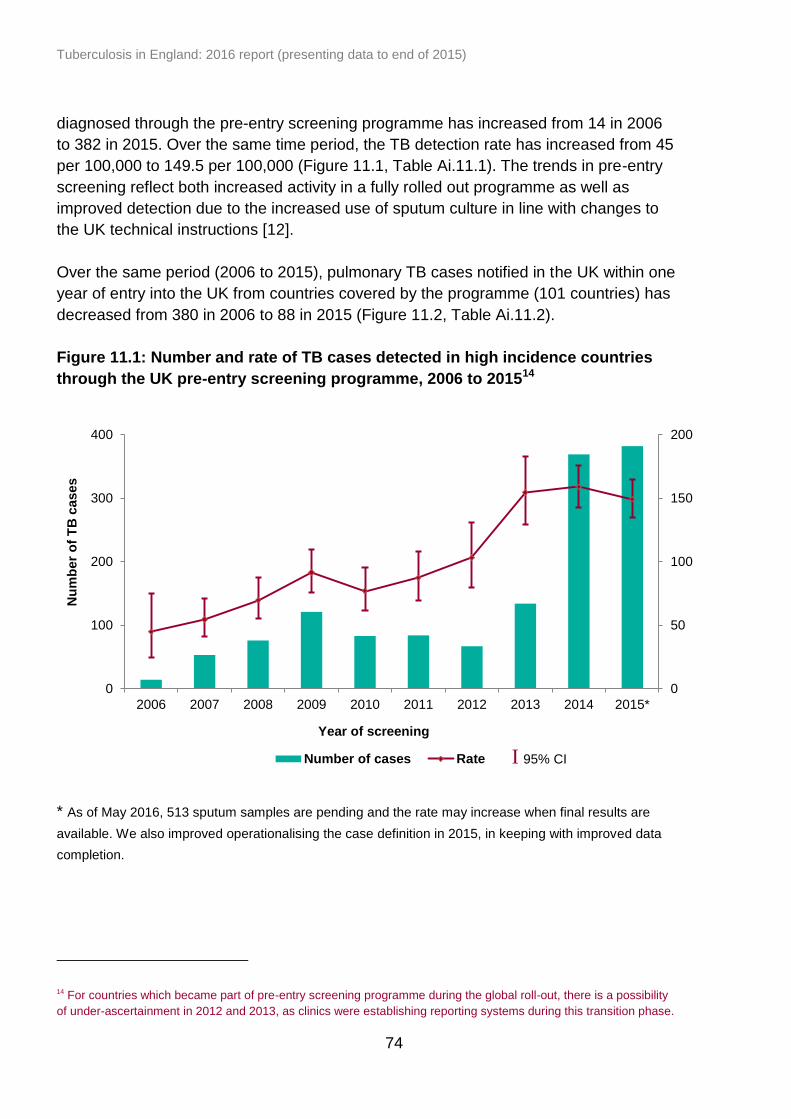
Tuberculosis in England: 2016 report (presenting data to end of 2015)
74
diagnosed through the pre-entry screening programme has increased from 14 in 2006
to 382 in 2015. Over the same time period, the TB detection rate has increased from 45
per 100,000 to 149.5 per 100,000 (Figure 11.1, Table Ai.11.1). The trends in pre-entry
screening reflect both increased activity in a fully rolled out programme as well as
improved detection due to the increased use of sputum culture in line with changes to
the UK technical instructions [12].
Over the same period (2006 to 2015), pulmonary TB cases notified in the UK within one
year of entry into the UK from countries covered by the programme (101 countries) has
decreased from 380 in 2006 to 88 in 2015 (Figure 11.2, Table Ai.11.2).
Figure 11.1: Number and rate of TB cases detected in high incidence countries
through the UK pre-entry screening programme, 2006 to 201514
* As of May 2016, 513 sputum samples are pending and the rate may increase when final results are
available. We also improved operationalising the case definition in 2015, in keeping with improved data
completion.
14 For countries which became part of pre-entry screening programme during the global roll-out, there is a possibility
of under-ascertainment in 2012 and 2013, as clinics were establishing reporting systems during this transition phase.
0
50
100
150
200
0
100
200
300
400
2006 2007 2008 2009 2010 2011 2012 2013 2014 2015*
Nu
mb
er
of
TB
cases
Year of screening
Number of cases Rate I 95% CI

Tuberculosis in England: 2016 report (presenting data to end of 2015)
75
0
100
200
300
400
500
600
2006 2007 2008 2009 2010 2011 2012 2013 2014 2015**
Nu
mb
er
of
cases
Year of screening/entry to the UK
TB cases diagnosed by pre-entry screening TB cases identified in the UK
Figure 11.2: Number of pulmonary TB cases diagnosed by pre-entry screening in
the 101 programme countries and those identified within one year of UK entry*,
2006 to 201515
* The number of pulmonary TB cases identified within one year of entry into the UK was from all 101 high incidence countries but the number of TB cases diagnosed by pre-entry screening were from an increasing number of countries as screening was rolled out; 5 pilot countries (2006), 15 pilot countries (2007 and 2012), 101 countries (by 2014). ** As of May 2016, 513 sputum samples are pending and the rate may increase when final results are available.
15
For countries, which only became part of pre-entry screening during the global roll-out in 2012-13, there is a possibility of
under-ascertainment, as clinics were establishing reporting systems during this transition phase
Tuberculosis in England: 2016 report (presenting data to end of 2015)
76
12. Conclusion
There has been a year-on-year decline in the incidence of TB in England over the past
four years, down to 10.5 per 100,000 (5,758 cases) in 2015. This represents a decline
of one-third since the peak incidence of 15.6 per 100,000 (8,280 cases) in 2011. This is
the lowest TB incidence in England since the start of enhanced TB surveillance in 2000.
In the past year, the decline in the number of TB cases has been seen in both the non-
UK born and UK born populations, and in all PHE Centres. However, the pattern of
decline differs in different population subgroups.
The reduction in the number of TB cases in the past four years has been particularly
marked in the non-UK born population, especially among new migrants. The majority of
non-UK born TB cases (60%) now occur among those who have lived in the UK for
more than six years. However, the rate of TB in the non-UK born population is still 15
times higher than in the UK born population, and 73% of all TB cases notified in 2015
were born abroad.
It is now also possible to see a consistent downward trend in the number of TB cases in
the UK born population since 2012. Within the UK born population, the majority (60%) of
cases notified in 2015 occurred in the White ethnic group, although the rate in this group
(2.2 per 100,000) was more than ten times lower than in the Black, Indian and Pakistani
ethnic groups.
The recent decline in the number of TB cases is likely to reflect a combination of factors.
The reduction in the number of TB cases in the non-UK born population, particularly in
new migrants, will in part reflect the success of the UK pre-entry screening programme.
We may also be starting to see the early impact of the increase in detection and
treatment of latent TB infection in this group. Some reduction in the number of TB cases
is also to be expected following reductions in the number of migrants from the highest
TB burden countries in recent years. In addition, there is now clear evidence of a
reduction in TB transmission in England, with reducing rates of TB in the UK born
population, including in UK born children, and a reduction in the proportion of TB cases
in a strain-typing cluster. This is likely to reflect overall improvements in TB control, in
addition to a reduction in the potential for transmission with reduced case numbers.
In terms of geographical distribution, TB continued to be concentrated in large urban
areas. As in previous years, the London PHE Centre accounted for nearly 40% of
cases, followed by the West Midlands PHE Centre with 12% of cases. However, TB
rates have shown particularly large declines in these areas, with a reduction of 35% and
29% in the past four years respectively.
Tuberculosis in England: 2016 report (presenting data to end of 2015)
77
The number and proportion of TB cases with multi-drug resistance/rifampicin resistance
(MDR/RR-TB) has decreased since the peak of 89 cases 2011, with 54 cases (1.6%)
with initial MDR/RR-TB in 2015. However, ten of these cases had XDR-TB, which
requires even more lengthy and complex management.
There has been a continued reduction in the number and proportion of TB cases co-
infected with HIV, from the peak of 566 cases (7.8%) in 2005 to 197 cases (3.2%) in
2014. The majority of TB-HIV co-infected cases continue to be among those born in
countries in Africa with a high HIV prevalence.
In 2015, there was a small reduction in the proportion of non-UK born cases who
experienced a delay of more than four months from date of reported symptom onset to
treatment start. However, long delays are still reported, with over a quarter of non-UK
born pulmonary cases and over a third of UK born pulmonary cases having a delay of
more than four months in 2015.
Following ten consecutive years of improving outcomes for TB cases, in the past year
there has been a slight reduction in the proportion of drug sensitive TB cases who had
completed treatment by 12 months, from 85.4% to 84.5%. This is mainly due to a small
increase in the proportion of cases who had died (from 4.1% to 4.8%). As in previous
years, the majority of those who died were aged 65 years or older.
Despite the overall decline in the number of TB cases in England, there has not been a
corresponding reduction in the number of cases with social risk factors. In the past year,
the proportion of cases with current or a history of homelessness, drug or alcohol
misuse or imprisonment has increased slightly, from 9.8% to 11.8%. People with social
risk factors are not only much more at risk of developing TB, but TB cases with social
risk factors are more likely to have drug resistance and to have worse TB outcomes,
being more than twice as likely to have been lost to follow up or to have died.
In summary, it is very encouraging that TB rates have declined for the fourth
consecutive year in England. However, it is important to note that despite significant
reductions in overall case numbers, there has been a small increase in the number of
cases with social risk factors, who have more complex clinical and social needs. This
demonstrates the ongoing need to tackle the social and economic factors associated
with TB, in addition to improving TB services, if the overall aim of eliminating TB as a
public health problem in England is to be achieved.

Tuberculosis in England: 2016 report (presenting data to end of 2015)
78
13. Recommendations
It is very encouraging that the number of TB cases and the rate of TB have declined for
the fourth consecutive year in England, and that this decline is now seen in the UK born,
as well as the non-UK born, population, and in every area of the country. This welcome
trend is likely to reflect recent improvements in TB control in England building up to and
since the launch of the Collaborative TB Strategy for England 2015-2020 [1] in January
2015, in addition to other factors.
To build on these achievements, and ensure that we continue to see an ongoing decline
in TB in England, further work is needed to take forward the strategy’s 10 areas for
action (AfA). Based on the findings in this report, a number of recommendations are
outlined below. Wider recommendations on improving TB control in England are
available in the Collaborative TB Strategy for England 2015-2020 [1].
To improve access to services and ensure early diagnosis (AfA1)
Although the delay between symptom onset and treatment start date for pulmonary TB
cases has shown a slight improvement in the past year, delays are still unacceptably
long.
Recommendations to reduce diagnostic delay:
TBCBs, CCGs and TB clinical teams to raise awareness of TB among healthcare
workers by utilising the recently updated TB resources of leading national TB
charity, TB Alert http://www.thetruthabouttb.org/professionals/professional-
education/
TBCBs, CCGs and primary care to raise awareness of TB and encourage use of
the RCGP TB e-learning module in primary care
http://elearning.rcgp.org.uk/course/info.php?id=107
TB clinical teams to use the recently updated TB resources for patients available
on TB Alerts website http://www.thetruthabouttb.org/
To provide universal access to high quality diagnostics (AfA2)
In 2015, 32% of all TB cases were not confirmed by any laboratory method. As we
move into a new era of TB diagnostics with whole genome sequencing (WGS) on the
horizon, we need to maximise the benefits of all diagnostic technologies.
Recommendations to improve TB diagnostics:
TB clinical teams to obtain diagnostic samples wherever possible
Tuberculosis in England: 2016 report (presenting data to end of 2015)
79
national TB office, through its diagnostics task and finish group, to undertake a
review of TB diagnostics across the NHS, and use this to define a minimum
standard of best practice for TB diagnostics in hospital laboratories
TBCBs and lead TB microbiologists to work with local laboratories to encourage
use of the TB diagnostics standard of best practice, once defined
To improve treatment and care services (AfA3)
To ensure the continuing decline in TB case numbers and low proportion of cases with
drug resistance, TBCBs, CCGs, TB services and wider TB stakeholders need to work
collectively to further improve treatment and care for patients.
Recommendations to improve TB treatment and care:
TBCBs to encourage CCGs to use the national TB service specification to
commission local TB services
TB clinicians, local stakeholders and TBCBs to support and improve local TB
clinical networks, and in due course consider the need for regional MDR-TB
MDTs
TBCBs are encouraged to complete their gap-analysis of local TB services
against the national TB service specification and use this to prepare local action
plans to meet these gaps
CCGs to commission and support highly-targeted case finding and prevention
activities, which focus on high-risk groups
TB clinical teams to continue their excellent case management and support to
complex TB patients, and to offer DOT where indicated
TB clinical teams to continue cohort review as a tool to improve local TB control
and as a measure of treatment outcomes and contact tracing activity
To reduce drug-resistant TB (AfA6)
Although the number of new MDR-TB cases has declined since 2011, in the past year
there has been a small increase in those with XDR-TB, who are particularly complex to
treat.
Recommendations to continue the reduction in drug resistant TB:
clinical teams to continue their hard work to support patients complete their
treatment course, using DOT where indicated
TB clinicians are encouraged to discuss each MDR-TB case with the BTS MDR-
TB Advisory Service
TBCBs should work with local stakeholders to consider the need for regional
MDR-TB MDTs
national TB office to work with NHS England to develop a service specification
for MDR/XDR TB as part of the Infectious Disease Service Review
Tuberculosis in England: 2016 report (presenting data to end of 2015)
80
To tackle TB in under-served populations (USPs) (AfA7)
As the number and proportion of TB cases with social risk factors (SRFs) has increased
slightly in 2015, and patients with SRFs have more complex needs and worse TB
outcomes, an enhanced focus on preventing TB in USPs and improving the support
available to patients with SRFs is required. This should, in turn, help to reduce health
inequalities, one of the key aims of the strategy.
Recommendations to improve TB control amongst USPs:
national TB office, through its USP task and finish group, to launch a TB resource
to help tackle TB in USPs for TBCBs, clinical teams and organisations who work
with USPs
TBCBs and the wider TB workforce to use the USP TB resource to take action
locally
TBCBs, CCGs, primary care and local authority public health to raise TB
awareness in health care workers, allied professionals working with USPs and
USPs themselves
TB commissioners in both CCGs and local authorities to ensure appropriate
access to services and treatment and support to enable patients to complete
treatment
To implement new entrant latent TB screening (AfA8)
As the rate of TB in the non-UK born population remains considerably higher than in the
UK born population, and nearly three-quarters of all TB cases notified in 2015 were born
abroad, driving forward the roll-out of the new migrant LTBI testing and treatment
programme is key to the delivery of better TB control in England. It is encouraging to
see the progressive roll-out of the programme.
Recommendations to sustain the roll-out of new migrant LTBI programmes:
in high TB burden areas, TBCBs should continue to work with CCGs to facilitate
the roll-out of LTBI programmes, facilitate data returns and encourage the use of
the recently launched LTBI toolkit to support this work
http://www.tbalert.org/health-professionals/ltbi-toolkit/
in high TB burden areas, CCG, primary and secondary care staff are encouraged
to drive forward the roll-out of LTBI programmes, invite people for testing and
encourage those with LTBI to consider treatment
healthcare staff are encouraged to use the recently launched LTBI toolkit to
enhance the delivery of their LTBI programmes
CCGs, primary and secondary care staff of LTBI programmes to ensure data
entry is robust and complete and to facilitate data transfer
national TB office to work with NHS England to sustain the funding for LTBI
testing and treatment programmes through to 2020
Tuberculosis in England: 2016 report (presenting data to end of 2015)
81
Two final overarching recommendations that relate to the broader aspects of TB control
include:
TBCBs are encouraged to continue their work providing over-arching support to
local TB control and overseeing local implementation of the strategy’s ten areas
for action
CCGs and local authorities are encouraged to use the PHE TB Fingertips tool to
assess their local TB burden to support JSNA development and TB
commissioning and monitoring
The strategy is to be delivered over five years. This year’s annual report provides
evidence of a very positive start to early implementation, however, there is much still to
do. None of what has been achieved so far could have been done without the hard work
of front-line TB service staff, TB control boards and their constituent members and NHS
England. Ultimately, improved TB control will be achieved through collective
participation and commitment of stakeholders and through the continued
implementation of the TB strategy.
Tuberculosis in England: 2016 report (presenting data to end of 2015)
82
References
1. Public Health England (2015). Collaborative tuberculosis strategy for England
2015-2020. https://www.gov.uk/government/publications/collaborative-
tuberculosis-strategy-for-england
2. Schurch AC, Kremer K, Daviena O, et al. High-resolution typing by integration of
genome sequencing data in a large tuberculosis cluster. J Clin Microbiol. 2010;
48: 3403–06.
3. Gardy JL, Johnston JC, Sui SJH, et al. Whole-genome sequencing and social-
network analysis of a tuberculosis outbreak. N Engl J Med. 2011; 364: 730–39.
4. Walker TM, Ip CL, Harrell RH, et al. Whole-genome sequencing to delineate
Mycobacterium tuberculosis outbreaks: a retrospective observational study. The
Lancet Infectious Diseases. 2013; 13(2):137-46.
5. World Health Organization (2013). Definitions and reporting framework for
tuberculosis – 2013 revision.
http://apps.who.int/iris/bitstream/10665/79199/1/9789241505345_eng.pdf
6. Joint Committee on Vaccination and Immunisation (2011). Tuberculosis: the
green book, chapter 32.
https://www.gov.uk/government/publications/tuberculosis-the-green-book-
chapter-32
7. Public Health England (2016). Cover of vaccination evaluated rapidly (COVER):
a guide to submitting data.
https://www.gov.uk/government/publications/cover-of-vaccination-evaluated-
rapidly-cover-programme-information-standards
8. NHS England (2015). Latent TB Testing Laboratory Analysis Services:
appointment of Providers to the National Framework
https://www.england.nhs.uk/resources/resources-for-ccgs/out-frwrk/dom-1/tb-
strategy/
9. Public Health England (2015). Latent TB testing and treatment for migrants: a
practical guide for commissioners and practitioners
https://www.gov.uk/government/publications/latent-tb-infection-ltbi-testing-and-
treatment

Tuberculosis in England: 2016 report (presenting data to end of 2015)
83
10. NHS Digital (2016). Database for the National LTBI testing and treatment
Programme in New Migrants from High-incidence Countries
http://digital.nhs.uk/isce/publication/isn
11. Public Health England (2015). Tuberculosis in England: 2015.
https://www.gov.uk/government/publications/tuberculosis-in-england-annual-
report
12. UK tuberculosis technical instructions (UKTBTI)
https://www.gov.uk/government/uploads/system/uploads/attachment_data/file/24
5009/UK_tuberculosis_technical_instructions.pdf
13. Aldridge RW, Shaji K, Hayward AC, Abubakar I. Accuracy of probabilistic linkage
using the enhanced matching system for public health and epidemiological
studies. PLOS one 2015; 10(8): e0136179.
14. TB Strain Typing Cluster Investigation Handbook, 3rd Edition, 2014.
http://webarchive.nationalarchives.gov.uk/20140714084352/http://www.hpa.org.u
k/webc/HPAwebFile/HPAweb_C/1317140774833
15. Department of Health. Tuberculosis prevention and treatment: a toolkit for
planning, commissioning and delivering high-quality services in England, 2007.
http://webarchive.nationalarchives.gov.uk/20130107105354/http:/www.dh.gov.uk/en/Publicationsandstatistics/Publications/PublicationsPolicyAndGuidance/DH_075621
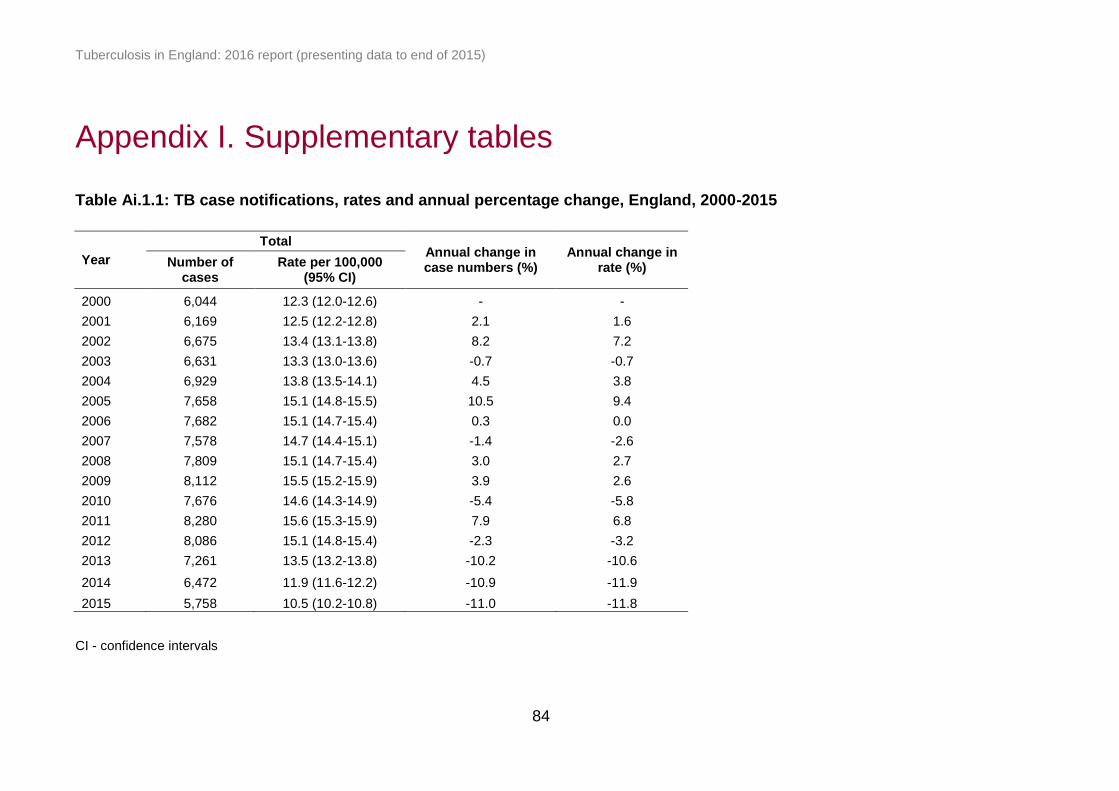
Tuberculosis in England: 2016 report (presenting data to end of 2015)
84
Appendix I. Supplementary tables
Table Ai.1.1: TB case notifications, rates and annual percentage change, England, 2000-2015
Year
Total Annual change in case numbers (%)
Annual change in rate (%) Number of
cases Rate per 100,000
(95% CI)
2000 6,044 12.3 (12.0-12.6) - -
2001 6,169 12.5 (12.2-12.8) 2.1 1.6
2002 6,675 13.4 (13.1-13.8) 8.2 7.2
2003 6,631 13.3 (13.0-13.6) -0.7 -0.7
2004 6,929 13.8 (13.5-14.1) 4.5 3.8
2005 7,658 15.1 (14.8-15.5) 10.5 9.4
2006 7,682 15.1 (14.7-15.4) 0.3 0.0
2007 7,578 14.7 (14.4-15.1) -1.4 -2.6
2008 7,809 15.1 (14.7-15.4) 3.0 2.7
2009 8,112 15.5 (15.2-15.9) 3.9 2.6
2010 7,676 14.6 (14.3-14.9) -5.4 -5.8
2011 8,280 15.6 (15.3-15.9) 7.9 6.8
2012 8,086 15.1 (14.8-15.4) -2.3 -3.2
2013 7,261 13.5 (13.2-13.8) -10.2 -10.6
2014 6,472 11.9 (11.6-12.2) -10.9 -11.9
2015 5,758 10.5 (10.2-10.8) -11.0 -11.8
CI - confidence intervals
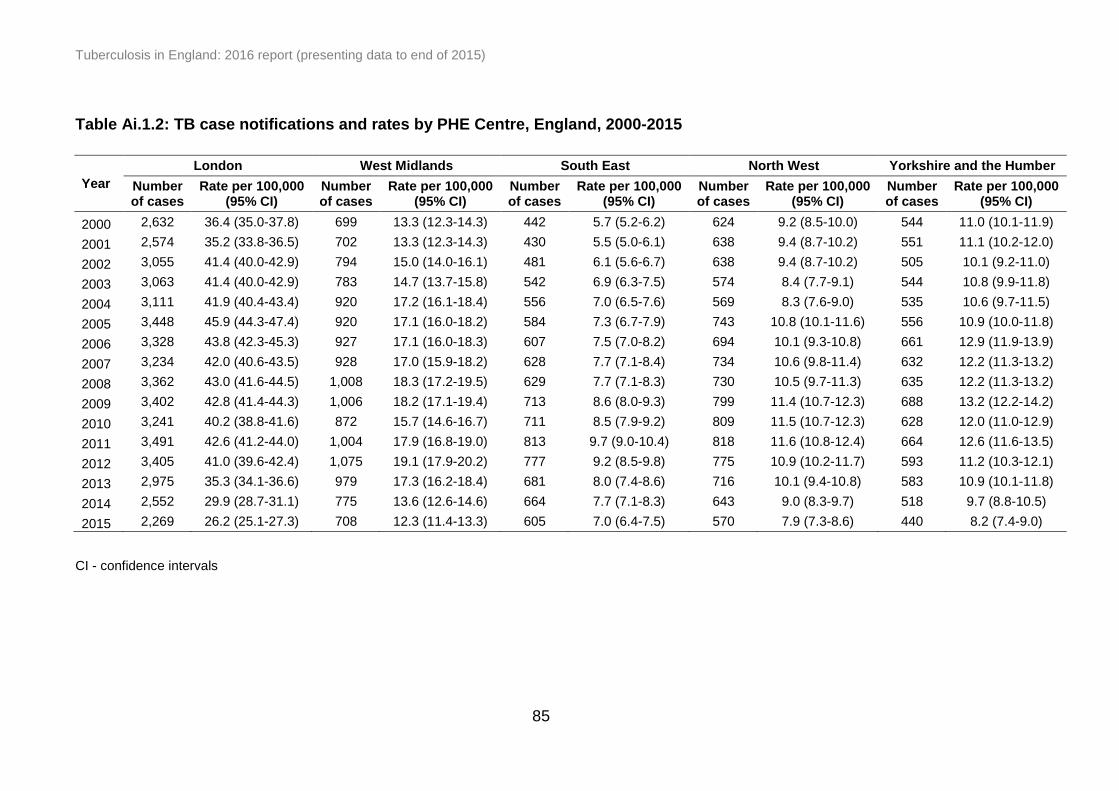
Tuberculosis in England: 2016 report (presenting data to end of 2015)
85
Table Ai.1.2: TB case notifications and rates by PHE Centre, England, 2000-2015
Year
London West Midlands South East North West Yorkshire and the Humber
Number of cases
Rate per 100,000 (95% CI)
Number of cases
Rate per 100,000 (95% CI)
Number of cases
Rate per 100,000 (95% CI)
Number of cases
Rate per 100,000 (95% CI)
Number of cases
Rate per 100,000 (95% CI)
2000 2,632 36.4 (35.0-37.8) 699 13.3 (12.3-14.3) 442 5.7 (5.2-6.2) 624 9.2 (8.5-10.0) 544 11.0 (10.1-11.9)
2001 2,574 35.2 (33.8-36.5) 702 13.3 (12.3-14.3) 430 5.5 (5.0-6.1) 638 9.4 (8.7-10.2) 551 11.1 (10.2-12.0)
2002 3,055 41.4 (40.0-42.9) 794 15.0 (14.0-16.1) 481 6.1 (5.6-6.7) 638 9.4 (8.7-10.2) 505 10.1 (9.2-11.0)
2003 3,063 41.4 (40.0-42.9) 783 14.7 (13.7-15.8) 542 6.9 (6.3-7.5) 574 8.4 (7.7-9.1) 544 10.8 (9.9-11.8)
2004 3,111 41.9 (40.4-43.4) 920 17.2 (16.1-18.4) 556 7.0 (6.5-7.6) 569 8.3 (7.6-9.0) 535 10.6 (9.7-11.5)
2005 3,448 45.9 (44.3-47.4) 920 17.1 (16.0-18.2) 584 7.3 (6.7-7.9) 743 10.8 (10.1-11.6) 556 10.9 (10.0-11.8)
2006 3,328 43.8 (42.3-45.3) 927 17.1 (16.0-18.3) 607 7.5 (7.0-8.2) 694 10.1 (9.3-10.8) 661 12.9 (11.9-13.9)
2007 3,234 42.0 (40.6-43.5) 928 17.0 (15.9-18.2) 628 7.7 (7.1-8.4) 734 10.6 (9.8-11.4) 632 12.2 (11.3-13.2)
2008 3,362 43.0 (41.6-44.5) 1,008 18.3 (17.2-19.5) 629 7.7 (7.1-8.3) 730 10.5 (9.7-11.3) 635 12.2 (11.3-13.2)
2009 3,402 42.8 (41.4-44.3) 1,006 18.2 (17.1-19.4) 713 8.6 (8.0-9.3) 799 11.4 (10.7-12.3) 688 13.2 (12.2-14.2)
2010 3,241 40.2 (38.8-41.6) 872 15.7 (14.6-16.7) 711 8.5 (7.9-9.2) 809 11.5 (10.7-12.3) 628 12.0 (11.0-12.9)
2011 3,491 42.6 (41.2-44.0) 1,004 17.9 (16.8-19.0) 813 9.7 (9.0-10.4) 818 11.6 (10.8-12.4) 664 12.6 (11.6-13.5)
2012 3,405 41.0 (39.6-42.4) 1,075 19.1 (17.9-20.2) 777 9.2 (8.5-9.8) 775 10.9 (10.2-11.7) 593 11.2 (10.3-12.1)
2013 2,975 35.3 (34.1-36.6) 979 17.3 (16.2-18.4) 681 8.0 (7.4-8.6) 716 10.1 (9.4-10.8) 583 10.9 (10.1-11.8)
2014 2,552 29.9 (28.7-31.1) 775 13.6 (12.6-14.6) 664 7.7 (7.1-8.3) 643 9.0 (8.3-9.7) 518 9.7 (8.8-10.5)
2015 2,269 26.2 (25.1-27.3) 708 12.3 (11.4-13.3) 605 7.0 (6.4-7.5) 570 7.9 (7.3-8.6) 440 8.2 (7.4-9.0)
CI - confidence intervals

Tuberculosis in England: 2016 report (presenting data to end of 2015)
86
Table Ai.1.2: TB case notifications and rates by PHE Centre, England, 2000-2015 continued
Year
East of England East Midlands South West North East
Number of cases
Rate per 100,000 (95% CI)
Number of cases
Rate per 100,000 (95% CI)
Number of cases
Rate per 100,000 (95% CI)
Number of cases
Rate per 100,000 (95% CI)
2000 299 5.4 (4.8-6.0) 414 9.9 (9.0-10.9) 230 4.7 (4.1-5.3) 157 6.2 (5.2-7.2)
2001 338 6.0 (5.4-6.7) 544 13.0 (11.9-14.1) 211 4.3 (3.7-4.9) 177 7.0 (6.0-8.1)
2002 355 6.3 (5.6-7.0) 471 11.2 (10.2-12.2) 220 4.4 (3.9-5.0) 149 5.9 (5.0-6.9)
2003 323 5.7 (5.1-6.3) 458 10.8 (9.8-11.8) 201 4.0 (3.5-4.6) 141 5.6 (4.7-6.5)
2004 405 7.1 (6.4-7.8) 419 9.8 (8.9-10.7) 264 5.2 (4.6-5.9) 143 5.6 (4.7-6.6)
2005 470 8.1 (7.4-8.9) 533 12.3 (11.3-13.4) 266 5.2 (4.6-5.9) 132 5.2 (4.3-6.1)
2006 479 8.2 (7.5-9.0) 566 13.0 (11.9-14.1) 278 5.4 (4.8-6.1) 141 5.5 (4.6-6.5)
2007 421 7.2 (6.5-7.9) 534 12.1 (11.1-13.2) 269 5.2 (4.6-5.9) 196 7.7 (6.6-8.8)
2008 506 8.5 (7.8-9.3) 483 10.9 (9.9-11.9) 279 5.4 (4.7-6.0) 177 6.9 (5.9-8.0)
2009 512 8.5 (7.8-9.3) 524 11.7 (10.7-12.8) 303 5.8 (5.2-6.5) 165 6.4 (5.5-7.5)
2010 506 8.4 (7.6-9.1) 494 11.0 (10.0-12.0) 265 5.0 (4.4-5.7) 150 5.8 (4.9-6.8)
2011 560 9.2 (8.4-10.0) 492 10.8 (9.9-11.8) 307 5.8 (5.2-6.5) 131 5.0 (4.2-6.0)
2012 497 8.1 (7.4-8.8) 497 10.9 (9.9-11.9) 300 5.6 (5.0-6.3) 167 6.4 (5.5-7.5)
2013 451 7.3 (6.6-8.0) 413 9.0 (8.1-9.9) 325 6.0 (5.4-6.7) 138 5.3 (4.4-6.2)
2014 436 6.9 (6.3-7.6) 400 8.6 (7.8-9.5) 316 5.8 (5.2-6.5) 168 6.4 (5.5-7.5)
2015 393 6.2 (5.6-6.8) 354 7.6 (6.8-8.4) 290 5.3 (4.7-5.9) 129 4.9 (4.1-5.8)
CI - confidence intervals
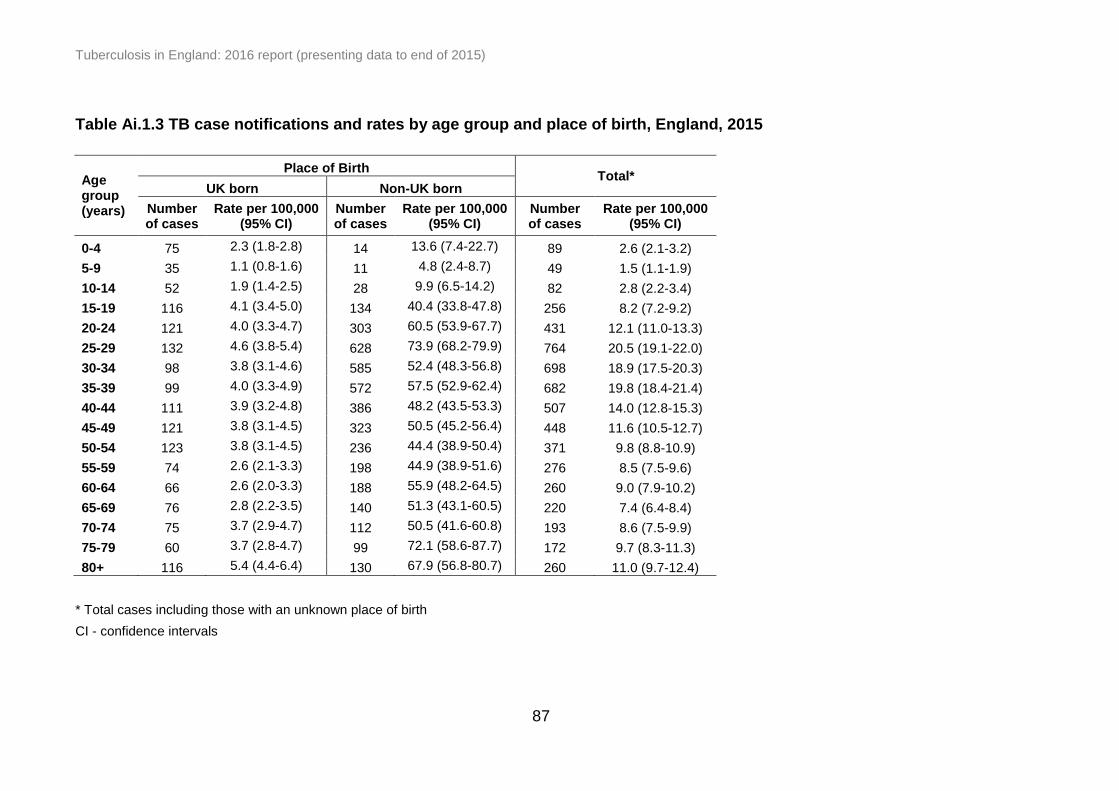
Tuberculosis in England: 2016 report (presenting data to end of 2015)
87
Table Ai.1.3 TB case notifications and rates by age group and place of birth, England, 2015
Age group (years)
Place of Birth Total*
UK born Non-UK born
Number of cases
Rate per 100,000 (95% CI)
Number of cases
Rate per 100,000 (95% CI)
Number of cases
Rate per 100,000 (95% CI)
0-4 75 2.3 (1.8-2.8) 14 13.6 (7.4-22.7) 89 2.6 (2.1-3.2)
5-9 35 1.1 (0.8-1.6) 11 4.8 (2.4-8.7) 49 1.5 (1.1-1.9)
10-14 52 1.9 (1.4-2.5) 28 9.9 (6.5-14.2) 82 2.8 (2.2-3.4)
15-19 116 4.1 (3.4-5.0) 134 40.4 (33.8-47.8) 256 8.2 (7.2-9.2)
20-24 121 4.0 (3.3-4.7) 303 60.5 (53.9-67.7) 431 12.1 (11.0-13.3)
25-29 132 4.6 (3.8-5.4) 628 73.9 (68.2-79.9) 764 20.5 (19.1-22.0)
30-34 98 3.8 (3.1-4.6) 585 52.4 (48.3-56.8) 698 18.9 (17.5-20.3)
35-39 99 4.0 (3.3-4.9) 572 57.5 (52.9-62.4) 682 19.8 (18.4-21.4)
40-44 111 3.9 (3.2-4.8) 386 48.2 (43.5-53.3) 507 14.0 (12.8-15.3)
45-49 121 3.8 (3.1-4.5) 323 50.5 (45.2-56.4) 448 11.6 (10.5-12.7)
50-54 123 3.8 (3.1-4.5) 236 44.4 (38.9-50.4) 371 9.8 (8.8-10.9)
55-59 74 2.6 (2.1-3.3) 198 44.9 (38.9-51.6) 276 8.5 (7.5-9.6)
60-64 66 2.6 (2.0-3.3) 188 55.9 (48.2-64.5) 260 9.0 (7.9-10.2)
65-69 76 2.8 (2.2-3.5) 140 51.3 (43.1-60.5) 220 7.4 (6.4-8.4)
70-74 75 3.7 (2.9-4.7) 112 50.5 (41.6-60.8) 193 8.6 (7.5-9.9)
75-79 60 3.7 (2.8-4.7) 99 72.1 (58.6-87.7) 172 9.7 (8.3-11.3)
80+ 116 5.4 (4.4-6.4) 130 67.9 (56.8-80.7) 260 11.0 (9.7-12.4)
* Total cases including those with an unknown place of birth
CI - confidence intervals

Tuberculosis in England: 2016 report (presenting data to end of 2015)
88
Table Ai.1.4: TB case notifications, rates and annual percentage change by place of birth, England, 2000-2015
Year
Place of birth
UK born Non-UK born
Number of cases
Rate per 100,000 (95% CI)
Annual change in case numbers (%)
Annual change in rate (%)
Number of cases
Rate per 100,000 (95% CI)
Annual change in case numbers (%)
Annual change in rate (%)
2000 1,830 4.1 (3.9 -4.3) - - 3,329 79.6 (76.9 -82.4) - -
2001 1,889 4.3 (4.1 -4.4) 3.2 4.9 3,431 79.1 (76.5 -81.8) 3.1 -0.6
2002 1,852 4.2 (4.0 -4.4) -2.0 -2.3 4,111 90.5 (87.7 -93.3) 19.8 14.4
2003 1,703 3.8 (3.6 -4.0) -8.0 -9.5 4,326 90.8 (88.1 -93.5) 5.2 0.3
2004 1,791 4.0 (3.8 -4.2) 5.2 5.3 4,570 95.1 (92.4 -97.9) 5.6 4.7
2005 1,804 4.0 (3.8 -4.2) 0.7 0.0 5,186 100.7 (98.0 -103.5) 13.5 5.9
2006 1,729 3.9 (3.7 -4.1) -4.2 -2.5 5,175 92.9 (90.4 -95.5) -0.2 -7.7
2007 1,799 4.0 (3.8 -4.2) 4.0 2.6 5,136 85.5 (83.2 -87.9) -0.8 -8.0
2008 1,867 4.2 (4.0 -4.4) 3.8 5.0 5,417 86.0 (83.7 -88.3) 5.5 0.6
2009 1,906 4.2 (4.1 -4.4) 2.1 0.0 5,663 86.8 (84.6 -89.1) 4.5 0.9
2010 1,814 4.0 (3.8 -4.2) -4.8 -4.8 5,515 83.1 (80.9 -85.3) -2.6 -4.3
2011 1,958 4.3 (4.1 -4.5) 7.9 7.5 6,021 85.9 (83.7 -88.1) 9.2 3.4
2012 2,005 4.4 (4.2 -4.6) 2.4 2.3 5,839 81.4 (79.3 -83.5) -3.0 -5.2
2013 1,840 4.0 (3.8 -4.2) -8.2 -9.1 5,256 70.6 (68.7 -72.5) -10.0 -13.3
2014 1,759 3.8 (3.7 -4.0) -4.4 -5.0 4,607 60.3 (58.5 -62.0) -12.3 -14.6
2015 1,550 3.4 (3.2 -3.5) -11.9 -10.5 4,087 51.2 (49.7 -52.8) -11.3 -15.1
CI - confidence intervals
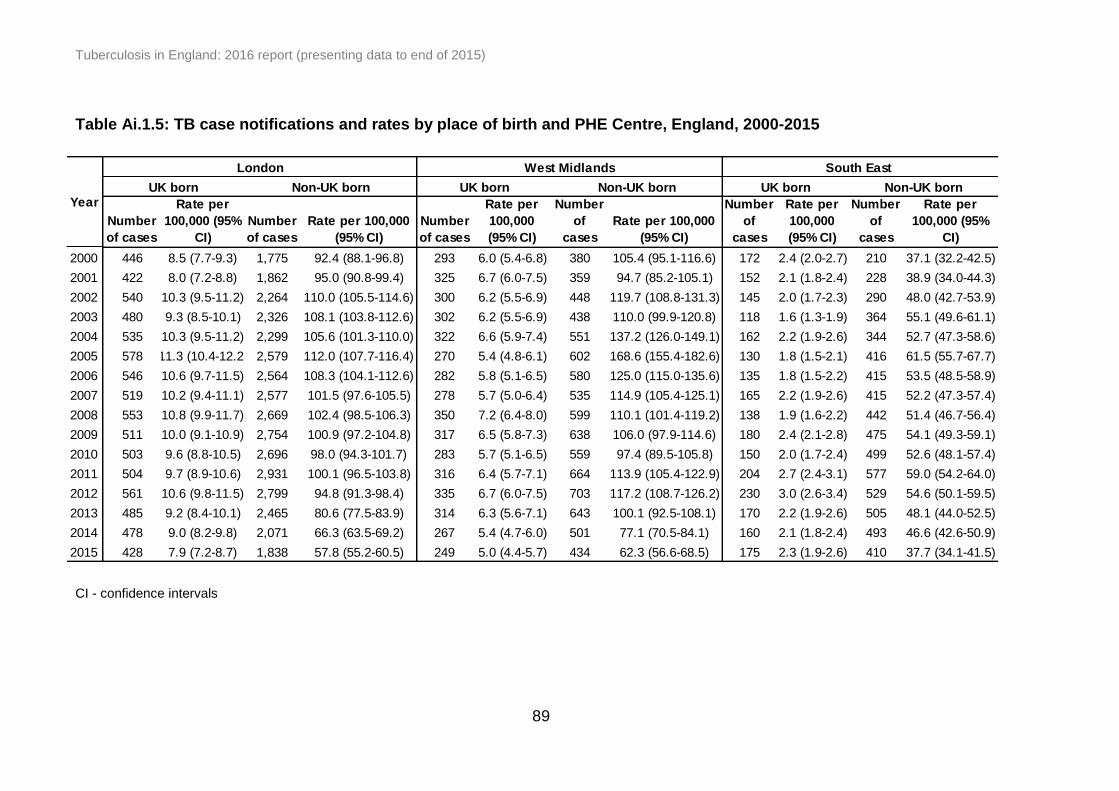
Tuberculosis in England: 2016 report (presenting data to end of 2015)
89
Number
of cases
Rate per
100,000 (95%
CI)
Number
of cases
Rate per 100,000
(95% CI)
Number
of cases
Rate per
100,000
(95% CI)
Number
of
cases
Rate per 100,000
(95% CI)
Number
of
cases
Rate per
100,000
(95% CI)
Number
of
cases
Rate per
100,000 (95%
CI)
2000 446 8.5 (7.7-9.3) 1,775 92.4 (88.1-96.8) 293 6.0 (5.4-6.8) 380 105.4 (95.1-116.6) 172 2.4 (2.0-2.7) 210 37.1 (32.2-42.5)
2001 422 8.0 (7.2-8.8) 1,862 95.0 (90.8-99.4) 325 6.7 (6.0-7.5) 359 94.7 (85.2-105.1) 152 2.1 (1.8-2.4) 228 38.9 (34.0-44.3)
2002 540 10.3 (9.5-11.2) 2,264 110.0 (105.5-114.6) 300 6.2 (5.5-6.9) 448 119.7 (108.8-131.3) 145 2.0 (1.7-2.3) 290 48.0 (42.7-53.9)
2003 480 9.3 (8.5-10.1) 2,326 108.1 (103.8-112.6) 302 6.2 (5.5-6.9) 438 110.0 (99.9-120.8) 118 1.6 (1.3-1.9) 364 55.1 (49.6-61.1)
2004 535 10.3 (9.5-11.2) 2,299 105.6 (101.3-110.0) 322 6.6 (5.9-7.4) 551 137.2 (126.0-149.1) 162 2.2 (1.9-2.6) 344 52.7 (47.3-58.6)
2005 578 11.3 (10.4-12.2) 2,579 112.0 (107.7-116.4) 270 5.4 (4.8-6.1) 602 168.6 (155.4-182.6) 130 1.8 (1.5-2.1) 416 61.5 (55.7-67.7)
2006 546 10.6 (9.7-11.5) 2,564 108.3 (104.1-112.6) 282 5.8 (5.1-6.5) 580 125.0 (115.0-135.6) 135 1.8 (1.5-2.2) 415 53.5 (48.5-58.9)
2007 519 10.2 (9.4-11.1) 2,577 101.5 (97.6-105.5) 278 5.7 (5.0-6.4) 535 114.9 (105.4-125.1) 165 2.2 (1.9-2.6) 415 52.2 (47.3-57.4)
2008 553 10.8 (9.9-11.7) 2,669 102.4 (98.5-106.3) 350 7.2 (6.4-8.0) 599 110.1 (101.4-119.2) 138 1.9 (1.6-2.2) 442 51.4 (46.7-56.4)
2009 511 10.0 (9.1-10.9) 2,754 100.9 (97.2-104.8) 317 6.5 (5.8-7.3) 638 106.0 (97.9-114.6) 180 2.4 (2.1-2.8) 475 54.1 (49.3-59.1)
2010 503 9.6 (8.8-10.5) 2,696 98.0 (94.3-101.7) 283 5.7 (5.1-6.5) 559 97.4 (89.5-105.8) 150 2.0 (1.7-2.4) 499 52.6 (48.1-57.4)
2011 504 9.7 (8.9-10.6) 2,931 100.1 (96.5-103.8) 316 6.4 (5.7-7.1) 664 113.9 (105.4-122.9) 204 2.7 (2.4-3.1) 577 59.0 (54.2-64.0)
2012 561 10.6 (9.8-11.5) 2,799 94.8 (91.3-98.4) 335 6.7 (6.0-7.5) 703 117.2 (108.7-126.2) 230 3.0 (2.6-3.4) 529 54.6 (50.1-59.5)
2013 485 9.2 (8.4-10.1) 2,465 80.6 (77.5-83.9) 314 6.3 (5.6-7.1) 643 100.1 (92.5-108.1) 170 2.2 (1.9-2.6) 505 48.1 (44.0-52.5)
2014 478 9.0 (8.2-9.8) 2,071 66.3 (63.5-69.2) 267 5.4 (4.7-6.0) 501 77.1 (70.5-84.1) 160 2.1 (1.8-2.4) 493 46.6 (42.6-50.9)
2015 428 7.9 (7.2-8.7) 1,838 57.8 (55.2-60.5) 249 5.0 (4.4-5.7) 434 62.3 (56.6-68.5) 175 2.3 (1.9-2.6) 410 37.7 (34.1-41.5)
YearUK born Non-UK born UK born Non-UK born UK born Non-UK born
London West Midlands South East
Table Ai.1.5: TB case notifications and rates by place of birth and PHE Centre, England, 2000-2015
CI - confidence intervals
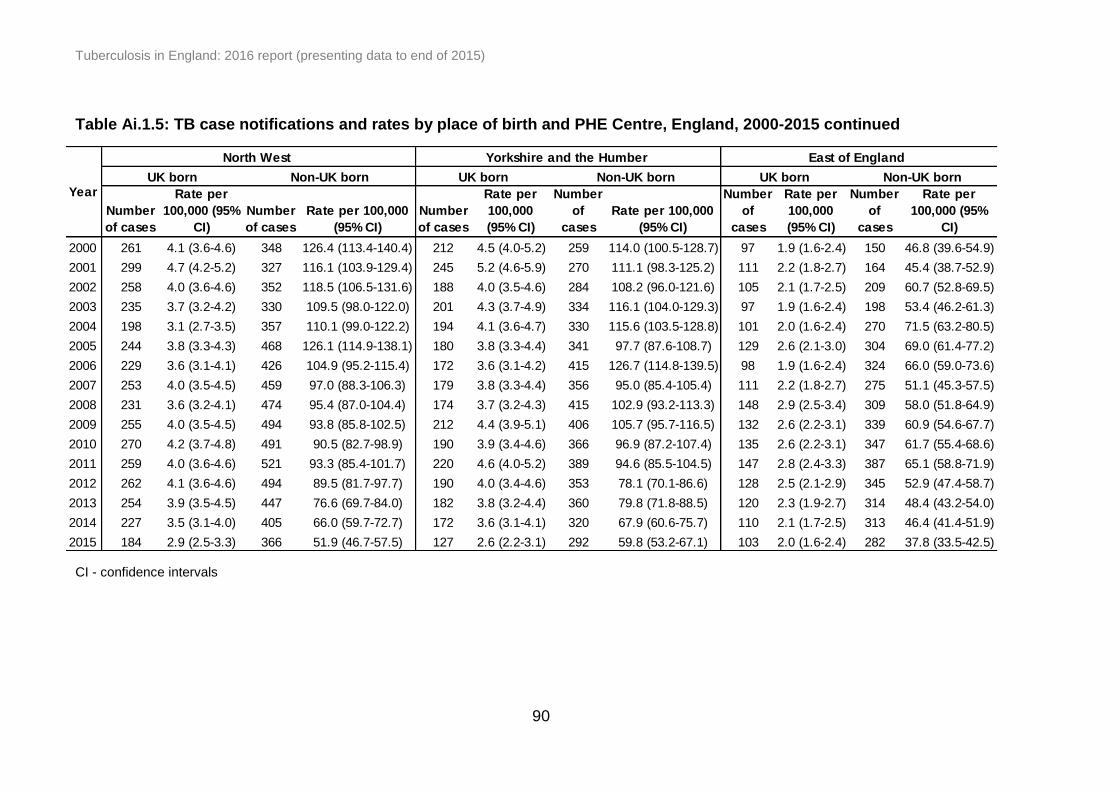
Tuberculosis in England: 2016 report (presenting data to end of 2015)
90
Number
of cases
Rate per
100,000 (95%
CI)
Number
of cases
Rate per 100,000
(95% CI)
Number
of cases
Rate per
100,000
(95% CI)
Number
of
cases
Rate per 100,000
(95% CI)
Number
of
cases
Rate per
100,000
(95% CI)
Number
of
cases
Rate per
100,000 (95%
CI)
2000 261 4.1 (3.6-4.6) 348 126.4 (113.4-140.4) 212 4.5 (4.0-5.2) 259 114.0 (100.5-128.7) 97 1.9 (1.6-2.4) 150 46.8 (39.6-54.9)
2001 299 4.7 (4.2-5.2) 327 116.1 (103.9-129.4) 245 5.2 (4.6-5.9) 270 111.1 (98.3-125.2) 111 2.2 (1.8-2.7) 164 45.4 (38.7-52.9)
2002 258 4.0 (3.6-4.6) 352 118.5 (106.5-131.6) 188 4.0 (3.5-4.6) 284 108.2 (96.0-121.6) 105 2.1 (1.7-2.5) 209 60.7 (52.8-69.5)
2003 235 3.7 (3.2-4.2) 330 109.5 (98.0-122.0) 201 4.3 (3.7-4.9) 334 116.1 (104.0-129.3) 97 1.9 (1.6-2.4) 198 53.4 (46.2-61.3)
2004 198 3.1 (2.7-3.5) 357 110.1 (99.0-122.2) 194 4.1 (3.6-4.7) 330 115.6 (103.5-128.8) 101 2.0 (1.6-2.4) 270 71.5 (63.2-80.5)
2005 244 3.8 (3.3-4.3) 468 126.1 (114.9-138.1) 180 3.8 (3.3-4.4) 341 97.7 (87.6-108.7) 129 2.6 (2.1-3.0) 304 69.0 (61.4-77.2)
2006 229 3.6 (3.1-4.1) 426 104.9 (95.2-115.4) 172 3.6 (3.1-4.2) 415 126.7 (114.8-139.5) 98 1.9 (1.6-2.4) 324 66.0 (59.0-73.6)
2007 253 4.0 (3.5-4.5) 459 97.0 (88.3-106.3) 179 3.8 (3.3-4.4) 356 95.0 (85.4-105.4) 111 2.2 (1.8-2.7) 275 51.1 (45.3-57.5)
2008 231 3.6 (3.2-4.1) 474 95.4 (87.0-104.4) 174 3.7 (3.2-4.3) 415 102.9 (93.2-113.3) 148 2.9 (2.5-3.4) 309 58.0 (51.8-64.9)
2009 255 4.0 (3.5-4.5) 494 93.8 (85.8-102.5) 212 4.4 (3.9-5.1) 406 105.7 (95.7-116.5) 132 2.6 (2.2-3.1) 339 60.9 (54.6-67.7)
2010 270 4.2 (3.7-4.8) 491 90.5 (82.7-98.9) 190 3.9 (3.4-4.6) 366 96.9 (87.2-107.4) 135 2.6 (2.2-3.1) 347 61.7 (55.4-68.6)
2011 259 4.0 (3.6-4.6) 521 93.3 (85.4-101.7) 220 4.6 (4.0-5.2) 389 94.6 (85.5-104.5) 147 2.8 (2.4-3.3) 387 65.1 (58.8-71.9)
2012 262 4.1 (3.6-4.6) 494 89.5 (81.7-97.7) 190 4.0 (3.4-4.6) 353 78.1 (70.1-86.6) 128 2.5 (2.1-2.9) 345 52.9 (47.4-58.7)
2013 254 3.9 (3.5-4.5) 447 76.6 (69.7-84.0) 182 3.8 (3.2-4.4) 360 79.8 (71.8-88.5) 120 2.3 (1.9-2.7) 314 48.4 (43.2-54.0)
2014 227 3.5 (3.1-4.0) 405 66.0 (59.7-72.7) 172 3.6 (3.1-4.1) 320 67.9 (60.6-75.7) 110 2.1 (1.7-2.5) 313 46.4 (41.4-51.9)
2015 184 2.9 (2.5-3.3) 366 51.9 (46.7-57.5) 127 2.6 (2.2-3.1) 292 59.8 (53.2-67.1) 103 2.0 (1.6-2.4) 282 37.8 (33.5-42.5)
East of England
UK born Non-UK bornYear
UK born Non-UK bornUK born Non-UK born
North West Yorkshire and the Humber
Table Ai.1.5: TB case notifications and rates by place of birth and PHE Centre, England, 2000-2015 continued
CI - confidence intervals

Tuberculosis in England: 2016 report (presenting data to end of 2015)
91
Number
of cases
Rate per
100,000 (95%
CI)
Number
of cases
Rate per 100,000
(95% CI)
Number
of cases
Rate per
100,000
(95% CI)
Number
of
cases
Rate per 100,000
(95% CI)
Number
of
cases
Rate per
100,000
(95% CI)
Number
of
cases
Rate per
100,000 (95%
CI)
2000 120 3.1 (2.6-3.7) 101 46.4 (37.8-56.4) 139 3.0 (2.5-3.6) 70 29.6 (23.1-37.5) 90 3.7 (2.9-4.5) 35 63.4 (44.2-88.2)
2001 120 3.1 (2.5-3.7) 100 44.7 (36.4-54.4) 123 2.7 (2.2-3.2) 61 25.8 (19.7-33.1) 92 3.8 (3.0-4.6) 59 88.5 (67.4-114.2)
2002 127 3.2 (2.7-3.9) 119 47.2 (39.1-56.5) 98 2.1 (1.7-2.6) 89 32.3 (25.9-39.7) 90 3.7 (3.0-4.6) 55 72.3 (54.5-94.1)
2003 116 2.9 (2.4-3.5) 182 72.9 (62.7-84.3) 87 1.9 (1.5-2.3) 93 33.0 (26.6-40.4) 67 2.7 (2.1-3.5) 60 91.0 (69.5-117.2)
2004 111 2.8 (2.3-3.4) 226 90.8 (79.3-103.4) 99 2.1 (1.7-2.6) 134 53.5 (44.8-63.3) 68 2.8 (2.2-3.6) 59 69.3 (52.8-89.4)
2005 95 2.4 (1.9-2.9) 291 99.4 (88.3-111.5) 123 2.6 (2.2-3.1) 124 46.0 (38.3-54.9) 55 2.3 (1.7-3.0) 60 66.3 (50.6-85.4)
2006 114 2.9 (2.4-3.5) 233 68.3 (59.8-77.6) 87 1.8 (1.5-2.3) 160 52.8 (44.9-61.7) 66 2.7 (2.1-3.5) 57 60.0 (45.4-77.7)
2007 118 3.0 (2.5-3.6) 278 75.7 (67.1-85.2) 97 2.1 (1.7-2.5) 151 42.1 (35.6-49.3) 79 3.2 (2.6-4.0) 90 95.1 (76.5-116.9)
2008 119 3.0 (2.5-3.6) 296 76.5 (68.0-85.7) 91 1.9 (1.5-2.3) 141 40.7 (34.2-47.9) 63 2.6 (2.0-3.3) 72 59.4 (46.5-74.8)
2009 146 3.6 (3.1-4.3) 340 89.8 (80.5-99.8) 99 2.1 (1.7-2.5) 147 45.2 (38.2-53.2) 54 2.3 (1.7-2.9) 70 48.9 (38.1-61.7)
2010 122 3.0 (2.5-3.6) 351 85.3 (76.6-94.8) 108 2.2 (1.8-2.7) 125 35.8 (29.8-42.6) 53 2.2 (1.6-2.9) 81 66.4 (52.7-82.5)
2011 142 3.5 (3.0-4.1) 331 76.1 (68.1-84.8) 127 2.6 (2.2-3.2) 150 36.7 (31.0-43.0) 39 1.6 (1.1-2.2) 71 62.2 (48.6-78.5)
2012 127 3.1 (2.6-3.7) 354 80.3 (72.1-89.1) 114 2.4 (2.0-2.8) 167 39.6 (33.8-46.0) 58 2.4 (1.8-3.1) 95 73.4 (59.4-89.7)
2013 116 2.9 (2.4-3.4) 292 63.3 (56.2-70.9) 151 3.1 (2.6-3.6) 155 39.1 (33.2-45.8) 48 2.0 (1.5-2.6) 75 48.7 (38.3-61.0)
2014 132 3.2 (2.7-3.8) 258 55.9 (49.2-63.1) 133 2.7 (2.3-3.2) 171 38.2 (32.7-44.4) 80 3.3 (2.6-4.1) 75 51.5 (40.5-64.5)
2015 101 2.5 (2.0-3.0) 246 50.0 (43.9-56.6) 128 2.6 (2.2-3.1) 146 31.9 (26.9-37.5) 55 2.2 (1.7-2.9) 73 58.3 (45.7-73.4)
YearNon-UK born
East Midlands South West North East
UK born Non-UK born UK born Non-UK born UK born
Table Ai.1.5: TB case notifications and rates by place of birth and PHE Centre, England, 2000-2015 continued
CI - confidence intervals

Tuberculosis in England: 2016 report (presenting data to end of 2015)
92
Table Ai.1.6: Number and proportion of TB case notifications by most frequent country of birth in non-UK born
population, England, 2000-2015
Year
Country of birth
India Pakistan Bangladesh Somalia Nepal Nigeria Romania Philippines Total*
n % n % n % n % n % n % n % n % n
2000 722 23.2 676 21.7 102 3.3 362 11.6 19 0.6 47 1.5 5 0.2 28 0.9 3,115
2001 668 20.6 715 22.1 109 3.4 360 11.1 28 0.9 47 1.5 5 0.2 35 1.1 3,236
2002 780 19.9 774 19.8 159 4.1 428 10.9 33 0.8 89 2.3 8 0.2 51 1.3 3,913
2003 789 19.3 729 17.9 182 4.5 473 11.6 34 0.8 116 2.8 11 0.3 52 1.3 4,083
2004 904 20.8 699 16.1 183 4.2 532 12.3 37 0.9 136 3.1 8 0.2 74 1.7 4,338
2005 1,099 22.4 832 16.9 191 3.9 581 11.8 36 0.7 153 3.1 11 0.2 69 1.4 4,917
2006 1,112 22.6 837 17.0 182 3.7 641 13.0 67 1.4 154 3.1 6 0.1 86 1.7 4,930
2007 1,188 24.3 796 16.3 243 5.0 551 11.3 69 1.4 150 3.1 15 0.3 92 1.9 4,887
2008 1,328 25.6 882 17.0 239 4.6 531 10.3 90 1.7 165 3.2 19 0.4 111 2.1 5,178
2009 1,531 28.2 921 16.9 235 4.3 535 9.8 114 2.1 174 3.2 25 0.5 114 2.1 5,437
2010 1,553 29.2 881 16.5 259 4.9 439 8.2 175 3.3 169 3.2 44 0.8 131 2.5 5,325
2011 1,787 30.4 1,061 18.0 285 4.8 415 7.1 214 3.6 190 3.2 54 0.9 101 1.7 5,884
2012 1,763 30.8 1,047 18.3 276 4.8 377 6.6 209 3.6 174 3.0 77 1.3 125 2.2 5,729
2013 1,545 29.9 1,044 20.2 237 4.6 290 5.6 163 3.2 156 3.0 69 1.3 125 2.4 5,162
2014 1,291 28.5 798 17.6 208 4.6 232 5.1 167 3.7 116 2.6 88 1.9 112 2.5 4,530
2015 1,056 26.3 638 15.9 210 5.2 177 4.4 126 3.1 118 2.9 118 2.9 105 2.6 4,022
Total 19,116 25.6 13,330 17.8 3,300 4.4 6,924 9.3 1,581 2.1 2,154 2.9 563 0.8 1,411 1.9 74,686
* Total number of non-UK born cases where country of birth was known

Tuberculosis in England: 2016 report (presenting data to end of 2015)
93
Table Ai.1.6: Number and proportion of TB case notifications by most frequent country of birth in non-UK born
population, England, 2000-2015 continued
Year
Country of birth
Zimbabwe Eritrea Poland Afghanistan Kenya Sri Lanka Other Total*
n % n % n % n % n % n % n % n
2000 78 2.5 26 0.8 10 0.3 43 1.4 92 3.0 50 1.6 855 27.4 3,115
2001 110 3.4 18 0.6 9 0.3 66 2.0 109 3.4 66 2.0 891 27.5 3,236
2002 240 6.1 26 0.7 10 0.3 100 2.6 110 2.8 82 2.1 1,023 26.1 3,913
2003 275 6.7 43 1.1 15 0.4 65 1.6 109 2.7 66 1.6 1,124 27.5 4,083
2004 270 6.2 33 0.8 13 0.3 78 1.8 130 3.0 81 1.9 1,160 26.7 4,338
2005 269 5.5 43 0.9 12 0.2 83 1.7 134 2.7 85 1.7 1,319 26.8 4,917
2006 242 4.9 64 1.3 30 0.6 73 1.5 106 2.2 62 1.3 1,268 25.7 4,930
2007 203 4.2 66 1.4 36 0.7 83 1.7 126 2.6 92 1.9 1,177 24.1 4,887
2008 201 3.9 86 1.7 53 1.0 92 1.8 124 2.4 86 1.7 1,171 22.6 5,178
2009 158 2.9 93 1.7 43 0.8 97 1.8 110 2.0 91 1.7 1,196 22.0 5,437
2010 189 3.5 81 1.5 48 0.9 95 1.8 96 1.8 86 1.6 1,079 20.3 5,325
2011 152 2.6 98 1.7 61 1.0 104 1.8 116 2.0 107 1.8 1,139 19.4 5,884
2012 129 2.3 78 1.4 60 1.0 76 1.3 95 1.7 97 1.7 1,146 20.0 5,729
2013 105 2.0 58 1.1 63 1.2 66 1.3 85 1.6 96 1.9 1,060 20.5 5,162
2014 107 2.4 85 1.9 70 1.5 95 2.1 80 1.8 76 1.7 1,005 22.2 4,530
2015 102 2.5 91 2.3 72 1.8 69 1.7 60 1.5 57 1.4 1,023 25.4 4,022
Total 2,830 3.8 989 1.3 605 0.8 1,285 1.7 1,682 2.3 1,280 1.7 17,636 23.5 74,686
* Total number of cases in the non-UK born population where country of birth was known
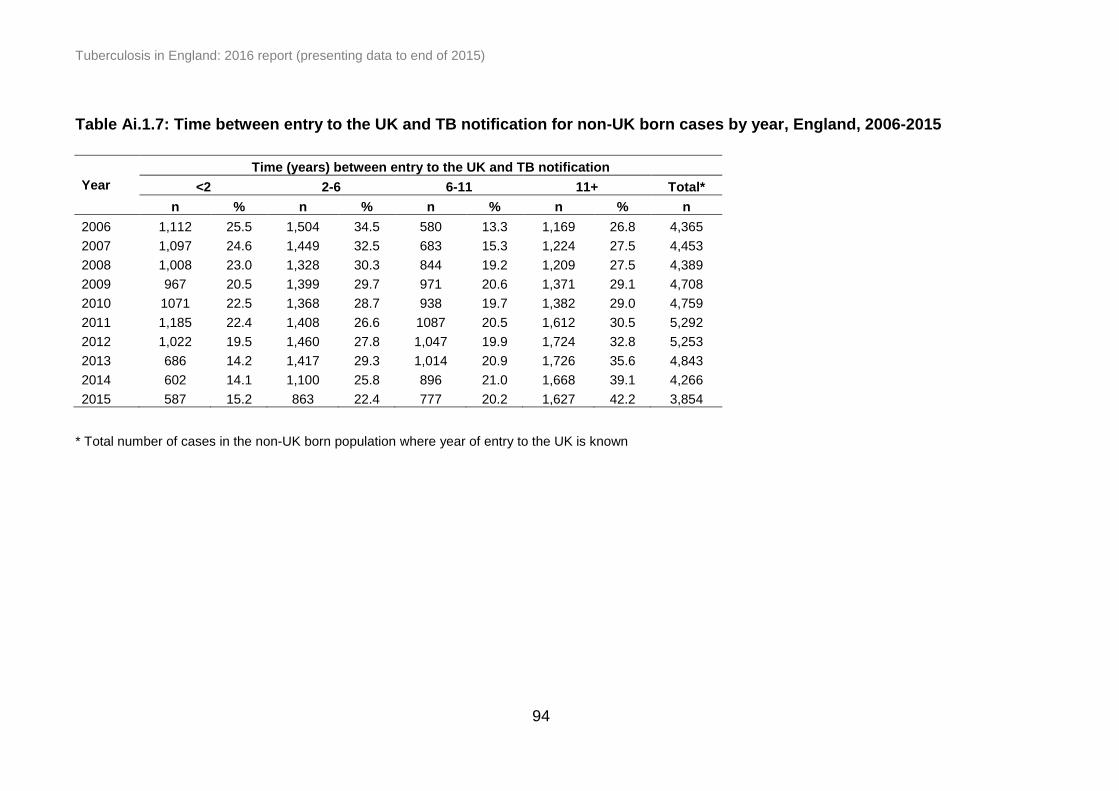
Tuberculosis in England: 2016 report (presenting data to end of 2015)
94
Table Ai.1.7: Time between entry to the UK and TB notification for non-UK born cases by year, England, 2006-2015
Year
Time (years) between entry to the UK and TB notification
<2 2-6 6-11 11+ Total*
n % n % n % n % n
2006 1,112 25.5 1,504 34.5 580 13.3 1,169 26.8 4,365
2007 1,097 24.6 1,449 32.5 683 15.3 1,224 27.5 4,453
2008 1,008 23.0 1,328 30.3 844 19.2 1,209 27.5 4,389
2009 967 20.5 1,399 29.7 971 20.6 1,371 29.1 4,708
2010 1071 22.5 1,368 28.7 938 19.7 1,382 29.0 4,759
2011 1,185 22.4 1,408 26.6 1087 20.5 1,612 30.5 5,292
2012 1,022 19.5 1,460 27.8 1,047 19.9 1,724 32.8 5,253
2013 686 14.2 1,417 29.3 1,014 20.9 1,726 35.6 4,843
2014 602 14.1 1,100 25.8 896 21.0 1,668 39.1 4,266
2015 587 15.2 863 22.4 777 20.2 1,627 42.2 3,854
* Total number of cases in the non-UK born population where year of entry to the UK is known

Tuberculosis in England: 2016 report (presenting data to end of 2015)
95
Table Ai.1.8: TB case notifications and rates by ethnic group and place of birth, England, 2015
Place of birth
UK born Non-UK born
Ethnic group Number of cases Rate per 100,000
(95% CI) Number of cases
Rate per 100,000 (95% CI)
White 928 2.2 (2.1-2.3) 409 10.8 (9.7-11.9)
Black-Caribbean 85 21.7 (17.3-26.8) 50 24.0 (17.8-31.6)
Black-African 101 21.2 (17.3-25.7) 819 102.3 (95.4-109.6)
Black-Other 20 42.1 (25.7-65.1) 47 118.1 (86.7-157.0)
Indian 140 20.8 (17.5-24.5) 1,143 133.9 (126.3-141.9)
Pakistani 159 23.2 (19.7-27.1) 660 131.5 (121.7-142.0)
Bangladeshi 33 14.2 (9.8-19.9) 209 107.7 (93.6-123.3)
Chinese 5 6.6 (2.1-15.4) 56 26.4 (19.9-34.3)
Mixed/Other 76 6.1 (4.8-7.6) 680 50.0 (46.3-53.9)
CI - confidence intervals

Tuberculosis in England: 2016 report (presenting data to end of 2015)
96
Table Ai.1.9: Number of UK born TB case over time by ethnic groupings, England, 2000-2015
Year White Black* South Asian** Mixed/other
$
n n n n
2000 1,262 173 346 35
2001 1,309 151 367 48
2002 1,229 178 391 38
2003 1,191 127 335 36
2004 1,164 204 345 59
2005 1,117 197 399 69
2006 1,094 189 373 62
2007 1,051 240 425 70
2008 1,049 235 483 81
2009 1,114 232 432 86
2010 1,054 225 436 70
2011 1,138 233 462 85
2012 1,182 239 475 87
2013 1,091 213 418 97
2014 1,074 222 363 93
2015 928 206 332 81
* Cases with Black-Caribbean, Black-African and Black-Other ethnic groups were grouped as ‘Black’
** Cases with Indian, Pakistani and Bangladeshi ethnic groups were grouped as ‘South Asian’ $ Cases with Mixed/Other and Chinese ethnic groups were grouped as ‘Mixed/other’

Tuberculosis in England: 2016 report (presenting data to end of 2015)
97
Table Ai.1.10: Number and proportion of TB case notifications by site of disease and place of birth, England, 2006-
2015
Year
All cases* UK born Non-UK born
Pulmonary** Extra-pulmonary
only#
Total Pulmonary** Extra-pulmonary
only#
Total Pulmonary** Extra-pulmonary
only#
Total
n % n % n n % n % n n % n % n
2006 4,297 56.1 3,361 43.9 7,658 1,239 72.0 482 28.0 1,721 2,630 50.9 2,537 49.1 5,167
2007 4,148 54.9 3,403 45.1 7,551 1,227 68.5 563 31.5 1,790 2,538 49.5 2,590 50.5 5,128
2008 4,286 55.3 3,464 44.7 7,750 1,328 71.5 529 28.5 1,857 2,664 49.5 2,718 50.5 5,382
2009 4,416 54.8 3,643 45.2 8,059 1,350 71.4 541 28.6 1,891 2,747 48.7 2,898 51.3 5,645
2010 4,070 53.2 3,575 46.8 7,645 1,248 69.1 558 30.9 1,806 2,589 47.1 2,909 52.9 5,498
2011 4,290 52.1 3,950 47.9 8,240 1,375 71.1 559 28.9 1,934 2,746 45.7 3,263 54.3 6,009
2012 4,191 52.1 3,860 47.9 8,051 1,361 68.3 633 31.7 1,994 2,694 46.2 3,137 53.8 5,831
2013 3,718 51.4 3,514 48.6 7,232 1,245 68.1 583 31.9 1,828 2,383 45.4 2,862 54.6 5,245
2014 3,402 52.7 3,059 47.3 6,461 1,190 67.8 565 32.2 1,755 2,144 46.6 2,456 53.4 4,600
2015 3,065 53.4 2,679 46.6 5,744 1,081 69.9 465 30.1 1,546 1,913 46.9 2,166 53.1 4,079
* Total cases including those with an unknown place of birth
** With or without extra-pulmonary disease # Extra-pulmonary disease only
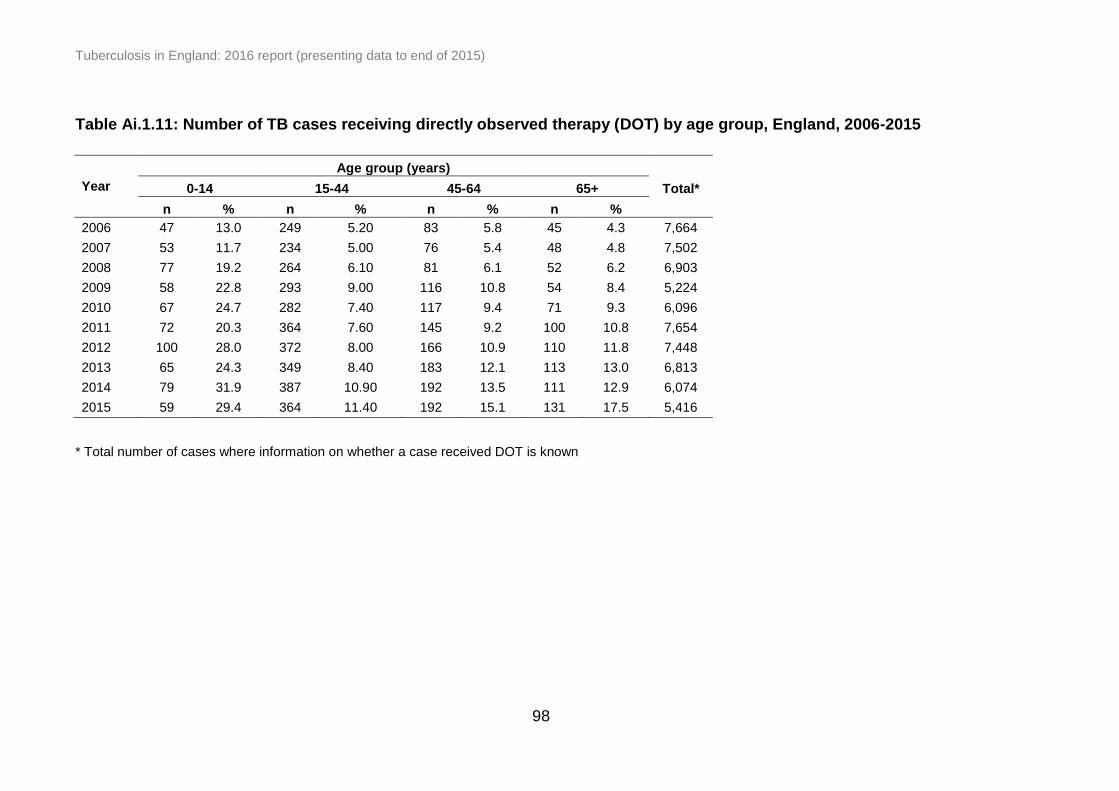
Tuberculosis in England: 2016 report (presenting data to end of 2015)
98
Table Ai.1.11: Number of TB cases receiving directly observed therapy (DOT) by age group, England, 2006-2015
Age group (years)
Year 0-14 15-44 45-64 65+ Total*
n % n % n % n %
2006 47 13.0 249 5.20 83 5.8 45 4.3 7,664
2007 53 11.7 234 5.00 76 5.4 48 4.8 7,502
2008 77 19.2 264 6.10 81 6.1 52 6.2 6,903
2009 58 22.8 293 9.00 116 10.8 54 8.4 5,224
2010 67 24.7 282 7.40 117 9.4 71 9.3 6,096
2011 72 20.3 364 7.60 145 9.2 100 10.8 7,654
2012 100 28.0 372 8.00 166 10.9 110 11.8 7,448
2013 65 24.3 349 8.40 183 12.1 113 13.0 6,813
2014 79 31.9 387 10.90 192 13.5 111 12.9 6,074
2015 59 29.4 364 11.40 192 15.1 131 17.5 5,416
* Total number of cases where information on whether a case received DOT is known

Tuberculosis in England: 2016 report (presenting data to end of 2015)
99
Table Ai.2.1: Number and proportion of culture confirmed TB cases by PHE Centre, England, 2006-2015
PHE Centre* 2006 2007 2008 2009 2010 2011 2012 2013 2014 2015
n % n % n % n % n % n % n % n % n % n %
London 2,016 60.6 1,834 56.7 1,935 57.6 1,908 56.1 1,950 60.2 2,089 59.8 2,092 61.4 1,773 59.6 1,540 60.3 1,339 59.0
West Midlands 539 58.1 555 59.8 542 53.8 584 58.1 524 60.1 615 61.3 590 54.9 550 56.2 424 54.7 402 56.8
South East 413 68.0 396 63.1 381 60.6 420 58.9 437 61.5 490 60.3 488 62.8 440 64.6 429 64.6 365 60.3
North West 415 59.8 430 58.6 427 58.5 481 60.2 490 60.6 507 62.0 468 60.4 447 62.4 392 61.0 355 62.3
Yorkshire and the Humber 394 59.6 382 60.4 357 56.2 401 58.3 363 57.8 378 56.9 346 58.3 365 62.6 326 62.9 264 60.0
East of England 308 64.3 253 60.1 304 60.1 294 57.4 308 60.9 352 62.9 311 62.6 283 62.7 285 65.4 243 61.8
East Midlands 311 54.9 309 57.9 285 59.0 279 53.2 298 60.3 296 60.2 298 60.0 243 58.8 239 59.8 237 66.9
South West 170 61.2 160 59.5 191 68.5 195 64.4 142 53.6 200 65.1 190 63.3 186 57.2 174 55.1 171 59.0
North East 101 71.6 127 64.8 115 65.0 108 65.5 97 64.7 104 79.4 114 68.3 106 76.8 115 68.5 84 65.1
England** 4,668 60.8 4,448 58.7 4,537 58.1 4,670 57.6 4,609 60.0 5,031 60.8 4,897 60.6 4,393 60.5 3,924 60.6 3,460 60.1
* Ordered by decreasing total number of cases in 2015
** Total cases including those with an unknown PHE Centre of residence

Tuberculosis in England: 2016 report (presenting data to end of 2015)
100
Table Ai.2.2: Number and proportion of pulmonary culture confirmed TB cases by PHE Centre, England, 2006-2015
* Ordered by decreasing total number of cases in 2015
** Total cases including those with an unknown PHE Centre of residence
TB Monitoring Indicator 8: Proportion of pulmonary TB cases that were culture confirmed (England, PHEC, UTLA and CCG data shown on Fingertips)
PHE Centre* 2006 2007 2008 2009 2010 2011 2012 2013 2014 2015
n % n % n % n % n % n % n % n % n % n %
London 1,287 71.1 1,121 67.2 1,177 67.1 1,175 66.8 1,148 71.5 1,193 72.6 1,184 72.5 1,045 74.6 945 74.6 809 73.9
West Midlands 359 65.2 357 68.9 366 64.4 383 68.0 333 70.6 407 72.2 368 64.9 352 66.3 273 65.2 267 67.4
South East 246 73.4 266 74.7 266 69.3 274 69.0 261 67.8 309 70.7 307 72.4 266 79.6 280 81.9 241 75.1
North West 264 71.9 293 72.7 277 74.9 317 72.7 312 73.8 298 72.3 285 73.1 265 74.9 255 72.6 234 77.0
Yorkshire and the Humber 250 67.2 245 65.7 213 63.4 264 67.0 255 67.1 247 65.2 222 67.5 229 68.8 219 74.5 182 70.8
East of England 201 72.8 157 68.9 202 63.7 200 67.6 204 68.0 220 72.4 182 69.5 176 75.5 181 78.7 156 70.9
East Midlands 193 60.3 218 69.9 198 70.2 193 68.9 195 78.6 201 72.3 188 66.0 172 71.4 161 72.2 165 78.2
South West 111 64.2 107 63.3 130 74.7 133 69.3 99 56.9 141 70.1 143 70.1 131 63.9 113 58.2 121 63.0
North East 68 73.9 85 70.2 75 73.5 69 70.4 60 73.2 59 81.9 70 72.9 76 87.4 62 75.6 53 76.8
England** 2,980 69.4 2,850 68.7 2,904 67.8 3,008 68.1 2,867 70.4 3,075 71.7 2,949 70.4 2,712 72.9 2,489 73.2 2,228 72.7
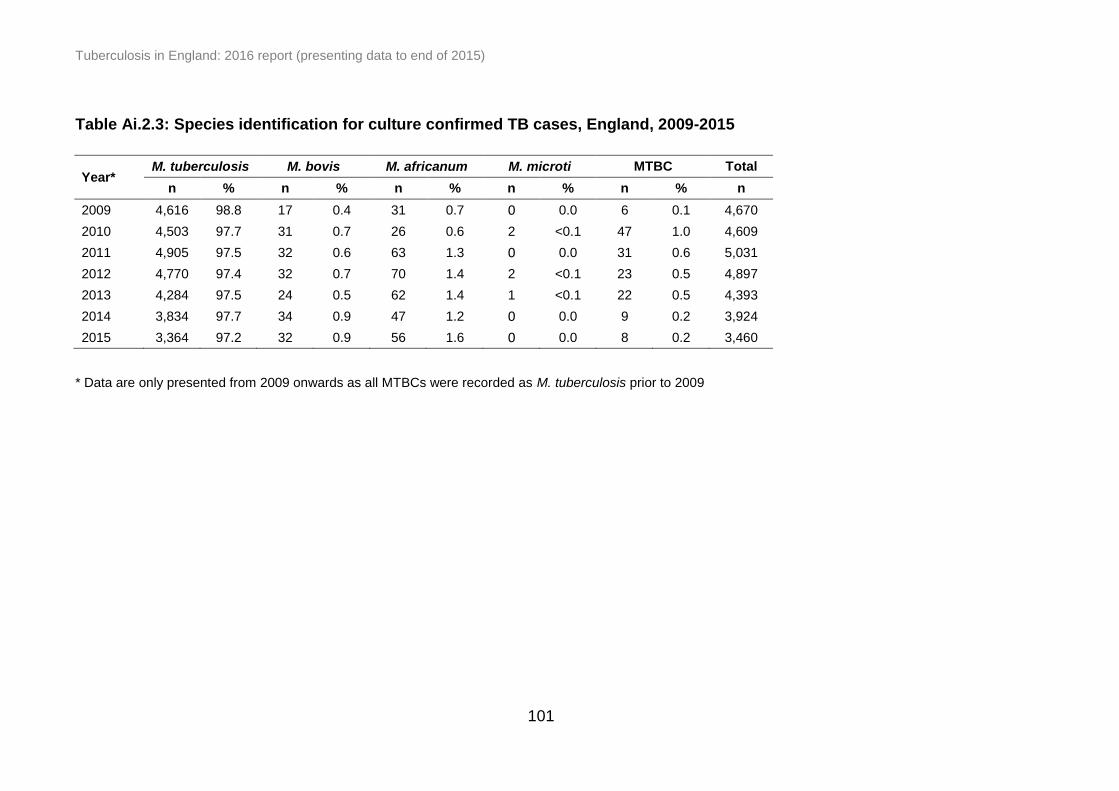
Tuberculosis in England: 2016 report (presenting data to end of 2015)
101
Table Ai.2.3: Species identification for culture confirmed TB cases, England, 2009-2015
Year* M. tuberculosis M. bovis M. africanum M. microti MTBC Total
n % n % n % n % n % n
2009 4,616 98.8 17 0.4 31 0.7 0 0.0 6 0.1 4,670
2010 4,503 97.7 31 0.7 26 0.6 2 <0.1 47 1.0 4,609
2011 4,905 97.5 32 0.6 63 1.3 0 0.0 31 0.6 5,031
2012 4,770 97.4 32 0.7 70 1.4 2 <0.1 23 0.5 4,897
2013 4,284 97.5 24 0.5 62 1.4 1 <0.1 22 0.5 4,393
2014 3,834 97.7 34 0.9 47 1.2 0 0.0 9 0.2 3,924
2015 3,364 97.2 32 0.9 56 1.6 0 0.0 8 0.2 3,460
* Data are only presented from 2009 onwards as all MTBCs were recorded as M. tuberculosis prior to 2009
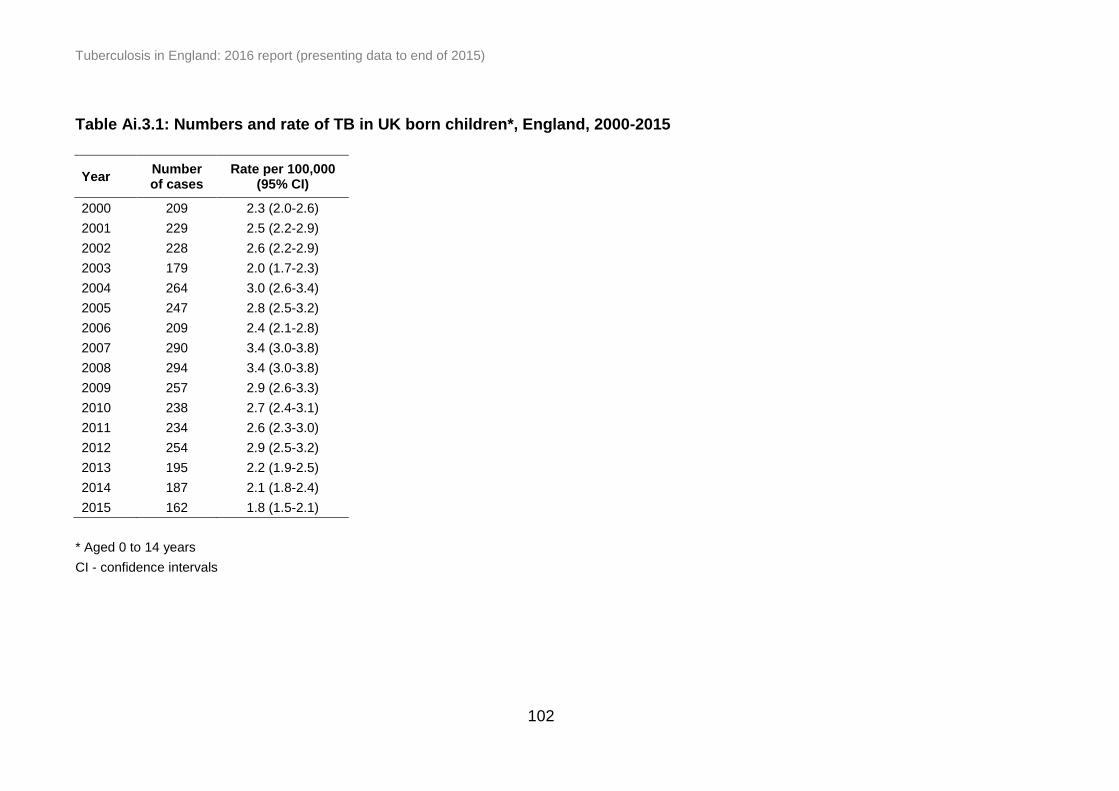
Tuberculosis in England: 2016 report (presenting data to end of 2015)
102
Table Ai.3.1: Numbers and rate of TB in UK born children*, England, 2000-2015
Year Number of cases
Rate per 100,000 (95% CI)
2000 209 2.3 (2.0-2.6)
2001 229 2.5 (2.2-2.9)
2002 228 2.6 (2.2-2.9)
2003 179 2.0 (1.7-2.3)
2004 264 3.0 (2.6-3.4)
2005 247 2.8 (2.5-3.2)
2006 209 2.4 (2.1-2.8)
2007 290 3.4 (3.0-3.8)
2008 294 3.4 (3.0-3.8)
2009 257 2.9 (2.6-3.3)
2010 238 2.7 (2.4-3.1)
2011 234 2.6 (2.3-3.0)
2012 254 2.9 (2.5-3.2)
2013 195 2.2 (1.9-2.5)
2014 187 2.1 (1.8-2.4)
2015 162 1.8 (1.5-2.1)
* Aged 0 to 14 years
CI - confidence intervals

Tuberculosis in England: 2016 report (presenting data to end of 2015)
103
n n % n % n % n n % n % n % n %
London 17,933 10,783 60.1 9,406 87.2 4,845 51.5 1,108 548 49.5 327 29.5 161 14.5 72 6.5
West Midlands 5,413 3,105 57.4 2,611 84.1 1,280 49.0 295 157 53.2 84 28.5 34 11.5 20 6.8
South East 4,251 2,649 62.3 2,290 86.4 797 34.8 239 139 58.2 64 26.8 29 12.1 7 2.9
North West 4,331 2,659 61.4 1,832 68.9 621 33.9 156 79 50.6 53 34.0 14 9.0 10 6.4
Yorkshire and the Humber 3,426 2,042 59.6 1,496 73.3 515 34.4 130 71 54.6 34 26.2 17 13.1 8 6.2
East of England 2,843 1,782 62.7 1,545 86.7 457 29.6 150 89 59.3 46 30.7 11 7.3 4 2.7
East Midlands 2,650 1,611 60.8 1,345 83.5 465 34.6 132 66 50.0 41 31.1 17 12.9 8 6.1
South West 1,803 1,063 59.0 884 83.2 288 32.6 75 37 49.3 21 28.0 15 20.0 2 2.7
North East 883 620 70.2 430 69.4 114 26.5 34 16 47.1 12 35.3 5 14.7 1 2.9
England$ 43,533 26,314 60.4 21,839 83.0 12,752 58.4 2,539 1,154 45.5 752 29.6 422 16.6 211 8.3
Clusters by cluster size
2 3-4 5-9 ≥10
PHE Centre*
Number
of
clusters
Clustered
cases#
≥23 loci typed
cases**
Culture
confirmed
cases
Notified
cases
Table Ai.3.2: Number of TB clusters and proportion clustered cases by PHE Centre, England, 2010-2015
* Ordered by decreasing total number of cases in 2015 ** Culture confirmed cases with a MIRU-VNTR profile with at least 23 complete loci # Clustered cases are clustered with each other within the same geographical area
$ The number of clusters in England is higher than the sum of all PHE Centre clusters because it includes clusters that span more than one PHE
Centre

Tuberculosis in England: 2016 report (presenting data to end of 2015)
104
Table Ai.4.1: Number and proportion of pulmonary TB cases by time from symptom onset to treatment start and
PHE Centre, England, 2015
PHE Centre* 0-2 months 2-4 months >4 months Total**
n % n % n % n
London 475 46.9 300 29.6 238 23.5 1,013
West Midlands 138 40.1 93 27.0 113 32.8 344
South East 105 35.4 81 27.3 111 37.4 297
North West 108 40.3 82 30.6 78 29.1 268
Yorkshire and the Humber 101 44.3 72 31.6 55 24.1 228
East of England 74 40.7 57 31.3 51 28.0 182
East Midlands 80 41.0 61 31.3 54 27.7 195
South West 66 36.1 59 32.2 58 31.7 183
North East 39 63.9 11 18.0 11 18.0 61
England 1,186 42.8 816 29.4 769 27.8 2,771
* Ordered by decreasing total number of cases in 2015 * The number of pulmonary cases with time between symptom onset to start of TB treatment available, excluding those diagnosed post-mortem and those who did not start treatment

Tuberculosis in England: 2016 report (presenting data to end of 2015)
105
Table Ai.4.2: Number and proportion of pulmonary TB cases by time from symptom onset to treatment start and
place of birth, England, 2011-2015
Place of birth Year
Time from symptom onset to treatment start
0-2 months 2-4 months >4 months Total*
n % n % n % n
UK born
2011 393 41.1 272 28.4 292 30.5 957
2012 413 40.9 293 29.0 305 30.2 1,011
2013 381 38.3 290 29.2 323 32.5 994
2014 402 39.3 285 27.9 336 32.8 1,023
2015 371 38.5 274 28.5 318 33.0 963
Non-UK born
2011 885 46.9 561 29.7 441 23.4 1,887
2012 923 45.4 616 30.3 496 24.4 2,035
2013 822 42.5 604 31.2 510 26.3 1,936
2014 743 39.6 593 31.6 539 28.7 1,875
2015 796 45.1 529 30.0 440 24.9 1,765
* The number of pulmonary cases with time between symptom onset to start of TB treatment available, excluding those diagnosed post-mortem and those who did not start treatment
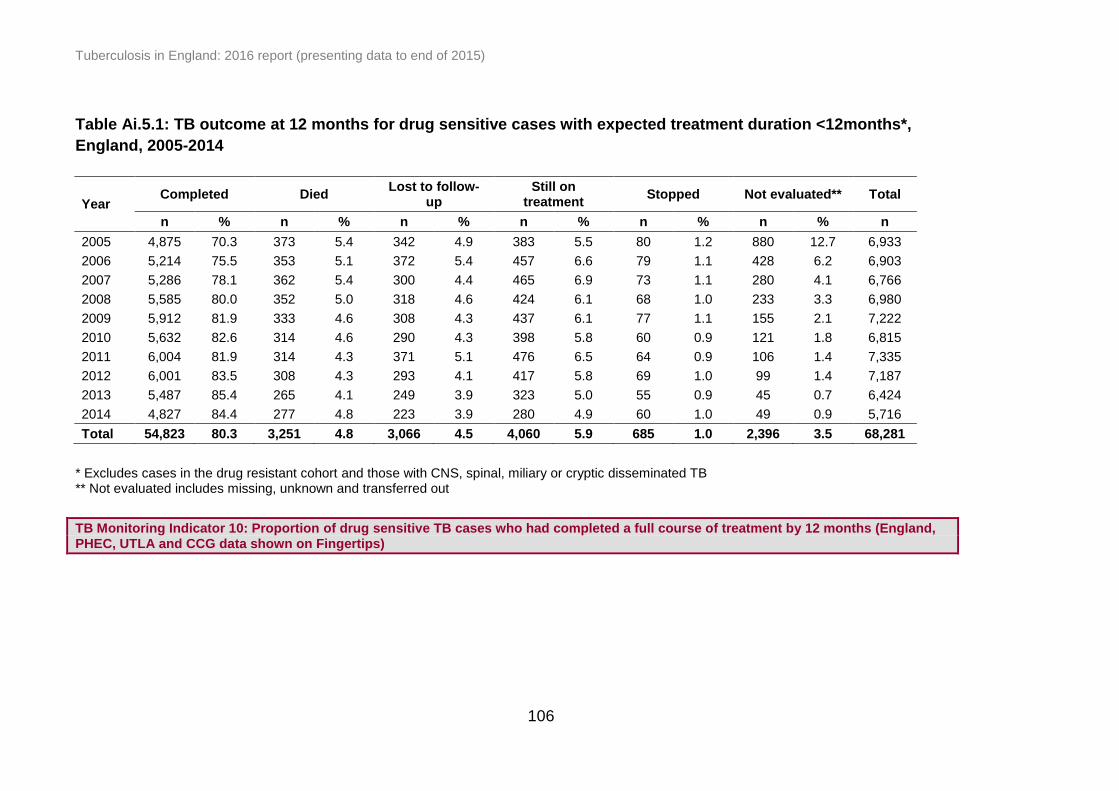
Tuberculosis in England: 2016 report (presenting data to end of 2015)
106
Table Ai.5.1: TB outcome at 12 months for drug sensitive cases with expected treatment duration <12months*,
England, 2005-2014
Year Completed Died
Lost to follow-up
Still on treatment
Stopped Not evaluated** Total
n % n % n % n % n % n % n
2005 4,875 70.3 373 5.4 342 4.9 383 5.5 80 1.2 880 12.7 6,933
2006 5,214 75.5 353 5.1 372 5.4 457 6.6 79 1.1 428 6.2 6,903
2007 5,286 78.1 362 5.4 300 4.4 465 6.9 73 1.1 280 4.1 6,766
2008 5,585 80.0 352 5.0 318 4.6 424 6.1 68 1.0 233 3.3 6,980
2009 5,912 81.9 333 4.6 308 4.3 437 6.1 77 1.1 155 2.1 7,222
2010 5,632 82.6 314 4.6 290 4.3 398 5.8 60 0.9 121 1.8 6,815
2011 6,004 81.9 314 4.3 371 5.1 476 6.5 64 0.9 106 1.4 7,335
2012 6,001 83.5 308 4.3 293 4.1 417 5.8 69 1.0 99 1.4 7,187
2013 5,487 85.4 265 4.1 249 3.9 323 5.0 55 0.9 45 0.7 6,424
2014 4,827 84.4 277 4.8 223 3.9 280 4.9 60 1.0 49 0.9 5,716
Total 54,823 80.3 3,251 4.8 3,066 4.5 4,060 5.9 685 1.0 2,396 3.5 68,281
* Excludes cases in the drug resistant cohort and those with CNS, spinal, miliary or cryptic disseminated TB ** Not evaluated includes missing, unknown and transferred out
TB Monitoring Indicator 10: Proportion of drug sensitive TB cases who had completed a full course of treatment by 12 months (England, PHEC, UTLA and CCG data shown on Fingertips)

Tuberculosis in England: 2016 report (presenting data to end of 2015)
107
Table Ai.5.2: Last recorded TB outcome for drug sensitive cases with expected treatment duration <12months*,
England, 2005-2014
Year Completed Died Lost to follow-up Still on treatment Stopped Not evaluated** Total
n % n % n % n % n % n % n
2005 5,079 73.3 377 5.4 342 4.9 175 2.5 80 1.2 880 12.7 6,933
2006 5,463 79.1 359 5.2 375 5.4 198 2.9 80 1.2 428 6.2 6,903
2007 5,582 82.5 367 5.4 302 4.5 161 2.4 74 1.1 280 4.1 6,766
2008 5,888 84.4 356 5.1 325 4.7 107 1.5 71 1.0 233 3.3 6,980
2009 6,235 86.3 341 4.7 309 4.3 104 1.4 78 1.1 155 2.1 7,222
2010 5,923 86.9 318 4.7 295 4.3 96 1.4 62 0.9 121 1.8 6,815
2011 6,467 88.2 317 4.3 373 5.1 5 0.1 67 0.9 106 1.4 7,335
2012 6,387 88.9 317 4.4 306 4.3 5 0.1 73 1.0 99 1.4 7,187
2013 5,788 90.1 268 4.2 252 3.9 8 0.1 63 1.0 45 0.7 6,424
2014# 4,951 86.6 279 4.9 224 3.9 153 2.7 60 1.0 49 0.9 5,716
Total 57,763 84.6 3,299 4.8 3,103 4.5 1,012 1.5 708 1.0 2,396 3.5 68,281
* Excludes cases in the drug resistant cohort and those with CNS, spinal, miliary or cryptic disseminated TB ** Not evaluated includes missing, unknown and transferred out # Reduced follow-up period for this group, therefore proportion completed expected to increase and proportion still on treatment expected to decrease
in future reporting
TB Monitoring Indicator 11: Proportion of drug sensitive TB cases who were lost to follow-up at last recorded outcome (England, PHEC, UTLA and CCG data shown on Fingertips) TB Monitoring Indicator 12: Proportion of drug sensitive TB cases who had died at last recorded outcome (England, PHEC, UTLA and CCG data shown on Fingertips)

Tuberculosis in England: 2016 report (presenting data to end of 2015)
108
Table Ai.5.3: Time to treatment completion for drug sensitive cases with expected treatment duration <12months*,
England, 2005-2014
Year
<6 months to complete
#
6-8 months to complete
#
8-10 months to complete
10-12 months to complete
>12 months to complete
Completion time known
Treatment completed**
n % n % n % n % n % n % N
2005 251 6.4 2,902 73.4 373 9.4 232 5.9 194 4.9 3,952 77.8 5,079
2006 249 5.8 3,116 72.1 475 11.0 252 5.8 228 5.3 4,320 79.1 5,463
2007 298 6.6 3,239 72.3 432 9.6 242 5.4 272 6.1 4,483 80.3 5,582
2008 269 5.6 3,509 72.5 514 10.6 272 5.6 279 5.8 4,843 82.3 5,888
2009 372 6.7 3,974 71.4 562 10.1 360 6.5 299 5.4 5,567 89.3 6,235
2010 321 5.9 3,981 72.6 581 10.6 332 6.1 267 4.9 5,482 92.6 5,923
2011 325 5.3 4,343 71.5 662 10.9 315 5.2 432 7.1 6,077 94.0 6,467
2012 303 5.0 4,405 72.7 614 10.1 367 6.1 366 6.0 6,055 94.8 6,387
2013 303 5.5 4,022 72.5 567 10.2 375 6.8 278 5.0 5,545 95.8 5,788
2014 268 5.5 3,563 73.3 536 11.0 381 7.8 114 2.3 4,862 98.2 4,951
Total 2,959 5.8 37,054 72.4 5,316 10.4 3,128 6.1 2,729 5.3 51,186 88.6 57,763
* Excludes cases in the drug resistant cohort and those with CNS, spinal, miliary or cryptic disseminated TB ** Treatment completed at last recorded outcome # Cases with completion between 168 and 180 days are included in the 6-8 months category

Tuberculosis in England: 2016 report (presenting data to end of 2015)
109
Table Ai.5.4: Treatment completion at 12 months by age group for drug sensitive cases with expected treatment
duration <12months*, England, 2005-2014
Year
Age group (years)
0-14 15-44 45-64 65+
n % n % n % n %
2005 303 79.5 3,221 74.0 811 65.5 539 56.3
2006 286 85.4 3,398 78.5 978 76.2 552 57.6
2007 364 86.1 3,362 80.9 1004 78.8 556 60.9
2008 375 89.3 3,592 82.5 1,071 81.1 545 61.8
2009 346 92.5 3,726 84.7 1,185 80.9 655 66.6
2010 301 91.8 3,556 85.5 1,147 82.1 628 67.6
2011 300 85.2 3,791 84.5 1,281 82.6 632 66.9
2012 334 91.0 3,770 86.1 1,250 84.1 647 67.9
2013 249 91.9 3,348 87.6 1,248 86.5 642 72.4
2014 231 93.5 2,900 87.8 1,104 84.0 592 69.6
Total 3,089 88.3 34,664 83.0 11,079 80.4 5,988 64.7
* Excludes cases in the drug resistant cohort and those with CNS, spinal, miliary or cryptic disseminated TB
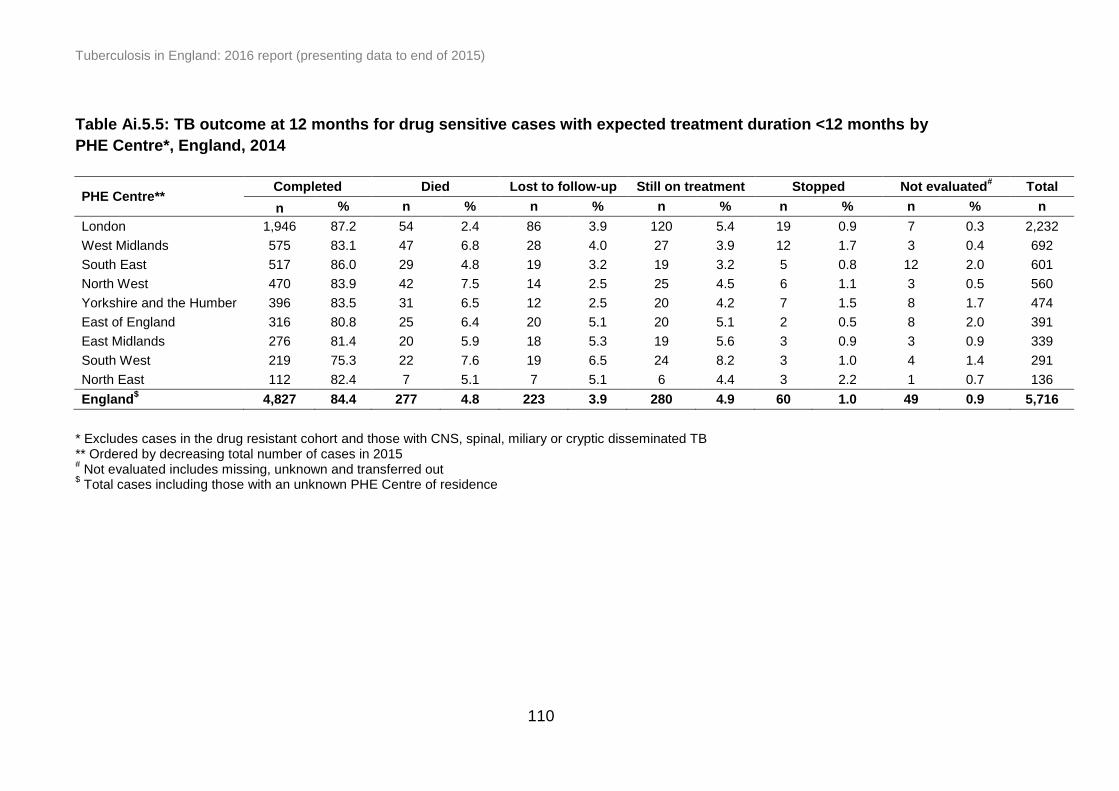
Tuberculosis in England: 2016 report (presenting data to end of 2015)
110
Table Ai.5.5: TB outcome at 12 months for drug sensitive cases with expected treatment duration <12 months by
PHE Centre*, England, 2014
PHE Centre** Completed Died Lost to follow-up Still on treatment Stopped Not evaluated
# Total
n % n % n % n % n % n % n
London 1,946 87.2 54 2.4 86 3.9 120 5.4 19 0.9 7 0.3 2,232
West Midlands 575 83.1 47 6.8 28 4.0 27 3.9 12 1.7 3 0.4 692
South East 517 86.0 29 4.8 19 3.2 19 3.2 5 0.8 12 2.0 601
North West 470 83.9 42 7.5 14 2.5 25 4.5 6 1.1 3 0.5 560
Yorkshire and the Humber 396 83.5 31 6.5 12 2.5 20 4.2 7 1.5 8 1.7 474
East of England 316 80.8 25 6.4 20 5.1 20 5.1 2 0.5 8 2.0 391
East Midlands 276 81.4 20 5.9 18 5.3 19 5.6 3 0.9 3 0.9 339
South West 219 75.3 22 7.6 19 6.5 24 8.2 3 1.0 4 1.4 291
North East 112 82.4 7 5.1 7 5.1 6 4.4 3 2.2 1 0.7 136
England$ 4,827 84.4 277 4.8 223 3.9 280 4.9 60 1.0 49 0.9 5,716
* Excludes cases in the drug resistant cohort and those with CNS, spinal, miliary or cryptic disseminated TB ** Ordered by decreasing total number of cases in 2015 # Not evaluated includes missing, unknown and transferred out
$ Total cases including those with an unknown PHE Centre of residence

Tuberculosis in England: 2016 report (presenting data to end of 2015)
111
Table Ai.5.6: Treatment completion at 12 months for drug sensitive cases with expected treatment duration
<12months* by PHE Centre, England, 2005-2014
PHE Centre** 2005 2006 2007 2008 2009 2010 2011 2012 2013 2014
n % n % n % n % n % n % n % n % n % n %
London 2,440 78.8 2,428 81.9 2,338 82.8 2,539 85.4 2,580 86.4 2,435 86.0 2,617 85.5 2,573 85.9 2,249 86.6 1,946 87.2
West Midlands 570 68.7 565 67.7 672 77.2 758 82.7 743 81.8 633 80.0 723 81.1 823 85.6 735 85.8 575 83.1
South East 373 69.6 382 70.0 405 70.7 417 75.1 507 79.8 510 79.8 603 83.3 583 83.0 528 87.1 517 86.0
North West 469 68.9 476 75.9 490 74.7 507 76.8 588 80.8 601 84.6 589 80.5 574 83.6 542 83.8 470 83.9
Yorkshire and the Humber 354 71.5 420 72.4 402 70.4 427 74.8 467 77.1 425 75.2 428 72.4 435 81.2 457 86.4 396 83.5
East of England 310 72.8 328 75.8 291 78.2 325 71.9 352 78.0 369 80.0 402 81.5 348 78.7 338 83.9 316 80.8
East Midlands 138 28.0 389 74.8 382 80.6 332 77.4 390 80.7 369 84.8 359 81.8 351 80.1 317 88.1 276 81.4
South West 142 57.7 128 49.6 167 67.9 160 62.3 174 63.7 179 74.0 194 68.8 194 70.8 222 73.5 219 75.3
North East 77 61.1 98 71.0 139 78.1 120 72.7 111 72.5 111 79.3 89 73.6 120 78.9 99 81.1 112 82.4
England# 4,875 70.3 5,214 75.5 5,286 78.1 5,585 80.0 5,912 81.9 5,632 82.6 6,004 81.9 6,001 83.5 5,487 85.4 4,827 84.4
* Excludes cases in the drug resistant cohort and those with CNS, spinal, miliary or cryptic disseminated TB ** Ordered by decreasing total number of cases in 2015 # Total cases including those with an unknown PHE Centre of residence
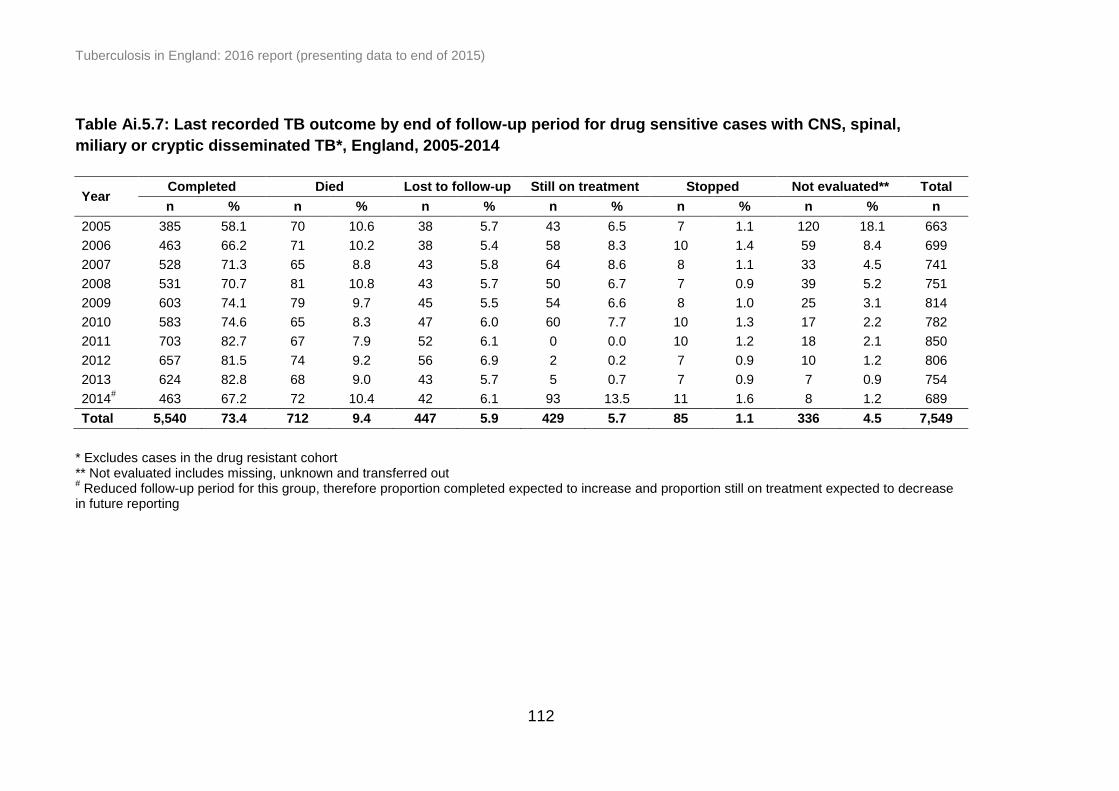
Tuberculosis in England: 2016 report (presenting data to end of 2015)
112
Table Ai.5.7: Last recorded TB outcome by end of follow-up period for drug sensitive cases with CNS, spinal,
miliary or cryptic disseminated TB*, England, 2005-2014
Year Completed Died Lost to follow-up Still on treatment Stopped Not evaluated** Total
n % n % n % n % n % n % n
2005 385 58.1 70 10.6 38 5.7 43 6.5 7 1.1 120 18.1 663
2006 463 66.2 71 10.2 38 5.4 58 8.3 10 1.4 59 8.4 699
2007 528 71.3 65 8.8 43 5.8 64 8.6 8 1.1 33 4.5 741
2008 531 70.7 81 10.8 43 5.7 50 6.7 7 0.9 39 5.2 751
2009 603 74.1 79 9.7 45 5.5 54 6.6 8 1.0 25 3.1 814
2010 583 74.6 65 8.3 47 6.0 60 7.7 10 1.3 17 2.2 782
2011 703 82.7 67 7.9 52 6.1 0 0.0 10 1.2 18 2.1 850
2012 657 81.5 74 9.2 56 6.9 2 0.2 7 0.9 10 1.2 806
2013 624 82.8 68 9.0 43 5.7 5 0.7 7 0.9 7 0.9 754
2014# 463 67.2 72 10.4 42 6.1 93 13.5 11 1.6 8 1.2 689
Total 5,540 73.4 712 9.4 447 5.9 429 5.7 85 1.1 336 4.5 7,549
* Excludes cases in the drug resistant cohort ** Not evaluated includes missing, unknown and transferred out # Reduced follow-up period for this group, therefore proportion completed expected to increase and proportion still on treatment expected to decrease
in future reporting
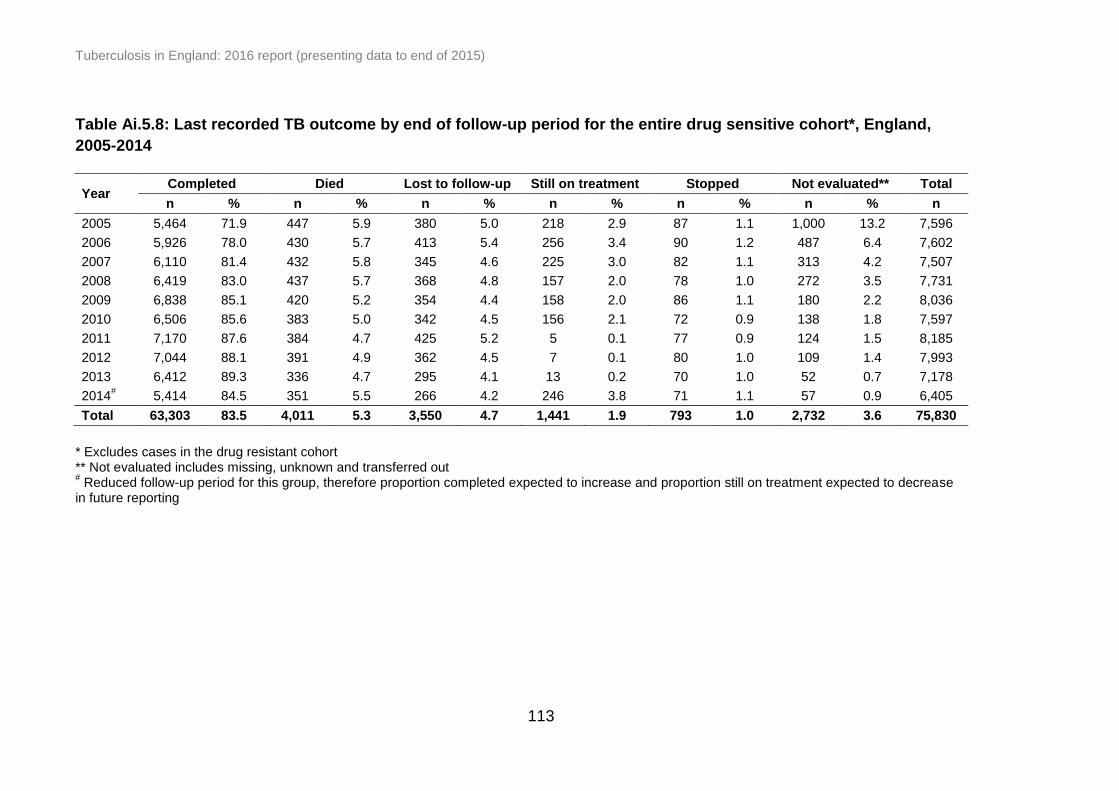
Tuberculosis in England: 2016 report (presenting data to end of 2015)
113
Table Ai.5.8: Last recorded TB outcome by end of follow-up period for the entire drug sensitive cohort*, England,
2005-2014
Year Completed Died Lost to follow-up Still on treatment Stopped Not evaluated** Total
n % n % n % n % n % n % n
2005 5,464 71.9 447 5.9 380 5.0 218 2.9 87 1.1 1,000 13.2 7,596
2006 5,926 78.0 430 5.7 413 5.4 256 3.4 90 1.2 487 6.4 7,602
2007 6,110 81.4 432 5.8 345 4.6 225 3.0 82 1.1 313 4.2 7,507
2008 6,419 83.0 437 5.7 368 4.8 157 2.0 78 1.0 272 3.5 7,731
2009 6,838 85.1 420 5.2 354 4.4 158 2.0 86 1.1 180 2.2 8,036
2010 6,506 85.6 383 5.0 342 4.5 156 2.1 72 0.9 138 1.8 7,597
2011 7,170 87.6 384 4.7 425 5.2 5 0.1 77 0.9 124 1.5 8,185
2012 7,044 88.1 391 4.9 362 4.5 7 0.1 80 1.0 109 1.4 7,993
2013 6,412 89.3 336 4.7 295 4.1 13 0.2 70 1.0 52 0.7 7,178
2014# 5,414 84.5 351 5.5 266 4.2 246 3.8 71 1.1 57 0.9 6,405
Total 63,303 83.5 4,011 5.3 3,550 4.7 1,441 1.9 793 1.0 2,732 3.6 75,830
* Excludes cases in the drug resistant cohort ** Not evaluated includes missing, unknown and transferred out # Reduced follow-up period for this group, therefore proportion completed expected to increase and proportion still on treatment expected to decrease
in future reporting

Tuberculosis in England: 2016 report (presenting data to end of 2015)
114
Table Ai.5.9: Died at last recorded outcome for the entire drug sensitive cohort*, England, 2005-2014
Year
TB caused or contributed to
death
TB incidental to death
Unknown Total deaths Cases
reported
n % n % n % n % n
2005 141 31.5 102 22.8 204 45.6 447 5.9 7,596
2006 138 32.1 88 20.5 204 47.4 430 5.7 7,602
2007 142 32.9 85 19.7 205 47.5 432 5.8 7,507
2008 145 33.2 97 22.2 195 44.6 437 5.7 7,731
2009 149 35.5 88 21.0 183 43.6 420 5.2 8,036
2010 103 26.9 101 26.4 179 46.7 383 5.0 7,597
2011 105 27.3 88 22.9 191 49.7 384 4.7 8,185
2012 116 29.7 87 22.3 188 48.1 391 4.9 7,993
2013 109 32.4 70 20.8 157 46.7 336 4.7 7,178
2014** 112 31.9 72 20.5 167 47.6 351 5.5 6,405
Total 1,260 31.4 878 21.9 1,873 46.7 4,011 5.3 75,830
* Excludes cases in the drug resistant cohort ** Reduced follow-up period for this group, therefore proportion expected to increase in future reporting
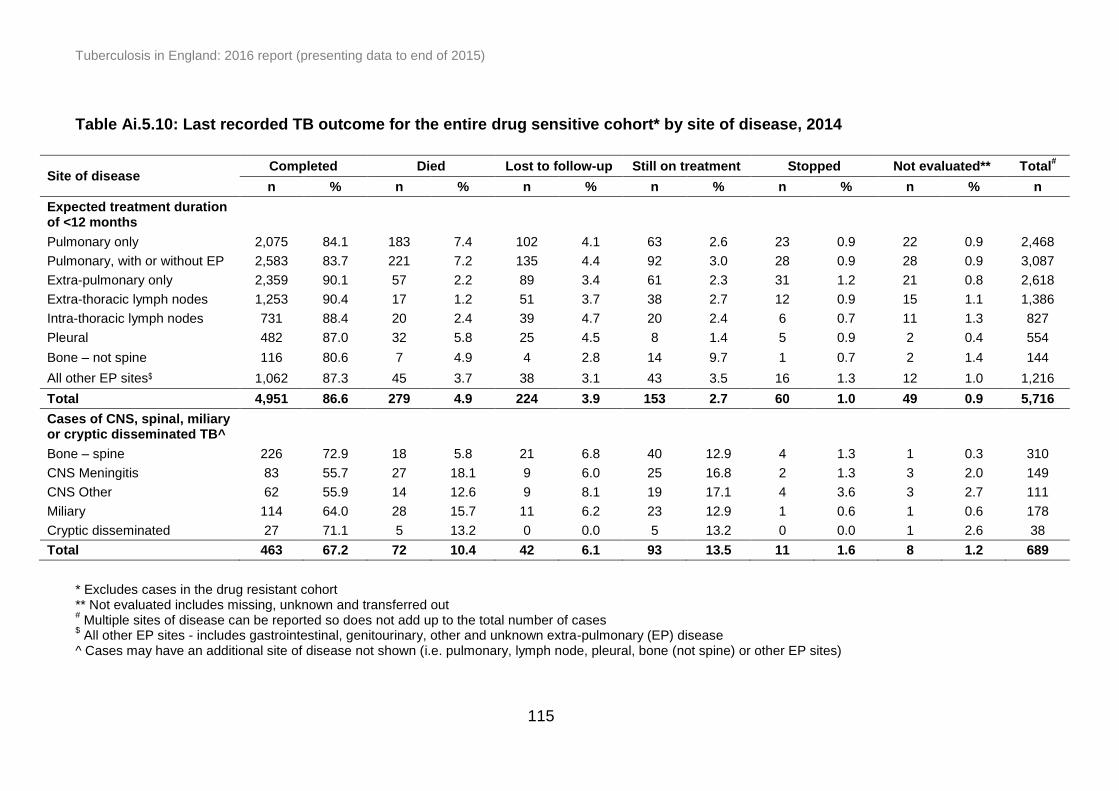
Tuberculosis in England: 2016 report (presenting data to end of 2015)
115
Table Ai.5.10: Last recorded TB outcome for the entire drug sensitive cohort* by site of disease, 2014
Site of disease Completed Died Lost to follow-up Still on treatment Stopped Not evaluated** Total
#
n % n % n % n % n % n % n
Expected treatment duration of <12 months
Pulmonary only 2,075 84.1 183 7.4 102 4.1 63 2.6 23 0.9 22 0.9 2,468
Pulmonary, with or without EP 2,583 83.7 221 7.2 135 4.4 92 3.0 28 0.9 28 0.9 3,087
Extra-pulmonary only 2,359 90.1 57 2.2 89 3.4 61 2.3 31 1.2 21 0.8 2,618
Extra-thoracic lymph nodes 1,253 90.4 17 1.2 51 3.7 38 2.7 12 0.9 15 1.1 1,386
Intra-thoracic lymph nodes 731 88.4 20 2.4 39 4.7 20 2.4 6 0.7 11 1.3 827
Pleural 482 87.0 32 5.8 25 4.5 8 1.4 5 0.9 2 0.4 554
Bone – not spine 116 80.6 7 4.9 4 2.8 14 9.7 1 0.7 2 1.4 144
All other EP sites$ 1,062 87.3 45 3.7 38 3.1 43 3.5 16 1.3 12 1.0 1,216
Total 4,951 86.6 279 4.9 224 3.9 153 2.7 60 1.0 49 0.9 5,716
Cases of CNS, spinal, miliary or cryptic disseminated TB^
Bone – spine 226 72.9 18 5.8 21 6.8 40 12.9 4 1.3 1 0.3 310
CNS Meningitis 83 55.7 27 18.1 9 6.0 25 16.8 2 1.3 3 2.0 149
CNS Other 62 55.9 14 12.6 9 8.1 19 17.1 4 3.6 3 2.7 111
Miliary 114 64.0 28 15.7 11 6.2 23 12.9 1 0.6 1 0.6 178
Cryptic disseminated 27 71.1 5 13.2 0 0.0 5 13.2 0 0.0 1 2.6 38
Total 463 67.2 72 10.4 42 6.1 93 13.5 11 1.6 8 1.2 689
* Excludes cases in the drug resistant cohort ** Not evaluated includes missing, unknown and transferred out # Multiple sites of disease can be reported so does not add up to the total number of cases
$ All other EP sites - includes gastrointestinal, genitourinary, other and unknown extra-pulmonary (EP) disease
^ Cases may have an additional site of disease not shown (i.e. pulmonary, lymph node, pleural, bone (not spine) or other EP sites)

Tuberculosis in England: 2016 report (presenting data to end of 2015)
116
Table Ai.5.11: Last recorded TB outcome for the entire drug sensitive cohort* by PHE Centre, England, 2014
PHE Centre** Completed Died
Lost to follow-up
Still on treatment
Stopped Not evaluated# Total
n % n % n % n % n % n % n
London 2,173 86.0 75 3.0 103 4.1 149 5.9 21 0.8 7 0.3 2,528
West Midlands 656 85.4 55 7.2 30 3.9 11 1.4 13 1.7 3 0.4 768
South East 572 86.5 37 5.6 22 3.3 11 1.7 5 0.8 14 2.1 661
North West 530 83.6 56 8.8 18 2.8 17 2.7 9 1.4 4 0.6 634
Yorkshire and the Humber 433 84.9 33 6.5 16 3.1 9 1.8 8 1.6 11 2.2 510
East of England 350 81.8 28 6.5 24 5.6 15 3.5 3 0.7 8 1.9 428
East Midlands 318 80.3 28 7.1 24 6.1 18 4.5 4 1.0 4 1.0 396
South West 248 79.0 27 8.6 21 6.7 11 3.5 3 1.0 4 1.3 314
North East 134 80.7 12 7.2 8 4.8 5 3.0 5 3.0 2 1.2 166
England 5,414 84.5 351 5.5 266 4.2 246 3.8 71 1.1 57 0.9 6,405
* Excludes cases in the drug resistant cohort ** Ordered by decreasing total number of cases in 2015 # Not evaluated includes missing, unknown and transferred out
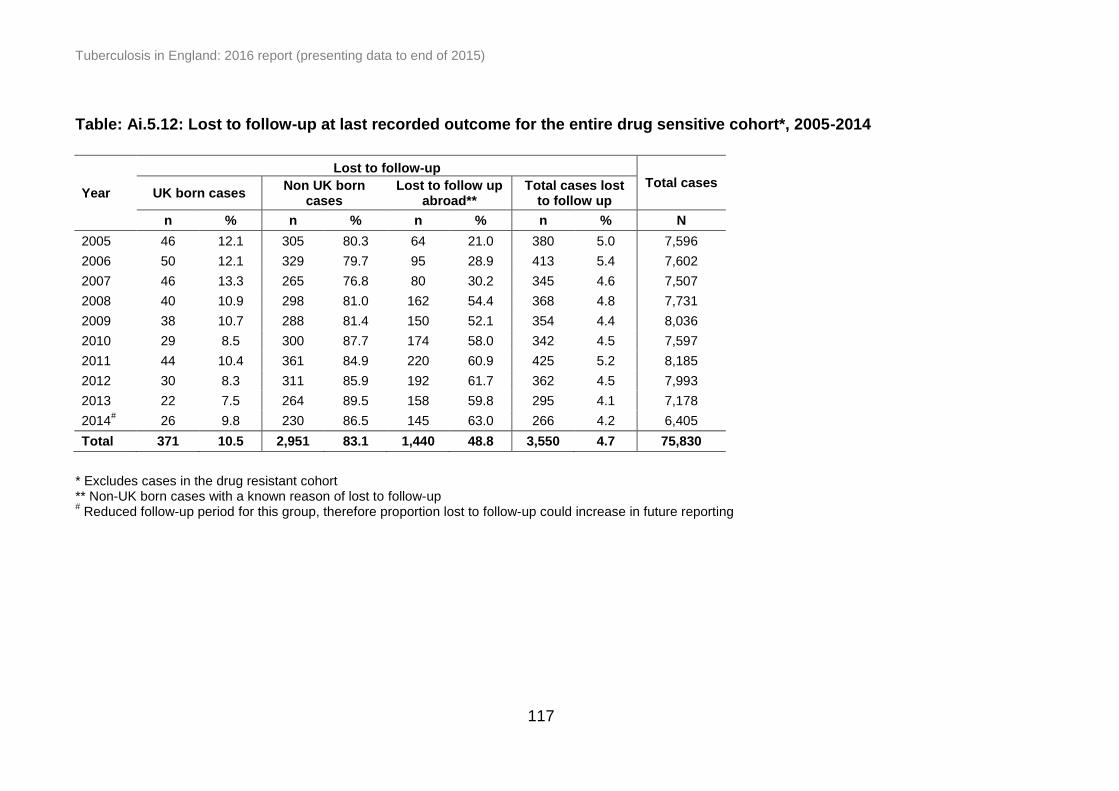
Tuberculosis in England: 2016 report (presenting data to end of 2015)
117
Table: Ai.5.12: Lost to follow-up at last recorded outcome for the entire drug sensitive cohort*, 2005-2014
Year
Lost to follow-up Total cases
UK born cases Non UK born
cases Lost to follow up
abroad** Total cases lost
to follow up
n % n % n % n % N
2005 46 12.1 305 80.3 64 21.0 380 5.0 7,596
2006 50 12.1 329 79.7 95 28.9 413 5.4 7,602
2007 46 13.3 265 76.8 80 30.2 345 4.6 7,507
2008 40 10.9 298 81.0 162 54.4 368 4.8 7,731
2009 38 10.7 288 81.4 150 52.1 354 4.4 8,036
2010 29 8.5 300 87.7 174 58.0 342 4.5 7,597
2011 44 10.4 361 84.9 220 60.9 425 5.2 8,185
2012 30 8.3 311 85.9 192 61.7 362 4.5 7,993
2013 22 7.5 264 89.5 158 59.8 295 4.1 7,178
2014# 26 9.8 230 86.5 145 63.0 266 4.2 6,405
Total 371 10.5 2,951 83.1 1,440 48.8 3,550 4.7 75,830
* Excludes cases in the drug resistant cohort ** Non-UK born cases with a known reason of lost to follow-up # Reduced follow-up period for this group, therefore proportion lost to follow-up could increase in future reporting

Tuberculosis in England: 2016 report (presenting data to end of 2015)
118
Table Ai.6.1: Number and proportion of TB cases with first line drug susceptibility results, England, 2006-2015
Year
Culture Drug susceptibility testing (2 first line
drugs)*
Drug susceptibility testing (all first
line drugs)** confirmed cases
n % n % n %
2006 4,668 60.8 4,631 99.2 4,607 98.7
2007 4,448 58.7 4,398 98.9 4,366 98.2
2008 4,537 58.1 4,480 98.7 4,429 97.6
2009 4,670 57.6 4,599 98.5 4,521 96.8
2010 4,609 60.0 4,559 98.9 4,517 98.0
2011 5,031 60.8 4,967 98.7 4,895 97.3
2012 4,897 60.6 4,852 99.1 4,787 97.8
2013 4,393 60.5 4,332 98.6 4,287 97.6
2014 3,924 60.6 3,898 99.3 3,832 97.7
2015 3,460 60.1 3,440 99.4 3,385 97.8
Total 44,637 59.7 44,156 98.9 43,626 97.7
* Culture confirmed cases that have been tested for isoniazid and rifampicin
** Culture confirmed cases that have been tested for isoniazid, rifampicin, ethambutol and pyrazinamide
TB Monitoring Indicator 9: Proportion of microbiologically confirmed cases with drug susceptibility testing reported for the four first line agents (England, PHEC and UTLA data shown on Fingertips)

Tuberculosis in England: 2016 report (presenting data to end of 2015)
119
Table Ai.6.2: Number and proportion of TB cases with first line drug resistance*, England, 2006-2015
Year
Isoniazid Rifampicin Ethambutol Pyrazinamide Resistant to any
resistant resistant resistant resistant** first line drug
n % n % n % n % n %
2006 337 7.3 74 1.6 25 0.5 22 0.5 370 8.0
2007 305 6.9 62 1.4 26 0.6 26 0.6 332 7.5
2008 266 5.9 68 1.5 34 0.8 35 0.8 305 6.8
2009 327 7.1 70 1.5 27 0.6 49 1.1 369 8.0
2010 292 6.4 75 1.6 34 0.7 40 0.9 321 7.0
2011 376 7.6 89 1.8 55 1.1 46 0.9 412 8.3
2012 330 6.8 87 1.8 48 1.0 44 0.9 358 7.4
2013 305 7.0 79 1.8 40 0.9 38 0.9 332 7.7
2014 267 6.8 56 1.4 42 1.1 30 0.8 286 7.3
2015 238 6.9 54 1.6 27 0.8 24 0.7 255 7.4
Total 3,046 6.9 714 1.6 358 0.8 355 0.8 3,344 7.6
* Of culture confirmed cases with drug susceptibility results for at least isoniazid and rifampicin ** Excludes M. bovis cases, which are inherently resistant to pyrazinamide
TB Monitoring Indicator 18: Number and proportion of culture confirmed TB cases with any first line drug resistance (England and PHEC)
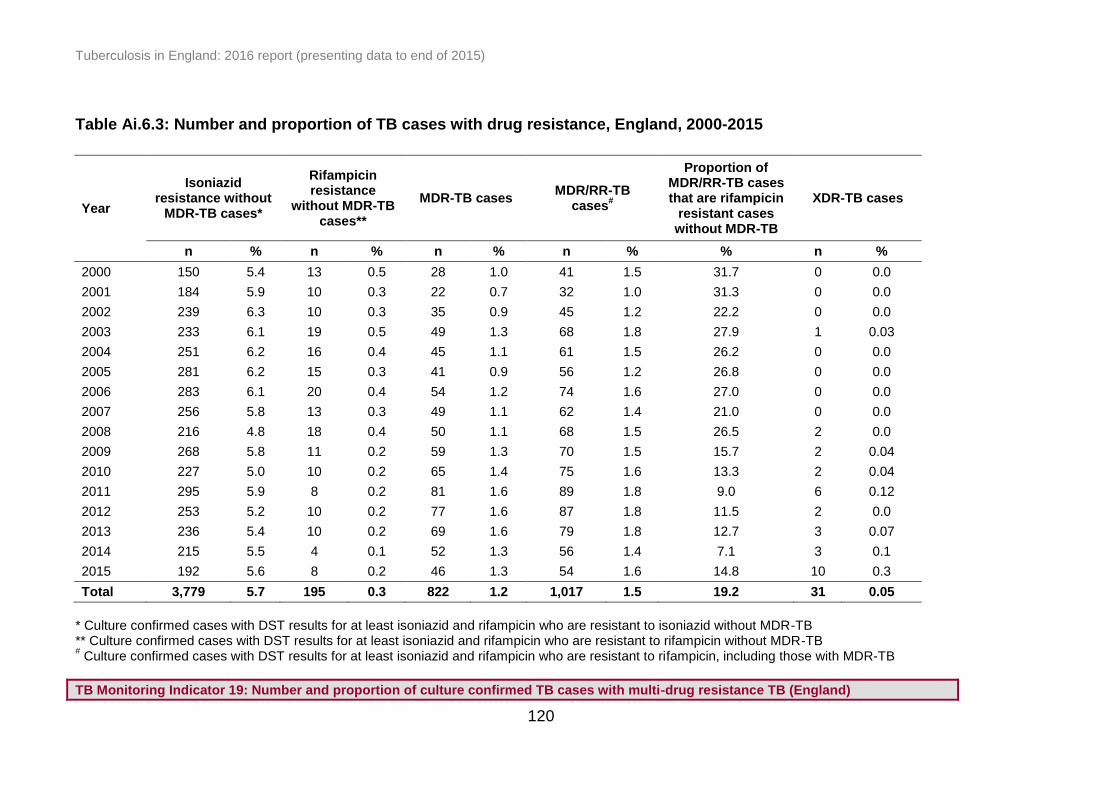
Tuberculosis in England: 2016 report (presenting data to end of 2015)
120
Table Ai.6.3: Number and proportion of TB cases with drug resistance, England, 2000-2015
Year
Isoniazid resistance without
MDR-TB cases*
Rifampicin resistance
without MDR-TB cases**
MDR-TB cases MDR/RR-TB
cases#
Proportion of MDR/RR-TB cases that are rifampicin
resistant cases without MDR-TB
XDR-TB cases
n % n % n % n % % n %
2000 150 5.4 13 0.5 28 1.0 41 1.5 31.7 0 0.0
2001 184 5.9 10 0.3 22 0.7 32 1.0 31.3 0 0.0
2002 239 6.3 10 0.3 35 0.9 45 1.2 22.2 0 0.0
2003 233 6.1 19 0.5 49 1.3 68 1.8 27.9 1 0.03
2004 251 6.2 16 0.4 45 1.1 61 1.5 26.2 0 0.0
2005 281 6.2 15 0.3 41 0.9 56 1.2 26.8 0 0.0
2006 283 6.1 20 0.4 54 1.2 74 1.6 27.0 0 0.0
2007 256 5.8 13 0.3 49 1.1 62 1.4 21.0 0 0.0
2008 216 4.8 18 0.4 50 1.1 68 1.5 26.5 2 0.0
2009 268 5.8 11 0.2 59 1.3 70 1.5 15.7 2 0.04
2010 227 5.0 10 0.2 65 1.4 75 1.6 13.3 2 0.04
2011 295 5.9 8 0.2 81 1.6 89 1.8 9.0 6 0.12
2012 253 5.2 10 0.2 77 1.6 87 1.8 11.5 2 0.0
2013 236 5.4 10 0.2 69 1.6 79 1.8 12.7 3 0.07
2014 215 5.5 4 0.1 52 1.3 56 1.4 7.1 3 0.1
2015 192 5.6 8 0.2 46 1.3 54 1.6 14.8 10 0.3
Total 3,779 5.7 195 0.3 822 1.2 1,017 1.5 19.2 31 0.05
* Culture confirmed cases with DST results for at least isoniazid and rifampicin who are resistant to isoniazid without MDR-TB ** Culture confirmed cases with DST results for at least isoniazid and rifampicin who are resistant to rifampicin without MDR-TB # Culture confirmed cases with DST results for at least isoniazid and rifampicin who are resistant to rifampicin, including those with MDR-TB
TB Monitoring Indicator 19: Number and proportion of culture confirmed TB cases with multi-drug resistance TB (England)

Tuberculosis in England: 2016 report (presenting data to end of 2015)
121
Table Ai.6.4: Number and proportion of TB cases with drug resistance by PHE Centre, England, 2011-2015
PHE Centre*
Isoniazid resistance without
MDR-TB cases MDR-TB cases
MDR/RR-TB cases
XDR-TB cases Total**
n % n % n % n % n
London 553 6.3 143 1.6 163 1.9 8 0.1 8,757
West Midlands 112 4.4 43 1.7 49 1.9 2 0.1 2,525
South East 122 5.6 23 1.0 27 1.2 2 0.1 2,191
North West 99 4.6 29 1.3 33 1.5 2 0.1 2,169
Yorkshire and the Humber 79 4.8 33 2.0 36 2.2 4 0.2 1,661
East of England 91 6.2 29 2.0 29 2.0 5 0.3 1,459
East Midlands 62 4.8 10 0.8 12 0.9 0 0.0 1,296
South West 55 6.1 7 0.8 8 0.9 1 0.1 908
North East 18 3.4 8 1.5 8 1.5 0 0.0 523
England 1,191 5.5 325 1.5 365 1.7 24 0.1 21,489
* Ordered by decreasing total number of TB cases in 2015 ** Culture confirmed cases with drug susceptibility results for at least isoniazid and rifampicin

Tuberculosis in England: 2016 report (presenting data to end of 2015)
122
Table Ai.6.5: Number and proportion of MDR/RR-TB cases with resistance to an injectable agent or a
fluoroquinolone, England, 2006-2015
Year
MDR/RR-TB
cases
Tested for resistance to at
least one injectable agent
Resistant to an injectable agent
Tested for resistance to at
least one fluoroquinolone
Resistant to a fluoroquinolone
n n % n % n % n %
2006 74 58 78.4 3 5.2 73 98.6 0 0.0
2007 62 52 83.9 2 3.8 61 98.4 4 6.6
2008 68 62 91.2 3 4.8 67 98.5 11 16.4
2009 70 64 91.4 5 7.8 68 97.1 7 10.3
2010 75 70 93.3 11 15.7 71 94.7 9 12.7
2011 89 88 98.9 14 15.9 89 100.0 21 23.6
2012 87 85 97.7 14 16.5 86 98.9 4 4.7
2013 79 75 94.9 12 16.0 79 100.0 11 13.9
2014 56 56 100.0 7 12.5 56 100.0 14 25.0
2015 54 52 96.3 12 23.1 54 100.0 15 27.8
Total 714 662 92.7 83 12.5 704 98.6 96 13.6
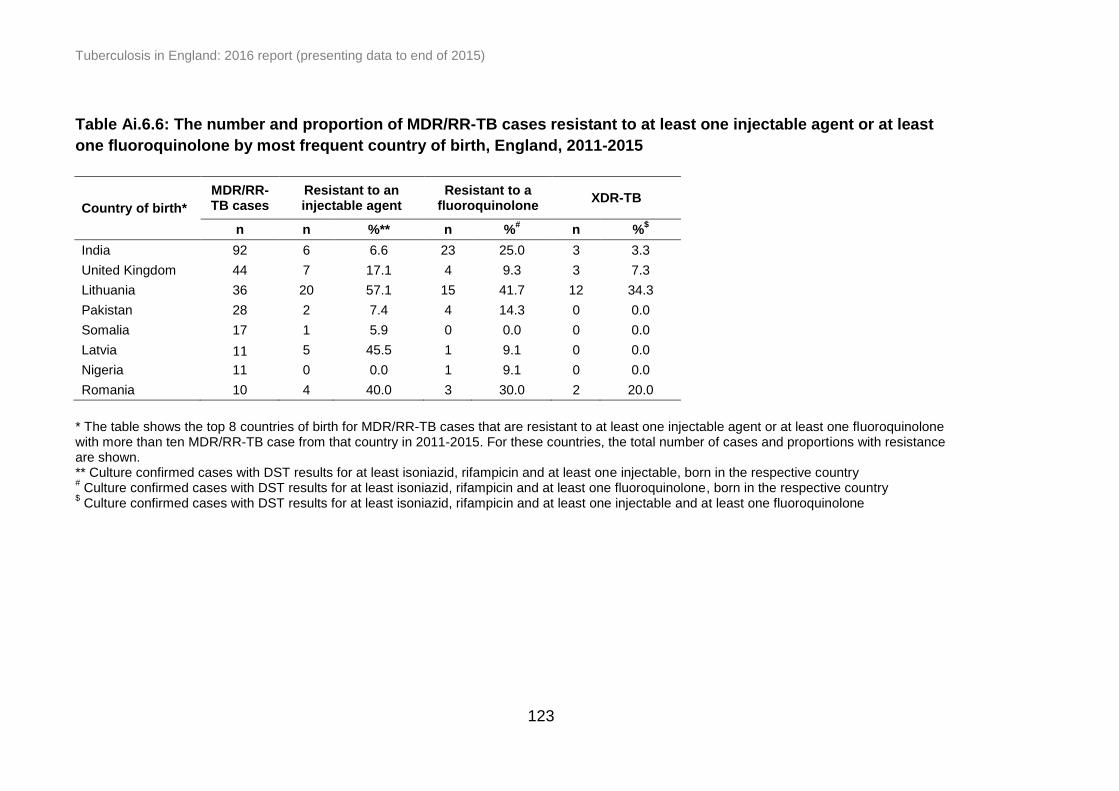
Tuberculosis in England: 2016 report (presenting data to end of 2015)
123
Table Ai.6.6: The number and proportion of MDR/RR-TB cases resistant to at least one injectable agent or at least
one fluoroquinolone by most frequent country of birth, England, 2011-2015
Country of birth*
MDR/RR-TB cases
Resistant to an injectable agent
Resistant to a fluoroquinolone
XDR-TB
n n %** n %# n %
$
India 92 6 6.6 23 25.0 3 3.3
United Kingdom 44 7 17.1 4 9.3 3 7.3
Lithuania 36 20 57.1 15 41.7 12 34.3
Pakistan 28 2 7.4 4 14.3 0 0.0
Somalia 17 1 5.9 0 0.0 0 0.0
Latvia 11 5 45.5 1 9.1 0 0.0
Nigeria 11 0 0.0 1 9.1 0 0.0
Romania 10 4 40.0 3 30.0 2 20.0
* The table shows the top 8 countries of birth for MDR/RR-TB cases that are resistant to at least one injectable agent or at least one fluoroquinolone with more than ten MDR/RR-TB case from that country in 2011-2015. For these countries, the total number of cases and proportions with resistance are shown. ** Culture confirmed cases with DST results for at least isoniazid, rifampicin and at least one injectable, born in the respective country # Culture confirmed cases with DST results for at least isoniazid, rifampicin and at least one fluoroquinolone, born in the respective country
$ Culture confirmed cases with DST results for at least isoniazid, rifampicin and at least one injectable and at least one fluoroquinolone

Tuberculosis in England: 2016 report (presenting data to end of 2015)
124
Table Ai.6.7: TB outcome at 24 months for drug resistant TB cases*, England, 2004-2013
Year Completed Died
Lost to follow-up
Still on treatment
Stopped Not evaluated** Total
n % n % n % n % n % n % n
2004 37 52.1 4 5.6 9 12.7 12 16.9 3 4.2 6 8.5 71
2005 39 62.9 4 6.5 8 12.9 5 8.1 4 6.5 2 3.2 62
2006 41 51.2 2 2.5 8 10.0 24 30.0 3 3.8 2 2.5 80
2007 30 42.3 10 14.1 6 8.5 20 28.2 5 7.0 0 0.0 71
2008 45 57.7 6 7.7 10 12.8 10 12.8 4 5.1 3 3.8 78
2009 40 52.6 4 5.3 11 14.5 19 25.0 1 1.3 1 1.3 76
2010 38 48.1 0 0.0 9 11.4 26 32.9 4 5.1 2 2.5 79
2011 48 50.5 4 4.2 17 17.9 23 24.2 3 3.2 0 0.0 95
2012 56 60.2 3 3.2 10 10.8 19 20.4 5 5.4 0 0.0 93
2013 48 57.8 4 4.8 10 12.0 18 21.7 3 3.6 0 0.0 83
Total 422 53.6 41 5.2 98 12.4 176 22.3 35 4.4 16 2.0 788
* Includes initial and acquired MDR/RR-TB cases and and cases treated with an MDR-TB regimen only ** Not evaluated includes missing, unknown and transferred out
TB Monitoring Indicator 13: Proportion of TB cases with rifampicin resistance or MDR-TB who had completed treatment at 24 months (England)

Tuberculosis in England: 2016 report (presenting data to end of 2015)
125
Table Ai.6.8: Last recorded TB outcome for drug resistant TB cases*, England, 2004-2013
Year Completed Died
Lost to follow-up
Still on treatment
Stopped Not evaluated** Total
n % n % n % n % n % n % n
2004 49 69.0 4 5.6 9 12.7 4 5.6 3 4.2 2 2.8 71
2005 42 67.7 4 6.5 9 14.5 3 4.8 4 6.5 0 0.0 62
2006 58 72.5 3 3.8 8 10.0 7 8.8 3 3.8 1 1.3 80
2007 46 64.8 10 14.1 6 8.5 4 5.6 5 7.0 0 0.0 71
2008 53 67.9 7 9.0 10 12.8 4 5.1 4 5.1 0 0.0 78
2009 59 77.6 4 5.3 11 14.5 0 0.0 1 1.3 1 1.3 76
2010 60 75.9 1 1.3 9 11.4 4 5.1 5 6.3 0 0.0 79
2011 64 67.4 6 6.3 18 18.9 4 4.2 3 3.2 0 0.0 95
2012 73 78.5 4 4.3 11 11.8 0 0.0 5 5.4 0 0.0 93
2013# 60 72.3 4 4.8 11 13.3 5 6.0 3 3.6 0 0.0 83
Total 564 71.6 47 6.0 102 12.9 35 4.4 36 4.6 4 0.5 788
* Includes initial and acquired MDR/RR-TB cases and cases treated with an MDR-TB regimen only ** Not evaluated includes missing, unknown and transferred out # Reduced follow-up period for this group, therefore proportion completed expected to increase and proportion still on treatment expected to decrease
in future reporting
TB Monitoring Indicator 14: Proportion of TB cases with rifampicin resistance or MDR-TB who are lost to follow-up at reported outcome (England) TB Monitoring Indicator 15: Proportion of TB cases with rifampicin resistance or MDR-TB who had died at last reported outcome (England)
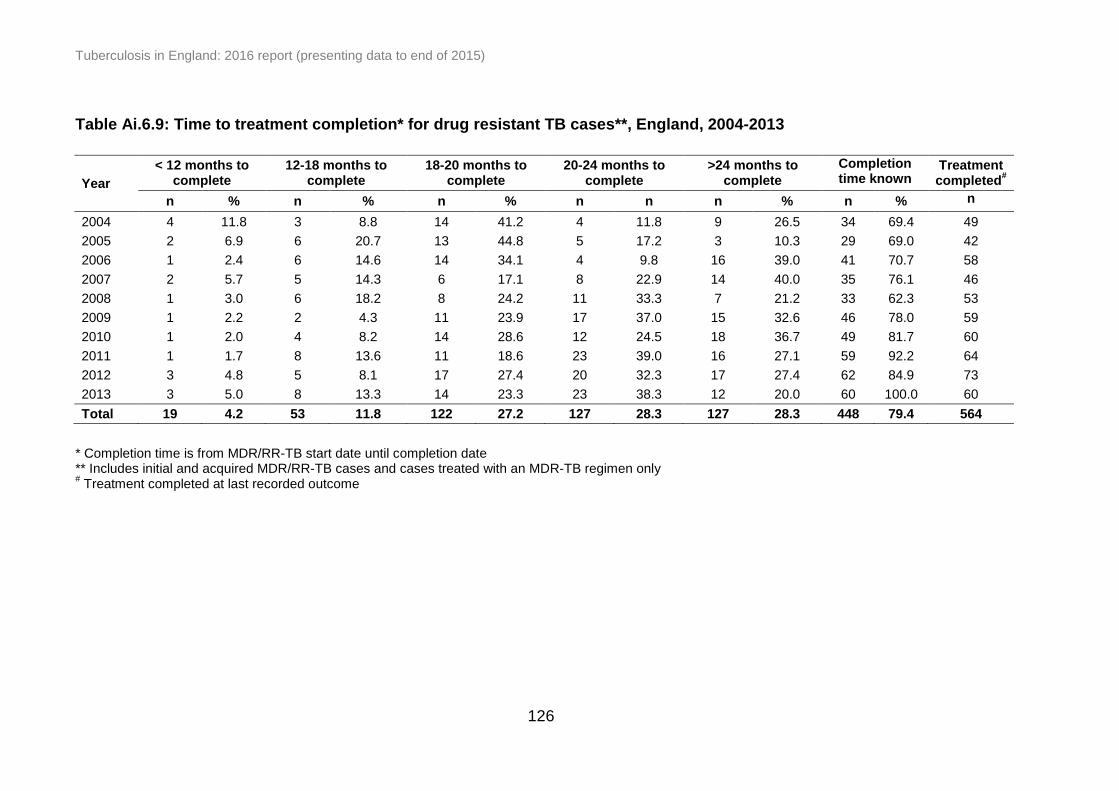
Tuberculosis in England: 2016 report (presenting data to end of 2015)
126
Table Ai.6.9: Time to treatment completion* for drug resistant TB cases**, England, 2004-2013
Year
< 12 months to complete
12-18 months to complete
18-20 months to complete
20-24 months to complete
>24 months to complete
Completion time known
Treatment completed
#
n % n % n % n n n % n % n
2004 4 11.8 3 8.8 14 41.2 4 11.8 9 26.5 34 69.4 49
2005 2 6.9 6 20.7 13 44.8 5 17.2 3 10.3 29 69.0 42
2006 1 2.4 6 14.6 14 34.1 4 9.8 16 39.0 41 70.7 58
2007 2 5.7 5 14.3 6 17.1 8 22.9 14 40.0 35 76.1 46
2008 1 3.0 6 18.2 8 24.2 11 33.3 7 21.2 33 62.3 53
2009 1 2.2 2 4.3 11 23.9 17 37.0 15 32.6 46 78.0 59
2010 1 2.0 4 8.2 14 28.6 12 24.5 18 36.7 49 81.7 60
2011 1 1.7 8 13.6 11 18.6 23 39.0 16 27.1 59 92.2 64
2012 3 4.8 5 8.1 17 27.4 20 32.3 17 27.4 62 84.9 73
2013 3 5.0 8 13.3 14 23.3 23 38.3 12 20.0 60 100.0 60
Total 19 4.2 53 11.8 122 27.2 127 28.3 127 28.3 448 79.4 564
* Completion time is from MDR/RR-TB start date until completion date ** Includes initial and acquired MDR/RR-TB cases and cases treated with an MDR-TB regimen only # Treatment completed at last recorded outcome

Tuberculosis in England: 2016 report (presenting data to end of 2015)
127
Table Ai.6.10: Drug resistant* TB cases reported as lost to follow-up at last recorded outcome by place of birth,
England, 2004-2013
Lost to follow-up Total cases
Year UK born Non UK born
Lost to follow up abroad**
Total cases lost to follow up
n % n % n % n % N
2004 0 0.0 8 88.9 4 57.1 9 12.7 71
2005 1 11.1 8 88.9 4 66.7 9 14.5 62
2006 1 12.5 7 87.5 4 80.0 8 10.0 80
2007 0 0.0 6 100.0 5 100.0 6 8.5 71
2008 0 0.0 10 100.0 8 80.0 10 12.8 78
2009 0 0.0 10 90.9 7 77.8 11 14.5 76
2010 0 0.0 9 100.0 9 100.0 9 11.4 79
2011 0 0.0 18 100.0 15 83.3 18 18.9 95
2012 1 9.1 10 90.9 7 77.8 11 11.8 93
2013# 0 0.0 11 100.0 8 80.0 11 13.3 83
Total 3 2.9 97 95.1 71 80.7 102 12.9 788
* Includes initial and acquired MDR/RR-TB cases and cases treated with an MDR-TB regimen only ** Non-UK born cases with a known reason for lost to follow-up # Reduced follow-up period for this group, therefore proportion lost to follow-up is expected to increase in future reporting
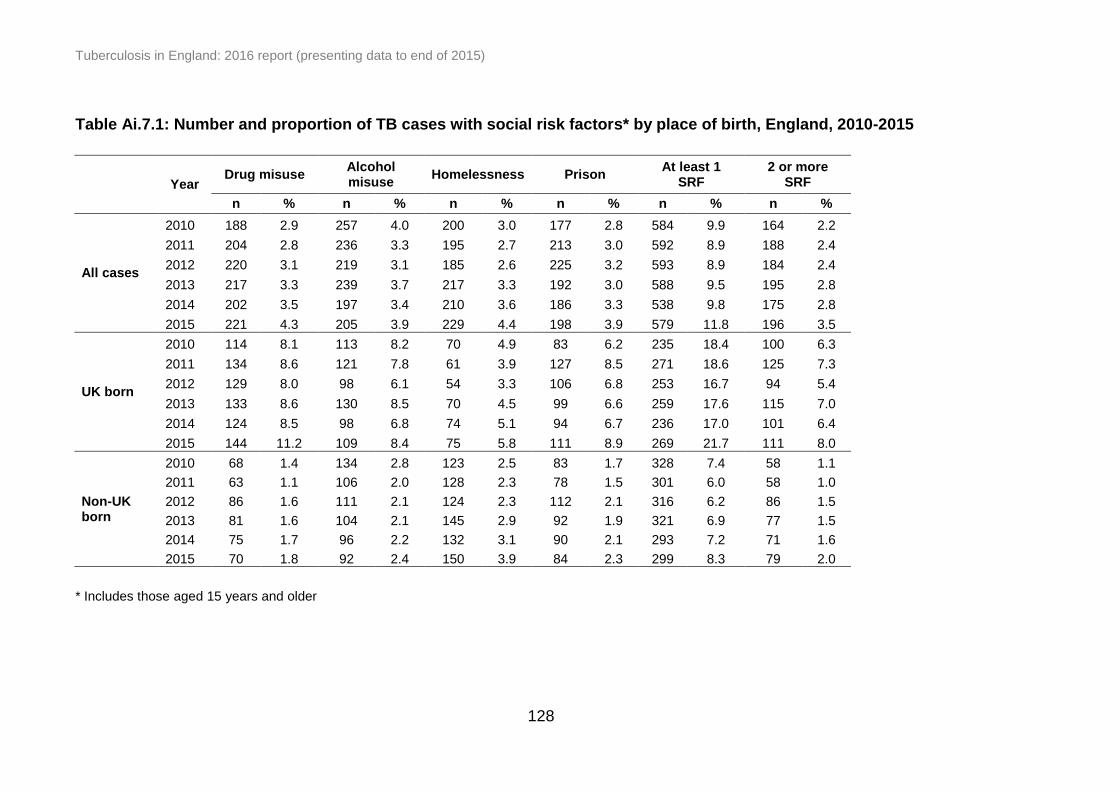
Tuberculosis in England: 2016 report (presenting data to end of 2015)
128
Table Ai.7.1: Number and proportion of TB cases with social risk factors* by place of birth, England, 2010-2015
Year Drug misuse
Alcohol misuse
Homelessness Prison At least 1
SRF 2 or more
SRF
n % n % n % n % n % n %
All cases
2010 188 2.9 257 4.0 200 3.0 177 2.8 584 9.9 164 2.2
2011 204 2.8 236 3.3 195 2.7 213 3.0 592 8.9 188 2.4
2012 220 3.1 219 3.1 185 2.6 225 3.2 593 8.9 184 2.4
2013 217 3.3 239 3.7 217 3.3 192 3.0 588 9.5 195 2.8
2014 202 3.5 197 3.4 210 3.6 186 3.3 538 9.8 175 2.8
2015 221 4.3 205 3.9 229 4.4 198 3.9 579 11.8 196 3.5
UK born
2010 114 8.1 113 8.2 70 4.9 83 6.2 235 18.4 100 6.3
2011 134 8.6 121 7.8 61 3.9 127 8.5 271 18.6 125 7.3
2012 129 8.0 98 6.1 54 3.3 106 6.8 253 16.7 94 5.4
2013 133 8.6 130 8.5 70 4.5 99 6.6 259 17.6 115 7.0
2014 124 8.5 98 6.8 74 5.1 94 6.7 236 17.0 101 6.4
2015 144 11.2 109 8.4 75 5.8 111 8.9 269 21.7 111 8.0
Non-UK born
2010 68 1.4 134 2.8 123 2.5 83 1.7 328 7.4 58 1.1
2011 63 1.1 106 2.0 128 2.3 78 1.5 301 6.0 58 1.0
2012 86 1.6 111 2.1 124 2.3 112 2.1 316 6.2 86 1.5
2013 81 1.6 104 2.1 145 2.9 92 1.9 321 6.9 77 1.5
2014 75 1.7 96 2.2 132 3.1 90 2.1 293 7.2 71 1.6
2015 70 1.8 92 2.4 150 3.9 84 2.3 299 8.3 79 2.0
* Includes those aged 15 years and older

Tuberculosis in England: 2016 report (presenting data to end of 2015)
129
Table Ai.7.2: Characteristics of TB cases with social risk factors*, England, 2010-2015
Characteristics
Drug misuse
Alcohol misuse
Homeless Prison At least 1
SRF 2 or more
SRF
n % n % n % n % n % n %
Ethnicity (UK born)
White 525 9.3 548 9.8 329 5.8 406 7.6 1,083 20.6 488 7.8
Black Caribbean 85 19.2 31 7.1 38 8.5 80 18.4 140 33.0 63 13.1
Black-African 14 4.1 11 3.3 8 2.3 23 6.6 40 12.1 11 3.0
Indian, Pakistani, Bangladeshi 97 5.0 48 2.5 10 0.5 65 3.3 161 8.7 46 2.2
Other 50 12.6 26 6.5 17 4.2 39 9.7 84 21.6 33 7.8
Country of birth (Non-UK born)**
India 22 0.3 164 2.0 64 0.8 42 0.5 252 3.2 36 0.4
Somalia 56 3.2 46 2.7 84 4.8 67 3.9 191 11.9 44 2.4
Pakistan 27 0.5 38 0.8 39 0.8 36 0.7 115 2.5 21 0.4
Poland 22 6.9 50 15.9 56 17.3 24 7.8 99 32.2 44 11.9
Eritrea 5 1.2 4 0.9 71 16.6 28 6.7 90 22.6 15 3.2
Romania 13 3.3 14 3.5 36 9.3 20 5.2 66 17.8 13 3.0
Lithuania 20 10.2 26 13.6 39 19.8 31 16.3 64 33.7 38 17.6
Nigeria 8 1.0 14 1.7 27 3.2 19 2.3 59 7.6 7 0.8
Bangladesh 23 1.7 15 1.1 13 0.9 15 1.1 54 4.2 9 0.6
Ireland 21 11.5 34 18.8 14 7.7 13 7.5 49 28.2 22 11.2
* Includes those aged 15 years and older ** The top ten countries of birth by the number of cases with at least 1 SRF were included

Tuberculosis in England: 2016 report (presenting data to end of 2015)
130
Table Ai.7.3: Number and proportion of TB cases with social risk factors* by PHE Centre, England, 2015
PHE Centre**
Drug misuse
Alcohol misuse
Homeless Prison At least 1
SRF 2 or more
SRF
n % n % n % n % n % n %
London 96 4.5 87 4.1 91 4.3 53 2.5 230 11.0 71 3.3
West Midlands 33 5.3 30 4.8 22 3.5 43 6.8 78 12.9 35 5.2
South East 21 3.8 15 2.7 29 5.2 18 3.3 59 11.2 15 2.5
North West 19 4.0 26 5.3 20 4.2 25 5.7 59 13.8 25 4.6
Yorkshire and the Humber 14 3.6 11 2.8 15 4.0 18 5.0 40 11.7 13 3.1
East of England 13 3.9 10 3.1 14 4.3 15 4.8 40 13.0 8 2.1
East Midlands 8 2.6 7 2.2 16 5.3 10 3.7 27 10.1 10 2.9
South West 13 5.1 14 5.3 17 6.7 8 3.3 32 13.9 14 4.9
North East 4 3.6 5 4.3 5 4.3 8 7.2 14 12.8 5 4.1
* Includes those aged 15 years and older ** Ordered by decreasing total number of TB cases in 2015
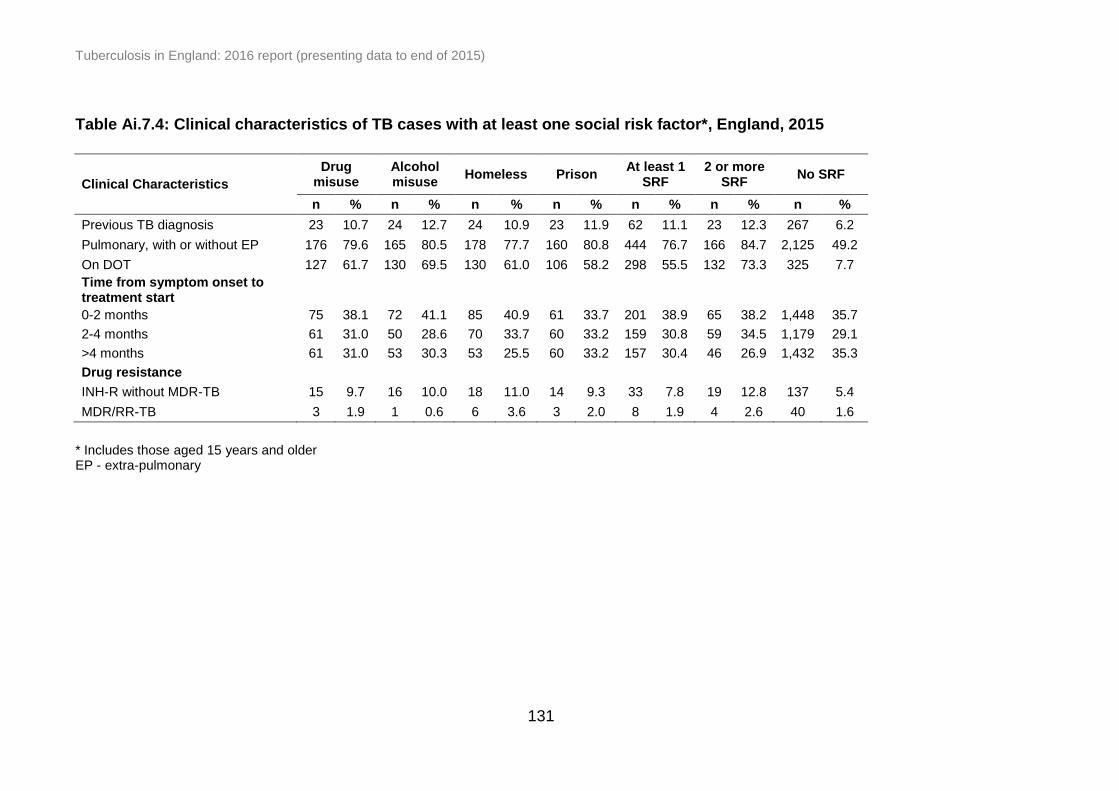
Tuberculosis in England: 2016 report (presenting data to end of 2015)
131
Table Ai.7.4: Clinical characteristics of TB cases with at least one social risk factor*, England, 2015
Clinical Characteristics
Drug misuse
Alcohol misuse
Homeless Prison At least 1
SRF 2 or more
SRF No SRF
n % n % n % n % n % n % n %
Previous TB diagnosis 23 10.7 24 12.7 24 10.9 23 11.9 62 11.1 23 12.3 267 6.2
Pulmonary, with or without EP 176 79.6 165 80.5 178 77.7 160 80.8 444 76.7 166 84.7 2,125 49.2
On DOT 127 61.7 130 69.5 130 61.0 106 58.2 298 55.5 132 73.3 325 7.7
Time from symptom onset to treatment start
0-2 months 75 38.1 72 41.1 85 40.9 61 33.7 201 38.9 65 38.2 1,448 35.7
2-4 months 61 31.0 50 28.6 70 33.7 60 33.2 159 30.8 59 34.5 1,179 29.1
>4 months 61 31.0 53 30.3 53 25.5 60 33.2 157 30.4 46 26.9 1,432 35.3
Drug resistance
INH-R without MDR-TB 15 9.7 16 10.0 18 11.0 14 9.3 33 7.8 19 12.8 137 5.4
MDR/RR-TB 3 1.9 1 0.6 6 3.6 3 2.0 8 1.9 4 2.6 40 1.6
* Includes those aged 15 years and older EP - extra-pulmonary
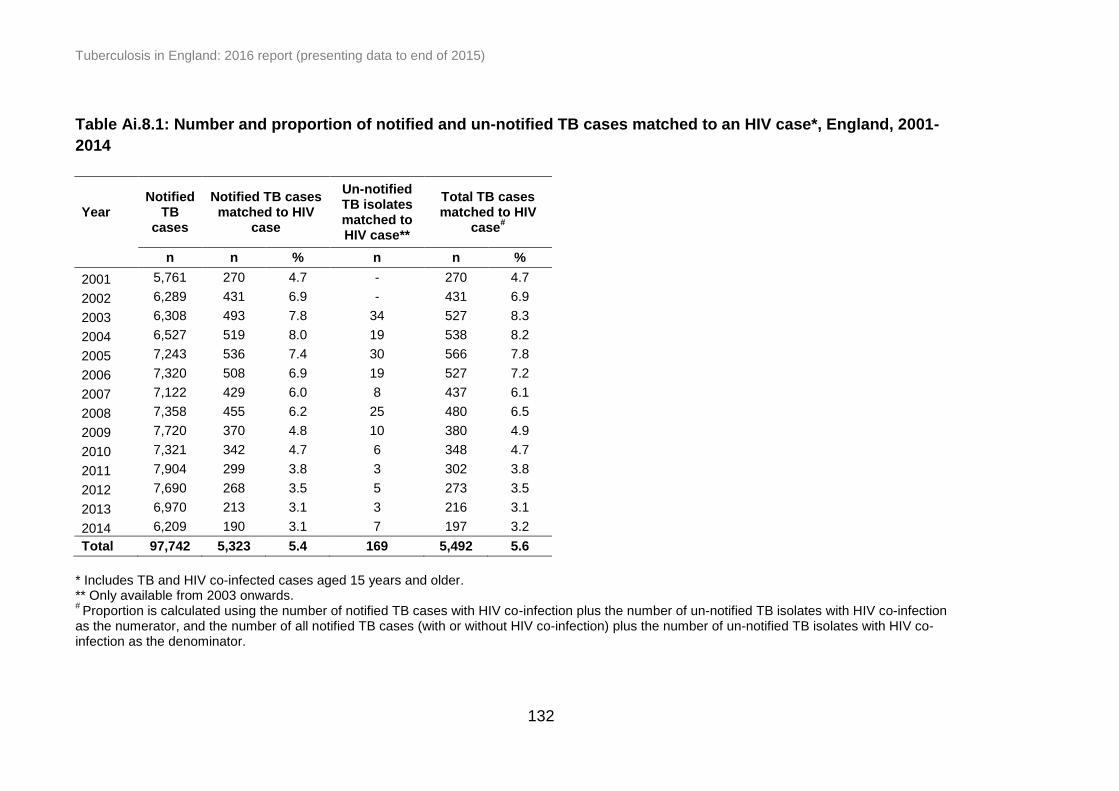
Tuberculosis in England: 2016 report (presenting data to end of 2015)
132
Table Ai.8.1: Number and proportion of notified and un-notified TB cases matched to an HIV case*, England, 2001-
2014
Year Notified
TB cases
Notified TB cases matched to HIV
case
Un-notified TB isolates matched to HIV case**
Total TB cases matched to HIV
case#
n n % n n %
2001 5,761 270 4.7 - 270 4.7
2002 6,289 431 6.9 - 431 6.9
2003 6,308 493 7.8 34 527 8.3
2004 6,527 519 8.0 19 538 8.2
2005 7,243 536 7.4 30 566 7.8
2006 7,320 508 6.9 19 527 7.2
2007 7,122 429 6.0 8 437 6.1
2008 7,358 455 6.2 25 480 6.5
2009 7,720 370 4.8 10 380 4.9
2010 7,321 342 4.7 6 348 4.7
2011 7,904 299 3.8 3 302 3.8
2012 7,690 268 3.5 5 273 3.5
2013 6,970 213 3.1 3 216 3.1
2014 6,209 190 3.1 7 197 3.2
Total 97,742 5,323 5.4 169 5,492 5.6
* Includes TB and HIV co-infected cases aged 15 years and older. ** Only available from 2003 onwards. # Proportion is calculated using the number of notified TB cases with HIV co-infection plus the number of un-notified TB isolates with HIV co-infection
as the numerator, and the number of all notified TB cases (with or without HIV co-infection) plus the number of un-notified TB isolates with HIV co-infection as the denominator.

Tuberculosis in England: 2016 report (presenting data to end of 2015)
133
Table Ai.8.2: Number and proportion of notified and un-notified TB cases matched to an HIV case by PHE Centre,
England*, 2001-2014
Year
PHE Centre**
London West
Midlands South East
North West
Yorkshire and the Humber
East of England
East Midlands
South West
North East
n %# n % n % n % n % n % n % n % n %
2001 174 7.2 4 0.6 25 6.0 9 1.5 16 3.3 18 5.6 13 2.7 3 1.4 8 4.9
2002 241 8.3 21 2.9 49 10.8 20 3.3 15 3.3 44 12.8 21 4.7 10 4.7 9 6.3
2003 276 9.4 33 4.6 66 12.3 25 4.5 34 6.6 47 14.9 22 5.1 16 8.0 8 5.9
2004 255 8.7 44 5.2 46 8.7 37 6.8 33 6.6 62 15.9 34 8.5 18 7.1 9 6.6
2005 277 8.5 38 4.3 60 10.5 46 6.5 41 7.9 43 9.6 39 7.7 14 5.4 6 4.8
2006 231 7.3 40 4.5 49 8.2 45 6.7 41 6.5 53 11.4 41 7.5 20 7.4 6 4.7
2007 179 5.9 34 4.0 53 8.8 41 5.9 29 4.9 39 10.2 33 6.4 15 5.7 14 7.4
2008 214 6.8 36 3.8 47 7.6 39 5.7 36 6.1 48 10.1 38 8.2 16 5.9 6 3.4
2009 159 4.9 37 3.9 45 6.5 36 4.8 24 3.7 39 7.9 19 3.8 14 4.9 6 3.8
2010 143 4.6 25 3.0 38 5.6 39 5.2 26 4.4 32 6.7 30 6.3 12 4.7 3 2.1
2011 121 3.6 32 3.3 32 4.1 21 2.8 27 4.5 33 6.1 25 5.2 9 3.0 2 1.5
2012 123 3.8 28 2.8 30 4.0 20 2.8 17 3.1 19 3.9 27 5.6 8 2.8 1 0.6
2013 98 3.4 31 3.3 18 2.7 16 2.3 14 2.6 23 5.3 6 1.5 8 2.6 2 1.5
2014 69 2.8 18 2.4 28 4.4 21 3.4 15 3.0 22 5.2 10 2.6 9 3.0 5 3.2
Total 2,560 6.1 421 3.5 586 6.9 415 4.4 368 4.8 522 9.0 358 5.5 172 4.7 85 4.1
* Includes TB and HIV co-infected cases aged 15 years and older. ** Ordered by decreasing total number of TB cases in 2015. # Proportion is calculated using the number of notified TB cases with HIV co-infection plus the number of un-notified TB isolates with HIV co-infection
as the numerator, and the number of all notified TB cases (with or without HIV co-infection) plus the number of un-notified TB isolates with HIV co-infection as the denominator.
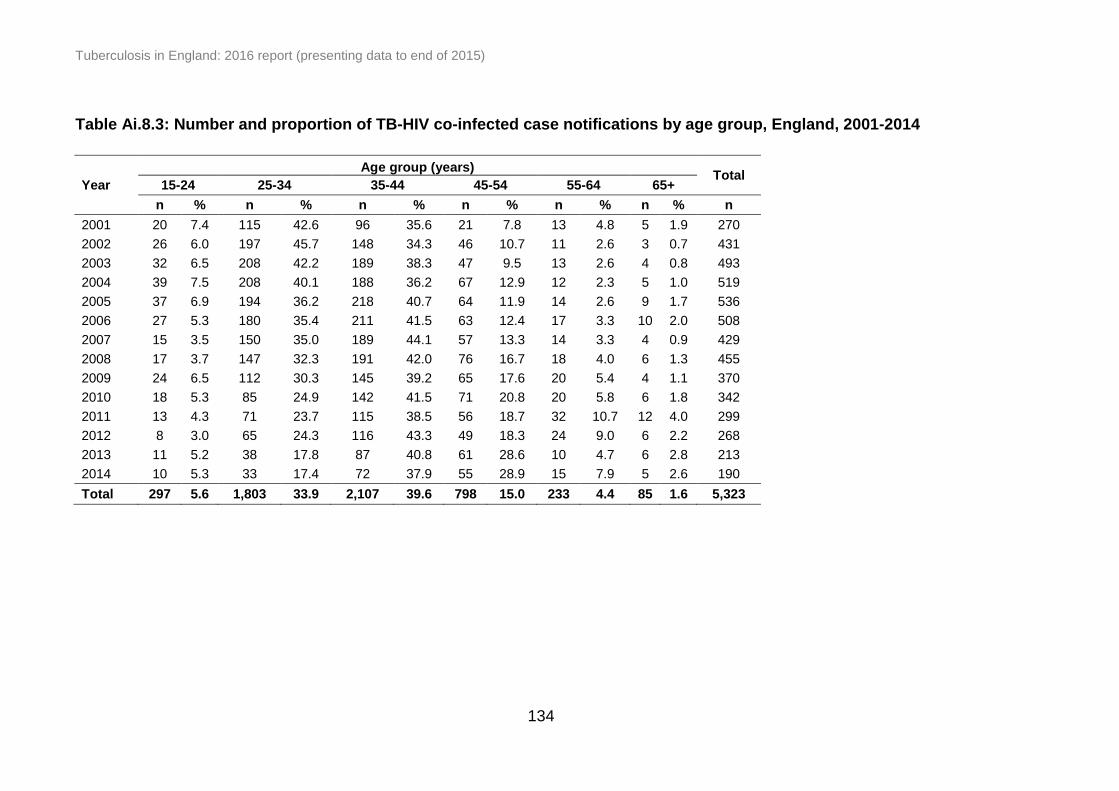
Tuberculosis in England: 2016 report (presenting data to end of 2015)
134
Table Ai.8.3: Number and proportion of TB-HIV co-infected case notifications by age group, England, 2001-2014
Year
Age group (years) Total
15-24 25-34 35-44 45-54 55-64 65+
n % n % n % n % n % n % n
2001 20 7.4 115 42.6 96 35.6 21 7.8 13 4.8 5 1.9 270
2002 26 6.0 197 45.7 148 34.3 46 10.7 11 2.6 3 0.7 431
2003 32 6.5 208 42.2 189 38.3 47 9.5 13 2.6 4 0.8 493
2004 39 7.5 208 40.1 188 36.2 67 12.9 12 2.3 5 1.0 519
2005 37 6.9 194 36.2 218 40.7 64 11.9 14 2.6 9 1.7 536
2006 27 5.3 180 35.4 211 41.5 63 12.4 17 3.3 10 2.0 508
2007 15 3.5 150 35.0 189 44.1 57 13.3 14 3.3 4 0.9 429
2008 17 3.7 147 32.3 191 42.0 76 16.7 18 4.0 6 1.3 455
2009 24 6.5 112 30.3 145 39.2 65 17.6 20 5.4 4 1.1 370
2010 18 5.3 85 24.9 142 41.5 71 20.8 20 5.8 6 1.8 342
2011 13 4.3 71 23.7 115 38.5 56 18.7 32 10.7 12 4.0 299
2012 8 3.0 65 24.3 116 43.3 49 18.3 24 9.0 6 2.2 268
2013 11 5.2 38 17.8 87 40.8 61 28.6 10 4.7 6 2.8 213
2014 10 5.3 33 17.4 72 37.9 55 28.9 15 7.9 5 2.6 190
Total 297 5.6 1,803 33.9 2,107 39.6 798 15.0 233 4.4 85 1.6 5,323

Tuberculosis in England: 2016 report (presenting data to end of 2015)
135
Table Ai.8.4: HIV testing in notified TB cases by PHE Centre, England, 2015
PHE Centre**
HIV testing*
Not offered Offered and
received Offered but not received
Offered but refused
Total*
n % n % n % n % n
London 27 1.2 2,107 97.3 23 1.1 8 0.4 2,165
West Midlands 27 4.7 520 91.1 16 2.8 8 1.4 571
South East 19 3.5 499 92.6 14 2.6 7 1.3 539
North West 17 3.7 440 94.8 4 0.9 3 0.6 464
Yorkshire and the Humber 19 6.0 286 90.8 6 1.9 4 1.3 315
East of England 22 6.9 277 86.6 18 5.6 3 0.9 320
East Midlands 21 6.9 278 90.8 4 1.3 3 1.0 306
South West 24 10.7 192 85.3 5 2.2 4 1.8 225
North East 15 13.5 93 83.8 3 2.7 0 0.0 111
England 191 3.8 4,692 93.5 93 1.9 40 0.8 5,016
* Total with previously unknown HIV status where HIV testing is known and excluding those diagnosed post-mortem ** Ordered by decreasing total number of TB cases in 2015
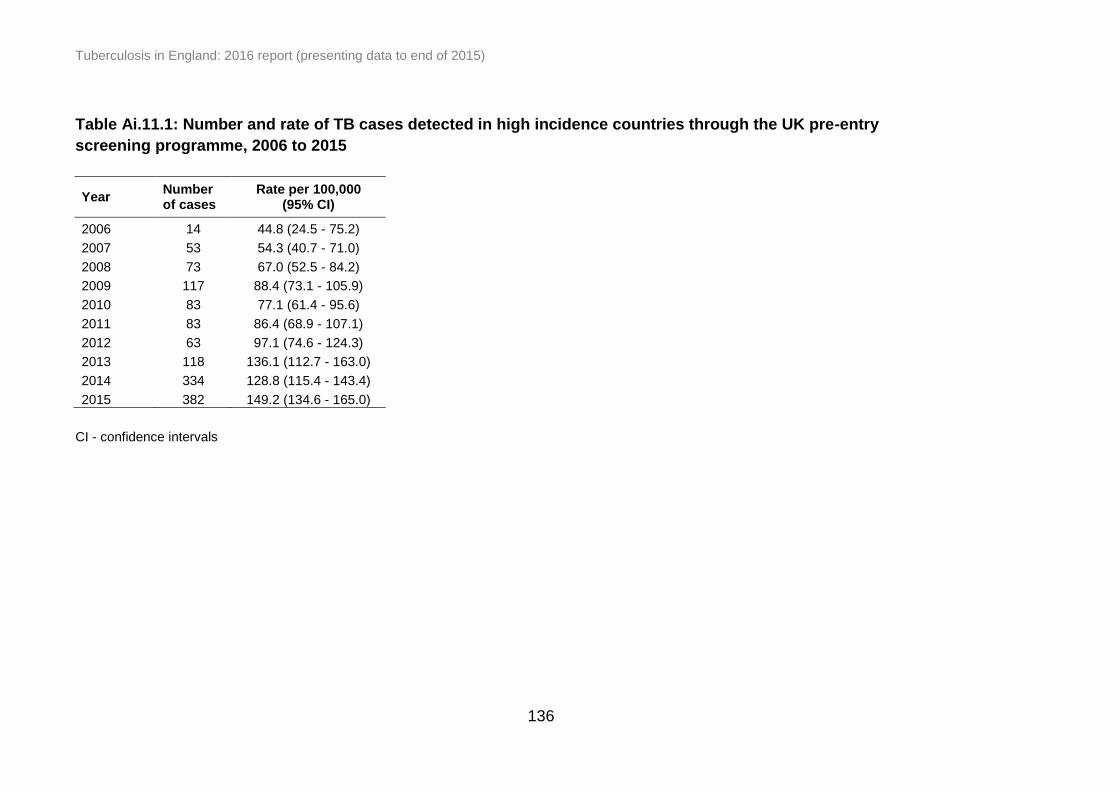
Tuberculosis in England: 2016 report (presenting data to end of 2015)
136
Table Ai.11.1: Number and rate of TB cases detected in high incidence countries through the UK pre-entry
screening programme, 2006 to 2015
Year Number of cases
Rate per 100,000 (95% CI)
2006 14 44.8 (24.5 - 75.2)
2007 53 54.3 (40.7 - 71.0)
2008 73 67.0 (52.5 - 84.2)
2009 117 88.4 (73.1 - 105.9)
2010 83 77.1 (61.4 - 95.6)
2011 83 86.4 (68.9 - 107.1)
2012 63 97.1 (74.6 - 124.3)
2013 118 136.1 (112.7 - 163.0)
2014 334 128.8 (115.4 - 143.4)
2015 382 149.2 (134.6 - 165.0)
CI - confidence intervals

Tuberculosis in England: 2016 report (presenting data to end of 2015)
137
Table Ai.11.2: Number of pulmonary TB cases diagnosed by pre-entry screening* and identified within one year of
UK entry**, 2006 to 2015
Year of screening/ entry to the UK
TB cases diagnosed by pre-entry screening
TB cases identified in the
UK
2006 14 380
2007 53 358
2008 76 330
2009 121 370
2010 83 351
2011 84 339
2012 67 190
2013 134 157
2014 369 161
2015 382 88
* The number of pulmonary TB cases identified within one year of entry into the UK was from all 101 high incidence countries but the number of TB cases diagnosed by pre-entry screening were from an increasing number of countries as screening was rolled out; 5 pilot countries (2006), 15 pilot countries (2007 and 2012), 101 countries (by 2014) ** As of May 2016, 513 sputum samples are pending and the rate may increase when final results are available
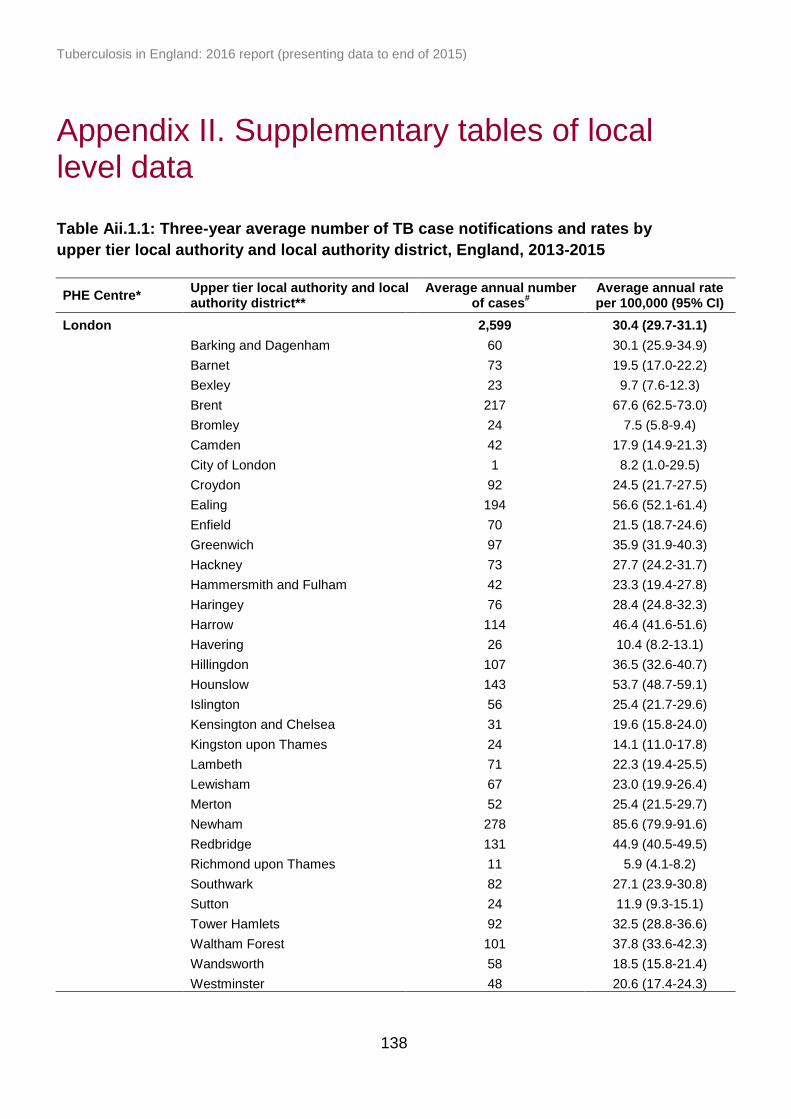
Tuberculosis in England: 2016 report (presenting data to end of 2015)
138
Appendix II. Supplementary tables of local level data
Table Aii.1.1: Three-year average number of TB case notifications and rates by
upper tier local authority and local authority district, England, 2013-2015
PHE Centre* Upper tier local authority and local authority district**
Average annual number of cases
# Average annual rate per 100,000 (95% CI)
London 2,599 30.4 (29.7-31.1)
Barking and Dagenham 60 30.1 (25.9-34.9)
Barnet 73 19.5 (17.0-22.2)
Bexley 23 9.7 (7.6-12.3)
Brent 217 67.6 (62.5-73.0)
Bromley 24 7.5 (5.8-9.4)
Camden 42 17.9 (14.9-21.3)
City of London 1 8.2 (1.0-29.5)
Croydon 92 24.5 (21.7-27.5)
Ealing 194 56.6 (52.1-61.4)
Enfield 70 21.5 (18.7-24.6)
Greenwich 97 35.9 (31.9-40.3)
Hackney 73 27.7 (24.2-31.7)
Hammersmith and Fulham 42 23.3 (19.4-27.8)
Haringey 76 28.4 (24.8-32.3)
Harrow 114 46.4 (41.6-51.6)
Havering 26 10.4 (8.2-13.1)
Hillingdon 107 36.5 (32.6-40.7)
Hounslow 143 53.7 (48.7-59.1)
Islington 56 25.4 (21.7-29.6)
Kensington and Chelsea 31 19.6 (15.8-24.0)
Kingston upon Thames 24 14.1 (11.0-17.8)
Lambeth 71 22.3 (19.4-25.5)
Lewisham 67 23.0 (19.9-26.4)
Merton 52 25.4 (21.5-29.7)
Newham 278 85.6 (79.9-91.6)
Redbridge 131 44.9 (40.5-49.5)
Richmond upon Thames 11 5.9 (4.1-8.2)
Southwark 82 27.1 (23.9-30.8)
Sutton 24 11.9 (9.3-15.1)
Tower Hamlets 92 32.5 (28.8-36.6)
Waltham Forest 101 37.8 (33.6-42.3)
Wandsworth 58 18.5 (15.8-21.4)
Westminster 48 20.6 (17.4-24.3)
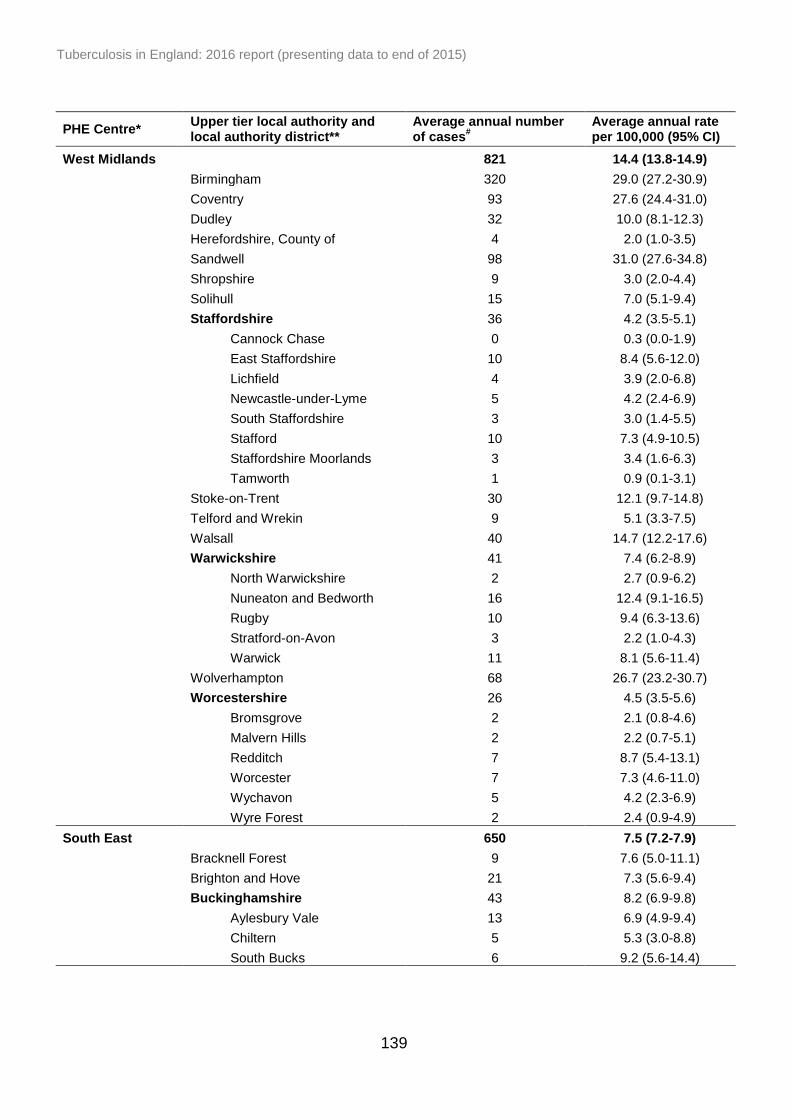
Tuberculosis in England: 2016 report (presenting data to end of 2015)
139
PHE Centre* Upper tier local authority and local authority district**
Average annual number of cases
# Average annual rate per 100,000 (95% CI)
West Midlands 821 14.4 (13.8-14.9)
Birmingham 320 29.0 (27.2-30.9)
Coventry 93 27.6 (24.4-31.0)
Dudley 32 10.0 (8.1-12.3)
Herefordshire, County of 4 2.0 (1.0-3.5)
Sandwell 98 31.0 (27.6-34.8)
Shropshire 9 3.0 (2.0-4.4)
Solihull 15 7.0 (5.1-9.4)
Staffordshire 36 4.2 (3.5-5.1)
Cannock Chase 0 0.3 (0.0-1.9)
East Staffordshire 10 8.4 (5.6-12.0)
Lichfield 4 3.9 (2.0-6.8)
Newcastle-under-Lyme 5 4.2 (2.4-6.9)
South Staffordshire 3 3.0 (1.4-5.5)
Stafford 10 7.3 (4.9-10.5)
Staffordshire Moorlands 3 3.4 (1.6-6.3)
Tamworth 1 0.9 (0.1-3.1)
Stoke-on-Trent 30 12.1 (9.7-14.8)
Telford and Wrekin 9 5.1 (3.3-7.5)
Walsall 40 14.7 (12.2-17.6)
Warwickshire 41 7.4 (6.2-8.9)
North Warwickshire 2 2.7 (0.9-6.2)
Nuneaton and Bedworth 16 12.4 (9.1-16.5)
Rugby 10 9.4 (6.3-13.6)
Stratford-on-Avon 3 2.2 (1.0-4.3)
Warwick 11 8.1 (5.6-11.4)
Wolverhampton 68 26.7 (23.2-30.7)
Worcestershire 26 4.5 (3.5-5.6)
Bromsgrove 2 2.1 (0.8-4.6)
Malvern Hills 2 2.2 (0.7-5.1)
Redditch 7 8.7 (5.4-13.1)
Worcester 7 7.3 (4.6-11.0)
Wychavon 5 4.2 (2.3-6.9)
Wyre Forest 2 2.4 (0.9-4.9)
South East 650 7.5 (7.2-7.9)
Bracknell Forest 9 7.6 (5.0-11.1)
Brighton and Hove 21 7.3 (5.6-9.4)
Buckinghamshire 43 8.2 (6.9-9.8)
Aylesbury Vale 13 6.9 (4.9-9.4)
Chiltern 5 5.3 (3.0-8.8)
South Bucks 6 9.2 (5.6-14.4)

Tuberculosis in England: 2016 report (presenting data to end of 2015)
140
PHE Centre* Upper tier local authority and local authority district**
Average annual number of cases
# Average annual rate per 100,000 (95% CI)
South East continued
Wycombe 19 10.9 (8.2-14.1)
East Sussex 23 4.2 (3.3-5.3)
Eastbourne 6 6.2 (3.8-9.7)
Hastings 7 7.3 (4.5-11.3)
Lewes 3 3.3 (1.6-6.1)
Rother 3 3.6 (1.7-6.7)
Wealden 3 1.9 (0.9-3.7)
Hampshire 52 3.8 (3.3-4.5)
Basingstoke and Deane 10 6.0 (4.1-8.5)
East Hampshire 2 1.4 (0.5-3.3)
Eastleigh 4 2.9 (1.4-5.1)
Fareham 5 4.1 (2.2-6.9)
Gosport 1 1.2 (0.2-3.5)
Hart 2 2.1 (0.8-4.7)
Havant 3 2.2 (0.9-4.3)
New Forest 2 1.3 (0.5-2.7)
Rushmoor 18 19.3 (14.5-25.1)
Test Valley 2 1.7 (0.6-3.6)
Winchester 3 2.5 (1.1-4.8)
Isle of Wight 2 1.2 (0.4-2.8)
Kent 100 6.6 (5.9-7.4)
Ashford 11 8.7 (5.9-12.2)
Canterbury 8 5.3 (3.4-7.8)
Dartford 10 9.5 (6.3-13.6)
Dover 4 3.5 (1.8-6.2)
Gravesham 17 16.2 (12.0-21.3)
Maidstone 13 7.8 (5.5-10.7)
Sevenoaks 5 4.5 (2.6-7.4)
Shepway 6 5.5 (3.2-8.7)
Swale 5 3.6 (2.0-5.9)
Thanet 11 8.0 (5.5-11.2)
Tonbridge and Malling 4 2.9 (1.5-5.3)
Tunbridge Wells 6 5.5 (3.3-8.5)
Medway 15 5.6 (4.1-7.5)
Oxfordshire 63 9.4 (8.1-10.8)
Cherwell 17 12.0 (9.0-15.7)
Oxford 31 19.7 (15.9-24.1)
South Oxfordshire 5 3.4 (1.9-5.7)
Vale of White Horse 5 3.7 (2.0-6.3)
West Oxfordshire 5 4.9 (2.8-8.0)
Portsmouth 16 7.5 (5.5-9.9)
Reading 56 34.7 (29.6-40.3)
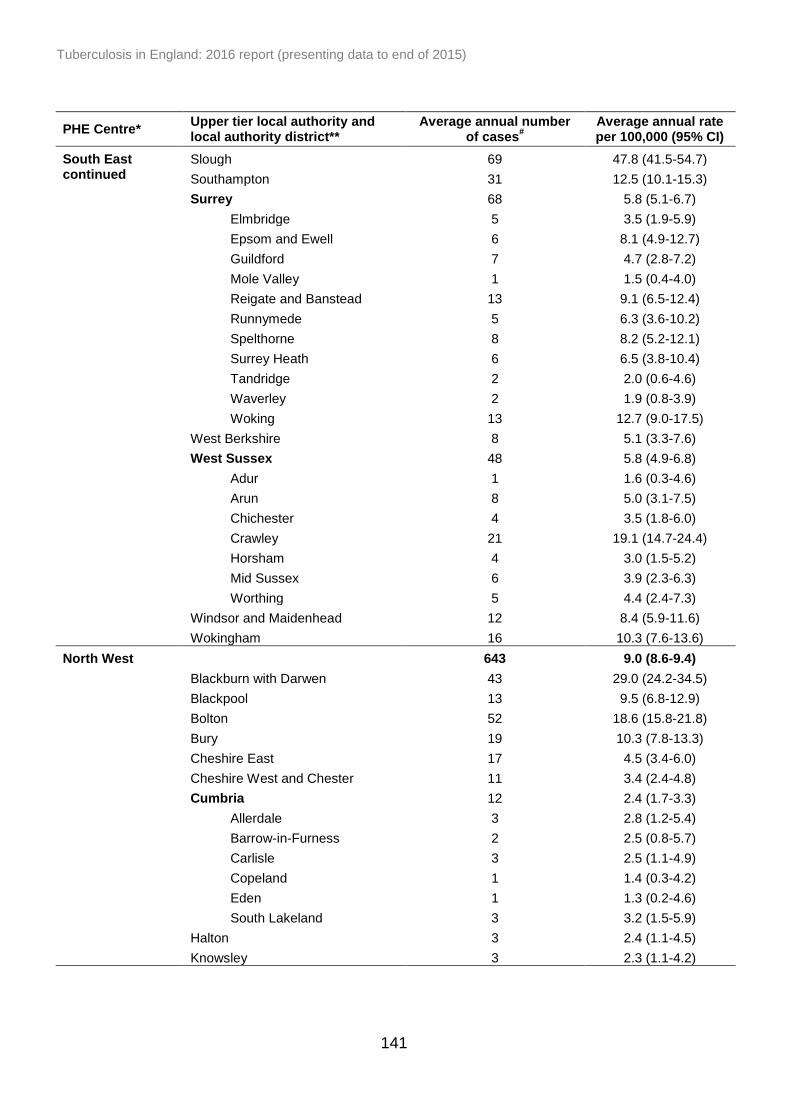
Tuberculosis in England: 2016 report (presenting data to end of 2015)
141
PHE Centre* Upper tier local authority and local authority district**
Average annual number of cases
# Average annual rate per 100,000 (95% CI)
South East continued
Slough 69 47.8 (41.5-54.7)
Southampton 31 12.5 (10.1-15.3)
Surrey 68 5.8 (5.1-6.7)
Elmbridge 5 3.5 (1.9-5.9)
Epsom and Ewell 6 8.1 (4.9-12.7)
Guildford 7 4.7 (2.8-7.2)
Mole Valley 1 1.5 (0.4-4.0)
Reigate and Banstead 13 9.1 (6.5-12.4)
Runnymede 5 6.3 (3.6-10.2)
Spelthorne 8 8.2 (5.2-12.1)
Surrey Heath 6 6.5 (3.8-10.4)
Tandridge 2 2.0 (0.6-4.6)
Waverley 2 1.9 (0.8-3.9)
Woking 13 12.7 (9.0-17.5)
West Berkshire 8 5.1 (3.3-7.6)
West Sussex 48 5.8 (4.9-6.8)
Adur 1 1.6 (0.3-4.6)
Arun 8 5.0 (3.1-7.5)
Chichester 4 3.5 (1.8-6.0)
Crawley 21 19.1 (14.7-24.4)
Horsham 4 3.0 (1.5-5.2)
Mid Sussex 6 3.9 (2.3-6.3)
Worthing 5 4.4 (2.4-7.3)
Windsor and Maidenhead 12 8.4 (5.9-11.6)
Wokingham 16 10.3 (7.6-13.6)
North West 643 9.0 (8.6-9.4)
Blackburn with Darwen 43 29.0 (24.2-34.5)
Blackpool 13 9.5 (6.8-12.9)
Bolton 52 18.6 (15.8-21.8)
Bury 19 10.3 (7.8-13.3)
Cheshire East 17 4.5 (3.4-6.0)
Cheshire West and Chester 11 3.4 (2.4-4.8)
Cumbria 12 2.4 (1.7-3.3)
Allerdale 3 2.8 (1.2-5.4)
Barrow-in-Furness 2 2.5 (0.8-5.7)
Carlisle 3 2.5 (1.1-4.9)
Copeland 1 1.4 (0.3-4.2)
Eden 1 1.3 (0.2-4.6)
South Lakeland 3 3.2 (1.5-5.9)
Halton 3 2.4 (1.1-4.5)
Knowsley 3 2.3 (1.1-4.2)

Tuberculosis in England: 2016 report (presenting data to end of 2015)
142
PHE Centre* Upper tier local authority and local authority district**
Average annual number of cases
#
Average annual rate per 100,000 (95% CI)
North West continued
Lancashire 75 6.3 (5.5-7.2)
Burnley 5 5.4 (2.9-9.0)
Chorley 4 3.9 (2.1-6.6)
Fylde 2 2.6 (1.0-5.7)
Hyndburn 9 11.2 (7.4-16.3)
Lancaster 3 2.4 (1.1-4.3)
Pendle 15 17.0 (12.5-22.7)
Preston 22 15.9 (12.3-20.2)
Ribble Valley 1 1.7 (0.4-5.0)
Rossendale 4 5.3 (2.6-9.5)
South Ribble 5 4.3 (2.3-7.2)
West Lancashire 2 2.1 (0.8-4.3)
Wyre 2 1.8 (0.7-4.0)
Liverpool 40 8.4 (7.0-10.1)
Manchester 141 27.0 (24.5-29.7)
Oldham 50 21.8 (18.5-25.6)
Rochdale 29 13.6 (10.9-16.8)
Salford 29 12.1 (9.7-14.9)
Sefton 7 2.6 (1.6-3.9)
St. Helens 3 1.9 (0.9-3.5)
Stockport 16 5.7 (4.2-7.5)
Tameside 19 8.7 (6.6-11.3)
Trafford 26 11.4 (9.0-14.1)
Warrington 10 5.0 (3.4-7.1)
Wigan 13 4.1 (2.9-5.5)
Wirral 9 2.8 (1.8-4.1)
Yorkshire and the Humber
514 9.6 (9.1-10.1)
Barnsley 8 3.5 (2.3-5.2)
Bradford 118 22.3 (20.0-24.7)
Calderdale 17 8.2 (6.1-10.8)
Doncaster 22 7.3 (5.7-9.3)
East Riding of Yorkshire 6 1.7 (1.0-2.7)
Kingston upon Hull, City of 17 6.5 (4.8-8.5)
Kirklees 75 17.3 (15.1-19.7)
Leeds 100 13.0 (11.6-14.5)
North East Lincolnshire 5 2.9 (1.6-4.9)
North Lincolnshire 11 6.3 (4.3-8.9)
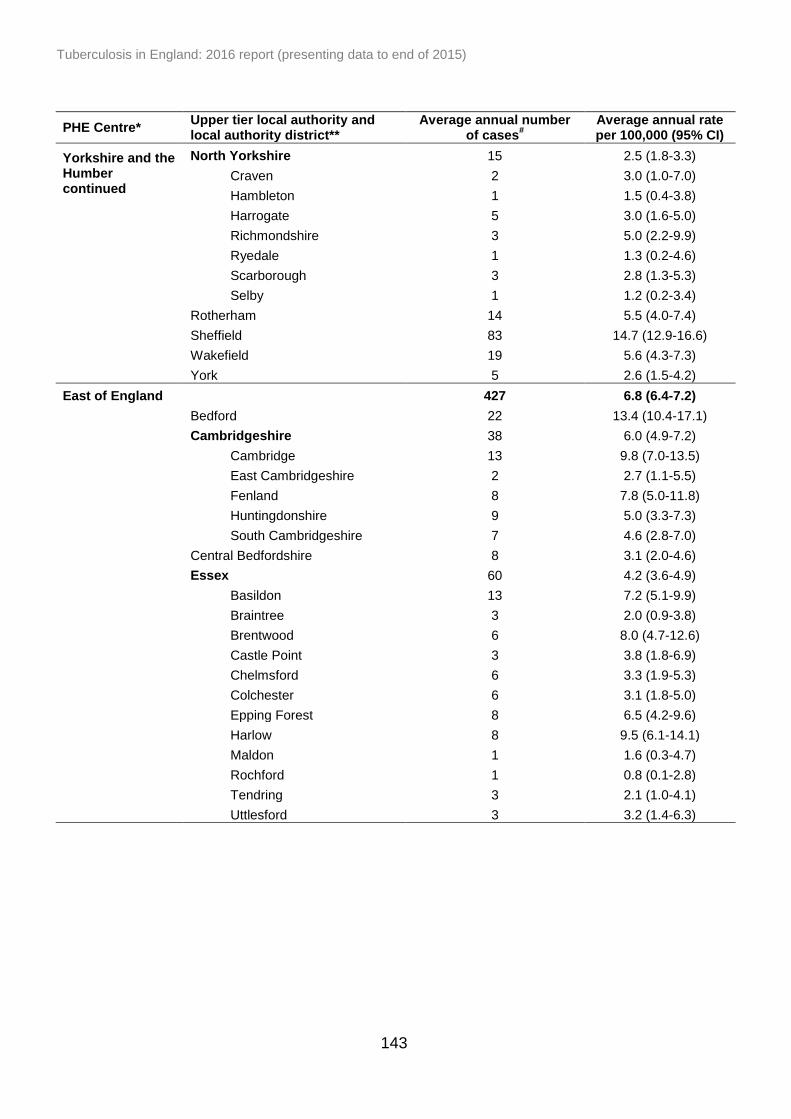
Tuberculosis in England: 2016 report (presenting data to end of 2015)
143
PHE Centre* Upper tier local authority and local authority district**
Average annual number of cases
#
Average annual rate per 100,000 (95% CI)
Yorkshire and the Humber continued
North Yorkshire 15 2.5 (1.8-3.3)
Craven 2 3.0 (1.0-7.0)
Hambleton 1 1.5 (0.4-3.8)
Harrogate 5 3.0 (1.6-5.0)
Richmondshire 3 5.0 (2.2-9.9)
Ryedale 1 1.3 (0.2-4.6)
Scarborough 3 2.8 (1.3-5.3)
Selby 1 1.2 (0.2-3.4)
Rotherham 14 5.5 (4.0-7.4)
Sheffield 83 14.7 (12.9-16.6)
Wakefield 19 5.6 (4.3-7.3)
York 5 2.6 (1.5-4.2)
East of England 427 6.8 (6.4-7.2)
Bedford 22 13.4 (10.4-17.1)
Cambridgeshire 38 6.0 (4.9-7.2)
Cambridge 13 9.8 (7.0-13.5)
East Cambridgeshire 2 2.7 (1.1-5.5)
Fenland 8 7.8 (5.0-11.8)
Huntingdonshire 9 5.0 (3.3-7.3)
South Cambridgeshire 7 4.6 (2.8-7.0)
Central Bedfordshire 8 3.1 (2.0-4.6)
Essex 60 4.2 (3.6-4.9)
Basildon 13 7.2 (5.1-9.9)
Braintree 3 2.0 (0.9-3.8)
Brentwood 6 8.0 (4.7-12.6)
Castle Point 3 3.8 (1.8-6.9)
Chelmsford 6 3.3 (1.9-5.3)
Colchester 6 3.1 (1.8-5.0)
Epping Forest 8 6.5 (4.2-9.6)
Harlow 8 9.5 (6.1-14.1)
Maldon 1 1.6 (0.3-4.7)
Rochford 1 0.8 (0.1-2.8)
Tendring 3 2.1 (1.0-4.1)
Uttlesford 3 3.2 (1.4-6.3)

Tuberculosis in England: 2016 report (presenting data to end of 2015)
144
PHE Centre* Upper tier local authority and local authority district**
Average annual number of cases
#
Average annual rate per 100,000 (95% CI)
East of England continued
Hertfordshire 78 6.8 (5.9-7.7)
Broxbourne 7 7.0 (4.3-10.8)
Dacorum 6 4.0 (2.4-6.3)
East Hertfordshire 5 3.3 (1.8-5.5)
Hertsmere 9 8.5 (5.5-12.4)
North Hertfordshire 8 6.1 (3.9-9.1)
St Albans 7 4.6 (2.8-7.1)
Stevenage 9 10.1 (6.6-14.8)
Three Rivers 6 6.3 (3.6-10.0)
Watford 15 15.8 (11.5-21.1)
Welwyn Hatfield 8 7.2 (4.6-10.6)
Luton 63 29.8 (25.7-34.4)
Milton Keynes 26 10.2 (8.1-12.7)
Norfolk 35 4.0 (3.3-4.9)
Breckland 3 2.5 (1.2-4.6)
Broadland 2 1.6 (0.6-3.5)
Great Yarmouth 9 8.8 (5.8-12.9)
King's Lynn and West Norfolk 6 3.8 (2.2-6.0)
North Norfolk 2 2.3 (0.9-4.7)
Norwich 11 8.0 (5.5-11.2)
South Norfolk 2 1.8 (0.7-3.7)
Peterborough 44 23.2 (19.4-27.5)
Southend-on-Sea 13 7.5 (5.4-10.2)
Suffolk 28 3.8 (3.1-4.7)
Babergh 2 1.9 (0.6-4.4)
Forest Heath 3 4.8 (2.2-9.1)
Ipswich 9 6.4 (4.2-9.4)
Mid Suffolk 2 2.4 (0.9-4.9)
St Edmundsbury 6 5.1 (2.9-8.1)
Suffolk Coastal 3 2.1 (0.9-4.2)
Waveney 4 3.7 (2.0-6.4)
Thurrock 9 5.3 (3.5-7.8)
East Midlands 389 8.4 (7.9-8.9)
Derby 35 13.8 (11.3-16.8)
Derbyshire 22 2.8 (2.2-3.6)
Amber Valley 4 3.5 (1.9-6.0)
Bolsover 1 1.7 (0.5-4.4)
Chesterfield 5 5.1 (2.9-8.3)
Derbyshire Dales 1 0.9 (0.1-3.4)
Erewash 4 3.5 (1.8-6.1)
High Peak 2 2.2 (0.8-4.8)
North East Derbyshire 1 1.0 (0.2-2.9)
South Derbyshire 3 3.4 (1.6-6.2)

Tuberculosis in England: 2016 report (presenting data to end of 2015)
145
PHE Centre* Upper tier local authority and local authority district**
Average annual number of cases
#
Average annual rate per 100,000 (95% CI)
East Midlands continued
Leicester 141 41.8 (37.9-46.0)
Leicestershire 27 4.0 (3.2-5.0)
Blaby 5 4.9 (2.7-8.2)
Charnwood 7 3.8 (2.3-5.9)
Harborough 4 4.9 (2.6-8.4)
Hinckley and Bosworth 3 2.8 (1.3-5.3)
Melton 0 -
North West Leicestershire 3 3.5 (1.7-6.4)
Oadby and Wigston 5 8.9 (5.0-14.7)
Lincolnshire 32 4.4 (3.6-5.4)
Boston 8 12.0 (7.7-17.9)
East Lindsey 6 4.1 (2.4-6.6)
Lincoln 4 4.2 (2.1-7.3)
North Kesteven 2 1.5 (0.5-3.5)
South Holland 2 2.6 (1.0-5.3)
South Kesteven 7 5.3 (3.3-8.1)
West Lindsey 3 3.6 (1.7-6.7)
Northamptonshire 47 6.6 (5.5-7.8)
Corby 3 5.1 (2.4-9.4)
Daventry 3 3.4 (1.5-6.6)
East Northamptonshire 3 3.0 (1.3-5.9)
Kettering 4 4.1 (2.1-7.2)
Northampton 27 12.3 (9.8-15.3)
South Northamptonshire 1 1.5 (0.4-3.9)
Wellingborough 6 7.8 (4.6-12.4)
Nottingham 54 17.1 (14.5-19.9)
Nottinghamshire 29 3.6 (2.9-4.5)
Ashfield 5 3.8 (2.1-6.4)
Bassetlaw 3 2.6 (1.2-5.0)
Broxtowe 6 5.4 (3.2-8.5)
Gedling 5 4.3 (2.4-7.1)
Mansfield 5 4.4 (2.4-7.4)
Newark and Sherwood 2 2.0 (0.8-4.1)
Rushcliffe 3 2.9 (1.4-5.4)
Rutland 2 4.4 (1.4-10.3)
South West 311 5.7 (5.4-6.1)
Bath and North East Somerset 14 7.5 (5.4-10.2)
Bournemouth 13 7.0 (5.0-9.5)
Bristol, City of 91 20.6 (18.2-23.2)
Cornwall 13 2.4 (1.7-3.3)

Tuberculosis in England: 2016 report (presenting data to end of 2015)
146
PHE Centre* Upper tier local authority and local authority district**
Average annual number of cases
#
Average annual rate per 100,000 (95% CI)
South West continued
Devon 29 3.8 (3.1-4.7)
East Devon 2 1.2 (0.4-2.9)
Exeter 6 4.6 (2.7-7.3)
Mid Devon 2 2.5 (0.9-5.5)
North Devon 3 3.5 (1.7-6.5)
South Hams 3 3.6 (1.6-6.8)
Teignbridge 10 7.6 (5.1-10.9)
Torridge 1 1.0 (0.1-3.7)
West Devon 3 6.2 (2.9-11.3)
Dorset 10 2.3 (1.5-3.3)
Christchurch 0 0.7 (0.0-3.8)
East Dorset 2 2.6 (1.1-5.4)
North Dorset 1 1.9 (0.5-4.9)
Purbeck 1 2.2 (0.5-6.4)
West Dorset 2 1.7 (0.5-3.9)
Weymouth and Portland 3 4.6 (2.1-8.7)
Gloucestershire 34 5.6 (4.6-6.8)
Cheltenham 8 7.2 (4.6-10.6)
Cotswold 2 2.0 (0.6-4.6)
Forest of Dean 1 1.2 (0.2-3.5)
Gloucester 14 10.9 (7.8-14.7)
Stroud 6 4.9 (2.9-7.9)
Tewkesbury 4 4.7 (2.4-8.2)
Isles of Scilly 0 -
North Somerset 8 4.0 (2.6-5.9)
Plymouth 14 5.4 (3.9-7.2)
Poole 5 3.3 (1.9-5.5)
Somerset 14 2.5 (1.8-3.4)
Mendip 5 4.2 (2.3-7.1)
Sedgemoor 3 2.2 (1.0-4.4)
South Somerset 5 2.8 (1.6-4.8)
Taunton Deane 2 1.5 (0.5-3.4)
West Somerset 0 -
South Gloucestershire 18 6.6 (5.0-8.6)
Swindon 23 10.7 (8.3-13.5)
Torbay 8 6.0 (3.9-9.0)
Wiltshire 15 3.2 (2.3-4.2)
North East 145 5.5 (5.0-6.1)
County Durham 10 1.9 (1.3-2.7)
Darlington 5 5.1 (2.9-8.2)
Gateshead 14 6.8 (4.9-9.2)
Hartlepool 4 4.0 (2.0-7.1)

Tuberculosis in England: 2016 report (presenting data to end of 2015)
147
PHE Centre* Upper tier local authority and local authority district*8
Average annual number of cases
#
Average annual rate per 100,000 (95% CI)
North East continued
Middlesbrough 14 9.8 (7.0-13.3)
Newcastle upon Tyne 41 14.1 (11.8-16.9)
North Tyneside 10 4.8 (3.2-6.9)
Northumberland 8 2.5 (1.6-3.8)
Redcar and Cleveland 4 3.0 (1.5-5.2)
South Tyneside 8 5.6 (3.6-8.3)
Stockton-on-Tees 9 4.6 (3.1-6.7)
Sunderland 19 6.9 (5.2-8.9)
* Ordered by decreasing total number of cases in 2015
** Those highlighted in bold are upper tier local authority only, those indented are local authority district only, and those neither highlighted nor indented are both an upper tier local authority and a local authority district. # Average number of cases in a local authority district may not be the same as the sum of the average
number of cases in the corresponding upper tier local authority due to rounding. CI - confidence intervals
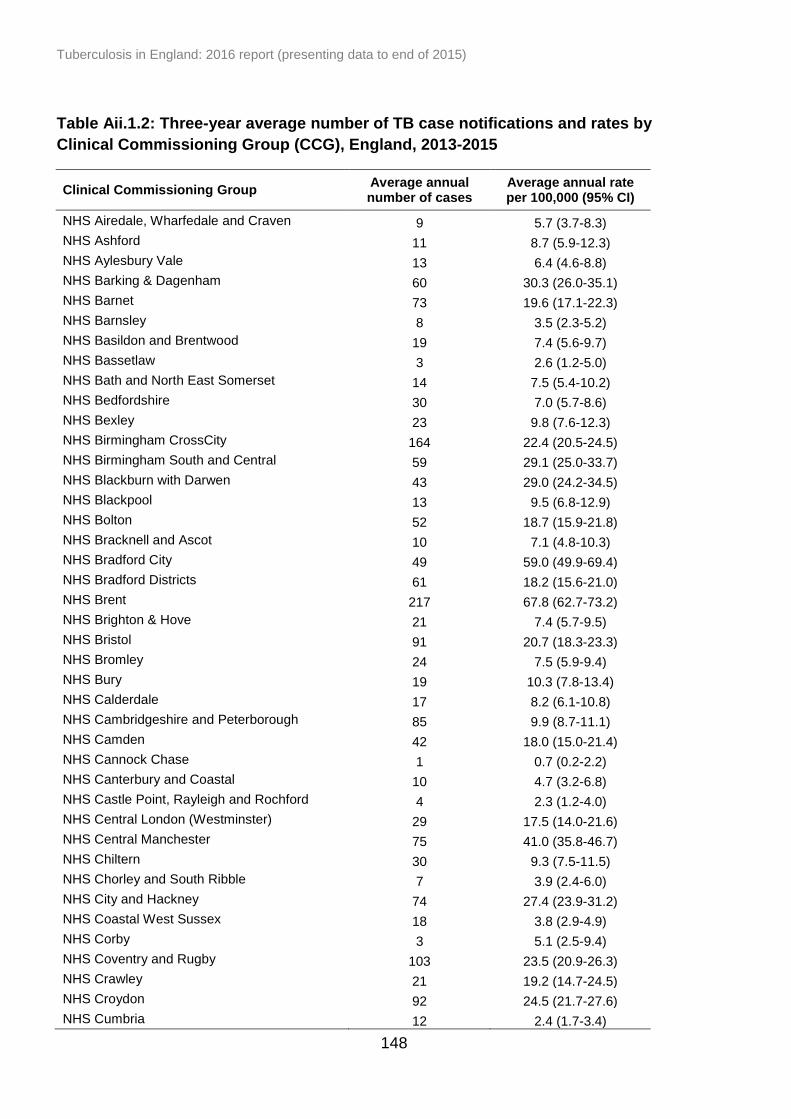
Tuberculosis in England: 2016 report (presenting data to end of 2015)
148
Table Aii.1.2: Three-year average number of TB case notifications and rates by
Clinical Commissioning Group (CCG), England, 2013-2015
Clinical Commissioning Group Average annual number of cases
Average annual rate per 100,000 (95% CI)
NHS Airedale, Wharfedale and Craven 9 5.7 (3.7-8.3)
NHS Ashford 11 8.7 (5.9-12.3)
NHS Aylesbury Vale 13 6.4 (4.6-8.8)
NHS Barking & Dagenham 60 30.3 (26.0-35.1)
NHS Barnet 73 19.6 (17.1-22.3)
NHS Barnsley 8 3.5 (2.3-5.2)
NHS Basildon and Brentwood 19 7.4 (5.6-9.7)
NHS Bassetlaw 3 2.6 (1.2-5.0)
NHS Bath and North East Somerset 14 7.5 (5.4-10.2)
NHS Bedfordshire 30 7.0 (5.7-8.6)
NHS Bexley 23 9.8 (7.6-12.3)
NHS Birmingham CrossCity 164 22.4 (20.5-24.5)
NHS Birmingham South and Central 59 29.1 (25.0-33.7)
NHS Blackburn with Darwen 43 29.0 (24.2-34.5)
NHS Blackpool 13 9.5 (6.8-12.9)
NHS Bolton 52 18.7 (15.9-21.8)
NHS Bracknell and Ascot 10 7.1 (4.8-10.3)
NHS Bradford City 49 59.0 (49.9-69.4)
NHS Bradford Districts 61 18.2 (15.6-21.0)
NHS Brent 217 67.8 (62.7-73.2)
NHS Brighton & Hove 21 7.4 (5.7-9.5)
NHS Bristol 91 20.7 (18.3-23.3)
NHS Bromley 24 7.5 (5.9-9.4)
NHS Bury 19 10.3 (7.8-13.4)
NHS Calderdale 17 8.2 (6.1-10.8)
NHS Cambridgeshire and Peterborough 85 9.9 (8.7-11.1)
NHS Camden 42 18.0 (15.0-21.4)
NHS Cannock Chase 1 0.7 (0.2-2.2)
NHS Canterbury and Coastal 10 4.7 (3.2-6.8)
NHS Castle Point, Rayleigh and Rochford 4 2.3 (1.2-4.0)
NHS Central London (Westminster) 29 17.5 (14.0-21.6)
NHS Central Manchester 75 41.0 (35.8-46.7)
NHS Chiltern 30 9.3 (7.5-11.5)
NHS Chorley and South Ribble 7 3.9 (2.4-6.0)
NHS City and Hackney 74 27.4 (23.9-31.2)
NHS Coastal West Sussex 18 3.8 (2.9-4.9)
NHS Corby 3 5.1 (2.5-9.4)
NHS Coventry and Rugby 103 23.5 (20.9-26.3)
NHS Crawley 21 19.2 (14.7-24.5)
NHS Croydon 92 24.5 (21.7-27.6)
NHS Cumbria 12 2.4 (1.7-3.4)

Tuberculosis in England: 2016 report (presenting data to end of 2015)
149
Clinical Commissioning Group Average annual number of cases
Average annual rate per 100,000 (95% CI)
NHS Darlington 5 5.1 (2.9-8.2)
NHS Dartford, Gravesham and Swanley 29 11.4 (9.1-14.1)
NHS Doncaster 22 7.3 (5.7-9.3)
NHS Dorset 28 3.7 (2.9-4.6)
NHS Dudley 32 10.0 (8.1-12.3)
NHS Durham Dales, Easington and Sedgefield 4 1.3 (0.7-2.4)
NHS Ealing 194 56.7 (52.2-61.5)
NHS East Lancashire 33 8.9 (7.3-10.9)
NHS East Leicestershire and Rutland 16 4.8 (3.6-6.4)
NHS East Riding of Yorkshire 5 1.7 (1.0-2.7)
NHS East Staffordshire 10 7.7 (5.2-11.1)
NHS East Surrey 10 5.6 (3.8-7.9)
NHS East and North Hertfordshire 35 6.4 (5.3-7.8)
NHS Eastbourne, Hailsham and Seaford 8 4.3 (2.8-6.4)
NHS Eastern Cheshire 9 4.6 (3.0-6.7)
NHS Enfield 70 21.6 (18.7-24.7)
NHS Erewash 4 4.2 (2.2-7.3)
NHS Fareham and Gosport 6 2.9 (1.7-4.6)
NHS Fylde & Wyre 4 2.2 (1.1-3.9)
NHS Gloucestershire 34 5.6 (4.6-6.8)
NHS Great Yarmouth & Waveney 13 6.1 (4.3-8.3)
NHS Greater Huddersfield 35 14.7 (12.0-17.7)
NHS Greater Preston 25 12.4 (9.7-15.5)
NHS Greenwich 97 36.2 (32.1-40.6)
NHS Guildford and Waverley 8 3.7 (2.3-5.5)
NHS Halton 3 2.4 (1.1-4.5)
NHS Hambleton, Richmondshire and Whitby 3 2.2 (1.0-4.0)
NHS Hammersmith and Fulham 42 23.3 (19.4-27.8)
NHS Hardwick 1 0.9 (0.2-2.7)
NHS Haringey 76 28.6 (25.0-32.5)
NHS Harrogate and Rural District 5 3.0 (1.6-5.0)
NHS Harrow 114 46.5 (41.7-51.7)
NHS Hartlepool and Stockton-on-Tees 13 4.4 (3.1-6.1)
NHS Hastings & Rother 10 5.5 (3.7-7.8)
NHS Havering 26 10.5 (8.3-13.1)
NHS Herefordshire 4 2.0 (1.0-3.5)
NHS Herts Valleys 42 7.2 (6.0-8.6)
NHS Heywood, Middleton & Rochdale 29 13.6 (10.9-16.8)
NHS High Weald Lewes Havens 5 2.7 (1.5-4.6)
NHS Hillingdon 107 36.7 (32.8-40.9)
NHS Horsham and Mid Sussex 9 3.8 (2.5-5.6)
NHS Hounslow 143 53.9 (48.9-59.3)
NHS Hull 17 6.5 (4.8-8.5)
NHS Ipswich and East Suffolk 13 3.3 (2.3-4.5)
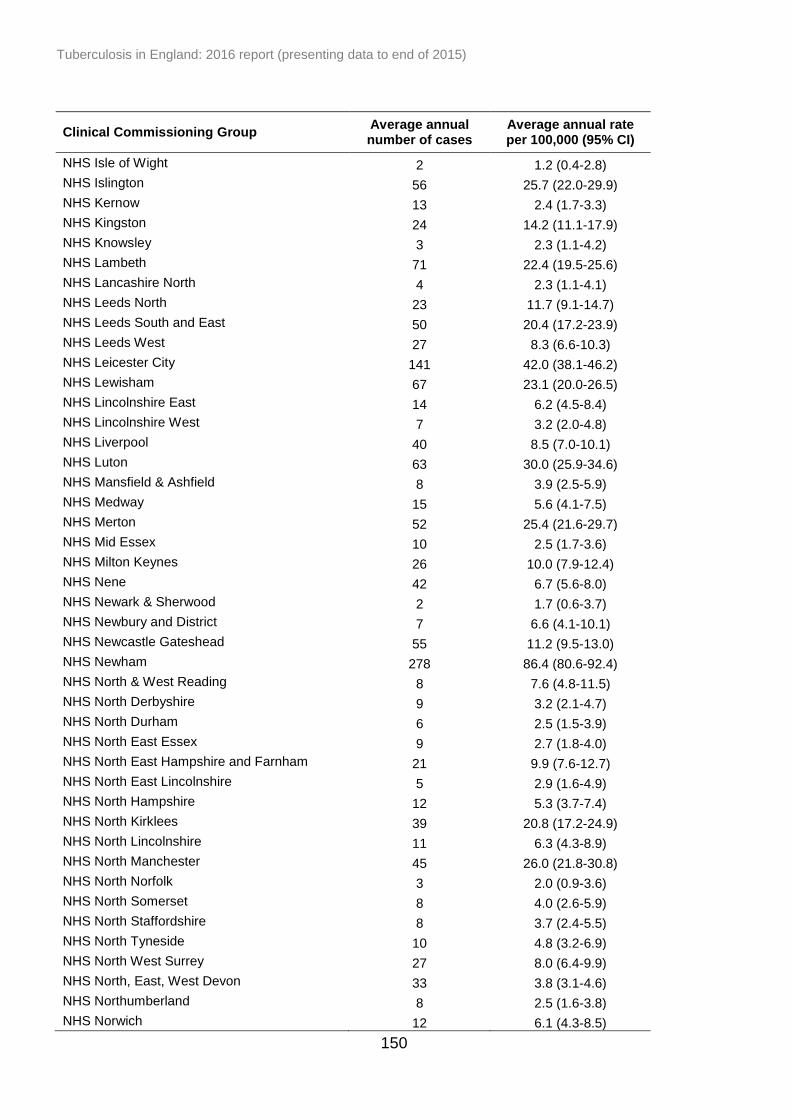
Tuberculosis in England: 2016 report (presenting data to end of 2015)
150
Clinical Commissioning Group Average annual number of cases
Average annual rate per 100,000 (95% CI)
NHS Isle of Wight 2 1.2 (0.4-2.8)
NHS Islington 56 25.7 (22.0-29.9)
NHS Kernow 13 2.4 (1.7-3.3)
NHS Kingston 24 14.2 (11.1-17.9)
NHS Knowsley 3 2.3 (1.1-4.2)
NHS Lambeth 71 22.4 (19.5-25.6)
NHS Lancashire North 4 2.3 (1.1-4.1)
NHS Leeds North 23 11.7 (9.1-14.7)
NHS Leeds South and East 50 20.4 (17.2-23.9)
NHS Leeds West 27 8.3 (6.6-10.3)
NHS Leicester City 141 42.0 (38.1-46.2)
NHS Lewisham 67 23.1 (20.0-26.5)
NHS Lincolnshire East 14 6.2 (4.5-8.4)
NHS Lincolnshire West 7 3.2 (2.0-4.8)
NHS Liverpool 40 8.5 (7.0-10.1)
NHS Luton 63 30.0 (25.9-34.6)
NHS Mansfield & Ashfield 8 3.9 (2.5-5.9)
NHS Medway 15 5.6 (4.1-7.5)
NHS Merton 52 25.4 (21.6-29.7)
NHS Mid Essex 10 2.5 (1.7-3.6)
NHS Milton Keynes 26 10.0 (7.9-12.4)
NHS Nene 42 6.7 (5.6-8.0)
NHS Newark & Sherwood 2 1.7 (0.6-3.7)
NHS Newbury and District 7 6.6 (4.1-10.1)
NHS Newcastle Gateshead 55 11.2 (9.5-13.0)
NHS Newham 278 86.4 (80.6-92.4)
NHS North & West Reading 8 7.6 (4.8-11.5)
NHS North Derbyshire 9 3.2 (2.1-4.7)
NHS North Durham 6 2.5 (1.5-3.9)
NHS North East Essex 9 2.7 (1.8-4.0)
NHS North East Hampshire and Farnham 21 9.9 (7.6-12.7)
NHS North East Lincolnshire 5 2.9 (1.6-4.9)
NHS North Hampshire 12 5.3 (3.7-7.4)
NHS North Kirklees 39 20.8 (17.2-24.9)
NHS North Lincolnshire 11 6.3 (4.3-8.9)
NHS North Manchester 45 26.0 (21.8-30.8)
NHS North Norfolk 3 2.0 (0.9-3.6)
NHS North Somerset 8 4.0 (2.6-5.9)
NHS North Staffordshire 8 3.7 (2.4-5.5)
NHS North Tyneside 10 4.8 (3.2-6.9)
NHS North West Surrey 27 8.0 (6.4-9.9)
NHS North, East, West Devon 33 3.8 (3.1-4.6)
NHS Northumberland 8 2.5 (1.6-3.8)
NHS Norwich 12 6.1 (4.3-8.5)
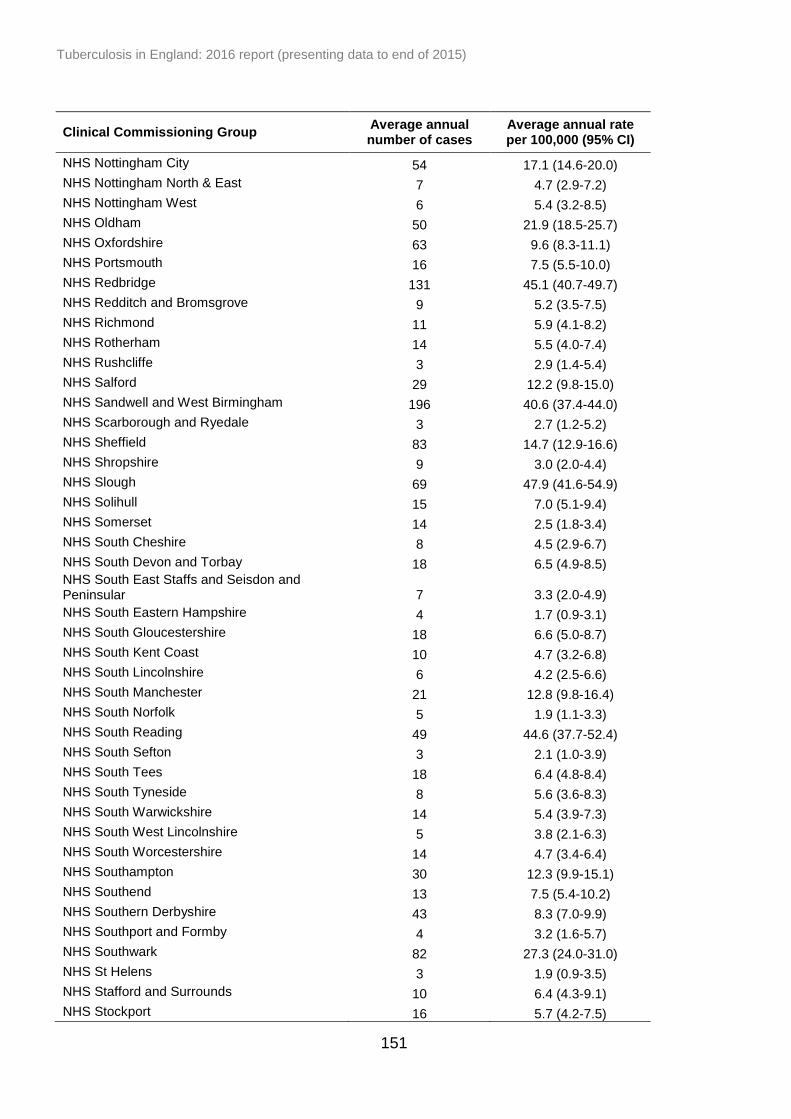
Tuberculosis in England: 2016 report (presenting data to end of 2015)
151
Clinical Commissioning Group Average annual number of cases
Average annual rate per 100,000 (95% CI)
NHS Nottingham City 54 17.1 (14.6-20.0)
NHS Nottingham North & East 7 4.7 (2.9-7.2)
NHS Nottingham West 6 5.4 (3.2-8.5)
NHS Oldham 50 21.9 (18.5-25.7)
NHS Oxfordshire 63 9.6 (8.3-11.1)
NHS Portsmouth 16 7.5 (5.5-10.0)
NHS Redbridge 131 45.1 (40.7-49.7)
NHS Redditch and Bromsgrove 9 5.2 (3.5-7.5)
NHS Richmond 11 5.9 (4.1-8.2)
NHS Rotherham 14 5.5 (4.0-7.4)
NHS Rushcliffe 3 2.9 (1.4-5.4)
NHS Salford 29 12.2 (9.8-15.0)
NHS Sandwell and West Birmingham 196 40.6 (37.4-44.0)
NHS Scarborough and Ryedale 3 2.7 (1.2-5.2)
NHS Sheffield 83 14.7 (12.9-16.6)
NHS Shropshire 9 3.0 (2.0-4.4)
NHS Slough 69 47.9 (41.6-54.9)
NHS Solihull 15 7.0 (5.1-9.4)
NHS Somerset 14 2.5 (1.8-3.4)
NHS South Cheshire 8 4.5 (2.9-6.7)
NHS South Devon and Torbay 18 6.5 (4.9-8.5) NHS South East Staffs and Seisdon and Peninsular 7 3.3 (2.0-4.9)
NHS South Eastern Hampshire 4 1.7 (0.9-3.1)
NHS South Gloucestershire 18 6.6 (5.0-8.7)
NHS South Kent Coast 10 4.7 (3.2-6.8)
NHS South Lincolnshire 6 4.2 (2.5-6.6)
NHS South Manchester 21 12.8 (9.8-16.4)
NHS South Norfolk 5 1.9 (1.1-3.3)
NHS South Reading 49 44.6 (37.7-52.4)
NHS South Sefton 3 2.1 (1.0-3.9)
NHS South Tees 18 6.4 (4.8-8.4)
NHS South Tyneside 8 5.6 (3.6-8.3)
NHS South Warwickshire 14 5.4 (3.9-7.3)
NHS South West Lincolnshire 5 3.8 (2.1-6.3)
NHS South Worcestershire 14 4.7 (3.4-6.4)
NHS Southampton 30 12.3 (9.9-15.1)
NHS Southend 13 7.5 (5.4-10.2)
NHS Southern Derbyshire 43 8.3 (7.0-9.9)
NHS Southport and Formby 4 3.2 (1.6-5.7)
NHS Southwark 82 27.3 (24.0-31.0)
NHS St Helens 3 1.9 (0.9-3.5)
NHS Stafford and Surrounds 10 6.4 (4.3-9.1)
NHS Stockport 16 5.7 (4.2-7.5)
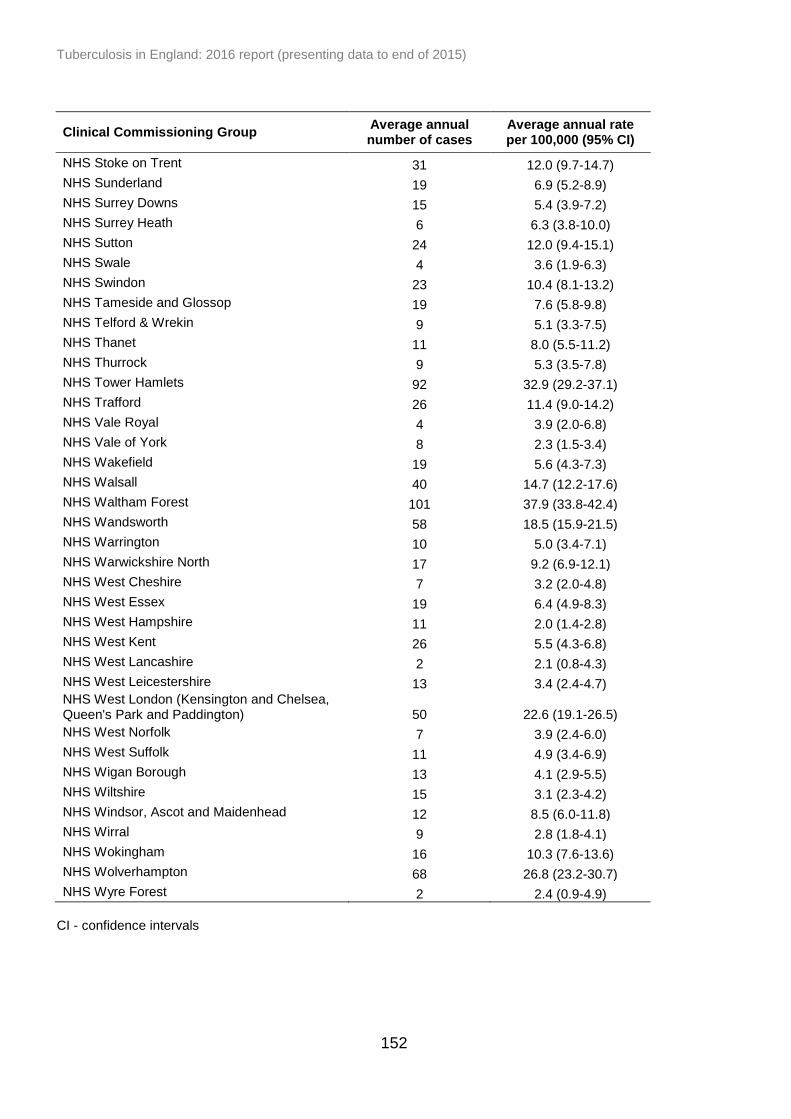
Tuberculosis in England: 2016 report (presenting data to end of 2015)
152
Clinical Commissioning Group Average annual number of cases
Average annual rate per 100,000 (95% CI)
NHS Stoke on Trent 31 12.0 (9.7-14.7)
NHS Sunderland 19 6.9 (5.2-8.9)
NHS Surrey Downs 15 5.4 (3.9-7.2)
NHS Surrey Heath 6 6.3 (3.8-10.0)
NHS Sutton 24 12.0 (9.4-15.1)
NHS Swale 4 3.6 (1.9-6.3)
NHS Swindon 23 10.4 (8.1-13.2)
NHS Tameside and Glossop 19 7.6 (5.8-9.8)
NHS Telford & Wrekin 9 5.1 (3.3-7.5)
NHS Thanet 11 8.0 (5.5-11.2)
NHS Thurrock 9 5.3 (3.5-7.8)
NHS Tower Hamlets 92 32.9 (29.2-37.1)
NHS Trafford 26 11.4 (9.0-14.2)
NHS Vale Royal 4 3.9 (2.0-6.8)
NHS Vale of York 8 2.3 (1.5-3.4)
NHS Wakefield 19 5.6 (4.3-7.3)
NHS Walsall 40 14.7 (12.2-17.6)
NHS Waltham Forest 101 37.9 (33.8-42.4)
NHS Wandsworth 58 18.5 (15.9-21.5)
NHS Warrington 10 5.0 (3.4-7.1)
NHS Warwickshire North 17 9.2 (6.9-12.1)
NHS West Cheshire 7 3.2 (2.0-4.8)
NHS West Essex 19 6.4 (4.9-8.3)
NHS West Hampshire 11 2.0 (1.4-2.8)
NHS West Kent 26 5.5 (4.3-6.8)
NHS West Lancashire 2 2.1 (0.8-4.3)
NHS West Leicestershire 13 3.4 (2.4-4.7) NHS West London (Kensington and Chelsea, Queen's Park and Paddington) 50 22.6 (19.1-26.5)
NHS West Norfolk 7 3.9 (2.4-6.0)
NHS West Suffolk 11 4.9 (3.4-6.9)
NHS Wigan Borough 13 4.1 (2.9-5.5)
NHS Wiltshire 15 3.1 (2.3-4.2)
NHS Windsor, Ascot and Maidenhead 12 8.5 (6.0-11.8)
NHS Wirral 9 2.8 (1.8-4.1)
NHS Wokingham 16 10.3 (7.6-13.6)
NHS Wolverhampton 68 26.8 (23.2-30.7)
NHS Wyre Forest 2 2.4 (0.9-4.9)
CI - confidence intervals

Tuberculosis in England: 2016 report (presenting data to end of 2015)
153
Appendix III. Methods
Data production
Case notifications
Cases in England are notified to the Enhanced Tuberculosis Surveillance system
(ETS), other than in London where cases are notified to the London TB Register
(LTBR). Data from the LTBR is routinely imported to ETS. ETS is also used in
Wales and Northern Ireland, but only cases resident in England, or those that are
homeless or from abroad and assigned to a clinic in England are included in this
report.
Data were extracted from ETS at the end of March 2016, then cleaned and
validated by end of August 2016.
Matching laboratory isolates to case notifications
Data from all TB isolates sent to Mycobacteria Reference Laboratories for culture
between January 2014 and March 2016 was deduplicated and a summary record
was generated from all the isolates from the same individual within a 12-month
period. Cases that received treatment for longer than 12 months were reviewed and
summarised with isolates including those outwith the 12-month period.
These data were then matched to TB case notifications from 2014 and 2015,
through a probabilistic matching process based on patient identifiers common to
both the laboratory isolate and the case notification [13]. Matches were also subject
to manual review to identify any false positive or false negative matches. For TB
cases notified before 2014, results from matching conducted in prior years (using
the same process described above) were retained and included in the final dataset.
In addition, isolates and cases are matched in ETS; automatically where patient
identifiers are identical or manually by users where differences in patient identifiers
occur. These matches were included in the production of the full dataset.
Matching TB and HIV data
Data from TB cases notified between 2001 and 2014 and data from unmatched
laboratory TB isolates with specimen dates between 2003 and 2014 were matched
to HIV data from SOPHID and HANDD for the same time period as above, for those
Tuberculosis in England: 2016 report (presenting data to end of 2015)
154
aged 15 years and above in England. Data was matched using a probabilistic
matching process based on patient identifiers common to both the TB and HIV
datasets, followed by deterministic matching and manual review. This was done
using the TB dataset prepared in 2015, and not with the updated current dataset.
Data cleaning to improve data quality
In addition to validation checks at data entry and routine cleaning queries that
identify missing or inconsistent data within ETS, the following cleaning was
subsequently carried out to produce the dataset used in reporting for cases notified
from 2000 to 2015.
The postcode field (used to map postcodes to geographic areas, including CCGs)
was cleaned by identifying postcodes with an incorrect number of characters or
those with obvious errors in the postcode (i.e. symbols). Where cleaning was
necessary, the correct postcode was identified using the address fields. For cases
that were homeless or who had a residence outside the UK, but were notified in
England, the postcode of the clinic/hospital that they were treated at was assigned
to the case. For cases with no postcode or treatment clinic/hospital, the local
authority and PHEC were updated using the local authority field recorded in ETS
(based on the area that the notifying case manager was located in). Cases were
assigned to PHECs (revised boundaries as of 1st July 2015) by matching the local
authority of residence to the relevant PHEC.
Cases of BCGosis, patients with latent TB on chemoprophylaxis and cases of non-
tuberculosis mycobacteria who were notified in error were identified using
comments fields, and denotified. Cases with culture confirmation who had been
denotified were queried with clinics, and lab contaminations were removed or cases
were renotified if they were found to have been denotified in error.
The site of disease was reclassified to pulmonary if a positive sputum smear
(microscopy) sample was recorded or if a positive culture was grown from a
pulmonary laboratory specimen. Cases with miliary or laryngeal TB were included in
pulmonary breakdowns. Site of disease for cases with extra-pulmonary disease was
reclassified for culture confirmed cases based on the site in the body where the
specimen was taken. Site of disease classifications were also updated using the
free text field site of disease in ETS.
Occupation was re-categorised into the main occupational groups
(agricultural/animal care worker, social service/prison, laboratory/pathology,
healthcare worker and education) if the occupation documented in the free text field
Tuberculosis in England: 2016 report (presenting data to end of 2015)
155
(which is available within ETS for occupational groups recorded as none or other),
could be classified in one of these occupational groups.
The presence or absence of social risk factors (current or a history of drug misuse,
alcohol misuse, homelessness and prison) was updated based on information
recorded in free text comments fields within ETS. Drug misuse (including if it was
current or past use) was updated to “yes” if recorded as unknown but current or
past drug misuse was mentioned in the comments fields. Alcohol misuse/ was
updated if alcohol misuse was mentioned in the comments along with evidence that
the patient was non-compliant or on DOT, in line with the definition that alcohol
affects the ability to self-administer treatment. Homelessness was updated to “yes”
if mentioned in the comments fields or if the address given was “no fixed abode” or
a shelter/hostel for homeless people was named. Prison (including if it was current
or past use) was updated to “yes” if mentioned in the comments fields or if HMP or
a prison name was recorded as the address. Data on incident TB cases reported to
the Public Health in Prisons (PHiP) log were used to validate cases reported with a
current imprisonment on ETS and updates were made where required. Cases
remanded in an immigration removal centre were identified through the address
given at notification, comments fields or occupation field showed the case to be an
immigration detainee.
Data cleaning of TB outcomes
If a case was reported to have died without a date of death, Office for National
Statistics (ONS) mortality data was used where available. Where date of death for
the TB outcome and post-mortem date of death differed, the correct date of death
was identified by validating the data against the ONS mortality data. In addition to
cases reported as post-mortem on ETS, post-mortem deaths were identified
through review of information in the comments fields and the date of diagnosis and
the date of death. Deaths were re-classified as post-mortem deaths if the date of
death was earlier than the date of diagnosis, where date of diagnosis was available.
Deaths were re-classified as not post-mortem deaths if a case had a start date of
treatment and the TB outcome entered stated that the patient died before treatment
or while on treatment (indicating that the patient was suspected to have TB before
death).
For cases who died and treatment start date was available, cases were reclassified
as died at 12, 24 or 36 months based on the time between the date of starting
treatment and the date of death. Where the date of treatment start was not
available, the notification date was used. Similarly, for cases who completed
treatment and treatment start date was available, cases were reclassified as
completed at 12, 24 or 36 months based on the time between the date of treatment
Tuberculosis in England: 2016 report (presenting data to end of 2015)
156
start and the date of treatment completion. Where treatment start date was not
available the notification date was used if appropriate.
For MDR/RR-TB cases, the start date of MDR/RR-TB treatment (collected
externally to ETS using paper based questionnaires) was used to reclassify TB
outcome at 12, 24 or 36 months. MDR-TB/RR cases that died were reclassified
based on the time between date of starting MDR/RR-TB treatment and the date of
death. Similarly, for MDR/RR-TB cases that had completed treatment, cases were
reclassified using the date of starting MDR-TB treatment and date of treatment
completion. Where the MDR/RR-TB treatment start date was not known, MDR/RR-
TB cases were not reclassified and the original TB outcome that was recorded on
ETS was used.
Comments fields were also used to identify additional outcomes that were not
recorded on ETS. For cases who were transferred to another clinic but a duplicate
was entered in error, the TB outcome was used from the record where it was
recorded and the duplicate was removed.
Reporting methodology
Time periods
TB rates are presented from the year 2000, the first year of enhanced surveillance
for TB. TB-HIV co-infection trends are presented from 2001 onwards, the first year
both TB and HIV data are available. All other trends are presented displaying the 10
most recent years of data, with the following exceptions; Mycobacterium speciation,
MIRU-VNTR clustering, treatment delay, social risk factors and HIV testing. MIRU-
VNTR clustering, social risk factors and HIV testing are presented from the first year
data were collected. Mycobacterium speciation is presented from 2009 onwards as
MTBC was reclassified as Mycobacterium tuberculosis prior to 2009 and treatment
delay is presented from 2011 onward when data completeness for symptom onset
data and treatment start date were both above 66%. For social risk factors, data
were presented from 2010 when data were available. Where presenting a single
year of data would have resulted in the display of small numbers, five years have
been combined.
Tuberculosis rates
Rates are presented from 2000 to 2015 with overall TB rates per 100,000
population, as well as those by age, sex and area of reporting, calculated using the
mid-year population estimates provided by ONS. Average annual rates per 100,000
for a three-year period were calculated by dividing the numerator (the number of TB

Tuberculosis in England: 2016 report (presenting data to end of 2015)
157
notifications in the three-year period) by the denominator (the sum of the mid-year
population estimates for the same three-year period) and multiplying by 100,000.
Rates by place of birth and by ethnic group were calculated using population
estimates from the Labour Force Survey (LFS)
http://www.esds.ac.uk/findingData/qlfs.asp. The LFS is based on a population
sample, so estimates are liable to sampling errors, particularly for small population
subgroups, and should be interpreted with caution.
CCGs were placed into priority groups for LTBI testing based on the CCG TB rate
per 100,000 and the TB burden (the proportion of cases the CCG contributes to the
overall number of cases for England). High incidence CCGs are defined as those
with an incidence of 20.0 per 100,000 or above. High burden CCGs are defined as
those with a case number over 0.5% of the total case number in England.
TB rates detected during pre-entry TB screening were calculated by taking the
cases detected as the numerator and the number of applicants screened in the
same year as the denominator.
Social risk factors and health inequalities
Cases were reported as having at least one social risk factor (yes) if any of the four
social risk factors (current or a history of homelessness, drug misuse, alcohol
misuse and imprisonment) had “yes” recorded. Cases were only reported to have
no social risk factor where all of the four risk factors were recorded as “no”.
Information on individual social risk factors was also reported separately, regardless
of whether information was known for all four risk factors. Because of this, the
denominator for reporting of at least one social risk factor and individual social risk
factors may differ.
TB cases were assigned an Index of Multiple Deprivation 2015 (IMD 2015) rank
based on Lower Super Output Area (LSOA) of residence. To assign LSOAs to
deprivation categories, the LSOAs were first sorted from most to least deprived
using the IMD 2015 rank, before being divided into deciles. The LSOA mid-year
population estimates were also assigned to these deciles and the rate per decile
was calculated by dividing the TB cases per decile by the population per decile and
multiplying by 100,000.
DOT interpretation
The variables for collecting information on DOT are different in ETS and LTBR. In
ETS, the relevant variable is “Is the patient to begin a course of treatment under
Tuberculosis in England: 2016 report (presenting data to end of 2015)
158
direct observation?”. In LTBR the relevant variable is “Patient was taking Directly
Observed Therapy at any time during the episode of care”. For the purposes of this
report, a report of “yes” for either variable was taken as an indication that the patient
had received DOT.
Reporting of Mycobacterium species
The species field was reclassified based on 24 loci MIRU-VNTR phylotypic lineage
(see below); those reported as MTBC with a phylotypic lineage of EAI, Beijing, CAS,
or Euro-american were reclassified as M. tuberculosis. Those reported as M.
tuberculosis or MTBC with phylotypic lineage of M. bovis or M. africanum were
reclassified as M. bovis or M. africanum, respectively.
Reporting drug resistance
Initial resistance was classed as resistance identified within three months of the first
specimen date. However, cases with a change from a sensitive to resistant result
following treatment were reclassified as acquired resistance, even if this is within
the three month period. Any result which changed from sensitive to resistant after
the three month period was automatically counted as having acquired resistance. If
no drug susceptibility results were available for isolates cultured in the first three
months, any subsequent susceptibility results were not used, unless MDR-TB was
identified. To ensure that all MDR-TB cases were counted, where the first available
drug susceptibility test was after the three month cut off and positive for MDR-TB
(with no evidence of acquired resistance), this MDR-TB result was classified as
initial resistance.
Additional non-culture confirmed cases treated with an MDR-TB regimen, were
identified using key word searches on the comment fields on the ETS case reports.
Strain typing
Strain types were assigned cluster numbers and phylogenetic lineage (based on
MIRU-VNTR) using the cluster numbers assigned in the Strain Typing Module
(STM) of ETS for those with a strain type with at least 23 loci.
A cluster was defined as two or more cases with indistinguishable 24 loci MIRU-
VNTR strain types with at least one case with a complete 24 loci profile [14].
Additional cases in the cluster may each have one missing loci. In addition, clusters
identified by the Mycobacteria Reference Laboratories where all cases in the cluster
have one untypable locus at the same locus are designated as “u clusters”. The

Tuberculosis in England: 2016 report (presenting data to end of 2015)
159
year a cluster was assigned to being a new cluster was the year of notification of
the second case in the cluster.
Cases that are part of a cluster are referred to as clustered cases. Clustered cases
were presented for England and PHEC. Clustered cases within a PHEC were only
defined as clustered if they were in a cluster with other cases within the same
PHEC.
TB outcome cohorts
TB outcomes are reported for all notified TB cases which includes those who
started treatment and those who did not (for example diagnosed post-mortem, died
without starting treatment, lost to follow up without starting treatment). For the
purposes of TB outcome reporting, the drug sensitive cohort is defined as all TB
cases, excluding those with rifampicin resistant TB or MDR-TB (initial or acquired),
or non-culture confirmed cases treated with an MDR-TB regimen [5]. In this report,
TB outcomes for drug sensitive TB cases were reported separately for the following
groups:
for cases with an expected duration of treatment less than 12 months, TB
outcomes at 12 months are reported. This group excludes cases with CNS
disease, who have an expected duration of treatment of 12 months. In
addition, those with spinal, cryptic disseminated or miliary disease are
excluded from this group, as CNS involvement cannot be reliably ruled out
for the purposes of reporting
for cases with CNS, spinal, cryptic disseminated or miliary disease, the last
recorded TB outcome is reported
The drug resistant cohort included any cases with MDR/RR-TB (initial or acquired)
as well as those without culture confirmation treated with an MDR-TB regimen.
A TB outcome is assigned to each member of these cohorts; those that have an
unknown TB outcome, or recorded as transferred to another clinic are assigned the
outcome “not evaluated”.
As well as reporting outcomes at defined time periods (at 12 and 24 months for drug
sensitive and drug resistant cohorts, respectively), a last recorded outcome based
on the last known outcome was derived and presented for those still on treatment
beyond the 12 and 24 month time periods.
Specifically, for this report the following groups have been presented:
Tuberculosis in England: 2016 report (presenting data to end of 2015)
160
drug sensitive cohort with expected course of treatment less than 12 months
TB outcomes were reported at 12 months, with analysis of treatment
completion at 12 months
drug sensitive cohort with CNS, spinal, miliary or cryptic disseminated TB
had outcomes reported for the last recorded outcome
analysis of deaths in the entire drug sensitive cohort (including CNS, spinal,
miliary or cryptic disseminated TB) were presented for the last recorded
outcome
analysis of loss to follow-up in the entire drug sensitive cohort was presented
for the last recorded outcome
drug resistant cohort had TB outcomes reported at 24 months, with analysis
of treatment completion at 24 months
deaths and loss to follow-up of the drug resistant cohort were reported at last
recorded outcome
Confidence intervals
95% confidence intervals for incidence rates were calculated using a Poisson
distribution. For proportions a binomial distribution was used.
Software packages
All statistical analysis was carried out using STATA 13. ArcGIS 10.2 was used to
produce all maps shown in the report.
Tuberculosis in England: 2016 report (presenting data to end of 2015)
161
Appendix IV. Surveillance data quality
Data completeness
Audits of records are undertaken annually based on the criteria suggested in the 2007
Department of Health TB Toolkit for Commissioners [15] which outlines the minimum
quality standards for surveillance. Data presented in the completeness tables are based
on data that was entered into the Enhanced TB Surveillance system (ETS) before
additional cleaning has been undertaken for presentation in the rest of the report. Table
IV.1 shows the level of completeness of the information for the Toolkit fields which have
a 95% target. To further categorise completeness <95%, 95-98% and 99-100%
completeness are colour coded in the table. The fields “forename”, “surname”,
“postcode”, “date of birth” and “sex”, are mandatory fields in ETS. Since May 2015, it
has been mandatory for all cases (with the exception of cases notified to LTBR) to
either enter a valid NHS number or select “no NHS number”.
In general, data completeness is high and has improved over time for many variables
collected in ETS (Table Aiv.1, Aiv.2, Aiv.3 and Aiv.4). However, completeness could still
be improved further for some variables.
Demographic variables completeness (Table Aiv.1 and Aiv.2)
NHS Number
This variable is used for matching TB notifications to TB isolates to ensure information
on culture confirmation, drug resistance and strain typing is available for each case. In
addition, this data helps identify duplicate notifications. High completion is therefore
extremely important.
completeness was 86% in 2015. There was a 7% decrease in completion between
2014 and 2015, this was mainly caused by a decrease of 15% in London between
2014 and 2015
in 2015, NHS number completion on TB isolates received from Mycobacterium
Reference Laboratories was 80%
Tuberculosis in England: 2016 report (presenting data to end of 2015)
162
Clinical variables completeness (Table Aiv.1 and Aiv.2)
Previous TB treatment
For those known to have a previous diagnosis, information on previous treatment
(yes/no) is also collected. It is important to collect this information to understand if drug
resistance occurs in those who were previously treated or in those with no previous
treatment. However, given its low completion, previous diagnosis has to be used as a
proxy measure when reporting nationally and internationally.
for those who had a previous diagnosis of TB, (96% known for England), previous
TB treatment completeness was low (77%)
there was a decrease in completeness of 3% between 2014 and 2015
Diagnosis variables completeness (Table Aiv.3 and Aiv.4)
Sputum smear status
Results of sputum smear status are collected through manual data entry onto ETS, and
completion of this information in ETS is low. While onerous, entry of this data is
important as currently no other possible mechanism for collection exists. Sputum smear
status among pulmonary cases enables quantification of the number and proportion of
TB cases that are likely to be most infectious.
only 62% of pulmonary cases had a sputum smear status reported in 2015
there was no improvement in completeness between 2014 and 2015
Symptom onset date completeness
this variable is used in the TB Strategy Monitoring indicators 6 and 7, and is vital to
assess diagnostic and treatment delays; completion was 93% in 2015
there was a 5% increase in completeness between 2014 and 2015
Date presented completeness16
The definition of this variable is the date a case first presented to a healthcare service,
not when first presented to TB services (unless this was the first contact with
healthcare). It is important to collect this to assess patient delays in diagnosis compared
16
Completion of this field does not include London cases, as this data field is not available in LTBR

Tuberculosis in England: 2016 report (presenting data to end of 2015)
163
with healthcare delays, to monitor and improve access to healthcare and early
diagnosis.
completion was only 87% in 2015, the lowest of the four key dates used in delay
monitoring (symptom onset date, date first presented, date of diagnosis and date of
treatment start)
there was no difference in completeness between 2014 and 2015
New variables introduced to ETS17
Travel and visitor risk factor variables (Table Aiv.5)
The travel and visitor history risk factor variables were introduced to ETS in May 2015.
completeness for reporting on travel and visitor history was 82% and 83%,
respectively
travel history was known for only 65% of cases
visitor history was known for only 55% cases
Co-morbidities (Table Aiv.6)
The co-morbidity variables were introduced to ETS in July 2015.
of the co-morbidities collected, diabetes had the highest completion, with 94%
reported and 83% known
hepatitis C had the lowest completion, with 93% reported and only 69% known
17
Completion of this field does not include London cases, as this data field is not available in LTBR
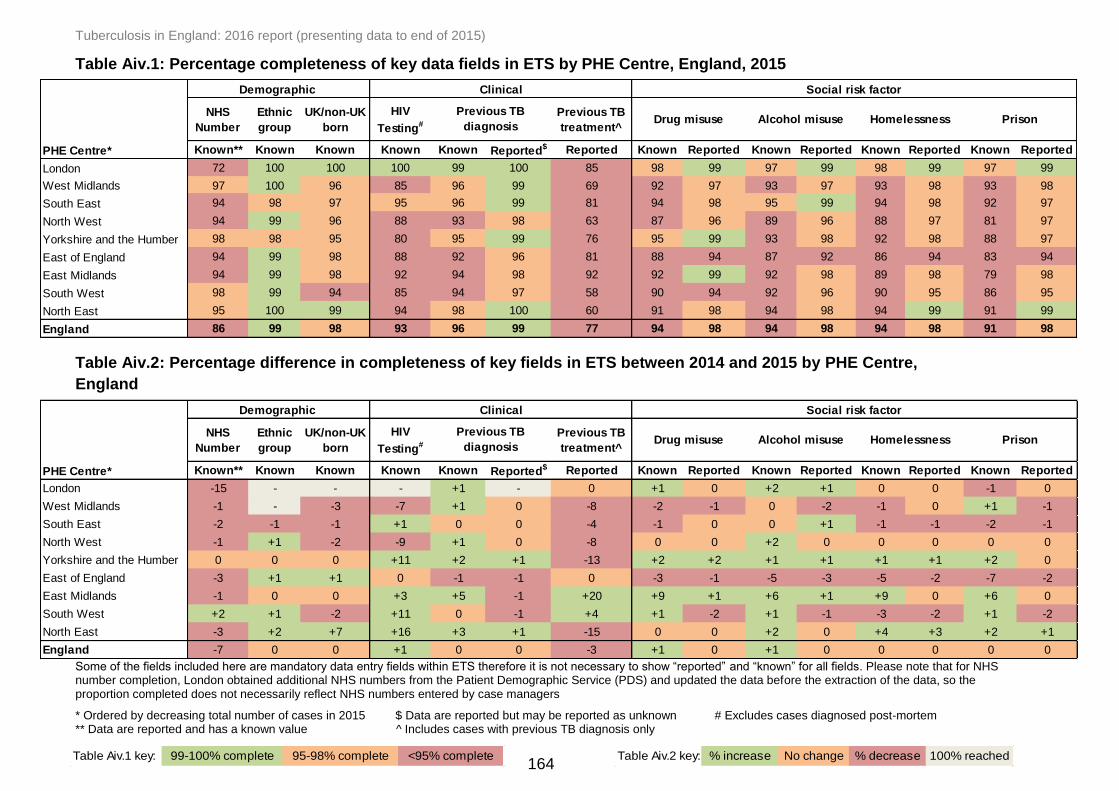
Tuberculosis in England: 2016 report (presenting data to end of 2015)
164
Table Aiv.1: Percentage completeness of key data fields in ETS by PHE Centre, England, 2015
Table Aiv.2: Percentage difference in completeness of key fields in ETS between 2014 and 2015 by PHE Centre,
England
Some of the fields included here are mandatory data entry fields within ETS therefore it is not necessary to show “reported” and “known” for all fields. Please note that for NHS number completion, London obtained additional NHS numbers from the Patient Demographic Service (PDS) and updated the data before the extraction of the data, so the proportion completed does not necessarily reflect NHS numbers entered by case managers
* Ordered by decreasing total number of cases in 2015 $ Data are reported but may be reported as unknown # Excludes cases diagnosed post-mortem ** Data are reported and has a known value ^ Includes cases with previous TB diagnosis only
NHS
Number
Ethnic
group
UK/non-UK
born
HIV
Testing#
Previous TB
treatment^
Known** Known Known Known Known Reported$ Reported Known Reported Known Reported Known Reported Known Reported
London 72 100 100 100 99 100 85 98 99 97 99 98 99 97 99
West Midlands 97 100 96 85 96 99 69 92 97 93 97 93 98 93 98
South East 94 98 97 95 96 99 81 94 98 95 99 94 98 92 97
North West 94 99 96 88 93 98 63 87 96 89 96 88 97 81 97
Yorkshire and the Humber 98 98 95 80 95 99 76 95 99 93 98 92 98 88 97
East of England 94 99 98 88 92 96 81 88 94 87 92 86 94 83 94
East Midlands 94 99 98 92 94 98 92 92 99 92 98 89 98 79 98
South West 98 99 94 85 94 97 58 90 94 92 96 90 95 86 95
North East 95 100 99 94 98 100 60 91 98 94 98 94 99 91 99
England 86 99 98 93 96 99 77 94 98 94 98 94 98 91 98
PHE Centre*
Alcohol misuse Homelessness Prison
Social risk factorClinical
Previous TB
diagnosis
Demographic
Drug misuse
NHS
Number
Ethnic
group
UK/non-UK
born
HIV
Testing#
Previous TB
treatment^
Known** Known Known Known Known Reported$ Reported Known Reported Known Reported Known Reported Known Reported
London -15 - - - +1 - 0 +1 0 +2 +1 0 0 -1 0
West Midlands -1 - -3 -7 +1 0 -8 -2 -1 0 -2 -1 0 +1 -1
South East -2 -1 -1 +1 0 0 -4 -1 0 0 +1 -1 -1 -2 -1
North West -1 +1 -2 -9 +1 0 -8 0 0 +2 0 0 0 0 0
Yorkshire and the Humber 0 0 0 +11 +2 +1 -13 +2 +2 +1 +1 +1 +1 +2 0
East of England -3 +1 +1 0 -1 -1 0 -3 -1 -5 -3 -5 -2 -7 -2
East Midlands -1 0 0 +3 +5 -1 +20 +9 +1 +6 +1 +9 0 +6 0
South West +2 +1 -2 +11 0 -1 +4 +1 -2 +1 -1 -3 -2 +1 -2
North East -3 +2 +7 +16 +3 +1 -15 0 0 +2 0 +4 +3 +2 +1
England -7 0 0 +1 0 0 -3 +1 0 +1 0 0 0 0 0
PHE Centre*
Demographic Clinical Social risk factor
Previous TB
diagnosisDrug misuse Alcohol misuse Homelessness Prison
Table Aiv.1 key: 99-100% complete 95-98% complete <95% complete Table Aiv.2 key: % increase No change % decrease 100% reached

Tuberculosis in England: 2016 report (presenting data to end of 2015)
165
Table Aiv.3: Percentage completeness of data fields for diagnosis and treatment in ETS by PHE Centre, England,
2015
Table Aiv.4: Percentage difference in completeness of data fields for diagnosis and treatment in ETS between 2014
and 2015 by PHE Centre, England
For treatment outcome variables - recording of ‘not completed’, or ‘transferred out’ are counted as unknown and not reported * Ordered by decreasing total number of cases in 2015 $ For cases with unknown site of disease § For cases notified in 2014 ** Pulmonary cases only † Cases notified in 2014 that have completed treatment only ‡ Data are reported but may be reported as unknown # Data are reported and has a known value ^ Excludes cases diagnosed post-mortem ¥ For cases notified in 2013 and still on treatment at 12 months
Sputum smear
status**
Site of
disease$
Symptom
onset date^
Date first
presented
Date
diagnosed^
Start of
treatment
date^
Date treatment
completed†
Known# Known Known Known Known Known Known Known Reported‡ Known Reported
London 78 100 93 N/A 87 99 100 100 100 100 100
West Midlands 53 99 90 88 96 98 97 99 100 98 100
South East 55 100 96 91 98 98 99 98 99 100 100
North West 54 100 92 87 98 99 99 99 100 97 97
Yorkshire and the Humber 51 100 93 88 98 97 97 97 99 90 95
East of England 46 100 84 75 96 99 98 98 99 100 100
East Midlands 60 100 98 82 88 100 98 99 99 100 100
South West 51 100 95 93 98 99 100 99 99 100 100
North East 46 99 97 96 99 99 97 98 99 100 100
England 62 100 93 87 93 99 99 99 100 99 100
Treatment Outcome
reported at 12 months§
Treatment Outcome
reported at 24 months¥PHE Centre*
Sputum smear
status**
Site of
disease$
Symptom
onset date^
Date first
presented
Date
diagnosed^
Start of
treatment
date^
Date treatment
completed†
Known# Known Known Known Known Known Known Known Reported‡ Known Reported
London 0 - +12 N/A +7 -1 - - - +1 -
West Midlands -1 -1 -3 -5 -2 -1 0 -1 - -2 -
South East -2 - +2 +2 0 -1 +1 -1 0 +4 +4
North West -4 - +1 +4 +2 -1 +1 0 - -3 -3
Yorkshire and the Humber +3 +1 +2 0 +1 -3 -1 -2 0 -10 -5
East of England +2 - -6 -8 0 0 -1 -1 -1 - -
East Midlands +3 - 0 +6 +4 +1 -2 0 -1 +10 -
South West +6 - +2 +2 +2 0 +5 +6 +5 - -
North East +13 -1 +4 +3 +4 0 0 +1 0 - -
England 0 - +5 0 +3 -1 +1 0 - 0 -
PHE Centre*
Treatment Outcome
reported at 12 months§
Treatment Outcome
reported at 24 months¥
Table Aiv.3 key: 99-100% complete 95-98% complete <95% complete Table Aiv.4 key: % increase No change % decrease 100% reached

Tuberculosis in England: 2016 report (presenting data to end of 2015)
166
Table Aiv.5: Percentage completeness of data fields for travel and visitor risk factors in ETS by PHE Centre,
England, 2015*
Table Aiv.6: Percentage completeness of data fields for comorbidities in ETS by PHE Centre, England, 2015^
* Includes all cases notified on or after 13/05/2015 and excludes all London cases as these data fields are not available in LTBR ** Ordered by decreasing total number of cases in 2015 # Data are reported and has a known value $ Data are reported but may be reported as unknown ^ Includes all cases notified on or after 02/07/2015 and excludes all London cases as these data fields are not available in LTBR
Known# Reported$ Known Reported
West Midlands 70 90 68 89
South East 70 80 59 78
North West 62 83 56 82
Yorkshire and the Humber 59 86 41 83
East of England 57 74 51 71
East Midlands 72 86 52 83
South West 52 79 37 78
North East 82 91 78 91
England 65 83 55 82
PHE Centre**
Risk factor
Travel history
outside UK
Visitors from
outside UK
Known# Reported$ Known Reported Known Reported Known Reported Known Reported Known Reported Known Reported
West Midlands 77 98 67 97 67 98 76 98 76 98 75 98 73 98
South East 87 92 73 90 72 89 84 90 86 90 84 91 80 91
North West 90 98 67 97 66 97 83 96 86 97 85 96 82 97
Yorkshire and the Humber 72 94 60 94 60 93 69 94 71 92 71 93 67 94
East of England 78 83 74 83 72 81 76 82 76 82 75 83 76 84
East Midlands 90 96 72 94 70 93 84 93 88 94 84 95 84 96
South West 84 95 74 94 73 93 78 93 78 91 78 94 61 94
North East 99 99 90 99 90 99 93 97 99 99 96 99 88 97
England 83 94 70 93 69 93 79 93 81 93 80 93 76 94
Chronic renal
diseaseImmunosuppression Smoker
PHE Centre**
Co-morbidities
Diabetes Hepatitis B Hepatitis C Chronic liver disease
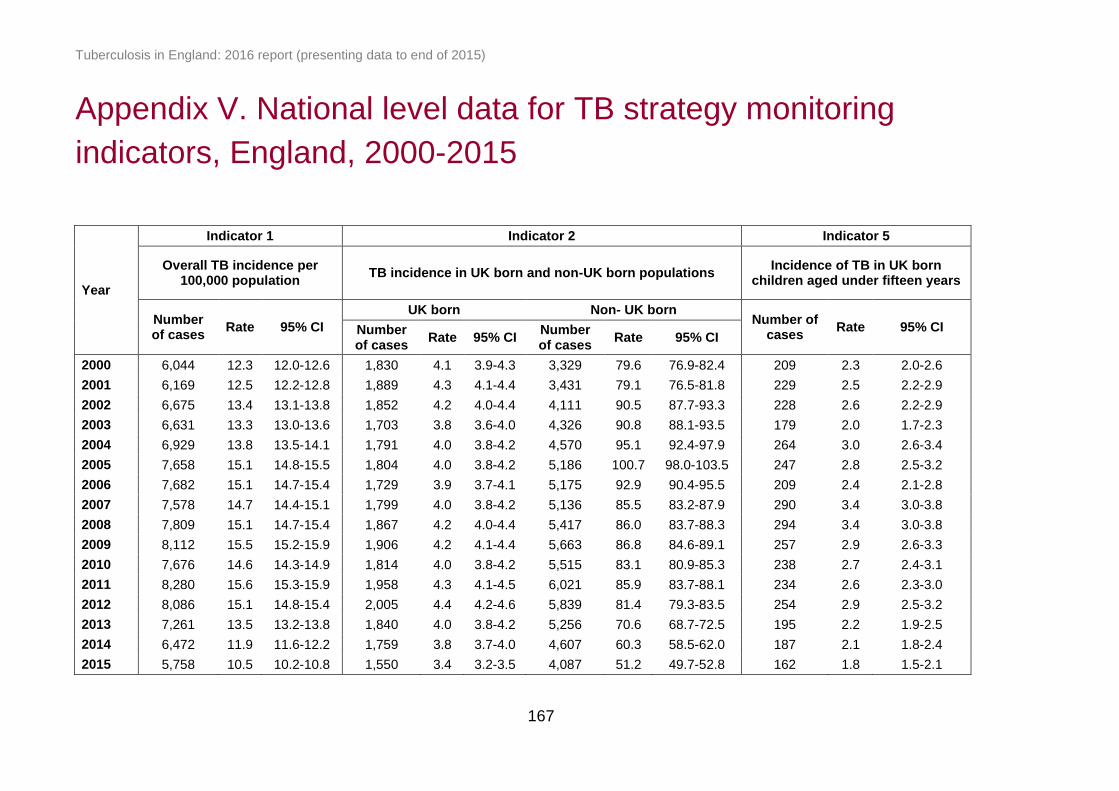
Tuberculosis in England: 2016 report (presenting data to end of 2015)
167
Appendix V. National level data for TB strategy monitoring
indicators, England, 2000-2015
Year
Indicator 1 Indicator 2 Indicator 5
Overall TB incidence per 100,000 population
TB incidence in UK born and non-UK born populations Incidence of TB in UK born
children aged under fifteen years
Number of cases
Rate 95% CI
UK born Non- UK born Number of
cases Rate 95% CI Number
of cases Rate 95% CI
Number of cases
Rate 95% CI
2000 6,044 12.3 12.0-12.6 1,830 4.1 3.9-4.3 3,329 79.6 76.9-82.4 209 2.3 2.0-2.6
2001 6,169 12.5 12.2-12.8 1,889 4.3 4.1-4.4 3,431 79.1 76.5-81.8 229 2.5 2.2-2.9
2002 6,675 13.4 13.1-13.8 1,852 4.2 4.0-4.4 4,111 90.5 87.7-93.3 228 2.6 2.2-2.9
2003 6,631 13.3 13.0-13.6 1,703 3.8 3.6-4.0 4,326 90.8 88.1-93.5 179 2.0 1.7-2.3
2004 6,929 13.8 13.5-14.1 1,791 4.0 3.8-4.2 4,570 95.1 92.4-97.9 264 3.0 2.6-3.4
2005 7,658 15.1 14.8-15.5 1,804 4.0 3.8-4.2 5,186 100.7 98.0-103.5 247 2.8 2.5-3.2
2006 7,682 15.1 14.7-15.4 1,729 3.9 3.7-4.1 5,175 92.9 90.4-95.5 209 2.4 2.1-2.8
2007 7,578 14.7 14.4-15.1 1,799 4.0 3.8-4.2 5,136 85.5 83.2-87.9 290 3.4 3.0-3.8
2008 7,809 15.1 14.7-15.4 1,867 4.2 4.0-4.4 5,417 86.0 83.7-88.3 294 3.4 3.0-3.8
2009 8,112 15.5 15.2-15.9 1,906 4.2 4.1-4.4 5,663 86.8 84.6-89.1 257 2.9 2.6-3.3
2010 7,676 14.6 14.3-14.9 1,814 4.0 3.8-4.2 5,515 83.1 80.9-85.3 238 2.7 2.4-3.1
2011 8,280 15.6 15.3-15.9 1,958 4.3 4.1-4.5 6,021 85.9 83.7-88.1 234 2.6 2.3-3.0
2012 8,086 15.1 14.8-15.4 2,005 4.4 4.2-4.6 5,839 81.4 79.3-83.5 254 2.9 2.5-3.2
2013 7,261 13.5 13.2-13.8 1,840 4.0 3.8-4.2 5,256 70.6 68.7-72.5 195 2.2 1.9-2.5
2014 6,472 11.9 11.6-12.2 1,759 3.8 3.7-4.0 4,607 60.3 58.5-62.0 187 2.1 1.8-2.4
2015 5,758 10.5 10.2-10.8 1,550 3.4 3.2-3.5 4,087 51.2 49.7-52.8 162 1.8 1.5-2.1

Tuberculosis in England: 2016 report (presenting data to end of 2015)
168
Year
Indicator 6 Indicator 7 Indicator 8 Indicator 9
Number and proportion of pulmonary TB cases starting
treatment within two months of symptom onset
Number and proportion of pulmonary TB cases starting
treatment within four months of symptom onset
Number and proportion of pulmonary TB cases that were
culture confirmed
Number and proportion of microbiologically confirmed cases
with drug susceptibility testing reported for the four first line
agents
Number of cases
Proportion 95% CI Number of cases
Proportion 95% CI Number of cases
Proportion 95% CI Number of cases
Proportion 95% CI
2000 - - - - - - 1,864 52.2 50.5-53.8 2,780 99.3 98.9-99.6
2001 - - - - - - 2,040 56.5 54.9-58.1 3,126 99.2 98.8-99.4
2002 - - - - - - 2,622 64.9 63.4-66.4 3,793 98.6 98.2-98.9
2003 - - - - - - 2,586 66.1 64.6-67.5 3,800 99.2 98.9-99.4
2004 - - - - - - 2,740 68.4 66.9-69.8 4,020 98.6 98.2-98.9
2005 - - - - - - 2,989 69.1 67.7-70.5 4,532 98.9 98.6-99.2
2006 - - - - - - 2,980 69.4 68.0-70.7 4,607 98.7 98.3-99.0
2007 - - - - - - 2,850 68.7 67.3-70.1 4,366 98.2 97.7-98.5
2008 - - - - - - 2,904 67.8 66.3-69.1 4,429 97.6 97.1-98.0
2009 - - - - - - 3,008 68.1 66.7-69.5 4,521 96.8 96.3-97.3
2010 - - - - - - 2,867 70.4 69.0-71.8 4,517 98.0 97.6-98.4
2011 1,318 45.0 43.2-46.8 2,173 74.2 72.6-75.8 3,075 71.7 70.3-73.0 4,895 97.3 96.8-97.7
2012 1,368 44.0 42.3-45.8 2,291 73.8 72.2-75.3 2,949 70.4 69.0-71.7 4,787 97.8 97.3-98.1
2013 1,224 41.2 39.5-43.0 2,122 71.5 69.8-73.1 2,712 72.9 71.5-74.3 4,287 97.6 97.1-98.0
2014 1,158 39.5 37.7-41.2 2,046 69.7 68.0-71.4 2,489 73.2 71.6-74.6 3,832 97.7 97.1-98.1
2015 1,186 42.8 41.0-44.7 2,002 72.2 70.6-73.9 2,228 72.7 71.1-74.2 3,385 97.8 97.3-98.3

Tuberculosis in England: 2016 report (presenting data to end of 2015)
169
Year
Indicator 10 Indicator 11 Indicator 12
Number and proportion of drug sensitive TB cases who had completed a full course of
treatment by 12 months
Number and proportion of drug sensitive TB cases who were lost to follow-up at last
reported outcome
Number and proportion of drug sensitive TB cases who had
died at last reported outcome
Number of
cases Proportion 95% CI
Number of
cases Proportion 95% CI
Number of
cases
Proportion 95% CI
2000 - - - - - - - - -
2001 3,631 63.7 62.4-64.9 237 3.9 3.4-4.4 377 6.1 5.6-6.8
2002 4,111 67.4 66.2-68.5 296 4.5 4.0-5.0 438 6.6 6.0-7.2
2003 4,191 69.6 68.4-70.7 290 4.4 3.9-4.9 407 6.2 5.6-6.8
2004 4,426 70.1 69.0-71.2 333 4.9 4.4-5.4 402 5.9 5.3-6.4
2005 4,875 70.3 69.2-71.4 380 5.0 4.5-5.5 447 5.9 5.4-6.4
2006 5,214 75.5 74.5-76.5 413 5.4 4.9-6.0 430 5.7 5.2-6.2
2007 5,286 78.1 77.1-79.1 345 4.6 4.1-5.1 432 5.8 5.3-6.3
2008 5,585 80.0 79.1-80.9 368 4.8 4.3-5.3 437 5.7 5.2-6.2
2009 5,912 81.9 81.0-82.7 354 4.4 4.0-4.9 420 5.2 4.8-5.7
2010 5,632 82.6 81.7-83.5 342 4.5 4.1-5.0 383 5.0 4.6-5.6
2011 6,004 81.9 81.0-82.7 425 5.2 4.7-5.7 384 4.7 4.3-5.2
2012 6,001 83.5 82.6-84.3 362 4.5 4.1-5.0 391 4.9 4.4-5.4
2013 5,487 85.4 84.5-86.3 295 4.1 3.7-4.6 336 4.7 4.2-5.2
2014 4,827 84.4 83.5-85.4 266 4.2 3.7-4.7 351 5.5 4.9-6.1
2015 - - - - - - ` - -

Tuberculosis in England: 2016 report (presenting data to end of 2015)
170
Year
Indicator 13 Indicator 14 Indicator 15
Number and proportion of TB cases with rifampicin resistance or MDR-TB who had completed
treatment at 24 months
Number and proportion of TB cases with rifampicin resistance or MDR-TB who were lost to follow-up at
last reported outcome
Number and proportion of TB cases with rifampicin resistance or MDR-TB who had died at last
reported outcome
Number of cases
Proportion 95% CI Number of cases
Proportion 95% CI Number of cases
Proportion 95% CI
2000 - - - - - - - - -
2001 - - - - - - - - -
2002 - - - - - - - - -
2003 - - - - - - - - -
2004 37 52.1 40.7-63.3 9 12.7 6.8-22.4 4 5.6 2.2-13.6
2005 39 62.9 50.5-73.8 9 14.5 7.8-25.3 4 6.5 2.5-15.4
2006 41 51.3 40.5-61.9 8 10.0 5.2-18.5 3 3.8 1.3-10.5
2007 30 42.3 31.5-53.8 6 8.5 3.9-17.2 10 14.1 7.8-24.0
2008 45 57.7 46.6-68.0 10 12.8 7.1-22.0 7 9.0 4.4-17.4
2009 40 52.6 41.6-63.5 11 14.5 8.3-24.1 4 5.3 2.1-12.8
2010 38 48.1 37.4-58.9 9 11.4 6.1-20.3 1 1.3 0.2-6.8
2011 48 50.5 40.6-60.4 18 18.9 12.3-28.0 6 6.3 2.9-13.1
2012 56 60.2 50.1-69.6 11 11.8 6.7-19.9 4 4.3 1.7-10.5
2013 48 57.8 47.1-67.9 11 13.3 7.6-22.2 4 4.8 1.9-11.7
2014 - - - - - - - - -
2015 - - - - - - - - -

Tuberculosis in England: 2016 report (presenting data to end of 2015)
171
Year
Indicator 16 Indicator 17 Indicator 18 Indicator 19
Number and proportion of TB cases offered an HIV test
Number and proportion of drug sensitive TB cases with at least
one social risk factor who completed treatment within 12
months
Number and proportion of culture confirmed TB cases
with any first line drug resistance
Number and proportion of culture confirmed TB cases with
multi-drug resistance TB
Number of cases
Proportion 95% CI Number of cases
Proportion 95% CI Number of cases
Proportion 95% CI Number of cases
Proportion 95% CI
2000 - - - - - - 193 6.9 6.0-7.9 28 1.0 0.7-1.4
2001 - - - - - - 224 7.1 6.3-8.1 22 0.7 0.5-1.1
2002 - - - - - - 297 7.8 7.0-8.7 35 0.9 0.7-1.3
2003 - - - - - - 309 8.1 7.3-9.0 49 1.3 1.0-1.7
2004 - - - - - - 326 8.1 7.3-9.0 45 1.1 0.8-1.5
2005 - - - - - - 346 7.6 6.9-8.4 41 0.9 0.7-1.2
2006 - - - - - - 370 8.0 7.2-8.8 54 1.2 0.9-1.5
2007 - - - - - - 332 7.5 6.8-8.4 49 1.1 0.8-1.5
2008 - - - - - - 306 6.8 6.1-7.6 50 1.1 0.8-1.5
2009 - - - - - - 371 8.1 7.3-8.9 59 1.3 1.0-1.7
2010 - - 372 73.4 69.4-77.0 322 7.1 6.4-7.8 65 1.4 1.1-1.8
2011 - - 370 71.3 67.3-75.0 412 8.3 7.6-9.1 81 1.6 1.3-2.0
2012 5,209 66.5 65.4-67.5 393 74.6 70.7-78.1 358 7.4 6.7-8.1 77 1.6 1.3-2.0
2013 5,791 82.8 81.9-83.7 405 77.1 73.4-80.5 332 7.7 6.9-8.5 69 1.6 1.3-2.0
2014 5,404 86.9 86.0-87.7 359 74.5 70.4-78.2 286 7.3 6.6-8.2 52 1.3 1.0-1.7
2015 4,829 87.9 87.0-88.7 - - - 255 7.4 6.6-8.3 46 1.3 1.0-1.8

Tuberculosis in England: 2016 report (presenting data to end of 2015)
172
Glossary
Acquired resistance
Acquired resistance is classed as resistance identified on repeat culture after three
months of the first specimen date. Cases with a change from a sensitive to resistant
result following treatment start are reclassified as acquired resistance, even if this is
within the three-month period.
BCG
Bacillus Calmette-Guérin vaccination
Cluster
Clusters in this document refer to molecular clusters only. These are defined as two
or more patients who are infected with a strain of Mycobacterium tuberculosis
complex with indistinguishable MIRU-VNTR profiles. Each cluster must have at
least one person with a full 24 MIRU-VNTR profile, and other members of the
cluster may have a maximum of one missing loci.
Drug resistant cohort
The drug resistant cohort includes any cases with rifampicin resistant TB (initial or
acquired), including MDR-TB (initial or acquired), as well as those without culture
confirmation treated with an MDR-TB regimen.
Drug sensitive cohort
The drug sensitive cohort excludes all TB cases with rifampicin resistant TB (initial
or acquired) including MDR-TB (initial or acquired), and non-culture confirmed
cases treated with an MDR-TB regimen.
Extensively-drug resistant TB (XDR-TB)
XDR-TB is defined as resistance to isoniazid and rifampicin (MDR-TB), at least one
injectable agent (capreomycin, kanamycin or amikacin) and at least one
fluoroquinolone (moxifloxacin, ofloxacin, ciprofloxacin).
First-line drug resistance
First-line drug resistance is defined as resistance to at least one of the first line
drugs (isoniazid, rifampicin, ethambutol, pyrazinamide).
Initial resistance
Initial resistance is class as resistance identified within three months of the first
specimen date.

Tuberculosis in England: 2016 report (presenting data to end of 2015)
173
Multi-drug resistant TB (MDR-TB)
MDR-TB is defined as resistance to at least isoniazid and rifampicin, with or without
resistance to other drugs.
Multi-drug resistant/ Rifampicin resistant TB (MDR/RR-TB)
MDR/RR-TB is defined as resistance to rifampicin including MDR-TB cases.
Post-mortem diagnosis
A case diagnosed at post-mortem is defined as a case where TB was not suspected
before death, but a TB diagnosis was made at post-mortem, with pathological
and/or microbiological findings consistent with active TB that would have warranted
anti-TB treatment if discovered before death.
Pulmonary tuberculosis
A pulmonary case is defined as a case with TB involving the lungs and/or tracheo-
bronchial tree, with or without extra-pulmonary TB diagnosis. In this report, in line
with the WHO’s recommendation and international reporting definitions, miliary TB
is classified as pulmonary TB due to the presence of lesions in the lungs.