Embed Size (px)
Citation preview

1
Economic Impact Assessment of Bovine Tuberculosis in the South West of England Allan Butler, Matt Lobley and Michael Winter CRPR Research Paper No 30.

Economic Impact Assessment of Bovine
Tuberculosis in the South West of England
Final Report
Allan Butler, Matt Lobley and Michael Winter
September 2010
This report can be downloaded from the CRPR website:
www.centres.ex.ac.uk/crpr/publications/
For further information, please contact Dr Matt Lobley, Centre for Rural Policy Research, Department of Politics, University of Exeter, Rennes Drive, Exeter, EX4 4RJ.
Tel: 01392 264539. E‐Mail: [email protected]

CRPR Research Report No. 30
ISBN 978-1-905892-11-2
£15
The views expressed in this report are those of the authors and are not necessarily shared by other members of the University, the University as a whole, the NFU, Devon County Council, or by the SW Sustainable Farming
and Food Board.
Copyright © 2010, Centre For Rural Policy Research, University of Exeter

Acknowledgements
We are very grateful to the NFU, Devon County Council, and SW Sustainable Farming and Food Board for funding the research upon which report is based. We are also particularly grateful to the farmers and others who freely gave of
their time to take part in the research.

Table of contents
SUMMARY....................................................................................................................I
1. INTRODUCTION......................................................................................................1
2. BOVINE TUBERCULOSIS IN THE SOUTH WEST OF ENGLAND ........................1
3. METHODOLOGY.....................................................................................................4
3.1 Quantifying the cost of a farmer’s labour ...........................................................5
4. RESULTS OF CASE STUDY FARMS .....................................................................6
Farm TB2 (heifer rearing/dairy) ................................................................................9 Farm TB3 (pedigree beef) ......................................................................................10 Farm TB4 (upland beef) .........................................................................................13 Farm TB5 (pedigree dairy) .....................................................................................15 Farm TB6 (commercial dairy).................................................................................17 Farm TB7 (commercial dairy and beef)..................................................................19 Farm TB8 (organic dairy/cheese producer) ...........................................................21
5. IN-DEPTH ANALYSES OF COSTS ASSOCIATED WITH BTB BREAKDOWNS ON CASE STUDY FARMS ........................................................................................23
5.1 Cost of bTB testing...........................................................................................23 5.2 Cost of movement restrictions..........................................................................27 5.3 Replacement costs...........................................................................................30 5.4 Administration costs of bTB on farms ..............................................................33 5.5 Cost of biosecurity measures...........................................................................35 5.6 Long term costs of bTB on business decisions................................................36
6. COMPENSATION PAYMENTS, INSURANCE CLAIMS AND THE TOTAL COST OF BTB ......................................................................................................................39
6.1 Compensation payments .................................................................................39 6.2 Insurance claims ..............................................................................................43 6.3 Estimating the total cost of bTB to farms .........................................................44
7. THE SOCIAL IMPACTS OF BTB ON FARMING FAMILIES AND THEIR COMMUNITIES..........................................................................................................47
8. WIDER ECONOMIC IMPACTS OF TB ON THE RURAL ECONOMY...................50
8.1. An auctioneer’s perspective ............................................................................50 8.2. A vet’s perspective ..........................................................................................51 8.3. An insurer’s perspective..................................................................................51 8.4. An advisor’s perspective .................................................................................52 8.5. A summary of the impact of bTB on wider economy.......................................53
9. SUMMARY AND CONCLUSIONS.........................................................................53
9.1 The economic cost of bTB at the farm level .....................................................53 9.2 The total economic cost of bTB on case study farms.......................................55 9.3 Personal and social costs ................................................................................55 9.4 The impact of bTB on wider economy..............................................................55 9.5 Conclusion .......................................................................................................56

i
Economic Impact Assessment of Bovine Tuberculosis in the South West of England
Summary
1. Introduction
Bovine TB (bTB) presents a significant challenge to beef and dairy farmers. In 2009 7,449 herds were subject to movement restrictions in Great Britain because of bTB. Of these, 52% were in South West England and 20% were in Devon alone. With over 25% of holdings with cattle in the South West likely to suffer a bTB breakdown within the course of a year, understanding the cost implications on farm businesses is vital in order to demonstrate the impact that this disease is having on agricultural communities and the agricultural economy.
This report describes the burden of these costs based on case study interviews with South West farmers and telephone interviews with key individuals in the agricultural industry in the region.
The overall aims of this research were:
1. To illustrate through detailed farm case studies the economic impact of Bovine Tuberculosis (bTB) on agricultural businesses in the South West.
2. To consider the economic impact of Bovine Tuberculosis to the wider rural industry and community – such as vets, livestock markets and others.
The specific objectives of the research were:
To examine the economic impact on agricultural businesses in terms of identifying
o (i) costs associated with bTB testing and
o (ii) production costs associated with the breakdown itself, including the role that compensation and insurance payments have in mitigating these.
To consider the economic impact of bTB on the wider community and industry.
A case study methodology was employed to enable an in-depth examination of the economic impact of bTB on dairy and beef farms. In late March and early April 2010, eight in-depth interviews were conducted with farmers that had recently endured or were still enduring a bTB breakdown and these form the basis of the case study analysis. The case study farms were selected to represent a range of different

ii
farming attributes (see main report). In addition, the extent of the breakdowns between the case studies illustrates how some farms spend many years under bTB restrictions, while for others the breakdown lasted less than a year.
The case study approach provides detailed evidence of the economic impact of bTB on SW farms. The analysis however, does have its limitations. Given the restricted number of observations, it is not possible to make statements or predictions about the role of bTB in the whole of the SW farming economy. This study has been informed by the earlier study of the economic impact of bTB by Sheppard and Turner. However, differences in methodological approach between the two studies and changes in the compensation system mean that it is not possible to make comparisons between the two sets of results.
2. The total cost of bTB on case study farms
The monthly loss of a bTB breakdown varies considerably from just under £505 to nearly £3,184. Clearly, there are many factors that account for the range of losses including the type of farm, the scale of operation, restocking policy, area farmed, number of holdings away from the farmstead, the marketing of livestock and livestock produce and by how much this is restricted. In general, but not exclusively, dairy farms tend to accrue the greatest losses during a bTB breakdown.
It is important to recognise that the costs of bTB ripple out across the businesses impacting on labour, feed and bedding costs, creating animal welfare issues and causing unintended contraventions of regulations such as organic certification requirements and cross-compliance. Furthermore, bTB also has implications for the well-being of farmers and their families as well as for the wider economy and community.
3. The cost of bTB testing
The approximate cost of administering and reading the intradermal tuberculin (skin) test per animal over each test and the breakdown period varied considerably. For example, the lowest was £1.36 and the highest was £6.10, although most were between £1.95 and £2.97 per animal. There were no discernible differences between beef and dairy farms. However, there are also a range of indirect and often hidden costs associated with testing such as the knock-on impacts on other activities (e.g. delays to silage making), impacts on milk production (although not all farmers experience this), behavioural difficulties in cattle and additional fuel and (human) feed costs.
4. The cost of movement restrictions
The costs of keeping additional stock accrue in costs for extra bedding, feed and labour to keep stock on the farm. The inability to move stock off-farm (or around a farm for those businesses composed of more than one holding) creates a

iii
significantly increased workload and may also be associated with problems of over-stocking and unintentional breaches of organic certification and cross-compliance regulations.
The costs of movement restrictions reflect the individual characteristics of particular farm businesses, the spatial configuration of the land holdings, the specific features of the farm enterprises, etc, suggesting that average figures can mask much of the complexity of cost assessment. The estimated costs of movement restrictions ranged from £3,198 to over £55,000 per farm.
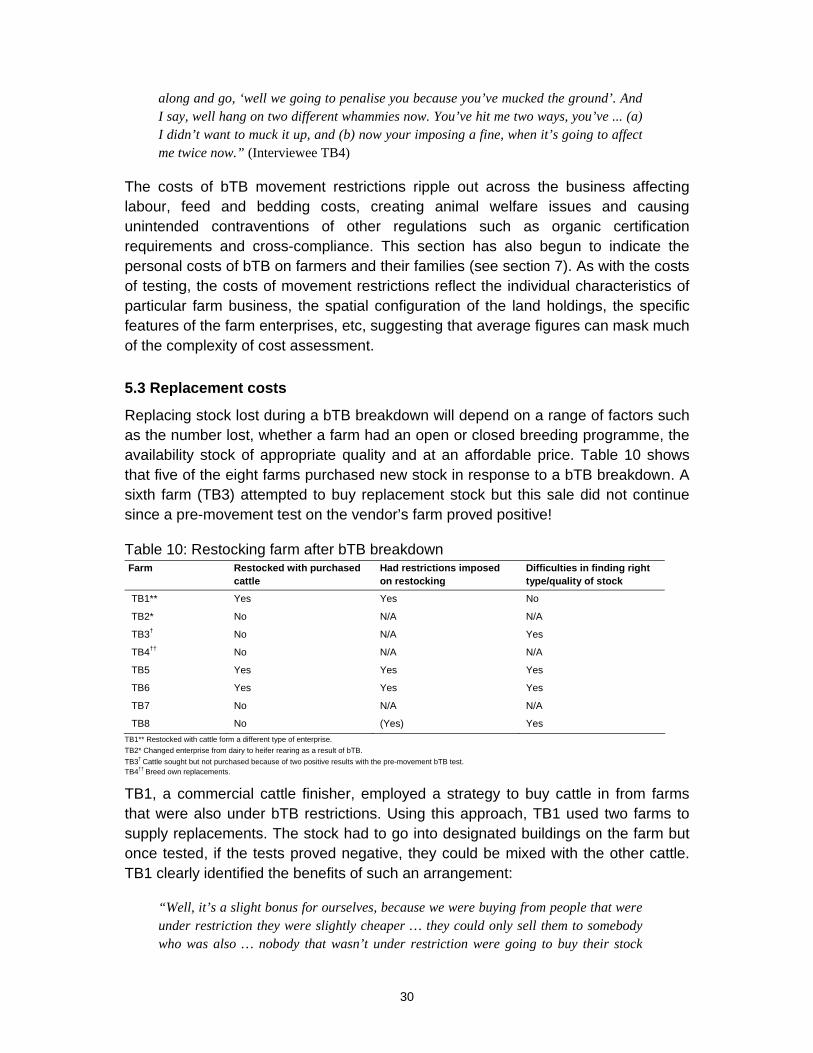
5. The cost of replacement livestock
The costs associated with replacing stock vary considerably, and the practicalities of replacing stock can have wider impacts on herd management and the farm business. In addition to the direct cost of the livestock itself, the costs of sourcing replacement stock include labour time taken to source cattle, the cost of travelling to see stock, and the costs of haulage once the cattle are purchased. These additional costs varied from just £43 for one farm to £985 for another.
The ability to replace livestock may in part depend on the amount of compensation received. Due to the variability of compensation payments and the mismatch between compensation payments and market values (see below), not all farms can afford to replace all cattle slaughtered. For instance, one farm only received sufficient compensation to replace just over 50% of their dairy cattle that had been slaughtered. In turn, this was associated with a significant loss of revenue from reduced milk sales. Not all farmers buy-in replacements. Some have chosen to maintain a closed herd and breed their own replacements. Again, this can be associated with a significant loss of milk revenue.
6. Compensation and insurance payments
The present bTB compensation scheme (introduced in February 2006) is derived from sale data obtained from store markets, prime markets, rearing calf sales, breeding sales and dispersal sales in Great Britain, rather than individual animal valuations. As such, farmers that breed and manage high value stock (whether these are pedigree or not) are likely to be under compensated, whereas farmers with cattle perceived in the market place to be of lower than average quality (as expressed in terms of price) are likely to be over compensated.
Evidence from the case study farms suggests that the chart-based compensation system fails to reflect the perceived value of stock. One farmer described it as ‘inadequate’ and ‘farcical’ given the time spent in breeding specific bloodlines to improve the quality of animals and their production performance. Consequently, for producers of high value pedigree, commercial or organic stock, a low rate of compensation can lead to difficulty in finding the same calibre replacement stock.

iv
In terms of insurance, claims per cow ranged from £150 to £300. The excess limit on the number of cattle that can be claimed for varied from having no exemption to an exemption on the first six animals of any claim.
7. The longer term costs of bTB
There are numerous longer-term costs of bTB that impact upon farm businesses. Some were directly related to dealing with the demands of the disease, such as additional paperwork or financing biosecurity measures, while others are structural, including the extension of overdrafts or the postponement of capital investment. However, the longer term effects of farming under bTB restrictions are difficult to quantify accurately since business decisions are undertaken for a variety of reasons. While the disease may have a considerable influence, it is unlikely to be the only factor in the equation. Nevertheless, this report demonstrates that bTB frequently influences decision-making and in some instances acts as a ‘tipping point’ which precipitates change in the business.
8. Personal and social costs
Although the focus of this study was on economic impacts, it has illustrated the stress and upset that bTB can bring to the farming industry through illuminating how the disease can change, significantly, the way a farm operates, as well as the additional workload that movement restrictions bring. There is the feeling of helplessness in the management of the disease, with farmers feeling like ‘bystanders’, which is deeply upsetting for many farmers and their families, for whom breeding cattle is more than just a business.
9. The impact of bTB on wider economy
The perspectives offered by interviewees from businesses associated with agriculture that have experience of bTB suggest that the disease has had costs but has also offered opportunities. However, where opportunities have arisen, these are often identified as being in conflict with the wider aspirations of business development. For example, while the vets may benefit from increased trade, they recognise that this is at the cost of developing better animal health programmes alongside farmers.
In addition, responses from businesses in the wider economy support farmers’ comments regarding difficulties in sourcing good quality livestock in the South West, the inadequacies of the compensation system and the consequences of the disease on farm animal health programmes.
10. Conclusions
Leaving aside the heated debate about appropriate means for controlling the incidence and geographical spread of bTB, this report has shown that current

v
compensation payments tend not to fully compensate farmers for their direct and indirect economic losses. The research undertaken for this report has revealed considerable variation across a range of different types of costs associated with bTB. Consequently average figures, either for costs or calculating compensation, obscure much of the detail at an individual farm level. The research also points to a range of ‘hidden’ and longer term costs that fall beyond the scope of the compensation scheme. Finally, in addition to economic losses, bTB is imposing considerable costs on the personal well-being of many farm households and also raises profound livestock welfare issues.

1
Economic Impact Assessment of Bovine Tuberculosis in the South West of England
1. Introduction
In Great Britain between 1996 and the beginning of 2010, the number of herds under movement restrictions because of a bovine TB (bTB) breakdown increased from 649 to a seasonal peak of 4,590 in April 2009 (see Figure 1). Over this period, there has been a fivefold increase in herds under movement restrictions, thus increasing the burden of costs on farmers’ and the government. It is estimated that between 1999/00 and 2008/09 the costs of bTB to the British Government was £458 million (Defra 2010a).1
This report describes the burden of these costs based on case study interviews with South West farmers and telephone interviews with key individuals in the agricultural industry in the region.
The overall aims of this research were:
To illustrate through detailed farm case studies the economic impact of Bovine Tuberculosis (bTB) on agricultural businesses in the South West (Cornwall, Devon, Somerset, Dorset, Wiltshire and Gloucestershire).
To consider the economic impact of Bovine Tuberculosis to the wider rural industry and community – such as vets, livestock markets and others.
In order to achieve these aims, the specific objectives of the research were to examine the economic impact on agricultural businesses in terms of identifying (i) costs associated with bTB testing and (ii) production costs associated with the breakdown itself, including the role that compensation and insurance payments have in mitigating these. A further objective was to consider the economic impact of bTB on the wider community and industry.
2. Bovine Tuberculosis in the South West of England
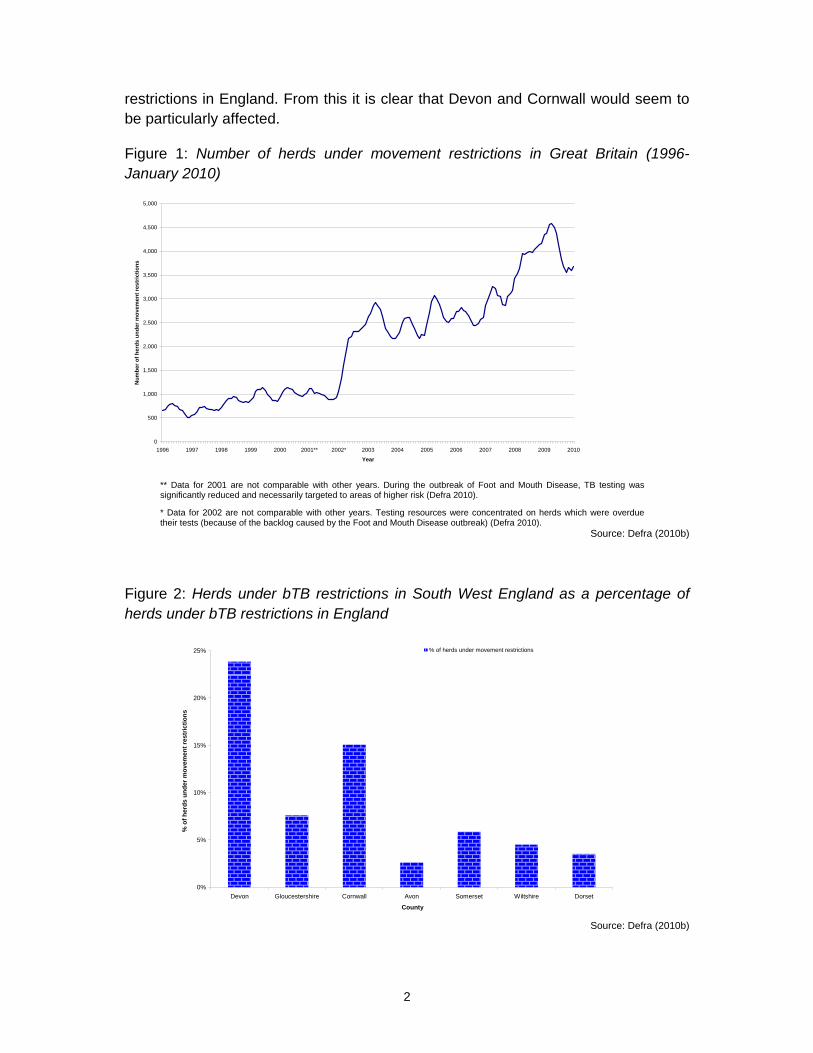
In 2009, there were 7,449 herds subject to movement restrictions in Great Britain because of bTB. Of these, 52% occurred in South West England and 20% were in Devon alone. Figure 2 illustrates the number of herds under movement restrictions in each county of South West England as a percentage of all herds under movement
1 It is not clear from the data whether this figure is £458 million or £603 million because the data in the columns for the years 2005/06 to 2008/09 does not equate to the values in the total row. A query has been sent to Defra to clarify the situation.
2
restrictions in England. From this it is clear that Devon and Cornwall would seem to be particularly affected.
Figure 1: Number of herds under movement restrictions in Great Britain (1996-January 2010)
0
500
1,000
1,500
2,000
2,500
3,000
3,500
4,000
4,500
5,000
1996 1997 1998 1999 2000 2001** 2002* 2003 2004 2005 2006 2007 2008 2009 2010
Year
Nu
mb
er o
f h
erd
s u
nd
er m
ove
me
nt
res
tric
tio
ns
** Data for 2001 are not comparable with other years. During the outbreak of Foot and Mouth Disease, TB testing was significantly reduced and necessarily targeted to areas of higher risk (Defra 2010).
* Data for 2002 are not comparable with other years. Testing resources were concentrated on herds which were overdue their tests (because of the backlog caused by the Foot and Mouth Disease outbreak) (Defra 2010).
Source: Defra (2010b)
Figure 2: Herds under bTB restrictions in South West England as a percentage of herds under bTB restrictions in England
0%
5%
10%
15%
20%
25%
Devon Gloucestershire Cornwall Avon Somerset Wiltshire Dorset
County
% o
f h
erd
s u
nd
er m
ov
emen
t re
str
icti
on
s
% of herds under movement restrictions
Source: Defra (2010b)
3
The data released by Defra gives the absolute number of farms and cattle affected by bTB. However, only considering absolute values (such as those presented by Figure 2) may mask the relative intensity of the disease in certain counties. Location Quotient (LQ) methodology provides an indication of the relative, rather than the absolute, spatial concentration of a phenomenon in a particular area by controlling for the varying size of counties and unitary authorities (CUA). LQ methodology has been used to explore the relative spatial concentration of organic farms (Ilbery and Maye 2010a) and it has also been used to explore agricultural tenancy patterns and the distribution of wheat and potatoes (Ilbery et al 2010; Ilbery and Maye 2010b).The calculation of the LQ is adapted from a method used by Ilbery et al. (1999):
Number of farms with movement restrictions in CUA ‘x’ ÷ Number of farms with movement restrictions in England
LQ ratio = Number of farms in CUA ‘x’ ÷ Number of farms in England
A LQ ratio of 1.0 signifies that an area has neither more nor less of its share of farms under bTB restrictions than its overall number of farms would suggest. Counties with an LQ ratio over 1.0 therefore have a greater relative spatial concentration (i.e. the incidence of farms with bTB restrictions is greater than that which might be expected). However, one weakness of the LQ ratio is its sensitivity to small numbers which can result in some of the smaller geographical units (metropolitan counties and unitary authorities) having to be treated with caution (Ilbery and Maye 2010a). Therefore, to ensure representativeness smaller urban authorities have been amalgamated with larger neighbouring counties.
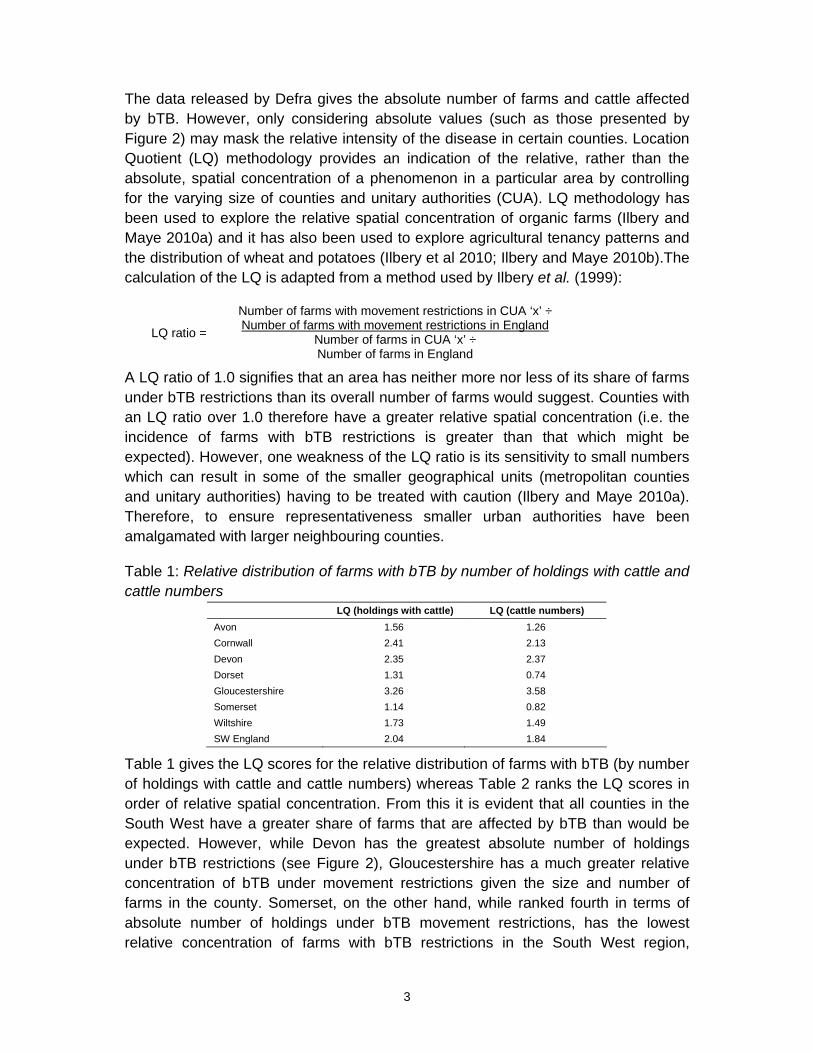
Table 1: Relative distribution of farms with bTB by number of holdings with cattle and cattle numbers
LQ (holdings with cattle) LQ (cattle numbers)
Avon 1.56 1.26
Cornwall 2.41 2.13
Devon 2.35 2.37
Dorset 1.31 0.74
Gloucestershire 3.26 3.58
Somerset 1.14 0.82
Wiltshire 1.73 1.49
SW England 2.04 1.84
Table 1 gives the LQ scores for the relative distribution of farms with bTB (by number of holdings with cattle and cattle numbers) whereas Table 2 ranks the LQ scores in order of relative spatial concentration. From this it is evident that all counties in the South West have a greater share of farms that are affected by bTB than would be expected. However, while Devon has the greatest absolute number of holdings under bTB restrictions (see Figure 2), Gloucestershire has a much greater relative concentration of bTB under movement restrictions given the size and number of farms in the county. Somerset, on the other hand, while ranked fourth in terms of absolute number of holdings under bTB movement restrictions, has the lowest relative concentration of farms with bTB restrictions in the South West region,

4
although this is still a greater relative spatial concentration than may be expected. In terms of cattle slaughtered, Gloucestershire has the most slaughtered cattle relative to the number of cattle in the county, followed by Devon. Interestingly, Somerset and Dorset have a lower relative spatial concentration than might be expected. One explanation for this is that on holdings in these counties relatively fewer cows per herd are identified as reactors.
Table 2: Ranking of LQ scores for farms with bTB by number of holdings with cattle (absolute ranking in brackets) and cattle slaughtered
LQ (holdings with cattle) LQ (cattle slaughtered)
Gloucestershire 1 (3) 1
Cornwall 2 (2) 3
Devon 3 (1) 2
Wiltshire 4 (5) 4
Avon 5 (7) 5
Dorset 6 (6) 7
Somerset 7 (4) 6
It is against this backdrop that this study of the costs of bTB is set. With over one-quarter of holdings with cattle in the South West likely to suffer a bTB breakdown within the course of a year, understanding the cost implications on farm businesses demonstrates the impact that this disease is having on agricultural communities and the agricultural economy.
3. Methodology
In order to meet the objectives of this study, a case study methodology has been employed that enables an in-depth examination of the economic impact of bTB on dairy and beef farms. By focusing on individual examples, in-depth analysis provides a better understanding of the system as a whole (Gerring 2007). This approach is particularly suitable when examining the many difficulties and challenges to farming families and their businesses associated with bTB. The detailed case study approach therefore develops a rich mix of quantitative and qualitative evidence regarding the economic impact of TB on the SW farming economy.
A case study analysis however does have its limitations. Given the restricted number of observations, it is not possible to make statements or predictions about the role of bTB in the whole of the SW farming economy. Furthermore, it is not possible to presume that what occurs on one farm will happen on other farms. Indeed, case studies are unique and not transferable. To be able to make inferences about economic data relating to bTB on farms would require a large scale survey of SW farmers which was beyond the resources of this project.
In order to illustrate a range of farm enterprise characteristics in addressing the objective of how bTB influences upon different types of farm businesses, it was necessary to select farms that had more than one business/enterprise attribute. Table 3 illustrates the criteria for choosing farms as case study examples. For

5
example, an organic dairy farm may be owner-occupied, process non-pasteurized milk and have a pedigree beef herd. Alternatively, a conventional dairy farm may be wholly rented, have a calf rearing enterprise and a beef enterprise selling finished beasts. In total, eight case study investigations of farms in the SW region were conducted to capture the many different attributes of dairy and beef farming.
Table 3: Attributes of case studies Dairy Enterprise Beef Enterprise Tenure
Organic Organic Wholly rented
Conventional Conventional Mixed tenure
Pedigree Pedigree Owner Occupier
Calf rearing Lowland
Dairy heifer rearing SDA
Closed herd Stores
Open herd Finished
On farm processing – non-pasteurised
On farm processing - pasteurised
In order to assess the wider economic impact of bTB a small number of key individuals from business connected to farming, such as vets, auctioneers, insurance brokers, were interviewed by telephone to comment on the impact of the disease on the wider rural economy. In total four interviews were conducted which, in the main, support evidence revealed by the case studies.
3.1 Quantifying the cost of a farmer’s labour
Estimating the cost of bTB in terms of a farmer’s labour is not straightforward since many farmers do not take a wage but instead draw income from the business to ensure the running of the farm household. This may be as little as £500 per month, which equates to approximately £2.50 hour assuming that only one person is working on the farm. Farm management handbooks such as Nix’s ‘Farm Management Handbook’ and the ‘Agricultural Budgeting and Costing Book’ supply minimum rates for agricultural workers at different grades. Accordingly, in 2009 Staff at Grade 6 with management responsibilities had an hourly rate of £8.45. However, using such a rate to estimate the labour costs of farmers may underestimate their true cost, as it does not reflect entrepreneurial risk. Furthermore, different types of farms will require different skills. Estimates for the cost of labour on cattle and sheep farms and dairy farms have been made respectively by Callwood (2006) and the RABDF (Royal Association of British Dairy Farmers) (2008). Using data on the type of work carried out and the education competencies of farmers, an average hourly rate of £11.18 was calculated for cattle and sheep farmers and £12.35 per hour for a dairy farmer.2 Adjusting for wage inflation/deflation3 to the end of January 2010,
2 The RABDF reports that the estimated hourly rate for a dairy farm is £16.70. This is calculated by assuming an average week of 37.5 hours and an additional 19.5 hours overtime. This gives an annual equivalent salary of £32.686. However, if the rate of £16.70 is multiplied by the number of hours per week this equates to an equivalent salary of £49.499. To ensure compatibility between the dairy and the beef and cattle farmers’ estimated wage rates, the methodology used the Callwood (2006) study is applied to the RABDF data. This results in a wage rate of £12.35 per hour.
3 Data from the Average Earnings Index (AEI) excluding bonus is used.

6
these rates are respectively £12.17 and £12.67. Therefore, in this report, these figures are used when it is necessary to calculate management costs, thus providing a more appropriate estimate for the two farm types that have or are being affected by bTB.
4. Results of case study farms
In late March and early April, 2010, eight in-depth interviews were conducted with farmers that had recently endured or were still enduring a bTB breakdown and these form the basis of the case study analysis. Table 4 illustrates the business/enterprise attributes of these case studies. It can be seen that most were farms of mixed tenure, with only one that was solely owner-occupied and one that was totally rented.
Half of the farms were dairy farms, with one of these rearing and milking pedigree stock, and another specialising in organic cows, the milk of which was turned into unpasteurised soft and hard cheese. Five farms reared beef animals, two of which reared pedigree stock. Four farmers described their beef herds as commercial beef, two sold store cattle (an upland farm and a dairy farm that reared its stores on common land). Three farms sold finished beef stock including one dairy farm that had recently begun their beef enterprise because of bTB breakdowns. A further farm, as a partial response to bTB, had sold its dairy herd to concentrate on rearing dairy heifers. Six of the case study farms operated a closed herd policy, although two farms had to buy in stock to replace animals slaughtered because of bTB. The only attribute from Table 3 not captured by the eight case study farms related to on-farm processing of pasteurised milk. Nevertheless, the case study examples illustrate a broad cross section of cattle farming in the region.
Table 4: Attributes of case study farms TB Farm TB1 TB2 TB3 TB4 TB5 TB6 TB7 TB8
Owner Occupier
Mixed Tenure
Wholly Rented
Upland
Dairy
Open herd
Closed Herd () ()
Heifer Rearing
Suckler Beef
Stores
Finished Cattle
Commercial
Organic
Pedigree
Processing facility () These farms operate a close herd programme but because of bTB, it has been necessary to buy in new stock.
Taken as a whole, the case study farms show the range of costs associated with bTB breakdowns such as: the cost of testing; costs associated with movement restrictions; administrative costs, additional labour costs; costs of replacing stock and

7
sourcing cattle; costs associated with losses in production; costs from increasing biosecurity measures; as well as other costs. Clearly, each case study farm is different and as such, the costs reflect the personal circumstances, farm structure and a farmer’s ability to respond. The financial costs of bTB to each cease study farm is illustrated using a series of flow diagrams (see below).4
Farm TB1 (commercial beef)
This beef and cereal farm produces finished beef from a suckler herd and from purchased calves. Of the 304 hectares farmed, 182 hectares is rented in. In terms of land use, 36% is used to grow arable crops with the remainder comprising of grassland for the cattle. The beef enterprise is the most important in terms of value of output, with the arable enterprise described as loss making. In terms of bTB, this farm has spent by far the most time under bTB restrictions. Indeed, from January 2002 until February 2010, other than an 11-month bTB free period in 2004, the farm had been constantly subject to movement restrictions.
The long-term nature of bTB restrictions meant that, compared to other farms in this case study analysis, it had adjusted its business model to farm in a manner that minimised the impacts of the disease. However, two particular costs, as illustrated in Figure 3, standout. The first regarded costs associated with testing, while the second related to livestock production losses.
Most farms during a bTB breakdown are required to test cattle every 60 days. However, TB1 negotiated a 90-day testing regime because of the longevity of their breakdown and the large number of cattle (approximately 800) present on the farm. This provision saved the farm £4,742 in additional testing per year. Therefore, without a 90-day testing period the farm’s annual cost of testing would have been £14,227 rather than the £9,485 reported in Figure 3. The cost per animal, over a year was £11.89, which compared with other farms in the case study analysis was relatively low (see Section 5.1 for the comparison). This partly reflected the use family members and staff already employed on the farm. An additional cost identified by this farmer related to reduced live weight gain. TB1 argued that the testing of his animals reduced the weight gained by his animals, which he estimated cost his business £5,040 per annum.
As a commercial cattle finisher, TB1 bought in cattle from two farms that were also under bTB restrictions. This reduced the need to replace stock slaughtered because of bTB. Indeed, it was part of the farmer’s normal business management practice during the period of the bTB breakdown.5 As such, no cost was associated with movement restrictions and only minimal costs were associated with sourcing replacement stock. The stock that TB1 bought in went into designated isolation
4 Data in flowcharts may not add up exactly because of rounding.
5 When the farm is not under bTB restrictions, the farmer sources stock in the same manner but from non bTB farms, from similar distances away.
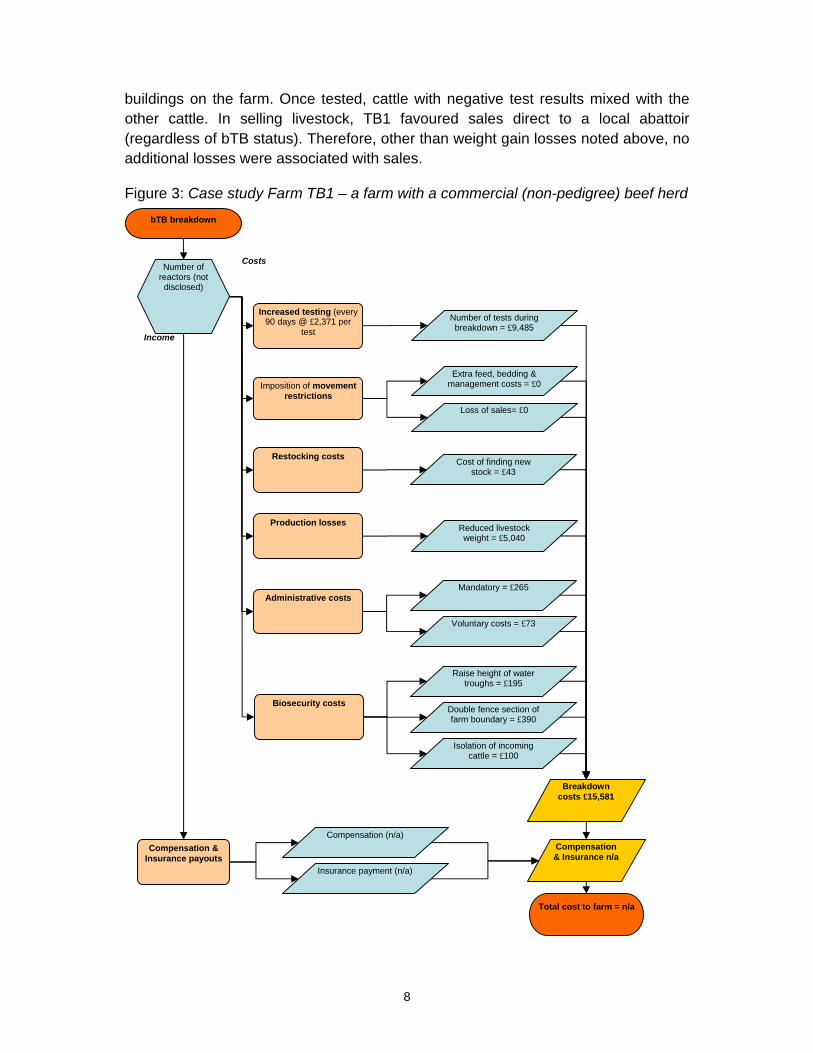
8
buildings on the farm. Once tested, cattle with negative test results mixed with the other cattle. In selling livestock, TB1 favoured sales direct to a local abattoir (regardless of bTB status). Therefore, other than weight gain losses noted above, no additional losses were associated with sales.
Figure 3: Case study Farm TB1 – a farm with a commercial (non-pedigree) beef herd
Increased testing (every 90 days @ £2,371 per
test
Imposition of movement restrictions
Administrative costs
Production losses
Number of tests during breakdown = £9,485
Extra feed, bedding & management costs = £0
Loss of sales= £0
Mandatory = £265
Voluntary costs = £73
Restocking costs Cost of finding new
stock = £43
bTB breakdown
Reduced livestock weight = £5,040
Number of reactors (not disclosed)
Costs
Compensation & Insurance payouts
Compensation (n/a)
Insurance payment (n/a)
Breakdown costs £15,581
Compensation & Insurance n/a
Total cost to farm = n/a
Income
Biosecurity costs Double fence section of farm boundary = £390
Isolation of incoming cattle = £100
Raise height of water troughs = £195

9
Other than administrative costs at £265 for mandatory paperwork and £73 for voluntary activity, TB1 spent £685 on various biosecurity measures including raising water troughs (£195), double fencing part of the farm boundary (£390) and £100 on the isolation of cattle.
Farm TB2 (heifer rearing/dairy)
Comprising 51 hectares of grassland (with 12% rented in), this case study represents a relatively small farm. Furthermore, it shows how bTB can have a catalytic influence on the direction of the farm business. At the time of the last bTB breakdown (in December 2008), this case study was a 100 cow dairy farm and it is analysed in this respect. However, while bTB was a contributing factor to the ending of dairy farming, it only brought the decision forward rather than being the main driver behind the farm’s structural change.
Presently, the farm comprises two enterprises: the rearing of dairy replacements (Holstein-Friesian) and a retained herd of 40 beef cross calves from the original dairy herd. The farm is a family partnership between the farmer and his wife with only one part-time employee. The only breakdown that this farm suffered lasted for 10 months between December 2008 and October 2009. During this period, the farm had 35 reactors and 20 inconclusive reactors, with 25 confirmed with bTB lesions.
By far the greatest cost for TB2 was the loss of milk production as yield dropped by 280,000 litres (see Figure 4). At a price of 24.5ppl, this represented a loss of £68,600 in income. It is interesting to note that the compensation received for the slaughtered animals (£72,600) covered little more than the loss of milk income. TB2 did not replace lost stock but instead exited milk production. However, changing from dairying to rearing dairy replacement heifers was not a direct consequence of bTB but the disease acted as a catalyst. The farmer was aware that his dairy enterprise did not have a longer-term future but the shock of his first and only bTB breakdown brought plans to cease milk production into fruition. While like-for-like replacement of cattle did not occur because of the change of enterprise, costs of finding new stock for the heifer rearing enterprise occurred in its place (£561).
In terms of the farm’s beef enterprise, TB2 reared dairy cross beef calves. The imposition of movement restrictions restricted the sale of 30 calves aged between 3 weeks and 3 months and these were kept for an additional 10 months. This cost the farm business an additional £7,699.
Other costs included the administrative costs associated with bTB breakdown. For TB2 the mandatory element was the second highest compared to the other case study examples, but less time was spent involved in voluntary activity, which therefore kept the overall cost of administration down. Finally, costs of £550 were incurred by raising water trough heights and fencing around a wildlife area in response to the bTB outbreak.

10
Figure 4: Case study Farm TB2 – an ex-dairy farm now rearing dairy heifer replacements
Farm TB3 (pedigree beef)
The third case study farm is the most complicated in terms of land tenure and business structure, operating three different units, including a hill farm (32 hectares of SDA land). This farm extends to 324 hectares, most of which is owned, although one-quarter is rented. The farm also has access to a further 41 hectares of common grazing with whole year grazing rights but this is only utilised during the summer months. In terms of farm type, this is a beef, sheep and arable farm with beef being the most valuable output. The beef enterprise consists of 140 pedigree suckler cows and four beef bulls. As a family partnership, three family members work on the farm
Increased testing (every 60 days @ £445per test
Imposition of movement restrictions
Administrative costs
Biosecurity costs
Number of tests during breakdown = £1,778
Additional feed & bedding = £7,050
Additional labour = £649
Mandatory = £268
Voluntary costs = £402
Restocking costs Cost of finding new stock =
£561
Loss of 280,000 litres = £68,600
bTB breakdown
Raising feed/water troughs = £50
Fenced identified wildlife habitats = £500
Number of cattle
slaughtered = 55
Costs
Compensation & Insurance payouts
Compensation = £64,350
Insurance payment = £8,250
Breakdown costs £79,858
Compensation & Insurance £72,600
Total cost to farm = £7,258
Income
Loss of milk production

11
as waged employees. Three part-time staff are employed on a self-employed basis. Detected through carcass tests at an abattoir in January 2010, this farm’s latest bTB breakdown was on-going at the time of the research having had 12 reactors and 4 inconclusive reactors. While this was the farm’s latest breakdown on the home farm, it has had bTB on at least one of its three holdings for the past six years.
Figure 5 illustrates the costs of the breakdown in the first five months. Unlike case studies TB1 and TB2, the loss of carcass and stock value were this farm’s greatest costs. Due to its latest breakdown, the farm missed its ‘six monthly window’ of being clear of bTB because of some unexpected reactors during the winter months. As a result, the business was unable to sell its beef bulls, resulting in overcrowding of intemperate animals and a loss in their value of approximately £200 (£9,600 in total) because of fighting and the carcasses being over age. However, the breeding bull enterprise has cost the farm £15,000. The sale of six breeding bulls reached only half the value expected for each bull (£3,000 instead of £6,000).
Testing cost this farm £996 per test, and their current breakdown had already cost them £4,980. This however, was likely to increase since the breakdown had not run its course. As noted, the farm was unable to sell its beef bulls and as a result had incurred an additional cost of £3,539 in extra feeding, bedding and labour costs over a two-month period. With three separate holdings, the cost of applying for movement licences were as time consuming as other bTB associated paperwork. Mandatory administration costs therefore cost TB3 £158, although this is the third lowest in the case study farms. While this farm spent £252 in search of replacement stock, the sale did not continue since a pre-movement test on the vendor’s farm proved positive.
Other costs proved much more difficult to determine. For example, the costs of under utilizing or over-grazing pasture on land not adjacent to the main farm. TB3 with its three separate holdings experienced stock management problems between farms. Finally, the cost of labour for cleaning an isolation shed was just over £48 for four hours of work using hired equipment at a rental rate of £60.

12
Figure 5: Case study farm TB3 – a farm with a pedigree beef suckler herd and bull rearing enterprise
Increased testing (every 60 days @
£996per test
Imposition of movement restrictions
Administrative costs
Reduced stock value on beef sales
Number of tests during breakdown = £4,980
Additional feed & bedding = £3,456
Additional labour = £83
Mandatory = £158
Voluntary costs = £122
Restocking costs Cost of finding new stock
= £252
bTB breakdown
Loss of value at £200/animal = £9,600
5 bulls sold at 50% of their value = £15,000
Number of reactors = 12
Number of inconclusive reactors = 4
Costs
Compensation & Insurance payouts
Compensation = £12,927
Insurance payment = £0
Breakdown costs £33,759
Compensation & Insurance
£12,927
Total cost to farm = £20,832
Income
Cleaning costs
Machine hire = £60
Labour costs (4 hours cleaning) = £48

13
Farm TB4 (upland beef)
This is an upland beef and sheep farm supplying pedigree stores to market. The family run farm employs no labour and consists of 233 hectares of owned land with 30 hectares away from the homestead. While beef is the most important agricultural enterprise in terms of value of output, more significant to the business as a whole is income from non-farming activities (camping and holiday accommodation) on the farm. The beef enterprise consists of 76 pedigree suckler cows with the last bTB breakdown beginning in April 2009.
The costs of increased testing and those associated with movement restrictions by far contributed the most to TB4’s total bTB breakdown costs (see Figure 6). With each bTB test costing £949, over the period of the breakdown this accrued to nearly £3,000. During the breakdown, the inability to sell store cattle led to the over-wintering of additional youngstock. This accounted for an extra £3,033 in bedding, feed, and labour costs.
Unlike the other case study farms, TB4 did not incur any costs associated with mandatory paperwork, arguing that these were no more than those normally related with the administration of the farm business. However, the principal farmer voluntarily travelled to meetings connected with bTB and took part in other research that resulted in a cost of £913, the second highest among the case studies.
Farm TB4 invested in the following two biosecurity measures: raising the height of water troughs, which cost £150; and strip grazing with a back fence that required the purchase of additional electric fence equipment at £300. Finally, the cost of labour of cleaning an isolation shed was just over £24 for two hours of work using existing farm equipment and detergents.

14
Figure 6: Case study farm TB4 – an upland farm with a pedigree suckler herd selling store cattle
Increased testing (every 60 days @
£494per test
Imposition of movement restrictions
Administrative costs
Biosecurity measures
Number of tests during breakdown = £2,964
Additional feed & bedding = £3,033
Additional labour = £164
Mandatory = £0
Voluntary costs = £913
bTB breakdown
Raise height of troughs = £150
Strip grazing with backing fence = £300
Number of cattle
slaughtered = 1
Costs
Compensation & Insurance payouts
Compensation = £1,904
Insurance payment = £0
Breakdown costs £7,549
Compensation & Insurance
£1,494
Total cost to farm = £6,055
Income
Cleaning costs Labour cost = £24

15
Farm TB5 (pedigree dairy)
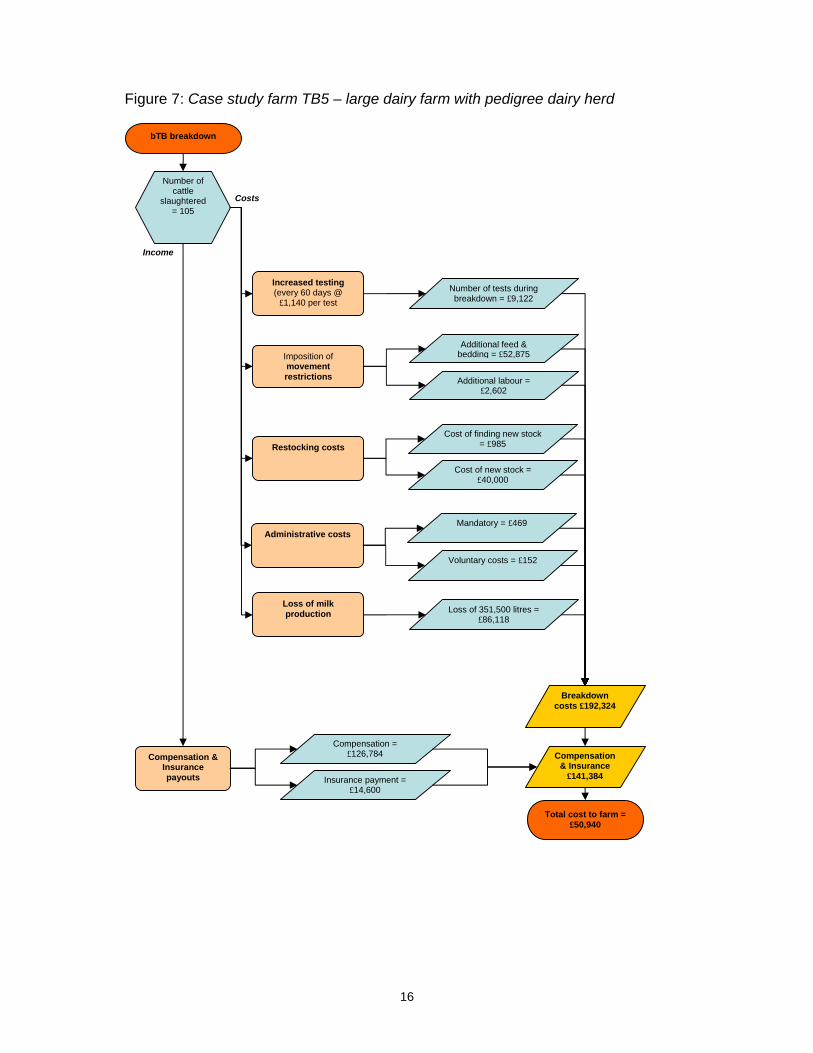
With 330 pedigree dairy cows and 225 dairy followers, this case study represents the largest dairy farm, in terms of animal numbers. In terms of area, it has 223 hectares, of which 142 are rented. However, unlike the other dairy farms in this study, this farm grows a substantial quantity of fodder maize (113 hectares) with the remainder grassland. As well as dairy, this farm has approximately 60 beef cattle that are a by-product of the dairy enterprise. In terms of number of cattle slaughtered as a result to bTB, this was the most affected farm. Detected through a pre-movement test, this farm’s last breakdown began in January 2009 and was on-going. It had suffered six breakdowns in the past 10 years.
Three costs in Figure 7 are clearly apparent: lost income from reduced milk sales; additional feed and bedding costs because of movement restrictions; and the cost of new stock. Of these, the greatest cost was the loss of milk production income. With so many cows and heifers slaughtered and the inability to replace lost stock with cows of the same milk producing calibre, milk sales were reduced by 351,500 litres (a loss of £86,118). Included in this, was an estimated 2,000 litres loss in milk production associated with testing and test reading days (over eight days). This loss alone equated to £3,920.6 The imposition of movement restrictions prevented the sale of dairy-bred beef cattle, which increased feed, bedding and labour costs by an additional £52,875. This high cost was related to keeping an additional 150 calves for a 15 month period. Presumably, at some point in the future some of these costs would be recouped when the cattle are sold. Thirdly, TB5 spent £40,000 in buying replacement dairy stock. Sourcing the correct stock was an issue for TB5, who reported that his pedigree dairy herd was in the top 1% of its breed. Therefore, while he spent many hours searching for stock of sufficient quality at a cost of £985, he argued that the stock he bought was not of the same milk producing quality.
The cost of testing for bTB, while much less than some other costs, nevertheless cost this farm £9,122 since January 2009, with each test costing £1,140. This was the second highest in all of the eight case studies partly because of the time required to test all the cattle (approximately 670) on the farm.
6 The price the farmer was receiving for his milk was 24.5ppl.
16
Figure 7: Case study farm TB5 – large dairy farm with pedigree dairy herd
Increased testing (every 60 days @
£1,140 per test
Imposition of movement restrictions
Administrative costs
Restocking costs
Number of tests during breakdown = £9,122
Additional feed & bedding = £52,875
Additional labour = £2,602
Mandatory = £469
Voluntary costs = £152
Loss of 351,500 litres = £86,118
bTB breakdown
Cost of finding new stock = £985
Cost of new stock = £40,000
Number of cattle
slaughtered = 105
Costs
Compensation & Insurance payouts
Compensation = £126,784
Insurance payment = £14,600
Breakdown costs £192,324
Compensation & Insurance
£141,384
Total cost to farm = £50,940
Income
Loss of milk production

17
Farm TB6 (commercial dairy)
This case study demonstrates the affects of bTB on a small family dairy farm. Operating a closed herd policy with just 80 dairy cows, this example illustrates the vulnerability of dairy farms that have no other enterprise. The breakdown on this farm began in April 2009 and was clear after a further three tests.
Similar to TB5, Figure 8 shows that the largest cost to TB6 was the loss of income from reduced milk production of 56,420 litres a cost to the farm of £14,542. Of this, TB6 estimated that production dropped by two litres per cow over the initial two milkings after testing (1,920 litres costing £471). The inability to afford the required number of replacement stock because of insufficient compensation meant that this farm had five fewer productive animals. As a result, the estimated financial loss from this was £14,072 since the cattle bought in have averaged 2,000 litres less per annum than those that they replaced. Furthermore, while marginal, their milk price was reduced by 0.1ppl because they were not able to meet a milk company target. Finally, in terms of milk production, this farm also lost £109 from its European Dairy Premium because of reduced milk production. In total, TB6 bought six replacement dairy cattle at a cost of £7,200 with a further £743 spent on their sourcing.
With the lowest costs associated with testing and reading the test at £285, the cost of testing was £1,710 over the period of the breakdown. However, while the cost per test was the least in comparison with the other case study farms, in terms of cost per animal per test, at £1.95, this was not the case. The cost of administration costs for mandatory paperwork and meetings was £177. On the other hand, £988 was incurred in voluntary costs mainly due to expenses connected to meetings on bTB.
Finally, TB6 is a small farm of approximately 40 hectares without the capacity to retain excess stock. This farm had looked into sending both its beef and dairy male calves to a licensed rearing unit. For the beef calves, TB6 felt that this undervalued their calves by between £30 and £50 per calf. However, unable to find a rearing unit that would take their Holstein Friesian bull calves, TB6 had no options but to shoot their newborn calves at a cost of £12 per calf.

18
Figure 8: Case study farm TB6 – small dairy farm with a commercial (non-pedigree) dairy herd
Increased testing (every 60 days @ £285
per test
Administrative costs
Restocking costs
Number of tests during breakdown = £1,710
Mandatory = £177
Voluntary costs = £988
Loss of 56,420 litres = £14,542
bTB breakdown
Cost of finding new stock = £743
Cost of new stock = £7,200
Number of cattle
slaughtered = 11
Costs
Compensation & Insurance payouts
Compensation = £11,352
Insurance payment = £0
Breakdown costs £27,351
Compensation & Insurance
£11,352
Total cost to farm = £15,999
Income
Loss of milk production
Calves shot as unable to sell = £1,880
Shooting calves
Loss of European Dairy Premium = £109

19
Farm TB7 (commercial dairy and beef)
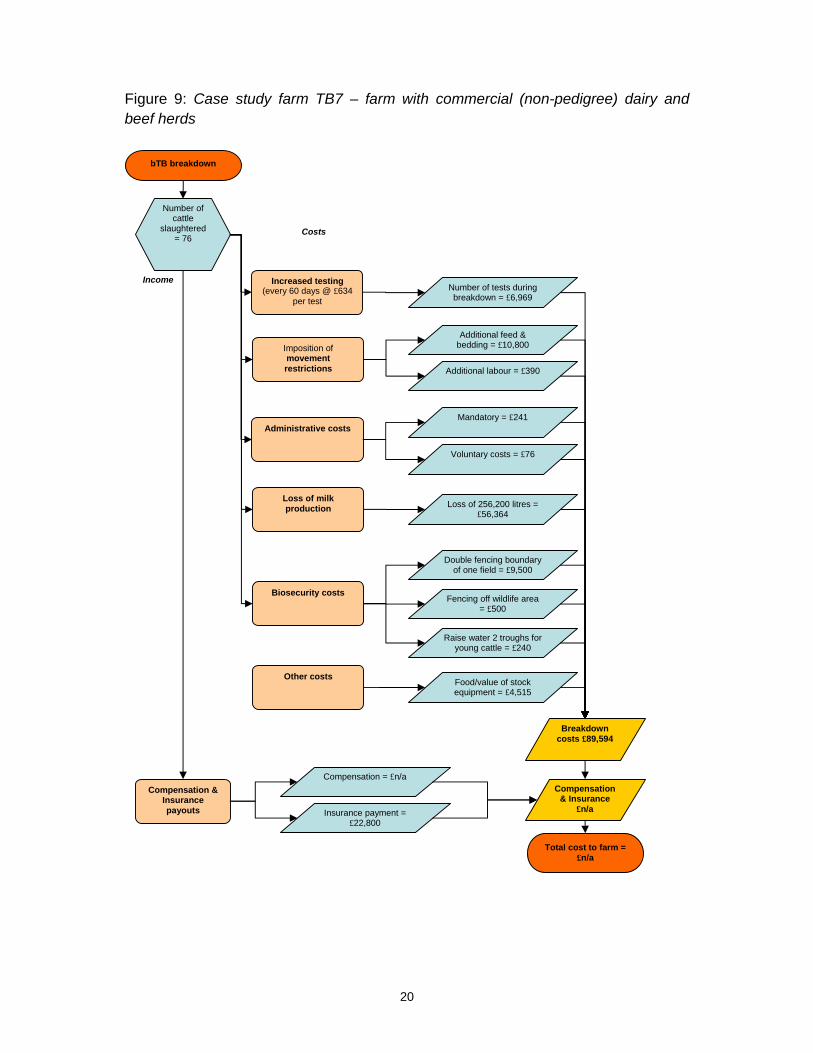
This is the largest farm in the sample at 332 hectares. Farmed as a family partnership, it has 150 dairy cows, 182 dairy followers, and rears finished beef steers using male calves from the dairy enterprise. This latter enterprise is relatively new and was introduced to the farm’s activities partly in response to bTB breakdowns. Its most recent breakdown beginning in February 2008 and this farm was still under restrictions in April 2010.
On this farm, similar to TB5 and TB6, reduced milk production accounted for the largest cost (see Figure 9). In this case, restocking occurred through the addition of surplus home reared heifers but this took time (for heifers to calf and start contributing) thus reducing milk production by 256,200 litres at a cost of £56,364. Unlike TB5 and TB6 however, TB7 suggested that milk production was not affected on test and reading days.
The cost of movement restrictions in this case is less straightforward compared to the other case study farms. TB7 decided to start a cereal-beef enterprise for slaughter rather than shoot unsalable calves. Therefore, the estimated annual variable cost of this enterprise at £11,190 accounts for the additional feed,7 bedding and labour requirements.
With testing and reading costs at £634 per test, TB7 spent nearly £7,000 on tests over the period of their breakdown. Furthermore, TB7 noted that there were hidden costs on testing and reading days as lunch was given to all those involved, which was estimated to be £20 per test and £440 over the bTB breakdown.
Other costs included £10,240 spent on biosecurity measures, with £9,500 paid for the double fencing of a single field, £500 on fencing walkways, and £240 on raising troughs. Further costs included the purchase of a handling system at a cost of £2,500, feeding additional staff on testing days, and for fuel needed to transport the cattle handling equipment around the farm.
7 As TB7 was feeding homegrown cereals, the cost of feed reflects their opportunity costs.
20
Figure 9: Case study farm TB7 – farm with commercial (non-pedigree) dairy and beef herds
Increased testing (every 60 days @ £634
per test
Administrative costs
Imposition of movement restrictions
Number of tests during breakdown = £6,969
Mandatory = £241
Voluntary costs = £76
Loss of 256,200 litres = £56,364
bTB breakdown
Additional feed & bedding = £10,800
Additional labour = £390
Number of cattle
slaughtered = 76
Costs
Compensation & Insurance payouts
Compensation = £n/a
Insurance payment = £22,800
Breakdown costs £89,594
Compensation & Insurance
£n/a
Total cost to farm = £n/a
Income
Loss of milk production
Double fencing boundary of one field = £9,500
Biosecurity costs
Food/value of stock equipment = £4,515
Other costs
Fencing off wildlife area = £500
Raise water 2 troughs for young cattle = £240

21
Farm TB8 (organic dairy/cheese producer)
The final case study encompasses a number of different characteristics. As a relatively small County Council rented farm (44.5 hectares), it specialises in producing organic milk from 38 rare breed cross dairy cows. The milk was processed into different types of cheeses, including unpasteurised, for a local market. In addition to the dairy and cheese-making activities, the farm has access to common grazing upon which it grazes store cattle. The date of the most recent breakdown on this farm was October 2009.
While the costs illustrated in Figure 10 are lower, compared to other case study farms particularly dairy farms, this case study demonstrates how additional costs due to bTB can become binding. On farm TB8, margins were extremely tight and therefore cash flow became problematic. The greatest cost, which affected cash flow, was the lost income from reduced milk production. The processing of most of the milk from this farm into cheese continued as normal. However, with five dairy cattle slaughtered the quantity of milk sold into the liquid market was reduced by 35,200 litres at a cost of £7,963.
The inability to sell store cattle because of movement restrictions required additional feed, fed in fields, and labour costs totalling nearly £3,000. The next highest cost was the cost of testing. At £874 per test, four tests cost the farm £2,623. To protect feed, TB8 bought a second-hand secure metal container as a wildlife proof store at a cost of £2,000.

22
Figure 10: Case study farm TB8 – farm with organic dairy herd, cheese making enterprise and store cattle grazed on common land
Increased testing (every 60 days @ £874
per test
Administrative costs
Imposition of movement restrictions
Number of tests during breakdown = £2,623
Mandatory = £127
Voluntary costs = £203
Loss of 32,500 litres = £7,963
bTB breakdown
Additional feed = £2,955
Additional labour = £320
Number of cattle
slaughtered = 6
Costs
Compensation & Insurance payouts
Compensation = £8,445
Insurance payment = £1,200
Breakdown costs £16,189
Compensation & Insurance
£9,645
Total cost to farm = £6,544
Income
Loss of milk production
Secure metal container for animal feed = £2,000
Biosecurity measures

23
5. In-depth analyses of costs associated with bTB breakdowns on case study farms
The summaries of each case study farm and their associated flowcharts have provided an overview of the costs associated with bTB breakdowns. This section explores in-depth the factors influencing these costs and explores why they can differ substantially between farms.
5.1 Cost of bTB testing
Before the detection of bTB, testing on each of the case study farms occurred on an annual basis, with the exception of biennial testing for TB8. Most of the recent breakdowns were detected through routine tests (see Table 5) although in case study TB3, the breakdown was detected through carcass tests at an abattoir and TB5 was detected through a pre-movement test. Once detected, the extent of bTB breakdowns between the case studies illustrates how some farms spend many years under bTB restrictions while for others the breakdown lasted less than a year. For three farms, the most recent bTB breakdown was ongoing.
Table 5: Frequency of testing pre-breakdown and where the breakdown was first detected
Farm Pre breakdown testing frequency
Where breakdown was first detected
Length of last breakdown
TB1 Annually Routine test 5 years*
TB2 Annually Routine test Dec 2008 to Oct 2009 (10 months)
TB3 Annually Abattoir test 6 years**
TB4 Annually Routine test Apr 2009 – Sept 2009 (6 months)
TB5 Annually Pre-movement test Jan 2009 - ongoing
TB6 Annually Routine test Apr 2009 – Feb 2009 (10 months)
TB7 Annually Routine test Feb 2008 - ongoing
TB8 Biennial Routine test Oct 2009 - ongoing
*TB1 has been under bTB restrictions since January 2002 other than for 11 months in 2004. **TB3 has had bTB on at least one of its three holdings for the past six years.
The cost of bTB testing was very different on each of the case study farms (see Tables 6 and 7). The variance depends on factors such as time of the year, distance cattle are to livestock handing equipment, the type of farm, number of animals tested and the number of people used in testing.
In considering the cost of bTB testing, the estimated dairy and beef farmers’ hourly rate is used to enable comparability between different farms types.8 The hourly rate of labour is likely to be an overestimate since not all those involved are likely to be on the same hourly rate. For example, the use of a farmer’s teenage children or the use of unskilled labour is likely to be paid at a much lower rate. However, using a farmer’s hourly rate for all workers involved in the bTB tests enables some of the
8 For farms with both dairy and beef enterprises, the wage rate for the dominant enterprise is used.

24
opportunity costs to be captured, such as other work that must be carried out at a different time due the disruption associated with testing.
Table 6 shows the cost of the test in two parts: the intradermal tuberculin (skin) test, and the reading of the results. Most of the farmers in the case study suggested that there was little difference in time between administering the skin test and reading the results. As one farmer put it:
“By the time you’ve got the cattle in, injecting it, they just go bang bang. But reading it takes just as long. By the time that they’ve felt and made sure ….” (Interviewee TB4)
As such, the cost differentiation between administering and reading the test were minimal, with only two farms suggesting that the reading test was marginally quicker and thus less expensive. In the example of TB1, the farmer supplied annual costs of bTB tests. Over the year (2008) with four 90-day tests per year, the total cost to the farm was £9,485.9 In terms total costs, the cost per test on the eight case study farms ranged between £285 for TB6 and £2,371 for TB1. Clearly, part of this difference reflects the number of cattle being tested (146 compared to 798). The total cost over the period of the breakdowns is difficult to assess since three of the case study farms were still under restrictions, while two further farms had been under bTB restrictions for over five years. In case study TB5 for example, since January 2009 bTB testing had cost £9,122 (or £7,982 if the cost of the annual bTB test is subtracted).
Table 6: Cost of bTB testing on the eight case study farms Farm No. of Cattle
tested Cost of administering skin test
Cost of reading skin test results
Cost per test Total cost over breakdown
TB1* 798 £1,186 £1,186 £2,371 £9,485
TB2 170 £222 £222 £445 £1,778
TB3* 400 £498 £498 £996 £4,980
TB4 81 £247 £247 £494 £2,964
TB5 668 £634 £507 £1,140 £9,122
TB6 146 £171 £114 £285 £1,710
TB7 465 £380 £253 £634 £6,969
TB8 146 £570 £304 £874 £2,623
*These values have been calculated on a yearly basis.
The approximate cost per animal over each test and the breakdown period varied considerably. For example, the lowest cost per animal per test was £1.36 on farm TB7 while this increased to £6.10 on farm TB4, although most were between £1.95 and £2.97 per animal per test. In terms of enterprises, there were no discernible differences between beef and dairy farms. In an earlier study of the costs of bTB Sheppard and Turner (2005) reported that the cost per animal per test ranged from
9 Testing was supposed to occur every 60 days. However, the cost of this to TB1 would be £14,227 per year so a 90-day testing period was requested. If the farm exceeds this 90 days Defra will not sanction cattle to be bought and brought on to the farm.

25
42 pence to £4.13 for dairy herds and 69 pence to £3.92 for beef herds. Clearly, while the cost of testing has increased, the majority are still within this range.
TB4 however, does stand out. This farm, an upland farm, selling beef stores, had land in two different places. As such, it was necessary for farmer to move his handling equipment between farms:
“Its picking up the whole handling system, taking all the handling system down, taking it to the other place, putting the whole handling system up, getting the cattle in … its very time consuming.” (Interviewee TB4)
Furthermore, as cattle were tested in two locations, this necessitated the movement of handing equipment, the vet to visit on two separate days, and the employment of additional casual labour. Effectively, this doubled the cost of each test. On other farms with land away from the main holding, handling equipment was in place or portable equipment was used that reduced the time of testing.
Table 7: Cost of bTB testing on the eight case study farms per animal Farm Cattle tested Cost per
animal per test Cost per animal over breakdown
TB1* 798 £2.97 £11.89
TB2 170 £2.62 £10.46
TB3* 400 £2.49 £12.45
TB4 81 £6.10 £36.59
TB5 668 £1.71 £13.66
TB6 146 £1.95 £11.72
TB7 465 £1.36 £14.99
TB8 146 £5.99 £17.96
*These values have been calculated on a yearly basis.
The employment of causal labour to assist on testing days varied. Three farms, TB1, TB2 and TB8 used no additional labour since these farms had a large enough workforce to cope with the additional demands of labour that bTB testing brought. Other farms relied on family help. For example, TB7 used their children as help. The remaining farms hired in additional labour, usually on a self-employed basis. The ability to employ family will depend on whether family members are available. If they are, as this interviewee suggests:
“It is cheaper to employ family than not, than people from away.” (Interviewee TB4)
However, it was not always possible to find casual staff, and for TB5 this proved difficult.
While Tables 4 and 5 provide indicative costs of bTB testing on farms across the SW of England, it does not account for hidden costs, such as losses to production, particularly on dairy farms, and the disruption of other activities. As these farmers put it:

26
“You are taking away from your core duties so you are not spotting cows bulling, you are not trimming feet, you are causing stress on cows, you are running them through the crush, they become needle shy, there are increased risks of injury, abortions, mastitis, lameness.” (Interviewee TB5)
“Everything else grinds to a halt ... which puts pressure on other things. If you had five of us or six of us spending one day that’s more than a week gone so ... We are testing next week [in early April] and if we had five of us out on a tractor we would cover some ground in one day.” (Interviewee TB3)
Another farm (TB7) noted the disruption of haymaking and silage making by having to carry out skin tests. However, another farmer who only had dairy cows with very little arable activity, took a more pragmatic view:
“It doesn’t [disrupt other enterprises] but you just have to make sure that you arrange everything around it …it’s not like they just turn up, you do have notice” (Interviewee TB6)
The loss of milk production on some dairy farms may be a further hidden cost. For example, farm TB6 estimates that production drops by two litres per cow over the initial two milkings after testing. Furthermore, behavioural difficulties in the cows led to the animals not wanting to enter the parlour, being frisky once in the parlour and, being more messy than normal. Consequently, milking took much longer. A much larger dairy farm (TB5) suggested that his losses were 2,000 litres over the testing and reading days, which was worth around £490. Taking the cost of this production loss over the last bTB breakdown (which included eight tests), this equated to approximately £3,920.10
Not all dairy farms reported a loss in milk production. Farm TB7 suggested that milk production was not affected.
“The dairy herd is done very, very quickly coz what they [the dairy cows] do is to go into self locking yokes where they’re feeding. So their food is in front of them all the time so we don’t see any drop in milk. So we do however many there is. At one point, we were up to 180 [dairy cows]. They are literally done within less than an hour. And they’ve got food in front of them so we don’t see any drop in milk.” (Interviewee TB7)
However, TB7 commented on some of the hidden costs on TB testing and reading days:
“It’s only a minor thing but my mother-in-law used to feed us. She’d come around and give us dinner and everything. Well you think about it, she’s feeding those people … I put down £20 every time because even if she does sandwiches … £20 quid don’t go far when you’re buying ham and all that lot … that’s £440 there.
10 The price the farmer was receiving for his milk was 24.5ppl.

27
And then another we thought of is travelling around with the crush gates and handling systems, the fuel costs on that … coz we used to take two tractors and that was £825 quid in fuel alone. You see, we have ground the other side of Bridgewater and on that day we had to go … so we’d have six moves in a day.
The direct costs of bTB testing are relatively easy to calculate, but as this section has illustrated, they are highly variable across farms due to a wide range of factors including the number of animals tested, the labour used (and it’s cost), distance to handling equipment and so on. However, the are also a range of indirect and often hidden costs associated with testing such as the knock-on impacts on other activities (e.g. delays to silage making), impacts on milk production (although not all farmers experience this), behavioural difficulties in cattle and additional fuel and (human) feed costs.
5.2 Cost of movement restrictions
Of the eight case study farms, six had experienced difficulties and extra expense because of cattle movement restrictions. Table 8 illustrates the types of cattle enterprises affected by movement restrictions. In most cases, farmers found it difficult to estimate the cost of keeping animals for extended periods. Therefore, Table 9 estimates these costs using information that the farmers provided and costs from ABC (2009). Some farms, TB1 and TB3, have adapted marketing channels to sell stock direct to slaughter. However, TB3 expected to sell its 18-20 bulls in the spring but because of an unexpected positive bTB test in the winter, this was not possible. The cost of keeping stock accrued in extra costs such as additional bedding, feed and labour required to keep stock on the farm. On TB8, these additional costs became binding since on this small rented farm, margins were extremely tight and therefore cash flow became problematic. The estimates provided in Table 9 indicate the likely costs of having to keep additional cattle for the case study farms, taking into account not only additional feed, bedding and labour costs but also the relative length of time that these farms have had to retain their stock.
Table 8: Cattle affected by movement restrictions
Type of cattle Number Age
TB1†
TB2 Beef calves 30 3 weeks to 3 months
TB3* Beef bulls 48 18 months
TB4 Store calves 50 7 months
TB5 Beef calves 150
TB6**
TB7 Beef calves 25 6 months
TB8 Beef stores 30 18 months
†TB1 - Most stock goes direct to abattoir, although would have sold better quality stock through livestock market *TB3 – Most stock goes direct to abattoir **TB6 - Do not keep excess stock

28
Table 9: Estimated costs as a consequence of movement restrictions Estimated
variable costs per animal
Estimated costs of keeping cattle
Extra labour per animal (SMDs)
Additional labour cost
Total costs
TB2 £282 £7,050 2.1 £649 £7,699
TB3 £432 £3,456 0.9 £83 £3,539
TB4 £182 £3,033 0.8 £164 £3,198
TB5 £282 £52,875 1.1 £2,602 £55,477
TB7* £432 £10,800 1.3 £390 £11,190
TB8 £197 £2,955 1.8 £320 £3,275
*TB7 – Rather than being an additional cost, TB7 took the decision to begin a cereal beef enterprise. Therefore, this represents the costs of the new enterprise over a one year period.
The inability to move stock off-farm (or around a farm with more than one holding) was illustrated by TB4. The restricted movement of cattle from this upland farm, which sold stores once a year, led to particular financial difficulties. As TB4 suggests:
“The critical one is in the autumn when you want to sell the cows, the suckler calves off the cows … I’d sell the whole 50 [suckler calves] … The consequences are you’ve got to keep them for 120 days minimum, you’ve got no feed, no shed space because you keep dry cows through the winter time. You then run into a welfare problem and a cost problem because you’ve relied on … that is your only income from those cattle at that time. You’ve got all the other added costs gone out like buying your … doing your hay, your silage, buying your straw for your cows and that’s all got to be paid for. If you have no income from those calves and you’ve actually got to buy more straw, you’ve got to get more silage, and you haven’t got shed space, you are kind of stuffed, up the creek with out a paddle. (Interviewee TB4)
As TB8 illustrates, this experience was not necessarily confined to only upland farms. TB8, rearing organic stores on common land in a lowland area, had to keep store cattle, which were normally sold in the autumn, for an additional six months. This led to increased cost in feeding, a ‘hugely increased work load’ and, because of a lack of proper accommodation, problems of over-stocking occurred that breached organic certification regulations. The financial stress that this causes echoes that of TB4 above in that:
“About 30 calves that we’d dearly love to sell, so would the bank manager.” (Interviewee TB8)
Apart from additional feed and bedding that is needed for excess stock, overstocking of livestock on one holding or another manifests itself in other ways. For instance, TB3 commented on his missed ‘six monthly window’ of being clear of bTB because of some unexpected reactors during the winter months. Without this window, the farm had not been able to sell its bulls, resulting in overcrowding of intemperate animals and a loss in their value of approximately £9,600:
So we’ve got an overload of bulls that are getting a bit frisky. Their carcass value has collapsed because they’re fighting and they’re over age for carcasses. [Interviewer]

29
How much do you think it has collapsed by? [Farmer] One would have hoped that they would have made ... they will have dropped £200 on their carcass values easily. And what is there ... er ... 48 bulls.” (Interviewee TB3)
A further consequence and cost of overstocking, particularly for dairy farms without the required facilities, is the question of what to do with Holstein Friesian bull calves. TB7, for example, set up its own barley beef unit to rear these calves but not all farms were in this position. TB6 was less fortunate in this respect. With a small area (approximately 40 hectares), this farm had looked to sending both its beef and dairy male calves to a licensed rearing unit. However, for the beef calves TB6 felt that this undervalued their calves by between £30 and £50 per calf. Moreover, TB6 was unable to find a rearing unit that would take their Holstein Friesian bull calves and therefore, during their breakdown they had no other option but to shoot the newborn calves at a financial and personal cost:
“At the moment I can get between £50 and £70 per calf. That’s picked up, collected. So if I took the calf to market I might get a bit more. And it costs me £12 an animal to shoot them. So it’s between £70 to £90 it’s costing per animal. And I think we’ve probably lost 20 animals. [Husband] We were lucky really because we had a run of heifer births. [Wife] Okay, you haven’t got the cost of rearing them for 40 days but [Husband] It’s morally wrong. [Wife] It’s very morally wrong. I hate doing it. [Husband] Yes. [Wife] We are not in farming to shoot animals. [Husband] It doesn’t fill you with glee. [Wife] I feel good that I can keep them and I’ve got some going tomorrow and that’s great. And to tell you the truth, I don’t ... as long as they make okay money I don’t really care what we get for them because I hate, I hate the idea of all the waste associated with ... It’s just a waste. The waste is horrendous.” (Interviewees TB6)
Other costs are much more difficult to determine. In particular, the costs of either under utilizing or over grazing pastures for farms with more than one holding or land that is not adjacent to the main farm. TB3, for instance, had three separate holdings resulting in stock management problems between farms:
“All of those … just restrictions make managing a herd a lot more difficult. We can’t move from here up on to the hill farm when we want, when grazing is suited … you just can’t say there’s more grass up here when one place is getting short of grass … it’s difficult to manoeuvre.[Farmer’s wife interjects] It was easier when both places were down, a lot easier. (Interviewee TB3)
A further concern regarding stock management and grazing was expressed by TB6 and his ability to meet cross-compliance regulations on his ESA land. Since movement restrictions meant that stock were left on the moor for longer than the farmer would have preferred, signs of poaching occurred which was of concern to the National Park Authority:
“They don’t believe. They say ‘you are poaching all that ground.’ And I say, well I don’t really want to poach it; I don’t want to muck up that ground. And they come
30
along and go, ‘well we going to penalise you because you’ve mucked the ground’. And I say, well hang on two different whammies now. You’ve hit me two ways, you’ve ... (a) I didn’t want to muck it up, and (b) now your imposing a fine, when it’s going to affect me twice now.” (Interviewee TB4)
The costs of bTB movement restrictions ripple out across the business affecting labour, feed and bedding costs, creating animal welfare issues and causing unintended contraventions of other regulations such as organic certification requirements and cross-compliance. This section has also begun to indicate the personal costs of bTB on farmers and their families (see section 7). As with the costs of testing, the costs of movement restrictions reflect the individual characteristics of particular farm business, the spatial configuration of the land holdings, the specific features of the farm enterprises, etc, suggesting that average figures can mask much of the complexity of cost assessment.
5.3 Replacement costs
Replacing stock lost during a bTB breakdown will depend on a range of factors such as the number lost, whether a farm had an open or closed breeding programme, the availability stock of appropriate quality and at an affordable price. Table 10 shows that five of the eight farms purchased new stock in response to a bTB breakdown. A sixth farm (TB3) attempted to buy replacement stock but this sale did not continue since a pre-movement test on the vendor’s farm proved positive!
Table 10: Restocking farm after bTB breakdown Farm Restocked with purchased
cattle Had restrictions imposed on restocking
Difficulties in finding right type/quality of stock
TB1** Yes Yes No
TB2* No N/A N/A
TB3† No N/A Yes
TB4†† No N/A N/A
TB5 Yes Yes Yes
TB6 Yes Yes Yes
TB7 No N/A N/A
TB8 No (Yes) Yes
TB1** Restocked with cattle form a different type of enterprise.
TB2* Changed enterprise from dairy to heifer rearing as a result of bTB.
TB3† Cattle sought but not purchased because of two positive results with the pre-movement bTB test. TB4†† Breed own replacements.
TB1, a commercial cattle finisher, employed a strategy to buy cattle in from farms that were also under bTB restrictions. Using this approach, TB1 used two farms to supply replacements. The stock had to go into designated buildings on the farm but once tested, if the tests proved negative, they could be mixed with the other cattle. TB1 clearly identified the benefits of such an arrangement:
“Well, it’s a slight bonus for ourselves, because we were buying from people that were under restriction they were slightly cheaper … they could only sell them to somebody who was also … nobody that wasn’t under restriction were going to buy their stock

31
were they coz as soon as they’d bought theirs, the whole heard would be under restriction themselves. They couldn’t sell them to somebody who was unrestricted. They could get five quid for them from the hunt; this is calves now at birth, or five quid or 10 quid from the abattoir if they kept them for 10 days. So if I was prepared to give 20 or 25 quid for a Friesian bull calf they were actually gaining and I was gaining a bit as well. I don’t mean that the calf would have been £50 in the market but I was gaining five quid or 10 quid per calf depending how good the calf was. So you know we just had a little bit of compensation there. (Interviewee TB1)
However, not all farms are so fortunate. For example, TB6, the small dairy farm that was under severe status, could only buy cattle from clean herds. This, they argued, restricted the options open to the farm in buying in new stock since they were not able to buy from a standard (bTB restricted) herd dispersal where they could expect to pay £200 less per animal for genetically similar animals with similar yields to their own dairy cows.
One of the main concerns regarding restocking, which has long-term costs to farms, is the ability to replace cattle with the same quality as the slaughtered stock. As noted in Section 6, compensation does not discriminate between average, below or above average quality. TB3, rearing pedigree beef, typified the problems that can arise when bTB disrupts a farm’s usual restocking policy:
“What we are sadly doing is ... we’d normally buy in 25 calves and select them back to the number we want, keeping the best ones, but we’re finding now that we have to keep everything. And our pedigree heifers, we’re keeping virtually everything because the TB is doing the culling for us and not necessarily the ones we want to cull. So our herd is going backward rather than going forward. And when you’ve got a son in his early 20s, that’s not the way you really want to be going.” (Interviewee TB3)
Sourcing the correct stock was also an issue for TB5, a pedigree dairy farmer who spent many hours searching for stock of sufficient quality:
“I spent probably a fair ounce before I found these. I went to farm sales, fair bit of research, and came up with somebody luckily through word of mouth. It was difficult. Five or six days work.” (Interviewee TB5).
For another dairy farm (TB6) while, as noted above, stock had to be sourced from ‘clean’ farms, introducing the stock into their herd changed the seasonality of production:
“We had several which were dry and we’ve had massive gapping gaps where we should ... we lost dry ones ... we lost three or four that were ready to calve and we have gaps and that’s our production profile ... I don’t know how much you can see it on our production profile but you can definitely see it in the ... [Husband] I think it was a bit of a mix with some dry ones, some freshly calved ones and some middle lactation ones ... [Wife] Yeah. I would have said, when I looked in the book and thought um we’ve got

32
a bit of a space here those were the animals that we lost that should have calved in the space.” (Interviewee TB6).
Table 11 shows the costs of sourcing replacement stock. This includes labour time taken to source cattle, the cost of travelling to see stock, and the costs of haulage once the cattle were bought. For TB1, replacement stock was sourced from two local farms that were under the same level of bTB restrictions. As such, the total cost of £43 reflects the annual cost of sourcing his stock from these farms. TB5 and TB6 recorded the highest costs associated with sourcing replacement stock. As noted above, the time spent on scouring websites and auction catalogues to find the correct quality stock can take many working days.
Table 11: Costs associated with sourcing replacement stock Labour
hours Vehicle mileage
Haulage Other costs Labour costs
Mileage costs
Total cost
TB1 3 20 £37 £6 £43
TB2* 5 £500 £61 £561
TB3 16 180 £195 £57 £252
TB5 50 400 £250 £609 £127 £985
TB6 48 60 £80 £60 £584 £19 £743
Restocking the farm may in part depend on the compensation received. TB6 could only afford to replace six of the 11 of the slaughtered dairy cattle. As a result, it incurred a financial loss of £14,072 since the cattle bought in averaged 2,000 litres less milk per annum than those that they replaced. The replacement stock, it was argued, did not cope well with the farm’s existing dairy system. Furthermore, because TB6 was paid on a volume collection basis, the dip in milk production meant that they dropped into a lower band, reducing their milk price from 24.5ppl to 24.4ppl. While this is only a very marginal change, on 720,000 litres of annual production this amounts to a £720 reduction in income. Finally, a loss of £109 was also attributed to less income being received from the European Dairy Premium, which was calculated on the basis of litres sent to the processor.
Not all farms, as Table 11 shows, decided to buy in replacement stock. Some preferred to try to keep their herds closed and restock from within. TB7, a commercial dairy herd, took this approach:
“[Interviewer] How are you restocking? [Farmer] Through our own replacements and keeping the beef calves so our numbers are going up again. Our numbers are low on the dairy herd but we’ll build that up by home breeding because we’re a closed herd and we’d like to keep it that way.” (Interviewee TB7).
However, for dairy herds this approach has a cost in lost milk production. For example, TB7 stated that 61 heifers were slaughtered because of bTB. If, on average, these herd replacements had produced 4,200 litres of milk in their first year of calving at a price of 22p per litre this would equate to approximately £924 for each heifer. Therefore, with 61 heifers no longer available to the herd, this equates to a

33
total loss of £56,364 in milk sales. Furthermore, since a business decision by this farm had been to replace stock through rearing their own replacements, this is a real loss in milk sales.
The ability of dairy farms to replace lost cows may be important in determining the scale of lost milk production. If a farm, such as TB8, has an adequate supply of heifers and only loses a few milking cows at any one time the impact may be less conspicuous:
“We just restock with home bred. We don’t go out and buy. If they’re only taking like a few at a time it makes little impact on us as we have that many heifers to replace with.” (Interviewee TB8)
However, as in the case of TB7, where it was the heifers that succumbed to bTB and there were no replacements, this led to a farm policy of keeping cattle longer, with associated problems of lameness, mastitis and other conditions:
“Before TB we were becoming a young herd which was good because then you don’t have your husbandry things, like your feet and things like that, whereas we’ve had to put that plan on to the back burners at the moment until we’ve built the numbers up. With a younger herd you do substantially reduce your vet bills.” (Interviewee TB7)
The costs associated with replacing stock vary considerably, and the practicalities of replacing stock can have wider impacts on herd management and the farm business. Due to the variability of compensation payments and the mismatch between compensation payments and market values, not all farms can afford to replace all cattle slaughtered. In turn, this can be associated with a significant loss of revenue from reduced milk sales. Some farms have chosen to maintain a closed herd and breed their own replacements. Again, this can be associated with a significant loss of milk revenue.
5.4 Administration costs of bTB on farms
The administration costs arising from a bTB breakdown are divided into: (i) those that are necessary because of a bTB breakdown, and (ii) additional voluntary activities, such as co-operating with research activity, attending industry body meetings, or lobbying activities. For each case study farm, the cost for each activity was calculated using the farmer hourly rates of £12.17 for cattle and sheep farmers and £12.67 for dairy farmers.
Most of the case study farms identified additional administrative costs associated with bTB, although farmers often found it difficult to quantify how many hours were involved. Indeed, this dialogue between a husband and wife farming in partnership typifies the difficulties in estimation.
“[Farmer’s wife] I spend more time on the phone to the ministry trying to sort out dates and booking dates ... it’s several hours ...[farmer] for every test there is an hour

34
spent on the phone one way or another sorting it out ... [farmer’s wife] Ministry vet comes out once or twice ...[Famer] Yep. [Farmer’s wife] you can’t send over 30 month, yeah over 30 month with under 30 month they’ve got to go on two different days so you have to pick out two separate lots of cattle. You’ve got to keep all them ... its two different lots of loading cos they all can’t go on one load. [Farmer] They come in here ... although they’re doing the paperwork here and sorting ... [Farmer’s wife] We’ve got to be here. [Farmer] So every test there is probably three hours extra on the paperwork side.” (Interviewee TB3)
Table 12 quantifies the hours and costs of administrative work associated with bTB. Only TB4 suggested that bTB had created no additional costs above those normally related with the administration of the farm business. Costs amongst other farms varied between an additional 10 hours and 37 hours over the course of a breakdown. For three of the farms, paperwork and meetings contributed over 75% to the additional administrative work. The cost of bTB administration ranged from nothing for farm TB4 to £469 for farm TB5. While there is compulsory paperwork that is necessary to complete, some of the other additional costs reflected the type and structure of the farm.
Six of the eight farms applied for movement licences. For farm TB3, with three separate holdings, the cost of applying for movement licences were as time consuming as other bTB associated paperwork. Telephone calls tended to be associated with time organising vet appointments and transport for animals, which might take two to three hours per breakdown. One farmer, TB7, suggested that telephone calls tended not to require additional time because as she put it: “to be honest, telephone calls are made on my mobile when I’m walking around doing other things”.
Table 12: Costs of administrating bTB Time TB1 TB2 TB3 TB4 TB5 TB6 TB7 TB8
Licence applications 2 10 4 5 4 8
Paperwork/meetings 16 10 6 30 8 19
Telephone calls 3 2 3 2 2 2
Total 21 22 13 0 37 14 19 10
Cost
Licence applications £24 £122 £49 £0 £63 £51 £0 £101
Paperwork/meetings £195 £122 £73 £0 £380 £101 £241 £0
Telephone calls £37 £24 £37 £0 £25 £25 £0 £25
Total £256 £268 £158 £0 £469 £177 £241 £127
In addition to the necessary administrative costs of bTB, some of the farmers engaged in additional voluntary activities, which while not necessary in terms of management nevertheless, provided farmers with an avenue to express how bTB had affected their farms. For example, two farmers had travelled to London to lobby parliament about bTB. Another had given three television and one radio interview to

35
publicise the difficulties farmers face in living with bTB. Others belonged to industry or support groups.
Table 13 shows the costs of voluntary activity relating to bTB. Clearly, there is a quite large variation between farms since some farmers had spent many more hours involved in voluntary action. However, every case study farm incurred some costs in excess of the time generated by this research, and this ranged from £73 for farm TB1 and £988 for farm TB6.
Table 13: Voluntary cost associated with bTB Time TB1 TB2 TB3 TB4 TB5 TB6 TB7 TB8
Paperwork 5 2 5 2 2
Telephone calls 3 2 1 1
Meetings 3 26 10 72 12 72 4 14
Total 6 33 10 75 12 78 6 16
Costs
Paperwork £0 £61 £0 £24 £0 £63 £25 £25
Telephone calls £37 £24 £0 £12 £0 £13 £0 £0
Meetings £37 £317 £122 £877 £152 £912 £51 £177
Total £73 £402 £122 £913 £152 £988 £76 £203
5.5 Cost of biosecurity measures
Most of the farms studied had implemented some form of biosecurity measure to reduce the incidence of bTB. Table 14 illustrates the type and costs of such measures. However, not all measures taken by farmers are included in the table because these either were implemented as part of wider farm improvements rather than specifically to reduce the potential incidence of bTB, or were not costed. For example, some farmers regarded the double fencing of farm boundaries as good practice since it can play a role in reducing the incidence of bTB, although other farmers were more sceptical. Only two farms implemented this on part of their farms as a direct measure to reduce the incidence of bTB. Furthermore, the majority of case study farms had herd health plans in place and routinely conducted pre-movement tests.
The most common measure implemented to raise the height of feed and water troughs, although not all farmers agreed that this would reduce infringements by wildlife. This was a relatively low cost measure. The most expensive measure implemented at £9,500 was the double fencing of a boundary field by TB7 while TB8 purchased a second hand feed secure metal container at £2,000 to ensure that wildlife had no direct access to bags of animal feed. Other costed measures included improving the facilities for the isolation of incoming cattle, and the use of strip fencing with a backing fence.

36
In the future, the most likely biosecurity measure would be the proofing of farm buildings against wildlife. Others included better sourcing of cattle, the raising of water troughs, making fields more wildlife proof and the isolation of reactors and inconclusive reactors.
Table 14: The type and costs of biosecurity measures that have been taken on farms to reduce the incidence of bTB
Biosecurity measures
Farm Fe
nce
off
iden
tifie
d w
ildlif
e ha
bita
ts,
wa
lkw
ays
, et
c.
Pro
of b
uild
ing
s, s
ilag
e c
lam
ps,
etc.
ag
ain
st w
ildlif
e
Ra
ise
he
ight
of
fee
d a
nd
wa
ter
tro
ughs
Use
str
ip g
razi
ng
with
bac
king
fe
nce
Re
duce
sto
ckin
g ra
te
Do
uble
fen
ce f
arm
bou
nda
rie
s
Isol
atio
n o
f Rea
ctor
s &
IR
s
Isol
atio
n o
f inc
omin
g c
attle
Sto
p s
pre
adi
ng s
lurr
y o
n gr
azin
g la
nd
Pre
-mo
vem
ent
te
stin
g
He
rd h
eal
th p
lan
(to
incl
ud
e so
urc
ing
of
cattl
e)
Sep
arat
e p
ers
on
ne
l for
se
pa
rate
uni
ts
Oth
er
All Costs
TB1 £195 £390 £100 £684 TB2 £500 £50 £550 TB3 £0 TB4 £150 £300 £450 TB5 £0 TB6 £0 TB7 £500 £240 £9,500 £10,240 TB8 £2,000 £2,000
5.6 Long term costs of bTB on business decisions
The impact that bTB has on business decision-making depends on the structure of the business, such as the number of enterprises on the farm, the relative proportion of cattle enterprises to the farm business as a whole or the level of indebtedness. Table 15 illustrates whether or not bTB has had any impact on various business decisions including increasing the business’ overdraft limit or taking out a loan to ease cash flow issues; the postponement or cancellation of investment or planned farm expansion; and the decision to diversify or not into other or new lines of business. All farms, with the exception of TB4, had found it necessary to alter their business decisions because of a bTB breakdown. TB4 on the other hand, had a special arrangement between the farm business and their holiday accommodation business that enabled one business to borrow against the other if cash flow became difficult. Without this facility, the farmer conceded that he would have increased his overdraft.
As a result of bTB, for half of the eight farms it had been necessary to increase the size of their overdrafts. However, such a strategy can be associated with additional difficulties in managing the farm business. In particular, if cash flow is dependent on autumn cattle sales, this can debilitate the farm’s daily existence, as this farmer explains:

37
“I can’t tell you how much its affected us … we normally have a crop of animals to sell towards the end of the autumn … we’ve actually kept them so we don’t have any … we’ve had to feed them. [Interviewer: And have you had to extend your overdraft?] “Hugely, hugely. And it’s constantly getting towards its upper limit and worrying. You thank God when someone sends you a cheque and you can get it in the bank. You know, it’s just hand to mouth, it’s absolutely hand to mouth.” (Interviewee TB8)
However, the impact can reach far beyond a farmer’s dependency on a particular sale. This small dairy farm illustrates the effects of bTB on the family as a whole because of breakdown:
“[Wife] We’re poor basically. [Husband] Yeah, we haven’t got any fun money. [Wife] Well there’s no money, full stop. We’ve had to up the overdraft significantly. There is no fun money last of all, but first of all there is none, there is very reduced income so our overdraft has increased … so I’ve had to borrow more from the bank because you haven’t got the milk sales. You are still paying off your loans but you are doing that with your overdraft. [Husband] And we are looking to diversify more. [Wife] Yeah, and you are looking away from farming for other sources of income because you just think well they’re not doing anything about it and we could be hit again … and if we are hit again, it will be even worse than it is now. And I’m dreading the bank manager visiting in June, because you don’t know what he’s going to say, do you. I mean, we are probably not … we didn’t lose as many as others, we haven’t been in the breakdown period as long as others but because you’ve got such a small herd you haven’t got the cushioning.” (Interviewee TB6)
Other farms, such as TB4 and TB7 point to an advantage in having a diversified business that enables cross subsidisation between businesses to ease any cash flow problems:
“But we are lucky, we’ve got the diversification, the bed and breakfast so we can absorb it a little bit where as some farmers haven’t got the opportunity for that” (Interviewee TB7)
Table 15: Impacts of bTB on business decisions TB1 TB2 TB3 TB4 TB5 TB6 TB7 TB8
Take out loan or increase overdraft to overcome losses/cash flow difficulties
Yes No No No No Yes Yes Yes
Cancel/postpone investment in stock, premises or equipment
No No Yes No Yes Yes Yes No
Cancel/postpone business expansion plans
Yes No Yes No Yes No Yes No
Diversify into other or new lines of business
Yes Yes No No No Yes No No
Three farms had either cancelled or postponed both farm investment and expansion plans. For example, TB5 (a large dairy farm) had an on-going expansion programme that: “is being held up by losing stock”. Another farm (TB1) had planned to expand the cattle side of his business and reduce his arable but as he put it: “because we had TB, it puts you off.”

38
Other farms still see the need for investment, despite having no capital to invest because of reduced income resulting from their bTB breakdowns:
“[Husband] But we’re going to have to build the slurry store and that’s another … [Wife] Well yes but that’s all regulatory stuff and … [Husband] Yeah but we’ll have to do it and it’ll take a lot longer … [Wife] Yeah it is. [Husband] … to be paid for” (Interviewee TB6)
“We have got planned expansion for the dairy equipment side which will increase our production. I wouldn’t say it’s been put on hold, and I’d even say we’ve got to do it more because we need to increase the income, but we haven’t got the money to do it so we are having to think how we can do it.” (Interviewee TB8)
Yet another farm, TB1 argued that despite having bTB for the best part of eight years, this had not stopped investment in the farm:
“I don’t suppose TB has stopped any investment that we would have done. We’ve never not bought land. Well it has affected the profit but yes but we’ve never not put a building up because we had TB. Not really.” ( Interviewee TB1)
These different reactions regarding investment and expansion illustrate that bTB may only be one of a range of influences on strategic decision-making that affect the direction in which the farm develops. In some cases, the change may be much more dramatic. As the following illustration shows, while TB2 was aware that his dairy enterprise did not have a longer-term future, the shock of his first and only bTB breakdown brought plans to cease milk production very much to the fore:
“It was instrumental in the decision to cease milk production. We had been considering doing so … basically we’ve got three daughters, two are now living at … and the third is at university so it was obvious that none of them were going to take the farm on, particularly take the dairy herd on anyway, so to a certain extent the writing was on the wall. You knew the day would come when some time or other. When we had TB as the first breakdown, losing so many animals was quite a considerable shock. We expected … we weren’t naïve enough to think you’d never get it but we thought that if you did get it you’d start off with maybe one or two reactors … that seems to be the way that most people do it but we lost 30 odd, you know, 22 reactors and 11 incons on the first. So after we had the second test and we lost another lot by that stage we’d pretty well made up our mind. We went on the proviso that we weren’t sure that we’d be able to sell the rest of the herd because obviously we were under … so we decided to see whether it was possible to sell the rest of the herd, whether anybody would be interested in them under restriction and what ever but it turned out that somebody in the same situation as us who’d lost quite a lot, he was looking for more cows and he was prepared to buy them so we decided to. It sort of pushed us into the decision probably a few years earlier than we would have taken it.” (Interviewee TB2)
In other cases, business strategies have been to develop or consider new enterprises to ensure that the business is more resilient any future bTB breakdown. Some of these are agricultural. For example, while under restriction TB7 shot the

39
male dairy calves, as they were unable to sell them. The stress of this process became emotionally difficult to tolerate and “my husband came in one day and said I can not shoot another animal.” Consequently, the decision was taken to begin a barley beef enterprise instead. Other business strategies to make the farm more resilient from bTB have been to diversify the income base of the household: TB6 indentified the possibility of a wind turbine to bring additional income:
“[Wife] Yeah we will be diversifying into something else. [Husband] We already have. [Wife] Yeah, we probably going to do a wind turbine because the grant money is there, Because it’s nothing to do with … it can’t get affected by disease.” (Interviewee TB6)
Even when a farm has been able to diversify, being under bTB restrictions may reduce the scope of the diversification that can take place. As this dialogue between a husband and wife farming partnership demonstrates, selling the dairy herd under bTB restrictions may have had a limiting effect:
“[Husband] No it has never stopped us diversifying because we had TB has it … [Wife] Well if you’d sold the herd and the quota and had the money you might have diversified. [Husband] Yeah, we might have done then. [Wife] It’s all ifs and buts. [Husband] Yes that was all to do with timing you see. I mean if milk prices had maintained its value when we sold the herd and we’d had a stack of money higher than the house the yeah we would have … if we hadn’t had TB we would have … had a huge chunk of money, a much bigger chunk of money to have done something with.” (Interviewee TB1)
The longer terms effects of farming under bTB restrictions are difficult to quantify accurately since business decisions are undertaken for a variety of reasons. While the disease may be a considerable influence, it is unlikely to be the only factor in the equation. Nevertheless, as the examples above have demonstrated, bTB frequently influences decision-making and in some instances acts as a ‘tipping point’ which precipitates change in the business.
6. Compensation payments, insurance claims and the total cost of bTB
6.1 Compensation payments
In February 2006, the present bTB compensation scheme was introduced, which is derived from sale data obtained from store markets, prime markets, rearing calf sales, breeding sales and dispersal sales in Great Britain, rather than individual animal valuations. Therefore, the compensation tables reflect past prices. In the case of non-pedigree animals, the prices are those over the recent past (approximately between two and six weeks before the monthly table is issued). The pedigree charts are however, over a longer period reflecting the prices paid over a period of six months before the monthly chart is issued. Figure 11 illustrates the trends in values for four of the compensation table categories: for both beef and dairy, calved cow (commercial) and calved 36 month (pedigree).

40
Figure 11: The value of Government compensation for bTB slaughtered animals between February 2006 to April 2010
£500
£1,000
£1,500
£2,000
£2,500
Feb-0
6
Apr-0
6
Jun-
06
Aug-0
6
Oct-06
Dec-0
6
Feb-0
7
Apr-0
7
Jun-
07
Aug-0
7
Oct-07
Dec-0
7
Feb-0
8
Apr-0
8
Jun-
08
Aug-0
8
Oct-08
Dec-0
8
Feb-0
9
Apr-0
9
Jun-
09
Aug-0
9
Oct-09
Dec-0
9
Feb-1
0
Apr-1
0
Jun-
10
Month (February 2006 to April 2010)
Val
ue o
f co
mpe
nsat
ion
Dairy Female - Calved Non-pedigree Dairy Female - Calved Pedigree Beef Non-pedigree Beef Pedigree Source: Defra (2010c)
The charts provide open and transparent values for cattle destroyed because of bTB, giving a farmer the knowledge of how much he or she is likely to receive. However, the values do not account for better than average quality of livestock or the loss of pedigree bloodlines. One farmer, not interviewed as part of the survey, provided data on compensation values illustrate the disparity between compensation rates and the value of livestock (see Table 16). The market or sale value of cattle will depend on a combination of circumstances including the quality and number of the cattle being sold, the prospective buyers, the location of the market or sale, and the time of year the cattle are sold, particularly for store cattle from upland farms.
As an example, at a recent sale at Sedgemoor Auction Centre 101 dairy cattle went under the hammer and the maximum price paid for a first quality dairy heifer was £2000. However, second quality dairy heifers made as little as £680. Similarly, the best quality dairy cow sold for £1840, whereas the minimum value paid for a second quality cow was £530. This illustration demonstrates the wide range of values that can be realised on a sale day. The difficulty of using the valuation chart based system is that it does not account for the margins of variability. Farmers that breed and manage high value stock (whether these are pedigree or not) are likely to be under compensated, whereas farmers with cattle perceived in the market place to be of lower than average quality) expressed in terms of price) are likely to be over compensated.
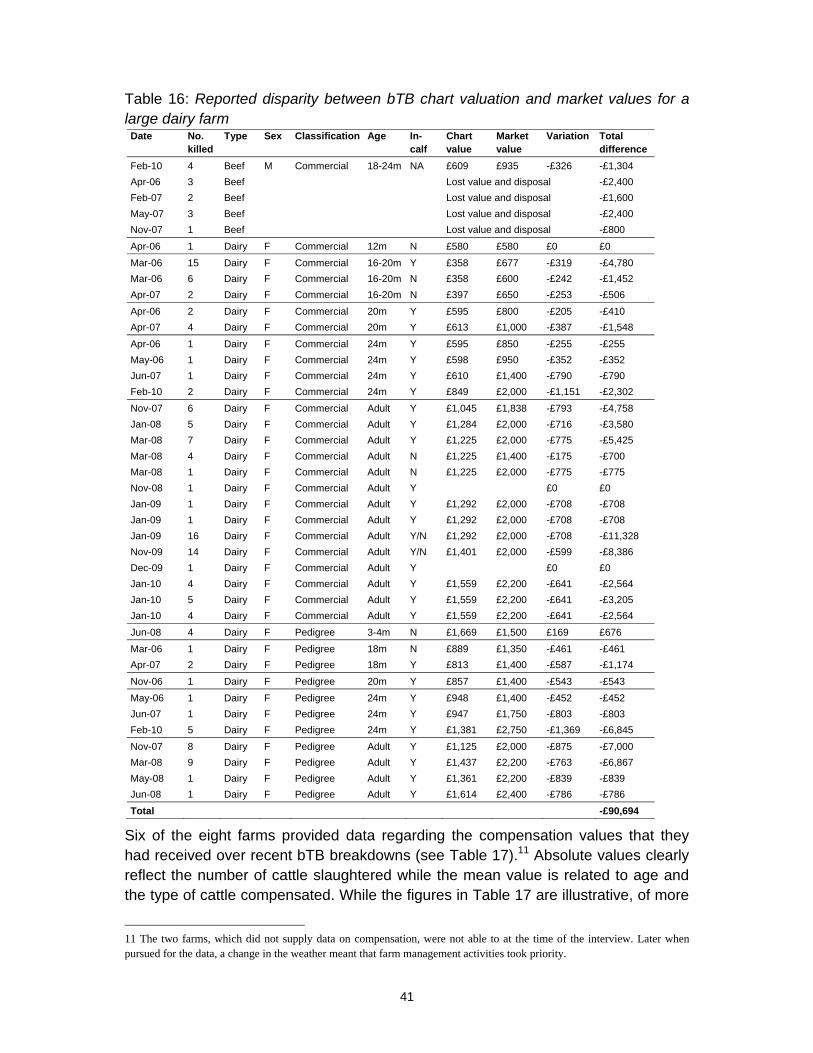
41
Table 16: Reported disparity between bTB chart valuation and market values for a large dairy farm
Date No. killed
Type Sex Classification Age In-calf
Chart value
Market value
Variation Total difference
Feb-10 4 Beef M Commercial 18-24m NA £609 £935 -£326 -£1,304
Apr-06 3 Beef Lost value and disposal -£2,400
Feb-07 2 Beef Lost value and disposal -£1,600
May-07 3 Beef Lost value and disposal -£2,400
Nov-07 1 Beef Lost value and disposal -£800
Apr-06 1 Dairy F Commercial 12m N £580 £580 £0 £0
Mar-06 15 Dairy F Commercial 16-20m Y £358 £677 -£319 -£4,780
Mar-06 6 Dairy F Commercial 16-20m N £358 £600 -£242 -£1,452
Apr-07 2 Dairy F Commercial 16-20m N £397 £650 -£253 -£506
Apr-06 2 Dairy F Commercial 20m Y £595 £800 -£205 -£410
Apr-07 4 Dairy F Commercial 20m Y £613 £1,000 -£387 -£1,548
Apr-06 1 Dairy F Commercial 24m Y £595 £850 -£255 -£255
May-06 1 Dairy F Commercial 24m Y £598 £950 -£352 -£352
Jun-07 1 Dairy F Commercial 24m Y £610 £1,400 -£790 -£790
Feb-10 2 Dairy F Commercial 24m Y £849 £2,000 -£1,151 -£2,302
Nov-07 6 Dairy F Commercial Adult Y £1,045 £1,838 -£793 -£4,758
Jan-08 5 Dairy F Commercial Adult Y £1,284 £2,000 -£716 -£3,580
Mar-08 7 Dairy F Commercial Adult Y £1,225 £2,000 -£775 -£5,425
Mar-08 4 Dairy F Commercial Adult N £1,225 £1,400 -£175 -£700
Mar-08 1 Dairy F Commercial Adult N £1,225 £2,000 -£775 -£775
Nov-08 1 Dairy F Commercial Adult Y £0 £0
Jan-09 1 Dairy F Commercial Adult Y £1,292 £2,000 -£708 -£708
Jan-09 1 Dairy F Commercial Adult Y £1,292 £2,000 -£708 -£708
Jan-09 16 Dairy F Commercial Adult Y/N £1,292 £2,000 -£708 -£11,328
Nov-09 14 Dairy F Commercial Adult Y/N £1,401 £2,000 -£599 -£8,386
Dec-09 1 Dairy F Commercial Adult Y £0 £0
Jan-10 4 Dairy F Commercial Adult Y £1,559 £2,200 -£641 -£2,564
Jan-10 5 Dairy F Commercial Adult Y £1,559 £2,200 -£641 -£3,205
Jan-10 4 Dairy F Commercial Adult Y £1,559 £2,200 -£641 -£2,564
Jun-08 4 Dairy F Pedigree 3-4m N £1,669 £1,500 £169 £676
Mar-06 1 Dairy F Pedigree 18m N £889 £1,350 -£461 -£461
Apr-07 2 Dairy F Pedigree 18m Y £813 £1,400 -£587 -£1,174
Nov-06 1 Dairy F Pedigree 20m Y £857 £1,400 -£543 -£543
May-06 1 Dairy F Pedigree 24m Y £948 £1,400 -£452 -£452
Jun-07 1 Dairy F Pedigree 24m Y £947 £1,750 -£803 -£803
Feb-10 5 Dairy F Pedigree 24m Y £1,381 £2,750 -£1,369 -£6,845
Nov-07 8 Dairy F Pedigree Adult Y £1,125 £2,000 -£875 -£7,000
Mar-08 9 Dairy F Pedigree Adult Y £1,437 £2,200 -£763 -£6,867
May-08 1 Dairy F Pedigree Adult Y £1,361 £2,200 -£839 -£839
Jun-08 1 Dairy F Pedigree Adult Y £1,614 £2,400 -£786 -£786
Total -£90,694
Six of the eight farms provided data regarding the compensation values that they had received over recent bTB breakdowns (see Table 17).11 Absolute values clearly reflect the number of cattle slaughtered while the mean value is related to age and the type of cattle compensated. While the figures in Table 17 are illustrative, of more
11 The two farms, which did not supply data on compensation, were not able to at the time of the interview. Later when pursued for the data, a change in the weather meant that farm management activities took priority.

42
interest are the perceived issues associated with the level of compensation payments particularly for pedigree cattle.
Table 17: Compensation values on case study farms
No. killed Compensation Average payment per reactor
TB2 55 £64,350 £1,170
TB3*† 12 £12,927 £1,077
TB4 1 £1,494 £1,494
TB5† 105 £126,784 £1,207
TB6 8 £11,352 £1,419
TB8 6 £8,445 £1,408
*Compensation over the previous twelve months †Some of the compensation payments are estimated because of insufficient information provided by farmers
The compensation for pedigree dairy and beef is regarded as particularly poor as this farmer argues:
“I’ve no idea how they work these tables out and it’s a con the way they work them out. Nobody knows how they are worked out.
It’s a farce really all of it because there’s no point in calling them pedigree when non-pedigree … you call them non-pedigree when they are pedigree because you get more money for non-pedigree cattle. So the only thing I’ll say about the compensation is that it’s inadequate and it’s farcical.” (Interviewee identity withheld)
Another farmer recognises how the compensation tables for pedigree stock can under estimate the value of cattle.
“Our problem is that we’re being paid an average price. If our stock were below average, we’d be making a benefit on that side. I don’t think it would be unfair to say that my stock are above average, considerably above average. Because they’re all beef calves … if I buy a calf in the market for a replacement they would generally recognise I’m double the average market price.” (Interviewee TB3)
It is likely, that both these farmers have high value stock and are disadvantaged by a system that offers averaged market/sale prices for cattle slaughtered. Furthermore, since pedigree data is collected over a much longer period (over the previous six months), any short-term trends in prices become diluted. The dilemma for pedigree dairy farms is illustrated in Figure 12. This shows the difference in value between a calved pedigree cow and a calved non-pedigree cow and illustrates the trend towards a reduction in the differential between the two types of cattle. If compensation for a pedigree dairy cow is below its commercial counterpart then it is understandable that farmers see the system as ‘inadequate’ and ‘farcical’ given the time spent in breeding specific bloodlines to improve the quality (and value) of their animals and their production performance. A similar problem may exist for organic farmers. TB8 argued that the Government compensation tables under estimates the ‘true value’ of organic cattle:
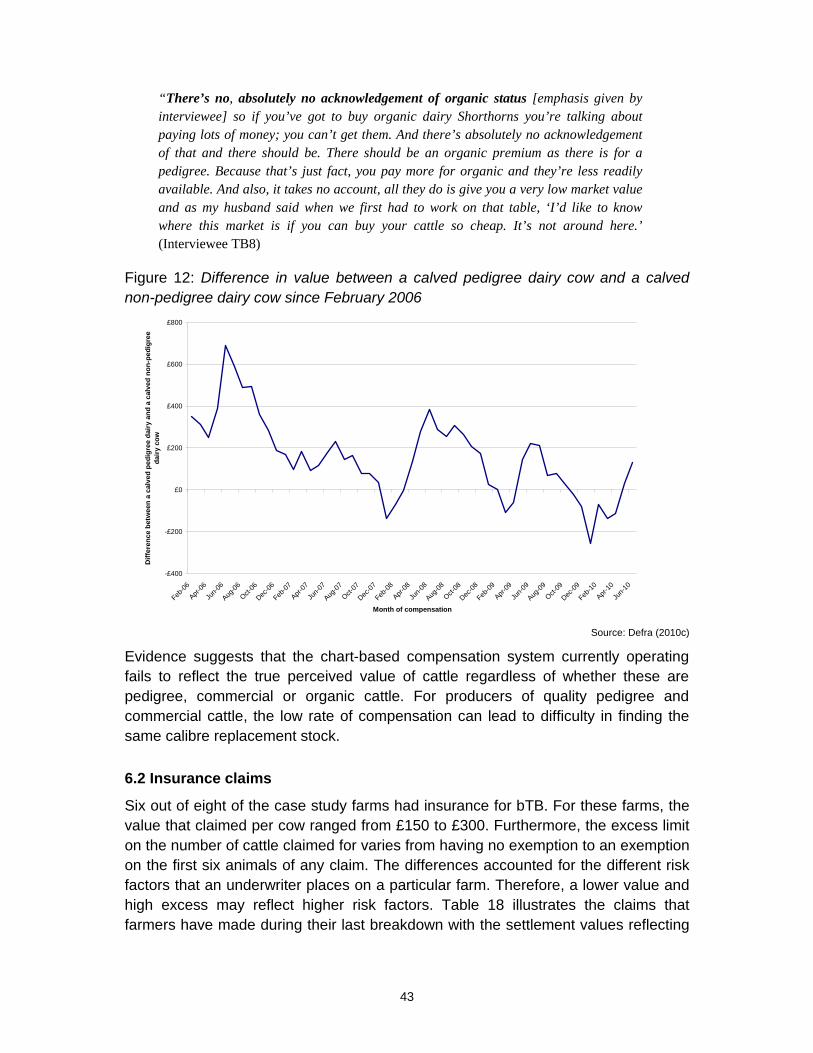
43
“There’s no, absolutely no acknowledgement of organic status [emphasis given by interviewee] so if you’ve got to buy organic dairy Shorthorns you’re talking about paying lots of money; you can’t get them. And there’s absolutely no acknowledgement of that and there should be. There should be an organic premium as there is for a pedigree. Because that’s just fact, you pay more for organic and they’re less readily available. And also, it takes no account, all they do is give you a very low market value and as my husband said when we first had to work on that table, ‘I’d like to know where this market is if you can buy your cattle so cheap. It’s not around here.’ (Interviewee TB8)
Figure 12: Difference in value between a calved pedigree dairy cow and a calved non-pedigree dairy cow since February 2006
-£400
-£200
£0
£200
£400
£600
£800
Feb-0
6
Apr-0
6
Jun-
06
Aug-0
6
Oct-06
Dec-0
6
Feb-0
7
Apr-0
7
Jun-
07
Aug-0
7
Oct-07
Dec-0
7
Feb-0
8
Apr-0
8
Jun-
08
Aug-0
8
Oct-08
Dec-0
8
Feb-0
9
Apr-0
9
Jun-
09
Aug-0
9
Oct-09
Dec-0
9
Feb-1
0
Apr-1
0
Jun-
10
Month of compensation
Dif
fere
nce
bet
we
en a
cal
ved
pe
dig
ree
da
iry
an
d a
cal
ved
no
n-p
ed
igre
e d
air
y co
w
Source: Defra (2010c)
Evidence suggests that the chart-based compensation system currently operating fails to reflect the true perceived value of cattle regardless of whether these are pedigree, commercial or organic cattle. For producers of quality pedigree and commercial cattle, the low rate of compensation can lead to difficulty in finding the same calibre replacement stock.
6.2 Insurance claims
Six out of eight of the case study farms had insurance for bTB. For these farms, the value that claimed per cow ranged from £150 to £300. Furthermore, the excess limit on the number of cattle claimed for varies from having no exemption to an exemption on the first six animals of any claim. The differences accounted for the different risk factors that an underwriter places on a particular farm. Therefore, a lower value and high excess may reflect higher risk factors. Table 18 illustrates the claims that farmers have made during their last breakdown with the settlement values reflecting

44
these factors and the total number of animals on the claim. Only one insured farm did not claim on his losses as he argued:
“It’s there if we have a major breakdown, that’s why I got it. Individual one or twos, I don’t actually claim for but if I had 20 cows go but then it will have to kick in.” (Interviewee TB4)
Of the two farms that did not have insurance for bTB breakdowns, one argued that it was better to try to manage risks, but recognised that this is difficult against bTB.
“Our premiums would be huge as we’re in a TB hotspot. Generally with insurance they like to insure you against things that are generally never going to happen so as long as you’ve take reasonable precautions to make sure they don’t happen and they make a margin on top of it as well. They have to cover their costs, their living. So generally insurances is, if well we’ve taken the view to try and manage it yourself but in this case it is a bit trick isn’t it? ” (Interviewee TB6)
Table 18: Insurance claims for lost stock
Insured Claimed in last breakdown
Value per cow Present excess Total value received
TB1 Yes £150 1st 2 animals exempt (Not known)
TB2 Yes £150 1st 6 animals exempt £8,250
TB3 No
TB4 Yes £150 £0 (not claimed)
TB5* Yes £200 1st 2 animals exempt £14,600
TB6 No
TB7* Yes £300 None £18,300
TB8 Yes £300 1st 2 animals exempt £1,200
*The total value received is estimated from other data given in the interview.
6.3 Estimating the total cost of bTB to farms
Table 19 estimates the total costs to the case study farms of a bTB breakdown. For some of these farms, these breakdowns are on going and therefore the cost of the breakdown is likely to increase. While it would have been ideal to only study farms that were not presently under movement bTB restrictions, this was not possible because of the limited number of initial contacts. Therefore, to enable some comparability between the case study farms, Table 19 not only presents the main costs but also illustrates the monthly losses. However, these should be considered a minimum since it is likely that not all costs have been captured, such as losses from increased mastitis, lameness or abortions.
The total costs in our research range from £7,549 to £192,324. Unfortunately, it is not possible to directly compare this research with that of Sheppard and Turner (2005) although Table 20 replicates their research findings.
The monthly loss of a bTB breakdown ranges from £505 to nearly £3,184. Table 19 also illustrates the average cost of bTB breakdown across the eight case study farms. Clearly, there are many different factors that account for the range in losses

45
including the type of farm, the scale of operation, restocking policy, area farmed, number of holdings away from the farmstead, the marketing of livestock and livestock produce and by how much this is restricted. In general, but not exclusively, dairy farms tend to accrue the greatest losses during a bTB breakdown. Furthermore, farms with pedigree cattle tend to incur higher losses, particularly if their stock value is above average. For example, the dairy herd of TB5 is in the top 1% of its breed and therefore this farm has been penalised more heavily by the compensation tables that do not recognise the time and effort that goes into breeding high value and quality livestock.

46
Table 19: The total cost of bTB to the study farms TB1 TB2 TB3 TB4 TB5 TB6 TB7 TB8 Average
Costs of testing £9,485 £1,778 £4,980 £2,964 £9,122 £1,710 £6,969 £2,623 £4,954
Costs of movement restrictions £0 £7,699 £3,539 £3,198 £55,477 £0 £11,190 £3,275 £10,547
Restocking costs £43 £561 £252 £0 £40,985 £7,943 £0 £0 £6,223
Administrative costs £329 £670 £280 £913 £621 £1,166 £317 £329 £578
Milk production costs £0 £68,600 £0 £0 £86,118 £14,542 £56,364 £7,963 £29,198
Other costs £5,724 £550 £24,709 £474 £0 £1,989 £14,755 £2,000 £6,275
Total costs £15,581 £79,858 £33,759 £7,549 £192,324 £27,351 £89,594 £16,189 £57,776
Compensation £0 £64,350 £12,927 £1,494 £126,784 £11,352 £0 £8,445 £28,169
Insurance £0 £8,250 £0 £0 £14,600 £0 £22,800 £1,200 £5,856
Total Compensation & Insurance £72,600 £12,927 £1,494 £141,384 £11,352 £22,800 £9,645 £38,886
Total loss over breakdown £7,258 £20,832 £6,055 £50,940 £15,999 £66,794 £6,544 £24,917
Total monthly loss £907 £2,083 £505 £3,184 £1,333 £3,036 £1,091 £1,734
Table 20: Findings from Sheppard and Turner on the costs of bTB in 2005 on the impact on farm income of a bTB breakdown (p.24)
Type of farm (number of farms) Breakdown costs Compensation Net gain Duration of breakdown
Dairy farm (37) £11,603 £19,302 £7,699 0.7 years
Non-pedigree dairy farms (28) £6,984 £8,506 £1,522 0.6 years
Pedigree dairy farms (8) £28,520 £57,884 £29,364 1.1 years
Upland beef farms (8) £8,186 £12,778 £4,592 0.9 years
Lowland beef farms (13) £2,757 £4,817 £2,226 0.7 years
Source: Sheppard and Turner (2005)

47
7. The social impacts of bTB on farming families and their communities
The social impacts of bTB on farming families and their communities manifest themselves in many ways. In this research, the analysis of eight case study farms is likely to only touch on some of the difficulties that farming families face. Nevertheless, it does provide a window on to some of the key social impacts. In particular, the case studies exemplify the stress and upset that the disease can bring to the farming industry. For example, TB4 illustrates how with bTB the way a farm operates changes significantly, while TB7 highlights the additional workload that movement restrictions bring:
“At the moment I’m clear of TB so I’m quite … I’m fine. It’s if you’re under restriction you are purely thinking TB. There’s no other … you can’t think of anything else. You can’t trade, trying to think of a way of getting out of the problem of TB. How you are going to try and manage the stock.” (Interviewee TB4).
“[Husband] Well it’s the extra work load; the worry of where you’re going to find the money to feed the extra cattle and that sort of thing. The stress is bloody horrific. And trying to get round to doing them out all winter. We kept 48 all winter and it was a bloody mess.” (Interviewee TB8)
Alongside such management difficulties are the feelings of helplessness against the disease:
“Everyday because you’re losing stock so management decisions are being made because of TB and not to manage the farm, so when you’ve got a chunk of animals taken out. All other disease we manage it, with TB we’re not allowed to. It’s mastitis, lameness, it’s all about prevention, you just don’t keep treating it; you manage the cause. Whereas with TB you just keep taking stock out; it’s an unmanaged disease which we can’t control.” (Interviewee TB5)
“It’s very frustrating because it limits your ability to do things I suppose on the farm … It’s not like you can go out there and deal with the source put it that way. You are expected to stand there and let it ravage your business and nobody is doing anything. And I think that just makes you very angry.” (Interviewee TB6)
Furthermore, watching cattle slaughtered as a ‘bystander’ is deeply upsetting for many farmers and their families, for whom breeding cattle is more than a business:
“Cattle breeding, pedigree breeding is bit of a … it’s more than a hobby … Yeah but it’s a gut feeling when you’re seeing good cattle go and you’re not able to do much about it; it hurts. When you see 18 good prime cattle being herded in the yard to be shot on the farm; it hurts.” (Interviewee TB3)
“Yes, it’s made me miserable. It’s made me miserable; it’s made me wonder why we do it. And it’s made me very sad that we’ve lost these lovely animals. But it’s made me cross.” (Interviewee TB6)
48
“It obviously affected [his wife] because we’re a husband and wife partnership etc. and she had to deal with the same sort of things which … we both had to pick the cows out and send them off for slaughter or whatever. With regard to the girls is probably wasn’t as much as an impact on them because none of them actually work here and if they’d been younger I would have said it would have had more of an effect.” (Interviewee TB2)
The strains and stress that this can place the farming family under can be considerable, particularly for the principal farmer:
“It does affect us in that we’re a bit ratty really with ourselves. You know, I’m not nice to live with if I’m … a pre pre-movement test I’m not nice to live with. For .... I’m just worried with the consequences” (Interviewee TB4)
“You can’t describe it. The main stress, the main person that is stressed is [her husband] and because he is stressed we’re all affected by it. We all hate it when anything happens to the animals.” (Interviewee TB8)
“Yes it has because you’re not exactly in the best of moods.” (Interviewee TB5)
Although the loss of cattle is understandably upsetting, some farmers adopt a more ‘philosophical’ approach. For example, TB7 recognise the strain that being under bTB puts on them personally but since members of the family have had their own personal health scares, they are less inward looking, suggesting that “there is always somebody worse off”. Whereas TB1, a farm that has been under bTB restrictions for much of the period between 2002 and 2010, understands the difficulties that some farmers have but personally tries not to be affected by the effects of the disease:
“I don’t get anxious thinking there’s going to be masses of reactors or anything like that; I just take it as it comes. But I wouldn’t say you’ve got a cloud over you you’re … there was a time you were embarrassed to say ‘I’m under TB restrictions which you aren’t so proud of that for somebody who’s not. But you get used to it then obviously.” (Interviewee TB1)
It is not only the farmer and his family that can feel the effects of bTB but also employees of the farm. TB1 had nothing but praise for his staff and the understanding that had prevailed over the long period that the farm had been under movement restrictions. However, TB5 noted how the disease had led to “low staff morale” since they had as much contact with the cattle as the farmer and this sentiment was echoed by TB3:
“They [the employees] are involved with them as well and they’re not happy about it. How much sleep they lose at night I don’t know but it doesn’t help.” (Interviewee TB3)

49
The greatest social impact on employees occurred on TB2. As this farm gave up milk production to concentrate on heifer rearing, the farmer had no choice but to release two of his staff:
“I disposed of two of the relief milkers and one guy that still helps me he’s obviously drastically slashed his income.” (Interviewee TB2)
Finally, there was a mixed reaction from the case studies as to whether bTB affects the wider rural community. Most interviewees regarded the wider farming community to be supportive, although this was not universal with TB8 reporting that suspicion amongst graziers of common land occurs if one or other of them go down with the disease. In the wider non-farming community, as might be expected given that they encounter the consequences of the disease relatively infrequently, there is less understanding, as TB2 highlights:
“On the farming community, yes. One the wider community … the actual farming specific you know, the hands on that have to do the work and deal with the consequences then yes it does have a massive impact, you know we’re a rural community, village community, on the wider community probably no. There is a lot of sympathy for you or whatever but aside from that then no not really.” (Interviewee TB2)
TB4 argued that understanding from the wider non-farming community only came if a farmer spoke with them and made them aware of the consequences of the disease. This point was powerfully illustrated by TB7 in relating a story about a television reporter that came on to her farm.
“The TV people came out to one of our pens and like it or not, we called it, at the end of the day it was called ‘death row’ because that’s where they were. And of course this TV chap came out and he said [can I see some cows] I didn’t think about it and I said I’ll take them up to death row. And he [the TV reporter] said that I hadn’t thought about it like that. And I said, well if they’re in that pen now there’s only one way they’re going. Coz he walked up round and saw them and he had a hell of a job to do ... he had a hell of a job, he was breaking down and everything ... and the [the cows] did look in their prime and they were quiet and were coming up and licking him. He just couldn’t, he could not believe that these animals [would be slaughtered] and I said to him that most of them have got a calf inside them. And he said, they’re going to kill them! When she gets shot there’s only one thing that happen to that calf. And he said, what happens? Well it suffocates in the end because there’s no oxygen for them ... He said I can’t believe this and I said yes, this is what people don’t see.” (Interviewee TB7)
The main emphasis of this report has been on the economic impact of bTB but as this section has shown, there is a range of wider impacts on the well-being of farmers and their families. Some of these may have economic implications. They certainly illustrate the personal cost of coping with bTB.

50
8. Wider economic impacts of TB on the rural economy
In order to understand some of the impacts of bTB on the wider economy, key individuals within organisations that support farm businesses were asked to comment on the implications of bTB for their organisation and the wider sector.
8.1. An auctioneer’s perspective
In general, the affect on this particular auctioneer’s business had been negative. The change from valuers’ estimates of cattle for compensation to the chart based system has resulted in an estimated annual loss of between £8,000 and £10,000 on his business. Under the old system, the cattle were valued prior to slaughter and, in some areas, this would employ two valuers. However, “stupid practices” by some valuers lead to this system being stopped. These valuers are alleged to have over-estimated the worth of the cattle. However, the auctioneer, while critical of his own industry’s practices, was also critical of the new system, citing how the chart system values paid to farmers tended to be less than an animals true value. For example, “the chart would value a calved heifer at £1,100 whereas the cost of replacement would be £1,500. It is only in this last month or so [April/May 2010] there has been convergence between the chart system and market values.”
A further difficulty for the auctioneer’s business was that pre-movement testing had caused problems with special sales. Where previously sales of 900-1000 cattle would occur at the market, since every animal is required to have a bTB test, this places stress on the animals. Therefore, instead of these large sales, farmers instead sell 100 per week as a measure to reduce their risk. This has led to uncertain income for the auctioneer since sales are spread across weeks rather than over a day.
A further issue cited by the auctioneer was that of trust. One farmer that conducts a pre-movement test that proves negative may sell his animals through the market. If another test on a vendor’s farm a week or two after the sale results in a reactor, the previous sales are traced and buyers are informed of the test results. The buyer blames the market. This has resulted in lost clients because it is perceived that there is too much risk in buying at markets. Therefore, trade from outside the area where bTB is less prevalent has fallen, with fewer farmers from outside the area wanting the potential problems of buying cattle from bTB areas.
While the problems of bTB have not directly led to market closures, it has been a contributory factor in some cases. In the South West, there has been a consolidation in livestock markets. For example, Chippenham Market was closed due to the council selling the land for development.12 Yeovil market, on 12 Although the market closed in Chippenham, it was moved to Bristol but this market closed after the proprietor refused to sign a lease agreement.

51
the other hand, closed because of combination of Blue Tongue and difficulties caused by bTB. This means that farmers in these areas are required to travel further to market to sell the cattle (and other livestock).
8.2. A vet’s perspective
The veterinary practice derives 75% of its income from the treatment of farm animals. Since 50% of this revenue was from fees for bTB testing, 37.5% of total income is from this source. As such, the practice is able to support 16 to 17 large animal vets. The vet freely acknowledged that his practice has benefited from the earned income but also admitted that given a choice, he would prefer to practice without bTB. Indeed, his frustration was clear:
“You train to be a vet but end up spending half your time on mundane tasks focused around one disease.”
However, the cost of this would be the loss of employment for half the large animal vets. Furthermore, should bTB be eradicated the ability to provide out of hours cover, particularly at night, would be compromised, thus reducing the level of service provided to farmers.
Equally, the regime of testing for bTB also detracted from the level of service the veterinary practice offered. This was illustrated by two examples. The first regarded the employment of a vet solely employed to test cattle for bTB to enable other vets in the practice to reduce the days they spent on testing thereby enabling them to focus on other clinical work. The second regarded attempts to develop a mastitis control programme.
“We sent a vet to develop the skills to develop a mastitis control programme and they came back full of enthusiasm and energy. But because of bTB pressures that person has only been to a very few farms in over a year. Instead, a farmer may phone up and say he has a high cell count and this is an opportunity to get involved and spend time with the farm and go in depth to understand why that herd has developed a mastitis problem. However, we say try this tube or that tube. The problem is that we are in a position of stable income [from bTB testing] but we are not out there generating new work”.
8.3. An insurer’s perspective
This insurer insures 70% of the farming community.
Bovine TB has caused this insurer difficulties in terms of its loss ratio. Four to five years ago, the loss ratio was in excess of 200%. That is, for bTB claims, twice the income was being paid out to clients as was being collected in premiums. To rectify this situation, the insurer had a choice of raising the premium for all farmers or increasing the excess to farmers that had made previous claims for losses from bTB. The latter course of action was taken and the loss ratio has been reduced to 80-90% which, once expenses have

52
been taken into account, means that providing insurance against the incidence of bTB is still a loss making activity for the insurer.
The number of claims for bTB however must be seen in context of this insurer’s business as a whole. Of the approximate 5,000 claims in the South West in 2009, half were for vehicle accidents, while the number of claims for bTB was much smaller in comparison. Therefore, the impact on the 130-140 staff employed in the South West office of the insurer has been minimal.
Initially, a farmer that has not had an outbreak of bTB will have some flexibility in the level of excess and compensation that he or she may wish to take out, and this will be reflected in the premium price. However, the level of cover will be assessed on a whole business basis rather than just insuring against bTB. If a farmer has already a number of claims for bTB, the insurer will assess the risks on a farm of further outbreaks of bTB and will offer the farmer insurance but with different conditions, such as different rates or a different excess policy such as cover over three or four animals with bTB. This prevents claims for one or two animals. It then becomes the choice of the farmer to weigh the premium against the risks. The insurer suggests that, in most cases, farmers are good risk managers, looking at the benefits of cover against the risks of incurring losses from bTB. However, it is important that a farmer understands the cover that is being offered and to be able to do this, it is necessary that insurer’s sale agents provide good advice.
While a farmer may be a good risk manager, the insurer does concede that farmers are not always happy with the revised terms and conditions, and may see increased premiums or a greater excess imposed when making a new claim. However, the alternative of offering the same terms and conditions would increase premiums to farmers not affected by bTB. Therefore, in terms of fairness, it is inevitable that increased premiums or more stringent terms and conditions will occur for farms that have already claimed for bTB. A consequence of farmers’ dissatisfaction is that relationships between farmers and the insurers’ sales staff, particularly in areas where bTB hotspots occur may be difficult and stressful.
8.4. An advisor’s perspective
This individual is the managing director of an advisory firm that provides market research and advice to the dairy industry. The impact of bTB on his business was not significant but as it is a business providing information and guidance to dairy farmers it had influenced the advisory work that they do. In a positive manner, the business has been viewed as a reliable source of information and support, as it was during foot and mouth.

53
8.5. A summary of the impact of bTB on wider economy
The perspectives offered by interviewees of businesses associated with agriculture that have experience of bTB suggest that the disease has had both costs but also has offered opportunities. However, where opportunities have arisen these are often identified as being in conflict with the wider aspirations of business development. For example, while the vets may benefit from increased trade they recognise that this is at the cost of developing better animal health programmes alongside farmers.
In addition, knowledge from businesses in the wider economy support farmers’ experiences regarding difficulties in sourcing good quality livestock in the South West, the inadequacies of the compensation system in reflecting the different qualities of breeding stock, and the consequences of the disease on farm animal health programmes. The comments of the advisor echoed the problems that farmers have with compensation in particular:
“The lack of effective action against the disease leaves farmers feeling very isolated and vulnerable. While financial compensation softens the blow it cannot lessen the devastating effect of losing generations of breeding.” (Advisor)
This quote also reinforces the point that the cost of bTB to farmers needs to be seen beyond strict economic costs but also in terms personal costs to the farming family.
9. Summary and Conclusions
bTB continues to pose a significant challenge to dairy and beef farmers, particularly in South West England. In 2009 there were 7,449 herds subject to movement restrictions in Great Britain because of bTB. Of these, 52% occurred in South West England and 20% were in Devon alone. There is no simple solution to the control of the disease and the debate has become increasingly polarised and politicised (RELU, 2010). Leaving aside the discussion about causes and control, the research reported here presents a rich and detailed study of the costs of bTB on eight farms across the South West, supplemented by additional interviews with stakeholders from allied sectors. In order to assess the economic impact of bTB, costs (and income) have been divided into various categories including the cost of bTB testing; the cost of movement restrictions; costs of restocking; longer term costs, compensation and insurance payments; and personal and social costs to the farmer and his family.
9.1 The economic cost of bTB at the farm level
Analysis of the case study farms demonstrated that the cost differentiation between administering and reading the intradermal tuberculin (skin) test is minimal. The approximate cost per animal over each test and the breakdown

54
period varied considerably however. For example, the lowest was £1.36 and the highest was £6.10, although most were between £1.95 and £2.97 per animal. In terms of enterprises, there were no discernible differences between beef and dairy farms. However, there are also a range of indirect and often ‘hidden’ costs associated with testing such as the knock-on impacts on other activities (e.g. delays to silage making), impacts on milk production (although not all farmers experience this), behavioural difficulties in cattle and additional fuel and other costs feed costs. Such costs are not covered by current compensation.
In addition to the direct costs of testing, movement restrictions impose a range of additional costs. The costs of keeping additional stock on the farm accrue in additional costs in extra bedding, feed and labour to keep stock. The inability to move stock off-farm (or around a farm for those businesses composed of more than one holding) create a significantly increased work load and may be associated with problems of over-stocking and unintentional breaches of organic certification and cross-compliance regulations. As with the costs of testing, the costs of movement restrictions reflect the individual characteristics of particular farm business, the spatial configuration of the land holdings, the specific features of the farm enterprises, etc, suggesting that average figures can mask much of the complexity of cost assessment.
The present bTB compensation scheme, introduced in February 2006, is derived from sale data obtained from store markets, prime markets, rearing calf sales, breeding sales and dispersal sales in Great Britain, rather than individual animal valuations. As such, farmers that breed and manage high value stock (whether these are pedigree or not) are likely to be under compensated, whereas farmers with cattle perceived in the market place to lower than average (as expressed in terms of price) are likely to be over compensated. Evidence from the case study farms suggested that the chart-based compensation system currently operating fails to reflect the perceived value of cattle, regardless of whether these are pedigree, commercial or organic. One farmer described it as ‘inadequate’ and ‘farcical’ given the time spent in breeding specific bloodlines to improve the quality and value of animals and their production performance. Consequently, for producers of quality pedigree and commercial cattle, the low rate of compensation can lead to difficulty in finding the same calibre replacement stock.
The costs associated with replacing stock also vary considerably, and the practicalities of replacing stock can have wider impacts on herd management and the farm business. The costs of sourcing replacement stock include labour time taken to source cattle, the cost of travelling to see stock, and the costs of haulage once the cattle are bought. Restocking a farm may in part depend on the amount of compensation received. There are however, also ‘hidden’ costs. Due to the variability of compensation payments and the mismatch between compensation payments and market values, not all farms

55
can afford to replace all cattle slaughtered. In turn, this can be associated with a significant loss of revenue from reduced milk sales. Some farms have chosen to maintain a closed herd and breed their own replacements. Again, this can be associated with a significant loss of milk revenue.
There are numerous longer-term costs of bTB that impact upon the farm business. Some are directly related to dealing with the demands of the disease, such as additional paperwork or financing biosecurity measures, while others are structural, including the extension of overdrafts or the postponement of capital investment for farm development. However, the longer terms effects of farming under bTB restrictions are difficult to quantify accurately since business decisions are undertaken for a variety of reasons. While the disease may a considerable influence, it is unlikely to be the only factor in the equation. Nevertheless, this report demonstrates that bTB frequently influences decision-making and in some instances acts as a ‘tipping point’ which precipitates change in the business.
9.2 The total economic cost of bTB on case study farms
The monthly loss of a bTB breakdown amongst the case study farms ranges from just under £505 to nearly £3,184. Clearly, this is influenced by a number of factors (see below), including the number of animals involved. These costs are likely to be an underestimate due to undisclosed and unquantified costs. Many different factors that account for the range in losses including the type of farm, the scale of operation, restocking policy, area farmed, number of holdings away from the farmstead, the marketing of livestock and livestock produce and by how much this is restricted. In general, but not exclusively, dairy farms tend to accrue the greatest losses during a bTB breakdown. Farms with pedigree cattle also tend to incur high losses, particularly if their stock is above average in terms of quality (as expressed by market prices).
9.3 Personal and social costs
Although the focus of this study has been on economic impacts, it has illustrated the stress and upset that the disease can bring to the farming industry through illuminating how bTB can impact on the way a farm operates and the additional workload that movement restrictions bring. In addition, interviewees have expressed feelings of helplessness in the management of the disease, with farmers feeling like ‘bystanders’, which is deeply upsetting for many farmers and their families, for whom breeding cattle is more than just a business.
9.4 The impact of bTB on wider economy
The perspectives offered by interviewees from businesses associated with agriculture that have experience of bTB suggest that the diseases has had costs but has also offered opportunities. However, where opportunities have

56
arisen, these are often identified as being in conflict with the wider aspirations of business development. For example, while the vets may benefit from increased trade they recognise that this is at the cost of developing better animal health programmes alongside farmers. In addition, knowledge from businesses in the wider economy support farmers’ experiences regarding difficulties in sourcing good quality livestock in the South West, the inadequacies of the compensation system, and the consequences of the disease on farm animal health programmes.
9.5 Conclusion
Given the limited number of farms studied, it is not appropriate to extrapolate the costs identified to all farms with bTB in the region. The case study approach employed in this research provides detailed qualitative analysis and quantitative data about the farms surveyed. In doing so it highlights the variability in costs and compensation that average figures often obscure. However, the analysis does have its limitations and to be able to estimate total costs to farmers across the South West of England would require a much larger survey, which was beyond the resources of this project.
Leaving aside the heated debate about appropriate means for controlling the incidence and geographical spread of bTB, this report has shown that current compensation payments tend not to fully compensate farmers for their direct and indirect economic losses. The research undertaken for this report has revealed considerable variation across a range of different types of costs associated with bTB. Consequently average figures, either for costs or calculating compensation, obscure much of the detail at an individual farm level. The research also points to a range of ‘hidden’ and longer term costs that fall beyond the scope of the compensation scheme. Finally, in addition to economic losses, bTB is imposing considerable costs on the personal well-being of many farm households and also raises profound livestock welfare issues.

57
References
ABC (2009). The Agricultural Budgeting and Costing Book (68th Edition) ABC, Melton Mowbray.
Callwood, S. (2006). Identifying the Cost of Unpaid Family Labour on Cattle and Sheep Farms. Promar International, Tarporley, Cheshire.
Defra (2010a). Breakdown of bovine TB expenditure from the England bTB Programme budget. Defra, London. http://www.defra.gov.uk/foodfarm/farmanimal/diseases/atoz/tb/documents/ expenditure-stats.pdf
Defra (2010b). Detailed TB statistics. Defra, London.
Defra (2010c). Compensation for Bovine TB, Brucellosis And Enzootic Bovine Leukosis. Defra. http.://www.defra.gov.uk/evidence/statistics/foodfarm/farmgate/commodity/documents/tbcompweb.xls
Gerring, J. (2007) Case Study Research: Principles and Practices. Cambridge University Press, Cambridge.
Ilbery, B. and Maye, D. (2010a) Agricultural restructuring and changing food networks in the UK. In: Coe, N. and Jones, A. (eds) Reading the economy: the UK in the 21st century. Sage, London, forthcoming.
Ilbery, B. and Maye, D. (2010b) Clustering and the spatial distribution of organic farming in England and Wales, Area DOI: 10.1111/j.1475-4762.2010.00953.x.
Ilbery, B., Holloway L., and Arber, R. (1999) The Geography of Organic Farming in England and Wales in the 1990s. Tijdschrift voor Economische en Sociale Geografie 90, 285–295
Ilbery, B., Maye, D., Watts, D. and Holloway, L. (2010) Property matters. Agricultural restructuring and changing landlord-tenant relationships in England. Geoforum, 41, 423-434.
RABDF (2008). Identifying the True Costs of Farmers Own Labour. Royal Association of British Dairy Farmers, Kenilworth, Warwickshire.
RELU (2010) Bovine tuberculosis: a problem for farmers, conservationists and policymakers. RELU Policy and Practice Note 19.
Sheppard, A. and Turner, M. (2005). An Economic Impact Assessment of Bovine Tuberculosis in South West England, Centre for Rural Research, University of Exeter.

58