Embed Size (px)
Citation preview

CALFRAC WELL SERVICES LTD. 2016 Barclays CEO Energy-Power Conference
TSX:CFW

Certain information contained within this presentation and statements made in conjunction with this presentation constitute forward-looking statements. These statements relate to future events or the future performance of the Company. All statements other than statements of historical fact may be forward-looking statements. Forward-looking statements are often, but not always, identified by the use of words such as “seek”, “anticipate,” “plan”, “continue”, “estimate”, “expect”, “may”, “will”, “project”, “predict”, “potential”, “targeting”, “intend”, “could”, “might”, “should”, “believe”, “forecast”, “can” and similar expressions. In particular, forward-looking statements in this presentation include, but are not limited to, statements with respect to future capital expenditures, future financial resources, anticipated equipment utilization levels, future oil and gas well activity, projections of market prices and costs, outcomes of specific events and trends in the oil and gas industry.
The forward-looking statements within this presentation and made in conjunction with this presentation are derived from certain assumptions and analyses made by the Company based on its experience and perception of historical trends, current conditions, expected future developments and other factors that it believes are appropriate in the circumstances, including assumptions and analyses relating to: the economic and political environment in which the Company operates; the Company’s expectations for its customers’ capital budgets and geographical areas of focus; the effect unconventional oil and gas projects have had on supply and demand fundamentals for oil and natural gas; the Company’s existing contracts and the status of current negotiations with key customers and suppliers; the effectiveness of cost reduction measures instituted by the Company; and the likelihood that the current tax and regulatory regime will remain substantially unchanged. Forward-looking statements are subject to a number of known and unknown risks and uncertainties that could cause actual results to differ materially from the Company’s expectations. Such risks and uncertainties include the items discussed under the heading “Business Risks” in the Company’s 2015 Annual Report and under the heading “Risk Factors” in the Company’s most recently filed Annual Information Form. Consequently, all of the forward-looking statements contained within this presentation and made in conjunction with this presentation are qualified by these cautionary statements and there can be no assurance that actual results or events anticipated by the Company will be realized or that they will have the expected consequences or effects on the Company or its business or operations.
Other than as required by applicable securities laws, the Company assumes no obligation to update publicly any such forward-looking statements, whether as a result of new information, future events or otherwise.
Forward Looking Statement
© Calfrac Well Services Ltd. 2

© Calfrac Well Services Ltd. 3
Company Snapshot
* As at 16:00:00 ET 9/1/2016
TSX Stock Symbol: CFW
Share Price* $2.93
30-Day Average Volume* 690,000
Market Capitalization* $338.7 million
Enterprise Value* $1.1 billion
Shares Outstanding* 115.6 million
Insider Ownership ~25%
Canada Frac Crew Operator (2012). Calfrac Well Services Photo

0
200
400
600
800
1,000
1,200
1,400
1,600
1,800
2,000
1/4/2013 1/4/2014 1/4/2015 1/4/2016
Nu
mb
er
of
Rig
s
Lower 48 Active Land Rig Count
0
100
200
300
400
500
600
700
800
Jan Feb Mar Apr May Jun Jul Aug Sep Oct Nov Dec
Nu
mb
er
of
Act
ive
WC
SB L
an
d R
igs
2012 2013 2014 2015 2016
Active Rig Counts: North America & International
© Calfrac Well Services Ltd. 4
- U.S. land rig count down ~75% from
peak, up ~110 rigs from trough
- International rig count down ~30% from
peak
Source: Baker Hughes
- WCSB active rig count down ~40% Y/Y
QTD Q3/16
200
220
240
260
280
300
320
340
360
700
750
800
850
900
950
1,000
1,050
1,100
Nu
mb
er o
f O
ffsh
ore
Rig
s
Nu
mb
er o
f O
nsh
ore
Rig
s
International Land Rig Count International Offshore Rig Count

© Calfrac Well Services Ltd. 5
Global Supply/Demand
Global oil demand growth continues
U.S. oil production declines accelerating and expected to continue into 2017
U.S. inventories need to see a sustained drawdown to move prices higher
Global oversupply overstated – unreliable data
Market rebalancing without OPEC intervention
Expect a more balanced market in H2/16 driven by price
Source: Bloomberg
4,000
5,000
6,000
7,000
8,000
9,000
10,000
1/6/2012 1/6/2013 1/6/2014 1/6/2015 1/6/2016
00
0's
Bb
ls/d
Weekly Lower 48 Oil Production

Full Service Pressure Pumping
Canada Fleet: 410,000 Horsepower
13 Coiled Tubing Crews
U.S. Fleet: 611,000 Horsepower
11 Cementing Crews
5 Coiled Tubing Crews
Latin America Fleet: 131,000 Horsepower
14 Cementing Crews
7 Coiled Tubing Crews
Russia Fleet: 70,000 Horsepower
7 Coiled Tubing Crews
As at June 30, 2016
© Calfrac Well Services Ltd. 6

Canadian Operations
© Calfrac Well Services Ltd. 7
Canada Fleet: 410,000 Horsepower
13 Coiled Tubing Crews
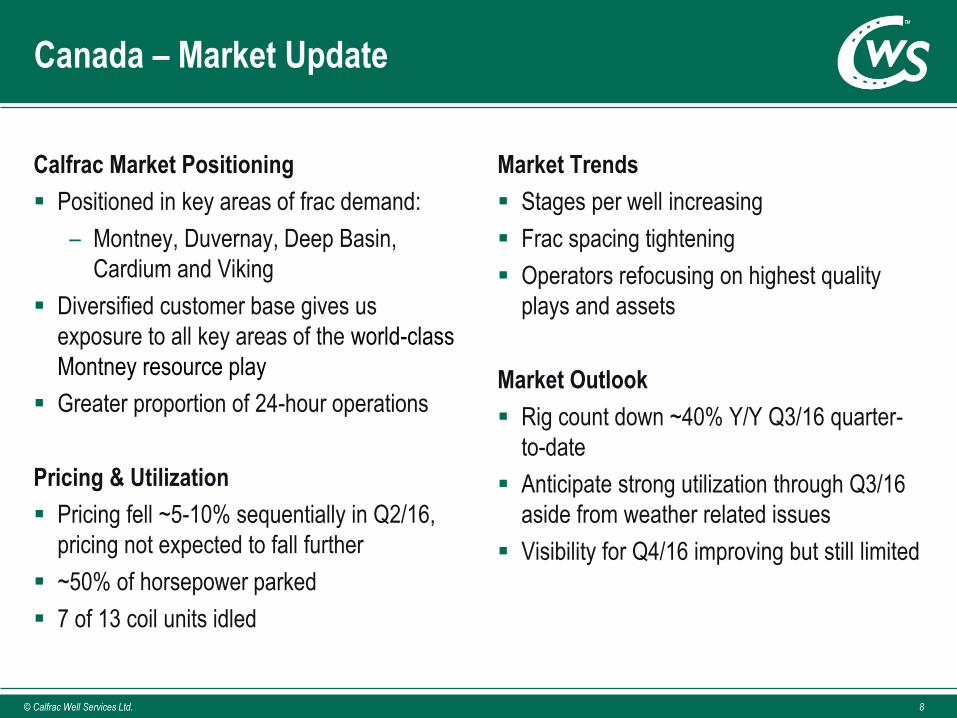
Calfrac Market Positioning
Positioned in key areas of frac demand:
– Montney, Duvernay, Deep Basin,
Cardium and Viking
Diversified customer base gives us
exposure to all key areas of the world-class
Montney resource play
Greater proportion of 24-hour operations
Pricing & Utilization
Pricing fell ~5-10% sequentially in Q2/16,
pricing not expected to fall further
~50% of horsepower parked
7 of 13 coil units idled
Market Trends
Stages per well increasing
Frac spacing tightening
Operators refocusing on highest quality
plays and assets
Market Outlook
Rig count down ~40% Y/Y Q3/16 quarter-
to-date
Anticipate strong utilization through Q3/16
aside from weather related issues
Visibility for Q4/16 improving but still limited
© Calfrac Well Services Ltd. 8
Canada – Market Update

United States Operations
U.S. Fleet: 611,000 Horsepower
11 Cementing Crews
5 Coiled Tubing Crews
© Calfrac Well Services Ltd. 9

Calfrac Market Positioning
Focus on customers that are financially strong and intend to remain active in key plays across the U.S.
Positioned in key areas of frac demand:
– Bakken, Marcellus, Rockies, Utica, Eagle Ford
– ~90% of work is 24-hour operations
Pricing & Utilization
Pricing largely stabilized but remains down ~40% from peak
~60% of horsepower parked
Temporarily suspended coiled tubing and cementing operations
Market Trends
Stages per well increasing
Frac spacing tightening
Market Outlook
U.S. land rig count troughed and has
started to rebound
Recent customer inquiries about increasing
activity is encouraging
Visibility for Q4/16 is limited
United States – Market Update
© Calfrac Well Services Ltd. 10

Neuquén, Argentina Frac Operation (2014). Calfrac Well Services Photo
© Calfrac Well Services Ltd. 11
Latin America Operations
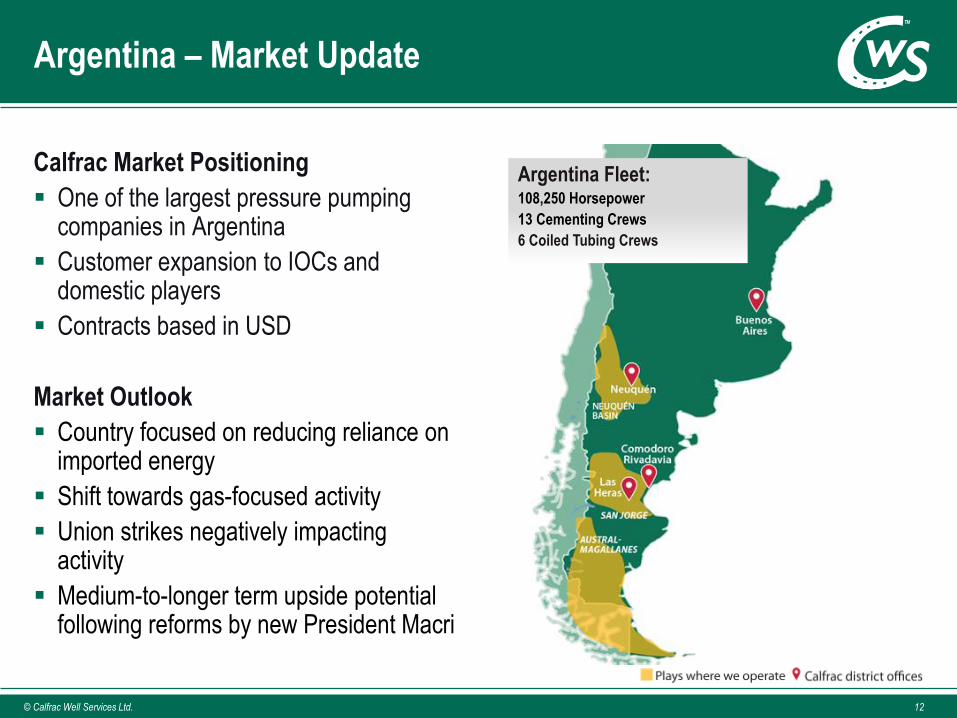
Calfrac Market Positioning
One of the largest pressure pumping companies in Argentina
Customer expansion to IOCs and domestic players
Contracts based in USD
Market Outlook
Country focused on reducing reliance on imported energy
Shift towards gas-focused activity
Union strikes negatively impacting activity
Medium-to-longer term upside potential following reforms by new President Macri
Argentina – Market Update
Argentina Fleet: 108,250 Horsepower
13 Cementing Crews
6 Coiled Tubing Crews
© Calfrac Well Services Ltd. 12

Calfrac Market Positioning
Long-term opportunity due to
Mexican energy industry reforms
– Low oil prices will limit
immediate impact
Round One tenders are ongoing
Market Outlook
Limited near-term activity
Right-sized business to reflect
current activity levels
Mexico – Market Update
© Calfrac Well Services Ltd. 13
Mexico Fleet: 22,500 Horsepower
1 Cementing Crew
1 Coiled Tubing Crew

Russian Operations
Russia Fleet: 7 Fracturing Spreads
70,000 Horsepower
7 Coiled Tubing Crews
© Calfrac Well Services Ltd. 14

Calfrac Market Positioning
Horizontal fracturing in conventional reservoirs is a significant amount of Calfrac’s activity
Rouble devaluation has negatively impacted reported financial results
Russia – Market Update
© Calfrac Well Services Ltd. 15
Russia Fracturing Crew (2015). Calfrac Well Services Photo
Market Outlook
2016 activity expected to be down
modestly from 2015
Change in customer mix
Introduction of multi-stage annular
fracture treatments is a market
differentiator

LICENSE TO OPERATE
Committed To Safety, Quality And Flawless Execution
© Calfrac Well Services Ltd. 16

Our License to Operate
Plan ▪ Do ▪ Assess ▪ Adjust HSE
QUALITY
SUPPLY CHAIN Evaluate ▪ Negotiate ▪ Finalize ▪ Implement
Monitor ▪ Refine ▪ Execute ▪ Improve
Calfrac employee on a Canadian hydraulic fracturing job. Calfrac Well Services Photo
TECHNOLOGY Research ▪ Develop ▪ Test ▪ Refine
Calfrac sand terminal in Whitecourt, Alberta. Calfrac Well Services Photo
© Calfrac Well Services Ltd. 17

NAVIGATING THROUGH THE DOWNTURN
© Calfrac Well Services Ltd. 18

© Calfrac Well Services Ltd. 19
Margin Erosion To Below Breakeven
Source: Company Reports, Morgan Stanley

© Calfrac Well Services Ltd. 20
North American Pressure Pumping Supply
Number of competitors decreasing through both bankruptcies and consolidation
Supply of horsepower decreasing as a result of cannibalization of equipment, lack of R&M and fleet retirements
Expect ~5-6 million horsepower to permanently exit the U.S. pumping
market (~30% of peak supply)
Expect Canadian supply to decrease by ~200k HHP
Fracturing Operation (2015) Calfrac Well Services Photo

Service Line Strategy
– Equipment has been idled when operating margins do not meet the company’s return requirements
Utilization and Maintenance Planning
– More efficient equipment utilization and maintenance schedules
– Unnecessary discretionary spending has been eliminated
Logistics and Supplier Initiatives
– Transload facilities in key locations and increase in rail car fleet
– Supplier costs have been reduced
Working Capital
– Focus has been on improving working capital management
– Maintaining lower levels of inventory (sand, chemicals and spare parts) in line with expected work
programs
Workforce & Fixed Cost Optimization
– Meaningfully reduced field workforce in Canada and the U.S. since January 2015
– In Canada, transportation and majority of fracturing and coiled tubing groups transitioned to variable pay
© Calfrac Well Services Ltd. 21
Managing The Downturn

Strong management team and Board of Directors that have been through multiple downturns
Optimized cost structure and developed operational efficiencies
Maintained core customer and supplier relationships
Strong existing employee base and recruiting capabilities
Well maintained equipment – initial fleet reactivations require minimal time and cost
“License To Operate” upheld through downturn
Proceeds from second lien term loan and undrawn credit facilities provide the liquidity needed to fund incremental working capital requirements associated with a recovery
© Calfrac Well Services Ltd. 22
Positioned For Recovery

© Calfrac Well Services Ltd. 23
Service Intensity Continues To Increase
Source: Rystad Energy, Morgan Stanley

FINANCIAL HIGHLIGHTS
© Calfrac Well Services Ltd. 24

Term Debt
US$600 mm with an interest rate of 7.5%
Matures in 2020
Second Lien Term Loan
$200 mm with an interest rate of 9%
Matures in 2020
Credit Facilities
Loan facility $300 mm (largely undrawn)
Matures in 2018
Capital Program
2016 capital budget set at $40 million – Includes $30 mm of carryover
© Calfrac Well Services Ltd. 25
The Balance Sheet
Neuquén, Argentina Frac Operation (2014). Calfrac Well Services Photo

APPENDIX
© Calfrac Well Services Ltd. 26

Introduction of Equity Cure:
– Applicable up to December 31, 2017
– Not to exceed the greater of 50% of total EBITDA over the prior twelve month period
or $25 million per cure
– Positively impacts both EBITDA and Funded Debt
– Can be utilized twice during period of covenant relief
– Can not be utilized in consecutive quarters
The Total Debt to Capitalization ratio removed
Funded Debt to Capitalization ratio introduced - 30% (does not include Calfrac’s
unsecured senior notes or second lien term loan)
© Calfrac Well Services Ltd. 27
Relaxation Of Covenants (Credit Facility)
Funded Debt/EBITDA covenant amendments including two periods of waivers

On June 10, 2016, AIMCo provided Calfrac a $200 million second lien senior secured term loan facility maturing in September 2020.
– 9% interest rate paid quarterly with option to pay interest “in kind” at 12% rate (8 quarters max)
– ~6.9 mm warrants were issued to AIMCo priced at $4.14/share exercisable prior to June 10, 2019
The proceeds of the term loan will be used by Calfrac for working capital needs and general corporate purposes, including:
– Repayment of all of Calfrac’s current bank indebtedness under its syndicated revolving credit facility and all borrowings of Calfrac Well Services (Argentina) S.A.
Positions Calfrac to assess opportunities to repurchase some of its unsecured senior notes due 2020
– Currently limited to $200 million
– Subject to a minimum liquidity requirement of $100 million
– Repurchase of notes must result in a reduction of annual net interest costs (dollar for dollar basis)
Following this financing, Calfrac still has $200 million of second lien capacity.
Overall, this financing leaves Calfrac well-positioned to navigate this period of market weakness and capitalize on the opportunities expected to arise as market conditions recover.
© Calfrac Well Services Ltd. 28
Second Lien Term Loan


![COMPUTERSHARE TRUST COMPANY OF CANADAcalfrac.investorroom.com/download/Calfrac+-+Shareholder+Rights+… · COMPUTERSHARE TRUST COMPANY OF CANADA Dated as of [ ]1, 2020 1 ... 2.5 Execution,](https://img.dokumen.tips/doc/110x75/601a6821e12e5e0c597f55e3/computershare-trust-company-of-shareholderrights-computershare-trust-company.jpg)