Embed Size (px)
Citation preview
Advanced Review
Tropospheric temperature trends:history of an ongoing controversyPeter W. Thorne,1,2∗ John R. Lanzante,3 Thomas C. Peterson,4
Dian J. Seidel5 and Keith P. Shine6
Changes in atmospheric temperature have a particular importance in climateresearch because climate models consistently predict a distinctive vertical profileof trends. With increasing greenhouse gas concentrations, the surface andtroposphere are consistently projected to warm, with an enhancement of thatwarming in the tropical upper troposphere. Hence, attempts to detect this distinct‘fingerprint’ have been a focus for observational studies. The topic acquiredheightened importance following the 1990 publication of an analysis of satellitedata which challenged the reality of the projected tropospheric warming. Thisreview documents the evolution over the last four decades of understandingof tropospheric temperature trends and their likely causes. Particular focusis given to the difficulty of producing homogenized datasets, with which toderive trends, from both radiosonde and satellite observing systems, because ofthe many systematic changes over time. The value of multiple independentanalyses is demonstrated. Paralleling developments in observational datasets,increased computer power and improved understanding of climate forcingmechanisms have led to refined estimates of temperature trends from a widerange of climate models and a better understanding of internal variability. It isconcluded that there is no reasonable evidence of a fundamental disagreementbetween tropospheric temperature trends from models and observations whenuncertainties in both are treated comprehensively. 2010 Crown copyright WIREs ClimChange 2010 DOI: 10.1002/wcc.80
INTRODUCTION
Since the earliest attempts to mathematically modelthe climate system’s response to human-induced
increases in greenhouse gases,1 a consistent pictureof resulting atmospheric temperature trends hasemerged. The surface and troposphere (the lowest8–12 km) warm with a local maximum trend in the
∗Correspondence to: [email protected] Office Hadley Centre, FitzRoy Road, Exeter, UK2Cooperative Institute for Climate and Satellites, NOAA NationalClimatic Data Center, 151 Patton Avenue, Asheville, NC, USA3NOAA Geophysical Fluid Dynamics Laboratory, ForrestalCampus, US Route 1, PO Box 308, Princeton, NJ, USA4NOAA National Climatic Data Center, 151 Patton Avenue,Asheville, NC, USA5NOAA Air Resources Laboratory, 1315 East West Highway, SilverSpring, MD, USA6Department of Meteorology, University of Reading, Earley Gate,PO Box 243, Reading, UK
DOI: 10.1002/wcc.80
upper levels in the tropics, while the stratosphereabove cools (Figure 1).
In a 1990 paper, Spencer and Christy3 claimedthat since the start of routine satellite temperatureobservations in 1979 there had been no troposphericwarming, despite apparently rapid surface warming.The paper raised questions about both the veracity ofthe surface temperature record and our understandingof the climate system’s response to greenhouse gasincreases, and it has been heavily cited in bothscientific and political arenas. Taken at face value,these questions would have fundamental and far-reaching implications for understanding of the climatesystem and efforts to mitigate projected climatechange. The ensuing controversy has motivatedseveral hundred research papers, two in-depthexpert panel assessments,2,4 and numerous politicalhearings (see examples in supporting information),and has been discussed within all of the majorIntergovernmental Panel on Climate Change (IPCC)scientific assessments.
2010 Crown copyr ight

Advanced Review wires.wiley.com/climatechange
(a) (b)
(c) (d)
FIGURE 1 | Simulated 1979–1999 temperature trends from four modern-day climate models with representations of human-induced and naturalforcings (see section on ‘Modeling Temperatures in the Atmosphere’). All exhibit a warming troposphere with a maximum in the tropical uppertroposphere and a cooling stratosphere, but with differences in trend patterns and magnitudes. Adapted from Climate Change Science ProgramSynthesis and Assessment Product 1.1.2
We present a history of the evolving under-standing of atmospheric temperature trends, theiruncertainties, and probable causes. The review focuseson peer-reviewed literature that assesses changes at thelargest spatial scales (tropical, hemispheric, or global)to inform understanding of global climate changes.It is distinct from previous analyses in: (1) addressingthe evolution of scientific issues rather than techni-cal details; and (2) providing a historical perspectiveon the treatment of these issues by the scientificcommunity.
As background, we present the scientific foun-dations for analyses of temperature trends and useof climate models to reconcile observations withcompeting hypotheses regarding likely causes. Ourchronological review is organized by time periods cor-responding to the IPCC assessments because of theirimportant influence in interpreting and advancing the
science. An annotated list of acronyms follows themain text. Supporting information is available onlineincluding a limited selection of political and main-stream science media developments which may be ofinterest to an interdisciplinary WIREs audience.
OBSERVING AND MONITORINGTEMPERATURES IN THEATMOSPHERE
All observing systems germane to this issue operateprimarily to support weather forecasting, not climatemonitoring and research. Most notably, frequentchanges in instrumentation and practices have hada deleterious impact on the use of observations forthe study of long-term climate changes by impartingsubstantial time-varying biases. Accounting for these
2010 Crown copyr ight
WIREs Climate Change Tropospheric temperature trends
80˚S80°S
70°S 70˚S
60˚S60°S
50°S 50˚S
40˚S40°S
30°S 30˚S
20˚S20°S
10°S 10˚S
0˚0°
10°N 10˚N
20˚N20°N
30°N 30˚N
40˚N40°N
50°N 50˚N
60˚N60°N
70°N 70˚N
80˚N80°N
170°W 150°W 130°W 110°W 90°W 70°W 50°W 30°W 10°W 0° 10°E 20°E 30°E 40°E 50°E 60°E 70°E 80°E 90°E 110°E 130°E 150°E 170°E
170°W 150°W 130°W 110°W 90°W 70°W 50°W 30°W 10°W 0° 10°E 20°E 30°E 40°E 50°E 60°E 70°E 80°E 90°E 110°E 130°E 150°E 170°E
Radiosonde stations JUL 2009Frequency of RECEPTION data at ECMWF
Level: 700 hPa temperature SUMMARY 00/12 UTC
% of received data
90 – 100 50 – 90 25 – 50 1 – 25 0 – 1
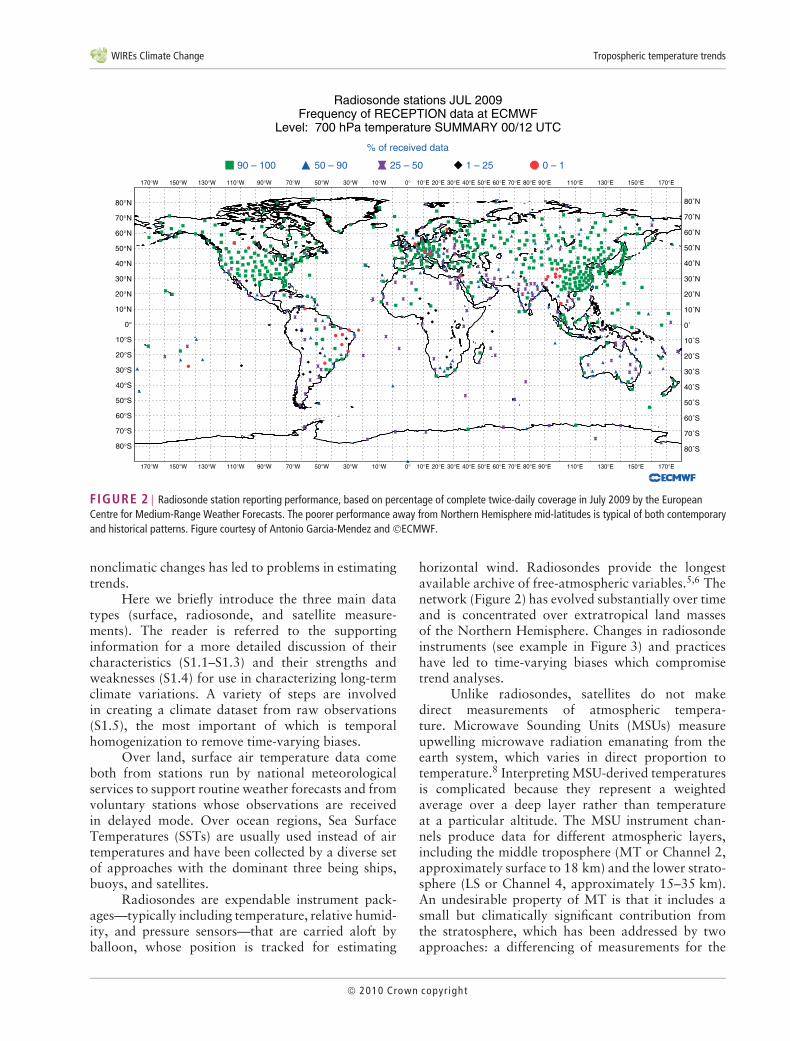
FIGURE 2 | Radiosonde station reporting performance, based on percentage of complete twice-daily coverage in July 2009 by the EuropeanCentre for Medium-Range Weather Forecasts. The poorer performance away from Northern Hemisphere mid-latitudes is typical of both contemporaryand historical patterns. Figure courtesy of Antonio Garcia-Mendez and ECMWF.
nonclimatic changes has led to problems in estimatingtrends.
Here we briefly introduce the three main datatypes (surface, radiosonde, and satellite measure-ments). The reader is referred to the supportinginformation for a more detailed discussion of theircharacteristics (S1.1–S1.3) and their strengths andweaknesses (S1.4) for use in characterizing long-termclimate variations. A variety of steps are involvedin creating a climate dataset from raw observations(S1.5), the most important of which is temporalhomogenization to remove time-varying biases.
Over land, surface air temperature data comeboth from stations run by national meteorologicalservices to support routine weather forecasts and fromvoluntary stations whose observations are receivedin delayed mode. Over ocean regions, Sea SurfaceTemperatures (SSTs) are usually used instead of airtemperatures and have been collected by a diverse setof approaches with the dominant three being ships,buoys, and satellites.
Radiosondes are expendable instrument pack-ages—typically including temperature, relative humid-ity, and pressure sensors—that are carried aloft byballoon, whose position is tracked for estimating
horizontal wind. Radiosondes provide the longestavailable archive of free-atmospheric variables.5,6 Thenetwork (Figure 2) has evolved substantially over timeand is concentrated over extratropical land massesof the Northern Hemisphere. Changes in radiosondeinstruments (see example in Figure 3) and practiceshave led to time-varying biases which compromisetrend analyses.
Unlike radiosondes, satellites do not makedirect measurements of atmospheric tempera-ture. Microwave Sounding Units (MSUs) measureupwelling microwave radiation emanating from theearth system, which varies in direct proportion totemperature.8 Interpreting MSU-derived temperaturesis complicated because they represent a weightedaverage over a deep layer rather than temperatureat a particular altitude. The MSU instrument chan-nels produce data for different atmospheric layers,including the middle troposphere (MT or Channel 2,approximately surface to 18 km) and the lower strato-sphere (LS or Channel 4, approximately 15–35 km).An undesirable property of MT is that it includes asmall but climatically significant contribution fromthe stratosphere, which has been addressed by twoapproaches: a differencing of measurements for the
2010 Crown copyr ight

Advanced Review wires.wiley.com/climatechange
1960 1965 1970 1975 1980 1985 1990 1995 2000 2005
0
−1
−2
−3
1
2
Ano
mal
y (K
)
700 hPa
1960 1965 1970 1975 1980 1985 1990 1995 2000 2005
0
−1
−2
−3
1
2
Ano
mal
y (K
)
200 hPa
FIGURE 3 | Top 2 panels: monthly temperature anomalies(smoothed with a 13-point running average) during 1958–2009 fromradiosonde observations at Camborne, Cornwall, UK, at 200 hPa(near-tropopause) and 700 hPa (lower-troposphere), including both raw(black) and adjusted (green) HadAT data.7 The smoothed differenceseries between the two shows the adjustments (offset by 2.25 K).Bottom panel: the four radiosonde types used over this period (typicalof UK-managed stations) are (left to right, with typical periods ofoperation): Phillips Mark IIb (1950s–1970s); Phillips MK3 (mid 1970s toearly 1990s); Vaisala RS-80 (early 1990s to 2005–2006); and VaisalaRS-92 (since 2005–2006). Dates of radiosonde changes (red dottedlines) are one sort of ‘metadata event’,5 others include:cross—radiation correction procedure change; star—data cut-offchange; diamond—change of pressure sensor; triangle—change ofwind equipment; square—change of relative humidity sensor. Photoscourtesy of Kevin Linklater, UK Met Office and background digitallyenhanced for clarity by Sara Veasey NOAA NCDC.
MT channel at different view angles9 to obtain datarepresenting the lower troposphere (LT), and statis-tical recombination (labeled *G) of MT and LS toremove the LS influence10 (Figure 4). MSU was car-ried on a series of satellites starting in late 1978; itwas superseded by Advanced MSU (AMSU) in 1998,although MSU continued to operate until 2005, offer-ing a substantial overlap (Figure 5).
We briefly mention reanalyses, special hybriddata products created by combining as muchobservational data (including nontemperature data)as are available using data assimilation schemes.11–13
Pre
ssur
e (h
Pa)
0.1
1.0
10
100
1000
LT *G MT LS
Surface
Tropopauselevel
Tropics
Poles
Stratosphere
Mesosphere
30
25
20
15
10
5
60
50
40
Height (km)
Troposphere
FIGURE 4 | Left: Vertical weighting functions for satellite products.Right: Schematic of atmospheric vertical structure and its latitudinalvariation. The line at 30 hPa indicates the typical maximum height ofhistorical global radiosondes data coverage. Because LT and *G involvecombining data from other layers, they have negative weightings inparts of the atmospheric column. Adapted from Climate Change ScienceProgram Synthesis and Assessment Product 1.1.2
Several erroneous findings using free-atmospheretrends from first and second generation reanalysisproducts have occurred (e.g., Refs 14–17). Therecent Climate Change Science Program report onfree-atmosphere temperatures2 concluded that ‘trendsarising from reanalyses [. . .] are not always reliable’,18
and we consider such studies sparingly. We note,however, that the latest and future products may wellbe suitable (or indeed invaluable) for characterizingsome free-atmosphere temperature changes.18–22
MODELING TEMPERATURES IN THEATMOSPHERE
Numerical models vary in complexity dependingon the number of separate, interacting subsystems
1980 1985 1990 1995 2000 2005 2010
Year
02:00
04:00
06:00
08:00
10:00
Equ
ator
cro
ssin
g tim
e
TIROS-N
NOAA-06
NOAA-07
NOAA-08
NOAA-09
NOAA-10
NOAA-11
NOAA-11NOAA-12
NOAA-14
NOAA-15
NOAA-16
AQUA
NOAA-18
METOP-A
FIGURE 5 | Satellite Local Equatorial Crossing Times (LECTs) (pmfor ascending/northward and am for descending/southward satelliteorbits) for MSU instruments (TIROS-N to NOAA-14) and subsequentAMSU instruments (all other satellite platforms). Changes in LECTstypically accompany changes in orbital height and viewinggeometry.Courtesy of Carl Mears, Remote Sensing Systems.
2010 Crown copyr ight

WIREs Climate Change Tropospheric temperature trends
and the manner by which processes are simulated.The hierarchy of climate models ranges fromrepresentation of the climate system by a singlevalue (e.g. global-mean surface temperature) to three-dimensional models with representations of theatmosphere, oceans, land surface, and chemical andbiological processes. Models represent simplificationsof a complex reality, dictated by knowledgelimitations and practical constraints on computing.
General Circulation Models (GCMs) are three-dimensional representations of the climate system.Early GCMs were relatively simple, but includedthe basic physical (but not biological or chemical)processes that underpin present-day understanding.GCMs gradually increased in sophistication (Figure 6)and resolution. The latest models include interactivechemistry, ecosystems, and carbon cycles, and enablerepresentation of various climate system feedbackmechanisms, although small time and space scaleprocesses are still not explicitly modeled.
Models are a key bridge between theory andobservations. They afford the opportunity to conduct‘what if’ experiments not possible in the real-world cli-mate system which evolves along a single trajectory.They provide estimates of how the climate systemshould behave (according to theoretical understand-ing) in response to changes external to the system,known as ‘forcings’.
Radiative forcing drives much of long-term cli-mate change and is a measure of the imbalance in theplanetary energy budget, for example, due to increasesin greenhouse gases (including carbon dioxide, ozone,and many others), changes in atmospheric aerosols,or solar variations. Changes in forcings can inducechanges in the vertical as well as horizontal structureof temperature. Model simulations of past or futureclimates use best estimates of the historical or plau-sible future changes in forcings. The incorporation offorcings into climate models (Figure 6) has evolvedsignificantly over time.23–25
Many groups have undertaken climate modelingusing GCMs, and many conduct ‘ensemble exper-iments’ with a given model in which the forcingsare identical, but the initial atmospheric state differsslightly for each ensemble member. Due to the ‘but-terfly effect’ each ensemble member will have a uniquetrajectory.33 This divergence can be used to charac-terize the uncertainty of the model solutions resultingfrom ‘internal variability’ (such as occurrence andtiming of El Nino), which is the natural variabilityof the system in the absence of changes in forcings.Although all climate models are derived from thesame basic physical laws, the exact formulations andimplementations vary among models. A multimodel
ensemble of results therefore presents a set of plausibleoutcomes that help bracket our uncertainty.34
EVOLVING UNDERSTANDING
Pioneering Model Projections andObservational Analyses from the late 1960sto Early 1990sAs early as 1970,35 the surface temperature responsesto an 18% increase of atmospheric CO2 concentra-tions by 2000 and to doubling of CO2 were projectedto be a warming of about 0.5 and 2 K, respectively,albeit with considerable uncertainty. Two seminalstudies by Manabe and Wetherald,1,27 provided thebasic framework for expectations of the vertical struc-ture of human-induced temperature change which stillunderpins current understanding. Their 1967 paper1
was the first to point out that a stratospheric coolingwould accompany the tropospheric warming whenCO2 was increased, and the 1975 paper27 first sim-ulated the enhanced warming in the tropical uppertroposphere, relative to the surface, in response toa CO2 increase. They attributed this to the modelrepresentation of moist convective adjustment, clearlydemonstrated by later studies using radiative–convec-tive models.36,37 Subsequent GCM experiments38,39
revealed some variation among models regardingthe amplification of the tropical upper-troposphericwarming, attributed mostly to the nature of the vari-ous convection schemes.40
During this period, observational analyses oftemperature trends were limited in number and intheir characterization of uncertainty. Long beforesatellite data were first used for climate trend anal-ysis, researchers were analyzing in situ temperatureobservations.41–43 The 63-station radiosonde networkused by Angell41,42,44 revealed a 1958–1987 increaseof about 0.3 K in the tropospheric 850–300 hPa layerglobally, much of it occurring in the late 1970s andearly 1980s, consistent with global surface temper-ature changes. The upper troposphere–lower strato-sphere 300–100 hPa layer showed cooling. Parker45
attempted to remove the nonclimatic influences fromthe data using a first-difference technique.46 Angell47
noted that El Nino variability complicated the assess-ment of volcanic impacts on the troposphere.
Spencer and Christy3 of the University ofAlabama in Huntsville (UAH) presented the firstestimates from satellite data in Science. They madetwo major claims: that ‘accurate long-term globaltemperature measurements can be obtained by satel-lites’; and that no obvious trend could be found inthe 1979–1988 dataset, strongly implying that little
2010 Crown copyr ight

Advanced Review wires.wiley.com/climatechange
100200300
500
800
90°N 60°N 30°N 0 30°S 60°S 90°SLatitude
Pre
ssur
e (h
Pa)
0.2
0.4
0.6
0.4
0.2
0
25
95
205
350
515660830940
25
20
15
10
5
56
4
3
3
21
0−3
−6−9
−12−15
4
56789
990 90°N 60°N 30°N 0° 30°S 60°S 90°SLatitude
Pre
ssur
e (h
Pa)
Hei
ght (
km)
90°N 60°N 30°N 0 30°S 60°S 90°S
100
200300
500
800
Latitude
Pre
ssur
e (h
Pa) −0.2−0.2
−1.0
−1.3
0.00.0
0.20.2
0.20.2
0.4
0.40.4
−2.2
Hei
ght (
Km
)
P/P
30
20
10
090° 80° 70° 60° 50° 40° 30° 20° 10° 0°
.009
.074
.189
.336
.500
.664
.811
.926
.991
0−1
−3−2
−4−5
−6
1
23
3
221097
??
?
Latitude
90°N 60°N 30°N 0° 30°S 60°S 90°S
25
20
15
10
5
0+4
+2+1+2
+2
+1
+3
0−1
−2−3
−4−5
Atm
osph
ere
Hei
ght (
km)
−6
Latitude
Pre
ssur
e (h
Pa)
Latitude
100
200
300
500
850
90N 45N 0 45S 90S
0.2
0.2
−0.1
0
−0.05
−0.1
−0.5
0.05
−0.2
0.1
0.1
Rain
CO2
Mid 1970s
Landsurface
Prescribedice
Mid 1980s
Clouds
Swamp ocean
1990
Sulphates
Volcanic activity
Mid 1990s
Ocean
2004
Oceancirculation
River
Aerosols
Carbon cycle
2009
OceanbiologyPlants and soil
Chemistry
FIGURE 6 | Over several decades, increasing climate model complexity and increasingly realistic simulation of forcings (depicted at left) have ledto little change in the expected pattern of atmospheric temperature change (right). Model representations are based on Treut et al.26 and courtesyFiona Carroll. Zonal-mean temperature responses from progressive versions of the GFDL (top three, trends in K/century) and Hadley Centre (bottomthree, trends in K/decade) models are directly from the literature,27–32 digitally enhanced for clarity only by Deb Misch NOAA/NCDC.
2010 Crown copyr ight

WIREs Climate Change Tropospheric temperature trends
if any global warming was occurring. Methodologi-cal details were expanded upon in a more technicalarticle.48 A technical comment to Science49 raised sev-eral issues with the analysis and cautioned againstmaking robust conclusions based upon a record ofonly a decade’s duration. The original author teamconcurred that further investigation was merited, butdisputed the posited importance of the issues raised.50
The first assessment report of the IPCC51 gave arather different interpretation to that in the initialScience article. Comparing the MSU, surface andradiosonde temperature data during 1979–1988, itfound high correlations and low root mean squareddifferences among them, and concluded that there is‘excellent agreement’ given the short time period. Thetropospheric and surface data agreement was termed‘surprisingly good, despite recent suggestions that it ispoor’. The implication was that the tropospheric dataagreed with the surface warming, the reality of whichwas not questioned by the report.
Early attempts to ascertain the causes ofobserved trends had mixed results. In 1982, Epstein52
analyzed Angell’s radiosonde record through 1980and failed to detect the expected temperature trends,but predicted that, with a longer data record, within10 years they would be detectable, and that by jointlyconsidering stratospheric and tropospheric changes‘a change that can be attributed to carbon diox-ide increase should be detectable by 1986’. Parker53
examined temperature trends in radiosonde data overa 25 year period, but, failing to find the expected pat-tern of changes, concluded that another 20–35 yearsof observations would be required for its detec-tion. Karoly detected statistically significant trends inNorthern54 and Southern55 Hemisphere radiosondestations in an index incorporating trends at six levelsbetween 850 and 30 hPa. He noted both the consis-tency with the model projected greenhouse warmingsignal, and that other climate variations would alsocause temperature changes of opposite sign in thetroposphere and stratosphere. By 1990, the IPCCreport chapter on detection of the greenhouse effect inthe observations56 found ‘broad agreement betweenthe observations and equilibrium model simulations’,with the main differences being related to the height atwhich tropospheric warming changes to stratosphericcooling.
Early 1990sRecognition of Data LimitationsDuring the early 1990s, Oort and Liu57 presented anupdated radiosonde-based temperature dataset cover-ing 1958–1989 with several differences in approach
to that of Angell,44 the main one being use of thefull global radiosonde network rather than a smallselection of stations. Trends were generally similar inpattern, but with significantly different magnitudes.Parker and Cox58 and Gaffen59 identified (but did notattempt to remove) specific sources of time-varyingbiases (often called ‘temporal inhomogeneity’) inradiosonde temperature data. They noted the incom-pleteness of radiosonde station history ‘metadata’.This latter situation had been only partially rectifiedby the global metadata compilation of Gaffen60 andremains to this day.5
Temporal inhomogeneity problems with MSUdata were also starting to be recognized. Christyet al.61 attempted to remove a spurious warming sig-nal associated with a sampling time drift in the NOAA11 satellite (Figure 5) and a problem with the dynamicrange on NOAA 12. Other studies9,62–65 used com-parisons with radiosonde data to support the homo-geneity of the satellite data during 1979–1990, and asubsequent review paper by Christy66 suggested thatall previously identified problems had been rectified.
Identification of Climate Change Signals inGlobal Climate ModelsDuring this period, model-data comparisons werestill mainly restricted to assessments of changes inglobal-mean temperatures. Climate signals unrelatedto anthropogenic change complicated trend estima-tion, particularly over the short satellite record, andattempts were made to remove the effects of ElNino/Southern Oscillation (ENSO) and volcanoesfrom observational records,67,68 which reduced thediscrepancy with model simulations. The observeddifference between surface and tropospheric trendswas found to be larger than either the climate-model-simulated natural variability or the expectedtransient forcing response.69 The first studies to iden-tify a climate change signal based on ‘fingerprint’pattern matching techniques and using zonal-meantemperatures from radiosondes from 1958 onwardsappeared,70,71 and one71 found that including strato-spheric ozone depletion and sulphate aerosols changesin addition to CO2 improved the match.
IPCC in 1995The observations chapter of the IPCC Second Assess-ment Report72 discussed in detail radiosonde dataissues that might hamper reliable trend estimation.In contrast, MSU data were seen to ‘have exhibitedhigh precision’ with the various biases in the datadescribed as ‘minimal’, ‘insignificant’, or having ‘beenremoved’. The global tropospheric trends from 1979to May 1995 were reported as showing slight cooling:
2010 Crown copyr ight
Advanced Review wires.wiley.com/climatechange
−0.06◦C/decade for MSU and −0.07◦C/decade forradiosondes. But after removing volcanic and ENSOeffects, the time series showed a positive trend.
The detection and attribution chapter73 com-pared the observed pattern of stratospheric coolingand tropospheric warming (after removing ENSO andvolcanic signals) with model simulations and con-cluded that ‘there is no serious inconsistency betweenthe most recent model predictions and MSU-basedtrend estimates’. However, it noted that the MSUperiod of record was relatively short. For detection andattribution, a sufficiently long record is required forany underlying signal to become distinct from ‘noise’introduced by natural climate variability. To this end,work70,71 with the longer radiosonde record was crit-ical in forming the conclusion that ‘The balance ofevidence suggests a discernable human influence onglobal climate’.
Late 1990sIdentification of Specific Radiosonde and MSUData ProblemsThe late 1990s witnessed a growing recognition ofradiosonde and MSU data homogeneity problemsand concerted efforts by several groups to correctthem. The Hadley Centre Radiosonde Temperature(HadRT)58,74 dataset was the first global radiosondeproduct to incorporate homogeneity adjustments,applied at upper levels only and solely from 1979,based upon MSU LS data.63 The ComprehensiveAerological Reference Dataset (CARDS) project com-piled all available raw radiosonde records75; a subsetprovided optimized spatial and temporal coverage.76
An auxiliary Monthly Aerological Data Set offeredmonthly average values,77 and a gridded versionwas created at the All-Russian Research Instituteof Hydrometeorological Information (RIHMI).78 Theoriginal 63-station ‘Angell network’42 was still inuse,79,80 but nine tropical stations were eliminatedbecause of data concerns.80
Luers and Eskridge81 attempted a novelradiosonde data homogeneity adjustment approachusing thermodynamic properties of each type ofradiosonde. Although promising in theory, indepen-dent validation was not possible.82 Gaffen et al.83
explored several different approaches for identifyingand adjusting artificial discontinuities, highlightingthe difficulty of the endeavor and the sensitivity of theresulting trends.
Although UAH remained the only readilyavailable MSU dataset, four versions (A,9,62 B,61 C,84
and D85) were created during the 1990s. Diagnosticstudies by other investigators86–89 provided a basis for
version D. Wentz and Schabel’s87 finding of an orbitaldecay effect and its implications of an artificial coolingimpact upon the UAH TLT record gained significantprominence in Nature and Science.90–93
For the first time, a group produced temperatureseries and trend estimates from MSU data indepen-dently of UAH,88,89,94 and they showed substantiallymore tropospheric warming than UAH. However, thisdataset was not updated so had limited utility.
Surface temperatures, radiosonde temperatures,and climate model output were used to make infer-ences regarding the UAH record. Two artificial discon-tinuities were claimed in the tropical MSU series95–98
and disputed by UAH using radiosonde data.99
Identification of the Causes of ObservedTropospheric ChangesStudies comparing modeled and observed temperaturechanges during the late 1990s were more sophisticatedand examined the effects of different climate forcings.Comparing zonal-mean temperature changes usingHadRT74 data from 1960 onwards with GCM output,two studies30,100 found identifiable ‘fingerprints’ ofgreenhouse gases and ozone depletion. Another101
evaluated the realism of GCM internal variability vis-a-vis HadRT and found deficiencies in the stratospherebut reasonable agreement in the troposphere, as wellas tentative evidence for volcanic and solar influences.Analysis of an atmosphere-only GCM found that theinfluence of observed SSTs alone could not explainthe observed HadRT signal but including greenhousegases and other forcings yielded consistency.102
Several studies concluded that the larger rateof surface warming than in the troposphere overthe satellite era was real and discussed possiblephysical mechanisms.4,103–105 Others highlighted theunderlying uncertainties due to various factors suchas horizontal, vertical and temporal sampling, spa-tial averaging, statistical sampling issues, choice ofdataset, etc.104,106–109 Explicit examination of the dif-ference between surface and tropospheric trends inthe tropics uncovered low frequency variations, alongwith a difference in the sign of the trend during andprior to the satellite era.109,110
IPCC in 2001The IPCC Third Assessment Report built upon theU.S. National Research Council (NRC) report4 whichhad concluded that the surface really was warmingrelative to the troposphere. IPCC concurred, acknowl-edged that all measuring systems ‘contain significanttime-varying biases’,105 and described advantages anddisadvantages of each. The detection and attribu-tion chapter111 acknowledged the difficulties involved
2010 Crown copyr ight

WIREs Climate Change Tropospheric temperature trends
in analyzing this problem and reconciling inconsis-tencies between the observed and modeled verticalpatterns of temperature change. It concluded that‘nevertheless, all the studies indicate that anthro-pogenic factors account for a significant part ofrecent observed changes, whereas internal and nat-urally forced variations alone, at least as simulatedby current models, cannot explain the observedchanges’. The studies referred to had almost invari-ably considered the longer radiosonde era and not thesatellite era.
Early 2000sThe early 2000s saw a rapid multiplication ofapproaches to homogenizing long-term temperatureobservations and resulting global datasets. Detectionstudies were refined, and observational uncertaintieswere identified as the primary explanation for discrep-ancies between models and observations.
Attempts to Homogenize Observational Dataand Emergence of Multiple AnalysesA workshop bringing together groups developingmethods to identify and remove inhomogeneities inradiosonde data112 set a cautionary tone, havingrevealed that different methods applied to real-life testcases found only limited agreement. Although mostfailed to progress beyond the development phase, twonew radiosonde temperature datasets emerged. TheLKS effort113,114 was the first to make adjustmentsindependent of satellite data, over a globally-distributed network, for both tropospheric and strato-spheric levels. Post-construction comparisons withMSU temperatures suggested improved trend charac-terization. They concluded that unadjusted radioson-des suffer world-wide from a spurious cooling biasthroughout the atmospheric column. However, sincethe subjective, labor-intensive approach did not lenditself readily to updates, a new dataset was createdby extending the LKS product which terminated in1997. The first-difference method of dataset con-struction, previously successfully employed for sur-face data,46 was adapted115 to create a new NOAAdataset: Radiosonde Atmospheric Temperature Prod-ucts for Assessing Climate (RATPAC).116 The secondeffort was the Hadley Centre Atmospheric Temper-atures (HadAT) product.7 Unlike RATPAC, whichwas limited to 85 stations, HadAT utilized 676.HadAT adjustments were based on comparison oftarget station data with similar time series fromsuitable neighbor stations. This contrasts with LKSwhich was almost entirely dependent upon informa-tion local to a station. At a more fundamental level,
creation of the quality-controlled Integrated GlobalRadiosonde Archive (IGRA)5 in place of CARDSwas a major advance. Although without homogeneityadjustments, IGRA is now the highest-quality archiveof long-term global radiosonde and pilot balloonsoundings.
Analysis of differences between day and night-time soundings by several investigators117–119 revealedsystematic and geographically pervasive biases,including a suspicious relative daytime cooling glob-ally, most notably in the tropics, with residual biaseven after adjustment.120–122 Angell123 found bet-ter trend agreement between the remaining networkafter eliminating nine tropical stations with suspecthomogeneity from his original network of 63.
Major developments with MSU temperaturedata included release of version 5.0 of the UAHproduct124 with revised adjustments and incorpora-tion of AMSU measurements. Most significant was thecreation of MSU datasets by two new teams, RemoteSensing Systems (RSS) and a group from the Universityof Maryland (UMd). The RSS team initially createdonly MT and LS products,125 later adding LT.126 Theyuncovered an error in the UAH LT drift adjustmentmethodology, a correction for which resulted in UAHv5.1.127 Although this correction led to little overallchange in global trends, it had a distinct latitudi-nal signature and revealed greater tropical warmingand reduced mid to high latitude warming. The UMdteam produced MT data128 which was subsequentlyrevised.129,130
Although similar in many respects, the UAHand RSS approaches have two main differences,131
and in both cases RSS uses more data, while UAHapplies constraints based on improving error charac-teristics. The MT trend difference between the twois mainly attributable to a difference in parametersderived for NOAA-9 which, due to premature failureshad a particularly short overlap with adjacent satellitesin the series.2 UMd used a fundamentally different,more physically-based approach, with a substantiallydifferent merging procedure from that of UAH andRSS.132 Such uncertainties in homogenization compli-cate assessment of climate trends.133 A confoundingissue is the methodological differences in construct-ing MSU data products for different layers and theinterpretation of the LT layer, with its large surfacecontribution.134
Although the stratospheric contribution to MTobservations had long been recognized, work by Fuand co-workers10,135–138 set out to explicitly removeit by combining MT and LS to produce a measure(*G), that is distinct from LT but has a similarvertical weighting function (Figure 4). Initial critical
2010 Crown copyr ight
Advanced Review wires.wiley.com/climatechange
analysis of this method139 highlighted several issues.Application to model simulations140,141 suggestedbetter agreement between observations and model andtheoretical expectations regarding the surface versustroposphere differential warming, and revealed someinconsistencies in the UAH tropospheric products,although UAH criticized the approach.142
A comprehensive comparison of then-availableupper-air datasets143 found better agreement forinterannual climate signals than trends. The effectsof regional variations in signals and of differingspatial sampling strategies were explored by sev-eral groups,104,144–146 as were the effects of datasetchoice147 and shifts in regional climate regimes148 ontemperature trends.
Refinement of Climate Change DetectionStudies in the TroposphereSeveral studies compared HadRT data from 1958onwards to GCM output.31,149–153 They all foundstrong evidence for a greenhouse gas fingerprint; somealso found evidence for volcanic151–153 or solar150
influences. Responding to criticism that the asym-metry in trends between the troposphere and strato-sphere dominated formal detection and attributionstudies,154 Thorne et al.151,152 examined the tropo-sphere in isolation and still detected a greenhousegas signal. Trends in the newer HadAT observationalanalyses were found to be outside model estimatesof natural variability, and anthropogenic effects wererequired to explain the observations.32
A comparison of UAH and HadRT with newGCM results from the NASA Goddard Institute forSpace Studies yielded discrepancies in trend behavior,particularly in the tropics, but best overall agree-ment when the model was forced with natural andanthropogenic forcings.155 In contrast to earlier work,Michaels and Knappenberger156 argued that the tim-ing of ENSO and volcanic events added a warmingtrend to the satellite record which, when accountedfor, exacerbated apparent discrepancies with modelexpectations. Santer et al. pointed out the dangers ofsuch analyses given that the timing of ENSO andvolcanoes are correlated in the observed record.157
In a pair of papers, Douglass et al.158,159 invoked afirst generation reanalysis as well as a dated sub-set of the available direct observations and arguedfor fundamental inconsistencies between model-basedexpectations and observed behavior over the satelliteera. Lindzen and Giannitsis160 hypothesized that theapparent discrepancy between observed and modeledbehavior over the satellite era could be related to adelay in surface response to an atmospheric tempera-ture jump in the mid-1970s.
Comparing the RSS and UAH MT records withGCMs, Santer et al.161 found the tropospheric finger-print of greenhouse gases evident only in RSS, high-lighting for the first time the importance of accountingfor observational uncertainty. A satellite era analy-sis for the tropics25,162 found that all observationsand climate models exhibited amplification of surfacechanges aloft on monthly to annual timescales, con-sistent with basic theory. However, on multidecadaltimescales climate models conformed to this behav-ior, whereas all observational estimates except RSSdamped rather than amplified the surface warmingaloft. While this discrepancy was attributed to modeldeficiencies, to observational errors, or a combinationof both, observational errors were concluded to be themost parsimonious explanation (Figure 7).
IPCC 2007The Fourth Assessment Report of the IPCC madeconsiderable use of the U.S. Climate Change ScienceProgram report on understanding temperature trendsin the lower atmosphere.2 This report, with authorshipfrom many of the principal participants in the debate,had taken several years to create and spawned manysignificant papers. It concluded that there was noevidence for a discrepancy between surface andtropospheric temperature trends globally but thatambiguity remained in the tropics. The presence ofsubstantial observational uncertainty in the tropicswas posited as the most likely explanation. Similarto its 2001 discussion, IPCC stated in 2007 that‘there is agreement that the uncertainties about long-term change are substantial’163 and that ‘it is difficultto make quantitatively defensible judgements as towhich, if any, of the multiple, independently-derivedestimates is closer to the true climate evolution’.Many sources of biases in the various datasets werediscussed. It noted that radiosonde data since 1958indicate tropospheric warming slightly exceedingsurface warming. The chapter on Understanding andAttributing Climate Change164 focused largely on thetropical troposphere,25,162 and highlighted the valueof a multimodel analysis to aid understanding.
Late 2000sThe last few years have witnessed even greater atten-tion to radiosonde and MSU data homogeneity andthe emergence of new approaches and data products.Modeling efforts have become more sophisticated. Thebasic conclusion that there is no discrepancy betweenmodel and observed trends is supported by the mostrecent work.
2010 Crown copyr ight

WIREs Climate Change Tropospheric temperature trends
FIGURE 7 | Tropical temperature behavior in observations andmodels (including those in Figure 1). Top panel characterizesmonth-to-month surface and LT temperature variability; bothobservations and models show surface variability is amplified aloft(slope of the line fit to the model points >1—the black line). Lowerpanel repeats the analysis for temperature trends over the period1979–1999; observations no longer agree with models, and all but RSSexhibit damping with height. Possible explanations are (1) a realmechanism that modulates long-term behavior that all models miss, or(2) residual nonclimatic influences in some or all the observations thatsubstantially impact their long-term trend estimates. The ClimateChange Science Program report concluded that the latter was the morelikely explanation.25 Adapted from Climate Change Science ProgramSynthesis and Assessment Product 1.1.2
Multiplicity of Homogenized Radiosondeand MSU datasetsThis period saw better exploration of uncertaintiesin current radiosonde datasets along with the cre-ation of three new independent datasets that increasedthe apparent uncertainty in radiosonde temperaturetrend estimates. Automation of analysis procedures165
and creation of error models for evaluating theirperformance166 led to the conclusion that HadATquite likely exhibits too little tropospheric warmingover the satellite era, particularly in the tropics. AUniversity of Vienna team used a novel homogeniza-tion approach167,168 involving ERA-40 reanalysis,12
on the premise that difference time series of radiosondeminus reanalysis background are sensitive indicatorsof changes in radiosonde biases. The detected break-points were adjusted with either the reanalysis field(RAOBCORE family of products167,168) or apparentlyhomogeneous neighbor segments (RICH168). Finally,another group led by Sherwood employed kriging, amethod used commonly in the geostatistical commu-nity, to synergistically estimate real climate signals,missing data, and artificial breakpoints through aniterative procedure (IUK169). Although they attaineda measure of success for a global network of stations,they expressed concern over likely remaining spuriouscooling biases in the deep tropics.
The Sherwood group also used radiosonde-measured winds through the thermal-wind relation-ship170–172 to infer substantial tropical upper-tropospheric warming. The strengths of this approachare that there have been fewer changes toradiosondes’ wind measurement techniques than totemperature measurements,173 and artefacts in windmeasurements are generally more easily identified andadjusted.
Over the satellite era those datasets consideredin the 2007 IPCC report (RATPAC and HadAT)exhibit less tropospheric warming than any of thenewer datasets at most levels (Figure 8). The apparentdiscrepancy with model behavior disappears if thenewest datasets are used. The ensemble estimate fromthe automated HadAT experiments166 (not shown)also includes the expected model behavior. An analysisusing a Bayesian selection criteria174 reinforcedprevious work175 that alternatives to a straight line fitmay better describe the time series evolution.
For MSU, RSS undertook substantial data repro-cessing to create version 3.2,176,177 resulting in minordifferences to their trend estimates and a quantifica-tion of the generally acceptable degree of agreementwith available radiosonde tropospheric datasets.177
A NOAA group178,179 (STAR) introduced a newmethod to produce MT, and later LS, estimates basedon simultaneous nadir overpass data near the poles.Because they should indicate the same temperaturefor a given scene, the simultaneous measurementsby different satellites can be used to quantify thebiases between them, although further adjustmentsare required.179 Trends derived from STAR showmore warming within the troposphere than similarproducts produced by others (Figure 8).
A series of studies compared MSU andradiosonde data, locally or regionally. Christy andNorris181 concluded UAH LT, MT, and LS productswere more reasonable than RSS products based oncloser agreement with radiosondes operated by the
2010 Crown copyr ight

Advanced Review wires.wiley.com/climatechange
Tropical tropospheric trends
−0.6 −0.4 −0.2 0 0.2 0.4 0.6 0.8
Trend (C/decade)
Surf
850
700
500
400
300
250
200
150
100P
ress
ure
(hP
a)
−0.1 0 0.1 0.2 0.3 0.4 0.5
Trend (C/decade)
MSU MT
MSU LT
Direct radiosondetemperatures
RATPAC-A
RICH
RAOBCORE v.1.4
HadAT2
IUK
Radiosonde windsAllen and Sherwood
MSU recordsUAHRSSUMdSTAR
Surface changeHadCRUT3
Model and theoreticalexpectations
Climate model meanand 5-95 percentile
MALR expectation
FIGURE 8 | Left: tropical tropospheric temperature trend estimates for 1979–2005 (K/decade) from adjusted radiosonde datasets and frommodels (derived by scaling the range of model amplification in Figure 7 by the HadCRUT3 surface trend180) and from moist-adiabatic lapse rate theory(MALR).162 Estimates from winds are from Allen and Sherwood.171 Right: same but for LT and MT layers and incorporating MSU time seriesestimates. The vertical displacement of the points in the right hand panels is for clarity only, and each point represents the average trend over therelevant MSU weighting function. The observations would fall within the model range if both the surface trend is accurate and the modelamplification constraint applies in the real world.
United States, and Christy et al.182 drew similar con-clusions for LT using tropical radiosonde stations.Christy and Norris183 confirmed these findings forAustralian data. The RSS adjustment procedure forthe transition from NOAA-11 to NOAA-12 was iden-tified as the primary problem. Randall and Herman184
using radiosonde data and Bengtsson and Hodges20
using reanalyses came to similar findings indepen-dently. But these various studies also revealed otherissues with the various MSU records considered. Satel-lite records were shown to be most uncertain whenone or more satellites are drifting rapidly.181,183 A fur-ther issue with such comparisons is that they generallyutilised raw radiosonde data or adjusted RATPAC orHadAT data, all of which subsequent research (seeabove) suggests retain a long-term cooling bias.
A Focus upon Understanding the TropicalTroposphereDetailed comparisons of radiosondes since 1958and GCMs185,186 indicated that the use ofhomogeneity-adjusted radiosonde data systematicallyimproves agreement between models and observa-tions, although even adjusted observations tended to
show less warming or more cooling than GCMs.Forster et al.187 hypothesized that model deficien-cies—insufficient ozone reduction in the tropical lowerstratosphere and excessive effects of convection in theupper troposphere—may explain the apparent exces-sive long-term warming of the upper tropical tropo-sphere in GCMs. Thorne et al.188 examined structuraluncertainty in both GCMs189 and observed data overboth the satellite and radiosonde eras, as well as choiceof analysis period start and end dates, and concludedthat uncertainties are large enough to preclude a fun-damental difference between model and real-worldtropical tropospheric amplification of warming. Aclaim by Douglass et al.190 that trends in tropicaltemperatures derived from models were substantiallyinconsistent with those from observations was refutedby Santer et al.191 using newer observational datasetsand correcting several methodological flaws. By com-paring temperature and precipitable water behavior inobservations, reanalyses, and climate models, Mearset al.192 concluded that MSU but not reanalysis trendestimates are reasonable. Recently, Klotzbach et al.193
argued for the presence of an artificial warming in theland surface record in the tropics using only a subset
2010 Crown copyr ight

WIREs Climate Change Tropospheric temperature trends
of the available tropospheric records. As is the normin scientific research and should be abundantly clearfrom the preceding sections, all these new analysesare likely to be reassessed and/or challenged by othersover the coming years.
SYNTHESIS AND CRITICALASSESSMENT
The controversy that began in 1990 regarding dif-fering rates of warming at the surface and in thetroposphere spurred much focused research. In retro-spect, it seems clear that the primary reason for thecontroversy was inadequate knowledge of the inher-ent uncertainties in estimates of temperature trends.These uncertainties are of two types: (1) structuraluncertainties of the observed upper-air data; and(2) uncertainties due to the internal variability of theatmosphere, both observed and modeled.
At the start of the controversy there was onlyone upper-air temperature dataset each from satellitesand radiosondes, and there was virtually no knowl-edge (or at least no acknowledgment in the literature)of the structural uncertainties that arise from attempt-ing to create a climate data record from individualobservations. The most crucial aspect is the processof homogenization, that is, attempting to remove theartificial effects of changing instruments and prac-tices that are known or suspected to contaminate therecord. The fundamental reason that the homogeniza-tion issue dominates this story is that historically wehave lacked a global climate observing system—so thatthe only recourse is to try to use weather observationsto assess climate changes.
The one satellite dataset available3 represented apioneering effort and stimulated much vital research.However, as the initial team that produced this prod-uct, and other teams, further scrutinized the data,myriad confounding effects were revealed. This led toa number of dataset revisions and alternative datasetsusing different underlying methodologies (Figures 9and 10).
The state of the radiosonde record was evenmore problematic as hardly any attempts at homog-enization had been made during the first few decades(1970s–1990s) of analysis of radiosonde data for cli-mate purposes. Throughout the 1990s researchersstruggled just to uncover (but not remove) the prob-lems in the data. Homogenization of radiosondedata is considerably more difficult than satellitesbecause of greater unknowns regarding changes to themeasurement system. Changes in radiosonde instru-ments and practices are often undocumented andoverlap rarely exists. Furthermore, each radiosonde
station usually has its own history, requiring a uniqueset of adjustments. Focusing on temperature anoma-lies at specific pressure levels, several homogenizedradiosonde datasets have been produced over the past5–10 years.
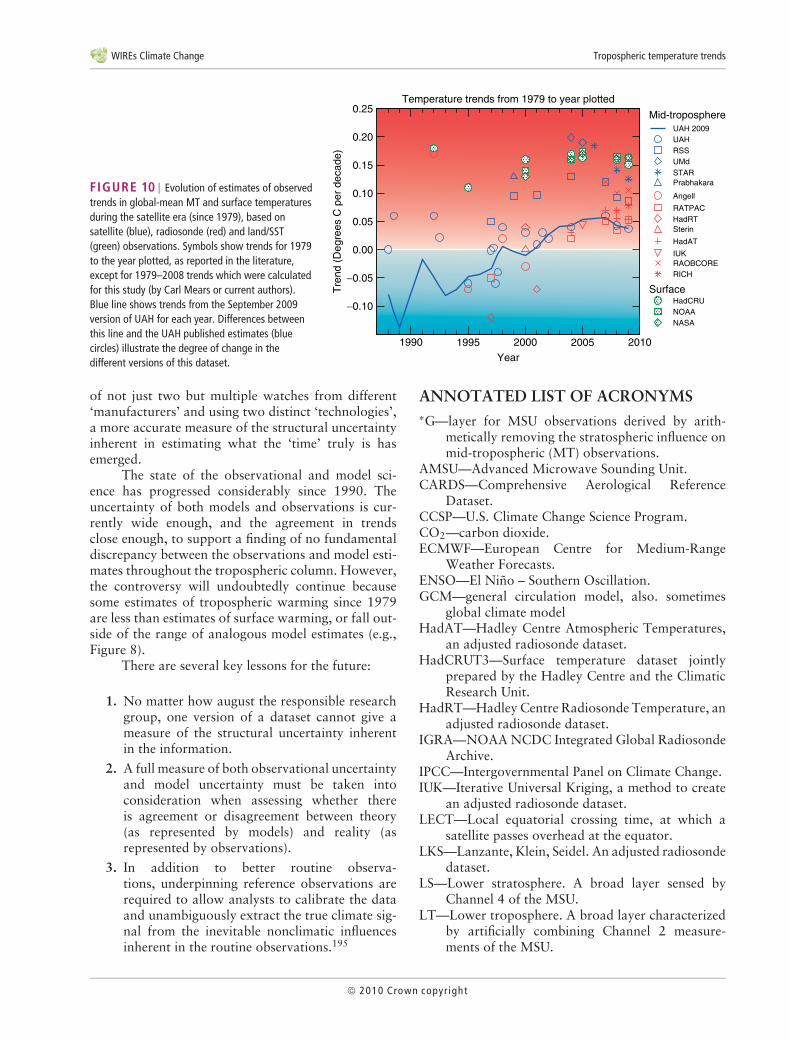
Figure 10 shows the evolution of publishedtemperature trends from 1979 to a given year between1989 and 2008 for the surface and MT (which includesa 10–15% contribution from the cooling stratosphere,Figure 4), from both radiosonde and MSU data. Forthe UAH MSU data, the evolution of this trendusing the September 2009 version is also shownfor reference. For the surface temperatures it shows(1) very good agreement between the three analyses;and (2) the trend has remained quite stable over morethan a decade. By contrast, the radiosonde analyses(1) differed considerably initially and, although theyare in much better agreement now, differences remain;and (2) the trend changed from negative (cooling) topositive (warming), sometime in the early 2000s. Forthe MSU analyses (1) in the early part of the recordthere was much volatility in the trends from the UAHgroup and after 1997, when more analyses becameavailable, there is considerable spread among thedifferent analyses and little evidence of convergenceover time, but (2) nevertheless the tendency towardall analyses showing a warming in the latter partof the record is clear. Additionally, there appears tobe convergence of the surface and mid-tropospheretrends in the latter part of the record. In summary, themost recent versions of all datasets do not support theconclusion of a significant difference in trend betweenthe surface and troposphere when considering (1) thestructural uncertainty (as evidenced by the spread) inthe MT trend estimates, (2) the very likely remainingcold bias in the radiosonde trend estimates, and (3) thefact that the MT trend has a small stratosphericcooling component.
With regard to understanding internal variabil-ity of the Earth system, technological advances incomputing power have greatly improved the abil-ity to make model-based estimates. In 1990, onlya few institutions had the resources to build, main-tain and run GCMs capable of examining long-termchanges, and they generally ran single model real-isations. By contrast, today about 20 institutionsmaintain large-scale climate models, and ensembles ofruns to characterize climate system variability are thenorm.
Hence, there now exists a larger set of obser-vational and model results, and these exhibit adegree of agreement, even in the tropics, wherecontroversy has been greatest (Figures 7 and 8).
2010 Crown copyr ight

Advanced Review wires.wiley.com/climatechange
Year
1960 1970 1980 1990 2000 2010
Mid
trop
osph
eric
tem
pera
ture
anom
aly
(K)
Tem
pera
ture
ano
mal
ydi
ffere
nce
(K)
HadAT - MeanRATPAC - MeanRadiosonde - Mean
IUK - MeanRaobcore - Mean
RICH - MeanRSS - Mean
UAH - MeanSTAR - Mean
0.5
0.0
−0.51.0
0.5
0.0
−0.5
−1.0
1.0
0.5
0.0
−0.5
−1.0
0.5
0.0
−0.5
Tem
pera
ture
ano
mal
ydi
ffere
nce
(K)
Low
er tr
opos
pher
ic te
mpe
ratu
rean
omal
y (K
)
FIGURE 9 | Smoothed global-mean temperature anomalies for 1958–2009 based on radiosonde and MSU datasets for two layers (top MT;bottom LT). In each panel, the bottom trace is the average of five radiosonde datasets (HadAT, RATPAC, IUK, RAOBCORE, and RICH), and above aredifferences for individual datasets. Modified from State of the Climate in 2008194 and courtesy of Carl Mears, Remote Sensing Systems.
Supporting this broad perspective are important spe-cific findings. Multiple lines of evidence suggest thatmany radiosonde datasets suffer from a bias towardexcessive stratospheric cooling and insufficient tropo-spheric warming59,114,120,165,166,169 and that this biasis largest in the tropics,119,123 where the separationbetween the models and some of the radiosondeobservations was largest. Further, independentwind measurements,169,171 physically-based argu-ments involving model-observational comparisons onshort and long time scales,25,162 and explicit removalof stratospheric cooling effects from satellite tropicaltropospheric trend estimates10 argue in favor of theconsistency between modeled and observed trends.
Overall, there is now no longer reasonable evi-dence of a fundamental disagreement between modelsand observations with regard to the vertical struc-ture of temperature change from the surface through
the troposphere.2,191 This is mainly due to a muchbetter understanding of the real level of uncer-tainty in estimates of past changes and expectationsfrom climate models. Ironically, elucidation of thetrue (large) degree of uncertainty in actual trendsfrom observations and expected trends from mod-els has led to greater confidence that they are notinconsistent.
CONCLUDING REMARKS
There is an old saying that a person with one watchalways knows what time it is, but with two watchesone is never sure. The controversy over surface andtropospheric temperature trends started in 1990 whenthe first satellite upper air ‘watch’ was producedand it was naıvely assumed that it told the correcttime. Over the subsequent years, with the advent
2010 Crown copyr ight
WIREs Climate Change Tropospheric temperature trends
FIGURE 10 | Evolution of estimates of observedtrends in global-mean MT and surface temperaturesduring the satellite era (since 1979), based onsatellite (blue), radiosonde (red) and land/SST(green) observations. Symbols show trends for 1979to the year plotted, as reported in the literature,except for 1979–2008 trends which were calculatedfor this study (by Carl Mears or current authors).Blue line shows trends from the September 2009version of UAH for each year. Differences betweenthis line and the UAH published estimates (bluecircles) illustrate the degree of change in thedifferent versions of this dataset.
1990 1995 2000 2005 2010
Year
−0.10
−0.05
0.00
0.05
0.10
0.15
0.20
0.25
Tre
nd (
Deg
rees
C p
er d
ecad
e)
Mid-troposphereUAH 2009UAHRSSUMdSTARPrabhakara
Angell
RATPACHadRTSterin
HadAT
IUKRAOBCORERICH
SurfaceHadCRUNOAANASA
Temperature trends from 1979 to year plotted
of not just two but multiple watches from different‘manufacturers’ and using two distinct ‘technologies’,a more accurate measure of the structural uncertaintyinherent in estimating what the ‘time’ truly is hasemerged.
The state of the observational and model sci-ence has progressed considerably since 1990. Theuncertainty of both models and observations is cur-rently wide enough, and the agreement in trendsclose enough, to support a finding of no fundamentaldiscrepancy between the observations and model esti-mates throughout the tropospheric column. However,the controversy will undoubtedly continue becausesome estimates of tropospheric warming since 1979are less than estimates of surface warming, or fall out-side of the range of analogous model estimates (e.g.,Figure 8).
There are several key lessons for the future:
1. No matter how august the responsible researchgroup, one version of a dataset cannot give ameasure of the structural uncertainty inherentin the information.
2. A full measure of both observational uncertaintyand model uncertainty must be taken intoconsideration when assessing whether thereis agreement or disagreement between theory(as represented by models) and reality (asrepresented by observations).
3. In addition to better routine observa-tions, underpinning reference observations arerequired to allow analysts to calibrate the dataand unambiguously extract the true climate sig-nal from the inevitable nonclimatic influencesinherent in the routine observations.195
ANNOTATED LIST OF ACRONYMS∗G—layer for MSU observations derived by arith-
metically removing the stratospheric influence onmid-tropospheric (MT) observations.
AMSU—Advanced Microwave Sounding Unit.CARDS—Comprehensive Aerological Reference
Dataset.CCSP—U.S. Climate Change Science Program.CO2—carbon dioxide.ECMWF—European Centre for Medium-Range
Weather Forecasts.ENSO—El Nino – Southern Oscillation.GCM—general circulation model, also. sometimes
global climate modelHadAT—Hadley Centre Atmospheric Temperatures,
an adjusted radiosonde dataset.HadCRUT3—Surface temperature dataset jointly
prepared by the Hadley Centre and the ClimaticResearch Unit.
HadRT—Hadley Centre Radiosonde Temperature, anadjusted radiosonde dataset.
IGRA—NOAA NCDC Integrated Global RadiosondeArchive.
IPCC—Intergovernmental Panel on Climate Change.IUK—Iterative Universal Kriging, a method to create
an adjusted radiosonde dataset.LECT—Local equatorial crossing time, at which a
satellite passes overhead at the equator.LKS—Lanzante, Klein, Seidel. An adjusted radiosonde
dataset.LS—Lower stratosphere. A broad layer sensed by
Channel 4 of the MSU.LT—Lower troposphere. A broad layer characterized
by artificially combining Channel 2 measure-ments of the MSU.
2010 Crown copyr ight

Advanced Review wires.wiley.com/climatechange
MSU—Microwave Sounding Unit.MT—Middle troposphere.NCDC—NOAA’s National Climatic Data Center.NOAA—U.S. National Oceanic and Atmospheric
Administration.NRC—U.S. National Research Council.RAOBCORE—RAdiosonde OBservation COrrec-
tion using REanalyses, an adjusted radiosondedataset.
RATPAC—Radiosonde Atmospheric TemperatureProducts for Climate, an adjusted radiosondedataset.
RICH—Radiosonde Innovation Composite Homoge-nization, an adjusted radiosonde dataset.
RIHMI—All-Russian Research Institute of Hydrom-eteorological Information, developer ofradiosonde data products.
RSS—Remote Sensing Systems, developer of a versionof MSU data products.
SCEP—Study of Critical Environmental Problems, a1970 assessment report.
SST—Sea Surface Temperature.UAH—University of Alabama in Huntsville, developer
of a version of MSU data products.UMd—University of Maryland.
ACKNOWLEDGEMENTS
We thank Antonio Garcia (ECMWF); Kevin Linklater, and Fiona Carroll (U.K. Met Office); Sara Veasey, DebMisch, Debi Riddle, and Glenn Hyatt (NOAA NCDC); and Carl Mears (Remote Sensing Systems) for help withsourcing and adapting many of the figures used herein. Mara Sprain (NOAA NCDC, STG Inc.) collated andformatted the reference list. We thank the anonymous reviewers. As internal or informal reviewers, Jim Angell,Melissa Free, Jana Goldman, Tom Knutson, L. Myles, David Parker, and Ron Stouffer helped to sharpen thetext and ensure the inclusion of relevant work. PWT was supported by the Joint DECC and Defra IntegratedClimate Programme—DECC/Defra (GA01101).
REFERENCES1. Manabe S, Wetherald R. Thermal equilibrium of the
atmosphere with a given distribution of relative humid-ity. J Atmos Sci 1967, 24:241–259.
2. Karl TR, Hassol SJ, Miller CD, Murray WL, eds.Temperature Trends in the Lower Atmosphere:Steps for Understanding and Reconciling Dif-ferences. Washington, DC: U.S. Climate ChangeScience Program and Subcommittee on GlobalChange Research; 2006, http://www.climatescience.gov/Library/sap/sap1-1/finalreport/default.htm.
3. Spencer RW, Christy JR. Precise monitoring of globaltemperature trends from satellites. Science 1990,247:1558–1562.
4. National Research Council. Reconciling Observationsof Global Temperature Change. Washington, DC:National Academy Press; 2000, 85.
5. Durre I, Vose RS, Wuertz DB. Overview of the inte-grated global radiosonde archive. J Clim 2006,19:53–68.
6. Grant AN, Bronnimann S, Ewen T, Nagurny A. Anew look at radiosonde data prior to 1958. J Clim2009, 22:3232–3247.
7. Thorne PW, Parker DE, Tett SFB, Jones PD,McCarthy M, Coleman H, Brohan P. Revisitingradiosonde upper air temperatures from 1958to 2002. J Geophys Res 2005, 110:D18105.DOI:10.1029/2004JD005753.
8. Smith WL, Woolf HM, Hayden CM, Wark DQ,McMillan LM. The TIROS-N operational verticalsounder. Bull Amer Meteor Soc 1979, 60:1177–1187.
9. Spencer RW, Christy JR. Precision and radiosondevalidation of satellite gridpoint temperature anoma-lies. Part II: A tropospheric retrieval and trends during1979–90. J Clim 1992, 5:858–866.
10. Fu Q, Johanson CM, Warren SG, Seidel DJ. Contribu-tion of stratospheric cooling to satellite-inferred tropo-spheric temperature trends. Nature 2004, 429:55–58.
11. Kalnay E, Kanamitsu M, Kistler R, Collins W,Deaven D, Gandin L, Iredell M, Saha S. White G,Woollen J, et al. The NCEP/NCAR 40-year reanalysisproject. Bull Amer Meteor Soc 1996, 77:437–471.
12. Uppala SM, Kallberg PW, Simmons AJ, Andrae U,Da Costa Bechtold V, Fiorino M, Gibson JK,Haseler J, Hernandez A, Kelly GA, et al. The ERA-40 re-analysis. Qtrly J Royal Meteor Soc 2005,131:2961–3012.
13. Onogi K, Tsutsui J, Koide H, Sakamoto M,Kobayashi S, Hatsushika H, Matsumoto T,Yamazaki N, Kamahori H, Takahashi K, et al. TheJRA-25 reanalysis. J Meteor Soc Japan 2007,85:369–432.
14. Graversen RG, Mauritsen T, Tjernstrom M, KallenE, Svensson G. Vertical structure of recent Arcticwarming. Nature 2008, 451:53–56.
2010 Crown copyr ight
WIREs Climate Change Tropospheric temperature trends
15. Thorne PW. Arctic tropospheric warming amplifica-tion? Nature 2008, 455:E1–E2. DOI:10.1038/nature07256.
16. Grant AN, Bronnimann S, Haimberger L. Recent Arc-tic warming vertical structure contested. Nature 2008,455:E2–E3. DOI:10/1038/nature07257.
17. Bitz CM, Fu Q. Arctic warming aloft is data set depen-dent. Nature 2008, 455:E3–E4. DOI:10.1038/nature07258.
18. Christy JR, Seidel DJ, Sherwood SC. What kinds ofatmospheric temperature variations can the cur-rent observing systems measure and what are theirstrengths and limitations, both spatially and tempo-rally? In: Karl TR, Hassol SJ, Miller CD, Murray WL,eds. Temperature Trends in the Lower Atmosphere:Steps for Understanding and Reconciling Differ-ences. Washington DC: U.S. Climate Change ScienceProgram and the Subcommittee on Global ChangeResearch; 2006, 29–46.
19. Thorne PW, Vose RS. Reanalyses suitable for charac-terizing long-term trends. Are they really achievable?Bull Amer Meteor Soc 2010, 91:353–361.
20. Bengtsson L, Hodges KI. On the evaluation of tem-perature trends in the tropical troposphere. Clim Dyn2009. DOI:10.1007/s00382-009-0680-y.
21. Simmons AJ, Jones PD, Bechtold VD, Beljaars ACM,Kallberg PW, Saarinen S, Uppala SM, Viterbo P,Wedi N. Comparison of trends and low-frequencyvariability in CRU, ERA-40, and NCEP/NCAR anal-yses of surface air temperature. J Geophys Res 2004,109:D24115. DOI:10.1029/2004JD005306.
22. Simmons AJ, Willett KM, Jones PD, Thorne PW,Dee D. Low-frequency variations in surface atmo-spheric humidity, temperature and precipitation: infer-ences from reanalyses and monthly gridded observa-tional datasets. J Geophys Res 2010, 115:D01110.DOI:10.1029/2009JD012442.
23. Cubasch U, Cess RD. Processes and modelling. In:Houghton JT, Jenkins GJ, Ephraums JJ, eds. ClimateChange: The IPCC Scientific Assessment. Cambridge,UK and New York, NY: Cambridge University Press;1990, 69–91.
24. McAvaney BJ, Covey C, Joussaume S, Kattsov V,Kitho A, Ogana W, Pitman AJ, Weaver AJ, Wood RA,Zhao Z-C. Model evaluation. In: Houghton JT,Ding Y, Griggs DJ, Noguer M, van der Linden PJ,Dai X, Maskell K, Johnson CA, eds. Climate Change2001: The Scientific Basis. Cambridge, UK andNew York, NY: Cambridge University Press; 2001,471–523.
25. Santer BD, Penner JE, Thorne PW. How well canthe observed vertical temperature changes be rec-onciled with our understanding of the causes ofthese changes? In: Karl TR, Hassol SJ, Miller CD,Murray WL, eds. Temperature Trends in the LowerAtmosphere: Steps for Understanding and Reconciling
Differences. Washington, DC: U.S. Climate ChangeScience Program and the Subcommittee on GlobalChange Research; 2006, 89–118.
26. Le Treut H, Somerville R, Cubasch U, Ding Y,Mauritzen C, Mokssit A, Peterson T, Prather M. His-torical overview of climate change science. In:Solomon S, Qin D, Manning M, Chen Z, Marquis M,Averyt KB, Tignor M, Miller HL, eds. Climate Change2007: The Physical Science Basis. Cambridge, UK andNew York, NY: Cambridge University Press; 2007,93–127.
27. Manabe S, Wetherald RT. Effects of doubling CO2
concentration on climate of a general circulationmodel. J Atmos Sci 1975, 32:3–15.
28. Manabe S. Carbon dioxide and climate. Adv Geophys1983, 25:39–82.
29. Manabe S, Stouffer RJ, Spelman MJ. Response of acoupled ocean-atmosphere model to increasing atmo-spheric carbon dioxide. Ambio 1994, 23:44–49.
30. Tett SFB, Mitchell JFB, Parker DE, Allen MR. Humaninfluence on the atmospheric vertical temperaturestructure: detection and observations. Science 1996,274:1170–1173.
31. Tett SFB, Jones GS, Stott PA, Hill DC, Mitchell JFB,Allen MR, Ingram WJ, Johns TC, Johnson CE,Jones A, et al. Estimation of natural and anthro-pogenic contributions to 20th century temper-ature change. J Geophys Res 2002, 107:4306.DOI:10.1029/2000JD000028.
32. Stott PA, Jones GS, Lowe JA, Thorne P, Durman CF,Johns TC, Thelen J-C. Transient climate simulationswith the HadGEM1 climate model: causes of pastwarming and future climate change. J Clim 2006,19:2763–2782.
33. Lorenz EN. Deterministic nonperiodic flow. J AtmosSci 1963, 20:130–141.
34. Meehl GA, Boer GJ, Covey C, Latif M, Stouffer RJ.The coupled model intercomparison project (CMIP).Bull Amer Meteor Soc 2000, 81:313–318.
35. SCEP (Study of Critical Environmental Problems).In: Matthews WH, ed. Man’s Impact on the GlobalEnvironment: Assessment and Recommendations forAction. Cambridge, MA: MIT Press; 1970, 319.
36. Ramanathan V. The role of ocean-atmosphere inter-actions in the CO2 climate problem. J Atmos Sci 1981,38:918–930.
37. Lindzen RS, Hou AY, Farrell BF. The role of convec-tive model choice in calculating the climate impact ofdoubling CO2. J Atmos Sci 1982, 39:1189–1205.
38. Hansen J, Lacis A, Rind D, Russell L, Stone P, Fung I,Ruedy R, Lerner J. Climate sensitivity analysis of feed-back mechanisms. In: Hansen J, Takahashi T, eds. Cli-mate Processes and Climate Sensitivity. Washington,DC: American Geophysical Union; 1984, 130–163.
2010 Crown copyr ight

Advanced Review wires.wiley.com/climatechange
39. Wetherald RT, Manabe S. An investigation of cloudcover change in response to thermal forcing. ClimChange 1986, 8:5–23.
40. Schlesinger M, Mitchell J. Climate model simulationsof the equilibrium climatic response to increased car-bon dioxide. Rev Geophys 1987, 25:760–798.
41. Angell JK, Korshover J. Estimate of the global changein tropospheric temperature between 1958 and 1973.Mon Wea Rev 1975, 103:1007–1012.
42. Angell JK, Korshover J. Estimate of global change intemperature, surface to 100 mb, between 1958 and1975. Mon Wea Rev 1977, 105:375–385.
43. Oort AH. Global Atmospheric Circulation Statistics,1958–1973. Washington DC: U.S. Government Print-ing Office; 1983, 180 [NOAA Professional Paper 14].
44. Angell JK. Variations and trends in tropospheric andstratospheric global temperatures, 1958–87. J Clim1988, 12:1296–1313.
45. Parker DE. The influence of the Southern Oscillationand volcanic eruptions on temperature in the tropicaltroposphere. Int J Clim 1985, 5:273–282.
46. Peterson TC, Karl TR, Jamason PF, Knight R, East-erling DR. First difference method: maximizing sta-tion density for the calculation of long-termglobal temperature change. J Geophys Res 1998,103:25967–25974.
47. Angell JK. Impact of El Nino on the delineationof tropospheric cooling due to volcanic eruptions.J Geophys Res 1988, 93:3697–3704.
48. Spencer RW, Christy JR, Grody NC. Global atmo-spheric temperature monitoring with satellitemicrowave measurements: method and results. J Clim1990, 3:1979–1985.
49. Gary BL, Keihm SJ. Microwave sounding units andglobal warming. Science 1991, 251:316–317.
50. Spencer RW, Christy JR. Microwave sounding unitsand global warming: response. Science 1991, 251:317.
51. Folland CK, Karl T, Vinnikov KY. Observed climatevariations and change. In: Houghton JT, Jenkins GJ,Ephraums JJ, eds. Climate Change: The IPCC Scien-tific Assessment. Cambridge, UK and New York, NY:Cambridge University Press; 1990, 195–238.
52. Epstein ES. Detecting climate change. J Appl Meteor1982, 21:1172–1182.
53. Parker DE. On the detection of temperature changesinduced by increasing atmospheric carbon dioxide.Qtrly J Royal Meteor Soc 1985, 111:587–601.
54. Karoly D. Northern hemisphere temperature trends:a possible greenhouse gas effect? Geophys Res Lett1989, 16:465–468.
55. Karoly DJ. Southern hemsiphere temperature trends:a possible greenhouse gas effect? Geophys Res Lett1987, 14:1139–1141.
56. Wigley TML, Barnett TP. Detection of the greenhouseeffect in the observations. In: Houghton JT, Jenk-ins GJ, Ephraums JJ, eds. Climate Change: The IPCCScientific Assessment. Cambridge, UK and New York,NY: Cambridge University Press; 1990, 239–255.
57. Oort AH, Liu HZ. Upper-air temperature trends overthe globe. J Clim 1993, 6:1958–1989.
58. Parker D, Cox D. Towards a consistent global cli-matological rawinsonde data-base. Int J Clim 1995,15:473–496.
59. Gaffen DJ. Temporal inhomogeneities in radiosondetemperature records. J Geophys Res 1994,99:3667–3676.
60. Gaffen DJ. Historical Changes in Radiosonde Instru-ments and Practices: Instruments and ObservingMethods. Geneva: World Meteorological Organiza-tion; 1993 [Report 50, WMO/TD-541].
61. Christy JR, Spencer RW, McNider RT. Reducingnoise in the MSU daily lower tropospheric globaltemperature data set. J Clim 1995, 8:888–896.
62. Spencer RW, Christy JR. Precision and radiosondevalidation of satellite gridpoint temperature anoma-lies. Part I: MSU channel 2. J Clim 1992, 5:847–857.
63. Spencer RW, Christy JR. Precision lower stratospherictemperature monitoring with the MSU: Technique,validation, and results 1979–1991. J Clim 1993,6:1194–1204.
64. Christy JR, Drouilhet SJ. Variability in daily, zonalmean lower-stratospheric temperatures. J Clim 1994,7:106–120.
65. Christy JR, Goodridge J. Precision global tempera-tures from satellites and urban warming effects ofnon-satellite data. Atmos Env 1995, 29:1957–1961.
66. Christy JR. Temperature above the surface layer. ClimChange 1995, 31:455–474.
67. Jones PD. Recent warming in global temperatureseries. Geophys Res Lett 1994, 21:1149–1152.
68. Christy JR, McNider RT. Satellite greenhouse signal.Nature 1994, 367:325.
69. Hansen J, Wilson H, Sato M, Ruedy R, Shah K,Hansen E. Satellite and surface temperature data atodds? Clim Change 1995, 30:103–117.
70. Karoly DJ, Cohen JA, Meehl GA, Mitchell JFB,Oort AH, Stouffer RJ, Wetherald RT. An example offingerprint detection of greenhouse climate-change.Clim Dyn 1994, 10:97–105.
71. Santer BD, Taylor KE, Wigley TML, Johns TC,Jones PD, Karoly, DJ, Mitchell JFB, Oort AH, Pen-ner JE, Ramaswamy V, et al. A search for humaninfluences on the thermal structure of the atmosphere.Nature 1996, 382:39–46.
72. Nicholls N, Gruza GV, Jouzel J, Karl TR, Ogallo LA,Parker DE. Observed climate variability and change.In: Houghton JT, Meira Filho LG, Callander BA,Harris N, Kattenberg A, Maskell K, eds. Climate
2010 Crown copyr ight

WIREs Climate Change Tropospheric temperature trends
Change 1995: The Science of Climate Change. Cam-bridge, UK and New York, NY: Cambridge UniversityPress; 1996, 133–192.
73. Santer BD, Wigley TML, Barnett TP, Anyamba E.Detection of climate change and attribution ofcauses. In: Houghton JT, Meira Filho LG, Callan-der BA, Harris N, Kattenberg A, Maskell K, eds. Cli-mate Change 1995: The Science of Climate Change.Cambridge, UK and New York, NY: Cambridge Uni-versity Press; 1996, 407–443.
74. Parker DE, Gordon M, Cullum DPN, Sexton DMH,Follard CK, Rayner N. A new global griddedradiosonde temperature data base and recent temper-ature trends. Geophys Res Lett 1997, 24:1499–1502.
75. Eskridge RE, Alduchov OA, Chernykh IV, Panmao Z,Polansky AC, Doty S. A Comprehensive AerologicalResearch Data Set (CARDS): rough and systematicerrors. Bull Amer Meteor Soc 1995, 76:1759–1775.
76. Wallis T. A subset of core stations from the Com-prehensive Aerological Reference Dataset (CARDS).J Clim 1998, 11:272–282.
77. Sterin AM, Eskridge RE. Monthly aerological data set:Some features and comparison of upper-air tempera-ture data to the NCAR/NCEP reanalysis monthly data.Proceedings of the 22nd Annual Climate Diagnos-tics and Prediction Workshop: 6–10 October 1997,Berkeley. Silver Spring MD: National Oceanic andAtmospheric Administration; 1998, 210–213.
78. Sterin AM. An analysis of linear trends in the freeatmosphere temperature series for 1958-1997 (inRussian). Meteor Gidrol 1999, 5:52–68.
79. Angell JK. Comparison of surface and tropospherictemperature trends estimated from a 63-stationradiosonde network, 1958-1998. Geophys Res Lett1999, 26:2761–2764.
80. Angell JK. Difference in radiosonde temperature trendfor the period 1979–1998 of MSU data and the period1959–1998 twice as long. Geophys Res Lett 2000,27:2177–2180.
81. Luers JK, Eskridge RE. Use of radiosonde temperaturedata in climate studies. J Clim 1998, 11:1002–1019.
82. Durre I, Peterson TC, Vose RS. Evaluation ofthe Luers-Eskridge homogeneity adjustments toradiosonde temperature measurements. J Clim 2002,15:1335–1347.
83. Gaffen DJ, Sargent MA, Habermann RE, LanzanteJR. Sensitivity of tropospheric and stratospheric tem-perature trends to radiosonde data quality. J Clim2000, 13:1776–1796.
84. Christy JR, Spencer RW, Lobl ES. Analysis of themerging procedure for the MSU daily temperaturetime series. J Clim 1998, 11:2016–2041.
85. Christy JR, Spencer RW, Braswell WD. MSU tro-pospheric temperatures: Dataset construction andradiosonde comparisons. J Atmos Ocean Tech 2000,17:1153–1170.
86. Mo T. A study of the microwave sounding unit on theNOAA-12 satellite. IEEE Trans Geosci Remote Sens1995, 33:1141–1152.
87. Wentz FJ, Schabel M. Effects of satellite orbital decayon MSU lower tropospheric temperature trends.Nature 1998, 394:661–664.
88. Prabhakara C, Iacovazzi R. Comments on ‘‘Analysisof the merging procedure for the MSU daily tempera-ture time series’’. J Clim 1999, 12:3331–3334.
89. Prabhakara C, Iacovazzi R, Yoo J-M, Dalu G. Globalwarming: evidence from satellite observations.Geophys Res Lett 2000, 27:3517–3520.
90. Gaffen DJ. Falling satellites, rising temperatures?Nature 1998, 394:615–616.
91. Gee H. Satellite climate record in error. Nature 1998,DOI:10.1038/news980820-1.
92. Hansen JE, Sato M, Ruedy R, Lacis A, Glascoe J.Global climate data and models: reconciliation.Science 1998, 281:930–932.
93. Kerr R. Among global thermometers, warming stillwins out. Science 1998, 281:1948–1949.
94. Prabhakara C, Iacovazzi R, Yoo J-M, Dalu G. Globalwarming deduced from MSU. Geophys Res Lett 1998,25:1927–1930.
95. Hurrell JW, Trenberth KE. Spurious trends in satel-lite MSU temperatures from merging different satelliterecords. Nature 1997, 386:164–167.
96. Hurrell JW, Trenberth KE. Difficulties in obtainingreliable temperature trends: reconciling the surface andsatellite MSU 2R trends. J Clim 1998, 11:945–967.
97. Trenberth KE, Hurrell JW. Response to ‘‘How accu-rate are satellite ’thermometers’?’’. Nature 1997,389:342–343.
98. Jones PD, Osborn TJ, Wigley TML, Kelly PM,Santer BD. Comparisons between the MSU 2R temper-ature record and the surface temperature record over1979 to 1996: real differences or potential discontinu-ities? J Geophys Res 1997, 102:30135–30145.
99. Christy JR, Spencer RW, Braswell WD. How accu-rate are satellite ’thermometers’? Nature 1997,389:342–343.
100. Allen MR, Tett SFB. Checking for model consistencyin optimal fingerprints. Clim Dyn 1999, 15:419–434.
101. Gillett NP, Allen MR, Tett SFB. Modelled andobserved variability in atmospheric vertical temper-ature structure. Clim Dyn 2000, 16:49–61.
102. Folland CK, Sexton DMH, Karoly DJ, Johnson CE,Rowell DP, Parker DE. Influences of anthropogenicand oceanic forcing on recent climate change. GeophysRes Lett 1998, 25:353–356.
103. Hurrell JW, Trenberth KE. Satellite versus surface esti-mates of air temperature since 1979. J Clim 1996,9:2222–2232.
2010 Crown copyr ight

Advanced Review wires.wiley.com/climatechange
104. Hurrell JW, Brown SJ, Trenberth KE, Christy JR.Comparison of tropospheric temperatures fromradiosondes and satellites: 1979–98. Bull Amer MeteorSoc 2000, 81:2165–2177.
105. Folland CK, Karl TR, Christy JR, Clarke RA,Gruza GV, Jouzel J, Mann ME, Oerlemans J,Salinger MJ, Wang S-W. Observed climate variabil-ity and change. In: Houghton JT, Ding Y, Griggs DJ,Noguer M, van der Linden PJ, Dai X, Maskell K,Johnson CA, eds. Climate Change 2001: The ScientificBasis. Cambridge, UK and New York, NY: CambridgeUniversity Press; 2001, 99–181.
106. Santer BD, Hnilo JJ, Wigley TML, Boyle JS, Doutri-aux C, Fiorino M, Parker DE, Taylor KE. Uncertain-ties in observationally based estimates of temperaturechange in the free atmosphere. J Geophys Res 1999,104:6305–6333.
107. Santer BD, Wigley TML, Boyle JS, Gaffen DJ,Hnilo JJ, Nychka D, Parker DE, Taylor KE. Statisti-cal significance of trends and trend differences inlayer-average atmospheric temperature time series.J Geophys Res 2000, 105:7337–7356.
108. Stendel M, Christy JR, Bengtsson L. Assessing levelsof uncertainty in recent temperature time series. ClimDyn 2000, 16:587–601.
109. Gaffen DJ, Santer BD, Boyle JS, Christy JR, Gra-ham NE, Ross RJ. Multidecadal changes in the verticaltemperature structure of the tropical troposphere. Sci-ence 2000, 287:1242–1245.
110. Brown SJ, Parker DE, Folland CK, Macadam I.Decadal variability in the lower-tropospheric lapserate. Geophys Res Lett 2000, 27:997–1000.
111. Mitchell JFB, Karoly DJ, Hegerl GC, Zwiers FW,Allen MR, Marengo J. Detection of climate changeand attribution of causes. In: Houghton JT, Ding Y,Griggs DJ, Noguer M, van der Linden PJ, Dai X,Maskell K, Johnson CA, eds. Climate Change 2001:The Scientific Basis. Cambridge, UK and New York,NY: Cambridge University Press; 2001, 695–738.
112. Free M, Durre I, Aguilar E, Seidel D, Peterson TC,Eskridge RE, Luers JK, Parker D, Gordon M, Lan-zante J, et al. Creating climate reference datasets:CARDS workshop on adjusting radiosonde temper-ature data for climate monitoring. Bull Amer MeteorSoc 2002, 83:891–899.
113. Lanzante JR, Klein SA, Seidel DJ. Temporal homoge-nization of monthly radiosonde temperature data. PartI: Methodology. J Clim 2003, 16:224–240.
114. Lanzante JR, Klein SA, Seidel DJ. Temporal homoge-nization of monthly radiosonde temperature data. PartII: Trends, sensitivities, and MSU comparison. J Clim2003, 16:241–262.
115. Free M, Angell JK, Durre I, Lanzante JR, Peterson TC,Seidel DJ. Using first differences to reduce inhomo-geneity in radiosonde temperature datasets. J Clim2004, 17:4171–4179.
116. Free M, Seidel DJ, Angell JK, Lanzante JR, Durre I,Peterson TC. Radiosonde Atmospheric TemperatureProducts for Assessing Climate (RATPAC): a new dataset of large-area anomaly time series. J Geophys Res2005, 110:D22101. DOI:10.1029/2005JD006169.
117. Eskridge RE, Luers JK, Redder CR. Unexplained dis-continuity in the U.S. radiosonde temperature data.Part I: Troposphere. J Clim 2003, 16:2385–2395.
118. Redder CR, Luers JK, Eskridge RE. Unexplained dis-continuity in the U.S. radiosonde temperature data.Part II: Stratosphere. J Atmos Ocean Tech 2004,21:1133–1144.
119. Sherwood SC, Lanzante JR, Meyer CL. Radiosondedaytime biases and late-20th century warming. Science2005, 309:1556–1559.
120. Randel W, Wu F. Biases in stratospheric and tropo-spheric temperature trends derived from historicalradiosonde data. J Clim 2006, 19:2094–2104.
121. Randel W, Wu F. Reply to comments on ‘‘Biasesin stratospheric and tropospheric temperature trendsderived from historical radiosonde data’’. J Clim 2007,20:3710–3711.
122. Free M, Seidel DJ. Comments on ‘‘Biases in strato-spheric and tropospheric temperature trends derivedfrom historical radiosonde data’’. J Clim 2007,20:3704–3709.
123. Angell JK. Effect of exclusion of anomalous tropi-cal stations on temperature trends from a 63-stationradiosonde network, and comparison with other anal-yses. J Clim 2003, 16:2288–2295.
124. Christy JR, Spencer RW, Norris WB, Braswell WD,Parker DE. Error estimates of version 5.0 of MSU-AMSU bulk atmospheric temperatures. J AtmosOcean Tech 2003, 20:613–629.
125. Mears CA, Schabel MC, Wentz FJ. A reanalysis ofthe MSU channel 2 tropospheric temperature record.J Clim 2003, 16:3650–3664.
126. Mears CA, Wentz FJ. The effect of diurnal correctionon satellite-derived lower tropospheric temperature.Science 2005, 309:1548–1551.
127. Christy JR, Spencer RW. Correcting temperature datasets. Science 2005, 310:972.
128. Vinnikov KY, Grody NC. Global warming trend ofmean tropospheric temperature observed by satellites.Science 2003, 302:269–272.
129. Grody NC, Vinnikov KY, Goldberg MD, Sullivan JT,Tarpley JD. Calibration of multisatellite observa-tions for climatic studies: Microwave SoundingUnit (MSU). J Geophys Res 2004, 109:D24104.DOI:10.1029/2004JD005079.
130. Vinnikov KY, Grody NC, Robock A, Stouffer RJ,Jones PD, Goldberg MD. Temperature trends at thesurface and in the troposphere. J Geophys Res 2006,111:D03106. DOI:10.1029/2005JD006392.
131. Christy JR, Norris WB. What may we con-clude about global tropospheric temperature
2010 Crown copyr ight
WIREs Climate Change Tropospheric temperature trends
trends? Geophys Res Lett 2004, 31:L06211.DOI:10.1029/2003GL019361.
132. Mears CA, Forest CE, Spencer RW, Vose RS,Reynolds RW. What is our understanding of the con-tribution made by observational or methodologicaluncertainties to the previously reported vertical differ-ences in temperature trends? In: Karl TR, Hassol SJ,Miller CD, Murray WL, eds. Temperature Trends inthe Lower Atmosphere: Steps for Understanding andReconciling Differences. Washington, DC: U.S. Cli-mate Change Science Program and the Subcommitteeon Global Change Research; 2006, 71–88.
133. Thorne PW, Parker DE, Christy JR, Mears CA. Uncer-tainties in climate trends—lessons from upper-airtemperature records. Bull Amer Meteor Soc 2005,86:1437–1442.
134. Swanson RE. Evidence of possible sea-ice influenceon microwave sounding unit tropospheric tempera-ture trends in polar regions. Geophys Res Lett 2003,30:2040. DOI:10.1029/2003GL017938.
135. Fu Q, Seidel DJ, Johanson CM, Warren SG. Atmo-spheric science: stratospheric cooling and thetroposphere (reply). Nature 2004, 432:E2–E3.DOI:10/1038/nature03210.
136. Fu Q, Johanson CM. Stratospheric influence on MSU-derived tropospheric temperature trends: a direct erroranalysis. J Clim 2004, 17:4636–4640.
137. Fu Q, Johanson CM. Satellite-derived verticaldependence of tropical tropospheric temperaturetrends. Geophys Res Lett 2005, 32:L10703.DOI:10.1029/2004GL022266.
138. Johanson CM, Fu Q. Robustness of tropospheric tem-perature trends from MSU channels 2 and 4. J Clim2006, 19:4234–4242.
139. Tett S, Thorne P. Tropospheric temperature seriesfrom satellites. Nature 2004, 432:E1. DOI:10.1038/nature03208.
140. Gillett NP, Santer BD, Weaver AJ. Stratospheric cool-ing and the troposphere. Nature 2004, 432:E1–E2.DOI:10.1038/nature03209.
141. Kiehl JT, Caron JM, Hack JJ. On using global cli-mate model simulations to assess the accuracy of MSUretrieval methods for tropospheric warming trends.J Clim 2005, 18:2533–2539.
142. Spencer RW, Christy JR, Braswell WD, Norris WB.Estimation of tropospheric temperature trends fromMSU Channels 2 and 4. J Ocean Atmos Tech 2006,23:417–423.
143. Seidel DJ, Angell JK, Christy J, Free M, Klein SA, Lan-zante JR, Mears C, Parker D, Schabel M, Spencer R,et al. Uncertainty in signals of large-scale climate varia-tions in radiosonde and satellite upper-air temperaturedatasets. J Clim 2004, 17:2225–2240.
144. Christy JR, Parker DE, Brown SJ, Macadam I, Sten-del M, Norris WB. Differential trends in tropical sea
surface and atmospheric temperature since 1979. Geo-phys Res Lett 2001, 28:183–186.
145. Agudelo PA, Curry JA. Analysis of spatial distributionin tropospheric temperature trends. Geophys Res Lett2004, 31:L22207. DOI:10.1029/2004GL02818.
146. Free M, Seidel DJ. Causes of differing temperaturetrends in radiosonde upper air data sets. J Geophys Res2005, 110:D07101. DOI:10.1029/2004JD005481.
147. Lanzante JR, Peterson TC, Wentz FJ, Vinnikov KY.What do observations indicate about the change oftemperatures in the atmosphere and at the surfacesince the advent of measuring temperatures verti-cally? In: Karl TR, Hassol SJ, Miller CD, Murray WL,eds. Temperature Trends in the Lower Atmosphere:Steps for Understanding and Reconciling Differ-ences. Washington DC: U.S. Climate Change ScienceProgram and the Subcommittee on Global ChangeResearch; 2006, 47–70.
148. Hegerl G, Wallace J. Influence of patterns of climatevariability on the difference between satellite and sur-face temperature trends. J Clim 2002, 15:2412–2428.
149. Sexton DMH, Rowell DP, Folland CK, Karoly DJ.Detection of anthropogenic climate change using anatmospheric GCM. Clim Dyn 2001, 17:669–685.
150. Hill DC, Allen MR, Stott PA. Allowing for solar forc-ing in the detection of human influence on tro-pospheric temperatures. Geophys Res Lett 2001,28:1555–1558.
151. Thorne PW, Jones PD, Osborn TJ, Davies TD,Tett SFB, Parker DE, Stott PA, Jones GS, Allen MR.Assessing the robustness of zonal mean climatechange detection. Geophys Res Lett 2002, 29:1920.DOI:10.1029/2002GL015717.
152. Thorne PW, Jones PD, Tett SFB, Allen MR, Parker DE,Stott PA, Jones GS, Osborn TJ, Davies TD. Probablecauses of late twentieth century tropospheric temper-ature trends. Clim Dyn 2003, 21:573–591.
153. Jones GS, Tett SFB, Stott PA. Causes of atmospherictemperature change 1960-2000: A combined attri-bution analysis. Geophys Res Lett 2003, 30:1228.DOI:10.1029/2002GL016377.
154. Legates DR, Davies RE. The continuing search foran anthropogenic climate change signal: limitationsof correlation-based approaches. Geophys Res Lett1997, 24:2319–2322.
155. Hansen J, Sato M, Nazarenko L, Ruedy R, Lacis A,Koch D, Tegen I, Hall T, Shindell D, Santer B, et al.Climate forcings in Goddard Institute for Space StudiesSI2000 simulations. J Geophys Res 2002, 107:4347.DOI:10.1029/2001JD001143.
156. Michaels PJ, Knappenberger PC. Natural signals in theMSU lower tropospheric temperature record. GeophysRes Lett 2000, 27:2905–2908.
157. Santer BD, Wigley TML, Doutriaux C, Boyle JS,Hansen JE, Jones PD, Meehl GA, Roeckner E, Sen-gupta S, Taylor KE. Accounting for the effects of
2010 Crown copyr ight

Advanced Review wires.wiley.com/climatechange
volcanoes and ENSO in comparisons of modeled andobserved temperature trends. J Geophys Res 2001,106:28033–28059.
158. Douglass DH, Pearson BD, Singer SF, Knappen-berger PC, Michaels PJ. Disparity of troposphericand surface temperature trends: new evidence.Geophys Res Lett 2004, 31:L13207. DOI:10.1029/2004GL020212.
159. Douglass DH, Pearson BD, Singer SF. Altitude depen-dence of atmospheric temperature trends: climatemodels versus observation. Geophys Res Lett 2004,31:L13208. DOI:10.1029/2004GL020103.
160. Lindzen RS, Giannitsis C. Reconciling observations ofglobal temperature change. Geophys Res Lett 2002,29:1583. DOI:10.1029/2001GL014074.
161. Santer BD, Wigley TML, Meehl GA, Wehner MF,Mears C, Schabel M, Wentz FJ, Ammann C,Arblaster J, Bettge T, et al. Influence of satellite datauncertainties on the detection of externally forcedclimate change. Science 2003, 300:1280–1284.
162. Santer BD, Wigley TML, Mears C, Wentz FJ, Klein SA,Seidel DJ, Taylor KE, Thorne PW, Wehner MF,Gleckler PJ, et al. Amplification of surface tempera-ture trends and variability in the tropical atmosphere.Science 2005, 309:1551–1556.
163. Trenberth KE, Jones PD, Ambenje P, Bojariu R,Easterling D, Klein Tank A, Parker D, Rahimzadeh F,Renwick JA, Rusticucci M, et al. Observations: sur-face and atmospheric climate change. In: Solomon S,Qin D, Manning M, Chen Z, Marquis M, Averyt KB,Tignor M, Miller HL, eds. Climate Change 2007: ThePhysical Science Basis. Cambridge, UK and New York,NY: Cambridge University Press; 2007, 235–336.
164. Hegerl GC, Zwiers FW, Braconnot P, Gillett NP,Luo Y, Marengo Orsini JA, Nicholls N, Penner JE,Stott PA. Understanding and attributing climatechange. In: Solomon S, Qin D, Manning M, Chen Z,Marquis M, Averyt KB, Tignor M, Miller HL, eds.Climate Change 2007: The Physical Science Basis.Cambridge, UK and New York, NY: Cambridge Uni-versity Press; 2007, 663–745.
165. McCarthy MP, Titchner HA, Thorne PW, Tett SFB,Haimberger L, Parker DE. Assessing bias and uncer-tainty in the HadAT adjusted radiosonde climaterecord. J Clim 2008, 21:817–832.
166. Titchner HA, Thorne PW, McCarthy MP, Tett SFB,Haimberger L, Parker DE. Critically assessing tro-pospheric temperature trends from radiosondesusing realistic validation experiments. J Clim 2009,22:465–485.
167. Haimberger L. Homogenization of radiosonde tem-perature time series using innovation statistics. J Clim2007, 20:1377–1403.
168. Haimberger L, Tavolato C, Sperka S. Toward elim-ination of the warm bias in historic radiosonde
temperature records—some new results from a com-prehensive intercomparison of upper-air data. J Clim2008, 21:4587–4606.
169. Sherwood SC, Meyer CL, Allen RJ, Titchner HA.Robust tropospheric warming revealed by intera-tively homogenised radiosonde data. J Clim 2008,21:5336–5352.
170. Allen RJ, Sherwood SC. Utility of radiosonde winddata in representing climatological variations of tro-pospheric temperature and baroclinicity in the westerntropical Pacific. J Clim 2007, 20:5229–5243.
171. Allen RJ, Sherwood SC. Warming maximum in thetropical upper troposphere deduced from thermalwinds. Nat Geosci 2008, 1:399–403.
172. Thorne PW. Atmospheric science—the answer isblowing in the wind. Nat Geosci 2008, 1:347–348.
173. Gruber C, Haimberger L. On the homogeneity ofradiosonde wind time series. Meteor Zeit 2008,17:631–643.
174. Schleip C, Menzel A, Dose V. Bayesian analysis ofchanges in radiosonde atmospheric temperature. IntJ Clim 2009, 29:629–641.
175. Seidel DJ, Lanzante JR. An assessment of three alter-natives to linear trends for characterizing global atmo-spheric temperature changes. Geophys Res Lett 2004,109:D14108. DOI:10.1029/2003JD004414.
176. Mears CA, Wentz FJ. Construction of the RemoteSensing Systems V3.2 atmospheric temperaturerecords from the MSU and AMSU microwavesounders. J Atmos Ocean Tech 2009, 26:1040–1056.
177. Mears CA, Wentz FJ. Construction of the RSS V3.2lower tropospheric temperature dataset from the MSUand AMSU microwave sounders. J Atmos Ocean Tech2009, 26:1493–1509.
178. Zou C-Z, Goldberg MD, Cheng Z, Grody NC,Sullivan JT, Cao C, Tarpley D. Recalibration ofmicrowave sounding unit for climate studies usingsimultaneous nadir overpasses. J Geophys Res 2006,111:D19114. DOI:10.1029/2005JD006798.
179. Zou C-Z, Gao M, Goldberg MD. Error structureand atmospheric temperature trends in observationsfrom the microwave sounding unit. J Clim 2009,22:1661–1681.
180. Brohan P, Kennedy JJ, Harris I, Tett SFB, Jones PD.Uncertainty estimates in regional and globalobserved temperature changes: a new datasetfrom 1850. J Geophys Res 2006, 111:D12106.DOI:10.1029/2005JD006548.
181. Christy JR, Norris WB. Satellite and VIZ-radiosondeintercomparison for diagnosis of nonclimatic influ-ences. J Atmos Ocean Tech 2006, 23:1181–1194.
182. Christy JR, Norris WB, Spencer RW, Hnilo JJ. Tropo-spheric temperature change since 1979 from tropicalradiosonde and satellite measurements. J Geophys Res2007, 112:D06102. DOI:10.1029/2005JD006881.
2010 Crown copyr ight

WIREs Climate Change Tropospheric temperature trends
183. Christy JR, Norris WB. Discontinuity issues withradiosonde and satellite temperatures in the Aus-tralian region 1979–2006. J Atmos Ocean Tech 2009,26:508–522.
184. Randall RM, Herman BM. Using limited time periodtrends as a means to determine attribution of dis-crepancies in microwave sounding unit-derived tropo-spheric temperature time series. J Geophys Res 2008,113:D05105. DOI:10.1029/2007JD008864.
185. Lanzante JR. Diagnosis of radiosonde vertical temper-ature trend profiles: comparing the influence of datahomogenization versus model forcings. J Clim 2007,20:5356–5364.
186. Lanzante JR, Free M. Comparison of radiosonde andGCM vertical temperature trend profiles: Effects ofdataset choice and data homogenization. J Clim 2008,21:5417–5435.
187. Forster PM, Bodeker G, Schofield R, Solomon S.Effects of ozone cooling in the tropical lower strato-sphere and upper troposphere. Geophys Res Lett2007, 34:L23813. DOI:10.1029/2007GL031994.
188. Thorne PW, Parker DE, Santer BD, McCarthy MP,Sexton DMH, Webb MJ, Murphy JM, Collins M,Titchner HA, Jones GS. Tropical vertical temperaturetrends. A real discrepancy? Geophys Res Lett 2007,34:L16702. DOI:10.1029/2007GL029875.
189. Murphy JM, Sexton DMH, Barnett DN, Jones GS,Webb MJ, Collins M, Stainforth DA. Quantification
of modelling uncertainties in a large ensemble of cli-mate change simulations. Nature 2004, 430:768–772.
190. Douglass DH, Christy JR, Pearson BD, Singer SF. Acomparison of tropical temperature trends with modelpredictions. Int J Climatol 2008, 27:1693–1701.
191. Santer BD, Thorne PW, Haimberger L, Taylor KE,Wigley TML, Lanzante JR, Solomon S, Free M,Gleckler PJ, Jones PD, et al. Consistency of modelledand observed temperature trends in the tropical tropo-sphere. Int J Climatol 2008, 28:1703–1722.
192. Mears CA, Santer BD, Wentz FJ, Taylor KE,Wehner MF. Relationship between temperature andprecipitable water changes over tropical oceans.Geophys Res Lett 2007, 34:L24709. DOI:10.1029/2007GL031936.
193. Klotzbach PJ, Pielke RA Sr., Pielke RA Jr., ChristyJR, McNider RT. An alternative explanation for dif-ferential temperature trends at the surface and in thelower troposphere. J Geophys Res 2009, 114:D21102.DOI:10.1029/2009JD011841.
194. Peterson TC, Baringer MO, eds. State of the climatein 2008. Bull Amer Meteor Soc 2009, 90:S1–S196.
195. Seidel DJ, Berger FH, Immler F, Sommer M, Vomel H,Diamond HJ, Dykema J, Goodrich D, Murray W,Peterson T, et al. Reference upper-air observations forclimate: rationale, progress, and plans. Bull AmerMeteor Soc 2009, 90:361–369.
2010 Crown copyr ight