Embed Size (px)
Citation preview

Tropical Cyclones
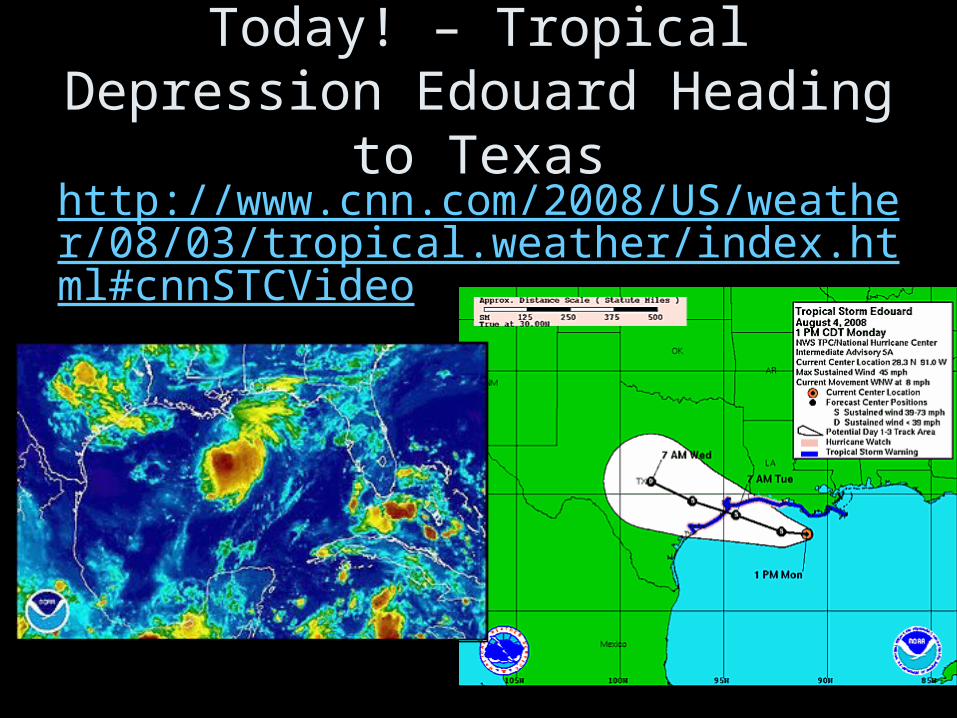
Today! – Tropical Depression Edouard Heading to Texas
http://www.cnn.com/2008/US/weather/08/03/tropical.weather/index.html#cnnSTCVideo
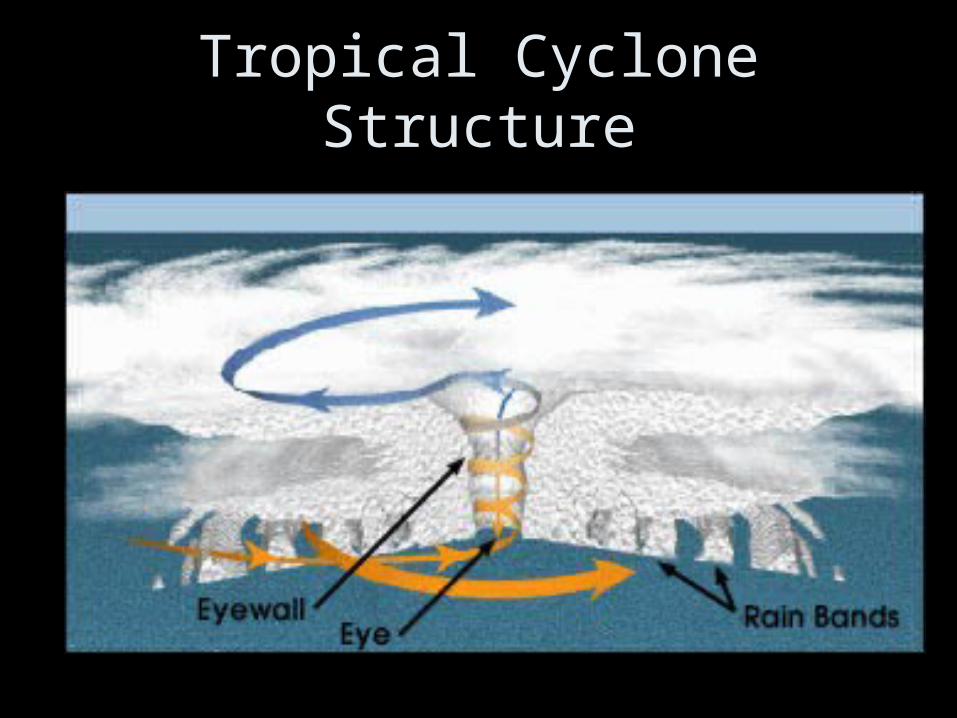
Tropical Cyclone Structure


Tropical Waves and the ITCZ

Tropical Storm Origins
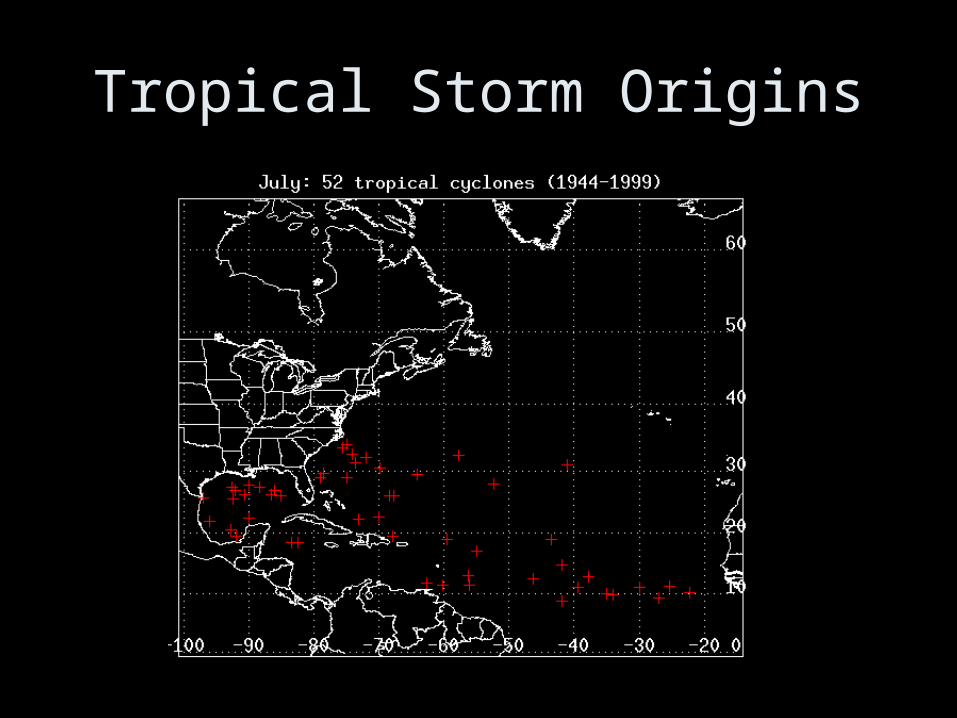
Tropical Storm Origins

Tropical Storm Origins

Tropical Storm Origins

Tropical Storm Origins
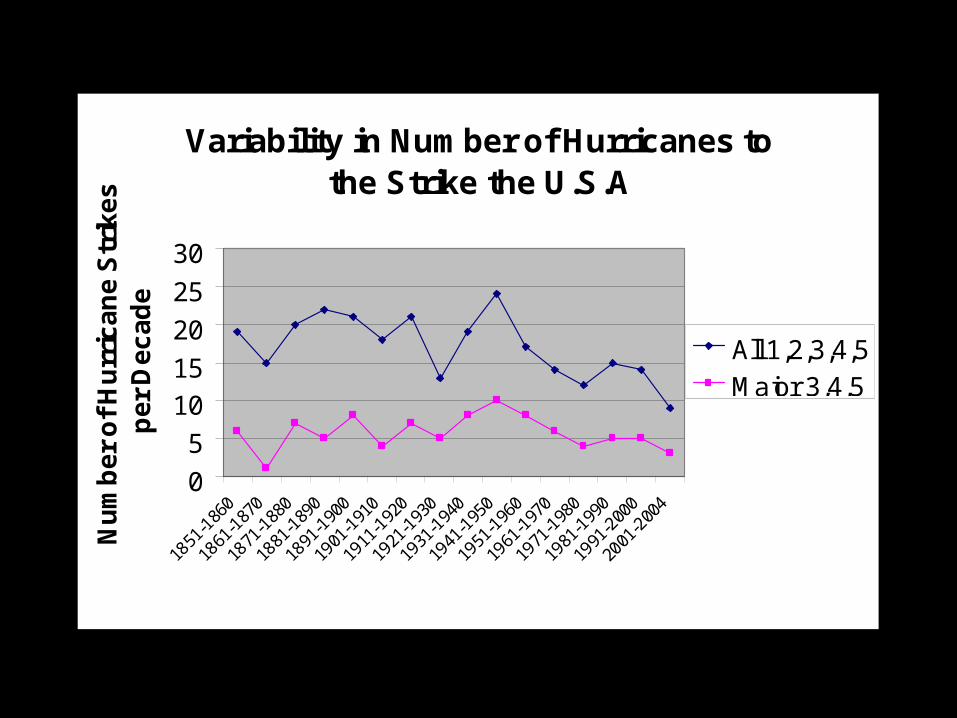
Variability in Number of Hurricanes to the Strike the U.S.A
0
5
1015
20
25
30
1851
-186
0
1861
-187
0
1871
-188
0
1881
-189
0
1891
-190
0
1901
-191
0
1911
-192
0
1921
-193
0
1931
-194
0
1941
-195
0
1951
-196
0
1961
-197
0
1971
-198
0
1981
-199
0
1991
-200
0
2001
-200
4
Nu
mb
er
of
Hu
rric
an
e S
trik
es
p
er
De
ca
de
All 1,2,3,4,5Major 3,4,5

Then Came 2005• Busiest Atlantic Hurricane season ever.
• 28 named storms. Ran out of the alphabet.
• Season persisted to January 6, 2006 with tropical storm Zeta.
• Most hurricanes (15) & most category 5 (4).
• Most intense tropical cyclone ever – Wilma. 882 mb atm. Pressure, 185 mph winds.
• At least 2,280 deaths and record damages of over $100 billion.
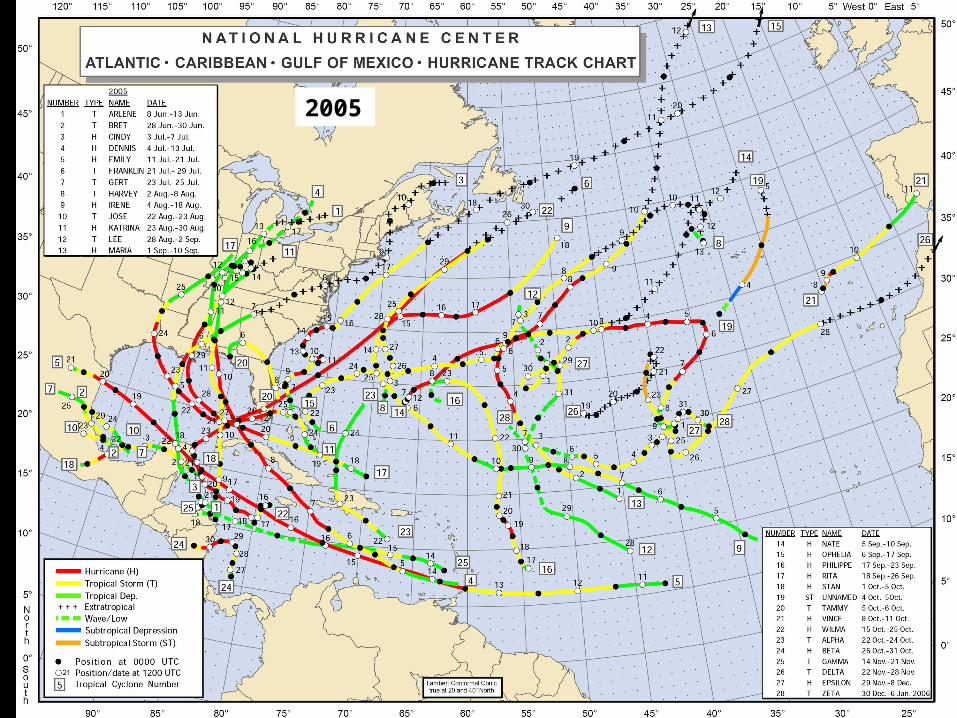
2005

Wind Speed vs. Atmospheric Pressure

Eye Wall Velocities in Cross Section
Georges vs. Mitch

Hurricane Floyd
Winds

Tropical Cyclone Storm Surge
Hurricane Carol

Tropical Cyclone Storm Surge
Storm surge on shallow water coastline
Storm surge on deep water coastline

Tropical Cyclone Storm Surge
From a Category Four Event in Eastern Suffolk County
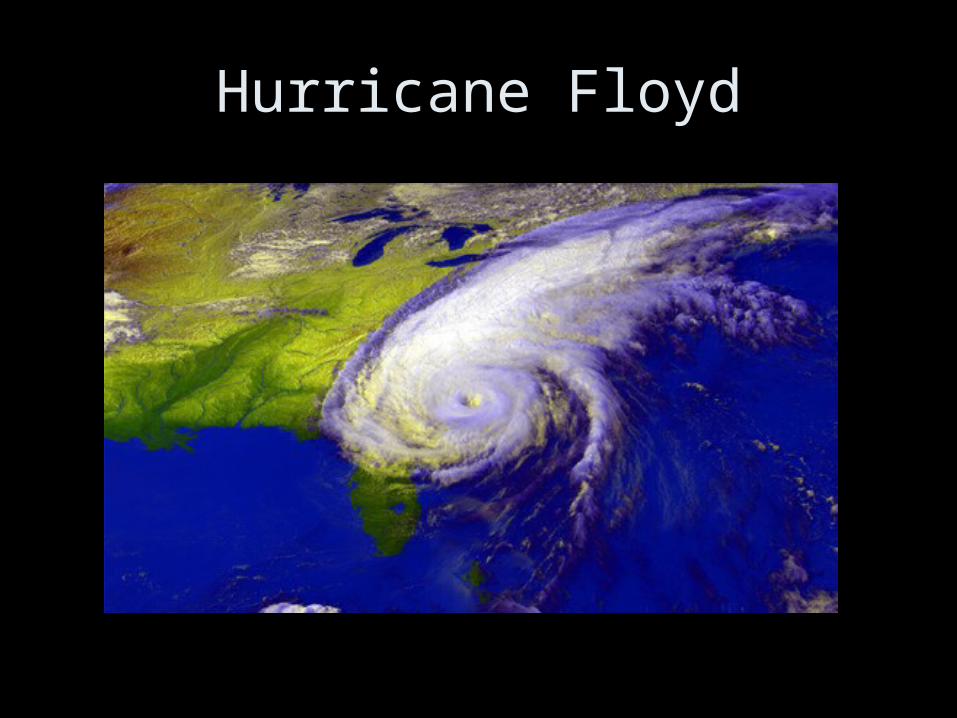
Hurricane Floyd

Hurricane Floyd

Hurricane Floyd
Serious flooding from North Carolina through New Jersey.
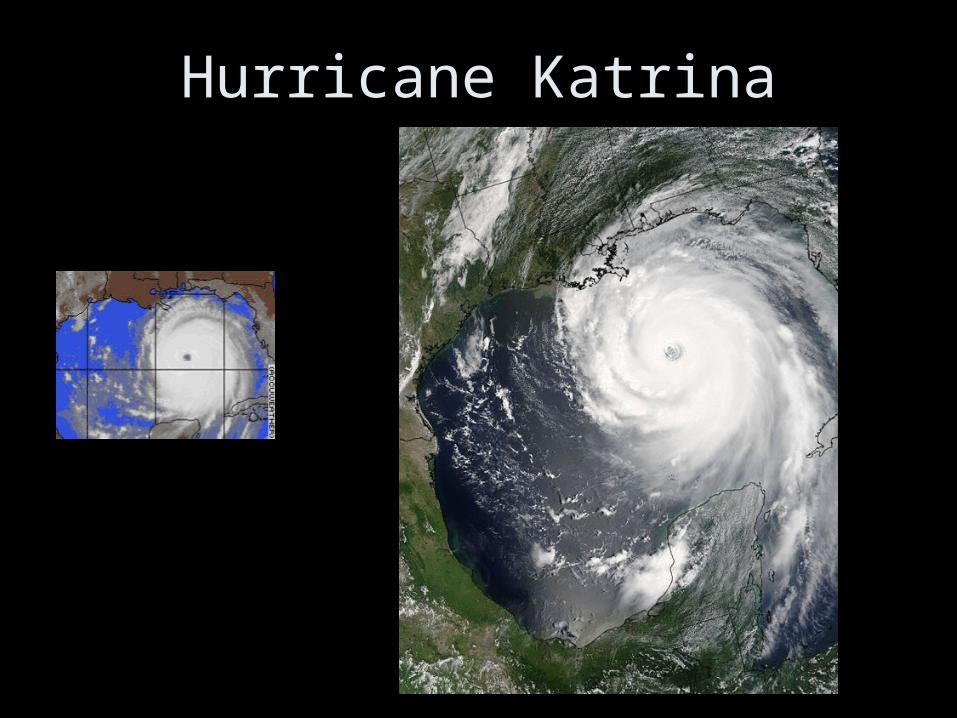
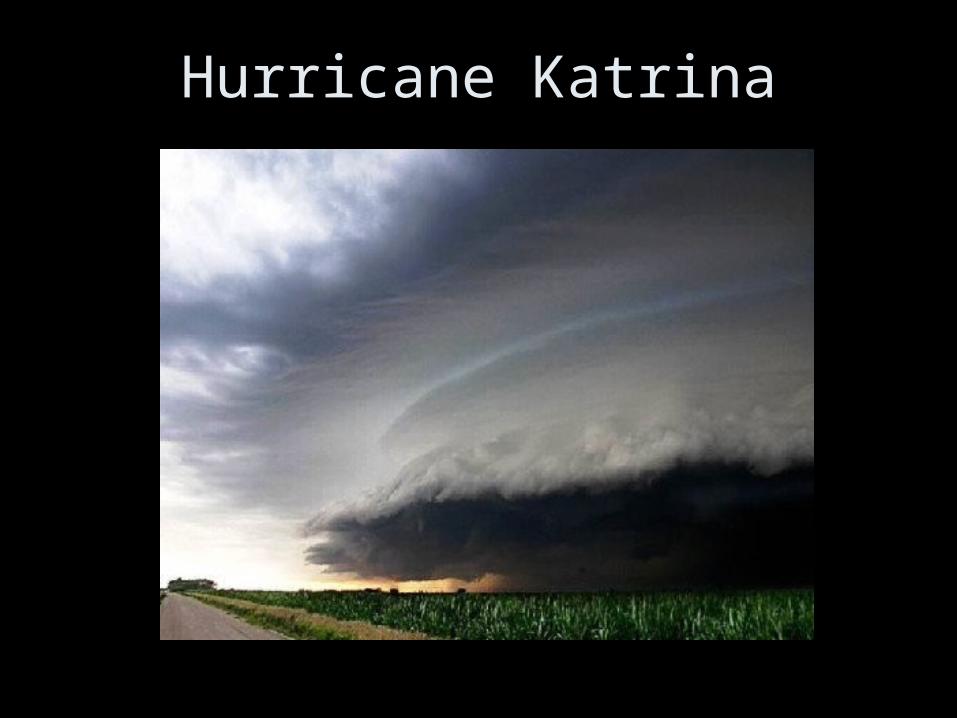
Hurricane Katrina
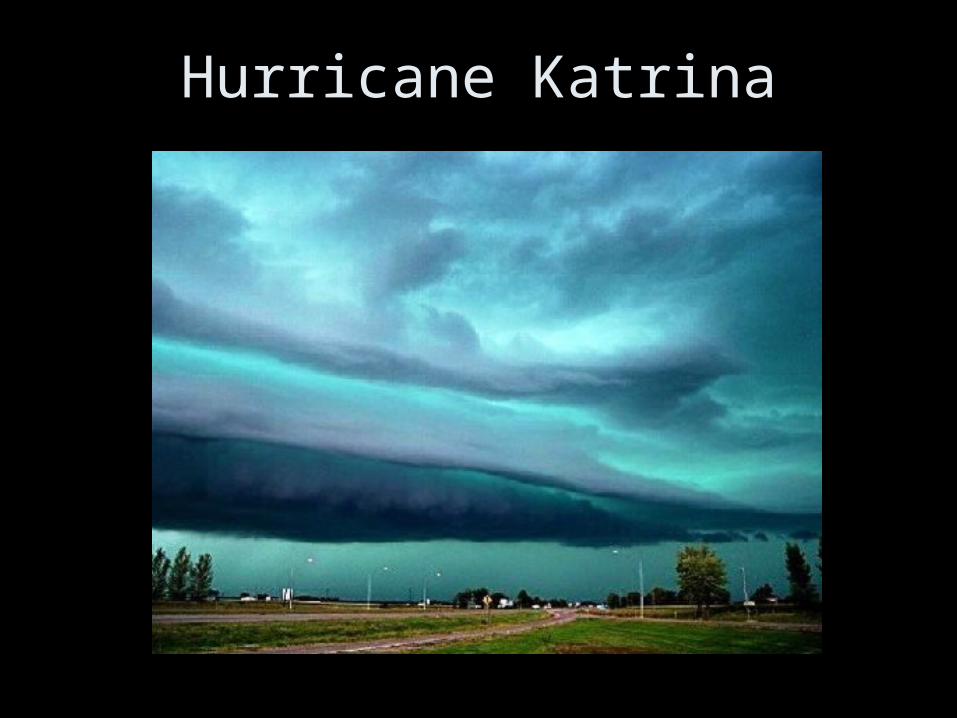
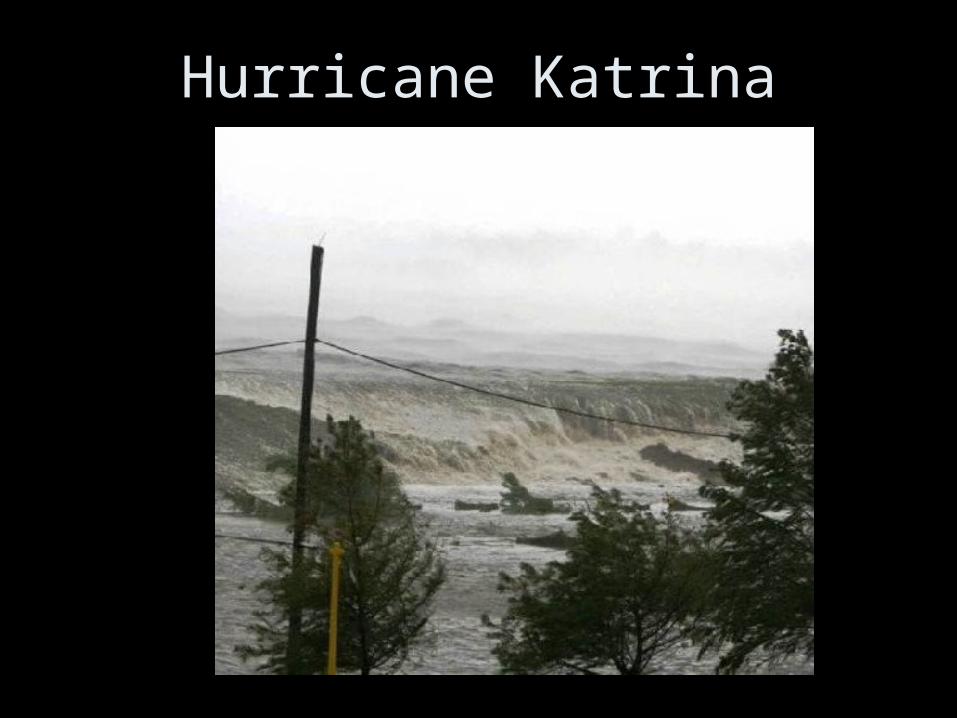
Hurricane Katrina
Hurricane Katrina

Hurricane Katrina

Hurricane Katrina

Hurricane Katrina
http://www.nasa.gov/mpg/126449main_katrina_fred_animation.mpg

Hurricane Katrina
This is an image of Hurricane Katrina on Sunday, August 28, 2005 at 5:30 PM EDT (21:33 UTC) as seen by the Tropical Rainfall Measuring Mission (TRMM) satellite's PR (Precipitation Radar), VIRS (Visible Infrared Scanner), TMI (Tropical Microwave Imager) and the GOES spacecraft. TRMM looks underneath of the storm's clouds to reveal the underlying rain structure. Blue represents areas with at least 0.25 inches of rain per hour. Green shows at least 0.5 inches of rain per hour. Yellow is at least 1.0 inches of rain and red is at least 2.0 inches of rain per hour. NASA
Hurricane Katrina
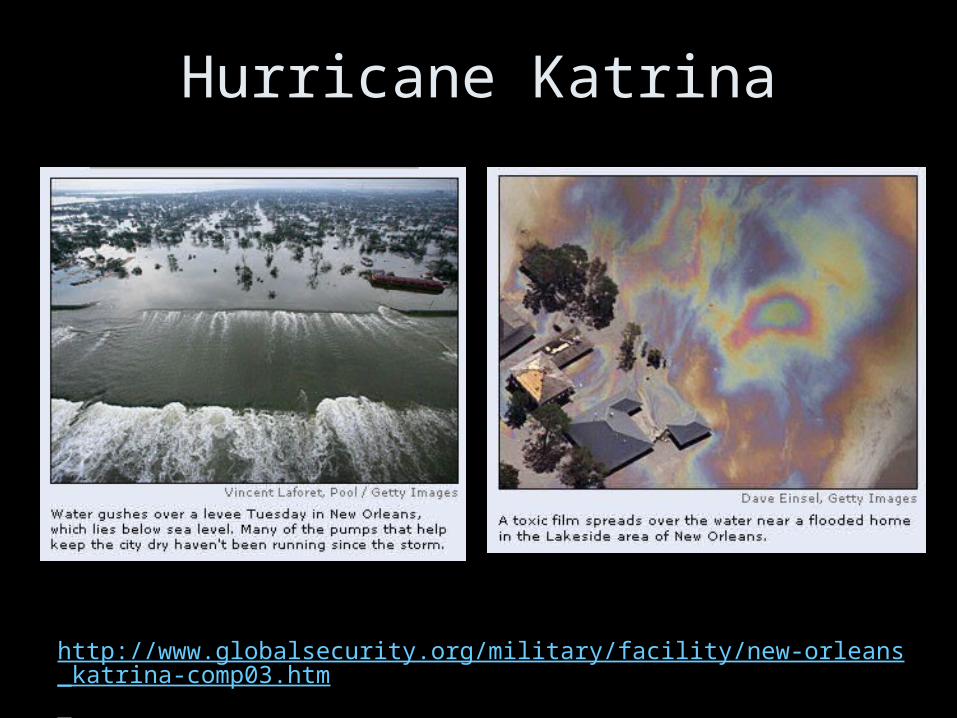
Hurricane Katrina
http://www.globalsecurity.org/military/facility/new-orleans_katrina-comp03.htm

Hurricane Katrina

Hurricane Katrina06 June 2005:
In fiscal year 2006, the New Orleans district of the U.S. Army Corps of Engineers is bracing for a record $71.2 million reduction in federal funding. It would be the largest single-year funding loss ever for the New Orleans district, Corps officials said. I've been here over 30 years and I've never seen this level of reduction, said Al Naomi, project manager for the New Orleans district... The cuts mean major hurricane and flood protection projects will not be awarded to local engineering firms. Also, a study to determine ways to protect the region from a Category 5 hurricane has been shelved for now.
From: http://www.legitgov.org/

Hurricane Rita